
The Contribution of Urban Morphology to the Formation of the Microclimate in Compact Urban Cores: A Study in the City Center of Thessaloniki


Abstract
:1. Introduction
2. Materials and Methods
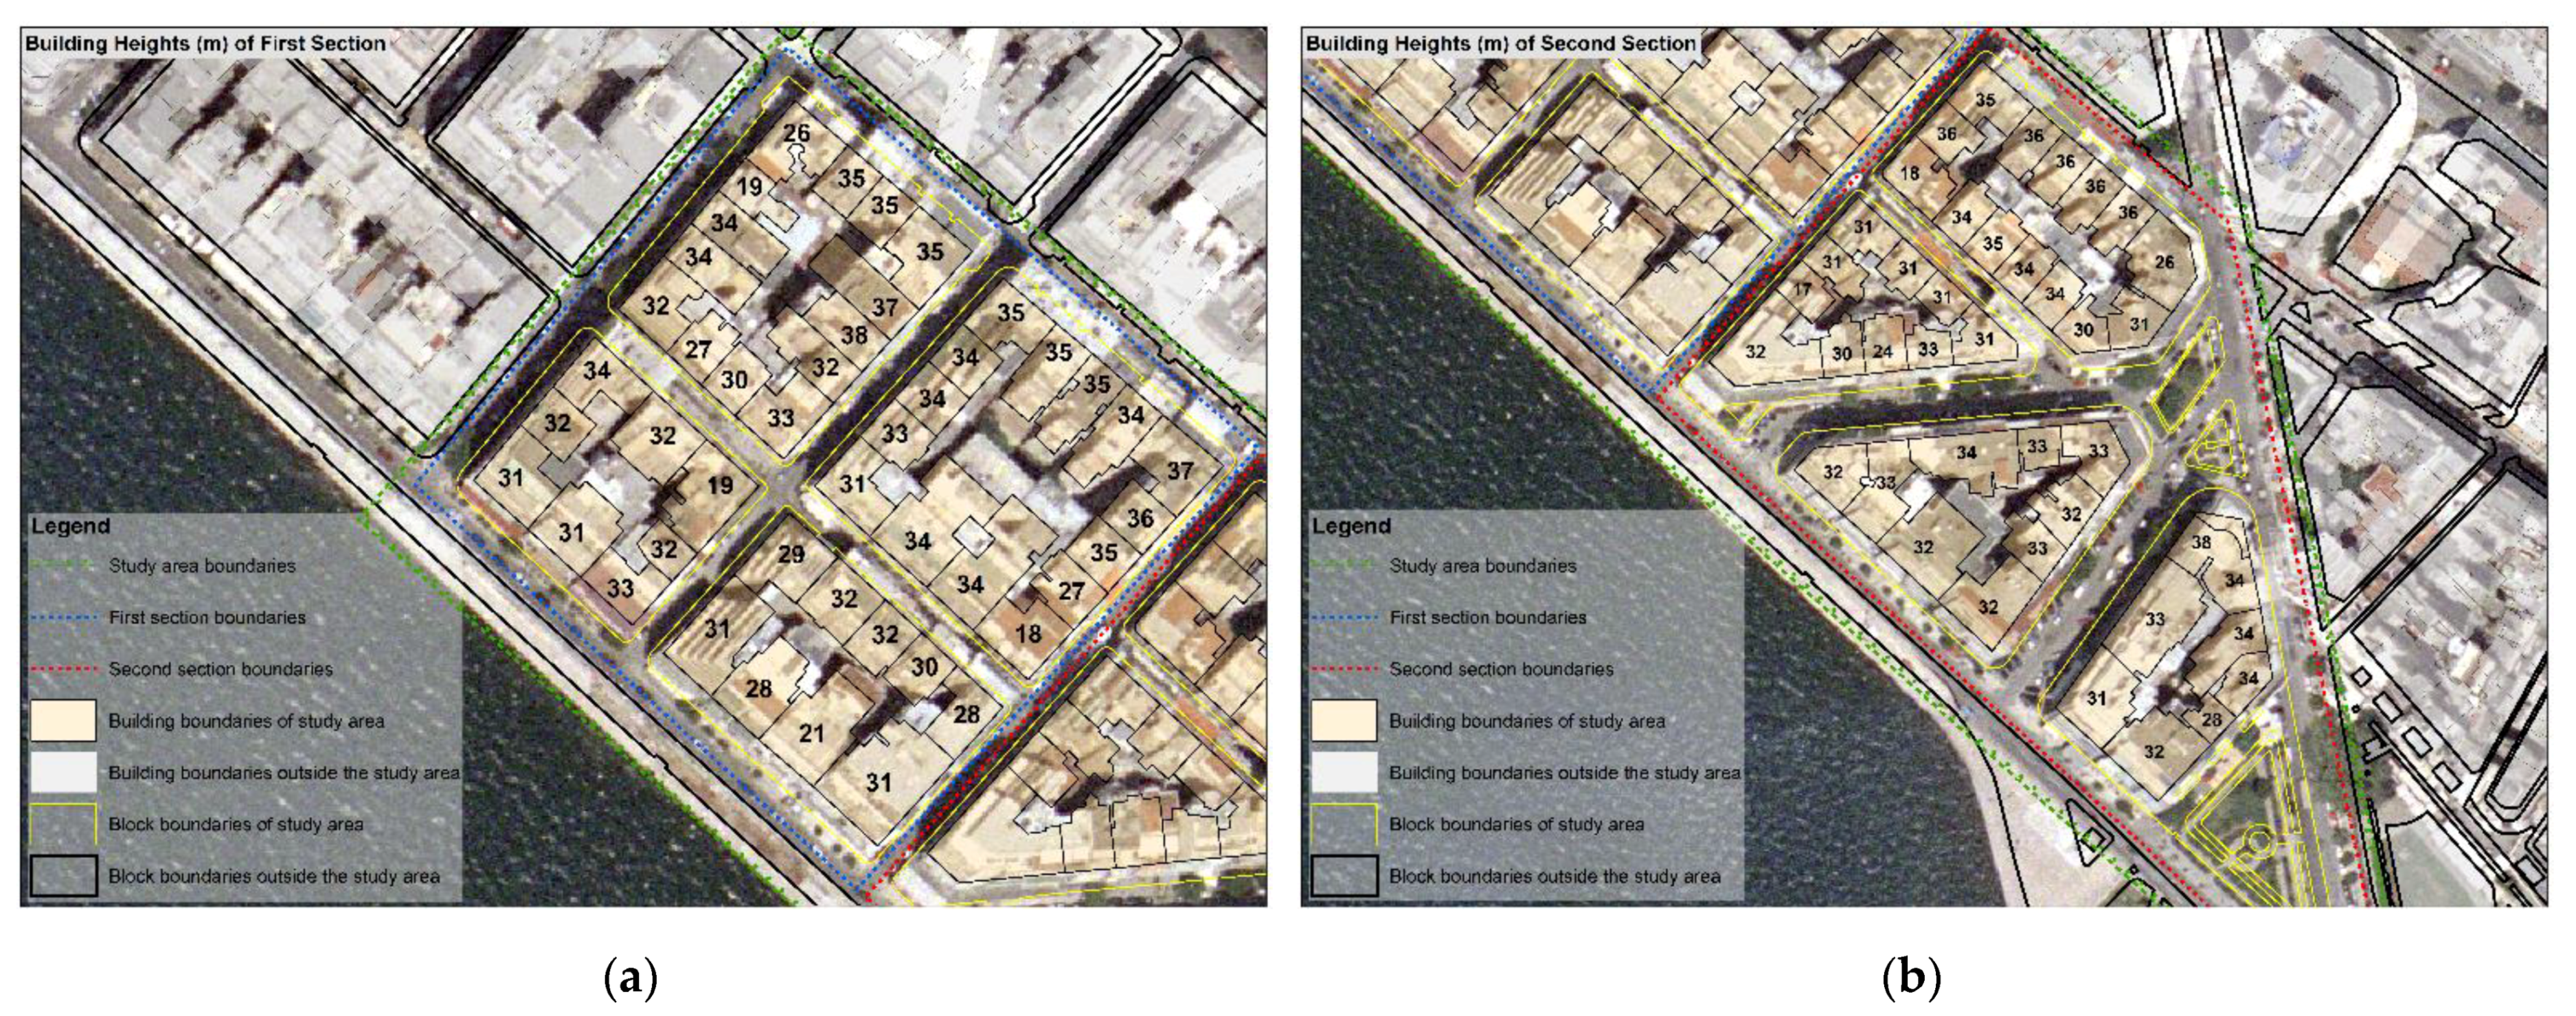
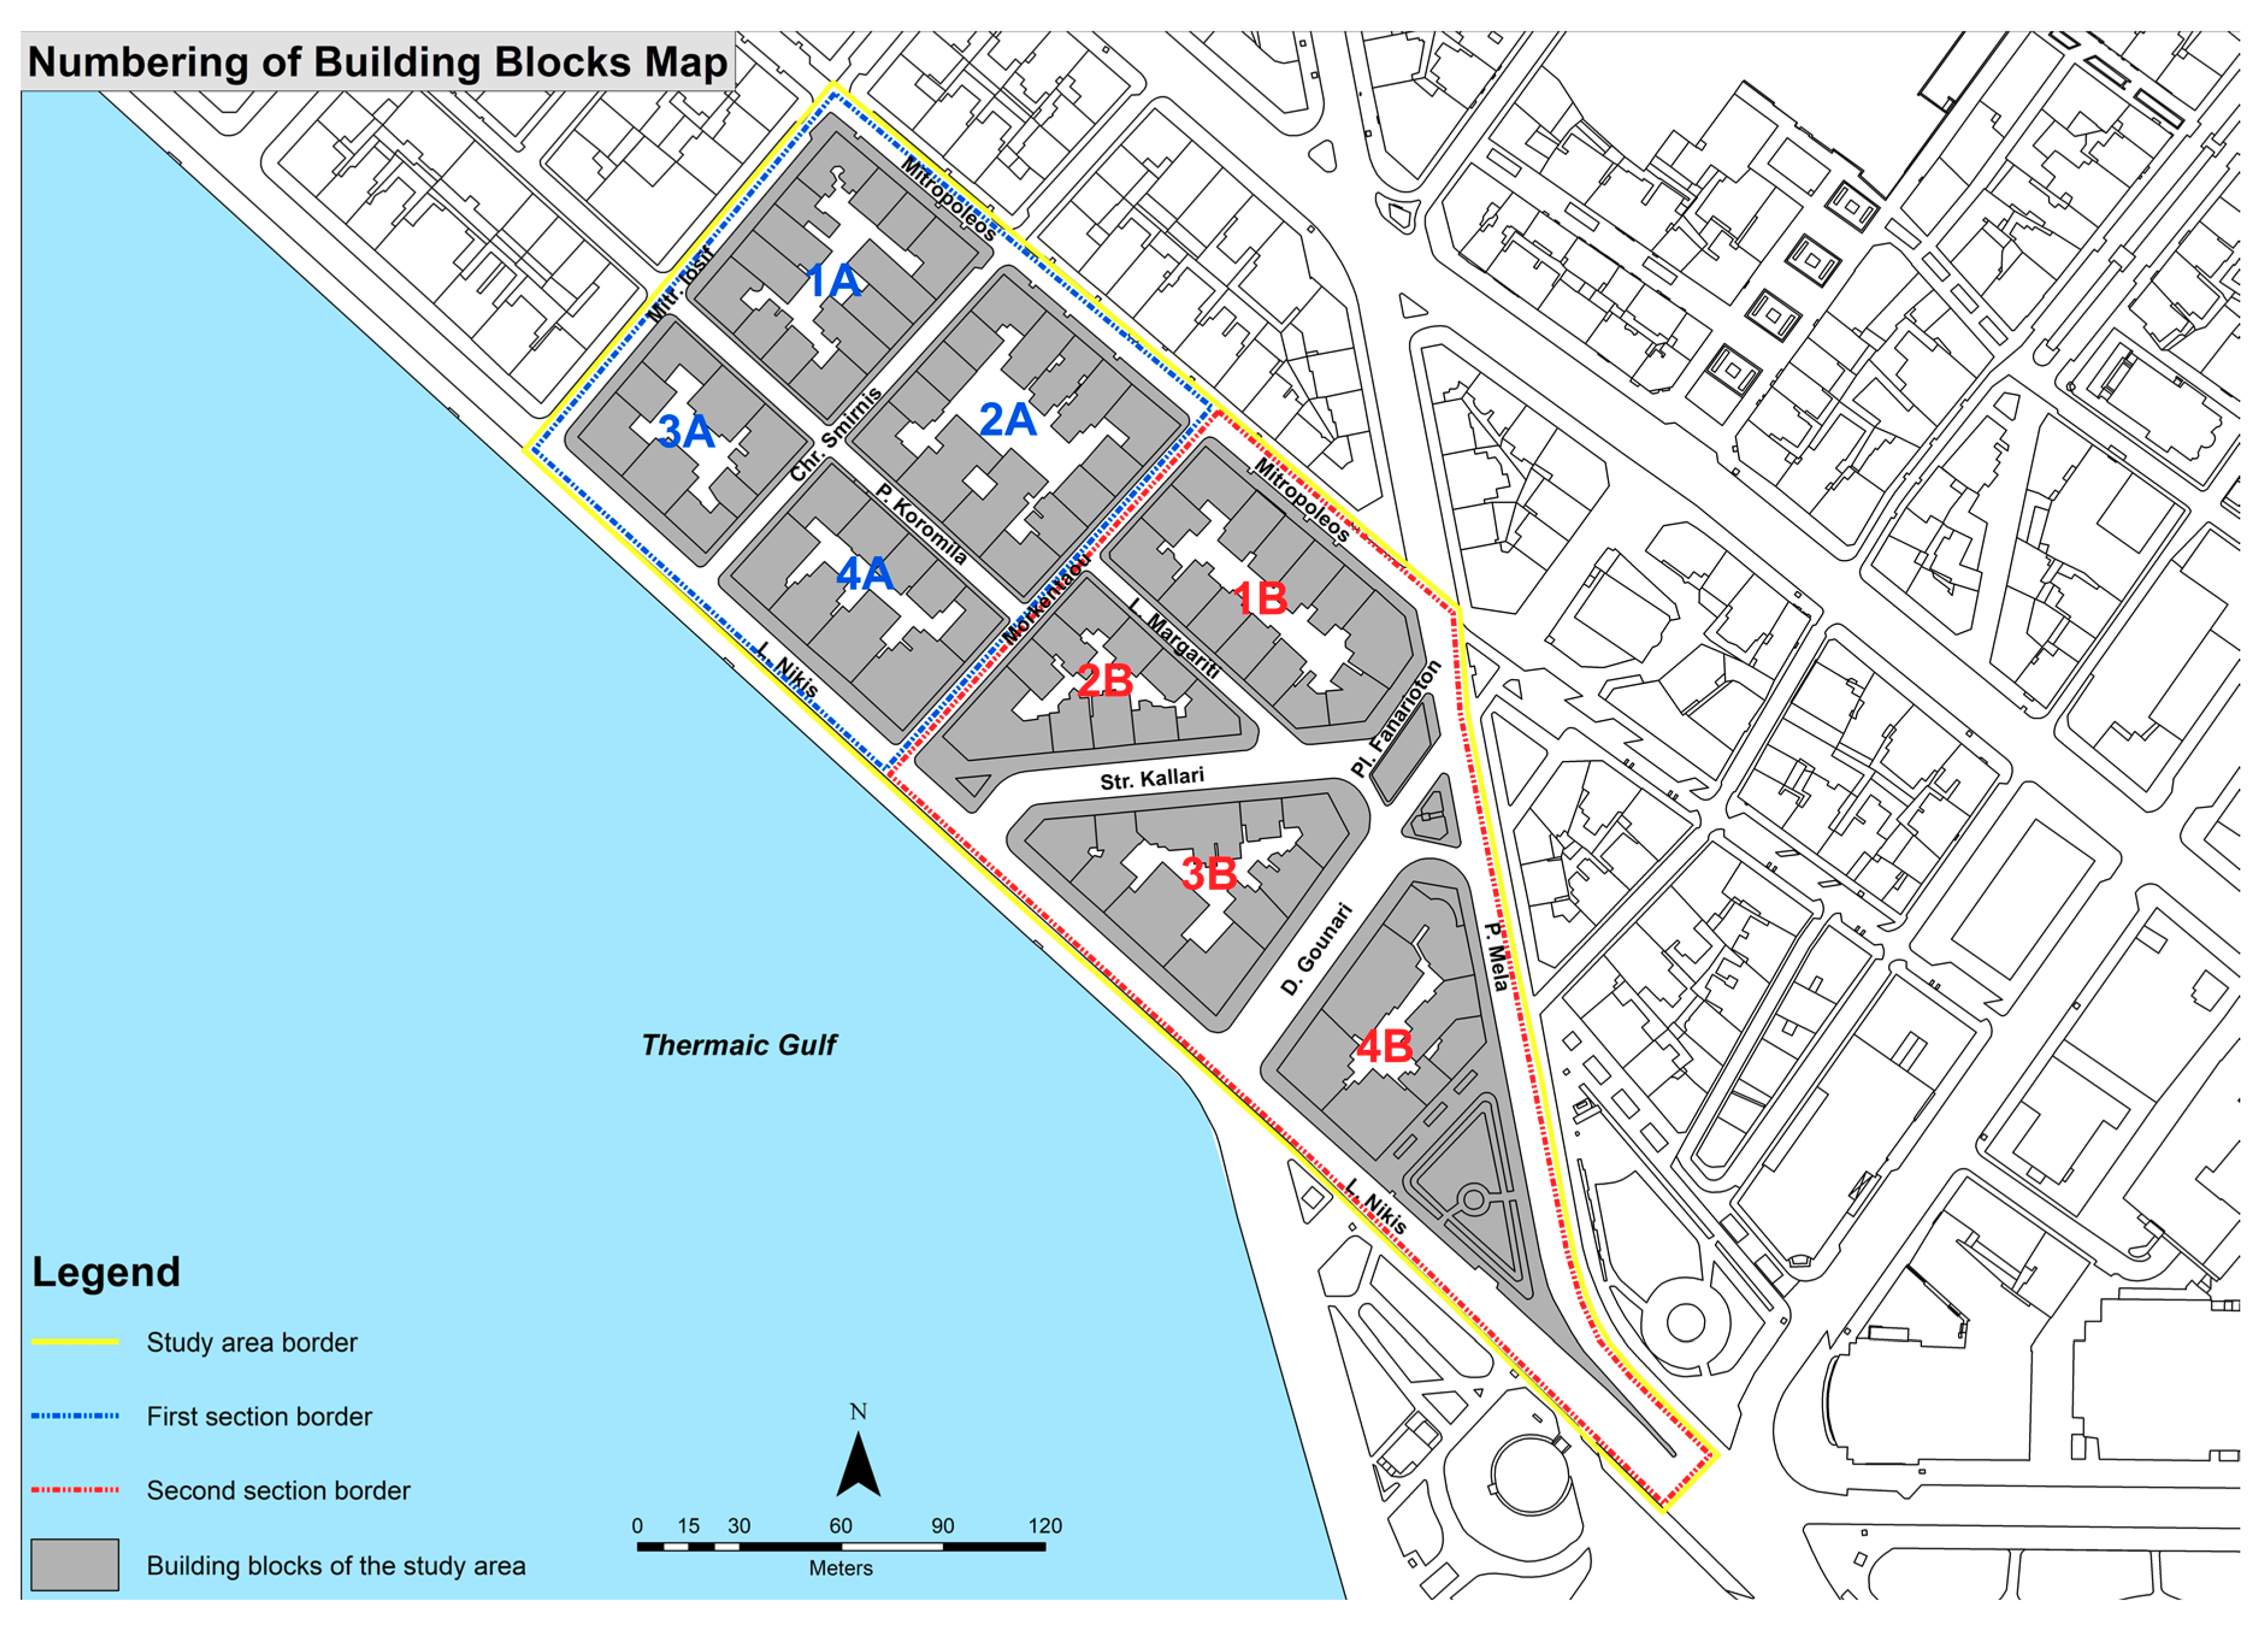
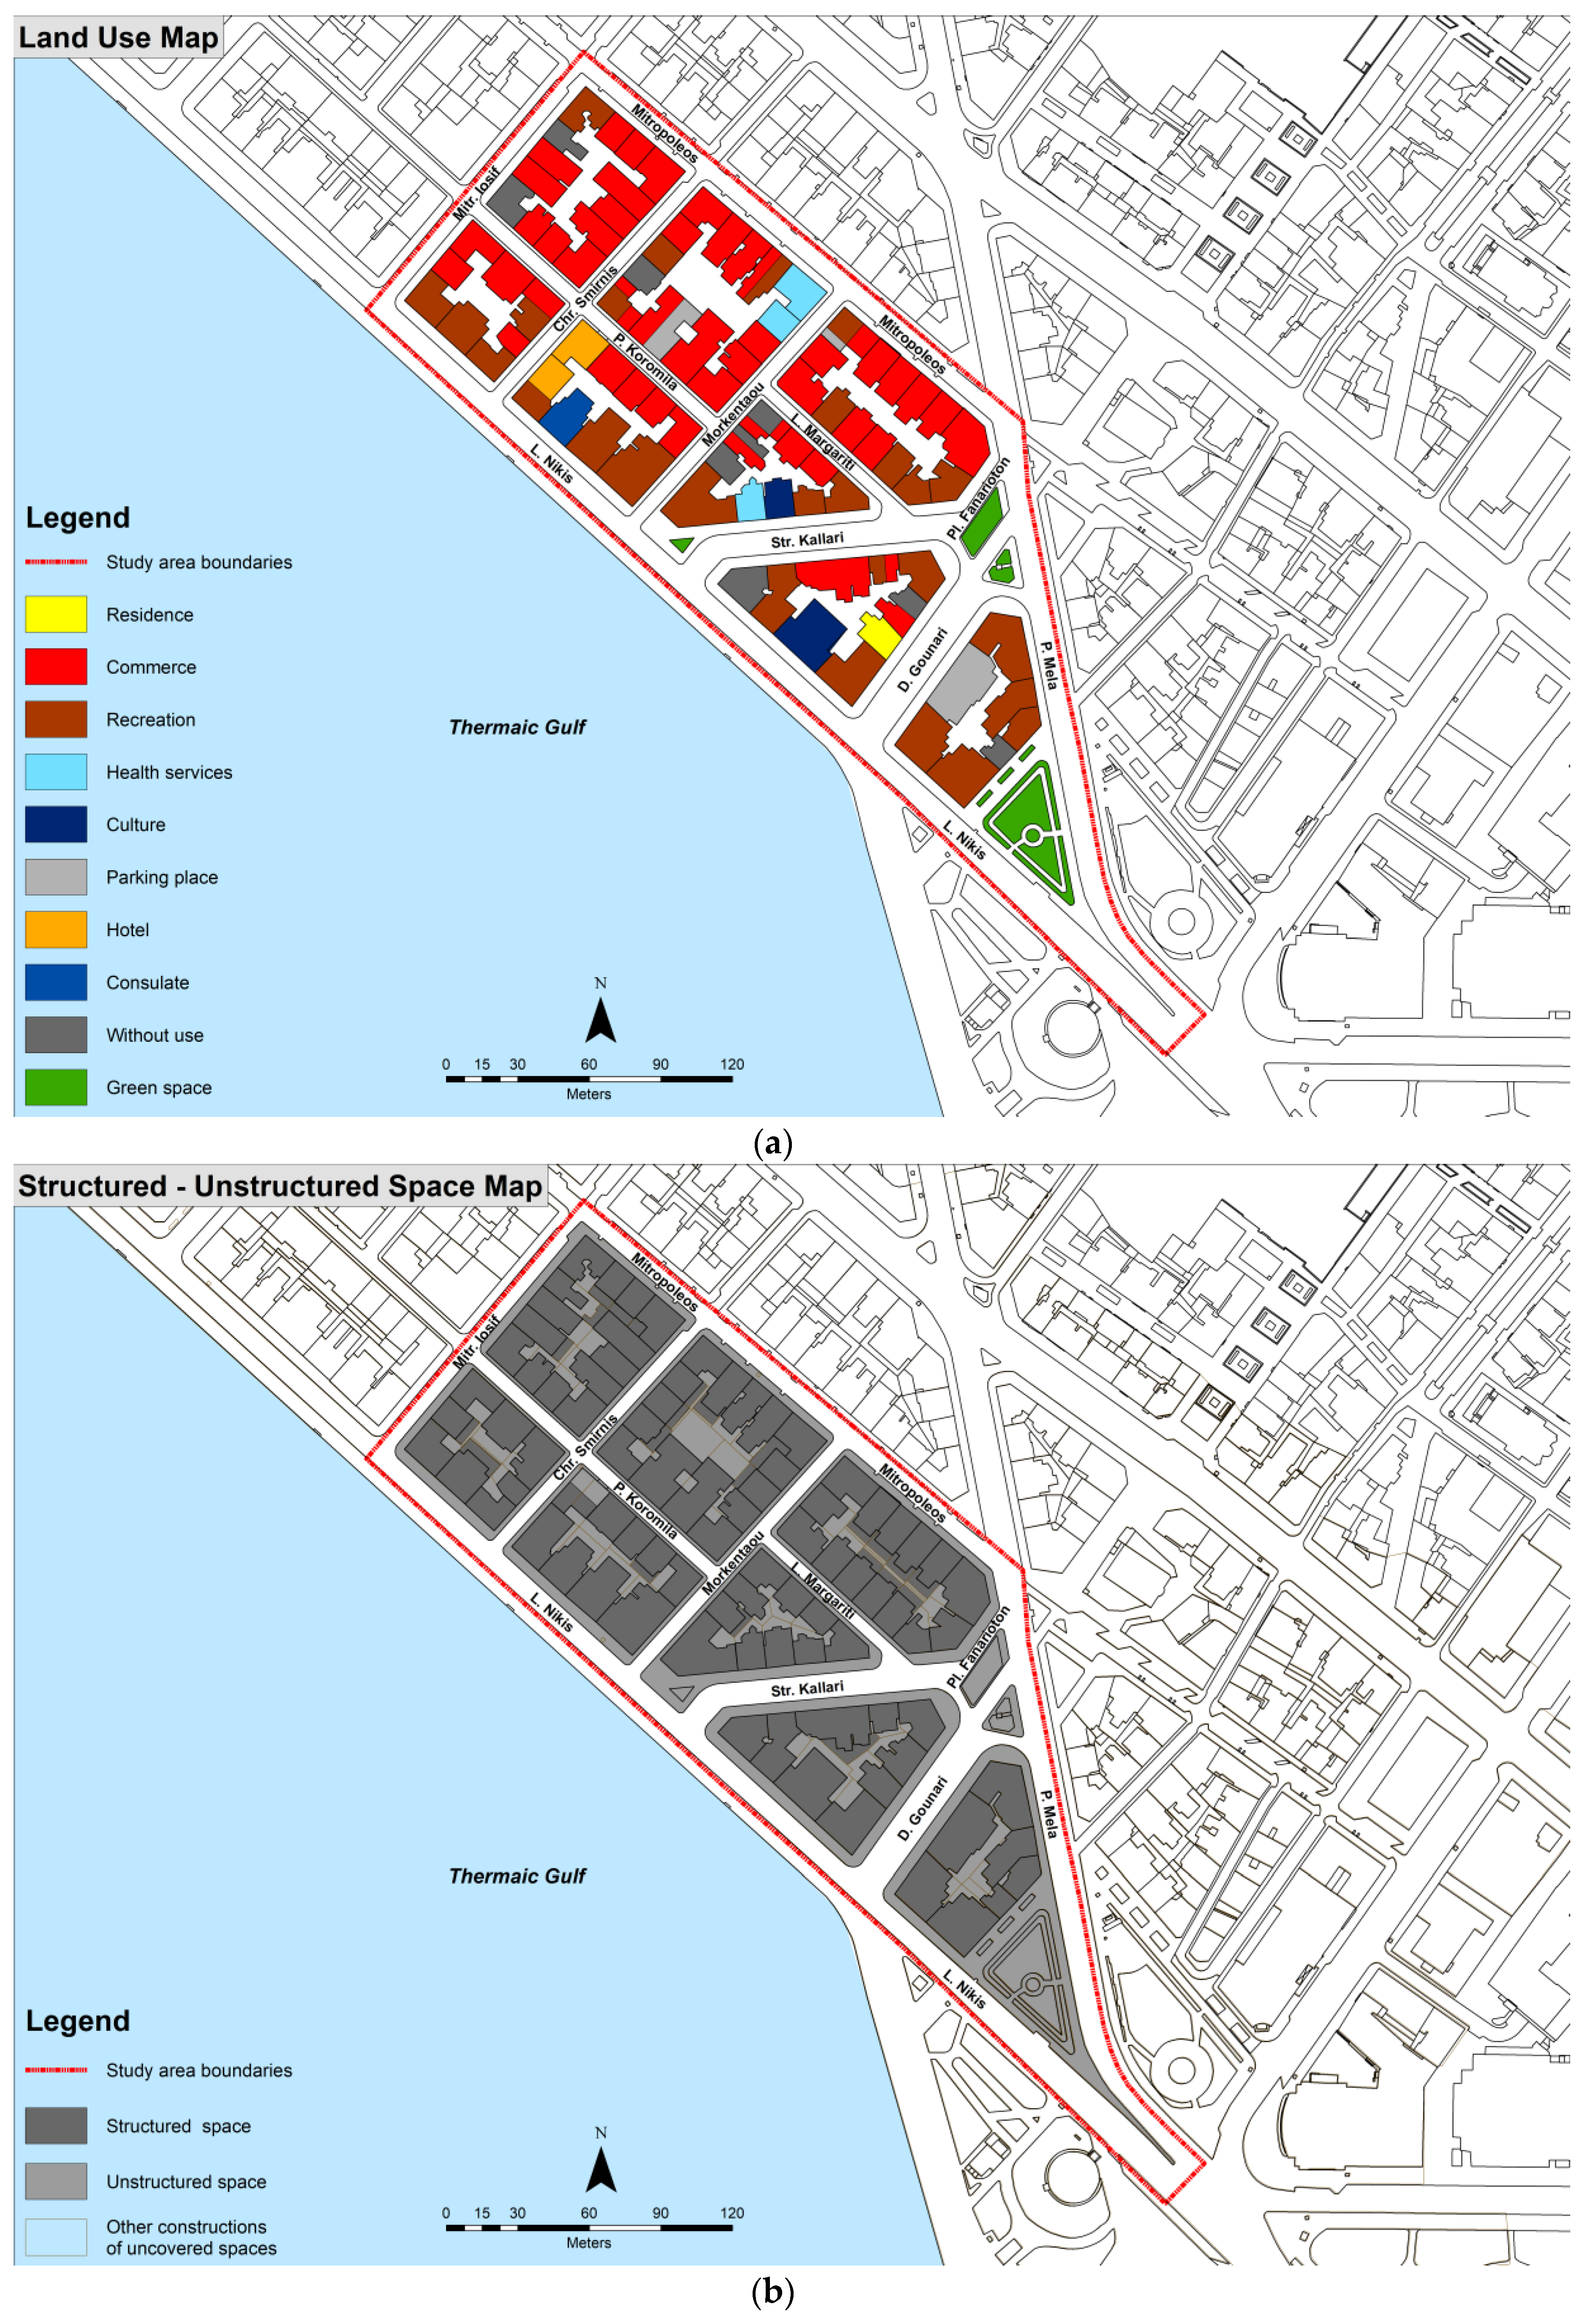
2.1. Field Study Methodology, Characteristics of the Study Area, and Typology of the Building Blocks
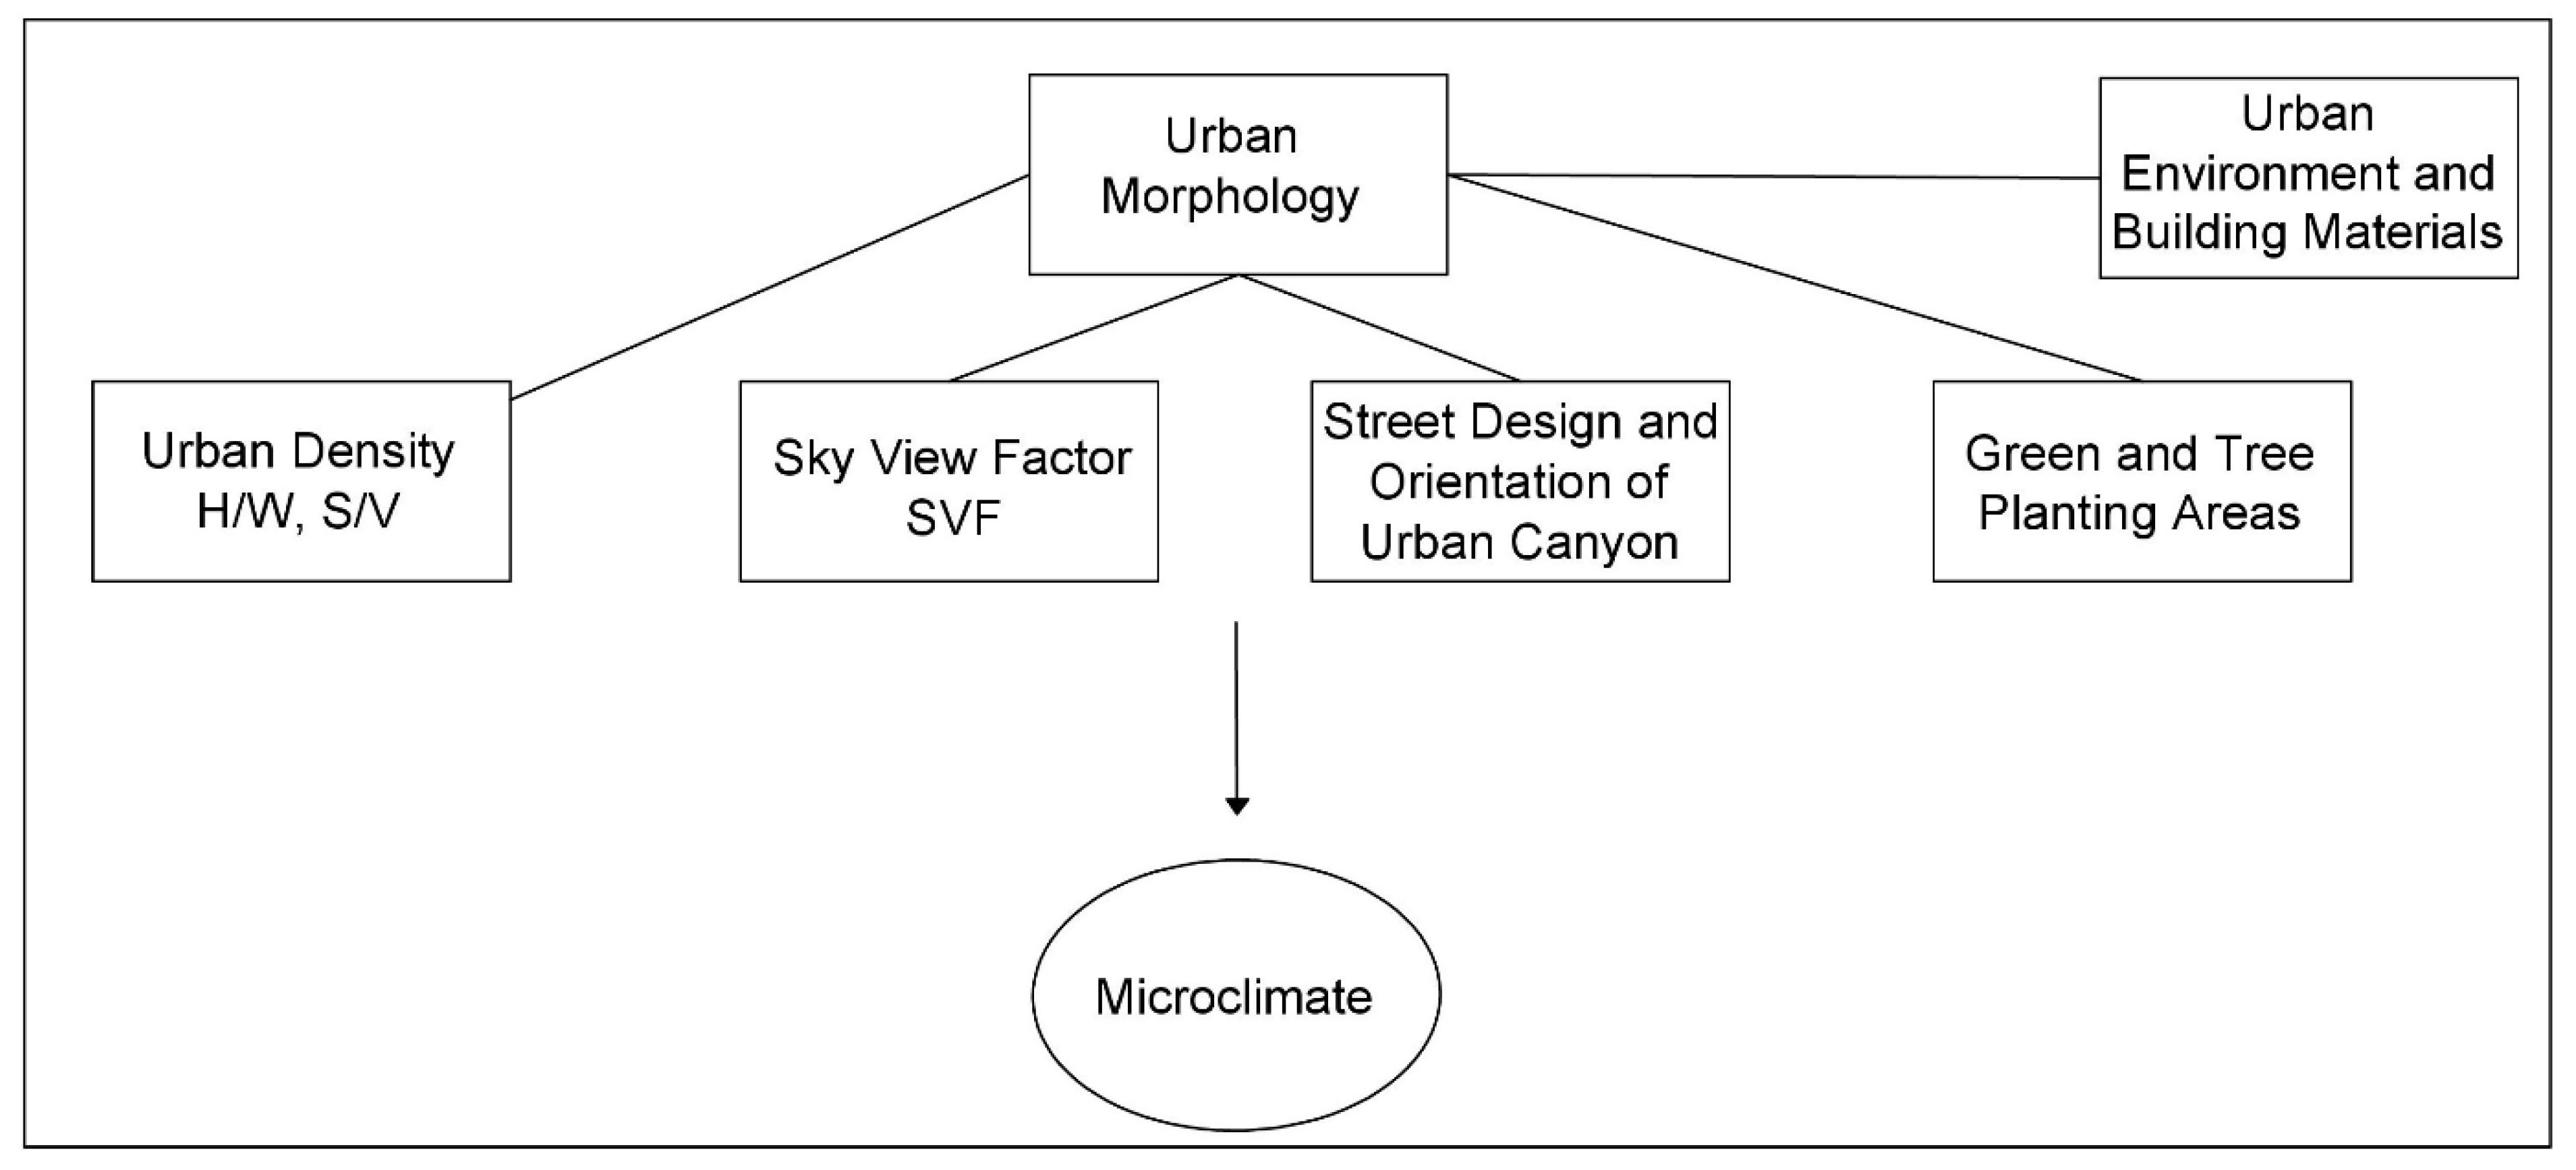
2.2. Analysis of the Urban Characteristics
2.3. Typology of the Building Blocks and Initial Findings for the Microclimate Conditions
3. Simulations of the Microclimate in the Compact Center of Thessaloniki and Main Results
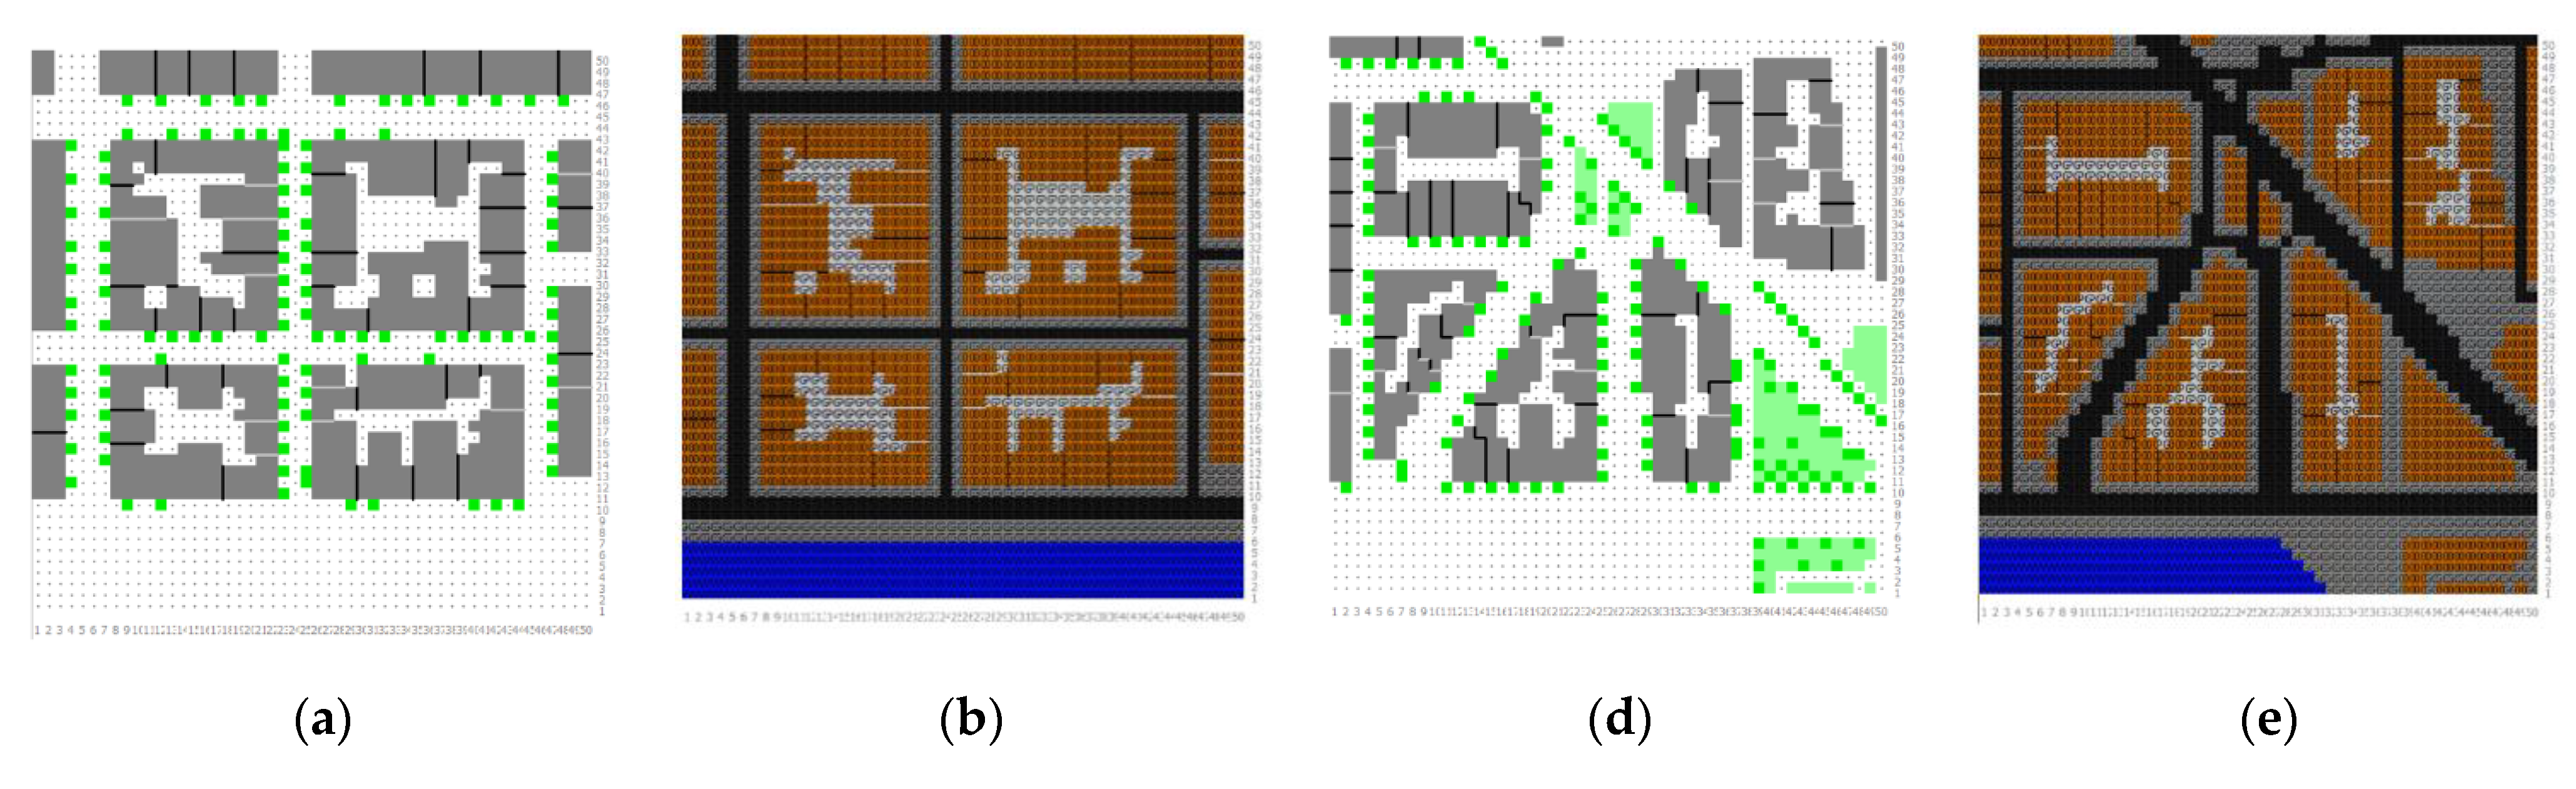
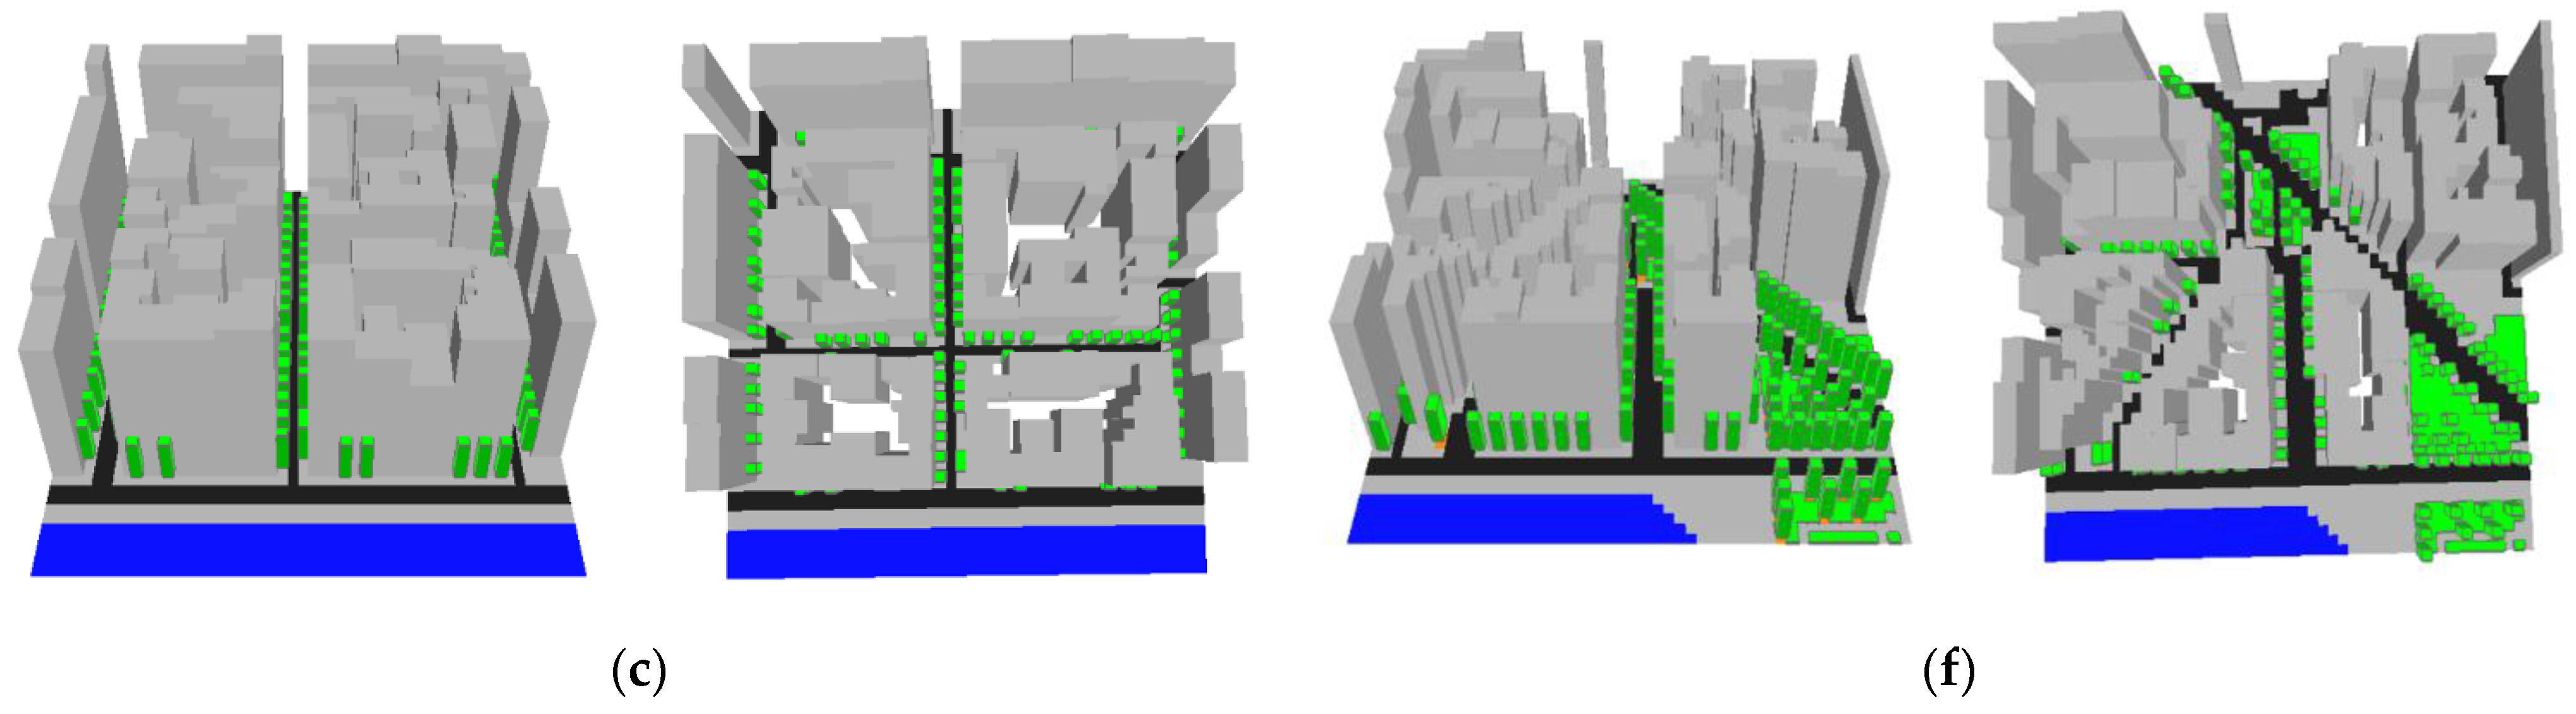
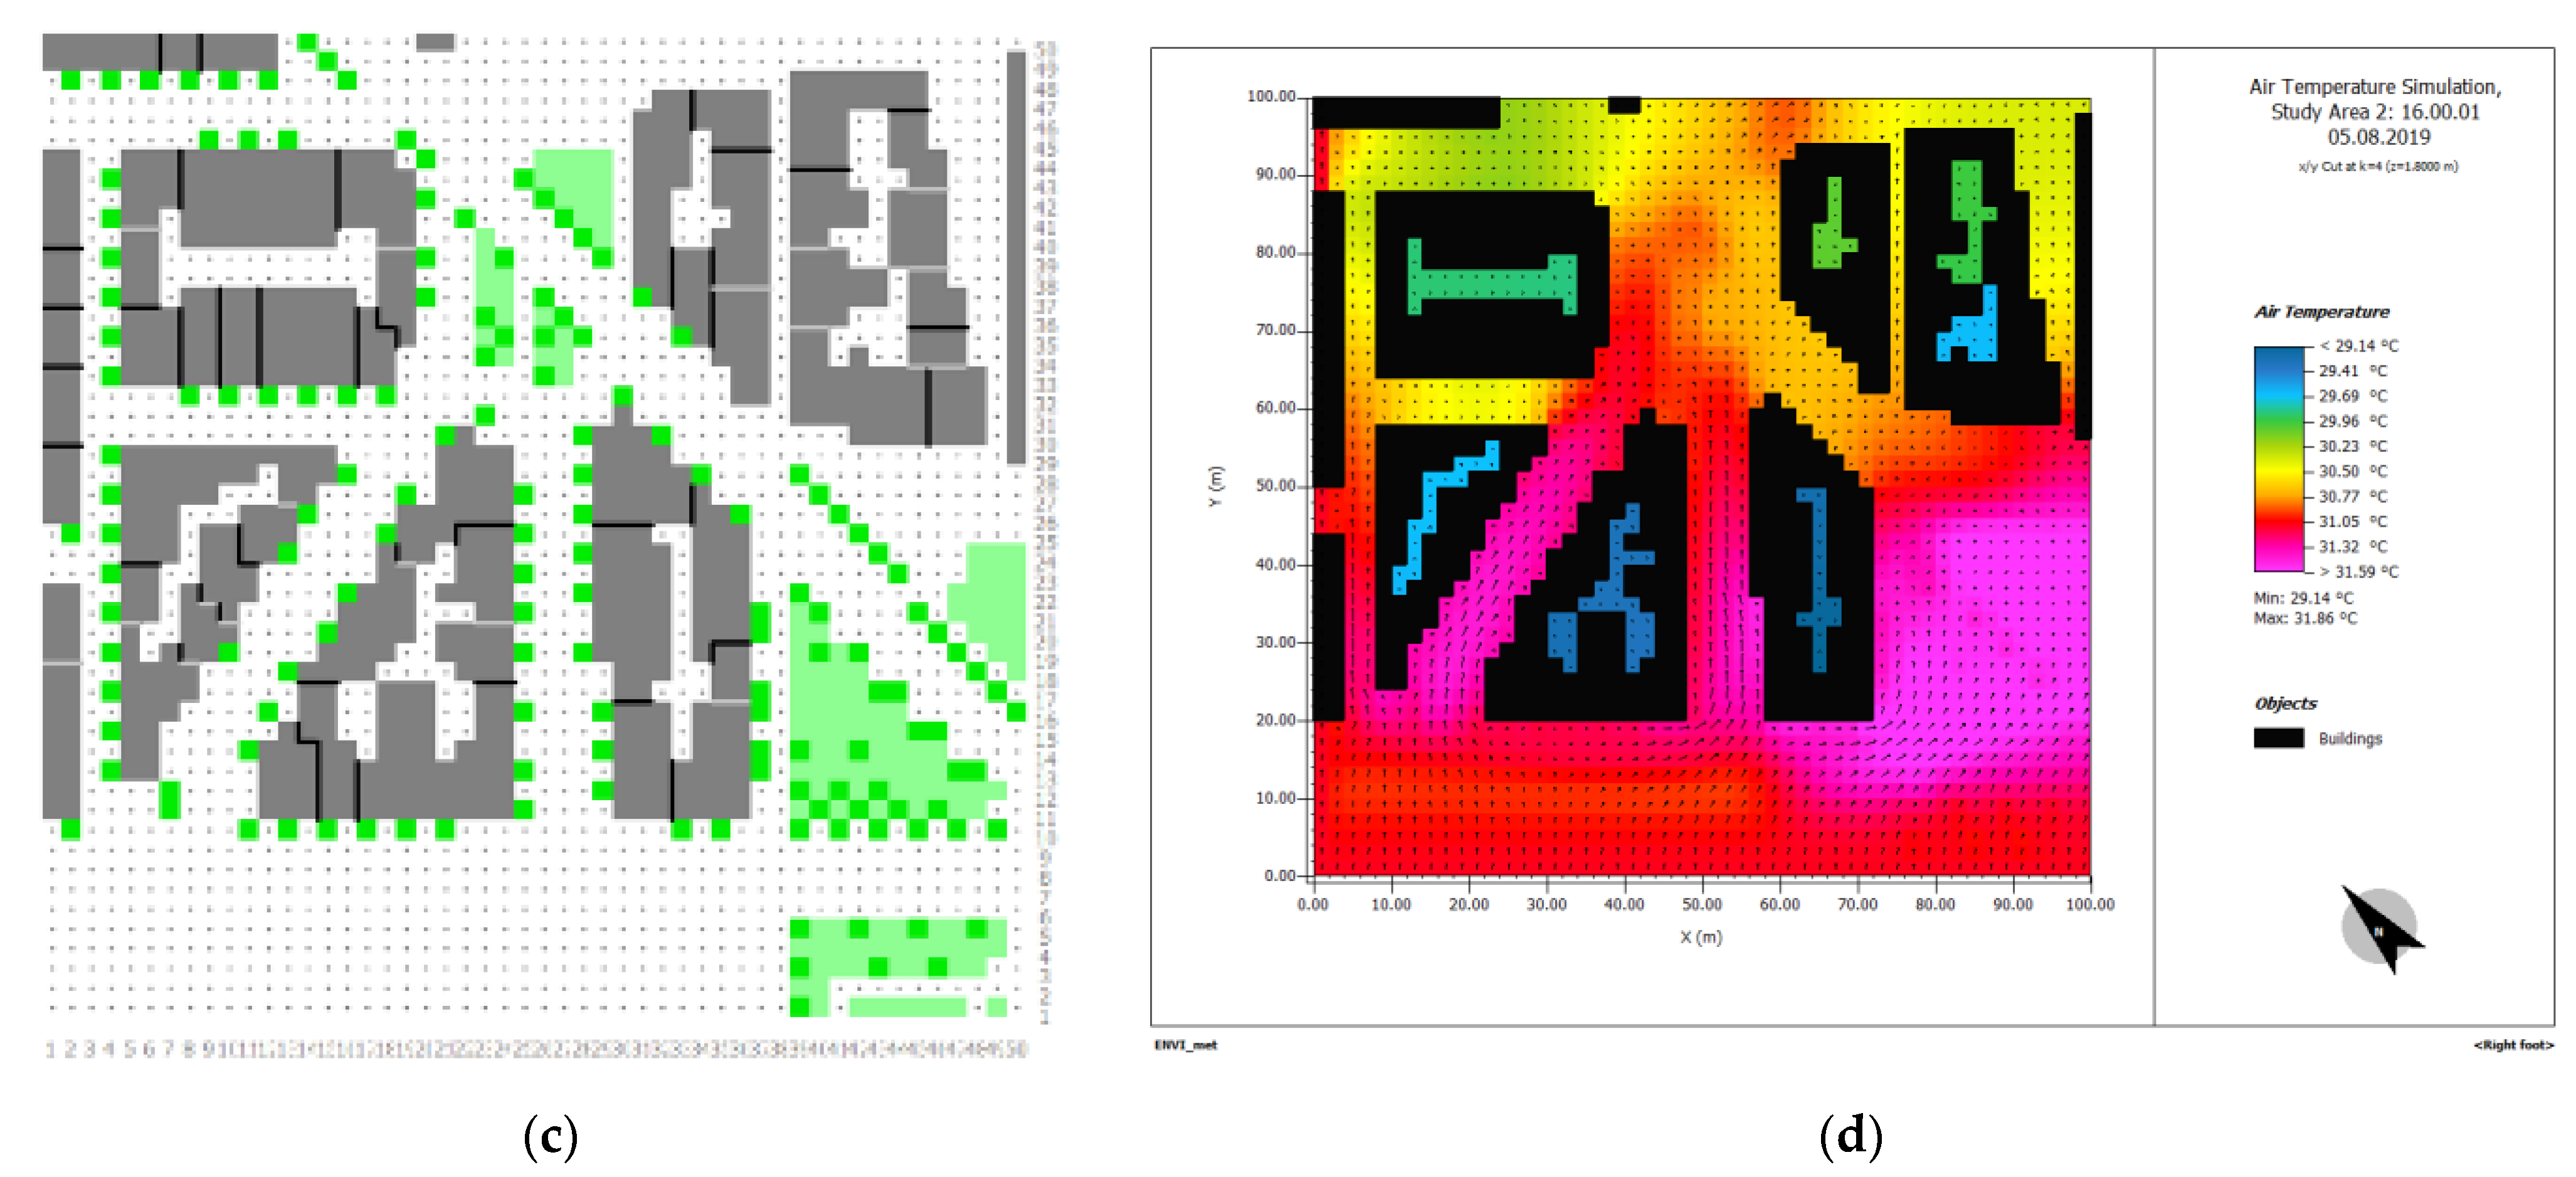
3.1. Modeling the Study Area Using ENVI-met©
3.2. Simulation Results
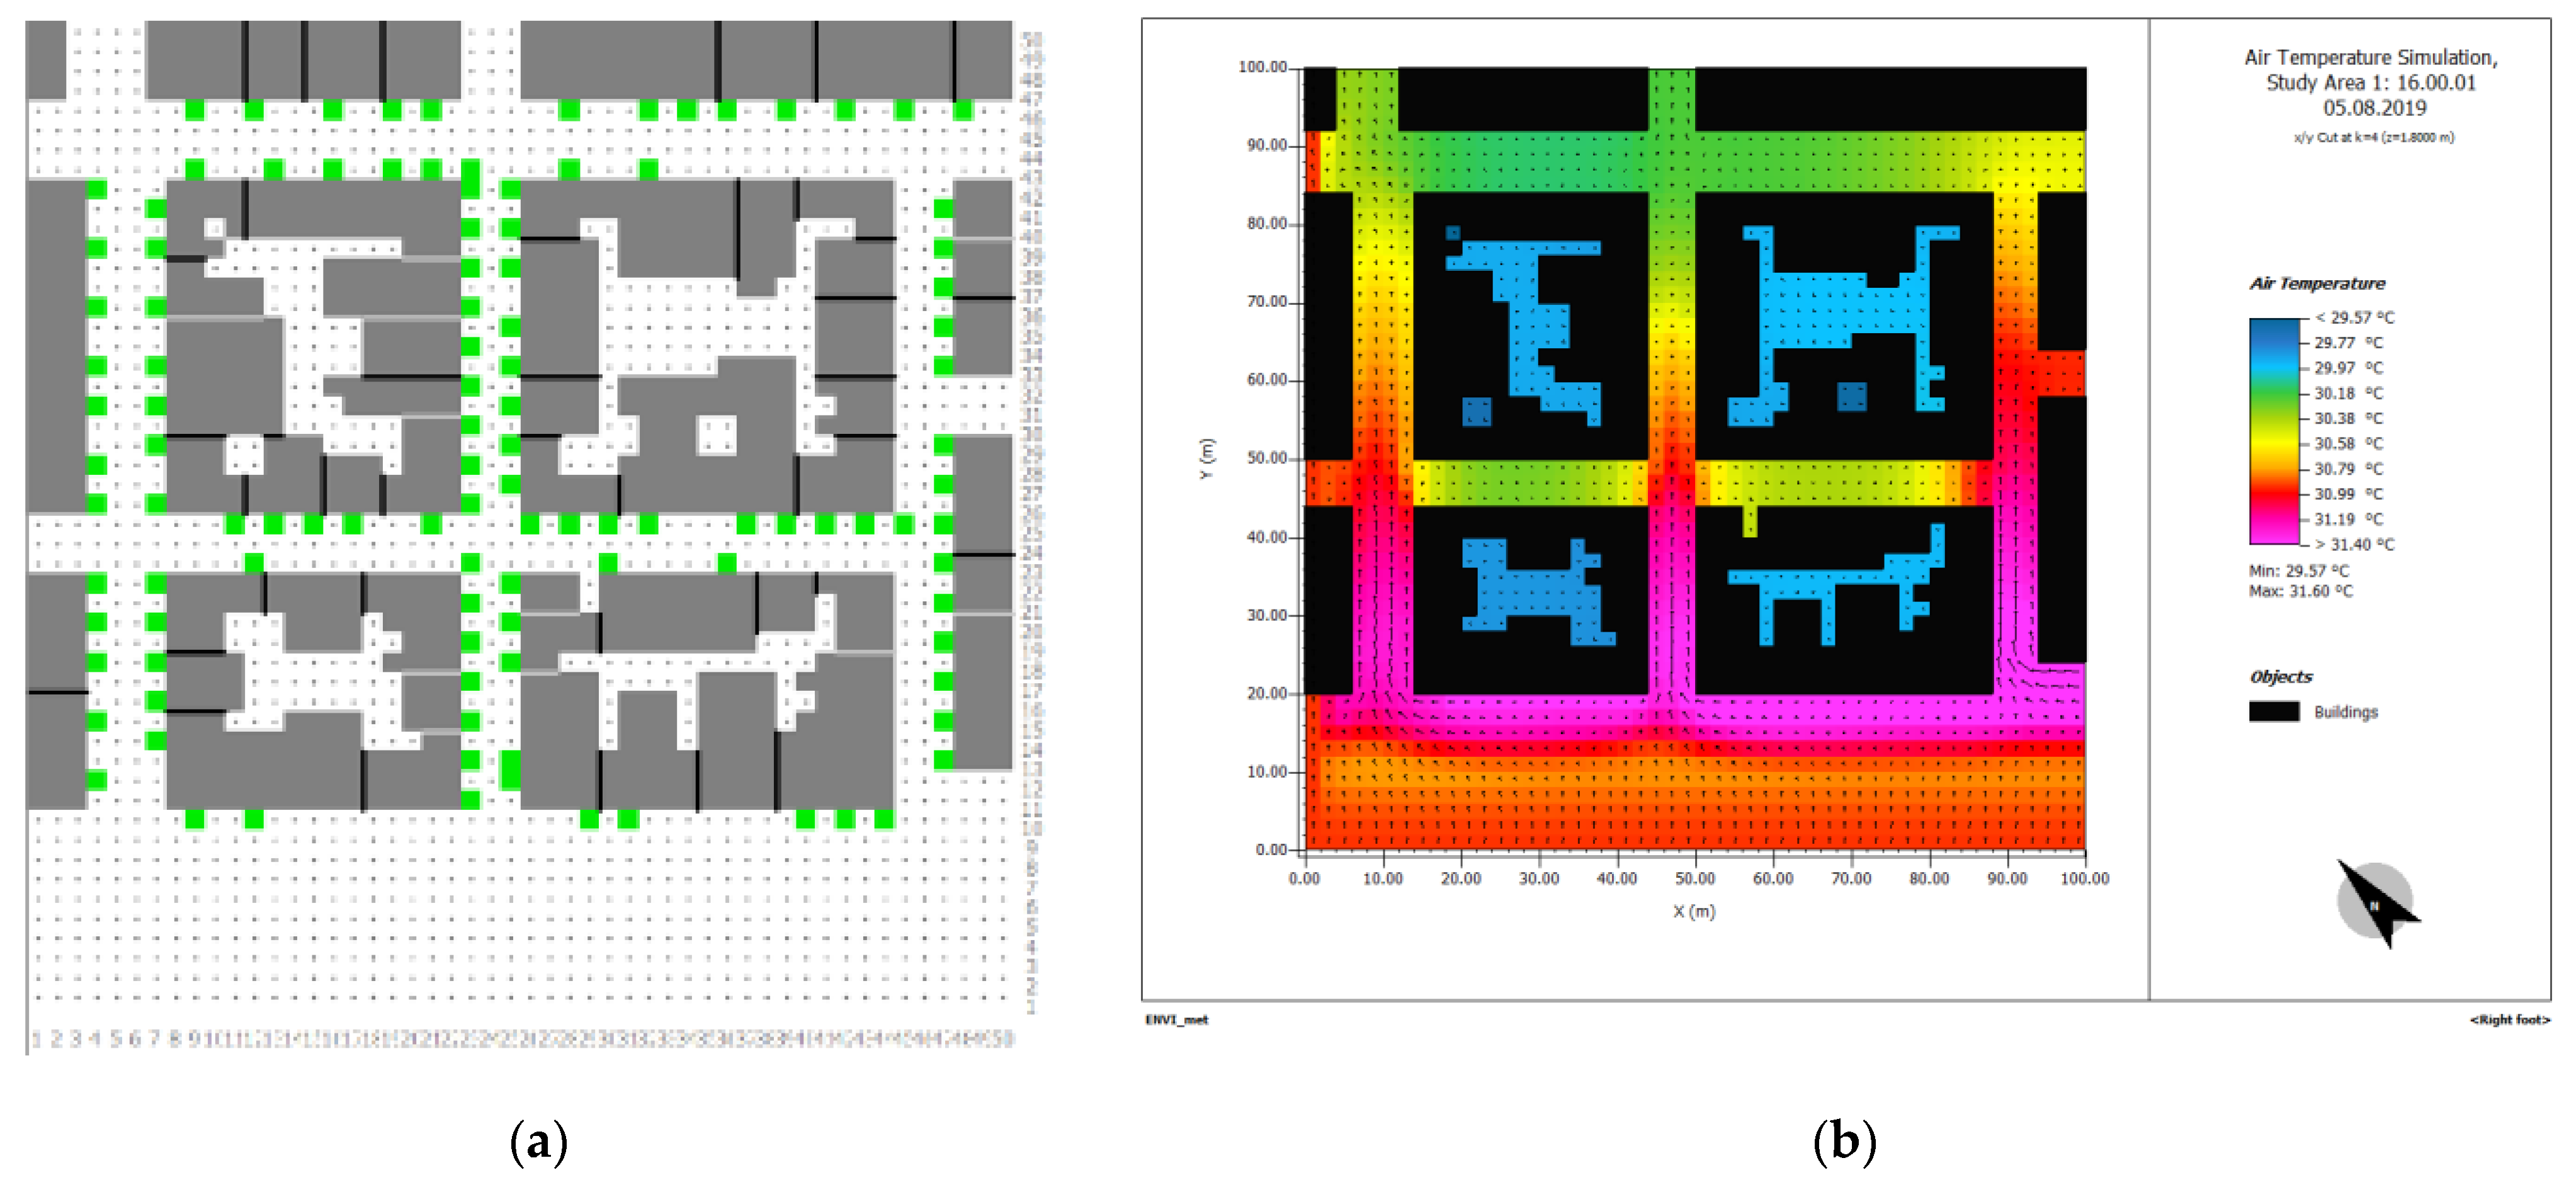
3.2.1. Air Temperature
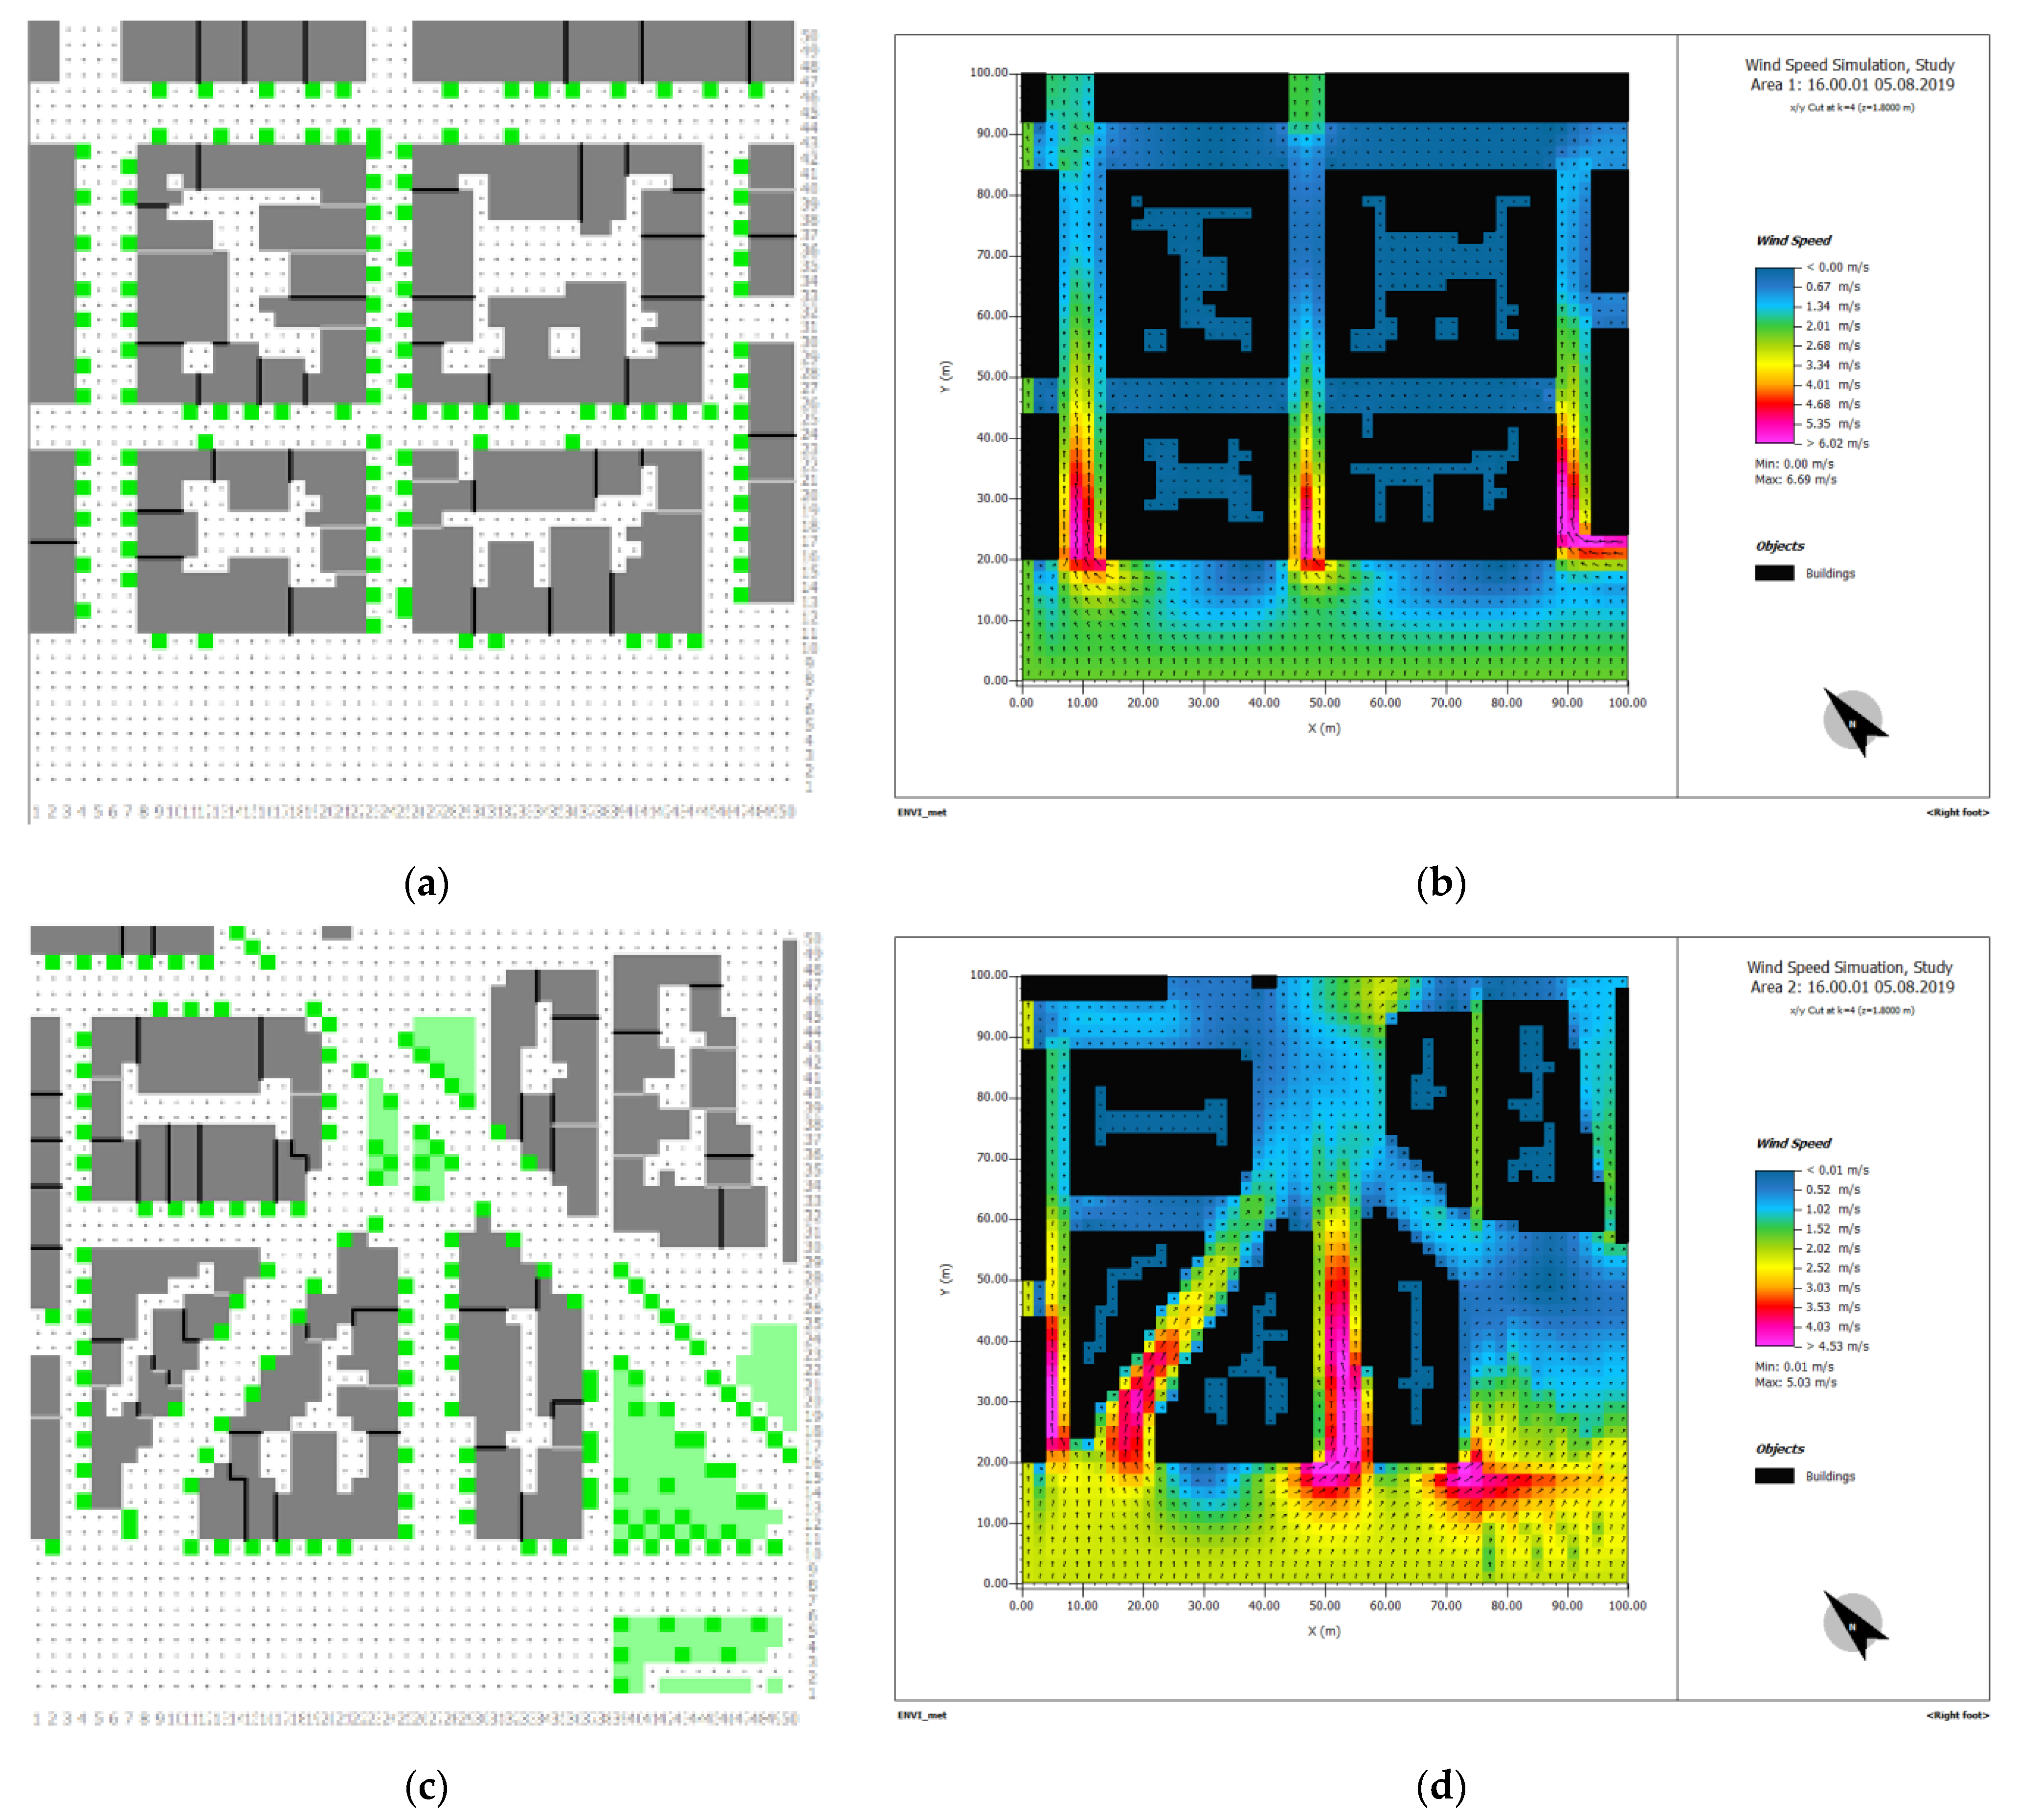
3.2.2. Wind Speed
3.2.3. Predicted Mean Vote (PMV) Index
3.3. Validation of ENVI-Met Software
4. Discussion
5. Conclusions
Author Contributions
Funding
Data Availability Statement
Conflicts of Interest
References and Note
- Tsoka, S.; Tsikaloudaki, K.; Theodosiou, T.; Bikas, D. Urban Warming and Cities’ Microclimates: Investigation Methods and Mitigation Strategies—A Review. Energies 2020, 13, 1414. [Google Scholar] [CrossRef] [Green Version]
- Rizwan, A.M.; Dennis, L.Y.C.; Liu, C. A review on the generation, determination and mitigation of Urban Heat Island. J. Environ. Sci. 2008, 20, 120–128. [Google Scholar] [CrossRef]
- Lin, P.; Gou, Z.; Lau, S.; Qin, H. The Impact of Urban Design Descriptors on Outdoor Thermal Environment: A Literature Review. Energies 2017, 10, 2151. [Google Scholar] [CrossRef] [Green Version]
- Givoni, B. Climate Considerations in Building and Urban Design; John Wiley & Sons, Inc.: New York, NY, USA, 1998; ISBN 978-0-471-29177-0. [Google Scholar]
- Goulding, R.J.; Lewis, J.O. Energy Conscious Design. In A Primer for Architects, Revised ed.; Steemers, T.C., Ed.; B T Batsford Ltd.: London, UK, 1994; ISBN 978-0-7134-6919-6. [Google Scholar]
- Hatzidimitriou, A. Evaluation of the Effect of Design Parameters on the Formation of the Microclimate of Urban Outdoor Spaces and on the Conditions of Thermal Comfort, during the Summer Season, in a Mediterranean Climate. Ph.D. Thesis, Aristotle University of Thessaloniki, Thessaloniki, Greece, 2012. [Google Scholar]
- Oke, T.R. Boundary Layer Climates, 2nd ed.; Taylor & Francis e-Library: London, UK, 1987; ISBN 978-0-203-40721-9. [Google Scholar]
- Oke, T.R.; Crowther, J.M.; McNaughton, K.G.; Monteith, J.L.; Gardiner, B. The Micrometeorology of the Urban Forest. Philos. Trans. R. Soc. B Biol. Sci. 1989, 324, 335–349. [Google Scholar] [CrossRef]
- Oke, T.R. Siting and Exposure of Meteorological Instruments at Urban Sites. In Air Pollution Modeling and Its Application XVII; Borrego, C., Norman, A.-L., Eds.; Springer: Boston, MA, USA, 2006; pp. 615–631. ISBN 978-0-387-28255-8. [Google Scholar]
- World Meteorological Organization. Organisation Météorologique Mondiale Guide to Meteorological Instruments and Methods of Observation; WMO: Geneva, Switzerland, 2008; ISBN 978-92-63-10008-5. [Google Scholar]
- Oke, T.R. Initial Guidance to Obtain Representative Meteorological Observations at Urban Sites; World Meteorological Organization: Vancouver, Canada, 2006. [Google Scholar]
- Bougiatioti, F.M. The Urban Microclimate. Bioclimatic Interventions for Its Use. Manuscript Notes/Lesson Lecture. 2010, unpublished.
- Gaitani, N.; Mihalakakou, G.; Santamouris, M. On the use of bioclimatic architecture principles in order to improve thermal comfort conditions in outdoor spaces. Build. Environ. 2007, 42, 317–324. [Google Scholar] [CrossRef]
- Polixronopoulos, D. The Integration of Bioclimatic Principles in Urban Planning. The Control of Insolation and Shading in the Urban Fabric. Ph.D. Thesis, National Technical University of Athens, Athens, Greece, 2002. [Google Scholar]
- Ko, Y. Urban Form and Residential Energy Use: A Review of Design Principles and Research Findings. J. Plan. Lit. 2013, 28, 327–351. [Google Scholar] [CrossRef]
- Nikolopoulou, M.; Likoudis, S.; Kikira, M.; Kofoed, N.-U.; Gaardsted, M.; Scudo, G.; Dessi, V.; Rogora, A.; Steemers, K.A.; Ramos, M.C.; et al. Designing Open Spaces in the Urban Environment: A Bioclimatic Approach; Nikolopoulou, M., Ed.; Centre for Renewable Energy Sources (CRES): Attiki, Greece, 2004; ISBN 960-86907-2-2. [Google Scholar]
- Roger, R. The Urban Task Force towards an Urban Renaissance, 1st ed.; Routledge: London, UK, 1999; ISBN 978-0-203-49774-6. [Google Scholar]
- Bartholomeos, A. Environmental Urban Planning of Greek Cities with Climatic Criteria. Ph.D. Thesis, Aristotle University of Thessaloniki, Thessaloniki, Greece, 2016. [Google Scholar]
- Oke, T.R. Street Design and Urban Canopy LayerClimate. Energy Build. 1988, 11, 103–113. [Google Scholar] [CrossRef]
- Gupta, V.K. Solar radiation and urban design for hot climates. Environ. Plan. B 1984, 11, 435–454. [Google Scholar] [CrossRef]
- Oke, T.R. The energetic basis of the urban heat island. Q. J. R. Met. Soc. 1982, 108, 1–24. [Google Scholar] [CrossRef]
- Synnefa, A.; Santamouris, M.; Livada, I. A study of the thermal performance of reflective coatings for the urban environment. Sol. Energy 2006, 80, 968–981. [Google Scholar] [CrossRef]
- Tzavali, A.P. Urban Heat Island: Analysis of the Phenomenon in Attica and Investigation of Its Effect on the Energy Behavior of School Buildings. Ph.D. Thesis, University of Patra, Patra, Greece, 2015. [Google Scholar]
- Athanasiou, E. City and nature. In Nature’s Views on Urban Planning; Association of Greek Academic Libraries: Athens, Greece, 2015; ISBN 978-960-603-175-5. [Google Scholar]
- Synnefa, A.; Santamouris, M.; Apostolakis, K. On the development, boptical properties and thermal performance of cool colored coatings for the urban environment. Sol. Energy 2007, 81, 488–497. [Google Scholar] [CrossRef]
- Mihalakakou, G.; Santamouris, M.; Papanikolaou, N.; Cartalis, C.; Tsangrassoulis, A. Simulation of the Urban Heat Island Phenomenon in Mediterranean Climates. Pure Appl. Geophys. 2004, 161, 429–451. [Google Scholar] [CrossRef]
- Emmanuel, R.; Johansson, E. Influence of urban morphology and sea breeze on hot humid microclimate: The case of Colombo, Sri Lanka. Clim. Res. 2006, 30, 189–200. [Google Scholar] [CrossRef] [Green Version]
- Oke, T.R. Canyon geometry and the nocturnal urban heat island: Comparison of scale model and field observations. J. Climatol. 1981, 1, 237–254. [Google Scholar] [CrossRef]
- Shashua-Bar, L.; Hoffman, M.E. Geometry and orientation aspects in passive cooling of canyon streets with trees. Energy Build. 2003, 35, 61–68. [Google Scholar] [CrossRef]
- Shishegar, N. Street Design and Urban Microclimate: Analyzing the Effects of Street Geometry and Orientation on Airflow and Solar Access in Urban Canyons. J. Clean Energy Technol. 2013, 52–56. [Google Scholar] [CrossRef]
- Ali-Toudert, F.; Mayer, H. Numerical study on the effects of aspect ratio and orientation of an urban street canyon on outdoor thermal comfort in hot and dry climate. Build. Environ. 2006, 41, 94–108. [Google Scholar] [CrossRef]
- Capeluto, I.G.; Yezioro, A.; Bleiberg, T.; Shaviv, E. Solar Rights in the Design of Urban Spaces. In Proceedings of the 23rd Conference on Passive and Low Energy Architecture, Geneva, Switzerland, 6–8 September 2006; p. 6. [Google Scholar]
- Swaid, H.; Bar-El, M.; Hoffman, M.E. A bioclimatic design methodology for urban outdoor spaces. Theor. Appl. Climatol. 1993, 48, 49–61. [Google Scholar] [CrossRef]
- Andreou, E. Τhe Investigation of the Factors that Shape the Microclimate in Urban Gorges. The Example of the Traditional and Newly Built Settlements of TINOS. Ph.D. Thesis, Aristotle University of Thessaloniki, Thessaloniki, Greece, 2011. [Google Scholar]
- Kim, H.; Gu, D.; Kim, H.Y. Effects of Urban Heat Island Mitigation in Various Climate Zones in the United States. Sustain. Cities Soc. 2018, 41, 841–852. [Google Scholar] [CrossRef]
- Lopes, C.; Adnot, J.; Santamouris, M.; Klitsikas, N.; Alvarez, S.; Sanchez, F. Managing the Growth of the Demand for Cooling in Urban Areas and Mitigating the Urban Heat Island Effect. In Proceedings of the Eceee Summer Studies 2001, Mandelieu, France, 11 June 2001; p. 13. [Google Scholar]
- Martins, T.A.L.; Adolphe, L.; Bonhomme, M.; Bonneaud, F.; Faraut, S.; Ginestet, S.; Michel, C.; Guyard, W. Impact of Urban Cool Island Measures on Outdoor Climate and Pedestrian Comfort: Simulations for a New District of Toulouse, France. Sustain. Cities Soc. 2016, 26, 9–26. [Google Scholar] [CrossRef]
- Fahed, J.; Kinab, E.; Ginestet, S.; Adolphe, L. Impact of Urban Heat Island Mitigation Measures on Microclimate and Pedestrian Comfort in a Dense Urban District of Lebanon. Sustain. Cities Soc. 2020, 61, 102375. [Google Scholar] [CrossRef]
- Bowler, D.E.; Buyung-Ali, L.; Knight, T.M.; Pullin, A.S. Urban greening to cool towns and cities: A systematic review of the empirical evidence. Landsc. Urban Plan. 2010, 97, 147–155. [Google Scholar] [CrossRef]
- Dimoudi, A.; Nikolopoulou, M. Vegetation in the urban environment: Microclimatic analysis and benefits. Energy Build. 2003, 35, 69–76. [Google Scholar] [CrossRef] [Green Version]
- Wang, C.; Wang, Z.-H.; Wang, C.; Myint, S.W. Environmental Cooling Provided by Urban Trees under Extreme Heat and Cold Waves in U.S. Cities. Remote Sens. Environ. 2019, 227, 28–43. [Google Scholar] [CrossRef]
- Spirn, A.W. Air Quality at Street-Level: Strategies for Urban Design; Harvard Graduate School of Design: Cambridge, MA, USA, 1986. [Google Scholar]
- Golany, G.S. Urban desing morthology and thermal performance. Atmos. Environ. 1995, 30, 455–465. [Google Scholar] [CrossRef]
- Papagiannakis, A.; Vitopoulou, A.; Yiannakou, A. Transit-Oriented Development in the Southern European City of Thessaloniki Introducing Urban Railway: Typology and Implementation Issues. Eur. Plan. Stud. 2020, 29, 117–141. [Google Scholar] [CrossRef]
- Yiannakou, A.; Salata, K.D. Adaptation to Climate Change through Spatial Planning in Compact Urban Areas: A Case Study in the City of Thessaloniki. Sustainability 2017, 9, 271. [Google Scholar] [CrossRef] [Green Version]
- Ministry of Environment and Energy. Ministry of Interior E-PLANNING Geographic Information Search. Available online: http://gis.epoleodomia.gov.gr/v11/#/ (accessed on 9 October 2020).
- Androutsopoulos, A.; Aravadinos, D.; Gonis, N.; Dimoudi, A.; Doulos, L.; Droutsa, K.; Efthymiadis, A.; Theodosiou, T.; Karaoulis, A.; Karellas, S.; et al. Detailed National Specifications of Parameters for Calculating the Energy Efficiency of Buildings and the Issue of the Energy Performance Certificate; Ministry of Environment and Energy—Ministry of Environment General Secretariat for Energy and Mineral Raw Materials, Technical Chamber of Greece: Athens, Greece, 2017. [Google Scholar]
- Meteo.Gr. The Weather in Greece. Available online: https://www.meteo.gr/ (accessed on 9 December 2020).
- List of Local Winds. Available online: https://www.wikiwand.com/en/List_of_local_winds (accessed on 9 August 2020).
- Windmill. Direction, Degrees, Intensity and Compass—Wind Names. Available online: https://www.helppost.gr/kairos/anemologio-dieythinsi-onomata-anemon/ (accessed on 9 August 2020).
- Grimmond, C.; Souch, C.; Hubble, M. Influence of tree cover on summertime surface energy balance fluxes, San Gabriel Valley, Los Angeles. Clim. Res. 1996, 6, 45–57. [Google Scholar] [CrossRef]
- Ye, G.; Yang, C.; Chen, Y.; Li, Y. A New Approach for Measuring Predicted Mean Vote (PMV) and Standard e Ective Temperature (SET*). Build. Environ. 2003, 38, 33–44. [Google Scholar] [CrossRef]
- d’Ambrosio Alfano, F.R.; Palella, B.I.; Riccio, G. The Role of Measurement Accuracy on the Thermal Environment Assessment by Means of PMV Index. Build. Environ. 2011, 46, 1361–1369. [Google Scholar] [CrossRef]
- Alfano, F.R. d’Ambrosio Palella, B.I.; Riccio, G. Notes on the Calculation of the PMV Index by Means of Apps. Energy Procedia 2016, 101, 249–256. [Google Scholar] [CrossRef]
- Ku, K.L.; Liaw, J.S.; Tsai, M.Y.; Liu, T.S. Automatic Control System for Thermal Comfort Based on Predicted Mean Vote and Energy Saving. IEEE Trans. Autom. Sci. Eng. 2015, 12, 378–383. [Google Scholar] [CrossRef]
- Tsoka, S.; Tsikaloudaki, K.; Theodosiou, T. Urban Space’s Morphology and Microclimatic Analysis: A Study for a Typical Urban District in the Mediterranean City of Thessaloniki, Greece. Energy Build. 2017, 156, 96–108. [Google Scholar] [CrossRef]
- Elnabawi, M.H.; Hamza, N.; Dudek, S. Thermal Perception of Outdoor Urban Spaces in the Hot Arid Region of Cairo, Egypt. Sustain. Cities Soc. 2016, 22, 136–145. [Google Scholar] [CrossRef]


| Analysis of Urban Characteristics of the Study Area | Location | Southeastern end of the historic center of Thessaloniki |
| Area of study area and individual sections | Total: 50,753 sq.m. Section A: 20,297 sq.m. Section B: 30,456 sq.m. | |
| Morphological characteristics | Compact city with strong residential development | |
| Average percentage of green areas for the municipality of Thessaloniki | 2.7 sq.m. per inhabitant | |
| Free spaces—green spaces | Lack of free space—green spaces, adequate tree planting | |
| Construction rules | Building ratio: 4.8; coverage ratio: 60% | |
| Building construction system | Continuous | |
| Land use | Urban center | |
| Relationship of structured—unstructured space | Problematic predominance of the structured | |
| Building height | Ranging from 17 to 38 m. Average height: 31.5 m. | |
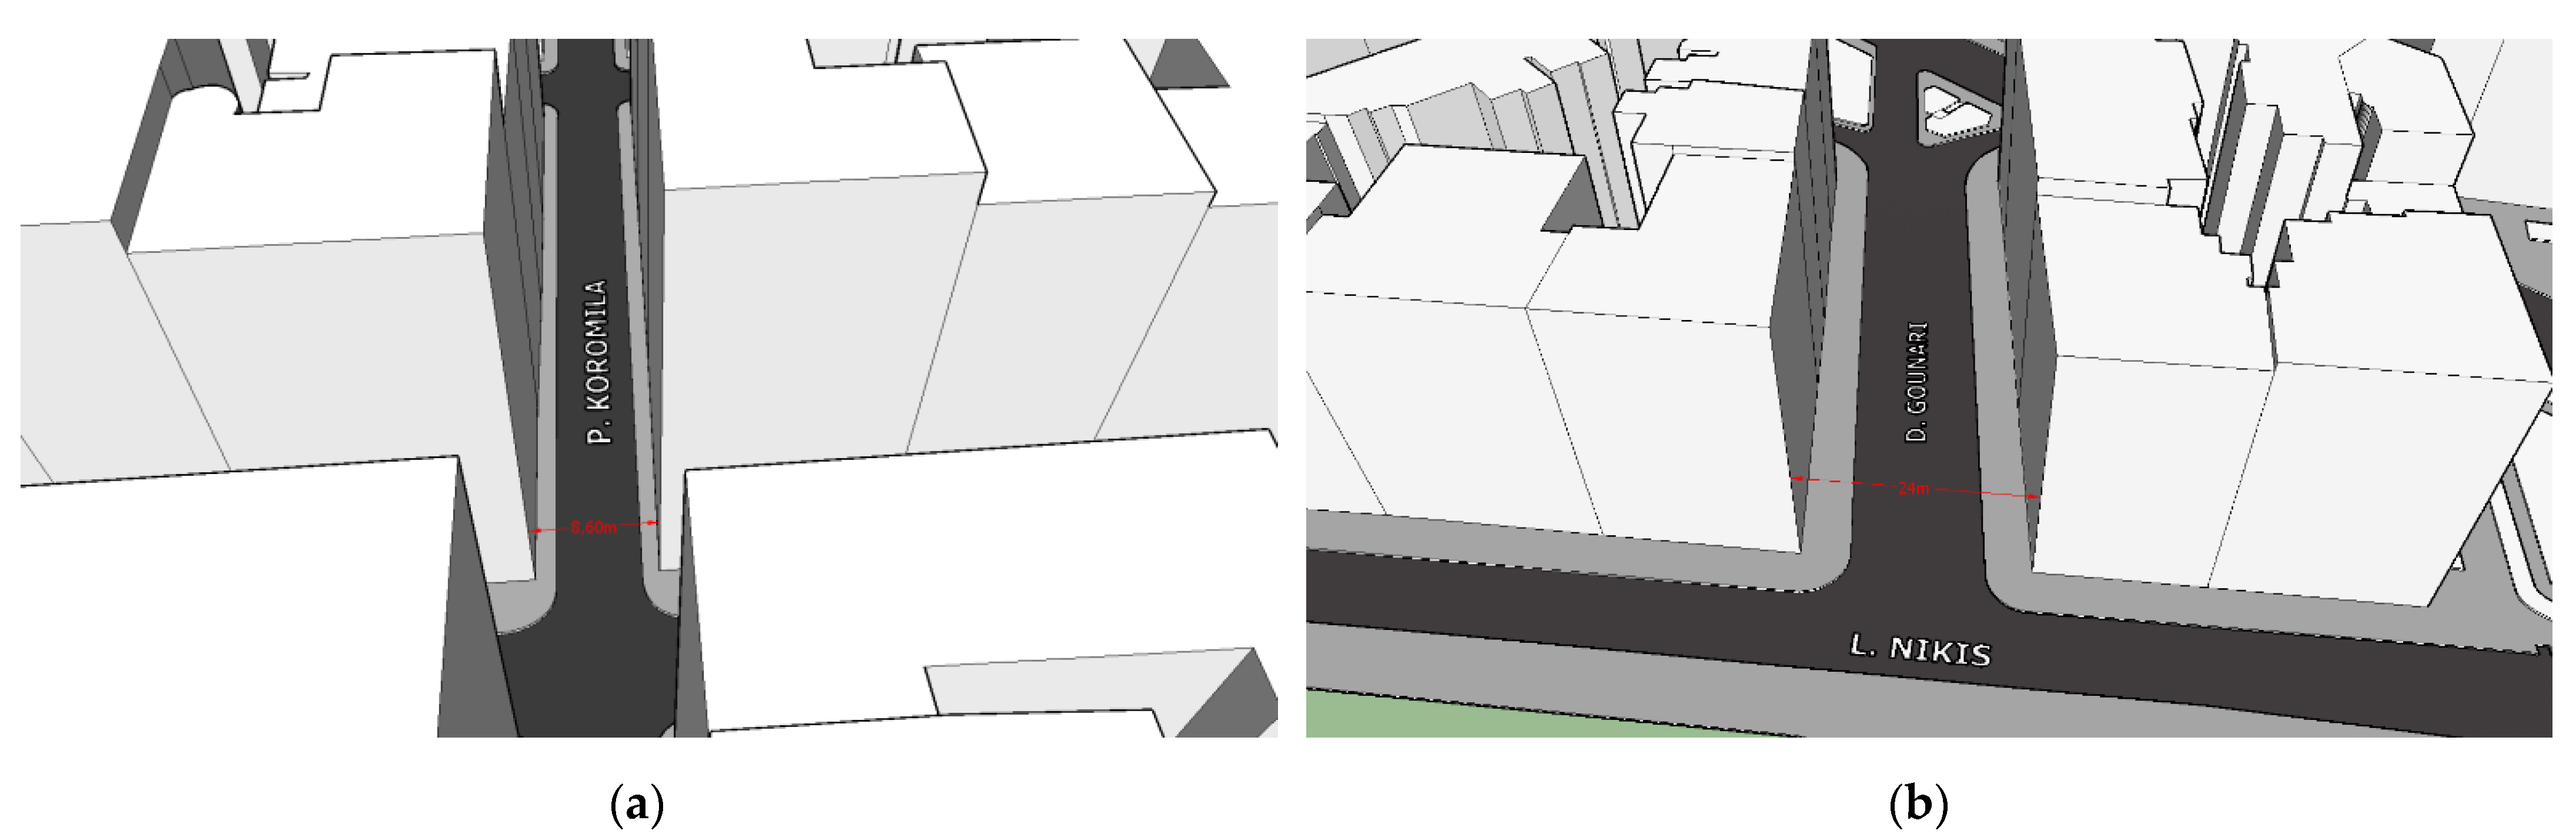
| Road width | 8.6–24 m. | |
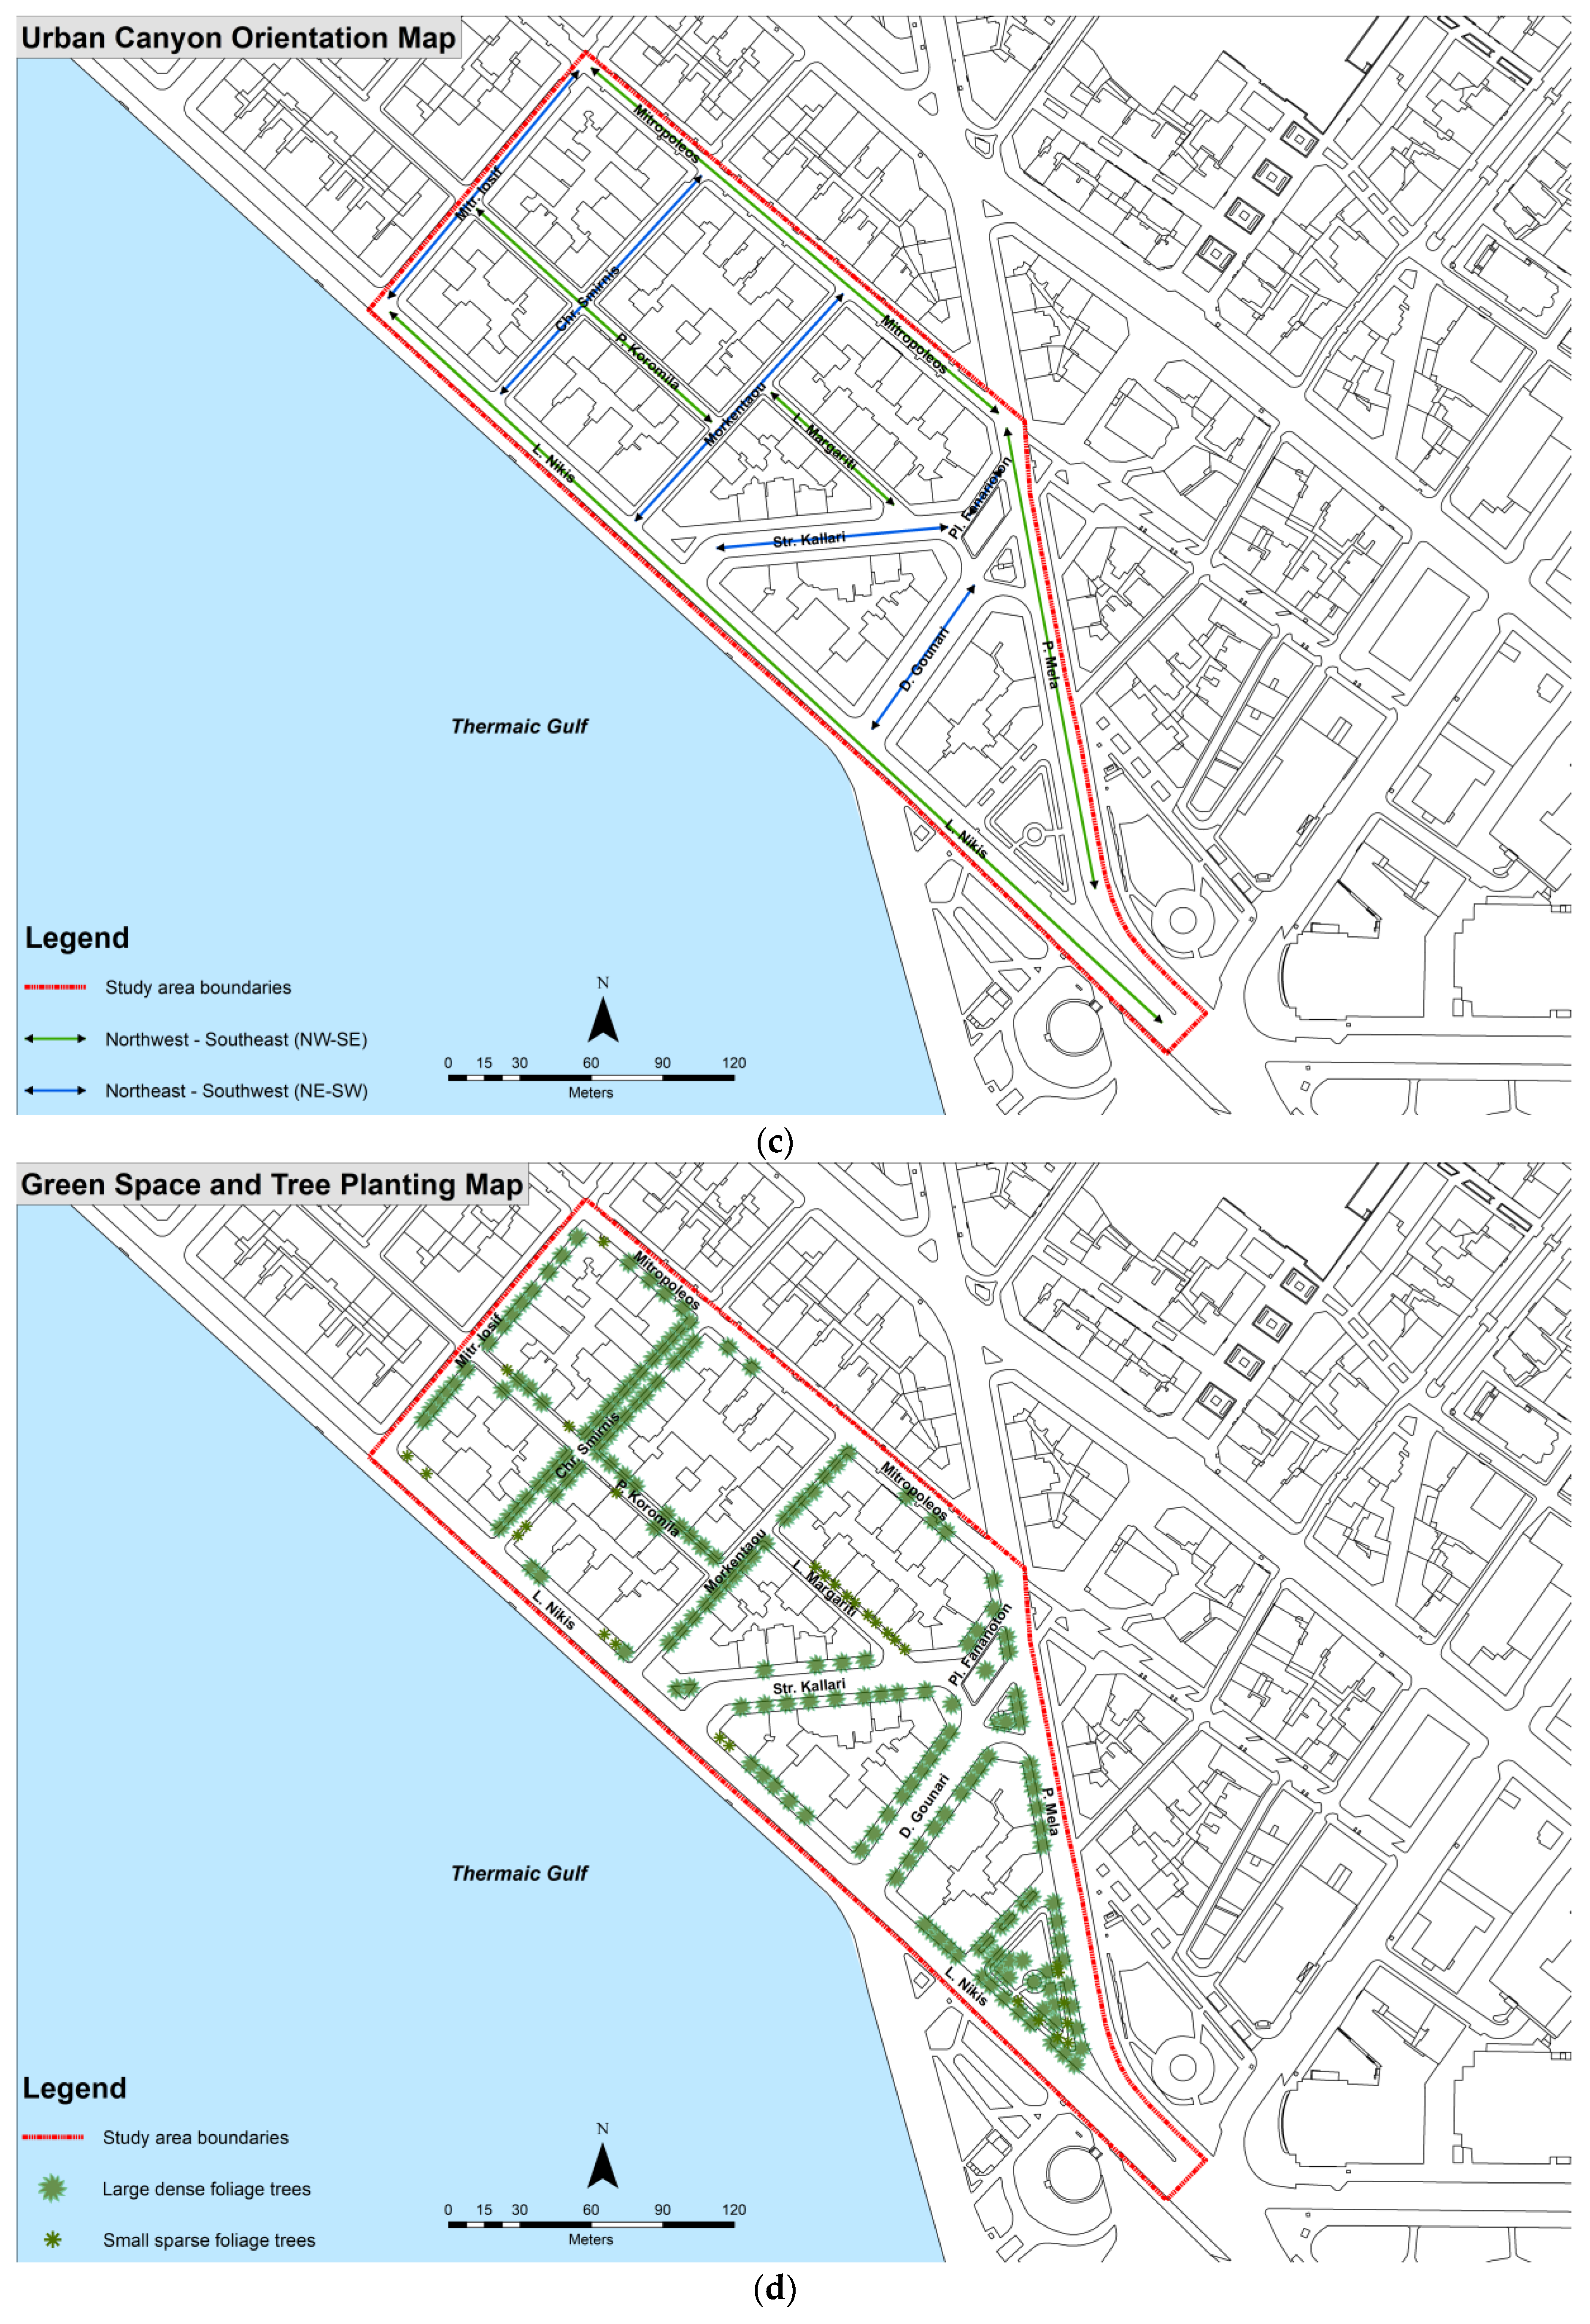
| Orientation of urban canyon | NE-SW or SW-SE |
| Study Area Input Data | |
|---|---|
| Location on earth | Thessaloniki |
| Geographic location (latitude, longitude) | 40.64, 22.93 |
| Reference longitude | 30 |
| Model dimensions (number of grids) xyz-grids | 50 × 50 × 40 |
| Size of grid cell (meters) dx,y,z | 2 × 2 × 2 |
| Model rotation out of grid north | 42° |
| Simulation Input Data | |
|---|---|
| Simulation date | 5/8/2019 |
| Start and duration of simulation | 05:00, 24 h |
| Wind speed | 3.1 m/s |
| Wind direction | SW, 225° |
| Temperature of atmosphere | Hot |
| Μin temperature | 24 °C |
| Μax temperature | 31 °C |
| Age of person (y) | 35 |
| Gender | Male |
| Weight (kg) | 75 |
| Height (m) | 1.75 |
| Static clothing insulation (clo) | 0.90 |
| Total metabolic rate (W) | 164.49 |
| Element Type | Albedo |
|---|---|
| Default wall—moderate insulation | 0.2 |
| Asphalt road | 0.2 |
| Dark granit pavement | 0.3 |
| Concrete pavement gray | 0.5 |
| Tree 10 m very dense, leafless base | 0.2 |
| Hedge dense, 2 m | 0.2 |
| Deep water | 0.0 |
| −3 cold | −2 cool | −1 slightly cool | 0 neutral | +1 slightly warm | +2 warm | +3 hot |
Publisher’s Note: MDPI stays neutral with regard to jurisdictional claims in published maps and institutional affiliations. |
© 2021 by the authors. Licensee MDPI, Basel, Switzerland. This article is an open access article distributed under the terms and conditions of the Creative Commons Attribution (CC BY) license (https://creativecommons.org/licenses/by/4.0/).
Share and Cite
Kouklis, G.-R.; Yiannakou, A. The Contribution of Urban Morphology to the Formation of the Microclimate in Compact Urban Cores: A Study in the City Center of Thessaloniki. Urban Sci. 2021, 5, 37. https://0-doi-org.brum.beds.ac.uk/10.3390/urbansci5020037
Kouklis G-R, Yiannakou A. The Contribution of Urban Morphology to the Formation of the Microclimate in Compact Urban Cores: A Study in the City Center of Thessaloniki. Urban Science. 2021; 5(2):37. https://0-doi-org.brum.beds.ac.uk/10.3390/urbansci5020037
Chicago/Turabian StyleKouklis, Georgios-Rafail, and Athena Yiannakou. 2021. "The Contribution of Urban Morphology to the Formation of the Microclimate in Compact Urban Cores: A Study in the City Center of Thessaloniki" Urban Science 5, no. 2: 37. https://0-doi-org.brum.beds.ac.uk/10.3390/urbansci5020037