
Residential Segregation and Living Conditions. An Analysis of Social Inequalities in Catalonia from Four Spatial Perspectives


Research Group on Energy, Territory and Society, Department of Geography, Autonomous University of Barcelona, 08193 Bellaterra, Spain
*
Author to whom correspondence should be addressed.
Urban Sci. 2021, 5(2), 45; https://0-doi-org.brum.beds.ac.uk/10.3390/urbansci5020045
Submission received: 24 February 2021
/
Revised: 6 May 2021
/
Accepted: 26 May 2021
/
Published: 31 May 2021
(This article belongs to the Special Issue Fragmented City: International Mobility and Housing in Spain)
Abstract
:Spatial inequalities in living conditions have traditionally been attributed to geographical location, the opposition between urban and rural settings or the size of settlements. Accordingly, the geographical literature has used these oppositions to explain not only differences in access to education, work and services but also diversity of lifestyles, beliefs and even political attitudes. In recent decades, however, urban areas have extended their scope, urbanization has become more dispersed, territories have become more interdependent and spatial hierarchies have tended to weaken. At the same time, social inequalities have become more marked, as manifested spatially by residential segregation. This article puts forward the thesis that residential segregation constitutes a considerably better explanatory factor currently for the elucidation of social inequalities and differences in living conditions in regional spaces than geographical location, the urban/rural divide or the size of settlements. A set of key indicators in the population of residents in Catalonia (level of education, socio-economic position, risk of poverty, self-perceived health and life satisfaction) are therefore analyzed from various spatial perspectives to explore this argument and evaluate each indicator’s explanatory potential. The main results seem to confirm the hypothesis that the most striking spatial inequalities are associated with residential segregation.
1. Introduction
Over the course of recent decades and, more particularly, as a result of the financial crisis that began in 2007, there has been an increase in inequalities in income and wellbeing in the populations of many developed countries. This subject has repeatedly sparked research and international debate, giving rise to some particularly influential studies [1,2,3,4,5]. Spain is one of the countries in the European Union in which this rise in inequalities has been most marked [6].
The increase in inequalities that has already become evident in the last twenty years of the past century in various European countries is even more striking for appearing after decades of relative progress in matters of equity. Its emergence has been attributed to a combination of various factors: the crisis of the welfare state [7], asymmetry in the mobility of capital and labour [8], the generalization of neoliberal policies [9], the growing incompatibility between capitalist economies and democratic institutions [10] and the effects of economic globalization [4]. In this context, the COVID-19 pandemic will very likely trigger an increase in inequality from the year 2020 onwards, on both a global and a national level, for two reasons: on the one hand, the pandemic will probably give rise to an increase in global poverty [11] and, on the other hand, inequality is itself a coadjutant in the expansion of the pandemic [12].
The debate on inequalities has acquired greater visibility in recent years due to an upsurge in political attitudes and behaviours of a disruptive nature in many European cities and countries [13,14,15,16,17,18,19]. These attitudes and behaviours express the dissatisfaction and fears of large sections of the population about the social and urban transformations that are occurring, as well as the policies that have accompanied them [20]. Changes in political attitudes have been apparent over the last decade in various episodes with widely varying characteristics. The most visible examples are the resistance to the imposition of austerity measures in various European countries at the high point of the financial crisis (Greece, Spain, Portugal), the emergence of the “gilets jaunes” movement in France and independence movements in other territories (Scotland, 2017; Catalonia, 2017). This unrest has been expressed electorally in a number of different ways. On the one hand, it has sparked the upsurge of newly minted political forces that challenge the traditional parties (Syriza in Greece, Podemos in Spain) and, on the other hand, it has driven the renewal of parties and movements on the far right (now represented in many national parliaments and governments of several European countries). Similarly, there have been referendums that have produced results which clearly alter the status quo (on Brexit in the United Kingdom and on constitutional reform in Italy, both in 2016).
This motley collection of phenomena displays a complexity that defies any simplification, be it the exaltation in some quarters of an upsurge in pure civic dynamism destined to advance progressive policies “from the bottom up” or the forthright condemnations emanating from other sectors, complete with labels such as “populism” and “irrationalism”. In any case, these changes in political attitudes represent one of the most significant phenomena in the recent development of contemporary European societies, due to both the contradictions that they embody and the historical consequences that they could entail [18].
Various authors who have closely examined these phenomena have emphasized the importance of territorial variables in the evolution of social conflict and political discontent. Accordingly, the origins of these developments have been sought in, for example, the opposition between the “France péripherique” and the Parisian metropolis [13]; between Britain’s old industrial hinterlands and the great tertiary hub of London [15,21]; between the Italian mezzogiorno and the better-off regions in the north and centre of the country; or between “Empty Spain” and the metropolitan areas [22]. From the spatial viewpoint, therefore, discontent could be interpreted, to a certain extent, as “the revenge of places that do not matter” [15], making it more the result of specific territories’ feelings of resentment than of social inequalities in themselves.
This debate is directly linked to a perennial topic in geographical analysis: the effects of territorial diversity on a population’s living conditions. As already known, there is an extensive body of research on this subject that responds to diverse approaches and themes. These include economic analyses on the factors that affect regional disparities [23,24,25], works on the causes and consequences of urban segregation [26,27,28,29,30,31], debates on the geography of opportunities and the neighborhood effect [32,33,34,35] and critical essays on uneven development and the demand for spatial justice [36,37,38,39,40,41,42].
One of the main questions addressed in this debate is precisely which factors explain, on the one hand, discrepancies in access to education, income, work or services and, on the other hand, diversity in lifestyles, beliefs and even political attitudes. Geographic tradition attributed these disparities to regional peculiarities and genre de vie [43], the opposition between urban and rural areas [44] or the settlements’ population size [45]. However, in Europe in recent decades, extended urbanization [46,47], the spread of urban networks over the territory [48] and the relative weakening of spatial hierarchies within regions [49] have highlighted the conceptual inadequacy of those approaches and the need to address the issue from other perspectives.
The present contribution explores precisely this question, starting from the hypothesis that the key factors for explaining spatial inequalities in living conditions are not to be found in the classic territorial oppositions but rather in residential segregation. Thus, the territorial factor that would most clearly impinge upon the maintenance and reproduction of social inequalities—on the basis of income or origin, on both an urban and a regional scale—would be, above all else, the tendency of social groups to fracture. Far from being a matter of solely analytical importance, the clarification of the question is, in our opinion, of great significance when it comes to elucidating the causes of social discontent to which we have referred above.
We define residential segregation herein as the tendency of social groups to separate from each other in urban areas according to their capacity to choose a place of residence. As is well known, this capacity depends mostly on two factors: on the one hand, disposable income and, on the other, real estate prices [29,30,38,50,51]. Under these circumstances, the most disadvantaged groups tend to concentrate in those areas where the low quality of housing, lack of amenities and/or scarcity of public services make prices relatively lower. In contrast, households that are more affluent, and thus able to choose their place of residence more easily, also tend to group together to enjoy the benefits of living among their peers and take advantage of better services. Recent studies have shown how growing income inequalities are leading to rising levels of urban socioeconomic segregation almost everywhere in the world, and more specifically in the main European cities [31,52]. In this context, one of the factors that can contribute to this increased segregation is the distribution of social housing in urban areas or, as in the case we studied, the ineffectiveness of social housing policies [53,54,55].
The discussion draws on research into the specific case of Catalonia in the first two decades of the 21st century. This case is particularly interesting for two reasons. First, the urbanization process has given rise to strong contrasts in this region of southern Europe: thus, more than two-thirds of the Catalan population—5 million out of 7.5 million inhabitants—reside in the metropolitan area of Barcelona, which covers barely 10% of the 32,000 sq. km that make up the region’s total surface area [56]. Furthermore, in the last few decades Catalan society has experienced deep transformations that have radically altered its economic base (an ongoing transition from industry to services), modified its social structure (reduced importance of traditional social classes) and sparked strong migratory flows [57,58]. In the last ten years, moreover, these transformations have been accompanied by highly significant social and political instability [59,60].
The method used here to examine this issue involved, firstly, the selection of a series of social indicators related to the living conditions of the population resident in Catalonia. These indicators are then analysed in terms of four different spatial aggregations of the data: geographical setting, population size, the intensity of urbanization and the effect of urban segregation. It is then demonstrated that the latter variable proves most discerning when it comes to explaining the territorial factors that impinge upon people’s lives. An initial processing of the data presented below was undertaken within the framework of the Report on Social Cohesion in Catalonia [60]. The methodology adopted partly follows that used in [14].
On the basis of the proposed objectives, hypothesis and methodology, this study is divided into four sections: the present introduction; a brief methodological epigraph with specifications of the data used and the type of analysis conducted; an explanation and discussion of the results obtained and, finally, a synthesis and some brief conclusions.
2. Materials and Methods
Two key elements need to be determined in an examination of the spatial distribution of social inequality: on the one hand, the variables selected as indicators of living conditions and, on the other hand, the territorial aggregations used to analyse them. As mentioned above, in this study we evaluated various indicators related to people’s living conditions according to their place of residence in the Catalan territory, and we systematically compared several territorial groupings of the data. The indicators used came from the processing of the Survey of the Population’s Living Conditions and Habits (ECVHP) corresponding to the year 2011.
The ECVHP drawn up by the Institut d’Estudis Regionals i Metropolitans de Barce-lona (IERMB) and the Institut d’Estadística de Catalunya (IDESCAT) has a five-year periodicity. The 2011 version used here covered the entire territory of Catalonia with an effective sample of 4235 households (sample units) distributed between 529 census tracts, resulting in a sample of 10,604 individuals (8000 of them aged 16 and over). Sampling errors for Catalonia as a whole were ±1% for individuals and ±1.5% for households. Even though in most cases the sample does not permit any greater disaggregation for statistical exploitation, it is sufficient in size for the purposes of this analysis. A Table S1 indicating the number of records included in each variable and spatial aggregation has been added to the Supplementary Materials to demonstrate the representativeness of the sample. This version was chosen for two reasons: on the one hand, it presents a complete set of data related to residential segregation, as shown more fully below; on the other hand, it evidences the structural nature of territorial inequalities, which was present prior to the crisis situations of the last decade and continued throughout them. Furthermore, although there have been more recent surveys, these do not present a sufficient sample to analyse the whole of the territory of Catalonia and the different territorial aggregations proposed. For details of the methodology of the ECVHPC, see [61]. More specifically, we selected the following five variables (in each, the treatment of the variables and subdivisions of the data responds to the desire to achieve the best possible balance between the sample size of the survey data and the objective of the study):
- Level of completed studies. Official level of education acquired by individuals aged 25 or over. Two groups were differentiated: the population with higher education and the population without.
- Social structure. Social structure for the working population aged between 16 and 64, in accordance with the criteria of the European Socio-Economic Classification (ESEC 9 + 1). Social strata were classified on the basis of groupings of jobs (i.e., occupational strata). Two groups were constructed for the purposes of our analysis: a qualified group (ESEC = 1, 2 and 3) and the rest of the population (ESEC > 3). ESEC 1, 2 and 3 correspond to the categories: large employers and higher-grade professional, administrative and managerial occupations; lower-grade professional, administrative and managerial occupations; and higher-grade white-collar workers. For more details of this classification, see [36].
- Rate of risk of poverty in the population. Percentage of people who are below the poverty level in the absence of any social transfers, other than retirement and subsistence payments. This threshold is established as 60% of people’s median income per consumption consumer unit (equivalized household size). Two groups were differentiated: those at risk of poverty and those not at risk.
- Self-perceived health. Subjective perception of individuals’ state of health, for the population aged 16 and over. Two groups were differentiated: those who state that they enjoy a good or very good state of health, and those who say that they are in a middling, bad or very bad state.
- Overall life satisfaction. Subjective perception of the life satisfaction of people aged 16 and over. A scale running from 0 to 10 is used to evaluate the degree of satisfaction (0 = total dissatisfaction; 10 = total satisfaction).
As mentioned above, these variables have been analysed with respect to four territorial aggregations established according to criteria of: geographical location, population size, intensity of urbanization and social vulnerability. The following four groupings were used for this purpose.
- Planning settings. Spatial planning areas currently used in Catalonia: Metropolità, Comarques Gironines, Camp de Tarragona, Terres de l’Ebre, Ponent and Alt Pirineu-Aran, Comarques Centrals and Penedès [62]. To make the sample more representative, the settings of Ponent and Alt Pirineu-Aran were combined into one.
- Size of population. Classification of the totality of the municipalities of Catalonia according to the number of inhabitants registered in the population census, in keeping with data from the Institut Català d’Estadística (IDESCAT) Continuous Census of Inhabitants. The municipalities were divided according to the following pattern: less than 5001 inhabitants; between 5001 and 10,000 inhabitants; between 10,001 and 50,000 inhabitants; between 50,001 and 100,000 inhabitants; more than 100,000 inhabitants and the city of Barcelona.
- Degree of urbanization. Classification of the Catalan territory into three categories defined on the basis of each municipality’s population density and its contiguity with other settlements, following the method established by the sociologist Sergio Porcel, already applied to the analysis of the surveys of young people in Catalonia in 2012 and 2017 [14,63]. The categories were as follows: densely populated area (bounded by a contiguous set of municipalities, each with a density > 500 inhabitants per km2, and an overall combined population > 50,000 inhabitants); semiurban or intermediate area (contiguous set of municipalities that do not belong to a densely populated area, in which each municipality has a density > 100 inhabitants per km2 and the overall combined population > 50,000 inhabitants or is adjacent to a densely populated area) and barely populated area (a set of municipalities that do not form part of either a densely populated area or an intermediate area and are therefore markedly rural in nature).
- Intensity of residential segregation. Classification of Catalonia’s census tracts with a focus on four variables closely linked to income: percentage of foreign population; percentage of population in a situation of unemployment; mean surface area of residence and cadastral value of residence. This analysis led to a division of the census tracts into three categories related to income: those with extreme downward urban segregation (vulnerable neighbourhoods, 484 census tracts); those with extreme upward urban segregation (well-off neighbourhoods: 586 census tracts) and those with no extreme segregation (intermediate neighbourhoods, 4359 census tracts). This classification was established in the research Barrios y crisis, corresponding to 2012 [64].
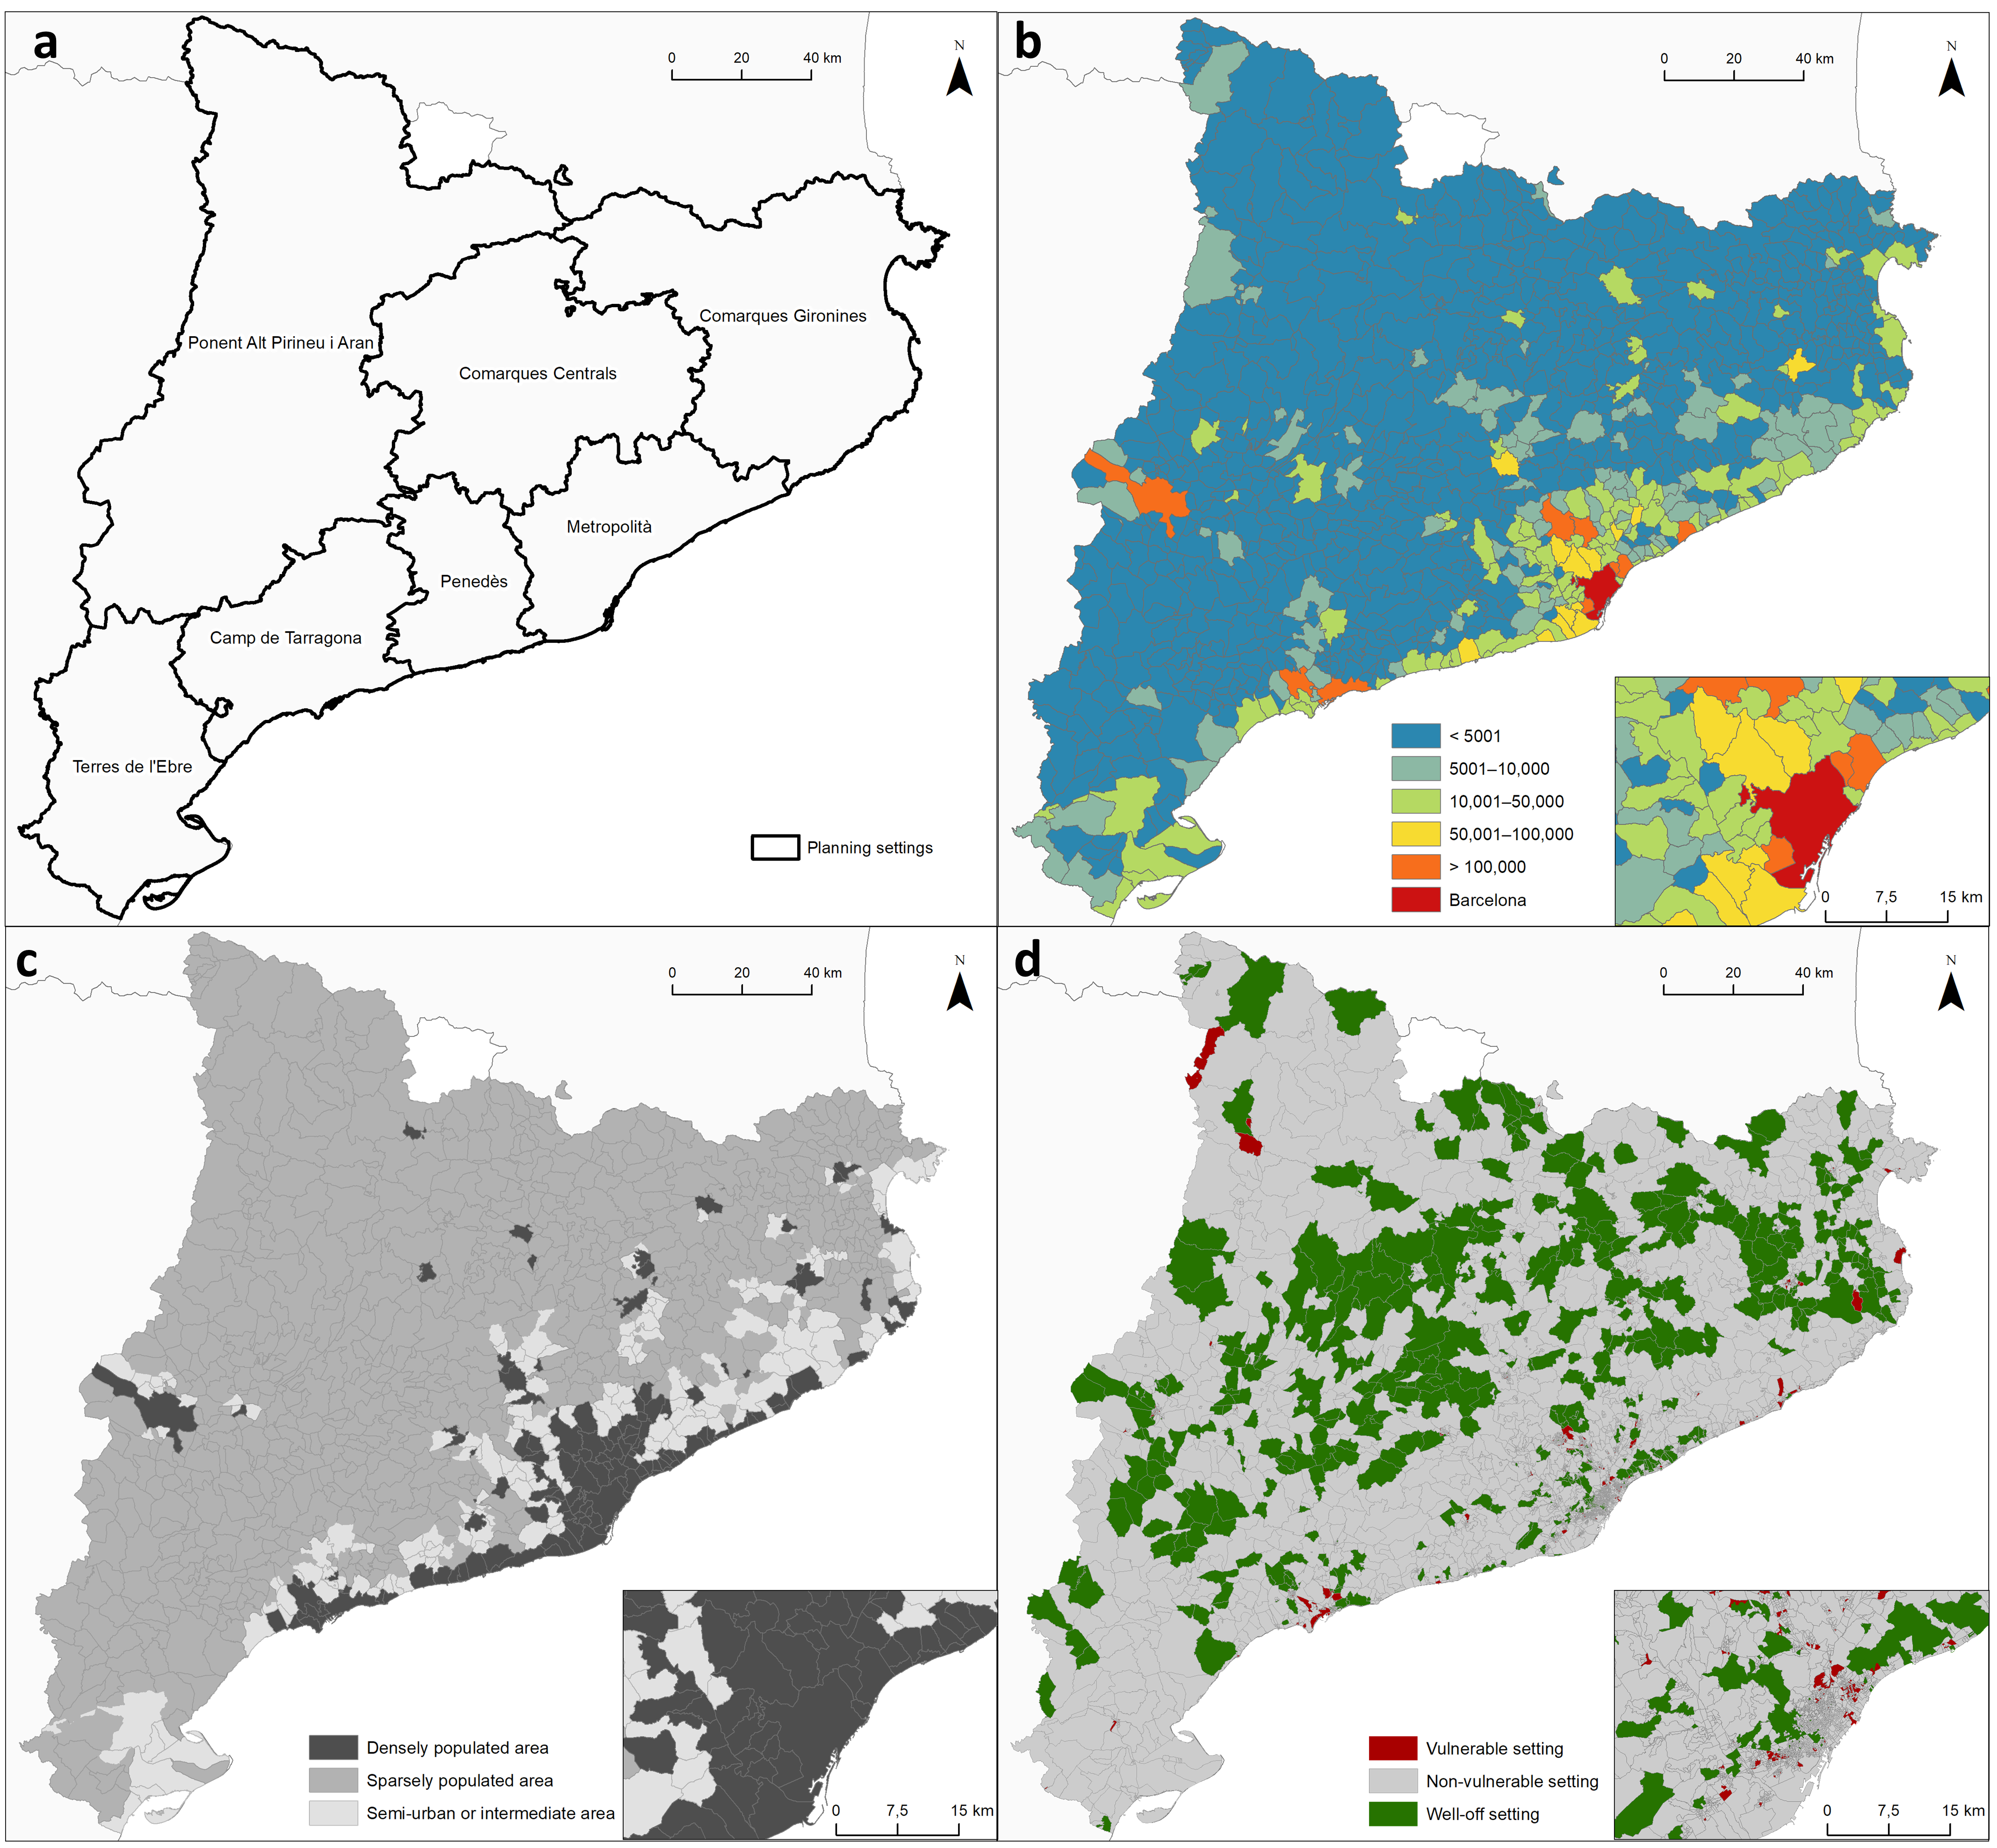
These territorial aggregations allow us to classify the population of Catalonia in accordance with the settings and population numbers shown in Table 1 and Figure 1. It should be pointed out that in all the aggregations, the resulting settings present a considerable volume of population (the least populated, Terres de l’Ebre, has 191,631 inhabitants), guaranteeing a suitable level of statistical representativity.
3. Results
The results obtained from the analysis of the five variables confirm (albeit with some variations) the initial hypothesis. They show that, from the territorial point of view, the most striking social cleavages or inequalities correspond less to the geographical setting of reference, the population size or intensity of urbanization and more to residential segregation. Let us examine these results in detail.
3.1. Level of Studies Attained
Spatial factors are a crucial element in the debate about the social potentialities of the educational system. More particularly, access to higher education has traditionally been considerably more onerous and difficult for the population resident in areas far removed from major urban centres, where the main educational facilities and universities tend to be established [65]. Furthermore, some recent studies in Catalonia and other contexts have shown that training opportunities are heavily determined by the prevailing socioeconomic level of the residence area [66,67,68]. This circumstance is reflected by the phenomenon of scholastic migration (enrolment outside the neighbourhood or municipality of residence), which is widespread in Catalonia [69,70]. Accordingly, any study of spatial inequalities demands a close examination of the main differences to be found in the field of education.
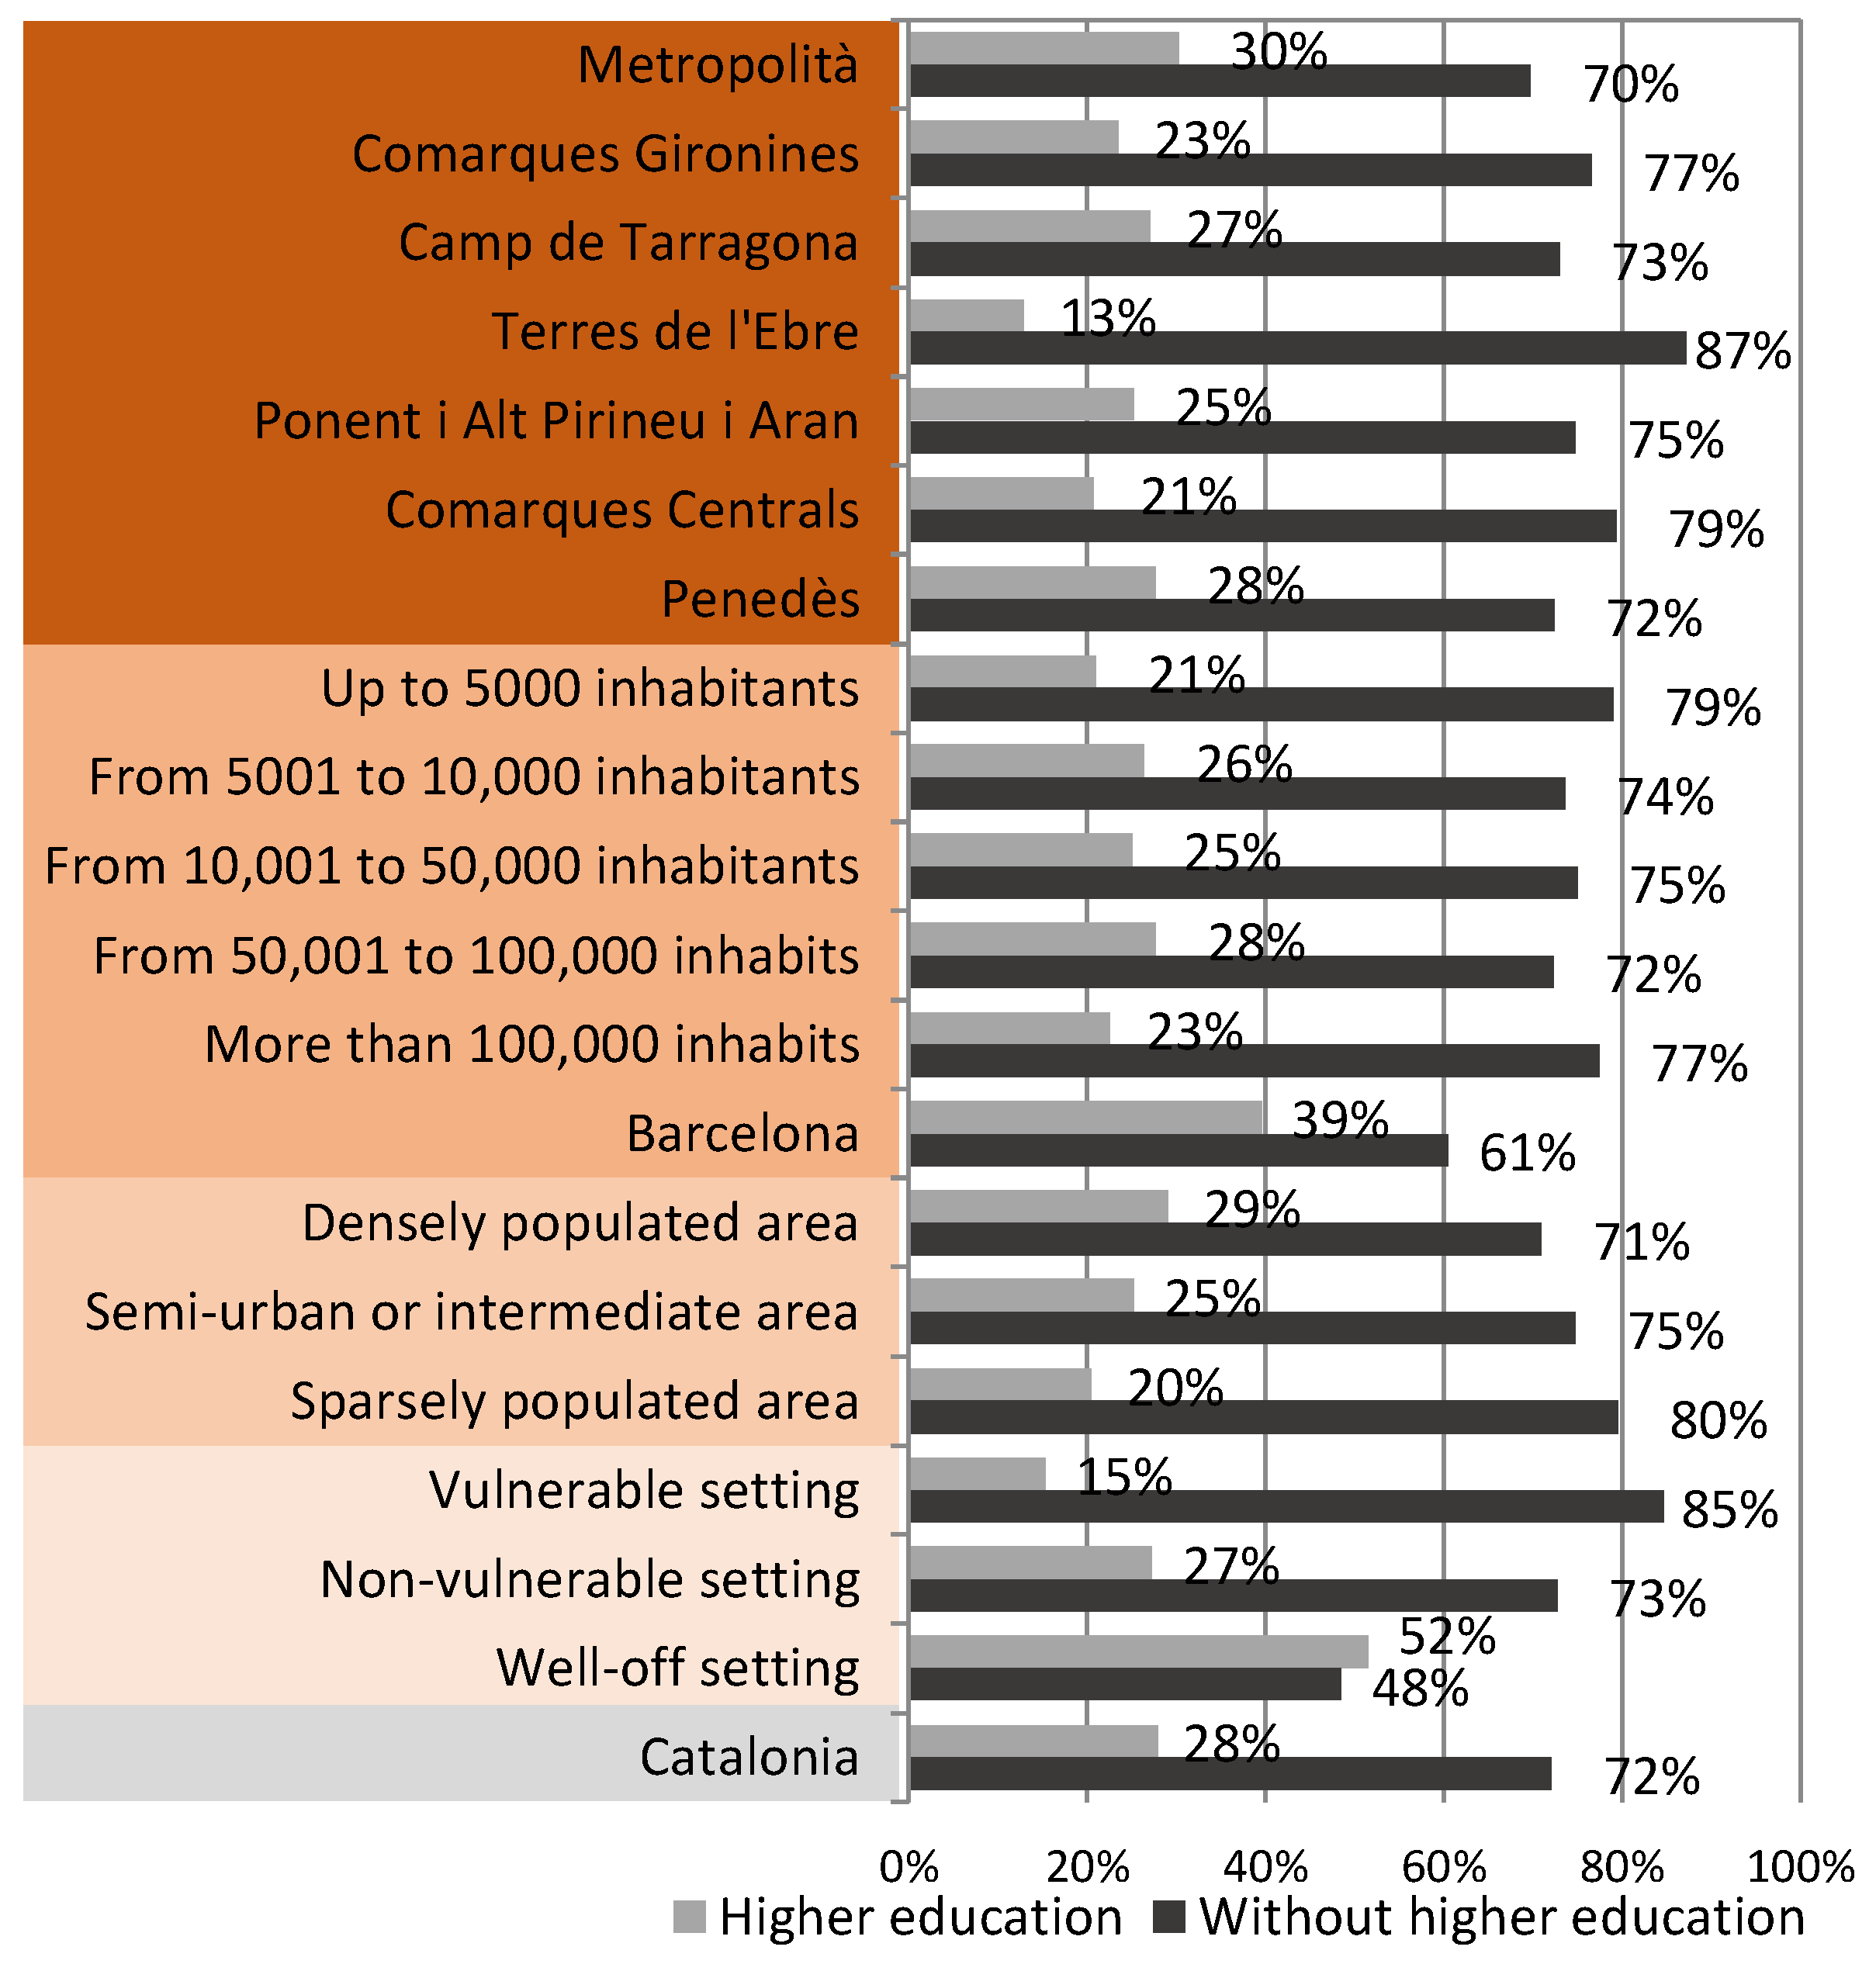
Figure 2 shows the data related to the level of higher education attained by the Catalan population aged 25 and over, grouped in accordance with the four territorial categories used herein (geographical setting, population size, intensity of urbanization and vulnerability). As we can see, the mean of the Catalan population with higher education is 28%. It is immediately apparent, however, that there are significant differences between the various territorial areas, and a comparison between the main geographical settings reveals that the percentage of the population with higher education is greater in the more urbanized areas: the Metropolitan Region of Barcelona, in first place, closely followed by Penedès and the Camp de Tarragona. In contrast, Comarques Centrals and Terres de l’Ebre present much lower values—in fact, the percentage of the population with higher education resident in the Metropolitan Region of Barcelona is twice that of Terres de l’Ebre. It must be taken into account, however, that educational itineraries depend not only on family income and the educational facilities on offer in each territory but also on other factors, such as the economic dynamism, the relative weight of the economic sectors and the qualification requirements of the labour market, as well as sociocultural factors derived from the characteristics of places of residence [14]. The fact that the area of Ponent and Alt Pirineu-Aran has double the percentage of population with higher education than Terres de l’Ebre, even though both are far from the metropolitan area of Barcelona, confirms the difficulty inherent in any automatic co-opting of geographical proximity to major urban centres as the primary explanatory factor in this field.
An examination of the data related to the level of studies attained by the population according to the size of the place of residence leads to similar conclusions. Firstly, there is a strong contrast between the city of Barcelona, where 4 out of every 10 adult residents have a higher education, and places with less than 5001 inhabitants, which have barely half that proportion. This difference can probably be explained by the broad range of education available in the capital, along with a labour market with jobs requiring a high level of qualification and the subsequent displacement of people with a higher education to Barcelona, attracted by the specialist work on offer. Close examination of the data reveals, however, that the population size of the municipality of residence is not directly related to the level of studies. Thus, the percentage of the population with a higher education in places with 5001 to 100,000 inhabitants exceeds, in every case, that of residents in cities with more than 100,000, with the exception of Barcelona. The fact that places with less than 5001 inhabitants and more than 100,000 share the bottom ranking in higher education shows that the size of the place of residence has a limited explanatory capacity in this respect.
Something similar occurs with the intensity of urbanization, or what has come to be known as the urban/rural divide. It has traditionally been understood that rurality is one of the main obstacles for access to education in general, and higher education in particular. The data demonstrate, however, that in the Catalan case, the differences in the classification of places according to the urban/rural divide are smaller than in any of the other aggregations used. Although it is true that the population residing in sparsely populated areas is less likely to attain a higher education than that residing in densely populated areas, the difference is far from overwhelming.
In contrast, the differences associated with residential segregation seem more conclusive. While one out of every two adults residing in well-off areas has attained a higher education, among residents in vulnerable areas, this proportion is barely more than one in every seven. This was the greatest difference found in all the classifications examined, markedly greater than any differences derived from the geographical areas, the population size or the degree of urbanization. Residential segregation therefore seems to be the dimension that is most clearly related with the attainment or otherwise of a higher education—and the dimension that most determines and best reflects that attainment.
3.2. Social Structure
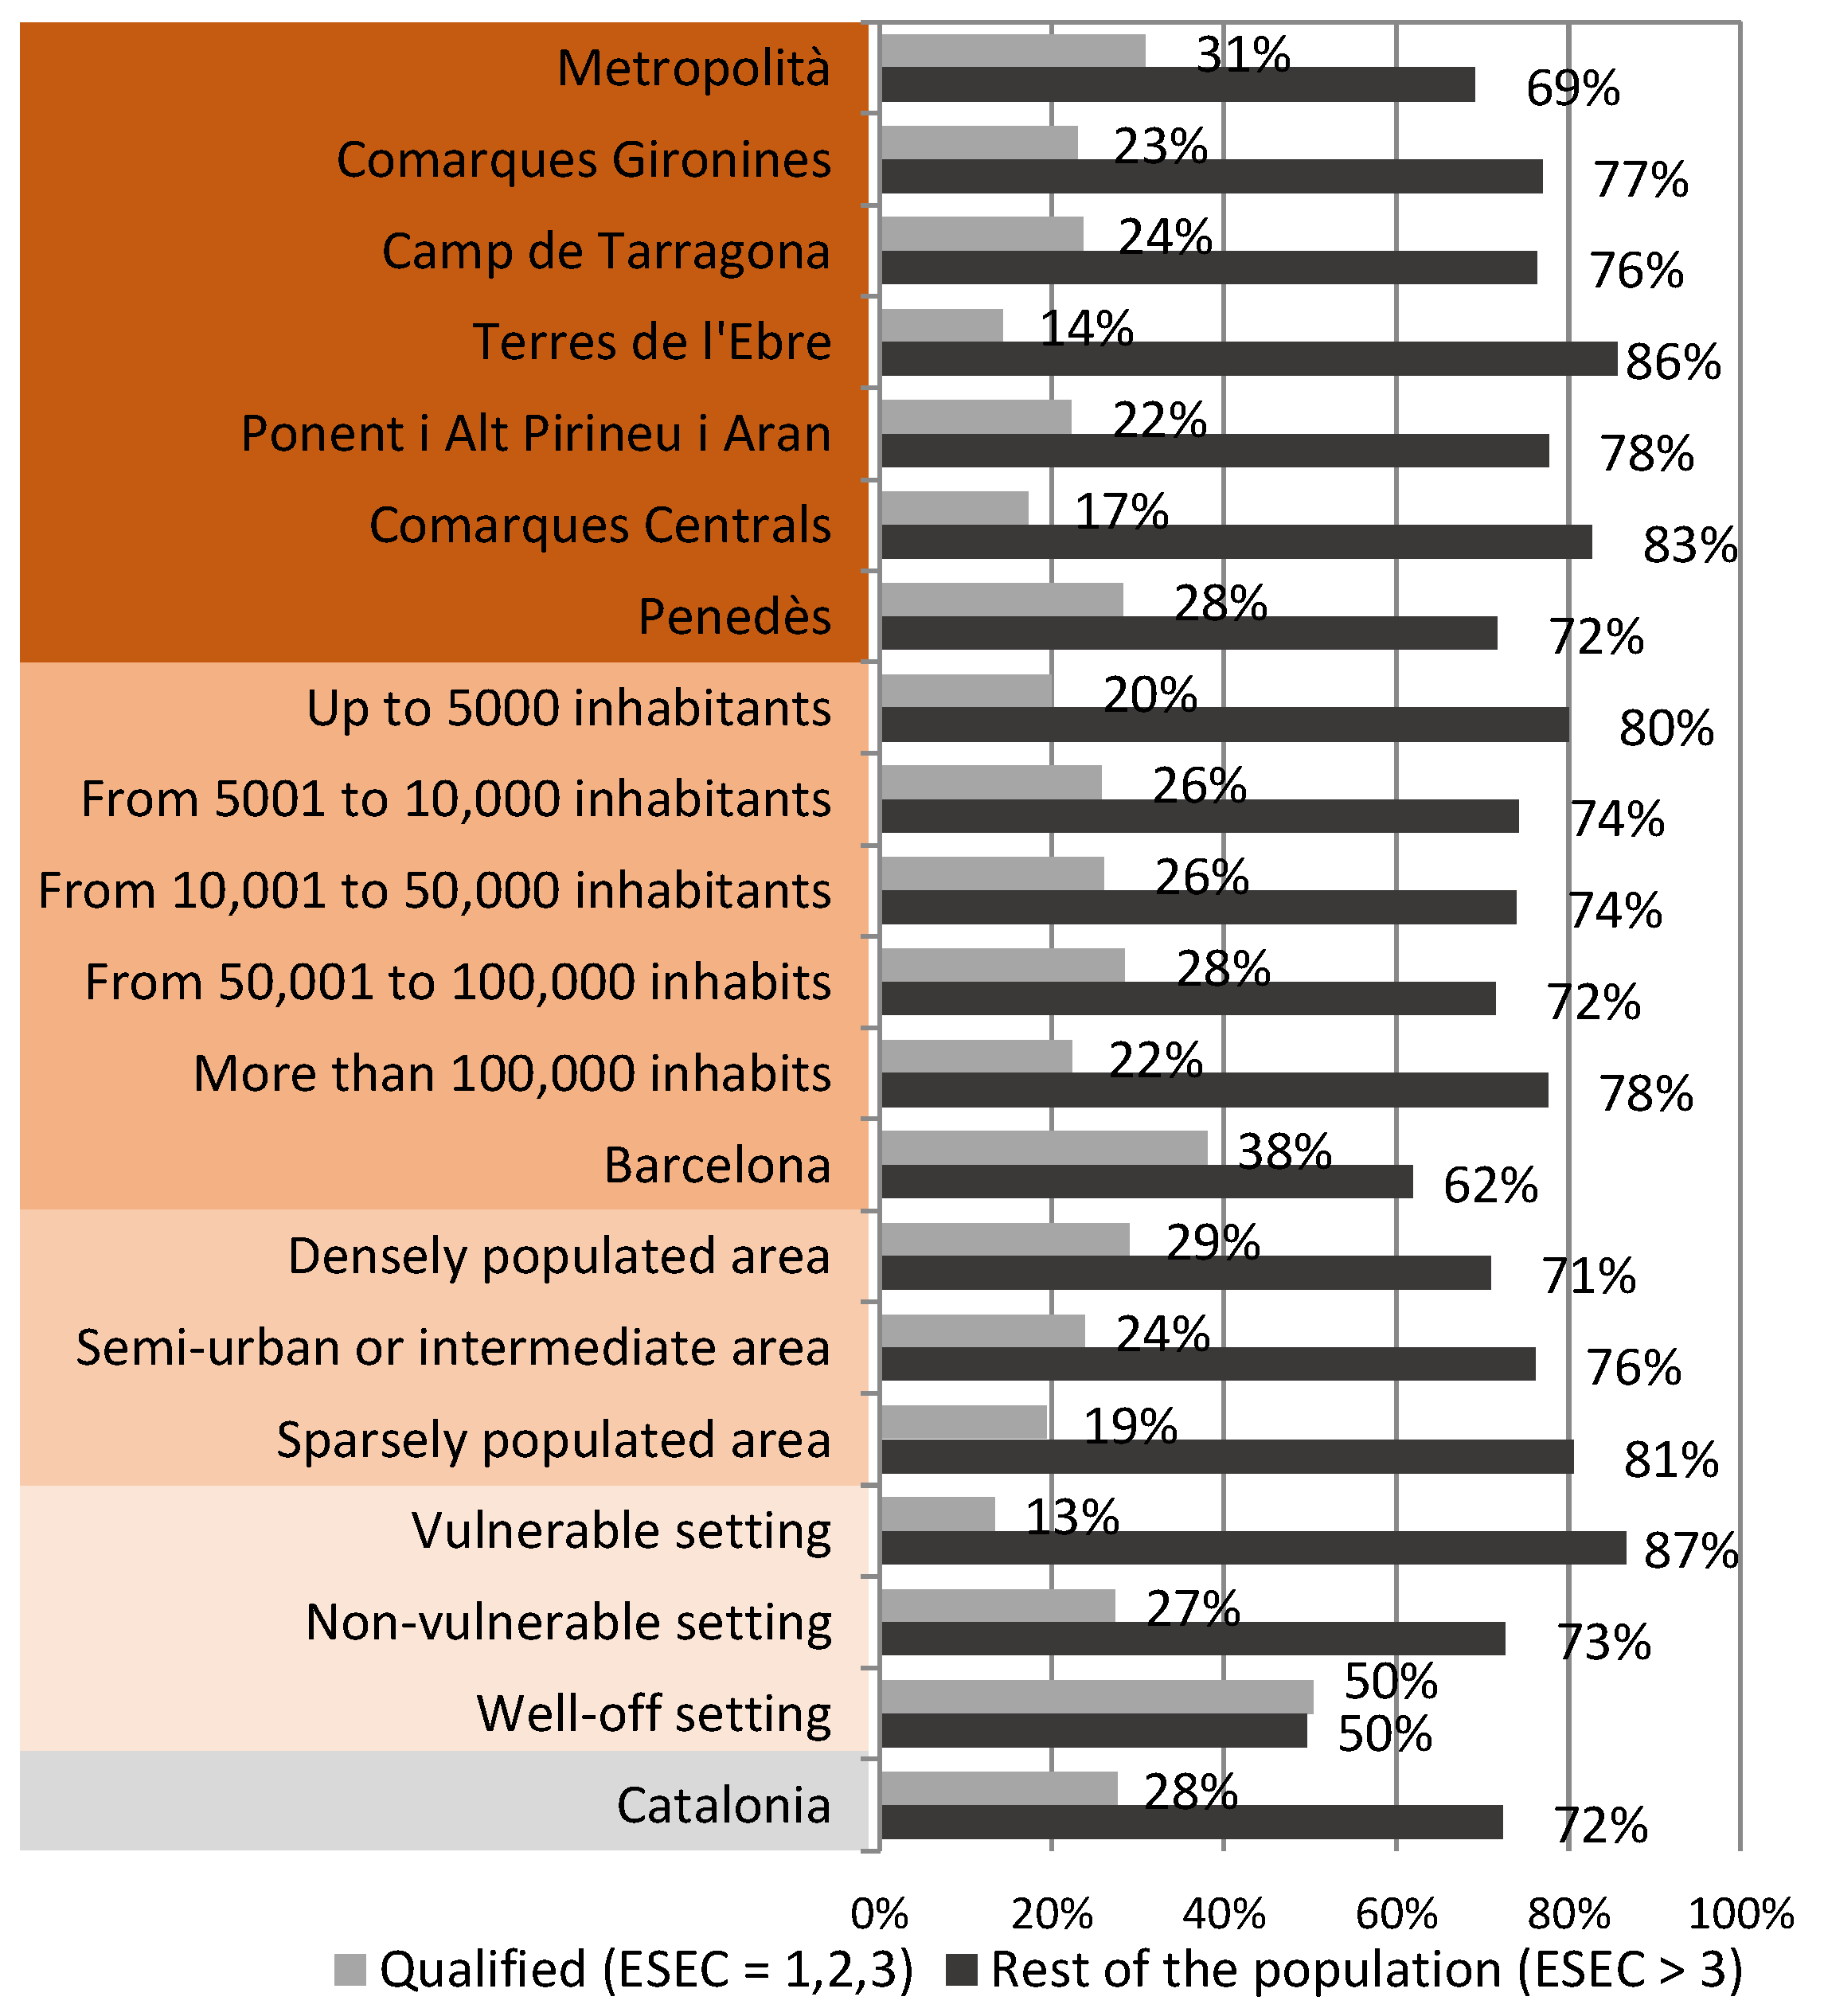
As explained above, the structure of Catalan society has undergone decisive transformations in recent decades [57,58]. An examination of the distribution of social groups in the Catalan setting reveals data that complement the findings above, although the data used here to observe this distribution are inevitably more limited in scope. As explained in the Methodology section, we used the European Socio-Economic Classification, constructed on the basis of occupational categories, to differentiate between two groups: the population with jobs requiring qualifications (ESEC = 1, 2 and 3) and the rest of the population (ESEC > 3).
The data show in Figure 3 that the more qualified job categories cover slightly more than a quarter of the working population of Catalonia (27.7%, to be precise). Unsurprisingly, their territorial distribution follows a pattern similar to that of the level of higher education: the geographical area that presents the highest proportion of higher-level employment categories is the Metropolitan Region of Barcelona - obviously heavily affected by the presence of the capital city - where they have double the weight that they have in Terres de l’Ebre and Comarques Centrals. The inequalities associated with population size and the intensity of urbanization are almost identical to the values observed in the previous variable.
Once again, it is the spatial aggregation corresponding to residential segregation that presents the most striking inequalities, even more than in the case of the distribution of higher education. Whereas five out of every ten working people that live in well-off areas belong to higher qualified employment categories, in vulnerable areas, this proportion is just over 1 out of every 10.
3.3. Risk of Poverty
One of the most notable effects of the financial crisis that began in 2007—and the policies that have accompanied it—has been the increase in the population at risk of poverty, or already in a situation of poverty [71,72,73]. The current health and social crisis triggered by the COVID-19 pandemic will probably worsen this situation, both globally and locally [11].
The data presented below (Figure 4) indicate the percentage of the Catalan population living in consumption units with earnings below the threshold of 60% of the mean income in Catalonia (before social transfers, apart from pensions and subsistence payments). The data have the disadvantage of being calculated on the basis of thresholds homogenized for the whole of Catalonia, even though incomes and costs of living are relatively different in the various parts of the region. In this sense, the areas that tend to have higher average incomes due to their position in the urban system of Catalonia show apparently better results compared to the whole, although the costs of living there are comparatively higher. In contrast, the territories with low mean incomes occupy the bottom positions with respect to these parameters, even though their situation is alleviated by lower living costs. In any case, this variable also offers an interesting approach to spatial differences.
The principal finding is that, according to the data of the ECVHP 2011, the poverty rate was 21.9% in the population of Catalonia—or, in other words, one out of every five citizens found themselves in a situation of poverty. Any comparison between territorial settings must be approached, however, with the aforementioned caveat that the mean levels of income and costs of living are far from homogeneous. As we can see in Figure 4, Terres de l’Ebre is, once again, the setting with the highest poverty rate, with almost 35% of its population affected. It is followed by Camp de Tarragona, Comarques Gironines and Penedès, all at around 25%. The areas with the lowest poverty rates are Ponent and Alt Pirineu-Aran and Comarques Centrals, while that of the Metropolitan Region of Barcelona lies around the mean for Catalonia.
The data linking the poverty rate to population size and intensity of urbanization are relatively less affected by the biases associated with the assessment of a single threshold for the whole of Catalonia—and they are, therefore, ultimately more interesting. In terms of population size, the city of Barcelona presents the lowest poverty rate, but, leaving aside the case of the capital, it can be seen that poverty is not directly or unequivocally related to population size. The same is true in terms of data referring to the intensity of urbanization. The territories with the highest percentage of poverty are those with an intermediate degree of urbanization and the differences between areas with high and low intensities of urbanization are not excessively marked.
The absence of any clear relationship between these spatial variables and situations of poverty contrasts strikingly with the results of an analysis of spatial aggregation on the basis of the level of residential segregation. It is abundantly clear that the population living in vulnerable settings is over two times more likely to find itself in a situation of poverty than that of well-off settings: in the former, one in every three people find themselves in that situation, while in the latter this proportion is barely one in seven. It must be borne in mind, however, that in this case the results may be tautological to a certain extent, since the variables used to construct the classification of the census tracts into vulnerable, well-off and intermediate settings (i.e., percentage of population unemployed, percentage of foreign population, cadastral value and mean surface area of residence) are closely related to income.
3.4. Self-Perceived Health
Having analyzed the indicators related to life opportunities, employment and poverty, we can go on to examine the issue of spatial inequalities via another variable directly related to living conditions: the state of health. Experts in public health have reliably explained how personal inequalities in health are systematic and produced—and reproduced—socially and spatially [74,75,76,77]. Once again, the present circumstances associated with the COVID-19 pandemic seem to clearly confirm the relationship between the health status of the population and social cleavages [12,78]. Accordingly, health is not a vector that only affects individuals through particular genetic factors but is in fact closely linked to their living conditions—and these, in their turn, largely depend on social and spatial factors such as working conditions, mobility, housing and environment.
What needs to be unpicked here is whether or not these factors are more decisive when they are analyzed in terms of geographical areas, population size, intensity of urbanization, or residential segregation. Territorial differences in health are usually discussed on the basis of mortality rates and life expectancy, with a view to establishing these factors’ relationships with socio-economic and work-related circumstances, as well as material deprivations. We follow a less well-trod path herein by examining the self-perceived health of individuals aged 16 years and over—an indicator that covers subjective experience of not only illness but also sensations like exhaustion [79]. In particular, as mentioned above, we have used the ECVHP data on self-perceived health to establish two categories: one of people who declare their state of health to be very good or good and the rest of the population (i.e., people who, according to their own subjective perception, have a state of health that is middling, bad or very bad).
In this case, the data in Figure 5 show biases that can be partly attributed not so much to spatial factors but more to the age structure of the population resident in each area. Thus, territories that have, on average, a more elderly population than that of Catalonia as a whole—as in the case of Ponent and Alt Pirineu-Aran and Terres de l’Ebre, as well as towns with under 5000 inhabitants and sparsely populated areas—present a poorer state of self-perceived health than the rest. Beyond these extremes, however, the differences between settings—whether classified by geographical area, population size or intensity of urbanization—are not very significant. Neither are the differences between the vulnerable and the well-off settings particularly marked, although the latter, as expected, present a notably better state of self-perceived health.
3.5. Life Satisfaction
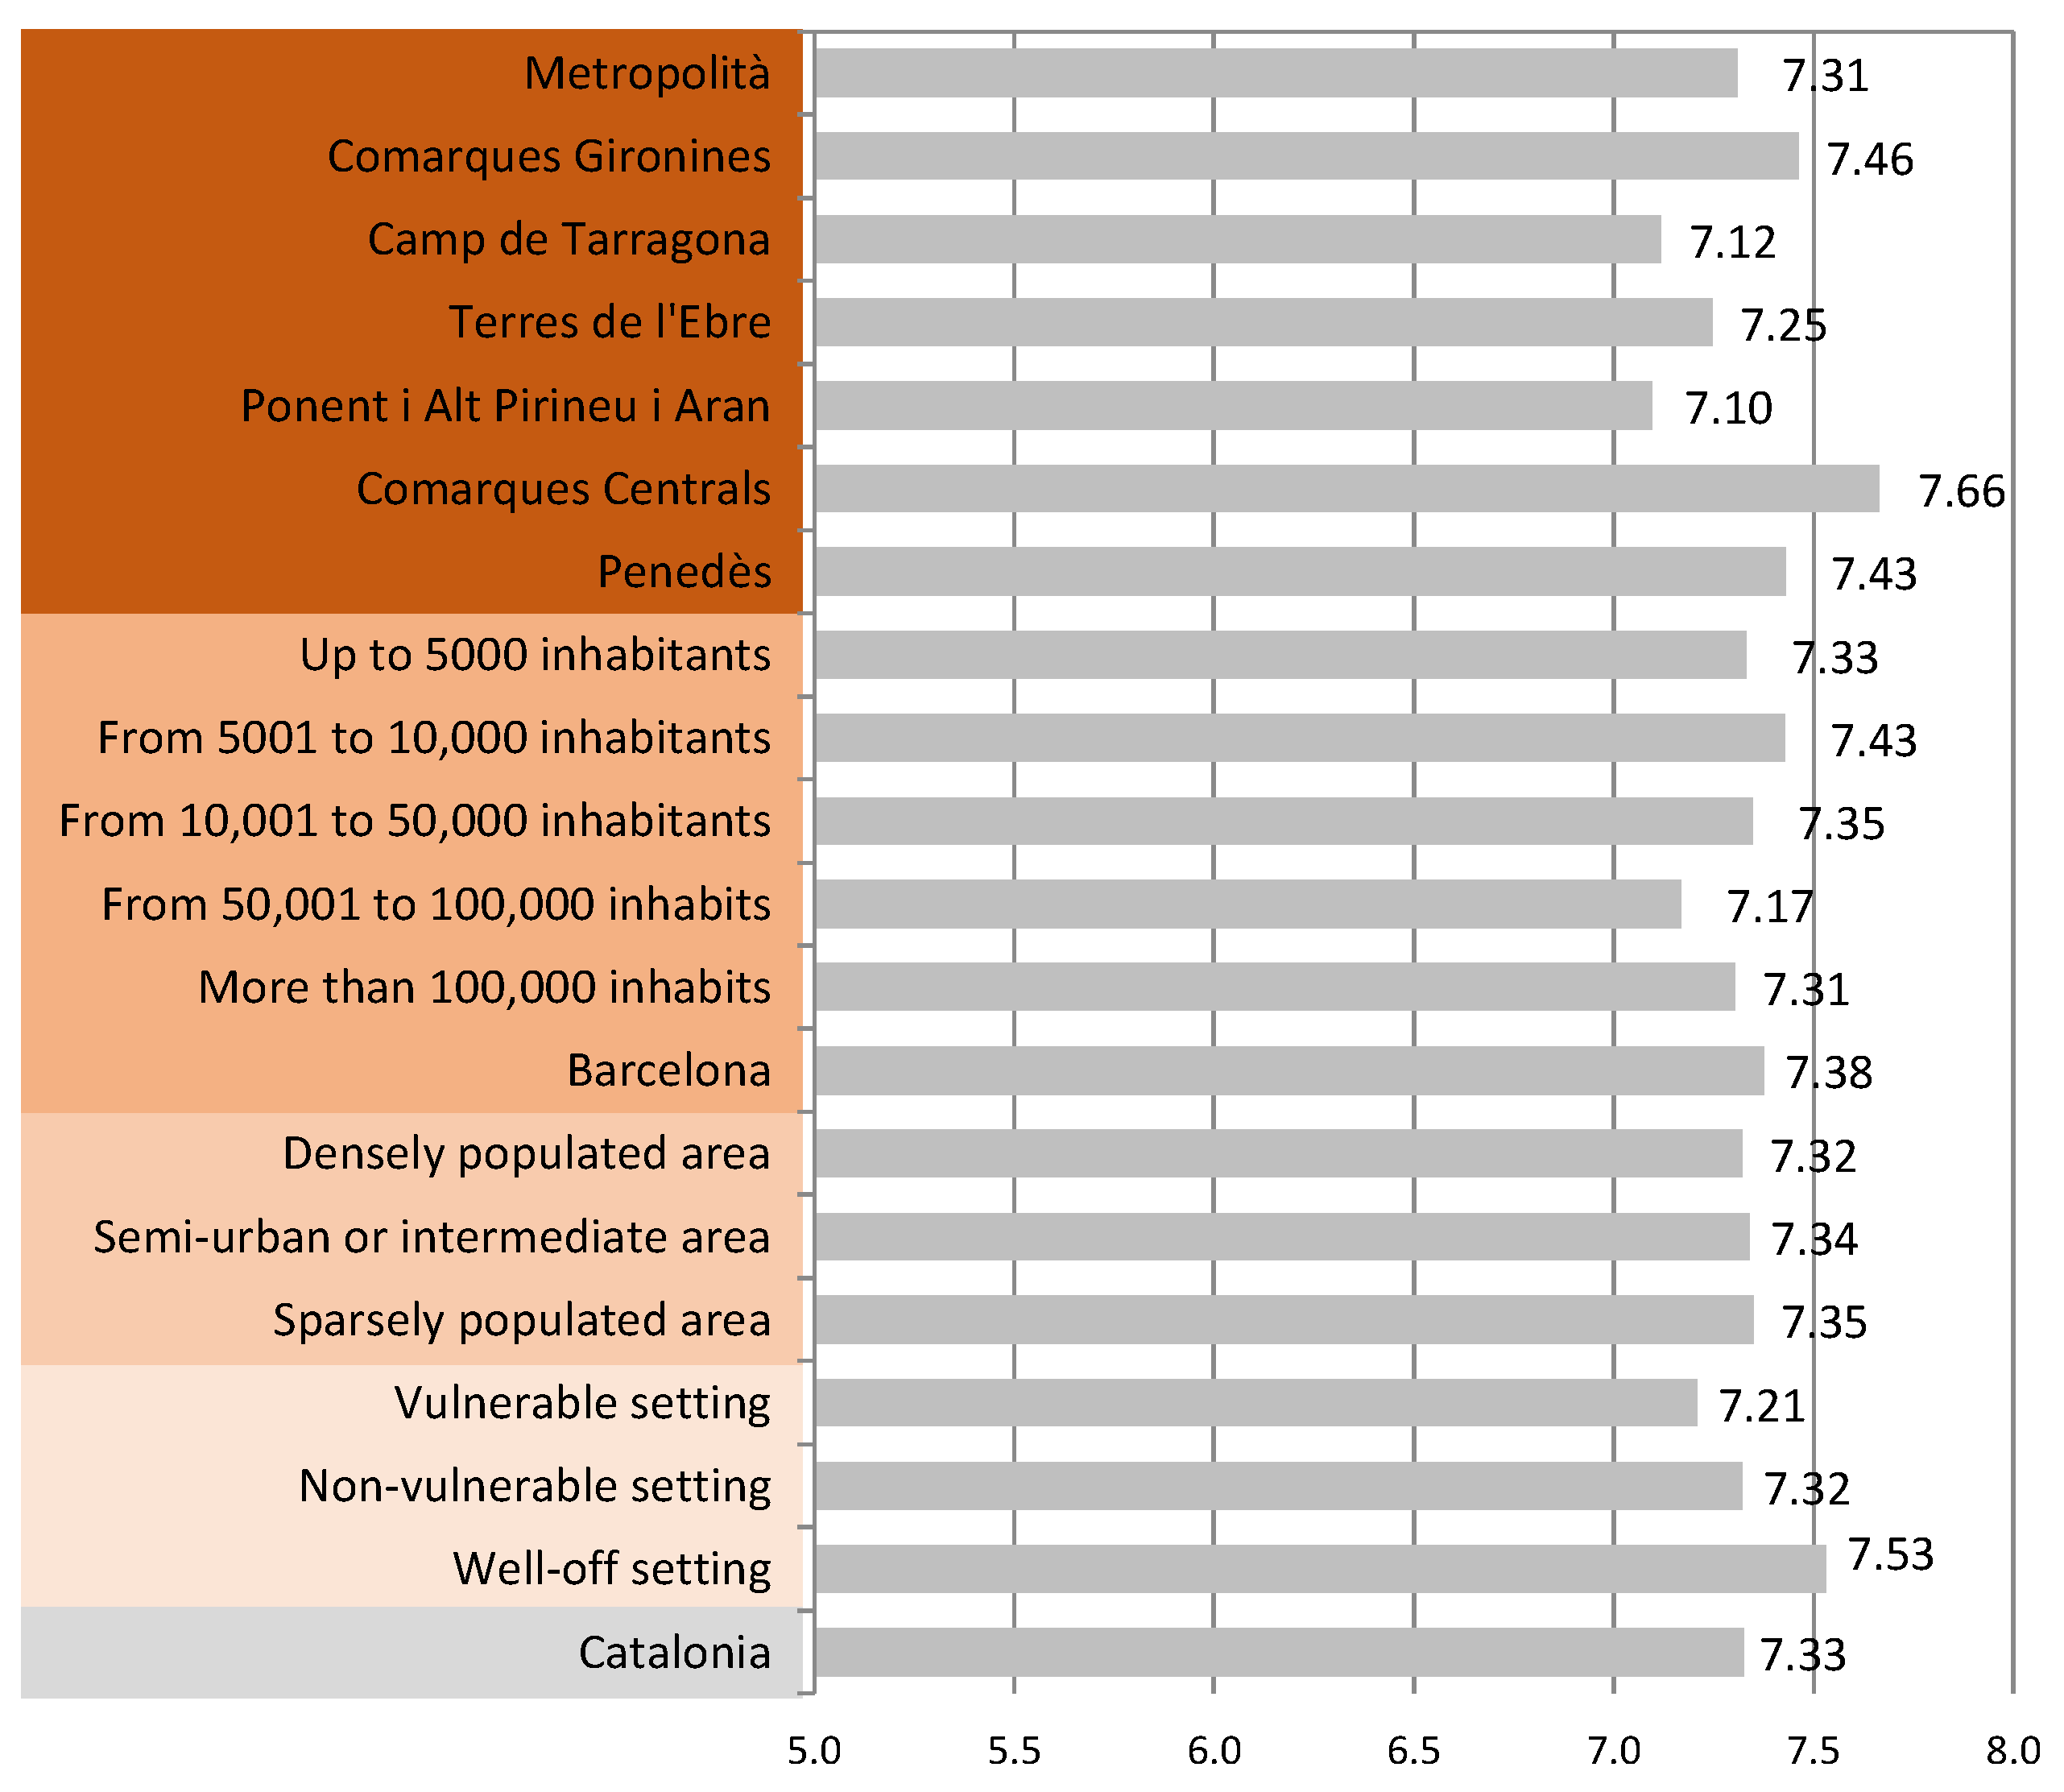
The last variable that we studied was subjective life satisfaction. As mentioned above, the data from the ECVHP reflect the subjective perception of life satisfaction in individuals aged 16 and over, using a scale of degree of satisfaction from 0 to 10, with 0 corresponding to the lowest level of satisfaction and 10 to the highest.
The mean life satisfaction of the Catalan population is fairly high, at around 7.33 (see Figure 6). In this case, the differences with respect to the urban/rural divide are almost irrelevant, as they barely stray from the mean. In contrast, the differences in the classification by population size are more significant, although, even here, there is no clear pattern that makes it possible to relate the two variables. Similarly, although the differences between large geographical settings are relatively more substantial, no logical order can be deduced from them. Once again, the difference that is surely most significant and explanatory is that between the life satisfaction of residents of well-off settings and those of vulnerable settings. In fact, if we leave aside the contrasts between some of the geographical settings, this difference is the most marked of all, and the one that affects most people.
4. Synthesis and Conclusions
Our study seeks to contribute to our knowledge of the relationship between spatial variables and a population’s living conditions. Using the specific example of Catalonia, we have analysed the relationship between, on the one hand, the population’s place of residence and, on the other, a set of social indicators (level of education, socioeconomic position, the risk of poverty, self-perceived health and life satisfaction). To do this, Catalan localities were grouped into four different territorial aggregations that corresponded to geographical settings, population size, intensity of urbanization and residential segregation. The objective was to determine which of these aforementioned spatial factors is most relevant to an explanation of the differences in people’s life courses and living conditions, and, therefore, the social cohesion of the country.
The data presented suffer from limitations of spatial and sampling representation that make deeper statistical analysis difficult. In our opinion, however, they show the interest and need to continue exploring the relationship between social inequality and territory, both in Catalonia and in all the countries of the European Union. Other data sources that allow a more in-depth and comparative statistical analysis will be necessary for this.
The results obtained are summarized in Table 2 and in the maps included in the Supplementary Materials. For the purposes of comparison, we have set the values of each of the variables analysed as index numbers (Catalonia = 100) and calculated the mean deviations of the observations. This makes it possible to contrast the deviations obtained in each of the territorial treatments of the data, so that the higher the deviation, the more discriminating the proposed spatial aggregation with respect to social inequalities. As can be seen, the results proved quite illustrative and they enable us to confirm, to a large extent, the initial hypothesis of substantial territorial fractures and differences in Catalonia. However, rather than being related to the variables around which the debate on this issue have traditionally revolved—geographical location, population size and the intensity of urbanization—these differences are linked, above all else, to individuals’ and social groups’ spatial segregation according to their income.
Thus, in three of the five variables studied—level of studies, socioeconomic position and risk of poverty—the greatest differences are clearly seen in those categories associated with residential segregation. In the other two variables—self-perceived health and life satisfaction—there was greater dispersion related to the geographical settings and other factors such as the mean age of the population. It is significant that the more structural variables seem to be more closely linked to residential segregation, while the differences associated with population size and the traditional urban/rural divide are, generally speaking, less relevant.
If we add the mean deviations associated with each of the spatial aggregations to achieve a synthesis value, we can see how the highest value is the one derived from the territorial grouping based on residential segregation—so much so that the mean of the mean deviations resulting from the analysis of segregation is practically double the means associated with the analysis via geographical settings, population size or degree of urbanization.
The enhanced capacity of residential segregation to explain spatial inequalities is also reflected in the interrelationship between the various variables in each of the territorial aggregations. Thus, the ordering of the variables in the three categories associated with residential segregation always follows the same ordinal precedence, so vulnerable areas are always in the worst position with respect to each of the variables. However, in the other territorial aggregations—geographical areas, population sizes and intensity of urbanization—the behaviour of the variables is more erratic, and their mutual coherence is lower. Spearman’s correlation analysis fully confirms this reading, as can be seen in Table S2 included in the Supplementary Materials.
We can conclude, therefore, with the following premises that largely confirm our initial hypothesis:
- (1)
- In Catalonia, there are notable inequalities in the average living conditions of people residing in various parts of the territory. These inequalities can be confirmed by examination of variables such as level of education, socioeconomic position, risk of poverty, health condition and life satisfaction.
- (2)
- The data available seem to ratify the statement repeatedly found in the literature, according to which the place of residence has a two-pronged effect on the opportunities and living conditions of the population: on the one hand, social differences influence the capacity of individuals, families and social groups to settle and use different territories; on the other hand, the population’s distribution over the space helps to consolidate and reproduce social differences.
- (3)
- The variables that present the most marked spatial differences are, in the following order: the socioeconomic position of the working population, the level of studies attained and the risk of poverty.
- (4)
- The analysis of social variables by grouping localities according to their size and intensity of urbanization (reflecting what is traditionally known as the urban/rural divide) has very little discriminatory and explanatory capacity. This finding has important implications, as the size of localities and rurality have traditionally been used as reference points for the analysis and discussion of spatial inequalities, and they underlie both common perceptions and territorial debates, both in Catalonia and beyond.
- (5)
- The grouping of localities according to large geographical areas proves to be somewhat more significant. However, the differences between these settings are particularly relevant with respect to variables with a subjective component (such as self-perceived health and life satisfaction) and, furthermore, they are difficult to reduce to simplistic opposites such as coast/interior, mountain/plain or metropolitan/non-metropolitan.
- (6)
- In any case, the most striking spatial inequalities are those associated with residential segregation. Thus, the most important territorial fractures in key variables such as the level of studies or socioeconomic position are to be found between the well-off and vulnerable settings.
These results contain relevant policy implications. In particular, they suggest that to reduce spatial inequalities today, improving living conditions in the most vulnerable neighbourhoods and urban areas must be a priority. Obviously, the characteristics of the case under study cannot necessarily be extrapolated to other regions of Spain and Europe. However, the results obtained clearly show the need to consider residential segregation and its effects as key factors in academic and political debates about spatial cleavages.
Supplementary Materials
The following are available online at https://0-www-mdpi-com.brum.beds.ac.uk/article/10.3390/urbansci5020045/s1, Table S1: Distribution of the sample according to territorial aggregations, Table S2: Spearman’s correlation according to territorial aggregations, Figure S1: Percentage of population (aged 25 or over) without higher education according to Territorial settings, Catalonia, Figure S2: Percentage of population (aged 16 and over) with self-perceived health no good according to Territorial settings, Catalonia, Figure S3: Overall life satisfaction of people (aged 16 and over) according to Territorial settings, Catalonia, Figure S4: Percentage of population risk of poverty (60% median) according to Territorial settings, Catalonia, Figure S5: Percentage of population (aged 16 and over) social structure no qualified (ESEC > 3) according to Territorial settings, Catalonia.
Author Contributions
Both authors contributed to the design and conception of the article. J.C. processed the data and created the graphics. O.N. wrote the conceptual section. Both authors contributed to the composition of the rest of the text. Both authors have read and agreed to the published version of the manuscript.
Funding
The original research on which this article is based has been possible thanks to the support of the Institut d’Estudis Catalans and its Section of Philosophy and Social Sciences. The preparation and publication of this article has received financial support from the Ministerio de Ciencia e Innovación «Proyectos de i+d+i» Retos de la sociedad, convocatoria 2019. Referencia PID2019-108120RB-C32.
Institutional Review Board Statement
Not applicable.
Informed Consent Statement
Not applicable.
Data Availability Statement
All information about the source of the data, as well as requesting the microdata can be found https://iermb.uab.cat/es/encuestas/cohesion-social-urbana/#2f756a49-ae6c-6, accessed on 26 May 2021.
Acknowledgments
The data from the Survey of Living Conditions and Habits of the Population (ECVHP) have been specifically used for this research, for which the authors would like to express their gratitude to the IERMB, its director and its research team.
Conflicts of Interest
The authors declare no conflict of interest.
References
- Piketty, T. Le Capital au XXIe Siècle; Éditions du Seuil: Paris, France, 2013; ISBN 9782021082289. [Google Scholar]
- Stiglitz, J.E. The Price of Inequality: How Today’s Divided Society Endangers Our Future; W. W. Norton & Company: London, UK, 2012. [Google Scholar]
- Sommeiller, E.; Price, M. The Increasingly Unequal States of America: Income Inequality by State, 1917 to 2011; Economic Policy Institute: Washington, DC, USA, 2015. [Google Scholar]
- Milanovic, B. Global Inequality: A New Approach for the Age of Globalization; Harvard University Press: Cambridge, MA, USA, 2016; ISBN 9780674984035. [Google Scholar]
- Atkinson, T. What can be done about inequality? Juncture 2015, 22, 32–41. [Google Scholar] [CrossRef]
- OECD Estudios económicos de la OCDE. España. 2018. Available online: https://www.oecd.org/economy/surveys/Spain-2018-OECD-economic-survey-vision-general.pdf (accessed on 13 December 2020).
- Judt, T. Ill Fares the Land: A Treatise on our Present Discontents; Penguin Books: New York, NY, USA, 2011; ISBN 0718191412. [Google Scholar]
- Urry, J. Offshoring; Polity Press: Cambridge, UK, 2014; ISBN 9780745664866. [Google Scholar]
- Fontana, J. El futuro es un país extraño: Una reflexión sobre la crisis social de comienzos del siglo XXI; Ediciones de Pasado y Presente: Barcelona, Spain, 2013; ISBN 9788493986353. [Google Scholar]
- Streeck, W. How will Capitalism End?: Essays on a Failing System; Verso: London, UK, 2016; ISBN 9781784784010. [Google Scholar]
- Sumner, A.; Hoy, C.; Ortiz-Juarez, E. Estimates of the Impact of COVID-19 on Global Poverty; United Nations University World Institute for Development Economics Research: Helsinki, Finland, 2020. [Google Scholar]
- Ahmed, F.; Ahmed, N.; Pissarides, C.; Stiglitz, J. Why inequality could spread COVID-19. Lancet Public Health 2020, 5. [Google Scholar] [CrossRef]
- Guilluy, C. La France périphérique: Comment on a sacrifié les Classes Populaires; Flammarion: Paris, France, 2014; ISBN 9782081312579. [Google Scholar]
- Nel·lo, O.; Gomà, A. Territori. Diversitat espacial en els hàbits i condicions de vida juvenils: El paper clau de la segregació residencial. In Enquesta de Joventut de Catalunya 2017 Volum 2. Experiències Juvenils i Desigualtats Socials; Serrecant, P., Ed.; Generalitat de Catalunya. Departament de Treball, Afers Socials i Families: Barcelona, Spain, 2018; pp. 441–534. [Google Scholar]
- Rodríguez-Pose, A. The revenge of the places that don’t matter (and what to do about it). Camb. J. Reg. Econ. Soc. 2017, 11, 189–209. [Google Scholar] [CrossRef]
- Traverso, E. The New Faces of Fascism: Populism and the Far Right; Verso Books: London, UK, 2019; ISBN 1788730461. [Google Scholar]
- Colomb, C. The revolt of the “periphery” against the “metropolis”? Making sense of the French Gilets Jaunes Movement (2018–2020). Int. J. Urban Reg. Res. 2020. Available online: https://www.ijurr.org/spotlight-on/urban-revolts/the-revolt-of-the-periphery-against-the-metropolis/ (accessed on 7 February 2021).
- Fregolent, L.; Nel·lo, O. (Eds.) Social Movements and Public Policies in Southern European Cities; Springer International Publishing: Cham, Switzerland, 2021; ISBN 978-3-030-52753-2. [Google Scholar]
- Nel·lo, O.; Gomà, A. Geographies of discontent: Urban segregation, political attitudes and electoral behaviour in Catalonia. City Territ. Archit. 2018, 5, 23. [Google Scholar] [CrossRef] [Green Version]
- Dijkstra, L.; Poelman, H.; Rodríguez-Pose, A. The geography of EU discontent. Reg. Stud. 2019, 54, 737–753. [Google Scholar] [CrossRef]
- McCann, P. The UK Regional-National Economic Problem: Geography, Globalisation and Governance; Routledge: London, UK, 2016; ISBN 978l138647237. [Google Scholar]
- Del Molino, S. La España Vacía. Viaje por un país que nunca fue; Turner: Madrid, Spain, 2016; ISBN 978-84-16354-14-6. [Google Scholar]
- Storper, M.; Walker, R. The Capitalist Imperative. Territory, Technology and Industrial Growth; Blackwell: Cambridge, UK, 1989. [Google Scholar]
- Camagni, R. Principi di economia urbana e territoriale; Carocci: Rome, Italy, 1993. [Google Scholar]
- Iammarino, S.; Rodriguez-Pose, A.; Storper, M. Regional inequality in Europe: Evidence, theory and policy implications. J. Econ. Geogr. 2019, 19, 273–298. [Google Scholar] [CrossRef]
- Cassiers, T.; Kesteloot, C. Socio-spatial Inequalities and Social Cohesion in European Cities. Urban Stud. 2012, 49, 1909–1924. [Google Scholar] [CrossRef]
- Cheshire, P.C. Segregated Neighbourhoods and Mixed Communities: A Critical Analysis; Joseph Rowntree Foundation: York, UK, 2007. [Google Scholar]
- Maloutas, T. Introduction: Residential Segregation in Context. In Residential Segregation in Comparative Perspective. Making Sense of Contextual Diversity; Maloutas, T., Fujita, K., Eds.; Ashgate: London, UK, 2012; pp. 1–36. [Google Scholar]
- Oberti, M.; Preteceille, E. La ségrégation urbaine; La Découverte: Paris, France, 2016; ISBN 2707164259. [Google Scholar]
- Secchi, B. La città dei ricchi e la città dei poveri; Laterza: Roma-Bari, Italy, 2013. [Google Scholar]
- Tammaru, T.; Marcińczak, S.; van Ham, M.; Musterd, S. (Eds.) Socio-Economic Segregation in European Capital Cities: East Meets West; Routledge: New York, NY, USA, 2016; ISBN 9781138794931. [Google Scholar]
- Atkinson, R.; Kintrea, K. Disentangling Area Effects: Evidence from Deprived and Non-deprived Neighbourhoods. Urban Stud. 2001, 38, 2277–2298. [Google Scholar] [CrossRef]
- Blank, R.M. Tracing the economic impact of cumulative discrimination. Am. Econ. Rev. 2005, 95, 99–103. [Google Scholar] [CrossRef]
- Nel·lo, O. (Ed.) Efecto Barrio. Segregación social y condiciones de vida en las grandes ciudades ibéricas; Tirant Humanidades: València, Spain, 2021; ISBN 978-84-18614-46-0. [Google Scholar]
- Slater, T. Your Life Chances Affect Where You Live: A Critique of the “Cottage Industry” of Neighbourhood Effects Research. Int. J. Urban Reg. Res. 2013, 37, 367–387. [Google Scholar] [CrossRef]
- Lefebvre, H. La production de l’espace; Seuil: Paris, France, 1974. [Google Scholar]
- Harvey, D. The Limits to Capital; University of Chicago Press: Chicago, IL, USA, 1982. [Google Scholar]
- Harvey, D. Social Justice and the City; Johns Hopkins University Press: Baltimore, MD, USA, 1973; ISBN 080181524X. [Google Scholar]
- Massey, D. In What Sense a Regional Problem? Reg. Stud. 1979, 13, 233–243. [Google Scholar] [CrossRef]
- Smith, N. Uneven Development; Oxford: New York, NY, USA, 1984. [Google Scholar]
- Soja, E.W. Seeking Spatial Justice; Globalization and Community Series; University of Minnesota Press: Minneapolis, MN, USA, 2010; ISBN 978-0-8166-6668-3. [Google Scholar]
- Brenner, N. A Thousand Leaves: Notes on the geographies of uneven development. In Leviathan Undone? Towards a Polítical Economy of Scale; Keil, R., Mahon, R., Eds.; University of British Columbia: Vancouver, BC, Canada, 2009; pp. 27–49. [Google Scholar]
- Hartshorne, R. The nature of Geography. A critical survey of current thought in the light of the past. Ann. Assoc. Am. Geogr. 1939, 29, 171–645. [Google Scholar]
- Williams, R. The Country and the City; Chatto & Windus (The Random House Group Limited): London, UK, 1973. [Google Scholar]
- Christaller, W. Central Places in Southern Germany; Prentice Hall, Englewood Cliffs: New Jersey, NJ, USA, 1966. [Google Scholar]
- Brenner, N. Implosions/Explosions: Towards a Study of Planetary Urbanization; Jovis: Berlin, Germany, 2014; ISBN 9783868593174. [Google Scholar]
- Brenner, N.; Schmid, C. The ‘Urban Age’ in Question. Int. J. Urban Reg. Res. 2014, 38, 731–755. [Google Scholar] [CrossRef]
- Indovina, F. Dalla città diffusa all’archipelago metropolitano; Franco Angeli: Milano, Italy, 2009. [Google Scholar]
- Soja, E.W. Regional Urbanization and the end of the Metropolis Era. In Cities in the 21st Century; Nel·lo, O., Mele, R., Eds.; Routledge: New York, NY, USA, 2016; pp. 41–56. ISBN 978-1-138-11964-2. [Google Scholar]
- Massey, D.S.; Denton, N.A. The Dimensions of Residential Segregation. Soc. Forces 1988, 67, 281–315. [Google Scholar] [CrossRef]
- Fujita, K. Residential Segregation in Comparative Perspective: Making Sense of Contextual Diversity; Maloutas, T., Fujita, K., Eds.; Ashgate: Surrey, UK, 2012; ISBN 1409418731. [Google Scholar]
- van Ham, M.; Tammaru, T.; Ubarevičienė, R.; Janssen, H. (Eds.) Urban Socio-Economic Segregation and Income Inequality. A Global Perspective; The Urban Book Series; Springer International Publishing: Cham, Switzerland, 2021; ISBN 978-3-030-64568-7. [Google Scholar]
- Maurin, É. Le ghetto français: Enquête sur le séparatisme social; Seuil: Paris, France, 2004; ISBN 2020685809. [Google Scholar]
- Arbaci, S. Paradoxes of Segregation: Housing Systems, Welfare Regimes and Ethnic Residential Change in Southern European Cities; John Wiley & Sons Ltd: Chichester, UK, 2019; ISBN 978-1-444-33832-4. [Google Scholar]
- Blanco, I.; Nel·lo, O. (Eds.) Barrios y Crisis. Crisis económica, segregación urbana e innovación social en Cataluña; Tirant lo Blanch: València, Spain, 2018; ISBN 9788417203313. [Google Scholar]
- Nel·lo, O.; López, J. El procés d’urbanització. In Raó de Catalunya.La Societat catalana al segle XXI.; Institut d’Estudis Catalans/Enciclopèdia Catalana: Barcelona, Spain, 2016; pp. 119–148. [Google Scholar]
- Subirats, M. Barcelona: De la necessitat a la llibertat. Les classes socials al tombant del segle XXI; L’Avenç: Barcelona, Spain, 2012. [Google Scholar]
- Giner, S.; Homs, O. (Eds.) Raó de Catalunya. La societat catalana al segle XXI.; Institut d’Estudis Catalans/ Enciclopèdia Catalana: Barcelona, Spain, 2016; ISBN 978-84-9965-315-0. [Google Scholar]
- Nel·lo, O. La Ciudad en movimiento: Crisis social y respuesta ciudadana; Díaz & Pons: Madrid, Spain, 2015; ISBN 978-84-944522-0-8. [Google Scholar]
- Cardús, S. (Ed.) Informe sobre la cohesió social a la Catalunya del segle XXI; Institut d’Estudis Catalans: Barcelona, Spain, 2020; ISBN 9788499658390. [Google Scholar]
- Antón-Alonso, F.; Porcel, S. Del barri a la metròpoli: Dinàmiques de mobilitat residencial metropolitanes. In Anuari Metropolità de Barcelona 2018: Del barri a la metròpoli; Clapés, J., Ed.; Institut d’Estudis Regionals i Metropolitans de Barcelona: Bellaterra, Spain, 2019; pp. 11–24. ISBN 978-84-92940-35-6. [Google Scholar]
- Els àmbits funcionals Territorials. Departament de Territori i Sostenibilitat. Available online: https://territori.gencat.cat/ca/06_territori_i_urbanisme/ordenacio_del_territori/plans_territorals/plans_territorials_parcials/ambits_funcionals/ (accessed on 30 January 2021).
- Porcel, S. Desigualtats territorials i mobilitat quotidiana. Una Aproximació socioterritorial a la realitat juvenil catalana. In Enquesta a la joventut de catalunya 2012, Volum 2; Serracant, P., Ed.; Generalitat de Catalunya Departament de Benestar Social i Família Direcció General de Joventut: Barcelona, Spain, 2013; pp. 315–379. [Google Scholar]
- Nel·lo, O. La segregación urbana en Cataluña. In Barrios y Crisis. Crisis Económica, Segregación Urbana e Innovación Social en Cataluña; Blanco, I., Nel.lo, O., Eds.; Tirant Humanidades: Valencia, Spain, 2018; pp. 71–110. [Google Scholar]
- OECD. Country Roads: Education and Rural Life. Trends Shaping Education Spotlights. 2017. Available online: https://0-www-oecd--ilibrary-org.brum.beds.ac.uk/education/country-roads_ea43a39d-en (accessed on 28 May 2021).
- Bonal, X. La política educativa ante el reto de la segregación escolar en Cataluña; Prospectivas; UNESCO IIEP: París, France, 2018. [Google Scholar]
- Acevedo-Garcia, D.; Noelke, C.; McArdle, N.; Sofer, N.; Hardy, E.F.; Weiner, M.; Baek, M.; Huntington, N.; Huber, R.; Reece, J. Racial And Ethnic Inequities In Children’s Neighborhoods: Evidence From The New Child Opportunity Index 2.0. Health Aff. 2020, 39, 1693–1701. [Google Scholar] [CrossRef] [PubMed]
- Brain, I.; Prieto, J. Understanding Changes in the Geography of Opportunity: The Case of Santiago, Chile; Lincoln Institute of Land Policy: Cambridge, MA, USA, 2018. [Google Scholar]
- Bayona-i-Carrasco, J.; Domingo, A. School segregation of migrants and their descendants in a dual school system: The case of Barcelona. Popul. Space Place 2021, e2446. [Google Scholar] [CrossRef]
- Gomà, A.; Muñoz, J. Segregated in the City, Separated in the School. The Reproduction of Social Inequality through the School System. Urban Sci. 2018, 2, 112. [Google Scholar] [CrossRef] [Green Version]
- Flores Martos, R.; Gómez Morán, M.; Renes Ayala, V. La transmisión Intergeneracional de la pobreza: Factores, Procesos y Propuestas para la intervención; Fundación FOESSA; Cáritas Españolas: Madrid, Spain, 2016; ISBN 978-84-8440-612-9. [Google Scholar]
- Nel·lo, O.; Donat, C. Los efectos territoriales de la crisis económica en la región metropolitana de Barcelona. In Geografía de la crisis económica en España; Albertos, J.M., Sánchez, J.L., Eds.; Publicacions Universistat de València: Valencia, Spain, 2014; pp. 565–608. [Google Scholar]
- Sarasa, S.; Porcel, S.; Navarro-Varas, L. L’impacte social de la crisi a l’àrea metropolitana de Barcelona i a Catalunya: Annex metodològic II: Classificació Socioeconòmica Europea (ESEC). Pap. Regió Metrop. Barc. Territ. Estratègies Planejament 2013, 56, 97–99. [Google Scholar]
- Borrell, C.; Benach, J. Els Determinants Socials de la Salut. Available online: https://espaifabrica.cat/els-determinants-socials-de-la-salut/ (accessed on 15 July 2020).
- O’Campo, P.; Wheaton, B.; Nisenbaum, R.; Glazier, R.H.; Dunn, J.R.; Chambers, C. The Neighbourhood Effects on Health and Well-being (NEHW) study. Health Place 2015, 31, 65–74. [Google Scholar] [CrossRef] [Green Version]
- Pemberton, S.; Humphris, R. Locality, Neighbourhood and Health: A Literature Review; Iris Working Paper Series: Birmingham, UK, 2016. [Google Scholar]
- Phelan, J.C.; Link, B.G.; Tehranifar, P. Social Conditions as Fundamental Causes of Health Inequalities: Theory, Evidence, and Policy Implications. J. Health Soc. Behav. 2010, 51, S28–S40. [Google Scholar] [CrossRef] [Green Version]
- Baena-Díez, J.M.; Barroso, M.; Cordeiro-Coelho, S.I.; Díaz, J.L.; Grau, M. Impact of COVID-19 outbreak by income: Hitting hardest the most deprived. J. Public Health (Bangkok) 2020, 1–6. [Google Scholar] [CrossRef] [PubMed]
- Borrell, C.; Benach, J. (Coord) Evolució de les desigualtats en la salut a Catalunya; Editorial Mediterrània, Fundació Jaume Bofill: Barcelona, Spain, 2005. [Google Scholar]
- Borrell, C.; Rodríguez-Sanz, M.; Ricart, I.; Pérez, G. Les desigualtats socials en salut a Barcelona. Població vulnerable Barcelona. 2005, 13, 104–113. [Google Scholar]
- Checa, J.; Robles, M. ¿Mueren antes los pobres? Esperanza de vida, salud mental y obesidad en la Ciudad. In Efecto barrio. Segregación Social i Condiciones de Vida en las Grandes Ciudades Ibéricas; Nel·lo, O., Ed.; Tirant Humanidades: València, Spain, 2021; ISBN 978-84-18614-46-0. [Google Scholar]
Figure 1.
Territorial settings, Catalonia. (a) Planning settings; (b) Population size; (c) Urban/rural character; (d) Residential segregation. Source: In-house construction based on cartography from Institut Cartogràfic i Geològic de Catalunya, inhabitants data from (IDESCAT), Urban/rural character from [14,63] and Residential segregation from [64].

Figure 2.
Level of studies attained. Catalonia, population aged 25 years and over. Year 2011. Source: In-house construction based on the ECVHP, 2011.
Figure 2.
Level of studies attained. Catalonia, population aged 25 years and over. Year 2011. Source: In-house construction based on the ECVHP, 2011.

Figure 3.
ESEC (9 + 1) social structure. Working people aged from 16 to 64 years, Catalonia. Source: In-house construction based on the ECVHP, 2011.
Figure 3.
ESEC (9 + 1) social structure. Working people aged from 16 to 64 years, Catalonia. Source: In-house construction based on the ECVHP, 2011.

Figure 4.
Levels of risk of poverty. Percentage of population resident in consumption units with incomes lower than 60% of the mean. Catalonia, 2011. Source: In-house construction based on the ECVHP, 2011.
Figure 4.
Levels of risk of poverty. Percentage of population resident in consumption units with incomes lower than 60% of the mean. Catalonia, 2011. Source: In-house construction based on the ECVHP, 2011.
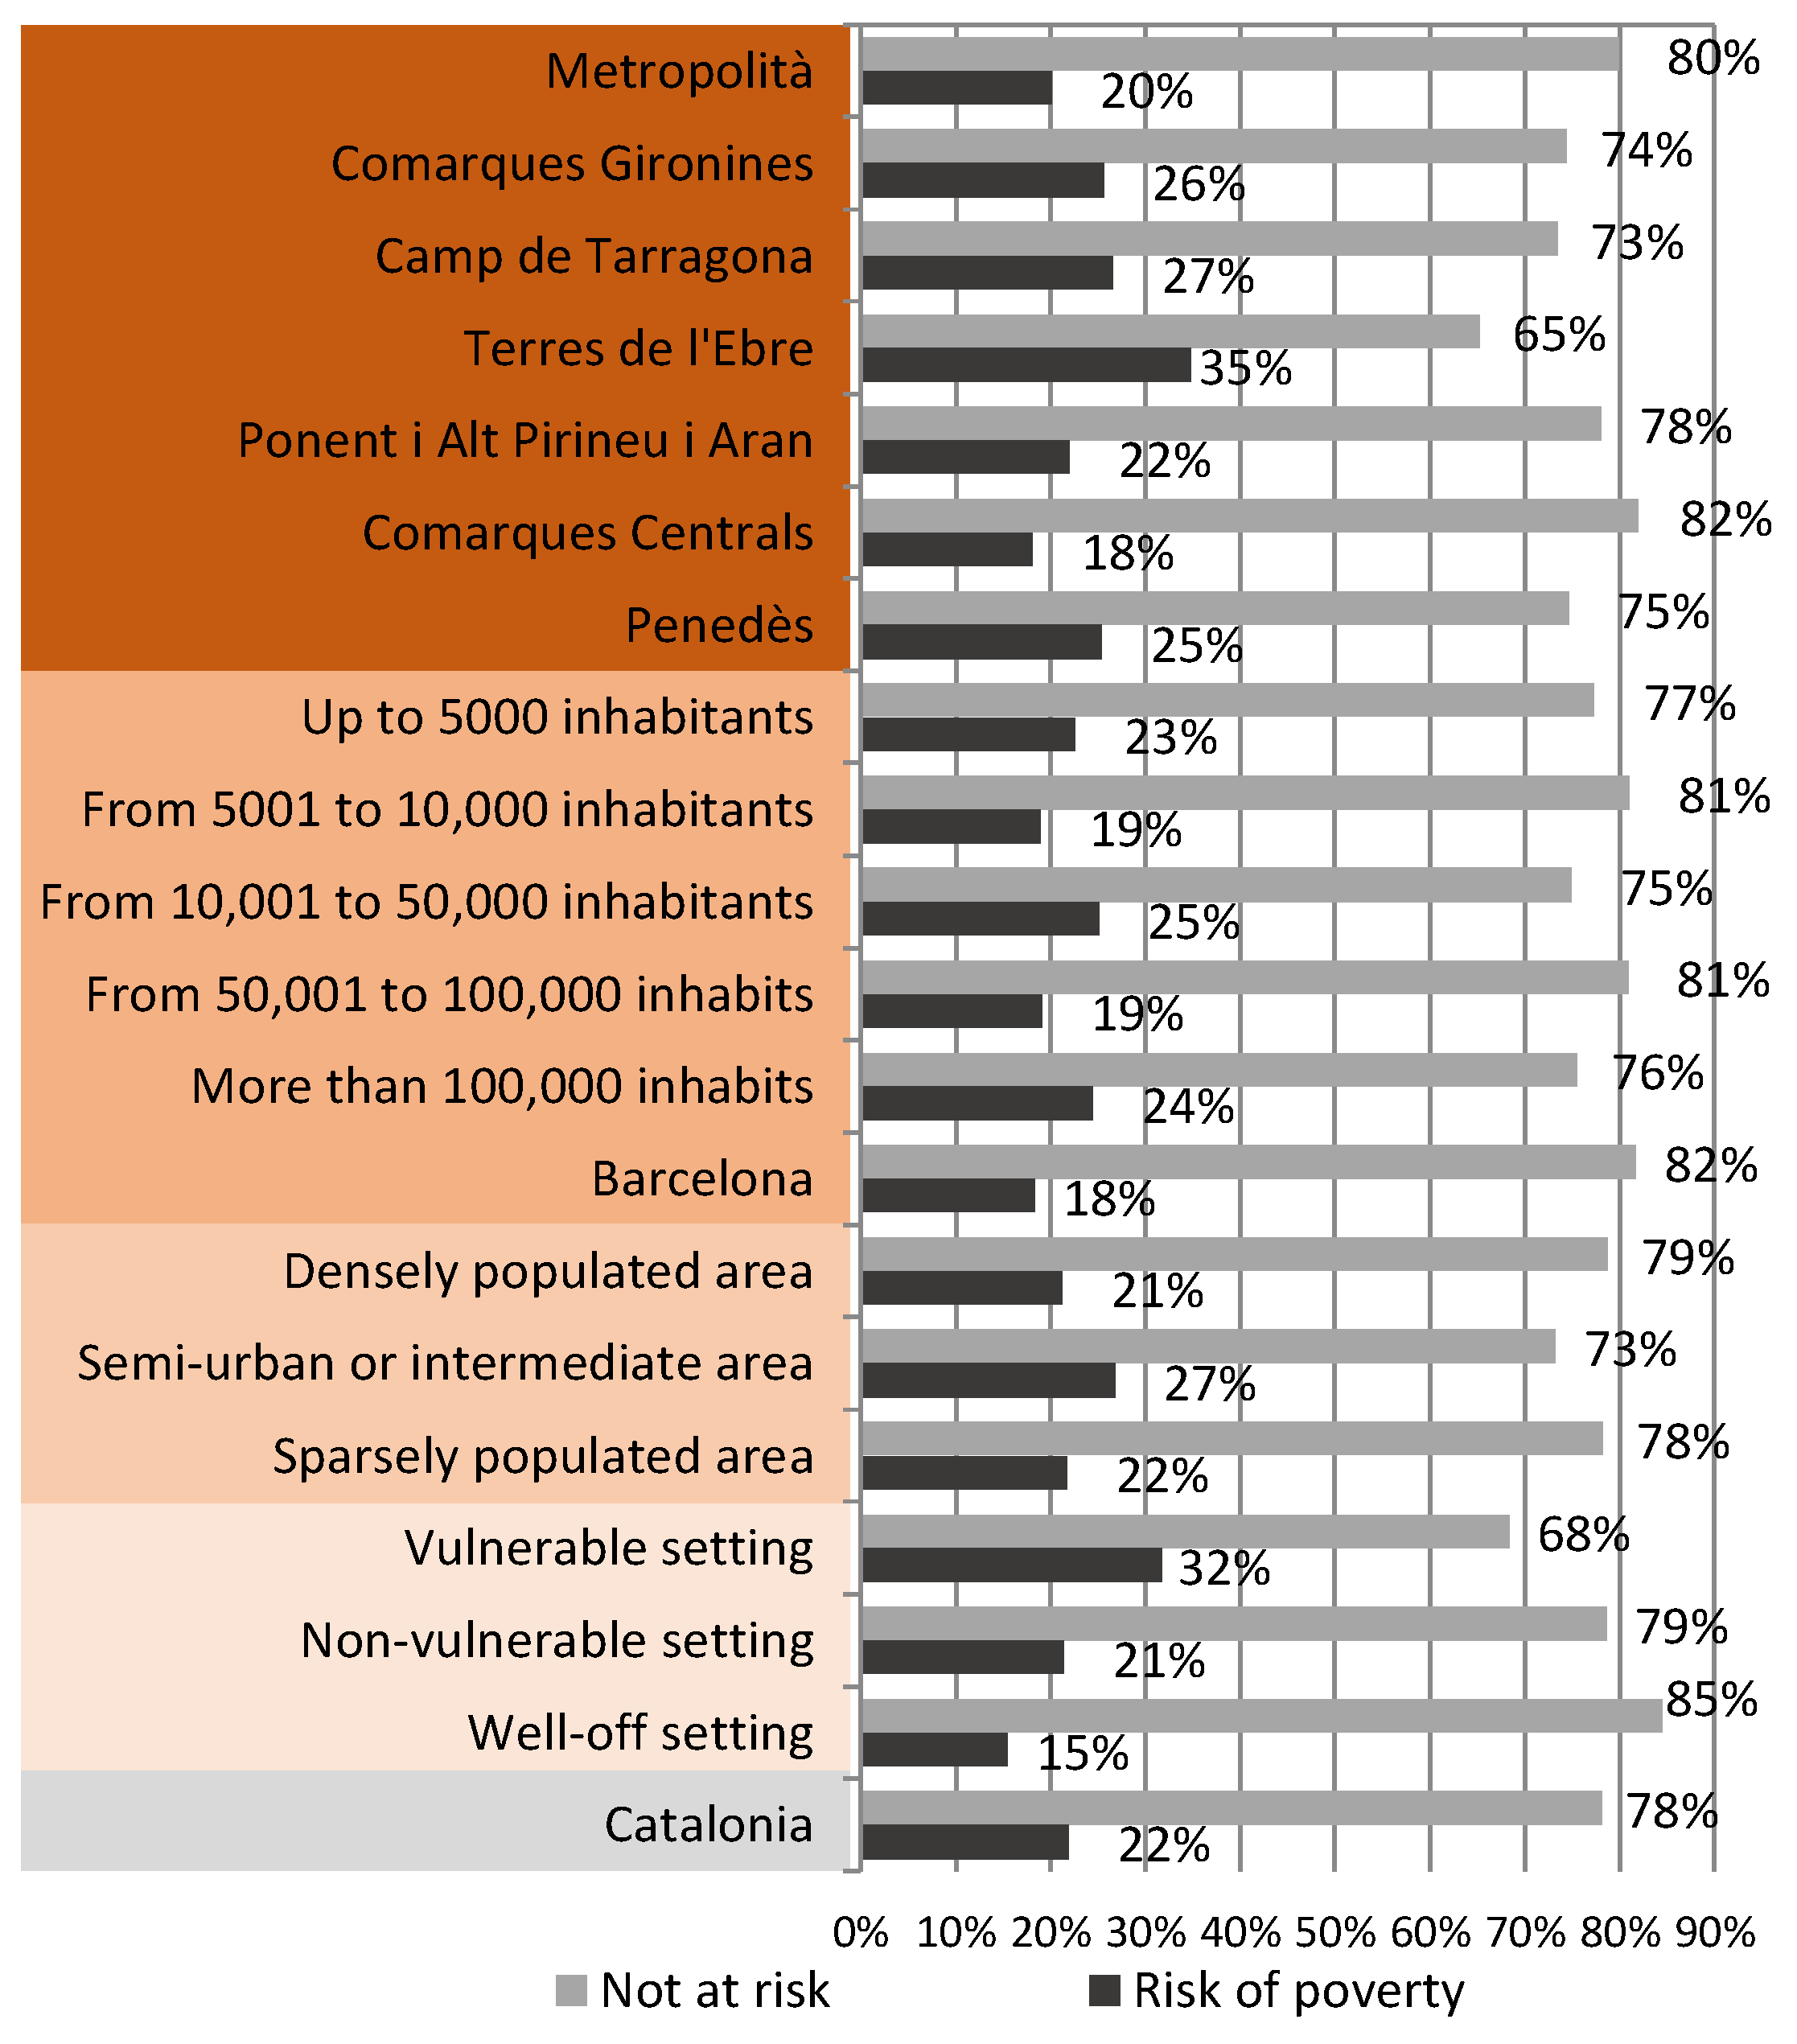
Figure 5.
Self-perceived health. Population aged 16 years and over. Catalonia. Source: In-house construction based on the ECVHP, 2011.
Figure 5.
Self-perceived health. Population aged 16 years and over. Catalonia. Source: In-house construction based on the ECVHP, 2011.
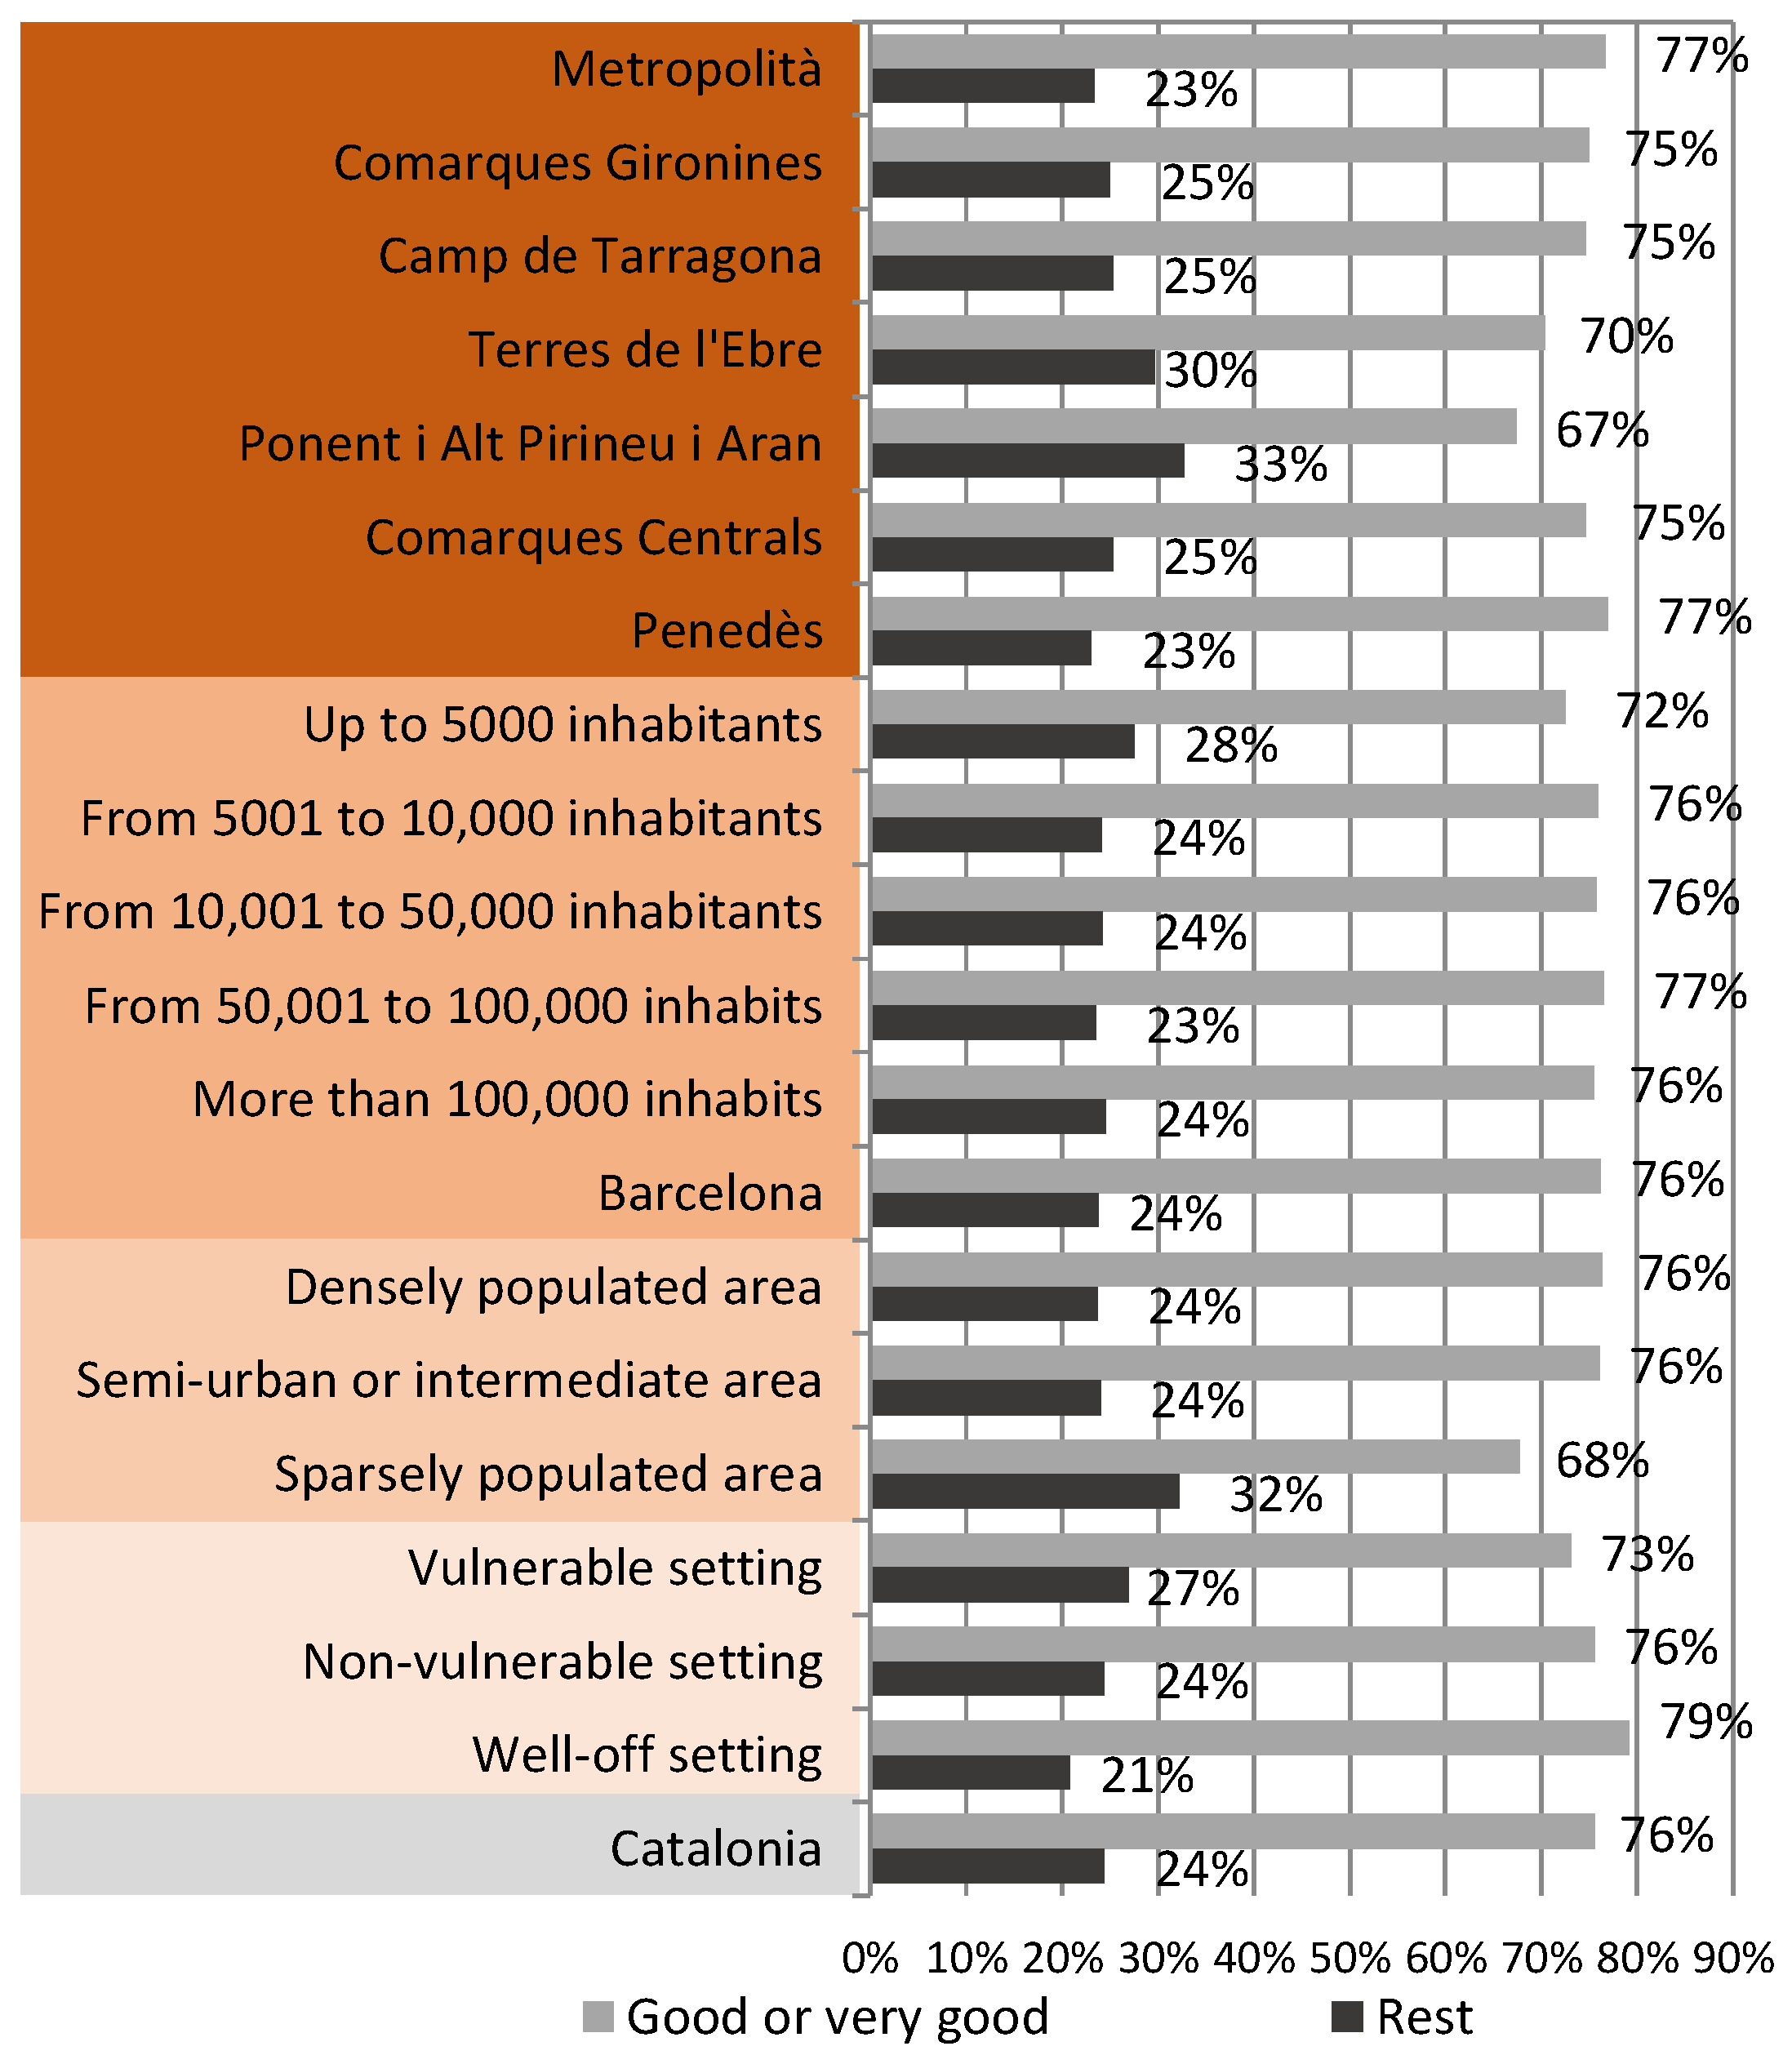
Figure 6.
Life satisfaction. Population aged 16 and over. Catalonia. Source: In-house construction based on the ECVHP, 2011.
Figure 6.
Life satisfaction. Population aged 16 and over. Catalonia. Source: In-house construction based on the ECVHP, 2011.


Table 1.
Distribution of the population according to territorial aggregations. Catalonia, 2011.
| Planning settings | Metropolità | Comarques Gironines | Camp de Tarragona | Terres de l’Ebre | Ponent and Alt Pirineu i Aran | Comarques Centrals | Penedès | Total |
| 4,636,077 | 741,899 | 518,655 | 191,631 | 443,211 | 405,489 | 602,656 | 7,539,618 | |
| Population size | Up to 5000 inhabitants | From 5001 to 10,000 inhabitants | From 10,001 to 50,000 inhabitants | From 50,001 to 100,000 inhabits | More than 100,000 inhabits | Barcelona | Total | |
| 790,319 | 645,951 | 2,097,920 | 1,056,294 | 1,333,687 | 1,615,448 | 7,539,618 | ||
| Degree of urbanization | Densely populated area | Semiurban or intermediate area | Sparsely populated area | Total | ||||
| 6,087,671 | 818,436 | 633,511 | 7,539,618 | |||||
| Segregation | Vulnerable setting | Nonvulnerable setting | Well-off setting | Total | ||||
| 676,365 | 6,239,062 | 624,191 | 7,539,618 |
Table 2.
Summary of the indicators analysed and their deviations. Catalonia; base: 100.
| Index Indicators 100 | Level of Completed Studies (Aged 25 or over) | Self-Perceived Health of People Aged 16 and over | Overall Life Satisfaction of People Aged 16 and over | Rate of Risk of Poverty 60% Median—Total CAT | Social Structure ESEC (9 + 1) People Aged 16 and over | Mean Indices | Sum Mean Deviations | Mean | |||||
|---|---|---|---|---|---|---|---|---|---|---|---|---|---|
| Without Higher Education | Higher Education | Rest | Good or Very Good | From 0 to 10 | Not at Risk | Risk of Poverty | Qualified (ESEC = 1,2,3) | Rest of the Population (ESEC > 3) | |||||
| Spatial planning areas | Metropolità | 96.8 | 108.4 | 95.5 | 101.4 | 99.8 | 102.3 | 91.8 | 111.4 | 95.6 | 100.3 | ||
| Comarques Gironines | 106.2 | 84.0 | 102.5 | 99.2 | 101.9 | 95.3 | 116.9 | 83.1 | 106.5 | 99.5 | |||
| Camp de Tarragona | 101.3 | 96.7 | 103.6 | 98.8 | 97.2 | 94.0 | 121.4 | 85.0 | 105.7 | 100.4 | |||
| Terres de l’Ebre | 121.0 | 45.9 | 121.4 | 93.1 | 98.9 | 83.5 | 159.0 | 52.0 | 118.4 | 99.2 | |||
| Ponent i Alt Pirineu i Aran | 103.7 | 90.4 | 133.8 | 89.1 | 96.8 | 99.8 | 100.5 | 80.5 | 107.5 | 100.2 | |||
| Comarques Centrals | 110.0 | 74.1 | 103.7 | 98.8 | 104.6 | 104.9 | 82.7 | 62.3 | 114.4 | 95.1 | |||
| Penedès | 100.4 | 99.0 | 94.4 | 101.8 | 101.4 | 95.5 | 116.0 | 101.8 | 99.3 | 101.1 | |||
| Mean Deviation | 6.5 | 16.9 | 10.7 | 3.5 | 2.2 | 5.6 | 19.9 | 21.5 | 8.2 | 94.95 | 10.55 | ||
| Population size | Up to 5000 inhabitants | 109.6 | 75.3 | 112.7 | 95.9 | 100.1 | 99.0 | 103.4 | 72.1 | 110.7 | 97.6 | ||
| From 5001 to 10,000 inhabitants | 102.1 | 94.5 | 98.6 | 100.5 | 101.4 | 103.8 | 86.5 | 93.0 | 102.7 | 98.1 | |||
| From 10,001 to 50,000 inhabitants | 104.0 | 89.7 | 99.3 | 100.2 | 100.3 | 95.9 | 114.6 | 94.0 | 102.3 | 100.0 | |||
| From 50,001 to 100,000 inhabits | 100.2 | 99.4 | 96.2 | 101.2 | 97.9 | 103.6 | 87.2 | 102.9 | 98.9 | 98.6 | |||
| More than 100,000 inhabits | 107.4 | 80.8 | 100.3 | 99.9 | 99.7 | 96.7 | 111.7 | 80.9 | 107.3 | 98.3 | |||
| Barcelona | 83.9 | 141.5 | 97.4 | 100.8 | 100.7 | 104.6 | 83.5 | 137.4 | 85.7 | 104.0 | |||
| Mean Deviation | 6.6 | 17.0 | 3.6 | 1.2 | 0.8 | 3.4 | 12.1 | 16.7 | 6.4 | 67.68 | 7.52 | ||
| Degree of urbanization | Densely populated area | 98.4 | 104.0 | 96.9 | 101.0 | 99.9 | 100.8 | 97.1 | 104.9 | 98.1 | 100.1 | ||
| Semiurban or intermediate area | 103.8 | 90.3 | 98.1 | 100.6 | 100.2 | 93.8 | 122.2 | 86.1 | 105.3 | 100.0 | |||
| Sparsely populated area | 110.4 | 73.1 | 131.8 | 89.7 | 100.3 | 100.2 | 99.3 | 70.3 | 111.4 | 98.5 | |||
| mean deviation | 5.3 | 13.6 | 12.3 | 4.0 | 0.2 | 2.4 | 8.6 | 16.2 | 6.2 | 68.61 | 7.62 | ||
| Segregation | Vulnerable setting | 117.6 | 54.7 | 110.3 | 96.7 | 98.4 | 87.5 | 144.7 | 48.0 | 119.9 | 97.5 | ||
| Nonvulnerable setting | 100.9 | 97.7 | 100.1 | 100.0 | 99.9 | 100.6 | 97.8 | 98.7 | 100.5 | 99.6 | |||
| Well-off setting | 67.3 | 184.5 | 85.2 | 104.8 | 102.8 | 108.3 | 70.6 | 181.9 | 68.6 | 108.2 | |||
| Mean Deviation | 17.1 | 44.1 | 8.4 | 2.7 | 1.5 | 7.1 | 25.4 | 45.1 | 17.3 | 168.67 | 18.74 | ||
| Mean Catalonia | 100 | 100 | 100 | 100 | 100 | 100 | 100 | 100 | 100 | 100 | |||
Source: In-house construction based on the ECVHP, 2011.
Publisher’s Note: MDPI stays neutral with regard to jurisdictional claims in published maps and institutional affiliations. |
© 2021 by the authors. Licensee MDPI, Basel, Switzerland. This article is an open access article distributed under the terms and conditions of the Creative Commons Attribution (CC BY) license (https://creativecommons.org/licenses/by/4.0/).
Share and Cite
MDPI and ACS Style
Checa, J.; Nel·lo, O. Residential Segregation and Living Conditions. An Analysis of Social Inequalities in Catalonia from Four Spatial Perspectives. Urban Sci. 2021, 5, 45. https://0-doi-org.brum.beds.ac.uk/10.3390/urbansci5020045
AMA Style
Checa J, Nel·lo O. Residential Segregation and Living Conditions. An Analysis of Social Inequalities in Catalonia from Four Spatial Perspectives. Urban Science. 2021; 5(2):45. https://0-doi-org.brum.beds.ac.uk/10.3390/urbansci5020045
Chicago/Turabian StyleCheca, Joan, and Oriol Nel·lo. 2021. "Residential Segregation and Living Conditions. An Analysis of Social Inequalities in Catalonia from Four Spatial Perspectives" Urban Science 5, no. 2: 45. https://0-doi-org.brum.beds.ac.uk/10.3390/urbansci5020045