
Regional Policy and Greenfield Investments in German Districts


1
Erasmus Happiness Economics Research Organisation (EHERO) and Department of Applied Economics, Erasmus University Rotterdam, 3062 Rotterdam, The Netherlands
2
Department of Organisation, Open University of the Netherlands, 6419 Heerlen, The Netherlands
3
Department of Public Health and Primary Care, LUMC Campus Den Haag, LUMC, Leiden University, 2595 Den Haag, The Netherlands
4
Institute of Geography and Geology, University of Greifswald, 17489 Greifswald, Germany
*
Author to whom correspondence should be addressed.
Urban Sci. 2021, 5(3), 51; https://0-doi-org.brum.beds.ac.uk/10.3390/urbansci5030051
Submission received: 4 May 2021
/
Revised: 7 June 2021
/
Accepted: 24 June 2021
/
Published: 28 June 2021
Abstract
:Using data on greenfield investment in German districts from 2003 to 2010, we examine how regional development policies affect the decision of multinational corporations to locate facilities in Germany. We are interested in whether regional development policies accumulate to increase the attractiveness of a region and whether some policies are necessary to attract foreign investors. Applying count data models and geographic weighted regression, the results indicate that, on average, regional development policies increase the attractiveness of German districts for multinational firms. We find that place-based policies have the strongest effect on investments in the East German lagging regions. However, policies predominantly attract standardised types of investments that require considerable capital investments but not specialised location advantages.
1. Introduction
During recent decades, regional development policies have been extensively used by European and national authorities to influence the location of firms in support of lagging regions. Most notably, European Structural Funds have aimed to encourage a more even distribution of economic activities within and across member states. Along these lines, policy has emphasized attracting multinational corporations (MNCs) to foster the development of lagging regions, where foreign direct investment (FDI) is considered crucial for the process of economic restructuring and technology catch-up. FDI can boost local and regional prospects for economic development through results such as the creation of employment, growth of capital stock, access to new technologies, and promotion of exports [1]. To attract MNCs to their jurisdictions, local and regional governments progressively utilise both incentive-based policies, such as subsidies, grants, and taxes, and capacity-building policies, such as government spending on amenities, education, physical infrastructure, and public transportation [2]. These incentive-based and capacity-building policies in lagging regions are supported by European and national regional development programs.
However, the extent to which these policies can influence the location decisions of MNCs remains unclear. Often only a limited number of locations can satisfy the criteria of MNC projects, and most locations are not even considered by location site managers. The number of potential locations for high-end sectors, such as R&D-intensive industries, and high-end functions, such as headquarters facilities, is typically rather limited [3,4]. Paradoxically, local and regional authorities often prefer these economic activities most because they believe that these industries and functions are most conducive to economic prosperity. Conversely, this reality suggests that regional development and incentive-based policies mainly help to attract MNC projects that lack specific location requirements, such as production plants.
At the same time, the empirical literature is also inconclusive about to what extent regional development policies can promote FDI. Midelfart-Knarvik and Overman [5] indicate that European Structural Funds expenditures affect the location of industry but find that national policies have little effect. Basile et al. [6] also find that being an Objective 1 region, meaning regions with a per capita GDP lower than 75% of the EU average, with a very low population density and/or ultra-peripheral regions, has a positive effect on the probability of attracting greenfield FDI, and Crozet et al. (2004), [7] find little evidence that regional policies influence the location choices of foreign investors in France. Wren and Jones [8] find that small grants affect the location of FDI in Britain: EUR 25 million in grant results on average in six additional FDI projects. Nevertheless, the results of the Wren and Jones study also suggest that investment incentives in the form of job subsidies, grants, or interest-free loans are an expensive tool to attract FDI (see also Tavares and Young [9]), although the incentives might sometimes be a necessary tool for lagging regions to offset unfavourable local conditions [10]. Globerman and Chen (2010), [2] also argue that a regional acquisition strategy based on capacity-building policies is less controversial than an acquisition strategy based on incentive-building policies because the latter generally aim to stimulate productivity and economic growth.
In this study, we examined the effect of regional development policies on greenfield investments in German districts. A greenfield investment is a type of foreign investment where a company expands or establishes a manufacturing plant, services, or extraction activities or constructs new facilities. Other forms of foreign direct investments include mergers and acquisitions of a majority stake in a foreign company, in which the parent company has little or no control over daily business operations. Germany is a good case study for examining the redistributive effects of such regional policies because large disparities still exist between German districts with respect to economic conditions—most notably, the ‘East-West divide’. In addition, East German districts have been major recipients of European, national, and regional funding during the past years. The focus on greenfield investment destinations is warranted for a number of reasons. In contrast with mergers and acquisitions, the location decision process for greenfield investments is not affected by past capital instalments. Therefore, greenfield investments reveal the location preferences of MNCs.
This study contributes to the literature on FDI and regional policy in several ways. First, we analyse to what extent geographical variation exists in the effects of regional policy. Favourable local conditions, in terms of demand and supply factors and external economies, can be expected to neutralise the positive effect of regional policies on attracting MNCs. Therefore, we predict that regional policy will significantly affect the number of investments in East German districts.
Second, we examine to what extent regional policy can have a different effect on different types of economic activities. Not all locations are suitable for all types of investments because they lack the appropriate specialised location factors [4,11,12] and the minimum requirements to host certain sectors and economic activities. Therefore, public funds are more likely to help attract economic activities with less specific location requirements (e.g., production plants) than economic activities with very specific location requirements (e.g., R&D and headquarters facilities). Similarly, incentive-based policies are more likely to attract those investment projects that require large capital investments, such as production plants.
Third, we investigate how different types of regional policies can have different effects on attracting MNCs. We not only examine differences between incentive-based and capacity-building policies but also differences between place-based policies aimed at regional convergence and place-neutral policies aimed at improving regional competitiveness in general [13].
2. Related Literature
2.1. Location Decisions of MNCs
Firms engage in FDI if the advantages gained from establishing a facility abroad are sufficiently great to balance the extra associated costs and risks [14]. Based on the OLI paradigm developed by Dunning [1], firms engage in FDI if they possess an Ownership (O) advantage related to particular products and production processes, a Location (L) advantage from establishing their subsidiary abroad rather than in their home country, and an Internalisation (I) advantage embedding their foreign activities in fully or partially owned subsidiaries rather than conducting them through trade, licensing, or franchising. Following the OLI paradigm, firms’ location decisions are only directly influenced by location advantages [15], where more attractive locations are more likely to attract foreign firms [16]. Attractive locations are often characterised by good market access, low wages, presence of a skilled workforce, or the presence of raw materials.
Location factors can be broadly categorised into three groups [7]: demand factors, supply factors, and agglomeration economies. Demand factors are related to the size of the markets and market access, and supply factors are related to the costs and quality of production factors. Accordingly, supply factors not only include wages, land costs, and taxes but also the quality of the workforce and the functioning of the labour and capital markets. External economies and imitation behaviour can also influence the location decisions of MNCs. In other words, MNCs are inclined to establish facilities in regions where many other firms are already present [17]. These external economies are related to the presence of a large and specialised labour market, proximity to suppliers and customers, and better possibilities to exchange knowledge and information through spin-offs, collaborations, and labour mobility [18]. Moreover, as MNCs that expand internationally into markets in new areas encounter uncertainty, following precedents of other MNCs can stimulate investments. Therefore, the number of MNCs already present at a certain location can attract additional FDI to that location [19].
The relative importance of the location factors mentioned above depends on the firm’s motivation to engage in FDI. Dunning [1] distinguishes between four motivations firms may have to internationalise: (1) access to natural resources; (2) access to new markets; (3) restructuring production to reduce costs of labour, machinery, and materials and to increase efficiency; and (4) access to strategically related created assets. Whereas market-seeking FDI is typically attracted to demand factors such as high local GDP and international accessibility, efficiency-seeking FDI is driven more by supply factors such as low wages, land costs, and taxes. Strategic asset-seeking FDI typically requires highly skilled labour as a supply factor and agglomeration economies to profit from labour market pooling and knowledge sharing. For example, to thrive, a manufacturing plant needs low-wage modestly skilled labour and inexpensive land; business services and sales offices demand a large domestic market and high worker competence; and strategic asset-seeking investments, such as R&D and headquarters facilities, require high-end local resources that are often associated with agglomeration economies and specialised skills [20].
2.2. Regional Policy and FDI
In addition to demand factors, supply factors, and agglomeration economies, public policy can play an important role in MNCs’ investment decisions. Policy can provide institutional quality in terms of control of corruption, instituting the rule of law, or establishing bureaucratic quality [21,22], as well as ensuring lower taxes, acquisition of grants, interest-reduced loans, and sometimes even monopoly rights [23]. Therefore, two types of regional development policy tools help attract FDI [2,24,25]:
- Incentive-based policies that aim to attract specific MNCs. Examples of such policies include tax benefits, grants, subsidies, and interest-free loans. In addition, national and regional investment promotion agencies can play an active role by promoting the region or supporting MNCs in finding suitable locations, employees, and financing.
- Capacity-building policies that aim to improve the economic, institutional, and physical environment in general. In addition to investments in infrastructure, higher education, public services, and amenities, improvements in institutional quality (e.g., bureaucratic efficiency, law and order, and control of corruption) are also important. Accordingly, capacity-building policies increase an area’s attractiveness to foreign investors through their effect on location factors.
Although both types of regional development policies can make an area more attractive to foreign investors, incentive-based policies are more controversial than capacity-building policies. Whether the costs of providing grants and interest-reduced loans weigh against the revenues of acquisition is unclear. When economic activities are difficult to conduct in the region, the effects on the regional innovation system and employment will be limited, and the subsidiary is more likely to disappear eventually [26]. Moreover, money spent on the provision of economic incentives cannot be spent on infrastructure or higher education, which can decrease the attractiveness of a region. Finally, in contrast with capacity-building policies, incentive-based policies are easy for other regions to duplicate, resulting in a ‘race to the bottom’. Although the European Union has always attempted to dodge such a race to the bottom by prohibiting most subsidies and grants for plant locations [27,28], lagging regions are still permitted to attract foreign firms using such incentive-based policies. Similarly, local and regional discretionary powers are likely to increase when European countries transfer economic development policies to sub-national levels of government. At the same time, governments have also become increasingly aware that attracting investments that complement the economic structure of the region and that are likely to endure is the best course of action. Therefore, capacity-building regional development policies are unsurprisingly becoming increasingly popular [25,29].
In the context of regional development policies, a distinction also exists between place-based and place-neutral policies [13]. According to Barca et al. [13], place-based policies reflect the specifics of the regional and local context (e.g., social, cultural, and institutional characteristics) and are based on the hypothesis that tapping into unused potential in intermediate and lagging areas can enhance growth at both a local and national level. Place-neutral or spatially blind policies possess a ‘one-size-fits-all’ character and are oriented towards the maximisation of aggregate growth, regardless of specific regional development bottlenecks, and thus focus on concentrating efficiency in the core regions. Because regional policy mainly helps to attract greenfield FDI by counterbalancing unfavourable local conditions, we hypothesise that place-based policies will have a more significant effect on the investment decisions of MNCs than place-neutral policies.
2.3. German Regional Policy and FDI
Within Germany, governments at different levels (i.e., national, state, and municipal) have implemented both incentive- and capacity-building-based policies that can affect foreign investors’ location choices. This study only focuses on monetary measures such as investment grants, interest-reduced loans, differences in tax rates, and investments in location factors that are at least partly funded by the national government within integrated regional policy programs. The states have their own support programs comprised of monetary incentives and soft measures, such as investment promotion agencies. However, they are smaller and not comparable across all districts.
Regional policy programs in Germany are either designed in a place-based or a place-neutral way. Place-based regional policy programs in Germany aim mainly at the equalisation of regional disparities and, thus, focus on economically lagging regions. These regions are favoured by the respective programs in three ways: (1) they receive a disproportionately high share of the total amount of public funds, (2) the intensity of the public funds as a share of total investment costs can be higher or even restricted to a sub-set of German districts, and (3) only regions in East Germany benefit from investment grants that are provided on an individual basis under the investment grant act (In German: Investitionszulagengesetz), in addition to public funds allocated within integrated regional policy programs.
Place-neutral regional policy programs include measures to increase the competitiveness of the German economy in general. They are provided for innovation projects, entrepreneurship, and collaborative projects. The spatial distribution of the funds in these programs is the result of the number of eligible proposals received rather than a predetermined spatial allocation of funds to particular regions.
In East Germany, the share of investment grants could reach 35% of the total investment for large firms and 50% for SMEs. Investments that received a particularly high amount of incentive-based funding include the semiconductor industry in Dresden and the chemical industry in Saxony-Anhalt. The investment grant provided for the semiconductor plant AMD Fab 36 in Dresden in 2003 illustrates the quantitative importance of public funds in East Germany [30]. The total investment amounted to EUR 2.8 billion of which EUR 2.4 billion were eligible for public support. The German government applied for permission to provide an investment grant that covers 22.67%, or approximately EUR 550 million, of AMD’s total investment. The funding was provided by a combination of funds from the major integrated regional policy program of Germany (GRW, Joint Agreement for the Improvement of Regional Economic Structures), an individual investment grant based on the investment grant law, and a bank guarantee.
Few studies have analysed the importance of regional policy for location decisions of firms in Germany. The Ifo Institute [30] has identified three studies that are based on company surveys [31,32,33]. These studies indicate that financial incentives are of average or minor importance for location decisions. However, they expect that surveys underestimate the importance of financial incentives because firms might fear appearing uncommitted to the location. Although these studies covered both domestic and foreign investors, an additional survey among 42 foreign investors in East Germany [30] revealed two distinct groups of MNCs. The first group (38%) reported that financial incentives are decisive in their investment decision, and the second group (57%) considers them to be of minor importance. Few firms indicated that economic incentives are important but not decisive (5%) compared with other location factors covered by the survey. These findings are also supported by the research conducted by Bochow [34]. Surveying foreign affiliates in the automotive industry, Bochow found the availability of investment incentives to be one of the main motives for investment in East Germany, in addition to the availability of skilled labour and relatively low wages and production costs.
The lack of systematic quantitative empirical evidence on the effect of incentive-based and capacity-building policy programs on FDI location choices and the difficulty of using company surveys to obtain this information support this study’s approach, which analyses regularities in the observable location choice behaviour of MNCs.
3. Data and Methodology
3.1. Greenfield Investments in Germany
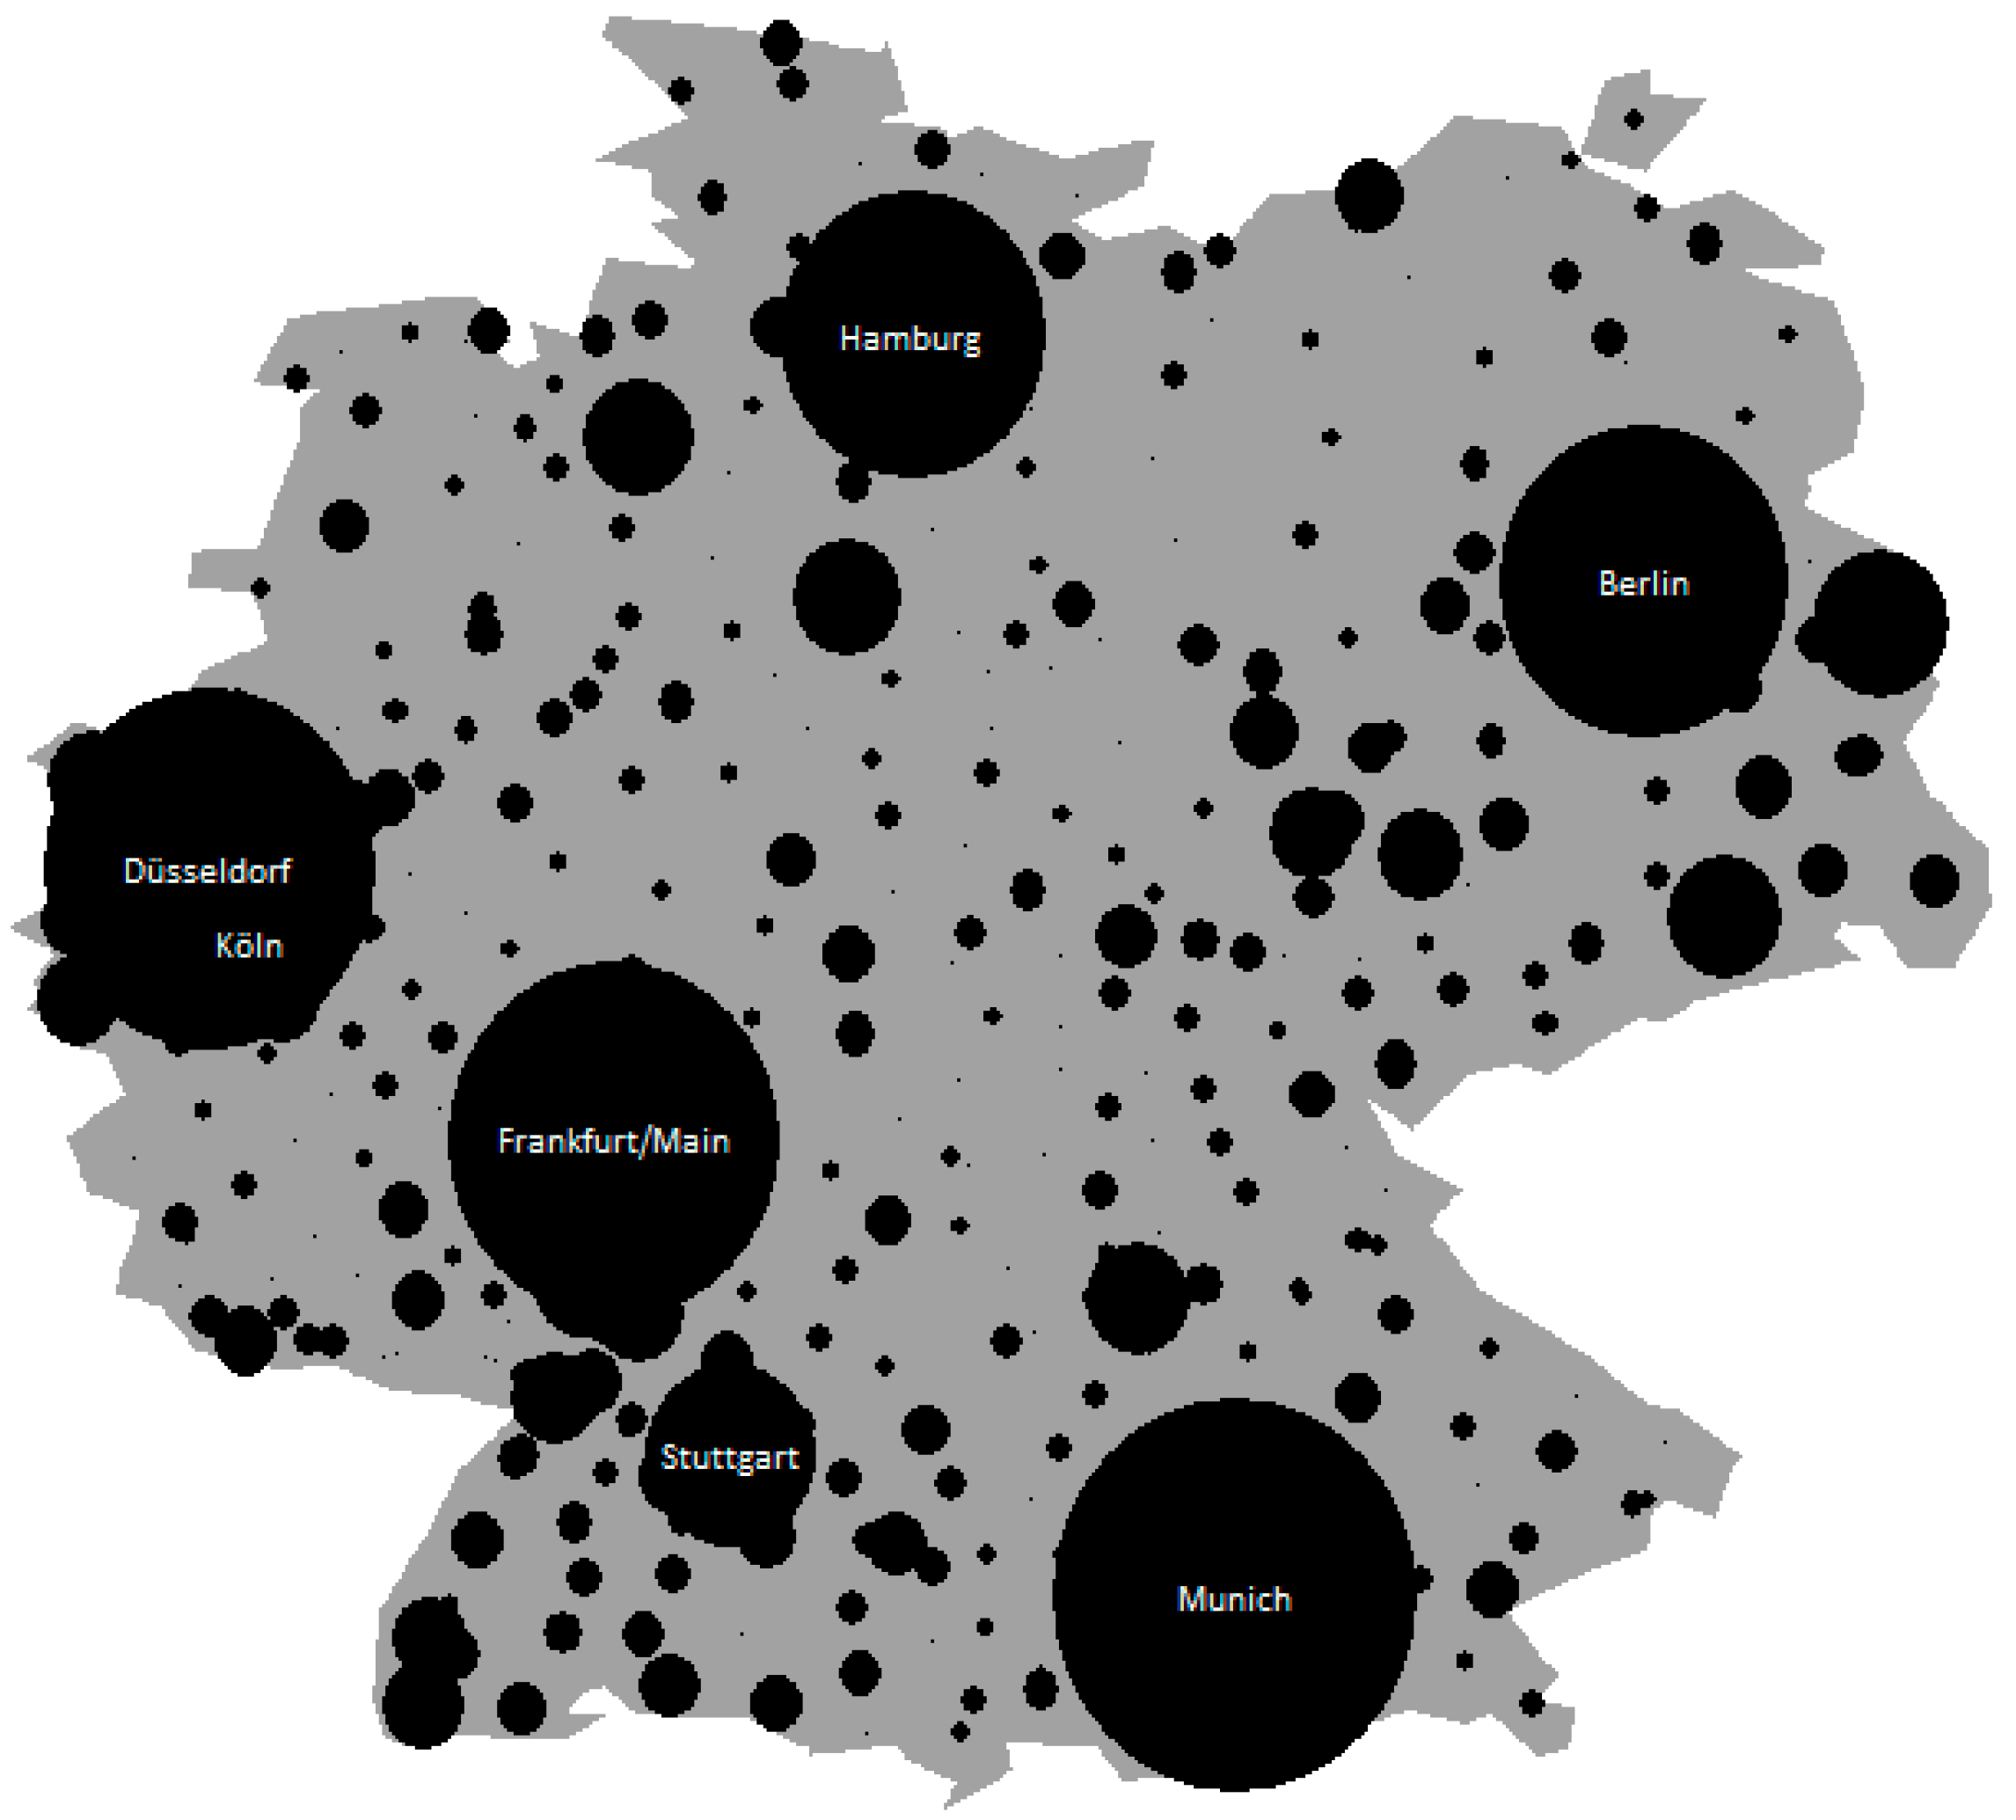
We utilised a spatially detailed register of foreign investment (fDI Markets 2012 [35]) to analyse how regional development policy affects MNCs’ investment decisions. More specifically, we focused on the number of investments in 412 German districts (In German: Kreise) from 2003 to 2010. fDI Markets is a monitor of foreign investment that has recorded most of the global project-based flows (i.e., new projects, expansions, and relocations). These data are collected based on formal announcements by the media, financial information providers, industry organisations, and market and publication companies. All projects are cross-referenced with multiple sources, and 90% of all investment projects are validated with company sources. No official minimum investment size exists, although investment projects creating fewer than 10 full-time jobs or involving a total investment of less than USD 1 million are rare. Presently, the fDI Markets database is the most important source of FDI project data for the large FDI statistics organisations, such as the United Nations Conference on Trade and Development (UNCTAD), the Economist Intelligence Unit (EIU), and the World Bank. Overall, the fDI Markets database contains 3519 investments in Germany by MNCs. Of these investments, 3470 (98.6%) include detailed information about the district where the investment was made. Figure 1 demonstrates that greenfield investments are distributed evenly across districts. Most strikingly, the top 5 districts (i.e., München, Stuttgart, Frankfurt am Main, Berlin, and Hamburg) attract more than 40% of all investment projects. Approximately 75% of all districts have received fewer than five investments during the period under study.
Most investments in Germany are made by MNCs based in the United States (29%), United Kingdom (9%), France (7%), Japan (6%), Switzerland (6%), and the Netherlands (6%). Table 1 displays the distribution of investments across broad economic sectors and functions. Most investments in Germany were made in the financial services (21%) and low-tech manufacturing (18%) sectors. The distribution of investments across broad economic functions (i.e., the stage or activity within the value chain of the firm) displayed in Table 1 reveals a strong concentration of investments in sales and marketing offices (36%), production plants (20%), and business services (17%). Fewer headquarters and R&D facilities are established.
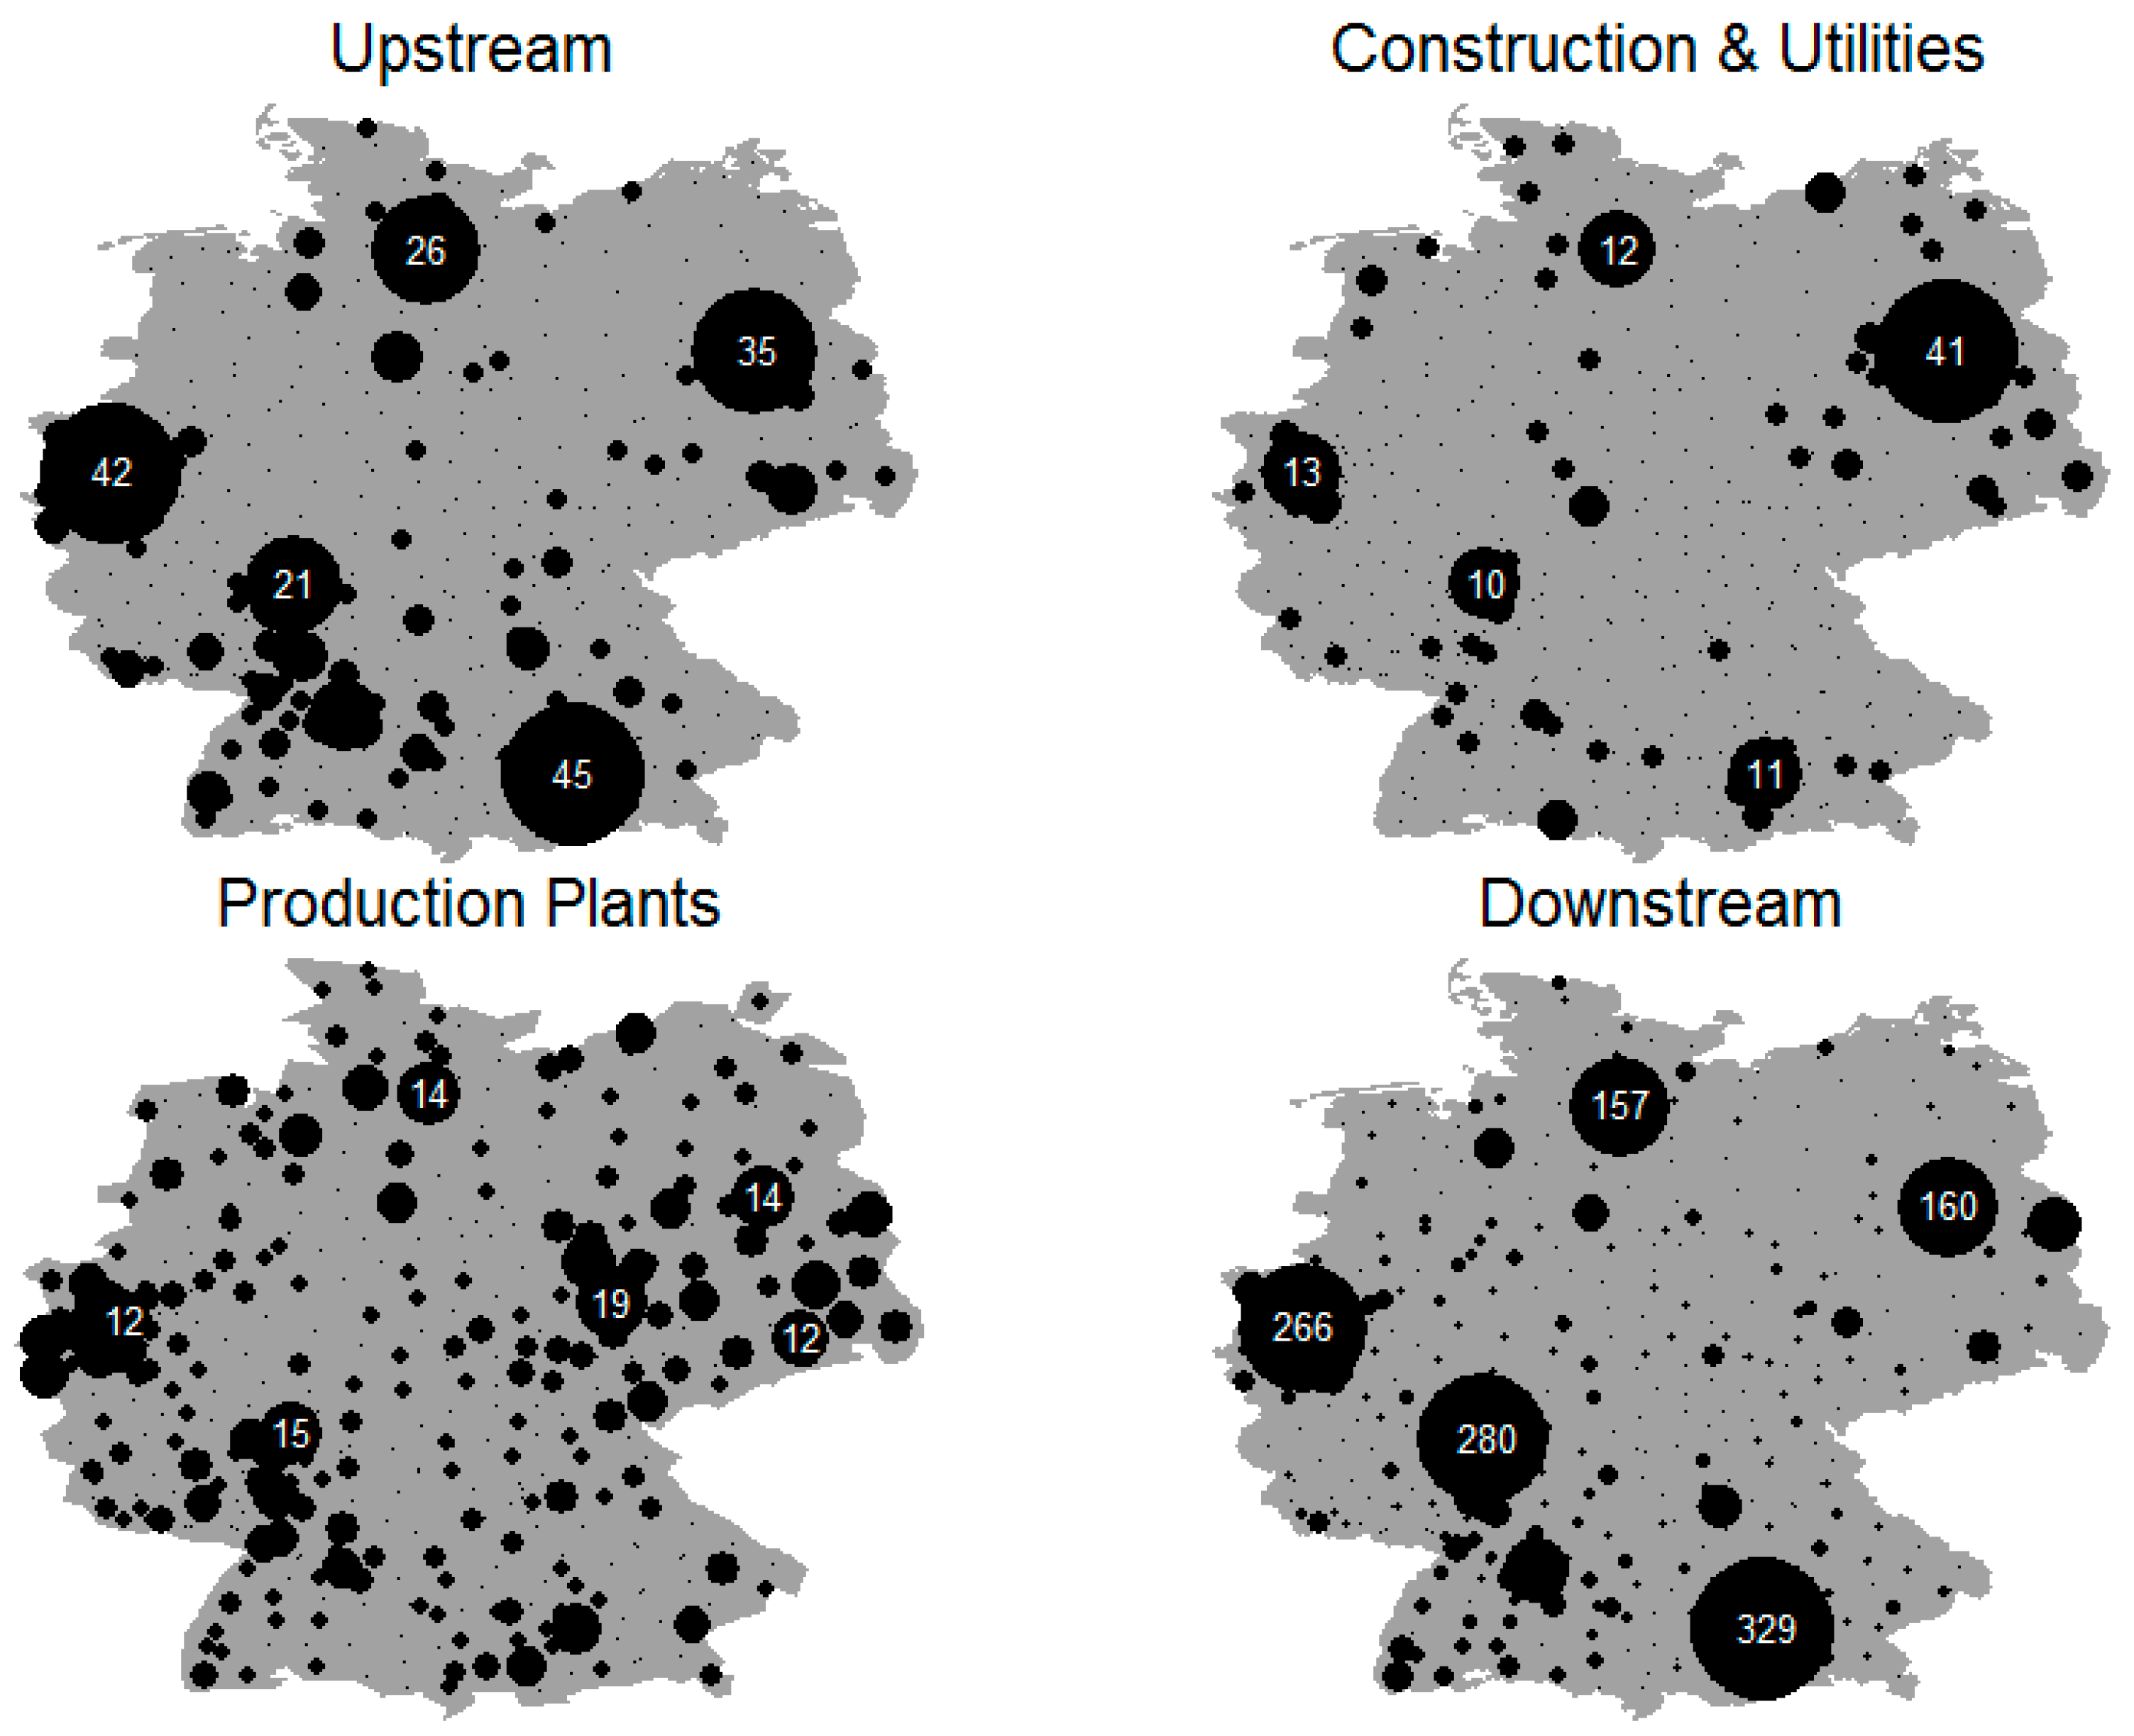
This study focused on which functions public funds attract by using information about the economic activities pursued by MNCs. These functions can be linked to the quality of the investment made and to the various motivations MNCs have to invest abroad. Building on earlier research by Defever [37] and Spies et al. [38], we grouped the economic functions into four different categories: upstream activities (i.e., management and R&D), construction and utilities, and production plants and downstream activities (i.e., business services, sales and marketing, support functions, and logistics). A more detailed overview of the functions included each category can be found in Appendix A (Table A1). Figure 2 displays the spatial distribution of the investments in each function across Germany. Not surprisingly, upstream activities and services operations tend to be concentrated in the large West German cities, whereas downstream functions tend to be concentrated in the Ruhr-area, Rhein-Main area, and Southern Germany. Production facilities and construction are more evenly distributed throughout the country and, in contrast with the other functions, are frequently located in East Germany (see also Spies et al. [38]).
3.2. Regional Policy Expenditures in German Districts
To examine the relationship between regional policy and the number of greenfield investments in German districts, we used data on public funds that have a potential impact on regional development (in German: raumwirksame Mittel) from the INKAR database of the Institute for Research on Building, Urban Affairs and Spatial Development (BBSR), which includes the amount of public funds differentiated by policy programs that each German district received. We have information on public funds from 1996 to 2004 and from 2005 to 2010. The first period occurred mostly before the period when we observed greenfield investments, and the second period corresponds with our observations of greenfield investments.
Figure 3 indicates the distribution of regional policy funding across Germany. The regions that receive the most public funds from place-based and place-neutral policies are districts in East Germany and, to a lesser extent, regions in West Germany that border former socialist states, old industrial regions that hosted mining and steel production facilities (i.e., Ruhr area and Saarland), and coastal regions.
Table 2 indicates the average annual public fund expenditures per inhabitant used in our analysis and distinguishes between the type of public fund (i.e., incentive-based versus capacity-building and place-based versus place-neutral), the time period, and the region (West versus East). Overall, the intensity of public funds per inhabitant is higher in East Germany than in West Germany. However, the differences between the eastern and western part of the country decrease over time. The increase in the total public funds intensity over time is explained by the expansion of labour market subsidies in the aftermath of the global economic and financial crisis, although most other programs recently received less funding.
The incentive-based programs are comprised of public funds for which foreign investors can apply when they invest in a new site in Germany. Two programs are place-based policies that focus on lagging regions. The Joint Agreement for the Improvement of Regional Economic Structures (GRW Gewerbliche Wirtschaft) provides investment grants and includes EU structural funds that are co-financed by the GRW, and the Regional Program of the European Recovery Program (ERP Regionalprogramm) provides loans at low interest rates to firms in East Germany. No data are available about additional investment grants provided under the investment grant law, but these grants are often provided in combination with funds from the GRW, and thus we expect that they follow similar spatial patterns. The place-neutral programs support innovation projects (KfW Innovationsprogramme), SMEs and entrepreneurship (KuM-Förderung), or environmental protection and efficiency (KfW- und ERP-Umweltprogramme) and renewable energy (KfW-Erneuerbare Energien).
The capacity-building-based programs include programs that focus on public infrastructure (GRW Infrastruktur and KfW-Infrastrukturprogramm) and that provide funding to local authorities and public enterprises in the form of grants and loans. The GRW Infrastruktur program is also place-based. The capacity-building programs aim to increase innovation and collaboration by providing support to firms that are already present in the region (Direkte Projektförderung), investing in university buildings (GA Hochschulbau), creating jobs and worker training opportunities (Arbeitsmarktpolitische Hilfen), and improving urban centres (Städtebauförderung). These latter programs tend to be place-neutral.
Based on the overview of regional programs in Table 2, we applied different measurements to cover public funds in our analysis. In addition to the total amount of public funds from 1996 to 2010, we differentiated between incentive- and capacity-building-based public funds. We used the incentive-based public funds from 2005 to 2010 because investment grants from the past are not relevant for investments today. For capacity-building-based public funds, we used the amount of public funds from 1996 to 2010 because we expected that at least some effects of the increase in public expenditures on infrastructure, networks, and workers would unfold over time. In addition, we analysed the impact of place-based and place-neutral incentive-based public funds and infrastructure investments separately from the effects of other capacity building-related public funds. A limitation of these measures is that the funding data we have are only available for certain periods instead of individual years, and hence we could not really examine how sensitive our findings are to the omission and incorporation of specific years.
3.3. Control Variables
Finally, we controlled for several factors that may moderate the relationship between regional development policies and greenfield FDI in German districts. We considered three types of variables related to the attractiveness of districts which we derived from the international economics and international business literature [3,6,7]: (1) demand factors, which are related to horizontal foreign direct investment and market-, resource-, and asset-seeking motives; (2) supply factors, which are related to vertical foreign direct investment as well as to efficiency and asset-seeking motives; and (3) external economies and imitation behaviour. All variables were average values for the period from 2003 to 2011 and were measured at either the district (Kreise; NUTS-3) or regional level (Regierungsbezirke; NUTS-2). Descriptive statistics of the variables that were included in the analysis can be found in Table 3.
3.3.1. Demand Factors
With respect to the demand factors, we included measures related to market accessibility and GDP per capita. Market accessibility was captured by means of the gross domestic product (GDP) in the district and by an accessibility indicator. With respect to the accessibility indicator, we included potential accessibility to the population by road, rail, and air (multimodal) from the ESPON research reported in Spiekermann and Wegener [39]. The potential accessibility is based on the assumption that the attraction of a location increases with the size of the area and decreases with distance to other attractive locations. In addition, we included GDP per capita as an indicator of the district’s development level and the growth in GDP (2000–2009) to account for the growth potential of a district.
3.3.2. Supply Factors
We included measures related to the costs of production. Most notably, these included labour, land, and capital costs. With respect to labour costs, we included two predictor variables. Unit wage costs were estimated at the regional (NUTS-2) level as the average wage per hour worked and were obtained from the Cambridge Econometrics database. However, as rightly noted by Head and Mayer [19], wages do not represent the only labour costs. The functioning of the labour market and the non-wage labour costs also add to the costs of labour. We measured the functioning of the labour market by the level of education in the region, calculated as the percentage of the workforce that is highly qualified, as an indicator of the efficiency of the labour force. Land costs were measured as the prices of building land per square meter. The costs of capital were captured by taxes. The tax rate was measured as the corporate tax percentage rate at the district level.
3.3.3. External Economies
To account for external economies, we included population density, measured as the number of inhabitants of a district per square meter. In addition, MNCs can be attracted to places where substantial economic activity is already located. Accordingly, we included two variables: value of the capital stock and a dummy variable indicated whether a Top-500 (i.e., Forbes magazine list) multinational was already located in the district.
3.4. Empirical Strategy
To analyse the number of investments in German districts, we used a count data model, which is common practice in the analysis of firm location choices [40,41]. Perhaps the most frequently used regression model to analyse count data is the Poisson model. Applying a Poisson model, the number of corporate investments Iij in a district i nested in NUTS-2 region j has a Poisson distribution with a conditional mean (μij) that is a function of a set of independent variables (1). Because we assume that Ii only takes a non-negative integer value, the exponential of the independent variables is taken, so that μij must either be zero or positive. More formally,
in which the conditional mean μi is linked to an exponential function of a set of explanatory variables (2)
where α0 is a proportionality constant, Xi and Xij, with corresponding parameters β and γ, and 1 × k row vectors of independent variables are related to the Kreise (NUTS-3) characteristics and Regierungsbezirke (NUTS-2) characteristics, respectively.
The Poisson regression assumes equidispersion. This means that the conditional variance should be equal to the conditional mean. However, the conditional variance is often higher than the conditional mean, which signifies that the dependent variable is overdispersed. Not correcting for overdispersion typically leads to inefficient estimation of the dependent variable, which is exemplified by spuriously large z-values and spuriously small p-values due to downward biased standard errors [40,42]. Using a negative binomial regression model can correct this distortion. Different from the Poisson model, the negative binomial model includes an additional parameter, which captures the degree of overdispersion. More formally,
where , Γ is the gamma function, and α is a parameter that determines the degree of dispersion in predictions, allowing the conditional variance to exceed the conditional mean. The larger α is, the larger the degree of overdispersion in the data; if α is zero, the negative binomial regression model reduces to the Poisson regression. The estimated negative binomial model focuses on the average global effect of public funds on the number of greenfield investments that are made in a district. Although the average effect can be a useful benchmark for general statements about the effectiveness of public funds, it may not reflect the actual marginal effect for all districts [43,44]. In our case, spatial variation with respect to the effects of regional policy may be expected because districts vary in structure, social context, and history. German districts have a clear East–West divide, with the lagging regions located in the east. Public funds are less important for location decisions when local conditions are favourable in terms of demand and supply factors and external economies. Accordingly, we would expect a larger marginal effect of public funds on the location choice of multinationals in East Germany. On a similar note, public funds are more likely to help attract economic activities with less specific location requirements (e.g., production plants) than economic activities with very specific location requirements (e.g., R&D and headquarters facilities). MNCs are constrained in their location choices by local resource availability, and not all locations are suitable for all types of investments because they lack the appropriate specialised location advantages [4,45]. Alternatively, it can be hypothesised that the effect of public funds on attracting greenfield investments is higher for those districts which fulfil the minimum location requirements of hosting these economic activities.
One means of addressing spatial heterogeneity in economic processes is geographically weighted regression analysis (GWR) [46,47], which captures spatial variation in regression coefficients by including a spatial weight matrix in the estimation of the model. Here, the spatial weight matrix represents connectivity effects based on the physical distance between districts. For a district i, a separate regression is estimated in which the sample is composed of districts within a given distance. In this, districts that are spatially proximate receive more weight in the regression for district i than districts located further away. Within the context of a negative binomial regression model, this would mean that for each district i nested in region j the conditional mean is specified as:
where the ij subscripts on the parameters indicate that a separate set of parameters exists for each district. At the same time, spatial weighting smooths the spatial variation in parameters, revealing only broad regional differences in the local marginal effects. The result is a set of parameter estimates for each district. In our case, this would mean the estimation of 412 different regression models, producing more than 5000 parameter estimates. A more detailed discussion about geographically weighted regression and its usefulness for assessing differences in regional policy effects can be found in Ali et al. [43] and Partridge et al. [44].
In our empirical results, we first examined the relationship between public funds and greenfield investments using count data models and then turned attention to spatial heterogeneity using geographically weighted regression analysis (Section 4.1). Subsequently, we examined to what extent the effect of public funds on FDI varies across (1) different business activities (Section 4.2) and (2) different type of funds (Section 4.3).
4. Empirical Results
4.1. The Effect of Regional Policy on Greenfield Investments
In this section, we analyse the effect of public funds on the investments in German districts. The information criteria (AIC, BIC) and the significance of the likelihood ratio test of overdispersion indicated that the negative binomial regression model fits the data better than the Poisson regression model. All models were estimated using the sandwich estimator to obtain robust standard errors.
Table 4 presents the estimates for the negative binomial regression model on the number of total number of greenfield investments in German districts. Column 1 considers the empirical results for the basic model excluding public funds. Market size, growth potential, and a highly qualified labour force help to attract MNCs. At the same time, supply factors also affect the location decisions of MNCs: unit wage costs and land costs are negatively related to the number of greenfield investments in a district. The positive and significant effects of population density and capital stock on the number of greenfield investments indicate that MNCs gravitate to districts where substantial economic activity is already located.
Shifting our attention to the main independent variable of interest (Column 2), we find a positive effect of public funds intensity on the location decisions of multinational corporations. Increasing public funds by 1% per inhabitant increases the number of investments in a district by 0.69%, holding everything else constant. The inclusion of the regional policy variable does not significantly affect the other results, except that the multimodal accessibility variable becomes statistically significant, and the education of the workforce variable is no longer statistically significant. Including incentive-based policies in our empirical operationalisation of public funds, based on the argument that greenfield FDI in Germany in 2003 and 2004 might have been affected by incentive-based policies before 2005, does not change results significantly (Column 3).
Considerable spatial heterogeneity exists in the public funds coefficient. We find a positive and significant interaction effect between regional funding intensity and the East Germany dummy (Column 4). This result indicates that whereas regional policies have a positive effect of attracting investments to East German districts, public funds typically have no effect on the number of investments in West German districts. This result may be because East German federal states are often perceived as more closely substitutable than Western federal states [36]. Similarly, the East German federal states may be more suitable for standardised types of investments that do not require specialised location advantages (e.g., production plants) and for which incentive-based policies that reduce the cost of capital and labour play a more important role in the location decision process [29].
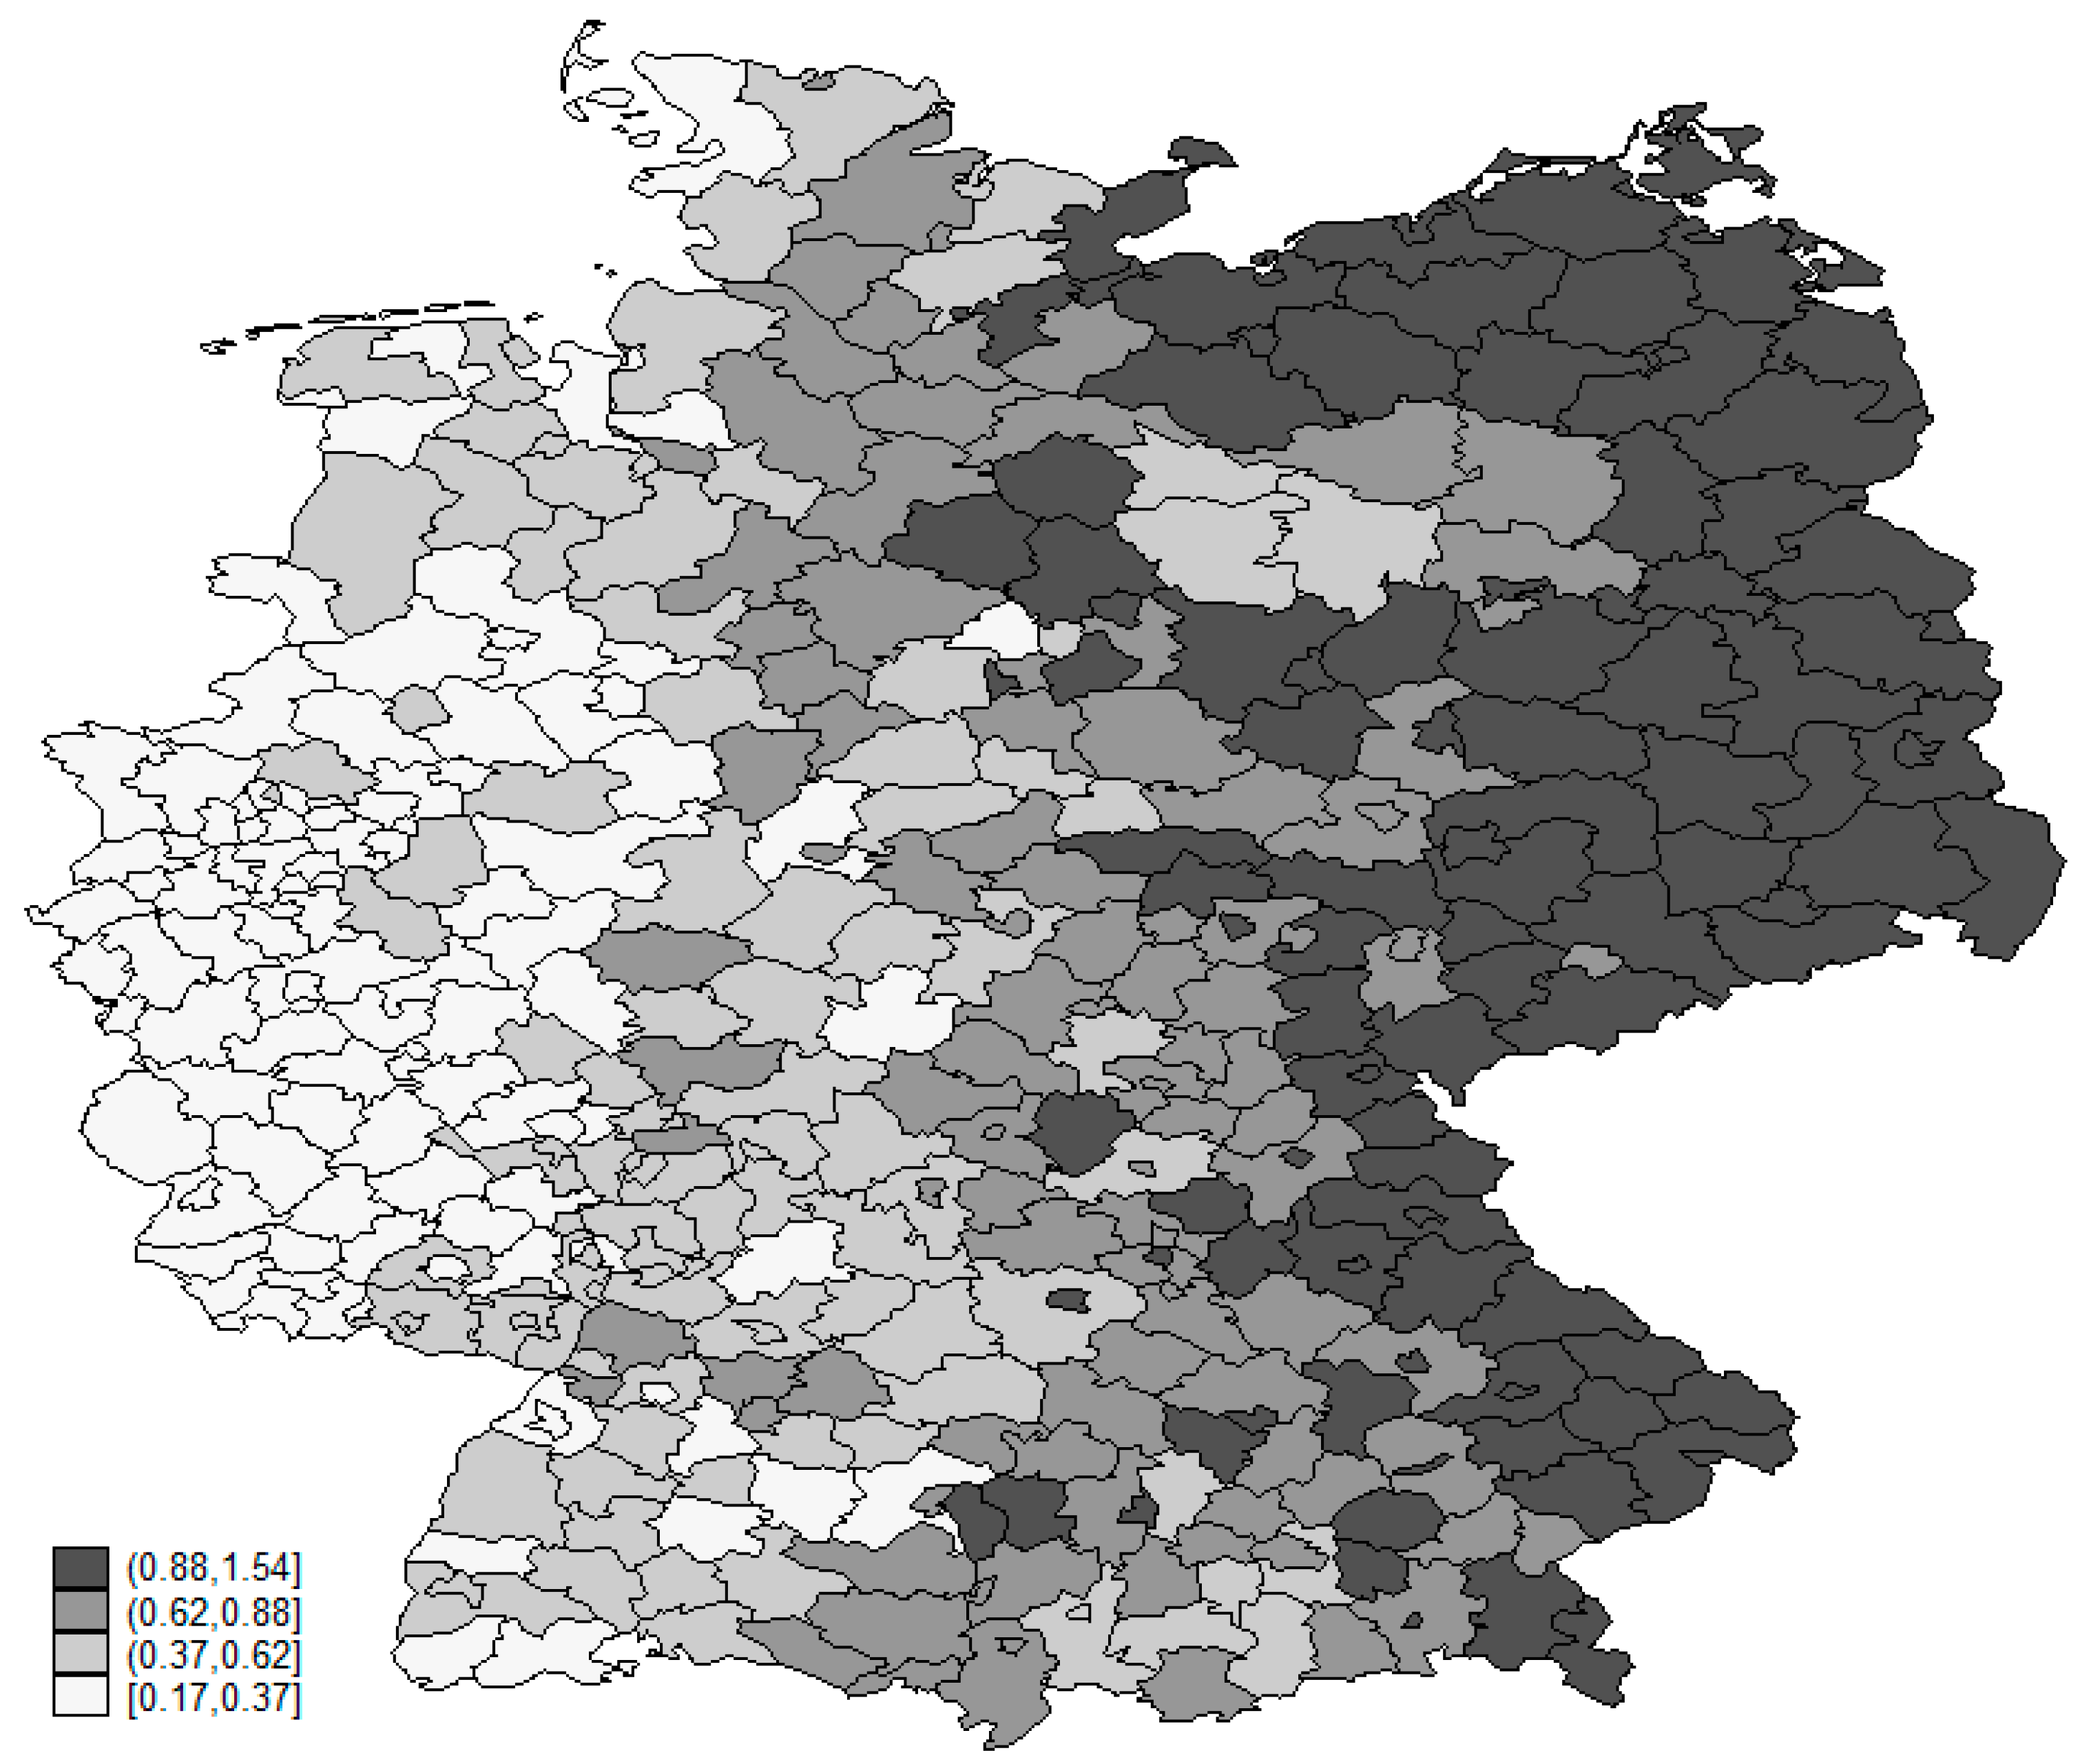
The spatial heterogeneity in the effect of regional policies on attracting greenfield FDI projects is further highlighted by the geographically weighted regressions presented in Table 5, estimated using 1000 Monte Carlo simulations. The estimated coefficients in our geographically weighted regression model range from a minimum of 0.16 to a maximum of 1.54, and Figure 4 indicates that regional policies have the strongest effect on the location choices of MNCs in East Germany.
4.2. Effect of Regional Policies across Economic Functions
Table 6 reports the estimates for the different groups of economic functions. The location choice for upstream and downstream activity is mainly driven by demand factors and the existing agglomeration of economic activity. In comparison with the regressions for the entire sample (Table 2, Column 2), the supply factors are hardly important for upstream and downstream activities, except for business taxes. For these economic functions, the costs of labour and land as well as public funds do not play an important role in the attractiveness of regions for MNCs. On the contrary, the number of greenfield investments in construction and energy and in production facilities is strongly driven by these supply factors.
However, public funds only have a positive and significant effect on the attraction of greenfield FDI for production plants. A 1% increase in the amount of regional public funds increases the number of production facilities in a district by 0.82%. This result indicates that these public funds mainly help attract standardised types of investments that do not require specialised location advantages (e.g., they can rely on low-cost labour and do not need to be located close to customers), but they do require substantial capital investments.
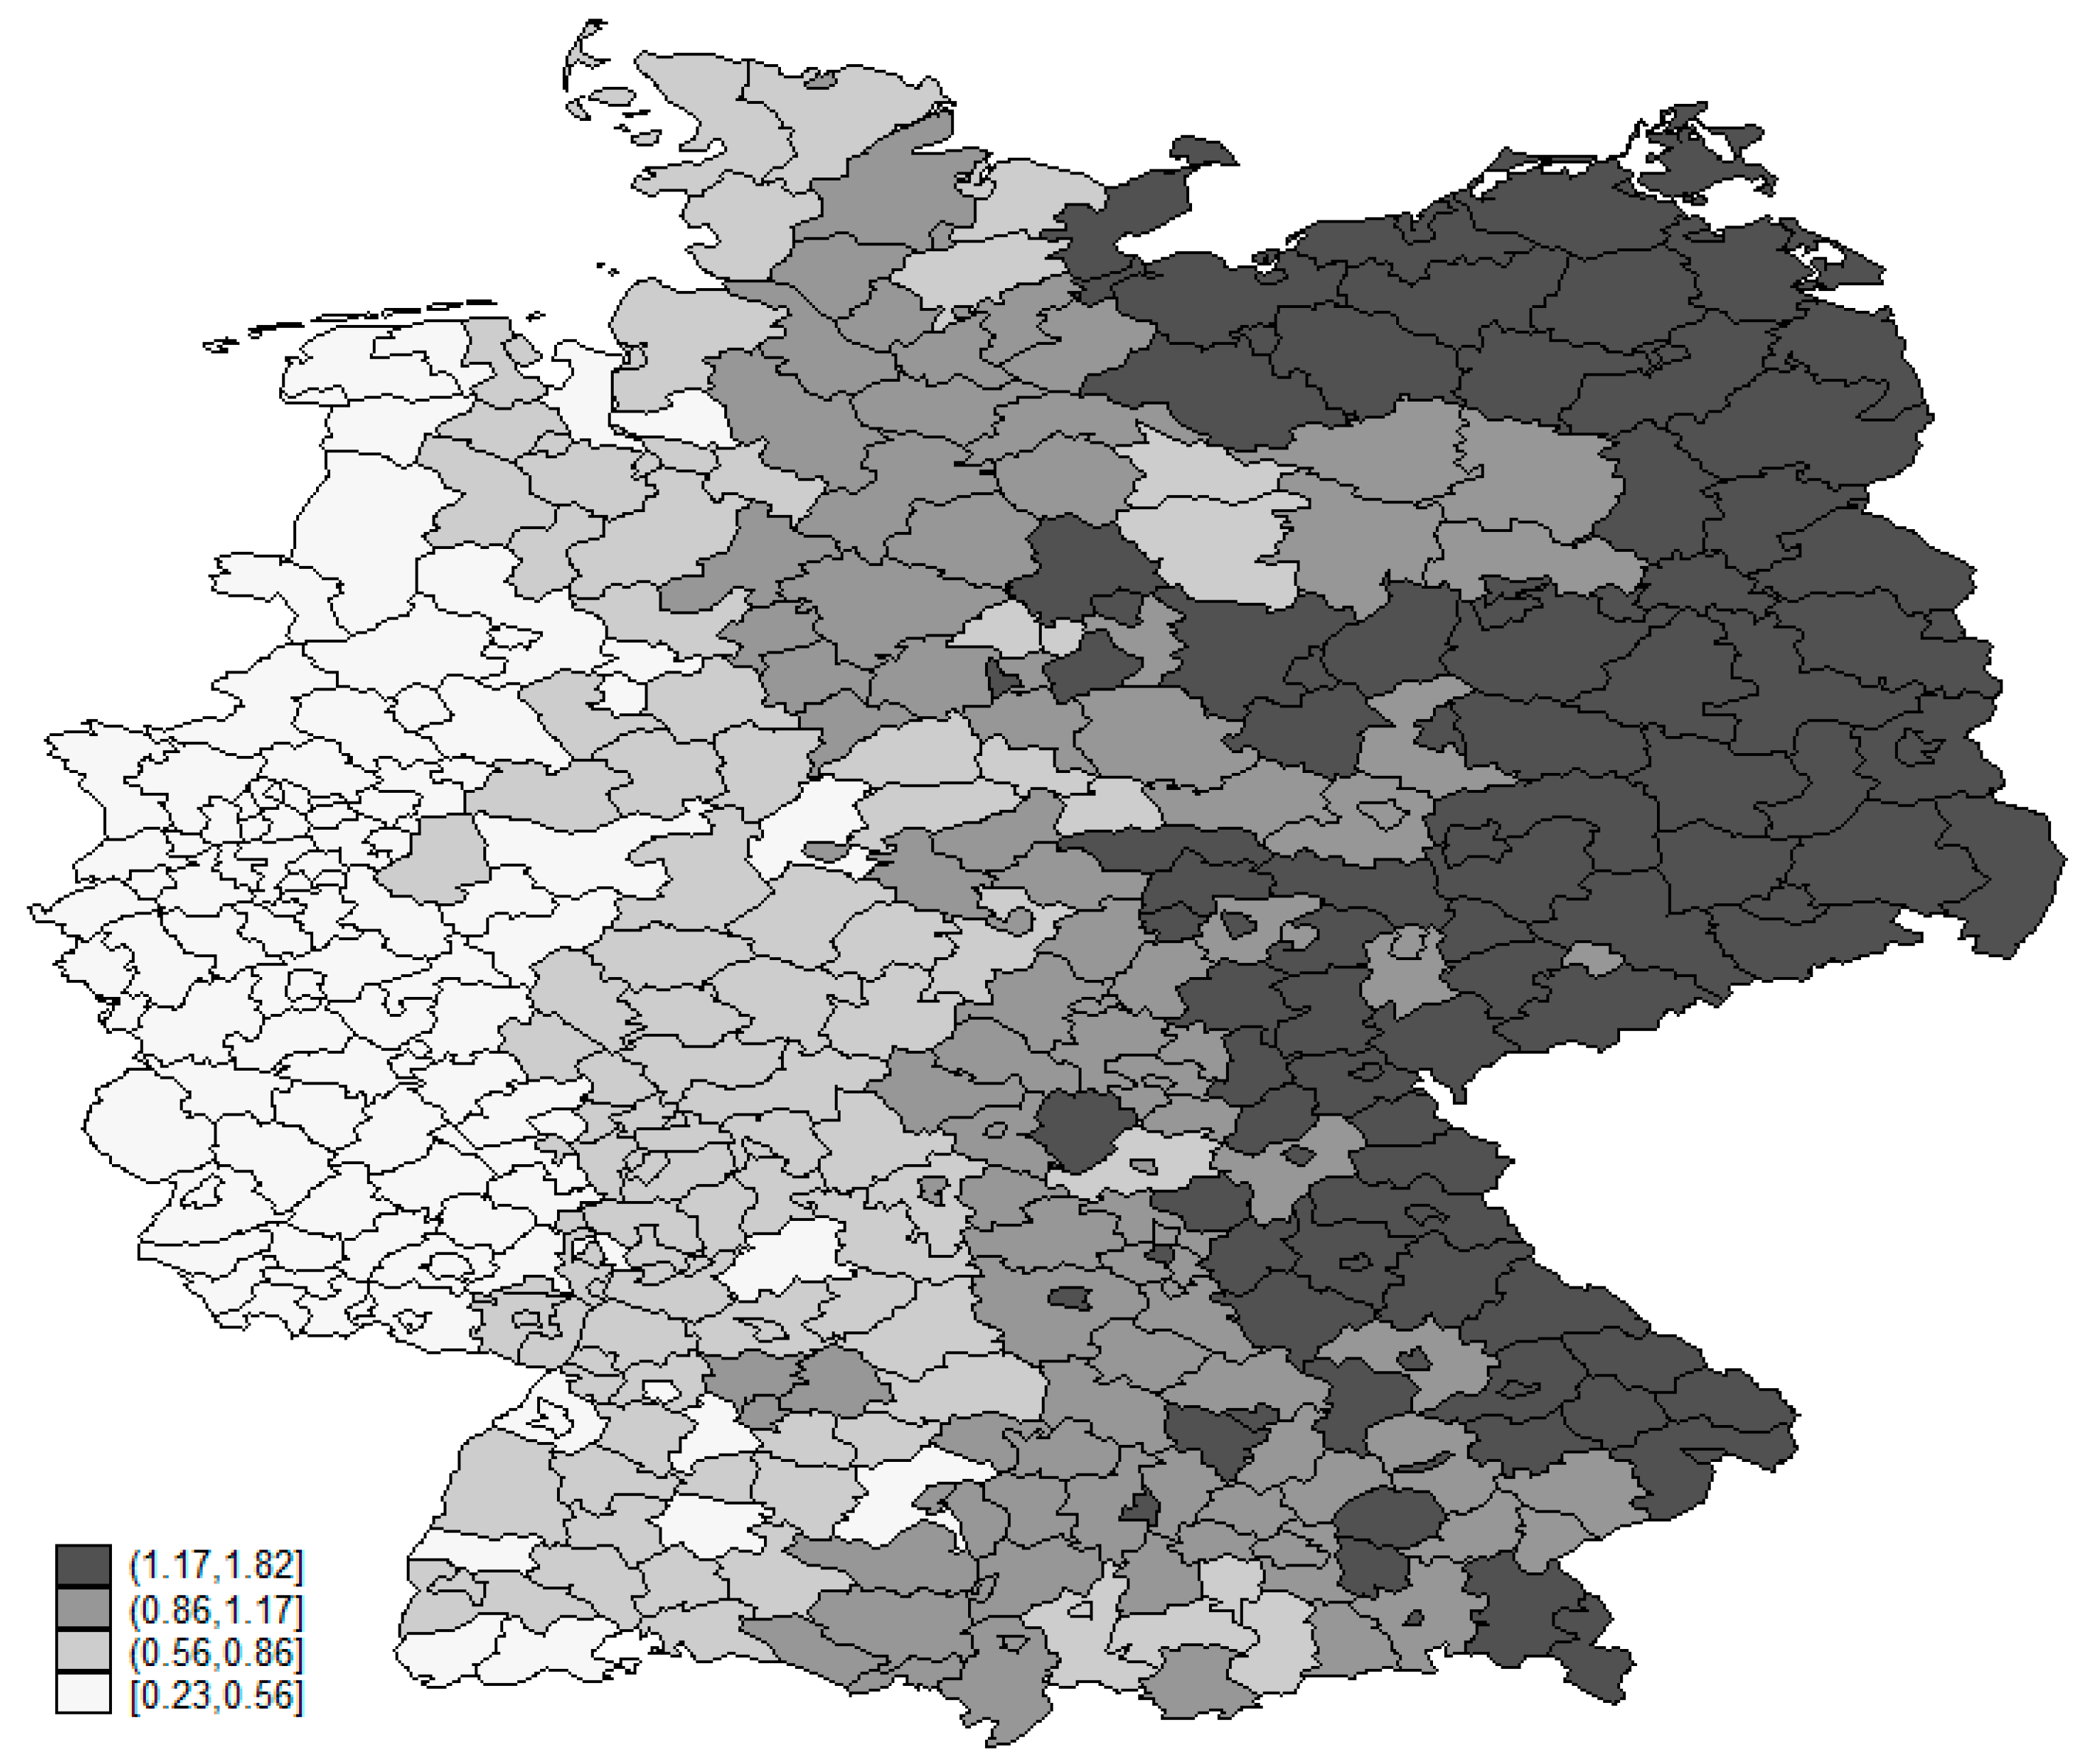
Turning to spatial heterogeneity in the effect of regional public funds on the number of investments, spatial variation in the public funds coefficient is only significant for production facilities, as determined by the Monte Carlo test [47]. The spatial heterogeneity in the effect of regional policies on attracting production plants is indicated by the geographically weighted regressions presented in Figure 5 and Table 7. The estimated coefficients in our geographically weighted regression model range from a minimum of 0.23 to a maximum of 1.82, where again the strongest effect of regional policies on the location choice of MNCs is found in East Germany. These results hold when re-estimating the model using negative binomial estimation and introducing an East German dummy*Public Funds (ln) interaction term.
4.3. Differences across Public Funds
Finally, we examined to what extent different types of public funds have a different effect on the attraction of multinational corporations. Incentive-based and capacity-building public funds have a positive and significant effect on the number of investments a district attracts (Appendix A, Table A2). Consistent with our expectations, place-based policies are instrumental to redistributing greenfield FDI, whereas the effect of place-neutral policies on the spatial distribution of multinational activity appears to be limited (Appendix A, Table A3). Although the effect of place-neutral policy fund expenditures on the number of greenfield investments is positive, the true value of the parameter estimate is too uncertain.
5. Discussion and Conclusions
This study analysed the effect of regional policies on the attraction of multinational corporations to German districts. The results indicate a positive effect of regional policy expenditures on the number of foreign direct investments in German districts. However, results also reveal that incentive-based and capacity-building regional policies mainly allow East German districts to attract greenfield FDI that do not require specialised location advantages but do require considerable physical capital investments. Consistent with our expectations, place-based policies help to redistribute economic activity in favour of lagging regions, whereas the effect of place-neutral policies on the spatial distribution of multinational activity seems to be limited.
Nevertheless, German regional public funds appear to have a limited effect on attracting high-end investments to East Germany in the form of headquarters and R&D facilities or advanced producer services. Because these are the types of investments for which many local and regional authorities aim, this finding raises the question to what extent incentive-based and capacity-building regional policies really promote industrial upgrading. An important limitation of this research in this respect is that we have little information on the quality of the investments made in manufacturing industries beyond subsector and function. However, the German experience seems to differ considerably from the Irish experience around the 2000s, where regions attracted numerous R&D-intensive investments using incentive-based policies [48].
At the same time, local and regional authorities increasingly recognise that greenfield FDI in high-end sectors and functions do not necessarily have to be a catalyst for economic development. On the contrary, attracting FDI that complements the existing industrial structure of a region may be better, such as investments in production plants that improve the technology and skills of the workforce in the case of East German districts. Indeed, research has indicated that subsidiaries that are better embedded in the region are less likely to disappear [26] and that they make a greater development contribution to the regional economy [49]. In this regard, regions’ FDI acquisition strategies can be integrated into the regional economic development strategy.
The fact that East Germany predominantly attracts foreign production facilities is not necessarily harmful for the region’s economic development potential because MNCs can bring new skills and technology. Indeed, recent research on East Germany has indicated the technological superiority of foreign investors in this part of Germany [50]. At the same time, some scholars have suggested that the East German innovation system does not fulfil the expectations of MNCs [51] and that linkages between foreign subsidiaries and the regional innovation system are weak [50]. Additional stimulation of policies that initiate cooperation between MNCs and local businesses could be a fruitful means of stimulating the East German economy. At the same time, local governments should be wary for trying to attract only firms in knowledge-intensive manufacturing, as engaging in the war for talent may predominantly lead to higher wages and fewer jobs due to already existing skill shortages [52].
Author Contributions
Conceptualization, M.J.B., J.S., and D.S.; methodology, M.J.B.; validation, M.J.B., J.S., D.S., and S.S.; formal analysis, M.J.B. and J.S.; data curation, M.J.B. and J.S.; writing—original draft preparation, M.J.B. and D.S.; writing—review and editing, M.J.B., J.S., D.S., and S.S.; visualization, M.J.B. All authors have read and agreed to the published version of the manuscript.
Funding
This research received no external funding.
Institutional Review Board Statement
Not applicable.
Data Availability Statement
The dataset is available upon request from the author for academic purposes ([email protected]).
Conflicts of Interest
The authors declare no conflict of interest.
Appendix A

Table A1.
Taxonomy of Investments by Broad Function.
| Broad Category | Category | Functions |
|---|---|---|
| Upstream | Headquarters R&D | Headquarters Design, Development, and Testing Education and Training Research and Development |
| Construction and Utilities | Construction Electricity | Construction Electricity |
| Production Plants | Production Plants | Manufacturing |
| Downstream | Business Services Sales and Marketing Support and Servicing Logistics | Business Services Retail Sales and Marketing Customer Contact Centres ICT and Internet Infrastructure Maintenance Shared Service Centres Technical Support Centres Logistics, Distribution and Transportation |
Table A2.
Negative Binomial Estimations on Number of Greenfield FDI: Incentive-Based versus Capacity-Building Policies.
Table A2.
Negative Binomial Estimations on Number of Greenfield FDI: Incentive-Based versus Capacity-Building Policies.
| (1) | (2) | (3) | |
|---|---|---|---|
| Incentive- Based | Capacity-Building | Full Model | |
| Incentive-based public funds (ln) | 0.39 * | 0.34 * | |
| (0.155) | (0.151) | ||
| Capacity-building public funds (ln) | 0.76 ** | 0.71 ** | |
| (0.166) | (0.160) | ||
| Local GDP (ln) | 1.10 ** | 1.14 ** | 1.13 ** |
| (0.106) | (0.110) | (0.107) | |
| % Growth Local GDP | 0.01 * | 0.01 | 0.01 |
| (0.007) | (0.008) | (0.008) | |
| Multimodal accessibility (ln) | 0.68 | 0.81 * | 1.05 * |
| (0.379) | (0.338) | (0.376) | |
| Unit wage costs (ln) | −1.81 * | −1.87 * | −1.68 * |
| (0.742) | (0.755) | (0.721) | |
| % Highly educated workforce | 0.08 ** | 0.02 | 0.02 |
| (0.028) | (0.032) | (0.030) | |
| Land costs (ln) | −0.53 ** | −0.26 | −0.26 |
| (0.126) | (0.141) | (0.134) | |
| % Business tax | −0.09 * | −0.10 ** | −0.08 ** |
| (0.037) | (0.035) | (0.034) | |
| Population density (ln) | 0.45 ** | 0.21 | 0.27 * |
| (0.115) | (0.110) | (0.118) | |
| Capital (ln) | 0.41 ** | 0.43 ** | 0.41 ** |
| (0.105) | (0.108) | (0.104) | |
| Presence Top-500 MNC | 0.20 | 0.14 | 0.21 |
| (0.160) | (0.164) | (0.156) | |
| Observations | 412 | 412 | 412 |
| McFadden’s R2 | 0.212 | 0.216 | 0.219 |
| LR test of alpha | 688 ** | 730 ** | 703 ** |
| AIC | 4.62 | 4.60 | 4.59 |
| BIC | −525 | −532 | −533 |
Robust standard errors in parentheses; ** p < 0.01, * p < 0.05.
Table A3.
Negative Binomial Estimations on Number of Greenfield FDI: Incentive-Based versus Capacity-Building Policies.
Table A3.
Negative Binomial Estimations on Number of Greenfield FDI: Incentive-Based versus Capacity-Building Policies.
| (1) | (2) | (3) | |
|---|---|---|---|
| Place- Based | Place- Neutral | Full Model | |
| Place-based public funds (ln) | 0.39 ** | 0.39 ** | |
| (0.068) | (0.069) | ||
| Place-neutral public funds (ln) | 0.39 | 0.19 | |
| (0.211) | (0.183) | ||
| Local GDP (ln) | 1.08 ** | 1.11 ** | 1.09 ** |
| (0.105) | (0.109) | (0.105) | |
| % Growth Local GDP | 0.01 | 0.02 * | 0.01 |
| (0.007) | (0.007) | (0.007) | |
| Multimodal accessibility (ln) | 0.92 ** | 0.65 | 1.03 ** |
| (0.346) | (0.376) | (0.364) | |
| Unit wage costs (ln) | −1.50 * | −2.00 * | −1.48 * |
| (0.709) | (0.779) | (0.706) | |
| % Highly educated workforce | 0.05 * | 0.07 * | 0.04 * |
| (0.025) | (0.032) | (0.026) | |
| Land costs (ln) | −0.23 * | −0.50 ** | −0.22 * |
| (0.117) | (0.136) | (0.116) | |
| % Business tax | −0.10 ** | −0.10 ** | −0.10 ** |
| (0.034) | (0.037) | (0.033) | |
| Population density (ln) | 0.25 ** | 0.39 ** | 0.25 ** |
| (0.096) | (0.108) | (0.096) | |
| Capital (ln) | 0.43 ** | 0.43 ** | 0.43 ** |
| (0.103) | (0.108) | (0.104) | |
| Presence Top-500 MNC | 0.16 | 0.16 | 0.18 |
| (0.158) | (0.167) | (0.158) | |
| Observations | 412 | 412 | 412 |
| McFadden’s R2 | 0.221 | 0.210 | 0.221 |
| LR test of alpha | 588 ** | 718 ** | 582 ** |
| AIC | 4.57 | 4.63 | 4.58 |
| BIC | −545 | −519 | −539 |
Robust standard errors in parentheses; ** p < 0.01, * p < 0.05.
References
- Dunning, J.H. Multinational Enterprises and the Global Economy; Addison Wesley: Boston, MA, USA, 1993. [Google Scholar]
- Globerman, S.; Chen, V.Z. Best Policy Practices for Promoting Inward and Outward Foreign Direct Investment; The Conference Board of Canada: Ottawa, OR, Canada, 2010. [Google Scholar]
- Buckley, P.J.; Clegg, L.J.; Cross, A.; Liu, X.; Voss, H.; Zheng, P. The determinants of Chinese outward foreign direct investment. In Foreign Direct Investment, China and the World Economy; Palgrave Macmillan: New York, NY, USA, 2009; pp. 81–118. [Google Scholar]
- Mataloni, R.J. The structure of location choice for new U.S. manufacturing investments in Asia-Pacific. J. World Bus. 2011, 46, 154–165. [Google Scholar] [CrossRef]
- Midelfart-Knarvik, K.H.; Overman, H.G. Delocation and European integration: Is structural spending justified? Econ. Policy 2002, 17, 321–359. [Google Scholar] [CrossRef]
- Basile, R.; Castellani, D.; Zanfei, A. Location choices of multinational firms in Europe: The role of EU cohesion policy. J. Int. Econ. 2008, 74, 328–340. [Google Scholar] [CrossRef]
- Crozet, M.D.; Mayer, T.; Mucchielli, J.-L. How do firms agglomerate? A study of FDI in France. Reg. Sci. Urban Econ. 2004, 34, 27–54. [Google Scholar] [CrossRef] [Green Version]
- Wren, C.; Jones, J. Assessing the Regional Impact of Grants on FDI Location: Evidence from U.K. Regional Policy, 1985–2005. J. Reg. Sci. 2010, 51, 497–517. [Google Scholar] [CrossRef]
- Editors, G.; Tavares, A.T.; Young, S. FDI and multinationals: Patterns, impacts and policies. Int. J. Econ. Bus. 2005, 12, 3–16. [Google Scholar] [CrossRef]
- De Propris, L.; Driffield, N. local industrial systems and the location of FDI in Italy. Int. J. Econ. Bus. 2005, 12, 105–121. [Google Scholar] [CrossRef]
- Phelps, N.A.; Raines, P. The New Competition for Inward Investment: Companies, Institutions and Territorial Development; Edward Elgar Publishing: Cheltenham, UK, 2003. [Google Scholar]
- Burger, M.J.; Van Der Knaap, B.; Wall, R. Revealed competition for greenfield investments between European regions. J. Econ. Geogr. 2012, 13, 619–648. [Google Scholar] [CrossRef] [Green Version]
- Barca, F.; McCann, P.; Rodríguez-Pose, A. The Case for Regional Development Intervention: Place-Based Versus Place-Neutral Approaches. J. Reg. Sci. 2012, 52, 134–152. [Google Scholar] [CrossRef]
- Hymer, S.H. The International Operations of National Firms: A Study of Foreign Direct Investment; MIT Press: Cambridge, MA, USA, 1976. [Google Scholar]
- McCann, P.; Mudambi, R. The Location Behavior of the Multinational Enterprise: Some Analytical Issues. Growth Chang. 2004, 35, 491–524. [Google Scholar] [CrossRef]
- Dunning, J.H. The eclectic paradigm as an envelope for economic and business theories of MNE activity. Int. Bus. Rev. 2000, 9, 163–190. [Google Scholar] [CrossRef]
- Guimaraes, P.; Figueiredo, O.; Woodward, D. Agglomeration and the Location of Foreign Direct Investment in Portugal. J. Urban Econ. 2000, 47, 115–135. [Google Scholar] [CrossRef] [Green Version]
- Mccann, P.; van Oort, F. Theories of agglomeration and regional economic growth: A historical review. In Handbook of Regional Growth and Development Theories: Revised and Extended Second Edition; Edward Elgar Publishing: Cheltenham, UK, 2019; pp. 6–23. [Google Scholar]
- Head, K.; Mayer, T. Market Potential and the Location of Japanese Investment in the European Union. Rev. Econ. Stat. 2004, 86, 959–972. [Google Scholar] [CrossRef]
- Lall, S.; Narula, R.; Bellak, C. EU enlargement and consequences for FDI assisted industrial development. Transnatl. Corp. 2009, 18, 69–89. [Google Scholar] [CrossRef] [Green Version]
- Daniele, V.; Marani, U. Organized crime, the quality of local institutions and FDI in Italy: A panel data analysis. Eur. J. Polit. Econ. 2011, 27, 132–142. [Google Scholar] [CrossRef]
- Daude, C.; Stein, E. The Quality of Institutions and Foreign Direct Investment. Econ. Polit. 2007, 19, 317–344. [Google Scholar] [CrossRef]
- Blomström, M.; Kokko, A.; Mucchielli, J.-L. The Economics of Foreign Direct Investment Incentives. In Foreign Direct Investment in the Real and Financial Sector of Industrial Countries; Springer: Berlin/Heidelberg, Germany, 2003; pp. 37–60. [Google Scholar]
- Tewdwr-Jones, M.; Phelps, N.A. Levelling the Uneven Playing Field: Inward Investment, Interregional Rivalry and the Planning System. Reg. Stud. 2000, 34, 429–440. [Google Scholar] [CrossRef]
- Urok, I.T. Cities, Regions and Competitiveness. Reg. Stud. 2004, 38, 1069–1083. [Google Scholar] [CrossRef]
- Phelps, N.A.; MacKinnon, D.; Stone, I.; Braidford, P. Embedding the Multinationals? Institutions and the Development of Overseas Manufacturing Affiliates in Wales and North East England. Reg. Stud. 2003, 37, 27–40. [Google Scholar] [CrossRef]
- Cheshire, P.C.; Gordon, I. Territorial competition: Some lessons for policy. Ann. Reg. Sci. 1998, 32, 321–346. [Google Scholar] [CrossRef]
- Markusen, A.R.; Nesse, K. Institutional and Political Determinants of Incentive Competition. In Reining in the Competition for Capital; W.E. Upjohn Institute for Employment Research: Kalamazoo, MI, USA, 2007; pp. 1–42. [Google Scholar]
- Raines, P. Flows and territories: The new geography of competition for mobile investment in Europe. In the New Competition for Inward Investment; Edward Elgar Publishing: Cheltenham, UK, 2003; pp. 119–136. [Google Scholar]
- Grundig, B.; Leßmann, C.; Müller, A.S.; Pohl, C.; Ragnitz, J. Rechtfertigung von Ansiedlungssubventionen am Beispiel der Halbleiterindustrie; Ifo Institut für Wirtschaftsforschung: München, Germany, 2008. [Google Scholar]
- Ernst & Young. Kennzeichen D: Standortanalyse 2006; Ernst & Young GmbH: Essen, Germany, 2006. [Google Scholar]
- Ernst & Young. Deutsche Großstädte: Zufriedenheit der Unternehmen mit ihrem Standort 2006; Ernst & Young GmbH: Essen, Germany, 2006. [Google Scholar]
- Barthel, C.; Spiess, S. Standortanforderungen Thüringer High-Tech-Unternehmen 2006. Available online: http://www.leg-thueringen.de/fileadmin/www/pdfs/DE/publikationen/standortanforderungen.pdf (accessed on 25 June 2021).
- Bochow, A. Ausländische Direktinvestitionen in der Automobilzulieferindustrie—Eine Empirische Analyse Ostdeutschlands; Fachverlag für Politik & Beratung: Berlin, Germany, 2007. [Google Scholar]
- fDi Markets. fDi Markets Database. Available online: http://www.fdimarkets.com (accessed on 25 June 2021).
- Van Oort, F.G. Urban Growth and Innovation: Spatially Bounded Externalities in the Netherlands; Ashgate: Aldershot, UK, 2004. [Google Scholar]
- Defever, F. Functional fragmentation and the location of multinational firms in the enlarged Europe. Reg. Sci. Urban Econ. 2006, 36, 658–677. [Google Scholar] [CrossRef] [Green Version]
- Spies, J. Network and border effects: Where do foreign multinationals locate in Germany? Reg. Sci. Urban Econ. 2010, 40, 20–32. [Google Scholar] [CrossRef] [Green Version]
- Spiekermann, K.; Wegener, M. Accessibility and Spatial Development in Europe. Sci. Reg. 2006, 5, 15–46. [Google Scholar]
- Arauzo-Carod, J.-M.; Liviano-Solis, D.; Manjon, M. Empirical Studies in Industrial Location: An Assessment of Their Methods and Results. J. Reg. Sci. 2009, 50, 685–711. [Google Scholar] [CrossRef]
- Schmidheiny, K.; Brülhart, M. On the equivalence of location choice models: Conditional logit, nested logit and Poisson. J. Urban Econ. 2011, 69, 214–222. [Google Scholar] [CrossRef] [Green Version]
- Gourieroux, C.; Monfort, A.; Trognon, A. Pseudo Maximum Likelihood Methods: Applications to Poisson Models. Econpapers 1984, 52, 701. [Google Scholar] [CrossRef]
- Ali, K.; Partridge, M.D.; Olfert, M.R. Can Geographically Weighted Regressions Improve Regional Analysis and Policy Making? Int. Reg. Sci. Rev. 2007, 30, 300–329. [Google Scholar] [CrossRef]
- Partridge, M.D.; Rickman, D.; Ali, K.; Olfert, M.R. The Geographic Diversity of U.S. Nonmetropolitan Growth Dynamics: A Geographically Weighted Regression Approach. Land Econ. 2008, 84, 241–266. [Google Scholar] [CrossRef]
- Karreman, B.; Burger, M.J.; Van Oort, F.G. Location Choices of Chinese Multinationals in Europe: The Role of Overseas Communities. Econ. Geogr. 2016, 93, 131–161. [Google Scholar] [CrossRef] [Green Version]
- Brunsdon, C.; Fotheringham, A.S.; Charlton, M.E. Geographically Weighted Regression: A Method for Exploring Spatial Nonstationarity. Geogr. Anal. 2010, 28, 281–298. [Google Scholar] [CrossRef]
- Fotheringham, A.S.; Brunsdon, C.; Charlton, M. Geographically Weighted Regression: The Analysis of Spatially Varying Relationships; Wiley: Chichester, UK, 2003. [Google Scholar]
- Guimón, J. Government strategies to attract R&D-intensive FDI. J. Technol. Transf. 2009, 34, 364–379. [Google Scholar] [CrossRef] [Green Version]
- Dimitratos, P.; Liouka, I.; Young, S. Regional location of multinational corporation subsidiaries and economic development contribution: Evidence from the UK. J. World Bus. 2009, 44, 180–191. [Google Scholar] [CrossRef]
- Günther, J.; Jindra, B.; Stephan, J. Foreign Subsidiaries in the East German Innovation System—Evidence from Manufacturing Industries. Appl. Econ. Q. 2008, 59, 137–172. [Google Scholar]
- Koschatzky, K. Innovationsbedingungen und Innovationspotenziale in Ostdeutschland– Exemplarische Analyse von drei Grenzregionen; Fraunhofer IRB Verlag: Stuttgart, Germany, 2006. [Google Scholar]
- Navaretti, G.B.; Venables, A.J. Multinational Firms in the World Economy; Princeton University Press: Princeton, NJ, USA, 2020. [Google Scholar]
Figure 1.
Distribution of greenfield FDI in Germany.

Figure 2.
Distribution of greenfield FDI across German districts by function.

Figure 3.
Public funds with a potential impact on regional development per inhabitant in German districts (Euro per inhabitant).
Figure 3.
Public funds with a potential impact on regional development per inhabitant in German districts (Euro per inhabitant).
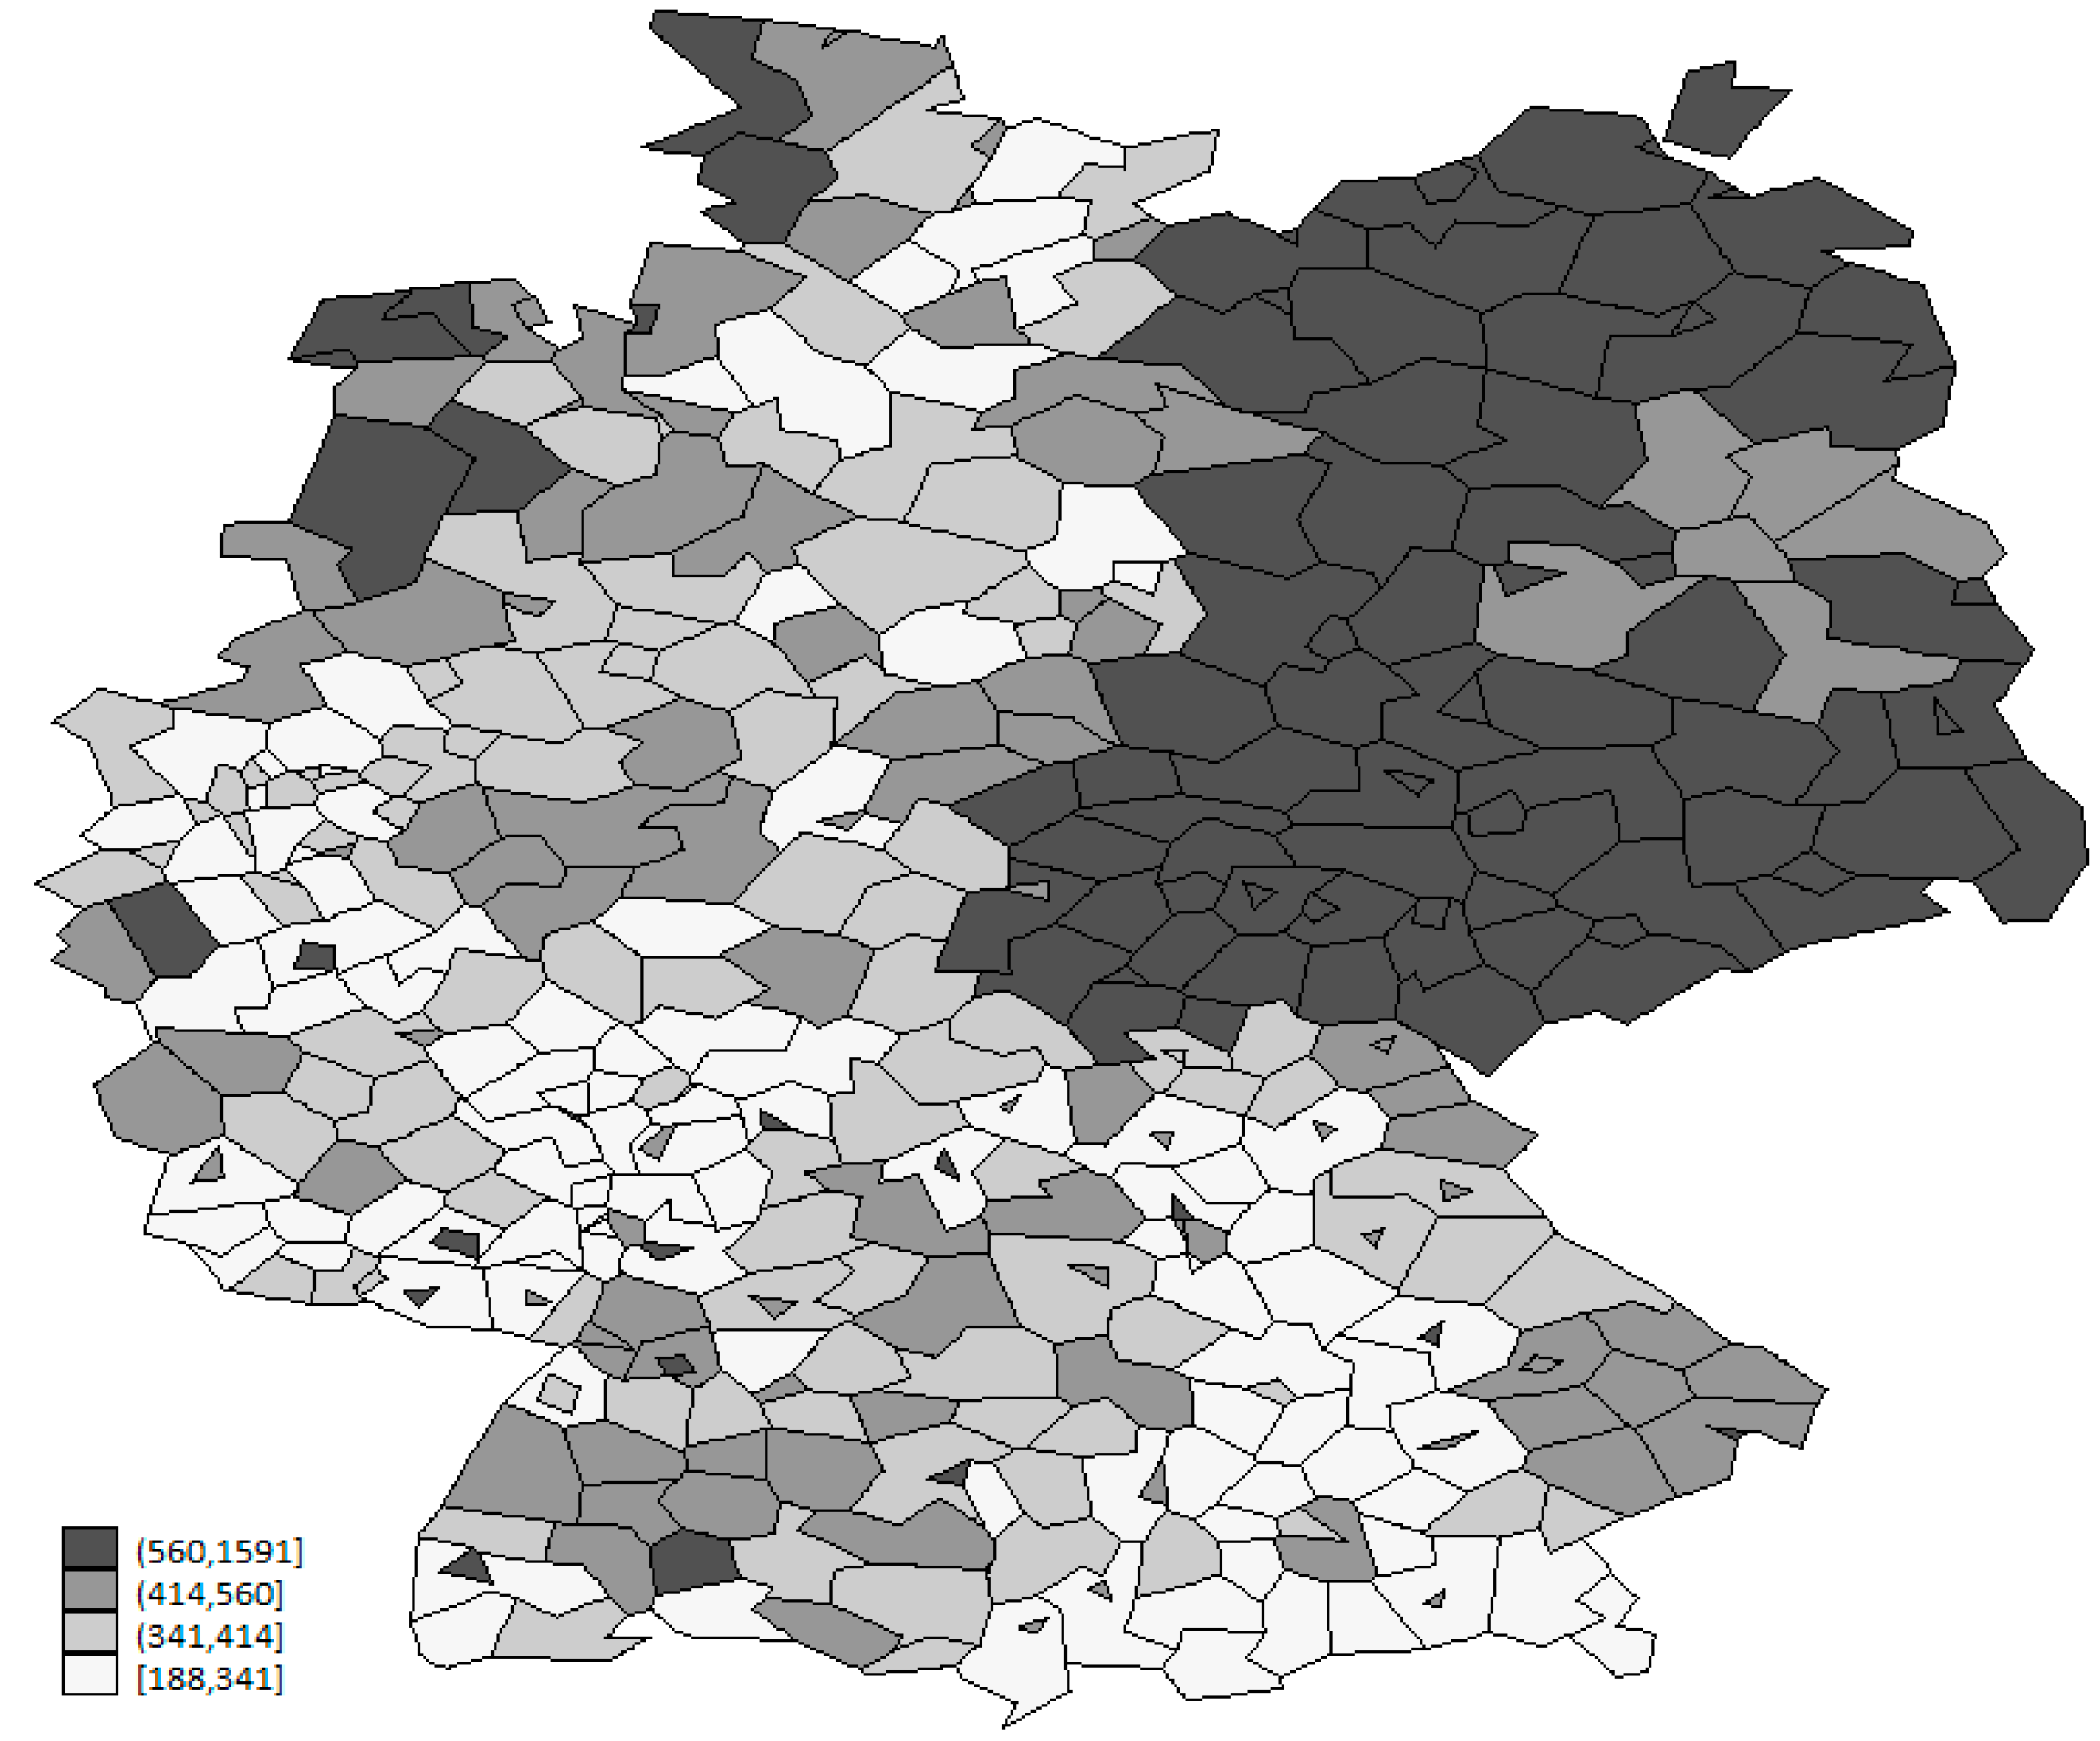
Figure 4.
Spatial Variation in Coefficients of Public Funds: Total Investments.

Figure 5.
Spatial Variation in Coefficients of Public Funds: Production Plants.

Table 1.
Distribution of Greenfield FDI across Broad Sectors and Functions (2003–2010).
| Number of Investments | % | |
|---|---|---|
| Broad Sector | ||
| Commercial Services | 484 | 13.9% |
| Consumer Services | 120 | 3.5% |
| Financial Services | 233 | 6.7% |
| High-Tech Manufacturing | 529 | 15.2% |
| ICT | 716 | 20.6% |
| Low-Tech Manufacturing | 507 | 14.6% |
| Medium-Tech Manufacturing | 445 | 12.8% |
| Resources and Processing Industries | 245 | 7.1% |
| Transport Services | 191 | 5.5% |
| Broad Functions | ||
| Business Services | 595 | 17.1% |
| Construction and Electricity | 170 | 4.9% |
| Headquarters | 223 | 6.4% |
| Logistics and Distribution | 243 | 7.0% |
| Production | 634 | 18.3% |
| Research and Development | 182 | 5.2% |
| Sales and Marketing | 1255 | 36.2% |
| Support and Servicing | 168 | 4.8% |
| Business Services | 595 | 13.9% |
Table 2.
Funds with a Potential Impact on Regional Development in Euro per Capita and Period.
| 1996–2004 | 2005–2010 | |||||
|---|---|---|---|---|---|---|
| Total | West | East | Total | West | East | |
| All public funds | 365.01 | 283.69 | 671.15 | 591.79 | 554.81 | 738.27 |
| Incentive-based public funds | 181.12 | 153.96 | 283.35 | 173.27 | 168.22 | 193.29 |
| GRW Gewerbliche Wirtschaft | 27.49 | 3.61 | 117.40 | 16.75 | 3.16 | 70.58 |
| ERP Regionalprogramm | 10.83 | 4.14 | 36.01 | 3.34 | 1.51 | 10.58 |
| KfW-Innovationsprogramme | 5.81 | 6.34 | 3.82 | 10.53 | 12.78 | 1.62 |
| KuM-Förderung | 100.60 | 106.49 | 78.42 | 75.77 | 83.64 | 44.63 |
| KfW- und ERP-Umweltprogramme | 33.57 | 30.18 | 46.34 | 35.85 | 33.70 | 44.38 |
| KfW-Erneuerbare Energien | 2.81 | 3.20 | 1.36 | 31.03 | 33.43 | 21.50 |
| Capacity-building-based public funds | 183.89 | 129.72 | 387.80 | 418.52 | 386.59 | 544.98 |
| GRW Infrastruktur | 10.75 | 1.53 | 45.45 | 6.80 | 1.45 | 27.96 |
| KfW-Infrastrukturprogramm | 41.99 | 39.12 | 52.78 | 32.14 | 30.34 | 39.25 |
| Direkte Projektförderung | 26.36 | 26.05 | 27.50 | 43.03 | 40.51 | 52.99 |
| GA Hochschulbau | 12.06 | 10.69 | 17.25 | 5.66 | 5.79 | 5.19 |
| Arbeitsmarktpolitische Hilfen | 87.71 | 50.83 | 226.57 | 324.29 | 304.94 | 400.96 |
| Städtebauförderung | 5.02 | 1.50 | 18.24 | 6.61 | 3.57 | 18.63 |
Table 3.
Descriptive Statistics, Independent Variables (N = 412).
| Mean | Standard Deviation | Min | Max | Level of Measurement | |
|---|---|---|---|---|---|
| Public funds (ln) | 6.08 | 0.79 | 5.23 | 7.37 | NUTS-3 |
| Local GDP (ln) | 15.15 | 0.75 | 13.74 | 18.22 | NUTS-3 |
| % Growth Local GDP | 8.39 | 7.49 | −25.00 | 57.60 | NUTS-3 |
| Multimodal accessibility (ln) | 4.78 | 0.21 | 4.10 | 5.30 | NUTS-3 |
| Unit wage costs (ln) | −0.43 | 0.06 | −0.91 | −0.41 | NUTS-2 |
| % Highlyeducated workforce | 3.84 | 3.05 | 0.61 | 25.25 | NUTS-3 |
| Land costs (ln) | 4.51 | 0.85 | 1.57 | 6.86 | NUTS-3 |
| % Business tax | 15.80 | 2.02 | 10.86 | 21.23 | NUTS-3 |
| Population density (ln) | 5.62 | 1.09 | 3.68 | 8.32 | NUTS-3 |
| Capital (ln) | 12.19 | 0.54 | 10.76 | 13.35 | NUTS-3 |
| Presence Top-500 MNC | 0.09 | 0.28 | 0 | 1 | NUTS-2 |
Sources: Unit wage costs and capital: Cambridge Econometrics database/Multimodal accessibility: ESPON, Spiekermann and Wegener [39]. Presence Top-500 MNC dummy: BBSR (2011); Other variables: INKAR database.
Table 4.
Negative Binomial Estimations on Number of Greenfield FDI.
| (1) | (2) | (3) | (4) | |
|---|---|---|---|---|
| Baseline Model | Including Public Funds | Including Incentives 1996–2004 | East vs. West Germany | |
| Public funds (ln) | 0.69 ** | 0.85 ** | 0.21 | |
| (0.194) | (0.194) | (0.223) | ||
| Local GDP (ln) | 1.11 ** | 1.14 ** | 1.10 ** | 1.14 ** |
| (0.109) | (0.104) | (0.111) | (0.104) | |
| % Growth Local GDP | 0.01 | 0.01 | 0.02 * | 0.01 * |
| (0.007) | (0.007) | (0.007) | (0.007) | |
| Multimodal accessibility (ln) | 0.38 | 0.87 * | 0.97 ** | 0.72 * |
| (0.336) | (0.368) | (0.360) | (0.343) | |
| Unit wage costs (ln) | −2.06 ** | −1.56 * | −2.03 ** | −1.66 * |
| (0.796) | (0.727) | (0.774) | (0.745) | |
| % Highly educated workforce | 0.09 ** | 0.03 | 0.04 | 0.02 |
| (0.031) | (0.028) | (0.032) | (0.027) | |
| Land costs (ln) | −0.55 ** | −0.34 ** | −0.30 * | −0.06 |
| (0.139) | (0.121) | (0.145) | (0.135) | |
| % Business tax | −0.11 ** | −0.10 ** | −0.09 * | −0.06 |
| (0.038) | (0.036) | (0.035) | (0.033) | |
| Population density (ln) | 0.40 ** | 0.26 ** | 0.30 ** | 0.25 * |
| (0.110) | (0.100) | (0.108) | (0.104) | |
| Capital (ln) | 0.43 ** | 0.43 ** | 0.41 ** | 0.30 ** |
| (0.107) | (0.108) | (0.108) | (0.102) | |
| Presence top 500 MNC | 0.12 | 0.14 | 0.20 | 0.20 |
| (0.168) | (0.162) | (0.161) | (0.151) | |
| East Germany dummy | −9.33 * | |||
| (3.803) | ||||
| East Germany dummy *Public funds (ln) | 1.54 ** (0.586) | |||
| Observations | 412 | 412 | 412 | 412 |
| McFadden’s R2 | 0.209 | 0.215 | 0.25 | 0.224 |
| LR test of alpha | 715 ** | 723 ** | 727 ** | 576 ** |
| AIC | 4.64 | 4.61 | 4.51 | 4.56 |
| BIC | −522 | −531 | −530 | −541 |
Robust standard errors in parentheses; ** p < 0.01, * p < 0.05.
Table 5.
Geographically Weighted Negative Binomial Regression Estimates.
| Minimum | Lower Quartile | Median | Global (NBPML) | Upper Quartile | Maximum | |
|---|---|---|---|---|---|---|
| Public funds (ln) ‡ | 0.16 | 0.37 | 0.62 | 0.71 ** | 0.88 | 1.54 |
| Local GDP (ln) | 1.01 | 1.14 | 1.18 | 1.14 ** | 1.22 | 1.29 |
| % Growth GDP | −0.00 | 0.01 | 0.01 | 0.01 | 0.01 | 0.02 |
| Multimodal accessibility (ln) | 0.51 | 0.80 | 0.89 | 0.88 ** | 0.99 | 1.21 |
| Unit wage costs (ln) ‡ | −4.31 | −2.42 | −1.77 | −1.54 | −1.41 | −0.96 |
| % Highly educated workforce | −0.00 | 0.01 | 0.02 | 0.03 | 0.03 | 0.05 |
| Land costs (ln) | −0.35 | −0.28 | −0.25 | −0.32 * | −0.20 | −0.04 |
| % Business tax | −0.16 | −0.13 | −0.10 | −0.10 * | −0.08 | −0.04 |
| Population density (ln) | 0.07 | 0.19 | 0.23 | 0.25 * | 0.26 | 0.33 |
| Capital (ln) | 0.16 | 0.29 | 0.36 | 0.41 ** | 0.40 | 0.52 |
| Presence Top-500 MNC dummy | 0.05 | 0.14 | 0.17 | 0.10 | 0.18 | 0.19 |
N = 412; ‡ indicates significant spatial variation in GWR coefficients at 10% level based on Monte Carlo test (Fotheringham et al. 2002). * and ** indicate that the parameter is significantly different from zero at the 5% and 1% level, respectively.
Table 6.
Negative Binomial Estimations on Number of Greenfield FDI by Economic Function.
| (1) | (2) | (3) | (4) | |
|---|---|---|---|---|
| Upstream Activities | Construction and Energy | Production Plants | Downstream Activities | |
| Public funds (ln) | 0.19 | 0.46 | 0.82 ** | 0.49 |
| (0.297) | (0.490) | (0.263) | (0.321) | |
| Local GDP (ln) | 1.31 ** | 1.36 ** | 0.83 ** | 1.22 ** |
| (0.111) | (0.188) | (0.111) | (0.160) | |
| % Growth Local GDP | 0.01 | 0.03 * | 0.00 | 0.03 * |
| (0.013) | (0.014) | (0.008) | (0.013) | |
| Multimodal accessibility (ln) | 0.89 | −2.03 ** | 0.75 | 1.40 * |
| (0.578) | (0.848) | (0.491) | (0.606) | |
| Unit wage costs (ln) | −0.76 | −3.21 ** | −2.06* | −0.52 |
| (0.930) | (1.132) | (1.035) | (0.800) | |
| % Highly educated workforce | 0.03 | 0.02 | −0.03 | 0.06 |
| (0.025) | (0.048) | (0.032) | (0.038) | |
| Land costs (ln) | 0.01 | −0.41 | −0.67 ** | −0.23 |
| (0.186) | (0.232) | (0.150) | (0.221) | |
| % Business tax | −0.11 * | −0.14 | −0.03 | −0.13 * |
| (0.049) | (0.091) | (0.051) | (0.054) | |
| Population density (ln) | 0.20 | 0.26 | 0.25 * | 0.39 ** |
| (0.144) | (0.235) | (0.124) | (0.150) | |
| Capital (ln) | 0.39 ** | 0.45 | 0.48 ** | 0.38 * |
| (0.148) | (0.296) | (0.157) | (0.170) | |
| Presence top 500 MNC | 0.11 | 1.08 ** | −0.03 | −0.00 |
| (0.232) | (0.359) | (0.212) | (0.228) | |
| Observations | 412 | 412 | 412 | 412 |
| McFadden’s R2 | 0.292 | 0.224 | 0.103 | 0.239 |
| LR test of alpha | 11.2 ** | 16.8 ** | 131 ** | 462 ** |
| AIC | 1.65 | 1.13 | 3.06 | 3.40 |
| BIC | −1750 | −1964 | −1166 | −1029 |
Robust standard errors in parentheses; ** p < 0.01, * p < 0.05.
Table 7.
Geographically Weighted Negative Binomial Regression Estimates—Production Plants.
| Minimum | Lower Quartile | Median | Global (NBPML) | Upper Quartile | Maximum | |
|---|---|---|---|---|---|---|
| Public funds (ln) ‡ | 0.23 | 0.56 | 0.86 | 0.83 ** | 1.17 | 1.82 |
| Local GDP (ln) | 0.71 | 0.78 | 0.85 | 0.82 ** | 0.94 | 1.06 |
| % Growth GDP | −0.01 | −0.00 | −0.00 | 0.00 | 0.00 | 0.01 |
| Multimodal accessibility (ln) ‡ | −0.27 | 0.57 | 0.77 | 0.74 | 1.02 | 1.23 |
| Unit wage costs (ln) ‡ | −4.87 | −3.16 | −2.44 | −2.09 | −1.76 | −0.92 |
| % Highly educated workforce | −0.06 | −0.05 | −0.04 | −0.03 | −0.03 | −0.03 |
| Land costs (ln) | −0.71 | −0.66 | −0.61 | −0.65 ** | −0.56 | −0.38 |
| % Corporate taxes | −0.08 | −0.06 | −0.03 | −0.02 | −0.01 | −0.03 |
| Population density (ln) | 0.07 | 0.19 | 0.25 | 0.24 | 0.31 | 0.37 |
| Capital (ln) | 0.32 | 0.41 | 0.45 | 0.47 ** | 0.47 | 0.55 |
| Presence Top-500 MNC dummy | −0.77 | −0.13 | 0.00 | −0.04 | 0.07 | 0.09 |
N = 412; ‡ indicates significant spatial variation in GWR coefficients at 10% level based on Monte Carlo test (Fotheringham et al., 2002). * and ** indicate that the parameter is significantly different from zero at the 5% and 1% level, respectively.
Publisher’s Note: MDPI stays neutral with regard to jurisdictional claims in published maps and institutional affiliations. |
© 2021 by the authors. Licensee MDPI, Basel, Switzerland. This article is an open access article distributed under the terms and conditions of the Creative Commons Attribution (CC BY) license (https://creativecommons.org/licenses/by/4.0/).
Share and Cite
MDPI and ACS Style
Burger, M.J.; Schalk, J.; Schiller, D.; Stavropoulos, S. Regional Policy and Greenfield Investments in German Districts. Urban Sci. 2021, 5, 51. https://0-doi-org.brum.beds.ac.uk/10.3390/urbansci5030051
AMA Style
Burger MJ, Schalk J, Schiller D, Stavropoulos S. Regional Policy and Greenfield Investments in German Districts. Urban Science. 2021; 5(3):51. https://0-doi-org.brum.beds.ac.uk/10.3390/urbansci5030051
Chicago/Turabian StyleBurger, Martijn J., Jelmer Schalk, Daniel Schiller, and Spyridon Stavropoulos. 2021. "Regional Policy and Greenfield Investments in German Districts" Urban Science 5, no. 3: 51. https://0-doi-org.brum.beds.ac.uk/10.3390/urbansci5030051