Article

Study on the Evolution of the Source-Flow-Sink Pattern of China’s Chunyun Population Migration Network: Evidence from Tencent Big Data

School of Geography and Environment, Jiangxi Normal University, Nanchang 330022, China
*
Author to whom correspondence should be addressed.
Submission received: 31 May 2021 / Revised: 6 August 2021 / Accepted: 20 August 2021 / Published: 6 September 2021

Abstract

:
We construct a comprehensive analysis framework of population flow in China. To do so, we take prefecture-level administrative regions as the basic research unit of population flow and use source-sink theory and flow space theory. Additionally, we reveal the dynamic differentiation of population flow patterns and the evolution of population source-flow-sink systems. We try to provide a theoretical basis for the formulation of population development policies and regional spatial governance. The results show the following: (1) The Hu Huanyong Line has a strong spatial lock-in effect on population flow. Additionally, provincial capital cities, headed by Hangzhou, Nanjing, and Hefei, have played an increasingly prominent role in population flow. (2) The developed eastern coastal areas have undertaken China’s main population outflow. The net population flow is spatially high in the middle of the region and low on the two sides, exhibiting an “inverted U-shaped” pattern. Furthermore, the borders of the central provinces form a continuous population inflow area. (3) The hierarchical characteristics of the population flow network are obvious. Strong connections occur between developed cities, and the effect of distance attenuation is weakened. The medium connection network is consistent with the traffic skeleton, and population flow exhibits a strong “bypass effect”. (4) The source and sink areas are divided into four regions similar to China’s three major economic belts. The 10 regions can be refined to identify the main population source and sink regions, and the 18 regions can basically reflect China’s level of urbanization. The network of the population flow source-flow-sink system exhibits notable nesting characteristics. As a result, it creates a situation in which the source areas on both sides of the east and the west are convective to the middle. The hierarchical differentiation of the source-flow sink system is related to the differences between the east and the west and between the north and the south, as well as local differences in China.

1. Introduction

Since the mid-1990s, China has fully entered a period of social and economic transformation. Under the guidance of certain strategies such as new urbanization, urban agglomeration, and ecological civilization construction, China’s socioeconomic level has developed rapidly. However, it has been affected by resource endowments and economic development trends. The development basis and the fixed effects of the planned economy have also caused development problems such as a substantial differentiation of interests, a widening of regional gaps, and prominent contradictions between people and the land. Humans constitute the main body of regional social and economic activity. The spatial flow of the population is often accompanied by the exchange of material, information, technology, capital, and other production factors between regions. This exchange affects the reaggregation and diffusion of these social and economic factors within a certain range [1]. These effects play an important role in improving the uneven economic development between regions, narrowing the income gap, and adjusting the industrial structure. Large-scale population migration has occurred in the eastern, central, and western regions of China, and it has become one of the most influential geographic processes in China and worldwide [2]. Population migration will become an important impetus for China’s future urbanization. In doing so, it will reshape a new population distribution pattern, and it will also have an impact on the world’s economy in the context of globalization.
Traditional studies of migration are based on census and official migration data [3,4,5,6,7,8]. However, its data structure severely limits the temporal and spatial accuracy of such research. Thus, it is difficult to dynamically reflect the increasingly complex interactions between cities. Many scholars use mobile phone data to study population mobility. Doing so has advantages in terms of a large data volume and a high level of temporal and spatial accuracy [9]. These studies analyze individual mobility patterns, personal travel behaviors and commuting patterns [10,11,12,13,14]. The flight and railway frequency of some transportation service platforms are also used as alternative parameters of the population interaction between cities to study the spatial structure of multiscale global, national, and urban flows [15,16,17]. In today’s information network era, the explosive growth in the amount of information available provides a massive data foundation for research on streaming spaces. For example, social media data are used to explore the characteristics of population mobility at multiple scales [18,19,20]. At the same time, however, these data sources can introduce some problems. Data involve privacy. Thus, it is difficult to obtain national-scale data, and the data sources are not uniform. Tencent Migration data allows for a large amount of location data to be obtained under the premise of user privacy protection. The data accuracy can be traced to the individual level, thereby compensating for the one-sidedness of the data, and a comprehensive assessment of the intercity population flow can be obtained from the results generated by single modes of transportation, such as railways, highways, aviation, and water transport. The population migration data provided by Tencent solve the problems above to a certain extent and are empirically reliable for analyzing population migration in China. Geographers have begun to use such dynamic migration data to characterize the pattern of population flow in China [21]. It is generally believed that as a typical source-flow-sink system, population flow has regional differentiation. Additionally, revealing the spatial pattern of population flow can help clarify the interaction between population resources and different economic and social spaces. Clarifying such interaction can play an important role in promoting the optimal allocation of population resources. China’s population mobility network has rich club areas and imbalanced regions [22]. The population connections between cities are “sparse from the east to the west”, showing typical “small world” network characteristics [23]. From a spatial scale, the area east of the Hu Huanyong Line carries most of the urban population flow in China, and this classic sparse population line has a slight tendency to shift towards the northwest [24]. Some scholars have begun to explore the source-sink system of population flow. Scholars such as Kawecki analyzed the impact of source and sink dynamics on demographics and found that the migration and spread of immigrants are affected by habitat conditions [24,25,26]. Ma found that the source of Egyptian population migration is located in the middle of China and the sinks are symmetrically distributed on both sides of eastern and western China, showing a “centre-periphery” pattern [27].
The destination of population flow between cities is largely affected by time and the role of the progression of time is often neglected in previous studies [28]. The population flow during special periods, such as the Spring Festival and National Day, can avoid issues related to the time differences in datasets. Some studies have focused on how to qualitatively and more accurately explore different travel behaviors and purposes [29,30,31,32]. “Spring Festival Transport” refers to transportation that occurs during the Spring Festival. It represents the large-scale high transportation pressure that occurs around the Spring Festival of the Chinese Lunar New Year. Before the Spring Festival, many people return to their hometowns to reunite with their families. After the festival, they return to the cities where they live. Scholars call this large-scale population movement in China the “annual space mismatch” of the separation between household registration and the workplace [33]. Over the past 40 years, the population movement during Spring Festival Transport in China has increased from 100 million to 3.7 billion (by 2020). This movement is known as the largest and most cyclical human migration event in human history. At the surface level, the Spring Festival Transport phenomenon is a traffic problem represented by a basic contradiction between the instantaneous concentration of travel demand and the relative shortage of transport capacity. In essence, however, it also reflects the imbalance of regional development, the dual structure of urban and rural areas, the reconstruction of social strata, and the disruption of regional industry. It is a comprehensive representation of many social and economic problems in China during the transition period, such as the division of labour and regional linkages. In other words, Spring Festival Transport is actually a microcosm of Chinese society in a transitional period and an obvious indicator of China’s social and economic development. The population flow during the Spring Festival travel season in China forms a “diamond-shaped” distribution pattern, with the four urban agglomerations of the Beijing-Tianjin-Hebei region, Yangtze River Delta, Pearl River Delta, and Chengdu-Chongqing area acting as population flow distribution centers [22]. There is a significant correlation between the population source and sink areas of Spring Festival Transport in China and the level of regional economic development. Urbanized sink areas exhibit large differences in population, density, and urbanization. The underdeveloped source areas still contain the majority of the census population [34].
Research on the static pattern of the population flow during Spring Festival Transport in China has obtained some valuable results. However, an in-depth study is needed to grasp the spatial variability of the population flow during the Spring Festival travel period in the context of the rapid economic and social changes during the transition period. The following questions are proposed: What are the spatial differentiation characteristics of the population flow pattern during the Spring Festival travel season in China at different times? How can the population source and sink areas be divided based on the population flow index and the regional geographic environment? Is there any change in the spatial interaction corridor between the population source area and the sink area? Based on these questions, the main objectives of this article are as follows: (1) Following the “field-flow” population flow analysis framework, this research aims to study the spatial and network-based differentiation of the population flow during the Spring Festival travel season in China across different periods of time to grasp the dynamic evolution of population flow patterns. (2) Based on source-sink theory, the net population flow index, and the regional geographic environment, this study aims to divide the source and sink areas of the population flow during Spring Festival Transport. (3) This study aims to embed flow elements into source-sink theory to explore the relationship between source and sink nodes and the evolution of the main population flow axis.
This article is divided into five main sections. The next section introduces the data and methods and discusses the analysis methods and regionalization models of source-sink theory in terms of population flow. The third section presents the result analysis following the field-flow analysis framework using regionalization models to analyze China’s Spring Festival Transport in detail. The evolution of the spatial and network patterns of population mobility and of the multiscale population source-flow-sink model is discussed. The fourth section discusses the theoretical importance of this article for population mobility research and its reference value for the optimal allocation of population resources. The final section draws the main conclusions of this article.

2. Materials and Methods

2.1. Research Data

The research objects are 337 cities in mainland China, including 4 municipalities and 333 prefecture-level administrative regions (292 prefecture-level cities, 7 regions, 30 autonomous prefectures, and 3 leagues, excluding Sansha City). This research does not involve Taiwan and Hong Kong. There are 337 research objects in Macau that basically cover mainland China (Figure 1). Officially, the Spring Festival time defined by China are 40 days, with 15 days before the Spring Festival and 25 days after it. The official Spring Festival travel times in 2015 is from February 4th to March 16th and it is from January 21st to March 1st in 2019. Studies have shown that cyclical convection is formed before and after the Spring Festival travel season. To better characterize the population distribution pattern during the Spring Festival travel season, based on the direction of population flow, the population flow data for a total of 40 days (the 20 days before the holiday in these two years) are selected.
The population movement data used in this study come from the population migration map of Tencent Location Big Data (https://heat.qq.com/qianxi.php (accessed on 29 August 2021)). The data are presented with a time unit of one day, and they record the urban inflow and the number of population movements between the top ten cities with the largest outflows. The principle of data collection is to compare the number of smart terminal users whose location requests have changed within 8 h by comparing user location changes and various transportation methods (such as railways, highways, and aviation paths). User location data are analyzed and counted to obtain the flow of people. The trajectory is presented in the form of visualization and origin-destination (OD) data [35].
The population movement data in this article were collected by a mobile app owned by China’s largest social media company, Tencent. Tencent specializes in various Internet-related services and products, including social networking, mobile payment, entertainment, news, and information. As of March 2020, the number of monthly active accounts of WeChat (a communication and social media platform) exceeded 1.2 billion and the number of monthly active users of QQ (including PCs and mobile devices) was 768 million. Tencent has a large number of users, and it can collect geographic location request information generated on users’ smart devices during a specific period of time. Thus, Tencent data have good representational power for studying population flows in China.

2.2. Research Methods

2.2.1. Source-Sink Theory and the Coefficient of Net Population Flow

Source-sink theory originated from environmental science and reached maturity in research on landscape ecology. It is believed that a source is the starting point of the spatiotemporal change process of matter and landscape and that a sink is the end of the process. The essence of source-sink theory is to analyze the law of the process of material distribution-movement-new distribution from the perspective of spatial patterns. Doing so supports systematic thinking and the development of new methods for the regulation of social and ecological processes. Source-sink theory has been widely used in research on biological science [36], landscape ecology [37], environmental science [38], resource science [39], climate change [40], and transportation and tourism science [41], as well as for other purposes. Research on population mobility is still in its infancy. In the source-flow-sink system of population mobility, a source area indicates that the population outflow is greater than the population inflow, and the population presents the characteristics of net outflow. A sink area is the opposite of a source area and represents the net population inflow area. “Flow” refers to the number of population flows and corridors between a source area and a sink area.
This research defines the total flow scale (SF) as the total flow of a city’s population, which is used to characterize the activity of population flow. The net flow scale (NF) is the net inflow and net outflow of the urban population, which measures the difference in the population outflow and inflow scale of a city and the city’s social attributes. The total population flow and net inflow value of city i on one day are expressed as follows:
S F i _ d a y = F i T + F i
N F i _ d a y = F i T F i
F I = F i n / F o u t
In the formula, Fi is the population flow matrix between cities, FiT is the transposition matrix, and FI is the net population flow coefficient. When FI 1, the city is a net outflow city. The smaller the index is, the more serious the population outflow and the greater the population decline. In contrast, FI 1 indicates that the city is a net inflow city, and that the urban population is on the rise during the study period. The larger the index is, the faster the urban inflow population. If FI = 1, the city is experiencing new outflow during the study period. Its internal population remains relatively stable.

2.2.2. Regionalization with Dynamically Constrained Agglomerative Clustering and Partitioning (REDCAP)

REDCAP involves “aggregate clustering with dynamic constraints and regionalization of partitions”. It consists of three clustering methods: the single link (SLK), average link (ALK), and complete link (CLK). A regionalization method is combined with two different constraint strategies (a first-order constraint and a full-order constraint) [42]. The experimental results show that the clustering effect of the total order average linkage clustering method is considerably better than that of other methods. Thus, it is applied in this study. Readers can refer to Guo and Wang for more details and REDCAP software is available [41,42].
The two basic steps of adjacency constraint hierarchical clustering and spatial adjacency tree division constitute REDCAP. In the first step, based on attribute similarity and spatial adjacency constraints, when two adjacent and similar clusters are preferentially merged, a spatial adjacency cluster tree is constructed from the bottom up. Links (edges) are recorded to mark the boundary between them. In the second step, the tree is recursively divided by removing the best edges to minimize the overall heterogeneity of all regions. The heterogeneity measure is defined as the sum of the squared differences (SSD):
S S D = r = 1 k i = 1 n r j = 1 d ( x i j x j ¯ ) 2
In the formula, k, nr and d represent the number of regions, the number of basic units in region r, and the number of attributes, respectively. xij is the value of the jth attribute of the ith object. xj is the regional average value of the jth attribute. As mentioned in the data section, the overall difference ratio is the main indicator used to determine the difference between basic units. Before using the full-level average link clustering method, z-score normalization is first applied.

3. Identification of Source and Sink Areas of Population Flow during Spring Festival Transport in China

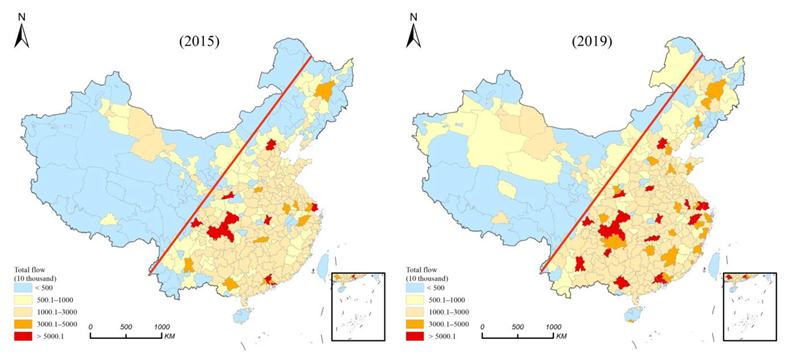
3.1. Spatial Differentiation of the Total Population Flow during Spring Festival Transport in China

The total scale of population flow is the sum of the inflow and outflow population of a certain city. The indicator reflects the total intensity of population flow in the city and is used to characterize the active population flow in the cities in the study area. This section uses data on the population flow between cities during the Spring Festival to compile a map of the evolution of the total scale of population flow before the Spring Festival in China. Additionally, it analyzes the intercity differentiation of China’s population flow activity during the special period of the Spring Festival and the differences in the status of different cities in the national population flow structure.
Figure 2 shows that the total scale of population movement during the Spring Festival travel season in China exhibits notable spatial differences. The population flow is mainly concentrated in southeastern China, while the northwest and Qinghai-Tibet areas are sparsely populated. The area east of the Hu Huanyong Line carries more than 90% of the population flow. Many scholars have verified the relevant research on China’s population distribution and the Hu Huanyong Line has a strong spatial lock-in effect on China’s population distribution and population flow. This geographic phenomenon is affected by multiple factors, such as parameters of the natural background environment, early national cascade development policies, and infrastructure construction projects [35,43]. Through important existing changes, the scale of population flow in some prefectures and cities in Gansu, Xinjiang, and other provinces has gradually expanded. The population activity in these areas has benefited from China’s western development policy and the radiant driving effect of the Lanxin Line on the region. The Lanzhou–Xinjiang railway has become a potential source of disruption that impacts the Hu Huanyong Line spatial lock-in effect.
From the perspective of the evolutionary characteristics of the total population flow, the total scale of population flow during the Spring Festival travel season in China from 2015 to 2019 showed an increasing trend. The first and third levels expanded considerably between the levels, and a T shape formed between the Hu Huanyong Line and the Lanxin Line. The source area is at the forefront of the growth in the population flow space. There is also strong spatial heterogeneity in the increase in population flow. In 2015, the first level of population flow in the north, Shanghai, Guangzhou, and Shenzhen, as well as the central and western regions of Wuhan, Xi’an, Chongqing, and Chengdu, reached 68.779 million, accounting for the approximate population of the entire country. Of the population flow, 16% has undoubtedly become a national population flow distribution center, playing an important role in the population flow pattern. The second tier is dominated by provincial capitals such as Hangzhou, Nanjing, and Hefei. The population flow has a strong degree of activity and most urban population flows are distributed in a spatially staggered manner between the third and fourth levels. The fifth-tier cities are mainly concentrated in western Huxian or along its border cities, with a small population base and a small total population flow (Figure 2). In 2019, the total population flow pattern was dominated by large cities, showing a trend of fragmentation. The population flow in urban agglomeration areas is relatively active (Figure 2). The number of first-tier cities has doubled, and the newly added cities are mainly provincial capitals and cities. The first and second levels of the core cities in the urban agglomeration initially outlined the major urban agglomerations in China. Urban agglomerations and provincial capitals such as the Pearl River Delta, Yangtze River Delta, Beijing-Tianjin-Hebei region, Chengdu-Chongqing area, and middle reaches of the Yangtze River are important carriers of population mobility and dominate the population movement in China. However, important labour export cities such as Ganzhou, Hengyang, and Zunyi also emerged in the second level. These cities are more active with migrant labour. The third and fourth levels are weakened and the third level is gradually “westward”. The population flow in the southeastern cities is becoming more frequent and is gradually shifting to a high-flow level.

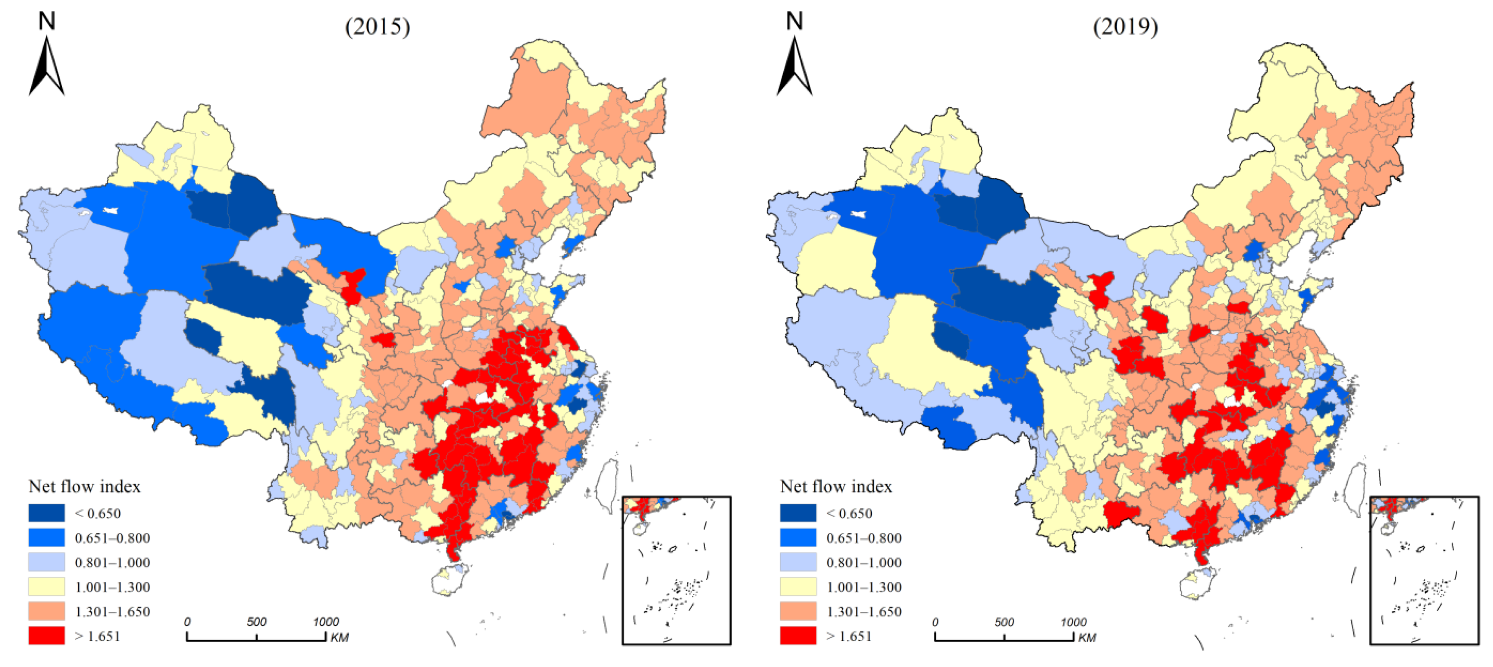
3.2. The Spatial Distribution Characteristics of the Net Population Flow during the Spring Festival Travel Season in China

China’s household registration system has relaxed restrictions on population movement. The amount of population movement is increasing, and the direction of migration is more diversified. During the Spring Festival travel season, the net population movement in space shows regularity and regional differences. Figure 3 shows the spatial evolution of China’s early Spring Festival travel seasons in 2015 and 2019. The cold color net flow index in the figure is less than 1, indicating the net outflow of the urban population. The warm color net flow coefficient is greater than 1, indicating the net inflow of the urban population.
Figure 3 shows that the net population loss during the early Spring Festival travel season in China is mainly concentrated in three regions: the eastern developed areas, including Dongguan, Shenzhen, Beijing, etc.; a few provincial capitals, such as Taiyuan, Kunming, and Zhengzhou; and Xinjiang and its border areas, such as Qinghai, Tibet, and Inner Mongolia, such as Turpan and Haixi. The net population flow in the early Spring Festival travel season exhibited an inverted U shape with a high middle and low sides. This means that during Spring Festival Transport, before the population flow, there was a net outflow of population from the eastern coastal areas on both sides and the northwestern Qinghai-Tibet area, especially the southeast coastal areas. These regions bear most of the country’s net outflows and the central region’s net inflows. Together with the “double vertical pattern” formed by the high-value coastal net inflow areas and the high-value population outflow areas in the central part of the population flow study after the year, this constitutes the population cycle convection before and after the Spring Festival. The population cycle evolution during the Spring Festival travel season under the effect of the spatiotemporal compression of high-speed traffic, the acceleration of population agglomeration, and the diffusion between regions is bound to reshape the spatial distribution pattern of China’s population. It is particularly important to analyze the characteristics of population mobility in such regions.
Specifically, in 2015 and 2019, the number of cities with a net population index lower than 0.8 was 26 and 21, respectively. They are the source areas of population flow in the early Spring Festival travel season and are mainly located in the Guangdong-Hong Kong-Macao Greater Bay area and the west coast of the Taiwan Strait. They constitute important regions, such as the Yangtze River Delta urban agglomeration, the Beijing-Tianjin-Hebei and Shandong Peninsula urban agglomerations, and other highly concentrated areas of economic industry, as well as the northwestern border areas. The economic development level of parts of Qinghai-Tibet, Xinjiang, and Inner Mongolia is lower than the national average, but the net population index is small and the population performance is high. A reasonable explanation for this phenomenon is as follows. On the one hand, Xinjiang and Tibet serve as a gateway for China’s external relations with Central Asia and Europe. The convenience of cross-border trade, coupled with the western development policy, and the full exploitation of mineral resources and tourism resources in the northwest region are important driving forces affecting population agglomeration [35]. On the other hand, the number of population flows in this region accounts for a small share of the national population flow. Due to the large spatial scope and small population base in this area, the proportion of net population outflow is deceptively high [34]. Active cities with a net population inflow index higher than 1.3 are important population sink areas that are concentrated in the central provinces of Anhui, Henan, Hubei, Hunan, Jiangxi, Guangxi, Chongqing, and Sichuan. Additionally, the degree of marginalization of net inflows to active cities continues to intensify. By 2019, the high-value areas of the net population inflow were severely fragmented, and they were scattered on the boundary of the provincial administrative region, forming a “labour export zone around the central province”. From 2015 to 2019, the net population mobility index in the eastern coastal areas changed considerably. The cities in the high-value areas of the central region’s net population inflows dropped significantly (from 50 to 38, a decrease of 24%), thereby balancing the net population in the central region. The main reasons for the decline in the current flow include the rapid economic development of provincial capital cities such as Hefei, Nanchang, Changsha, and Nanning, which have become more attractive to the population in the province. In addition, the industrial foundations of labour-exporting cities such as Chuzhou, Xiangtan, and Fuyang are ideal. The tendency to choose jobs locally during the trade-off has eased the trend of continued net outflow of labour in the central region.

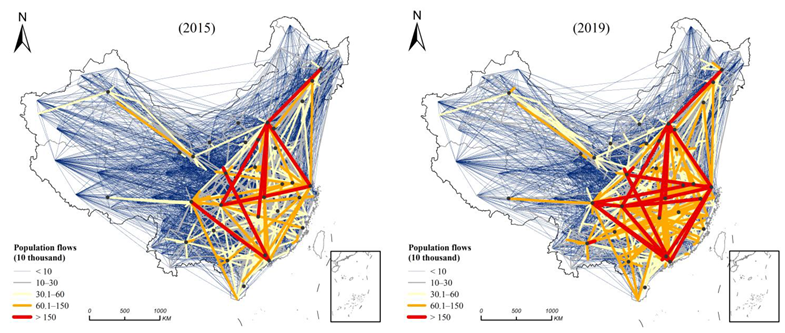
3.3. The Network Pattern of China’s Spring Festival Transport Population Flow

Wei proposed that due to the uneven population flow between cities, a typical directionally weighted geographic network is formed [23]. From a network perspective, portraying the spatial association pattern of the populations between cities is conducive to analyzing the characteristics of the spatial interaction of populations and the evolutionary process of population mobility. The study found that the directionality of the net population inflow during the two periods before and after the Spring Festival is basically symmetrical. This article uses data on the population flow relationship between cities to construct a population flow directional weighting matrix to see the dynamic process and network of China’s intercity population flow feature.
In 2015, China’s population flow network took the form of a diamond network with the Beijing-Tianjin-Hebei region, the Yangtze River Delta, the Pearl River Delta, the Chengdu-Chongqing region, and the middle reaches of the Yangtze River as the fulcrum and the cross-shaped corridor formed by the Beijing-Kowloon Line and the Yangtze River Economic Belt as the axis. The structure of this network is shown in Figure 4. A high-density, high-connectivity spatial relationship is formed within the diamond-shaped network framework. Outside the diamond, there are a large number of population connections along the Jingha and Lanxin Lines, and the rest are characterized by a series of weak population connections. The densely populated diamond-shaped frame is located to the east of the Hu Huanyong Line, confirming the stability of this line’s population distribution pattern in China. In 2019, the diamond-shaped framework of the population flow network continued to be consolidated. Additionally, the number of population connections within the framework increased from 405.44 million to 604.13 million, accounting for more than 80.5% of the national population flow. In addition, with provincial capitals as the frontier, the number of returnees from the Yangtze River Delta and Beijing-Tianjin-Hebei region in Northeast China continued to increase. Provincial capitals such as Nanning and Kunming have played an increasingly prominent role in population mobility, promoting the expansion of the diamond framework.
China’s population flow network has sharp differences between different levels. The first level with population flows greater than 1.5 million person-times is used to identify core cities and major population flow arteries, including Beijing, Shanghai, Guangzhou, Shenzhen, Chongqing, Chengdu, etc., with a high population density in each city. The connection has a strong correlation with the city level and the constraint of geographic spatial distance on population mobility is weakened. In 2019, the population flow in the coastal economic corridors between Shanghai and Guangzhou and Shenzhen increased, and the population flow in multiple cities was upgraded to represent a strong connection. The number of population connections in the central cities has increased considerably and the network has become denser. The second and third tiers with a population flow of more than 300,000 are mainly composed of three parts: the migration of large cities such as Beijing, Shenzhen, and Chengdu to labour-exporting cities such as Xinyang, Ganzhou, and Yiyang; Foshan, Hangzhou, and Fuzhou representing the population transfer between important cities in urban agglomerations and central and western cities; and the concentration and dispersion of populations within and outside the region by regional central cities such as Harbin, Kunming, and Urumqi. The population flow between fourth-tier cities is not large and the network formed is more consistent with China’s main traffic arteries. The population flow shows a strong effect along the way, and the population flow has a high path dependence on the traffic layout. The population flow network of the fifth layer is similar to the random network and there is no obvious regularity.
The population flow network follows the spatial attenuation effect and cities with neighboring spaces are more prone to population flow. Take Guangzhou as an example: In 2015, 11 of the top 20 cities with population outflow in Guangzhou were in Guangdong Province (such as Qingyuan and Foshan), and 3 were the neighboring provinces of Ganzhou, Hengyang, and Yueyang. This finding shows that the population flow intensity is negatively correlated with geographic distance. That is, the closer the distance is, the higher the flow intensity. When the distance increases to a certain extent, the outflow of the Guangdong population comes from large cities such as Chengdu, Wuhan, and Shanghai. Population migration has a greater impact on economic factors and tends to be present in higher-level cities. In population migration research, the geographic distance limit of population mobility has always been a concern. What is the distance limit for the urban population to choose close employment or long-distance migration for employment? What is the difference between this distance limit for cities of different levels? These questions warrant an in-depth analysis.

3.4. Identifying the Source and Sink Areas of Population Flow at Different Levels

3.4.1. Dynamic Division of the Source and Sink Areas of Population Flow

Based on the total population flow and the net population migration index, Figure 2 and Figure 3 show that the evolutionary pattern of population flow is scattered. This situation is not conducive to understanding geographic regions and grasping the laws of population flow. This study uses the regionalization method (REDCAP model) to build increasingly representative regions that will increase the homogeneity within a region. The index selects the net population flow index to describe the difference in and similarity of population flow between regions during the Spring Festival. The selection of the number of regions is made based on Wang [34], and four, ten, and eighteen regions are selected to identify the population source and sink areas at three levels.
At the first level in 2015, China was divided into four regions: west, central, east, and the highly developed Yangtze River Delta region (including Zhejiang, Shanghai, and southern Jiangsu). The layout is similar to the three economic belts of China’s east, middle, and west sections (Figure 5). The central region is a population confluence area. Before the Spring Festival, a large number of people return to the area. The Yangtze River Delta and the western region are considered population source areas. Owing to the pulling force introduced by the Lanxin Line to the population of Gansu, Gansu Province is included in the central region, and the boundary between the central and western regions is similar to that of the Hu Huanyong Line. The Yangtze River Delta region, the first-level population source area identified in the hierarchical clustering, experienced a large-scale population exodus in the early period of the Spring Festival, with a regional net population index of 0.892. Shanghai is China’s economic center and innovation highland. The Yangtze River Delta region, of which Shanghai is the core, has supported China’s economic growth and houses a large number of migrant workers.
Next, the model divides ten regions to refine the regionalization pattern of population flow (Figure 5). There is basically no change between the Yangtze River Delta region and the western region. The central and eastern regions are divided into multiple regions; region 3 is roughly divided into north and south components along the Qinling and Huaihe Rivers. The population inflow from the north is relatively sparse. It is formed in northeastern Harbin, Siping, and Tieling. The “tadpole-like” population inflow area is high. The Pearl River Delta region, with high population outflows with Guangzhou and Shenzhen as the core, is identified on the south side. In addition, the net population inflow zone on the border between Guangdong and Guangxi is demarcated. The main bodies of area 3 are Shaanxi, Henan, and Southwest China, which are important labour export regions. Area 4 is the area with the highest net inflow of population. It is divided into area 9, centered on Nanchang and Changsha in the middle reaches of the Yangtze River, and area 8, near the Yangtze River Delta in Anhui and Fujian. These are areas of weak net inflow.
With the refinement of the hierarchy, more regions can be identified. The 18 regions derived and shown in Figure 5 can basically reflect the overall situation of China’s economic development. Regions 13, 15, and 16 are the Beijing-Tianjin-Hebei region, the Shandong Peninsula region, and the west coast of the Taiwan Strait, respectively. They are divided as the source regions of China’s population outflow. These regions benefit from superior location conditions and the country’s early policies of reform and opening up. They have become an economic highland in eastern China and are one of the important destinations for labour. Notably, region 14 includes Chongqing and parts of Sichuan as one of the largest labour export regions in China. The average net population inflow coefficient is 1.39. There is no disparity in the net population inflow. A more reasonable explanation is that Chongqing is the gateway to the southwest region. On the one hand, it is an important labour inflow area, and it also provides a large number of nearby jobs for surrounding areas. On the other hand, as an important population distribution hub, the large temporary population balances the net flow. Region 11 contains only two cities, Zhanjiang and Maoming, with an average net population coefficient of 2.349. It is the region with the highest net population inflow ratio. This area is an important hinterland of the Pearl River Delta region, and it provides a large amount of labour for this region. In addition, this area is a cold holiday resort, and, in this regard, it is second only to Hainan. The tropical environment and scenery attract tourists, who then spend the Spring Festival here.
The overall identification of source and sink areas of population flows in 2019 is similar to that in 2015, with some subtle changes. The boundary between region 2 and region 3 in the four subregions is smoother, and the western regions, such as Xinjiang, Qinghai, and Tibet, are mainly divided into population source areas. Areas 3 and 4 have not changed considerably. Area 1 is mainly the Yangtze River Delta and extends to the coast and the Shanghai-Kunming Line. The two areas are straits centered on Anhui and Jiangxi and the area near the provincial capital of Hunan and Fuzhou and Xiamen. The West Bund region was the source area for the return of the population before the Spring Festival (Figure 6). The 10 regions are divided by the model. Region 3 divides China’s northern and southern regions with large differences, identifies the population source area with the lowest net flow index in the Pearl River Delta region, and divides two population gathering areas near the Qinling and Huai River lines, i.e., region 8 and region 9. A common feature of the two regions is that the cities in the regions are located on the provincial boundary and contain more migrant workers (Figure 6). Next, the model divides 18 regions to roughly reflect the level of urbanization development in China. The eastern coastal area is used to identify population sources supporting a high degree of urbanization and industrialization and a high demand for labour. The central, northeastern, and southwestern regions of China are discretized due to natural and societal factors. The combined effects of factors cause the population to leave for work. Additionally, the perennial population and the household registration space are mismatched in the population gathering areas where the population returned to their hometown before the year (Figure 6).

3.4.2. Classification of Source and Sink Areas of Population Flow

As shown in Table 1, the 18 regions in the two years are divided into six types based on the regions’ net population coefficient and geographic environment. The differences in the geographic environments are conducive to understanding the economic and cultural process behind this coefficient.
The first category is China’s most important “source area”, with a highly developed economy. This category includes the Yangtze River Delta, Pearl River Delta, and Beijing-Tianjin-Hebei region. These regions benefited from the early policy of reform and opening up and they led the development of China’s economy. The migrant population played an important role in the development process, which was referred to as the “outer urbanization” phenomenon. The second category is the secondary “source area”, i.e., an urbanized area with a developed economy. In 2015, the Shandong Peninsula and the west coast of the Taiwan Straits were included. In 19 years, only the Shandong Peninsula remained. The west coast of the straits represented a weak net inflow of population as more marginal areas were included. The third category has high population mobility and is mainly distributed in western China. For a long time, the western development policy has driven the development of local industries and resources, and a year ago, the western region became the main source of population flow. Due to the industrial pull and the corridor effect of railways, more Qinghai and Xinjiang regions will be highlighted in the source areas in 2019. The fourth category is the population subsink area. In 2015, the capital cities and surrounding areas, including the middle reaches of the Yangtze River, the Yunnan area, and the northern inland areas, were used in the process of accepting the return of the population from developed areas and the depopulation of economically poor areas, which maintained a weak net inflow of population. The fifth category is the labour export area. In 2015, it was included in the northeast, southwest, and border areas of Fujian and Anhui. In 2019, this type was divided into the northeast and border areas of Guangdong and Guangxi. The sixth type of first-level confluence areas are areas where labour services are concentrated, namely, Sichuan-Chongqing labour service export areas, Jiangxi, Henan, Anhui and other central labour export areas, and the border areas of Guangdong and Guangxi. The northward trend of the confluence area was obvious in 2019, and the provincial boundary areas along the Huaihe River in the Qinling Mountains were identified.

3.4.3. The Organization Model of Population Flow Sources and Sinks

The source-flow-sink system of the population during the Spring Festival travel season in China exhibits obvious differences between the different levels, forming a network nesting at multiple scales. This article takes the areas under the 18 divisions as the source area and sink area nodes, merges upward into 10 areas and 4 areas, and extracts the population flow between the source and sink areas, i.e., the population flow corridor.
As shown in Figure 7, in 2015, the source-flow-sink system mainly formed a closed and strong flow around areas 1, 3, and 4. The population in the Yangtze River Delta diverted to central areas 3 and 4, and the population in the western area strongly flowed to the central area. The second level region 3 refines the clusters centered on regions 3, 5, and 6, and on regions 7 and 10. The Pearl River Delta is the main source area. The population flows out to regions 3 and 6. Region 5 serves as the distribution center in the north and the population moves towards the northeast. The region is moderately mobile, forming strong convection with the central and southern regions. Region 4 mainly undertakes the return of population from the Pearl River Delta and the Yangtze River Delta. Additionally, there is an intermediate population flow in the region and the Nanchang-Changsha district and northern Fujian-Huinan subregions with better economic conditions. In 2019, the population mainly flowed from coastal urban agglomerations to the central region. The organizational pattern of the first-level source flow and sink is similar to that in 2015. A strong population flow occurred between regions 1, 3, and 4, and the population flowed from the Yangtze River Delta to the inland area. The main hierarchical nesting occurs in Hui District 3, which divides the typical southern and northern groups. A strong population flow in the southern group occurs in southwestern regions such as the Pearl River Delta to Sichuan and Chongqing. The northern group represents the population of Beijing-Tianjin-Hebei and the Shandong Peninsula. It flows to the northeast region and the provincial boundary areas along the Qinling-Huaihe River. Overall, due to differences in policies and locations between the east and west, China has experienced the first level of differentiation in population mobility. Regional differences between the north and south have led to the second level of differentiation in population mobility. Local regional factors have formed the third differentiation of regionalization.

4. Discussion

4.1. Significance for Research on Population Mobility

Accurately portraying the far-reaching social phenomenon of population mobility has always been of major interest and a difficult problem in academic research. Many studies use multisource data and multiple indicators to substitute parameters to characterize population mobility patterns. However, they do not take into account the temporal heterogeneity of data and the spatial and temporal variability of the source-flow-sink system. This article draws on source-sink theory, flow space theories, and spatial analysis methods to form a comprehensive analysis framework for population flow research. It takes the typical population flow during the Spring Festival travel in China as a research case. Additionally, it uses the regionalization model to divide the source and sink areas and embeds flow elements into source-sink theory. Furthermore, it dynamically analyzes the source-sink process of the population flow phenomenon. It also discusses the population flow during Spring Festival Transport in China based on the number of different regional changes in the pattern of sources, flows, and sinks, and the evolution of organizational models. This article addresses the research case of population mobility and, to a certain extent, enriches the perspectives and methods of population mobility research.
The phenomenon of population mobility includes three links: inflow, outflow, and migration flow, which is a typical “source-flow-sink”. It has natural advantages to apply source-sink theory and flow space theory to the study of population mobility. This paper effectively solves two problems: First, depict the pattern of the source and sink areas of population mobility, identify the flow direction of the population in the source area and the main source of the population in the sink area, and accurately grasp the evolution of the population “source and sink” and the changes of population flow. Second, the “source-flow-sink” of population mobility at different levels, analyzing the hierarchical differentiation and network nesting of the phenomenon of population mobility.

4.2. The Role of and Suggestions for the Optimal Allocation of Population Resources

Humans are the main body of regional social and economic activities. The spatial flow of the population is often accompanied by the exchange of production factors such as material, information, technology, and capital between regions. Such exchange affects the reaggregation and diffusion of these social and economic factors within a certain range. These effects will further increase the shape of a new population distribution pattern. This paper connects the spatial characteristics of population flow with the network structure, deconstructs the source-flow-sink process of population mobility, and dynamically depicts the main source and sink areas of population mobility and the population interaction corridor between the two, i.e., the region. The optimal allocation of population resources provides a scientific theoretical basis for such studies. This paper finds that in the population source-sink system, the eastern urban agglomeration is the main source of population, and the population sink in the central region is severely differentiated. The border areas of the central provinces, the mountainous and hilly regions, and the Sichuan-Chongqing region constitute the most important labour export areas in China. The provincial capital cities have large populations. The collecting and distributing role of mobility has become increasingly prominent. The government should optimize the allocation of population resources, adjust the regional industrial structure, compensate for the shortcomings in the development of disadvantaged regions, and achieve coordinated development between regions and the sustainable development of population and space. Specifically, the border areas and mountainous and hilly regions of Anhui and Jiangxi in central China have always represented areas in which the labour force has migrated out in great numbers. In the process of urbanization, to inform the selection of local jobs, how to develop small and medium-sized cities, upgrade the industrial structure, improve the level of infrastructure and public services, and guide the population need careful consideration. Sichuan and Chongqing have formed growth poles, such as those of Chongqing and Chengdu, and the migrant workers in the Yangtze River Delta and Pearl River Delta regions still represent a very populous pool. How to adjust the industrial structure in the region to achieve the coordinated clustering of population and industry and to give full play to the growth poles for the region is particularly important. In addition, special population sources and sink areas such as northwestern and southern Guangdong should be included in the regional governance system to form a regional governance model based on the net population flow index, the regional geographic environment, and the coordination of population resources and socioeconomic space.
It is worth noting that there are some differences in urban population mobility in countries with different economic development levels and different topographic characteristics. As a typical developing country in Africa, Egypt’s source-sink system of population flow is still in an immature development stage compared with China. Its population flow presents the characteristics of stepped runoff from east to west and local convection from north to south. Similar to China, the interprovincial population flow is dominated by the neighborhood infiltration of high-level nodes, the population convergence areas are concentrated in large cities, and the population source areas are economically backward areas. In the United States, a developed country, the population is concentrated in the metropolitan area, and the population inside and outside the metropolitan area maintains a good proportion. The population of the top 20 metropolitan areas accounts for 40% of the country. With the economic transformation, more people in the northeast and central United States migrate to the southeast and west. In the process of population mobility, we should actively deal with many problems: First, we should actively cultivate small and medium-sized cities, improve the level of infrastructure and public services, form a reasonable urbanization system, and avoid the negative externalities caused by excessive population agglomeration. We should also promote the effective flow of advantageous population among cities at different levels and promote the rational allocation of population resources and regional high-quality development. Secondly, under the guidance of scientific and technological innovation, adjust the regional industrial structure, make up for the development shortcomings of vulnerable regions, guide the flow of population with industry, and form the synergy of population and industry. This provides a favorable reference for the majority of developing countries to adjust their population development strategies and realize the scientific and effective allocation of population.

5. Conclusions

This paper draws on source-sink theory and flow space theory, and it combines spatial analysis methods and regionalization models to construct a comprehensive analysis framework of population flow. In doing so, it dynamically portrays the differentiation of the population flow space and network pattern during the Spring Festival travel season in China. Flow elements are embedded into source-sink theory to explore the evolution of the source-sink nodes and the main population flow axis and to extract the source-sink organization mode. The main conclusions are as follows:
(1)
The population flow during Spring Festival Transport in China is mainly concentrated east of the Hu Huanyong Line, which plays a relatively stable role in defining the differences in the population flow in China. There is strong spatial heterogeneity in the growth of the total population flow. The population flow in the “T-shaped” area formed by the Hu Huanyong Line and Lanxin Line has increased considerably. Provincial capital cities such as Hangzhou, Nanjing, and Hefei are gathering and dispersing in population flow. The role is increasingly prominent.
(2)
The net population outflow areas are mainly concentrated in the easternmost developed regions, some provincial capital cities, and some western regions. The net population flow in space presents an inverted U-shaped pattern that is high in the middle and low on both sides. The net inflow areas are concentrated in Anhui central provinces, such as Henan and Jiangxi, which have evolved spatially and discretely, and they distributed on the boundaries of provincial administrative regions, forming the labour export zone surrounding the central province.
(3)
The population flow network during Spring Festival Transport in China has gradually formed a diamond network structure. The Beijing-Tianjin-Hebei, Yangtze River Delta, Pearl River Delta, and Chengdu-Chongqing regions and the middle reaches of the Yangtze River act as the fulcrum. The Beijing-Kowloon Line and the cross-shaped corridor of the Yangtze River Economic Belt act as the axis. The western region represents a series of weak population ties. The population flow network has obvious hierarchical characteristics. The first level of connection mainly occurs in core cities such as Beijing, Shanghai, Guangzhou, Shenzhen, Chengdu, and Chongqing, and the distance attenuation effect is weakened. The second and third levels are concentrated in the important population source and sink areas. The fourth level of population flow is connected to China. The main traffic arteries are relatively consistent and the effect of population flow along the way is obvious. The fifth-level population flow network is similar to the random network.
(4)
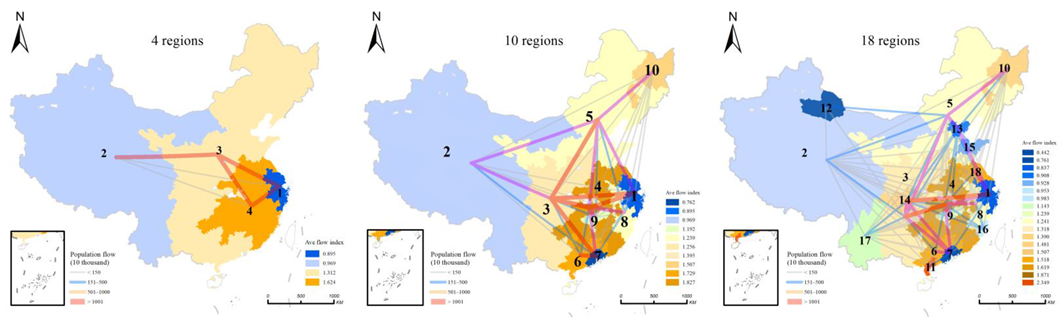
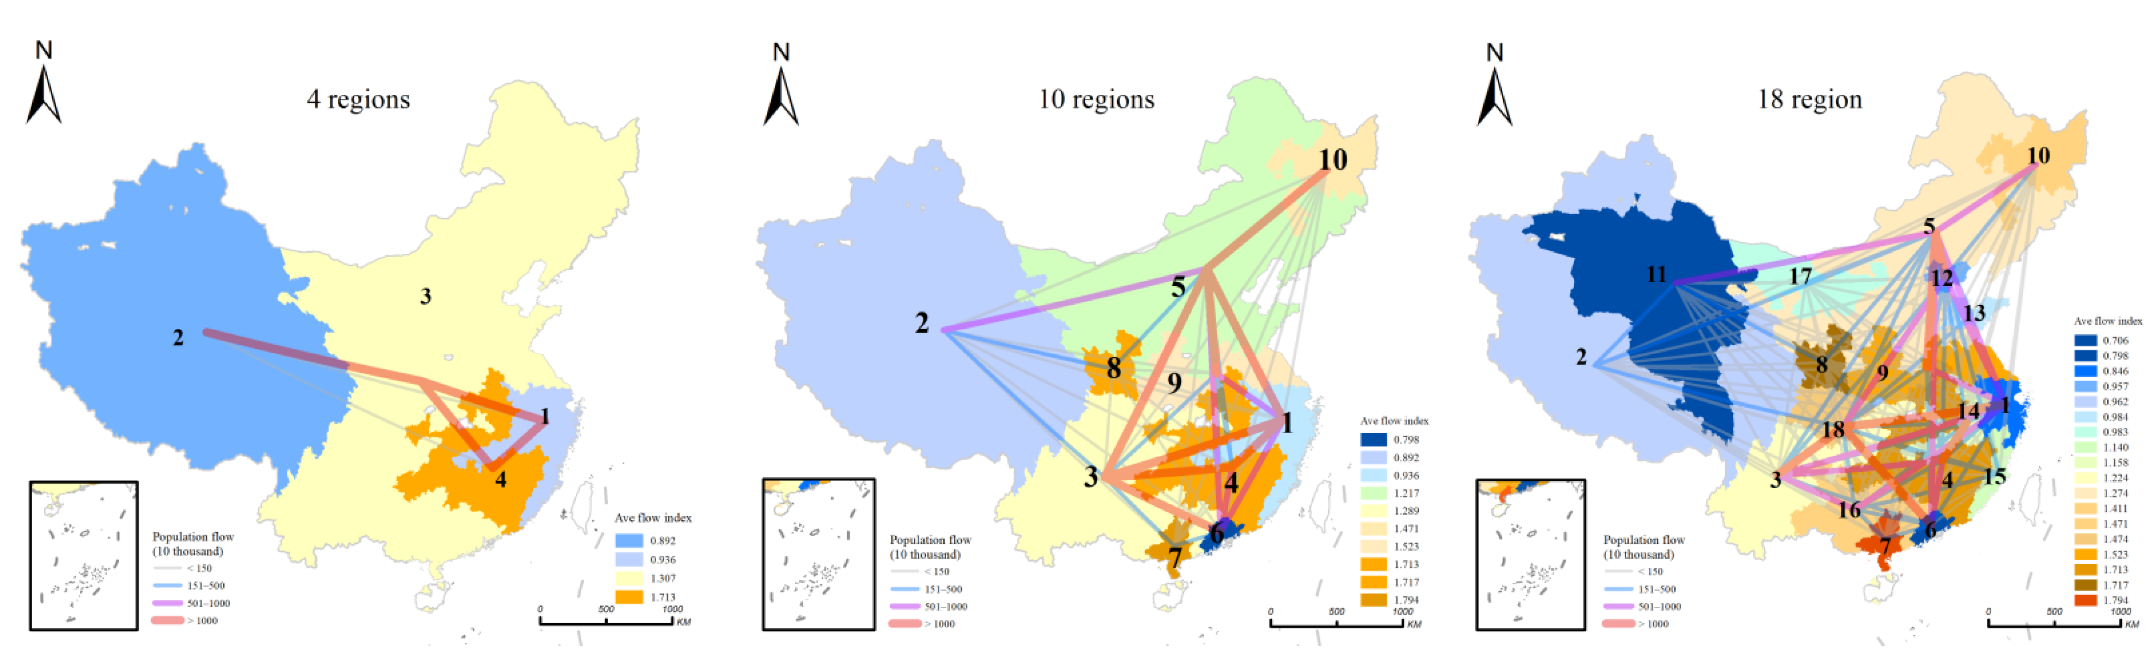
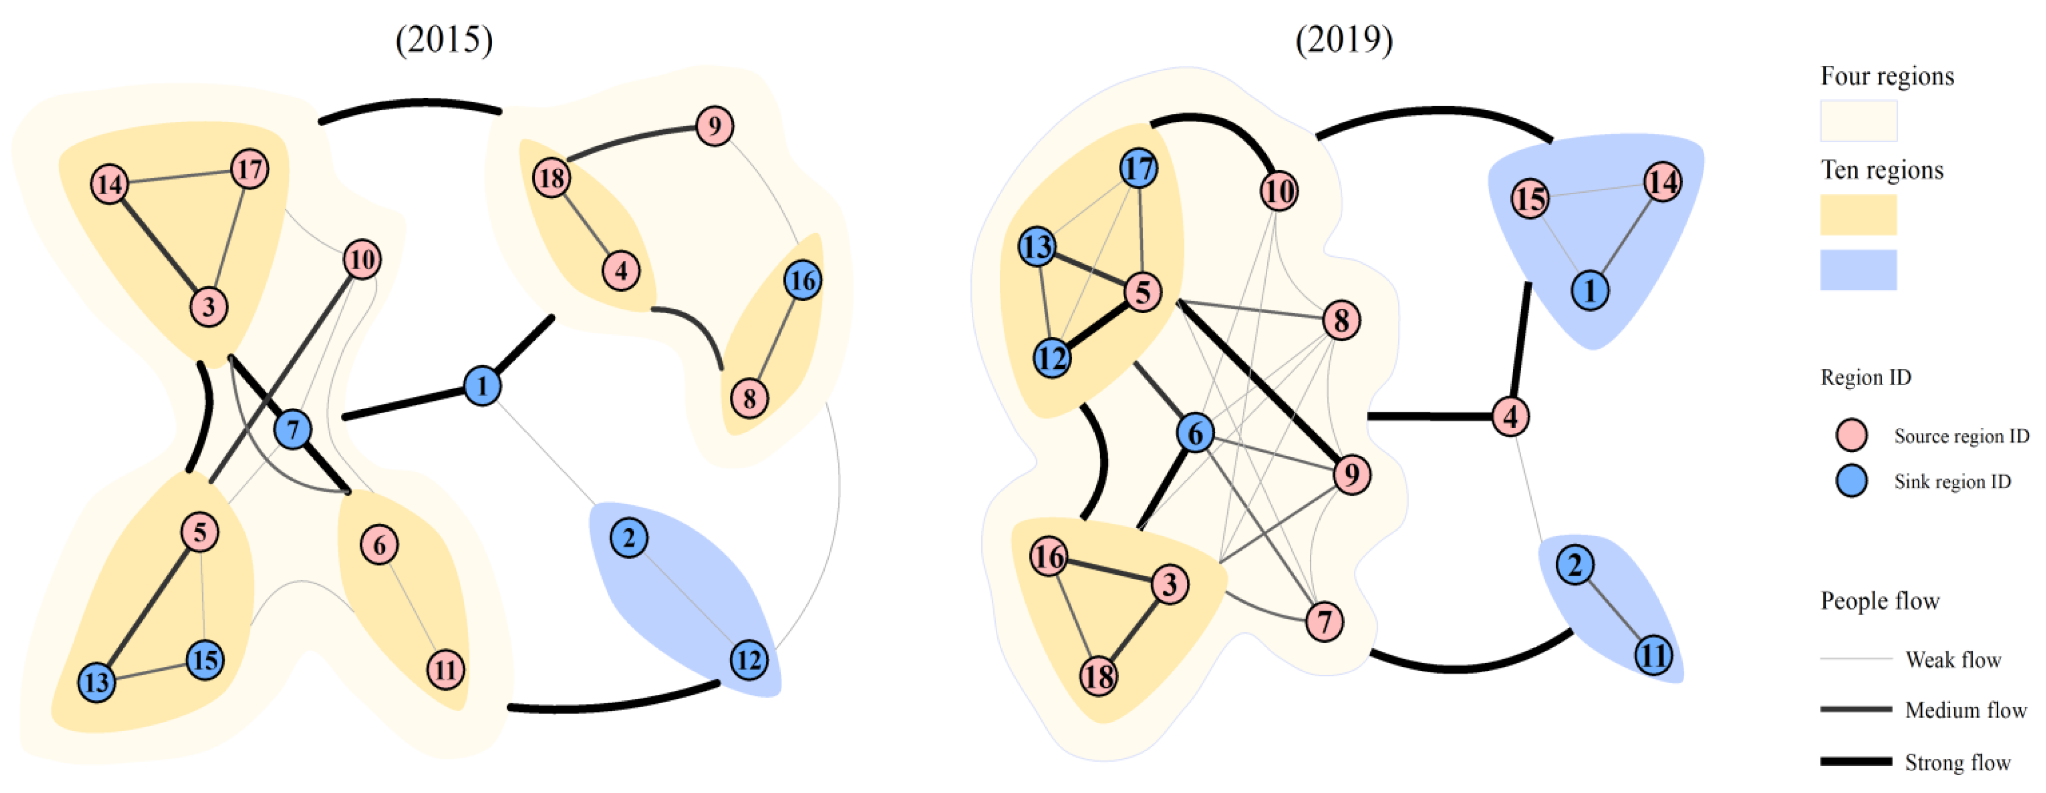
The population flow source and sink areas are divided into four areas of the first level similar to the three economic belts of eastern, central, and western China. In the second level, which contains 10 areas, important population sources and sink areas are divided, such as the Pearl River Delta and the central region. The 18 regions in the tier can basically reflect the overall situation of China’s economic development. Among the six types of population movement, the first two source areas are mainly the eastern coastal urban agglomeration areas, which bear most of China’s population outflow. The western source areas are due to industry, tourism, and other factors that have high population mobility. The three-tier confluence areas are mainly concentrated in Sichuan and Chongqing and the central provinces, especially at the junction of the central provinces. The source-sink system of population flow shows obvious network nesting.

Author Contributions

Z.X. conceived and designed this study; Z.X. collected and analyzed the data; M.B. and H.M. provided assistance for supervision and visualization; Z.X. wrote the paper; Z.X., M.B. and Y.Z. reviewed and revised the paper; and X.F. contributed to the progress of the research idea. All authors have read and agreed to the published version of the manuscript.

Funding

This research was funded by the National Natural Science Foundation of China (Grant No. 41961043) and Humanities and Social Science Research Projects in Colleges and Universities in Jiangxi Province (Grant No. JC20206).

Informed Consent Statement

Informed consent was obtained from all subjects involved in the study.

Data Availability Statement

https://heat.qq.com/qianxi.php, accessed on 9 February 2019.

Conflicts of Interest

The authors declare no conflict of interest.

References

  1. De Haas, H. Migration and development: A theoretical perspective. Int. Migr. Rev. 2010, 44, 227–264. [Google Scholar] [CrossRef] [PubMed] [Green Version]
  2. Li, S.M. Population migration regional economic growth and income determination: A comparative study of Dongguan and Meizhou China. Urban Stud. 2014, 34, 999–1026. [Google Scholar] [CrossRef]
  3. Halás, M.; Klapka, P.; Tonev, P. The use of migration data to define functional regions: The case of the Czech Republic. Appl. Geogr. 2016, 76, 98–105. [Google Scholar] [CrossRef]
  4. Wang, J.; Kim, S. Multilevel analysis of social and Policy acceptance of immigrants across European countries and its implications for comparative policy. J. Comp. Policy Anal. 2020, 1–52. [Google Scholar] [CrossRef]
  5. Windzio, M. The network of global migration 1990–2013. Soc. Netw. 2018, 53, 20–29. [Google Scholar] [CrossRef]
  6. Morrill, R. Fifty years of population change in the US 1960–2010. Cities 2012, 29, S29–S40. [Google Scholar] [CrossRef]
  7. Wang, X.; Hui, E.C.; Sun, J. Population migration, urbanization and housing prices: Evidence from the cities in China. Habitat Int. 2017, 66, 49–56. [Google Scholar] [CrossRef]
  8. Louail, T.; Lenormand, M.; Cantu Ros, O.G.; Picornell, M.; Herranz, R.; Frias-Martinez, E.; Barthelemy, M. From mobile phone data to the spatial structure of cities. Sci. Rep. 2014, 4, 1–12. [Google Scholar] [CrossRef] [PubMed] [Green Version]
  9. Bengtsson, L.; Gaudart, J.; Lu, X.; Moore, S.; Wetter, E.; Sallah, K.; Piarroux, R. Using mobile phone data to predict the spatial spread of cholera. Sci. Rep. 2015, 5, 1–5. [Google Scholar] [CrossRef] [PubMed]
  10. Gariazzo, C.; Pelliccioni, A. A multi-city urban population movement study using mobile phone traffic data. Appl. Spat. Anal. 2019, 12, 753–771. [Google Scholar] [CrossRef]
  11. Lee, K.S.; You, S.Y.; Eom, J.K.; Song, J.; Min, J.H. Urban spatiotemporal analysis using mobile phone data: Case study of medium- and large-sized Korean cities. Habitat Int. 2018, 73, 6–15. [Google Scholar] [CrossRef]
  12. Picornell, M.; Ruiz, T.; Lenormand, M.; Ramasco, J.J.; Dubernet, T.; Frías-Martínez, E. Exploring the potential of phone call data to characterize the relationship between social network and travel behavior. Transportation 2015, 42, 647–668. [Google Scholar] [CrossRef] [Green Version]
  13. Sagl, G.; Delmelle, E.; Delmelle, E. Mapping collective human activity in an urban environment based on mobile phone data. Cartogr. Geogr. Inform. Sci. 2014, 41, 272–285. [Google Scholar] [CrossRef] [Green Version]
  14. Rinzivillo, S.; Mainardi, S.; Pezzoni, F.; Coscia, M.; Pedreschi, D.; Giannotti, F. Discovering the geographical borders of human mobility. Künstl. Intell. 2012, 26, 253–260. [Google Scholar] [CrossRef]
  15. Guimera, R.; Mossa, S.; Turtschi, A.; Amaral, L.A.N. The worldwide air transportation network: Anomalous centrality, subnetwork structure, and cities’global roles. Proc. Natl. Acad. Sci. USA 2005, 102, 7794–7799. [Google Scholar] [CrossRef] [Green Version]
  16. Wang, L. High-speed rail services development and regional accessibility restructuring: The case of the Yangtze River Delta, China. Transport. Policy 2018, 72, 34–44. [Google Scholar] [CrossRef]
  17. Zhong, Y.; Wu, S.; Feng, X.; Wu, Q. The network structure characteristics of the urban agglomeration in the middle reaches of the Yangtze River from the perspective of multi-flow space. J. Jiangxi Norm. Univ. (Philos. Soc. Sci. Ed.) 2020, 53, 47–55. (In Chinese) [Google Scholar]
  18. Hawelka, B.; Sitko, I.; Beinat, E.; Sobolevsky, S.; Kazakopoulos, P.; Ratti, C. Geo-located Twitter as proxy for global mobility patterns. Cartogr. Geogr. Inform. Sci. 2014, 41, 260–271. [Google Scholar] [CrossRef] [Green Version]
  19. Liu, Y.; Sui, Z.; Kang, C.; Gao, Y. Uncovering Patterns of Inter-Urban Trip and Spatial Interaction from Social Media Check-In Data. PLoS ONE 2014, 9, e86026. [Google Scholar] [CrossRef] [PubMed]
  20. Roberts, H.; Sadler, J.; Chapman, L. Using Twitter to INVESTIGATE seasonal variation in physical activity in urban green space. Geo Geogr. Environ. 2017, 4, e00041. [Google Scholar] [CrossRef]
  21. Xu, J.; Li, A.; Li, D. Difference of urban development in China from the perspective of passenger transport around Spring Festival. Appl. Geogr. 2017, 87, 85–96. [Google Scholar] [CrossRef]
  22. Wei, Y.; Song, W.; Xiu, C.; Zhao, Z. The rich-club phenomenon of China’s population flow network during the country’s spring festival. Appl. Geogr. 2018, 96, 77–85. [Google Scholar] [CrossRef]
  23. Kawecki, T.J. Demography of source-sink populations and the evolution of ecological niches. Evol. Ecol. 1995, 9, 38–44. [Google Scholar] [CrossRef]
  24. Pan, J.; Lai, J. Spatial pattern of population mobility among cities in China: Case study of the National day plus Mid-autumn festival based on tencent migration data. Cities 2019, 94, 55–69. [Google Scholar] [CrossRef]
  25. Brawn, J.D.; Robinson, S.K. Source-Sink Population Dynamics may Complicate the Interpretation of Long-Term Census Data. Ecology 1996, 1, 3–12. [Google Scholar] [CrossRef]
  26. Gundersen, G.; Johannesen, E.; Andreassen, H.P.; Ims, R.A. Source–sink dynamics: How sinks affect demography of sources. Ecol. Lett. 2001, 4, 14–21. [Google Scholar] [CrossRef]
  27. Ma, Z.; Zhang, S.; Zhao, S. Study on the spatial pattern of Migration population in Egypt and its flow field characteristics from the perspective of “source-flow-sink”. Sustainability 2021, 13, 350. [Google Scholar] [CrossRef]
  28. Fuchs, M.; Hopken, W.; Lexhagen, M. Big data analytics for knowledge generation in tourism destinations—A case from Sweden. J. Destin. Mark. Manag. 2014, 3, 198–209. [Google Scholar] [CrossRef]
  29. Li, J.; Ye, Q.; Deng, X.; Liu, Y.; Liu, Y. Spatial-temporal analysis on spring festival travel rush in China based on multisource big data. Sustainability 2016, 8, 1184. [Google Scholar] [CrossRef] [Green Version]
  30. Wang, X.; Chen, L.; Mao, W.; Hu, Z.; Gu, L. Tracing the largest seasonal migration on earth. Physics 2014, arXiv:1411.0983. [Google Scholar]
  31. Wei, Y.; Xiu, C.; Liu, Z.; Chen, W. Spatial pattern of city network in transitional China based on the population flows in “Chunyun” period. Sci. Geogr. Sin. 2016, 36, 1654–1660. (In Chinese) [Google Scholar]
  32. Wu, Q.; Tao, J.; Wu, K.; Zhao, M. Daily commuting behavior characteristics of high-speed rail passengers in the Yangtze River Delta region: A case study of Shanghai-Hangzhou, Nanjing-Hangzhou, and Hangzhou-Ningbo lines. City Plan. Rev. 2018, 42, 90–97. (In Chinese) [Google Scholar]
  33. Kain, J.F. A pioneers perspective on the spatial mismatch literature. Urban Stud. 2004, 41, 7–32. [Google Scholar] [CrossRef]
  34. Wang, Y.; Wang, F.; Zhang, Y.; Liu, Y. Delineating urbanization “SOURCE-SINK” regions in China: Evidence from mobile app data. Cities 2019, 86, 167–177. [Google Scholar] [CrossRef]
  35. Zhang, W.; Chong, Z.; Li, X.; Nie, G. Spatial patterns and Determinant factors of population FLOW networks in China: Analysis on Tencent Location big data. Cities 2020, 99, 102640. [Google Scholar] [CrossRef]
  36. Paquet, M.; Arlt, D.; Knape, J.; Low, M.; Forslund, P.; Part, T. Why we should care about movements: Using spatially explicit integrated population models to assess habitat source–sink dynamics. J. Anim. Ecol. 2020, 89, 2922–2933. [Google Scholar] [CrossRef] [PubMed]
  37. Feng, X.; Xiu, C.; Bai, L.; Zhong, Y.; Wei, Y. Comprehensive evaluation of urban resilience based on the perspective of landscape pattern: A case study of Shenyang city. Cities 2020, 104, 102722. [Google Scholar] [CrossRef]
  38. Huang, W.; Gao, B.; Lin, J.; Cui, S.; Zhong, Q.; Huang, C.L. Driving forces of nitrogen input into city-level food systems: Comparing a food-source with a food-sink prefecture-level city in China. Resour. Conserv. Recycl. 2020, 160, 104850. [Google Scholar] [CrossRef]
  39. Sakalli, A. The responses of net ecosystem production to climate change: A modelling study to identify the sink and source of carbon regions at the paneuropean scale. Appl. Ecol. Environ. Res. 2020, 18, 4569–4581. [Google Scholar] [CrossRef]
  40. Liu, Y.; Wang, F.; Xiao, Y.; Gao, S. Urban land uses and traffic ‘source-sink areas’: Evidence from GPS-enabled taxi data in Shanghai. Landsc. Urban. Plan. 2012, 106, 73–87. [Google Scholar] [CrossRef]
  41. Guo, D. Regionalization with dynamically constrained agglomerative clustering and partitioning (redcap). J. Geogr. Inf. Sci. 2008, 22, 801–823. [Google Scholar] [CrossRef]
  42. Guo, D.; Wang, H. Automatic region building for spatial analysis: Automatic region building for spatial analysis. Trans. GIS 2011, 15, 29–45. [Google Scholar] [CrossRef]
  43. Liu, C.; Xu, Y.; Wang, F. Population distribution patterns and changes in China 1953–2010. J. Geogr. Sci. 2019, 29, 1908–1922. [Google Scholar] [CrossRef] [Green Version]
Figure 1. China regional overview map.
Urbansci 05 00066 g001
Figure 2. The total population flow in the early Spring Festival travel season.
Urbansci 05 00066 g002
Figure 3. Spatial distribution of net population flow during Spring Festival Transport in China.
Urbansci 05 00066 g003
Figure 4. Population flow network during the Spring Festival travel season in China.
Urbansci 05 00066 g004
Figure 5. The “source-flow-sink” system of population flow during Spring Festival Transport in 2015 in China.
Urbansci 05 00066 g005
Figure 6. The “source-flow-sink” system of population flow during Spring Festival Transport in 2019 in China.
Urbansci 05 00066 g006
Figure 7. The “source-flow-sink” organization model of population flow in China.
Urbansci 05 00066 g007
Table 1. Classification of the source and sink areas of population flow during the Spring Festival travel season.
TypesClassification20152019
Region IDFlow IndexSpecific RegionDescriptionRegion IDFlow IndexSpecific RegionDescription
IHigh outflow regions70.761Pearl River Delta regionGuangzhou, Shenzhen, Zhuhai, Foshan, Jiangmen, Huizhou, Dongguan, and Zhongshan60.799Pearl River Delta regionGuangzhou, Shenzhen, Zhuhai, Foshan, Jiangmen, Huizhou, Dongguan, and Zhongshan
10.84Yangtze River Delta regionShanghai, southern Jiangsu, and Zhejiang Province10.846Yangtze River DeltaShanghai, southern Jiangsu, and most of Zhejiang
130.908Beijing-Tianjin-Hebei regionBeijing, Tianjin, Tangshan, Qinhuangdao, and Langfang120.958Beijing-Tianjin-Hebei regionBeijing, Tianjin, Tangshan, Qinhuangdao, and Langfang
IIModerate outflow regions150.953Shandong PeninsulaJinan, Qingdao, Zibo, Dongying, Yantai, Weifang, Weihai, and Binzhou130.983Shandong PeninsulaJinan, Qingdao, Zibo, Dongying, Yantai, Weifang, Weihai, and Binzhou
160.983West coast of the straitFuzhou, Xiamen, Putian, and Quanzhou
IIIWeak outflow regions20.93Western ChinaXinjiang, Tibet, Qinghai, Sichuan, Gansu, and parts of Yunnan Province170.984Yinchuan-HohhotWestern Inner Mongolia and Yinchuan
120.442Turpan-HamiTurpan and Hami20.965Western ChinaXinjiang, Tibet, Qinghai, Sichuan, Gansu, and parts of Yunnan
110.706Qinghai-centred regionThe borders of Xinjiang, Gansu, Qinghai, Qamdo, and Tibet
IVWeak inflow region171.143Kunming-centred regionPanzhihua, Leshan, Meishan, Ya’an and Liangshan in Yunnan, and Sichuan Province151.14West coast of the straitFuzhou, Xiamen and other areas of Fujian Province and Lishui, Shantou, and Chaozhou
91.239Nanchang-Changsha areaChangsha, Zhuzhou, Xiangtan, and Nanchang, Xinyu, Pingxiang, and Yichun in Hunan Province141.158Hefei-Changsha regionAnhui, Jiangxi, Hunan, and other provincial capitals and their surrounding areas
51.247Northern inlandParts of Inner Mongolia, Jilin, Liaoning, Hebei, Shaanxi, Shanxi, Shandong and Henan Provinces31.217Part of the southwestParts of Yunnan, Sichuan, Guizhou, Hubei and Hunan Provinces
51.274Northern inlandParts of Inner Mongolia, Jilin, Liaoning, Hebei, Shaanxi, and other provinces
VModerate inflow region81.318Southern Anhui-northern FujianSanming, Nanping and Ningde in Fujian Province, Jingdezhen and Yingtan in Jiangxi Province, and parts of Anhui Province161.411Guangxi and surrounding areasGuangxi Province, western Guangdong Province and southwest Guizhou
31.4Southern inlandParts of Henan, Shaanxi, Hubei, Hunan, Guangxi and Sichuan provinces101.472Harbin-centred regionCentral and eastern Heilongjiang, Jilin Province, Siping, Songyuan
101.507Harbin-centred regionThe central and eastern parts of Heilongjiang Province, Siping and Songyuan of Jilin Province
VIHighly inflow region141.345Sichuan-Chongqing regionChongqing and the provinces of Chengdu, Deyang, Suining, Nanchong, Guang’an, Dazhou, and Ziyang181.353Sichuan-Chongqing regionChongqing, Chengdu, Deyang, Mianyang and other Sichuan provinces
181.518Northern JiangsuNorthern Jiangsu, Bengbu, Huaibei, Chuzhou, Heze, and Shandong91.523Henan-northern Jiangsu regionNorth Jiangsu, Shandong, Anhui, Henan, Shanxi, Shaanxi and Hubei Provinces and other border areas
61.619Guangdong-Guangxi regionThe western part of Guangdong and the eastern part of Guangxi41.714South-eastern inlandParts of Henan, Shaanxi, Hubei, Hunan, Jiangxi, Guangxi, Guangdong and Fujian Provinces
41.871Central regionParts of Anhui, Henan, Hubei, Hunan, Jiangxi and Guangxi Provinces81.717Shaanxi-Gansu border regionSoutheast Gansu Province, Hanzhong and Baoji
112.349Southern GuangdongZhanjiang and Maoming71.794South of Guangxi, GuangdongSouth Guangxi, Zhanjiang and Maoming
Publisher’s Note: MDPI stays neutral with regard to jurisdictional claims in published maps and institutional affiliations.

