
Machine Learning Algorithms for Urban Land Use Planning: A Review


Chair of Land Management, Technical University of Munich (TUM), 80333 Munich, Germany
*
Author to whom correspondence should be addressed.
Urban Sci. 2021, 5(3), 68; https://0-doi-org.brum.beds.ac.uk/10.3390/urbansci5030068
Submission received: 2 August 2021
/
Revised: 6 September 2021
/
Accepted: 12 September 2021
/
Published: 14 September 2021
(This article belongs to the Topic Sustainable Real Estate and Resilient Cities: Management, Assessment and Innovations)
Abstract
:Urbanization is persistent globally and has increasingly significant spatial and environmental consequences. It is especially challenging in developing countries due to the increasing pressure on the limited resources, and damage to the bio-physical environment. Traditional analytical methods of studying the urban land use dynamics associated with urbanization are static and tend to rely on top-down approaches, such as linear and mathematical modeling. These traditional approaches do not capture the nonlinear properties of land use change. New technologies, such as artificial intelligence (AI) and machine learning (ML) have made it possible to model and predict the nonlinear aspects of urban land dynamics. AI and ML are programmed to recognize patterns and carry out predictions, decision making and perform operations with speed and accuracy. Classification, analysis and modeling using earth observation-based data forms the basis for the geospatial support for land use planning. In the process of achieving higher accuracies in the classification of spatial data, ML algorithms are being developed and being improved to enhance the decision-making process. The purpose of the research is to bring out the various ML algorithms and statistical models that have been applied to study aspects of land use planning using earth observation-based data (EO). It intends to review their performance, functional requirements, interoperability requirements and for which research problems can they be applied best. The literature review revealed that random forest (RF), deep learning like convolutional neural network (CNN) and support vector machine (SVM) algorithms are best suited for classification and pattern analysis of earth observation-based data. GANs (generative adversarial networks) have been used to simulate urban patterns. Algorithms like cellular automata, spatial logistic regression and agent-based modeling have been used for studying urban growth, land use change and settlement pattern analysis. Most of the papers reviewed applied ML algorithms for classification of EO data and to study urban growth and land use change. It is observed that hybrid approaches have better performance in terms of accuracies, efficiency and computational cost.
1. Introduction
The degree to which human actions have an effect on changes in the environment has been a key subject of study for land management researchers. One can measure these changes, which often have a spatial dimension, both qualitatively and quantitatively. Nevertheless, mapping of temporal and spatial changes of urban and rural land still remains a challenging task because the technological tools and instruments have so far not been adequate to support the daily practice and the spatio-temporal needs of planners and decision makers. The traditional methods used for land use planning such as field surveys and participatory mapping are time consuming, costly and labor intensive. Advancements in the data acquisition technologies and the availability of improved computational power has made it possible to make practical use of the algorithms which earlier could only be called theoretical solutions but could not be practiced [1]. The methods of imaging land use fall in the domain of remote sensing (RS) and processes by which they are utilized for their analysis is through Geographic Information Systems (GIS) tools. RS datasets are a vital source for assessing the land-use and land-cover processes. RS datasets provide large scale coverages right from the regional to the global scale. One of the ways to understand the status and changes in both natural and built environment is through interpretation of RS datasets. In recent decades, RS sensors and techniques have become increasingly sophisticated. They can provide a large volume of data with superior quality and high spatial resolution [2]. The availability of high-resolution data like LIDAR, RADAR, MSS, Hyperspectral, UAV borne data and other commercially available satellite data and data from other airborne platforms has improved the capabilities and understanding of land use planning. While classical methods compartmentalize graphic and non-graphic data for analysis, a combined use of advanced RS and GIS applications can integrate both spatial and socio-economic factors which may support a better understanding of the dynamics of the society needed to improve land use planning.
The spatial analysis underlying land use planning encompasses land use classification, growth, zoning, restrictions, allocation and change. There are various ML algorithms that make it possible to model aspects of land use planning. However, the algorithms differ in their performances, in terms of spatial accuracies and output possibilities. According to Hagenauer et al. (2019) [3] “ML comprises a set of inductive models that recognize patterns and/or minimize the prediction error of complex regression functions, by means of a repeated learning strategy from training data, linking an output such as land-use change to several underlying drivers. Once learned, the model can then be used to estimate previously unseen cases and predict future land-use change. There are many simulation models to model land use change and growth using ML techniques”. In other words, the benefits of ML models are numerous, and have the ability of dealing with large amounts of data and a large number of variables, assigning relative importance to the variables, alongside the ability to model complex nonlinear relationships as well as interactions between drivers, while not being grounded in restrictive distributional assumptions of the input data that are hard to achieve in practice [3]. Despite these benefits, there is still limited literature which systematically compares the currently used ML algorithms in light of the specific needs and requirements of land use planning, classification, change, transition and growth.
The aim of this article therefore is to present the results of a comparative study of the commonly used ML algorithms against the background of the needs and requirements of land use planning and land use planning related decision making. The article identifies ML algorithms which give optimum results in terms of computation cost and accuracy levels.
The sequence of the article is as follows. We first present a theoretical grounding of the land use classification algorithms. Followed by discussion of the methodology adopted for reviewing the various ML algorithms for land use planning and finally conclude the findings after reviewing the functionalities, applications and computational power of the ML algorithms.
2. Theoretical Perspective
Land use planning is a process that ensures the judicious use of land by group of people who benefit from it. In order to make the best use of the limited available land and its resources, land use planners and policy makers need to intervene by incorporating guidelines/regulations on the use of land and to sustain the natural resources. The governments and administrative bodies involved in land use planning impose regulations on the use of land which include but are not limited to zoning, land use control, land use restrictions and allocation [4]. Rapid urbanization leads to substantial unplanned growth which is not healthy for the environment. It leads to degradation, air pollution and contamination of water resources. A major problem faced by urban planner and decision makers is to channelize this growth. In order to ensure the growth is planned and systematic spatial, non-spatial and temporal data has to be made available. To monitor and solve the problems of unplanned growth, EO and GIS data along with socio-economic data provide vital source of information for updating of land use maps.
In remotely sensed data, spatial resolution and temporal frequencies are the two important factors to study land use change. Proprietary and open-source data provided by various international and national agencies are custodians of EO and GIS data. The land administrators and land use planners need information on built-up area, non-built-up area, water bodies, green area, forests (urban), land use patterns, road network, drainage systems, etc. Most of this data can be obtained and/or extracted from images. Some types of data, such as open street map, USGS earth explorer, Sentinel hub, Copernicus open access hub, GHSL, etc., are repositories of open-source data and are utilized for spatial data requirements. Apart from open-source data, commercially available satellite images, aerial photographs, LIDAR data are used for various land use planning application such as cadastral boundary extraction, 3D feature extraction, 3D modeling, etc. The first step in the various stages of land use planning is to study the past data which is available in the form of master plan, census data and other statistical data available with various government and non-government agencies, the second stage is to study how far the plan has been fulfilled by studying with the help of EO based data against the master plan projections and the third stage will be projecting the land use plan for future, depending on the projection of the statistical data being generated as future projection, i.e., it will be geared towards fulfillment of those projections which will also be dependent on the government policies. A comprehensive geospatial database has to be developed to assess the existing land use and model the future changes. The type of data requirement depends on the type of land use planning problem in hand which needs to be addressed. Depending on the purpose, imagery could be of high resolution and in multi band or it may suffice to have imagery of low resolution as can be seen in Table 1 depicting the data requirements and the applications to measure the indicators.
2.1. Machine Learning Based Algorithms
Several ML algorithms have been tested for their performance on different kinds of datasets for land use classification and simulation of land use planning processes. The more popular algorithms are support vector machine, neural network, Markov random field, GANS and random forest. These algorithms are experimented on different data sets individually and in combination. The article is a review of the functionalities of these algorithms and their application in land use planning.
There is ongoing research for new methods of ML to take land use mapping to a higher plane. Support vector machines (SVMs) have been applied in a number of research papers and have been compared for their performance in land use classification with other ML algorithms such as random forest (RF), neural network. SVMs is a group of non-parametric ML algorithms. The core operation of SVMs is to construct a separating hyperplane (i.e., a decision boundary) on the basis of the properties of the training samples, specifically their distribution in feature space. In many instances, classification in high dimension feature spaces results in over-fitting in the input space, however, in SVMs over-fitting is controlled through the principle of structural risk minimization. The empirical risk of misclassification is minimized by maximizing the margin between the data points and the decision boundary [5]. In case of computational requirements SVMs work well with small data sets with fewer outliers [6]. Among the decision tree algorithms like CART (classification and regression tree), ID3 (iterative dichotomizer 3) more commonly used algorithm for land use classification is RF. One of the benefits of RF algorithm is that it can be used for both classification and regression. RF works as an ensemble learning algorithm based on decision tree classifiers, bagging, and bootstrapping. Each tree is trained by bootstrapping, using different samples from the training data. Additionally, each tree is trained using a random subset of the predicting variables. RF may use thousands of decision trees, where each tree casts a vote and the prediction of the class is decided by the majority vote. A big committee of randomly created decision tree determines the classification, hence the name, random forest [7]. RF can handle large number of variables without need of deleting any and bringing out the relative importance of each of the variables. As compared to SVMs, RF do not have hyperparameters to tune like choosing the right kernel, regularization, penalty, the slack variable, however, the complexity and computational cost increase with the increase in the number of trees in the forest. A list of some of the most commonly used variables is given in Table 2.
Apart from SVM and RF, another ML algorithm which has been widely applied for land use classification is deep learning methods. In 2006, deep learning was introduced by Hinton et al. (2015) [10]. Deep learning methods are representation learning methods composed of multiple layers and each layer computes a new data representation from the representation in the previous layers of artificial neurons creating a hierarchy of data abstractions [10]. Among the group of deep learning methods is convolutional neural network (CNN) composed of convolution and pooling that are concluded by a fully connected neural network layer and a proper activation function, i.e., in models that directly reconstruct an output image prediction, such as U-Net and generative models, the fully connected network and activation function is not needed [11]. In deep learning, artificial neural network (ANN) has been gaining importance in land use planning studies. ANN is a computational ML model based on multilayer perception composed of processing elements forming three kinds of layer (input, hidden, output) which are called perceptrons [12]. Deep learning algorithms work well with relatively large datasets with supporting infrastructure to train them in reasonable time. There has been increasing interest in the Markov random field-based methods for land use classification and land use change as it helps in generating a smooth classification pattern. Markov random field (MRF) is a statistical model based on probability theory which efficiently represents dependency between pixels in a spatial domain. MRF is useful for characterizing spatial-contextual information and has been commonly used for image segmentation, texture analysis, edge detection and image restoration. MRF has been used for linear feature detection with satisfactory results. MRF for modeling spatial context relies on its relationship to Gibbs random field which is a useful way to apply MRF to deal with context [13]. In the paper “Identifying Urban Poverty Using High-Resolution Satellite Imagery and Machine Learning Approaches: Implications for Housing Inequality” [14], six types of image features perimeter, line segment detector (LSD), Hough transform, gray-level co-occurrence matrix GLCM, HoG, and local binary patterns (LBP) were extracted to identify urban poverty in Wuhan, China. The paper utilizes four machine learning regression approaches random forest (RF), Gaussian process regression (GPR), support vector regression (SVR), and neural network (NN) to study whether the features derived are helpful in differentiating urban poverty. It was concluded in the paper that textural features are important in identifying urban poverty in the study area.
In addition to the above-mentioned ML algorithms, there are several simulation models for the purpose of mapping and growth projections of land use. There are mainly two groups according to the key mechanisms to simulate the process of land use change rule-based/process-based models and empirical-statistic models [15].
2.2. Urban Land Use Models
Cellular Automata (CA)have been defined as discrete spatio-temporal dynamic systems based on local rules. In cellular models, geographic space is represented in the form of a geographic grid, such as the cells in a raster Geographic Information System. They are preferred when model states and the probabilities of transitions among those states are known and stable. They are most suitable for measuring, detecting and predicting change processes such as land use change and urban growth [16].
Cellular automata have capacity to handle temporal dynamics. Cellular automata have the following basic features:
- -
- States: each cell can take an integer value that corresponds to the current state of that cell. There is a finite set of states.
- -
- Neighborhood: is a collection of cells that interact with the current one. To perform simulations on a satellite image we normally take the eight surrounding pixels as neighborhood.
- -
- Transition function (f): takes as input arguments the cell and neighborhood values and returns the new state of the current cell.
The transition function is applied to each cell of the grid across several iterations. Therefore, cellular automata have an evolution process because some cells are changing their states across the different iterations [17]. The most commonly used cellular automata model is the Slope, Land cover, Exclusion, Urban growth, Transport and Hill shade (SLEUTH) model which has been in application for a long time. SLEUTH model has been widely used for simulating urban growth and land use change. SLEUTH is open source and has been developed in C programming language. As described by Berberoğlu et al. (2016) [18].
“The program involves as a series of nested loops: the outer control loop repeatedly executes each growth “history”, retaining cumulative statistical data, while the inner loop executes the growth rules for a single iteration, assumed to be a “-year-.” The rules apply to one cell at a time and the whole grid is updated as the iterations complete”.
Statistical modeling methods are widely used for modeling, assessing, qualifying, quantifying and predicting the degree/extent/direction of land use change and growth. An example of a statistical model is the logistic regression model. Logistic regression is a predictive statistical modeling technique which applies multivariate regression to predict future land use based on historical land use changes, their spatial (change) characteristics and other potential drivers [15]. It is easier to model land use change using statistical modeling methods as their calibration is not so computationally intensive compared to rule-based models like cellular automata [19]. In logistic regression, social and economic factors like population density, accessibility to services, distance to commercial and industrial area, mean incomes, etc., can be incorporated in the model. Logistic regression analysis has been one of the most widely used approaches in the past two decades for predictive land use modeling by means of variation of inductive modeling [19].
Agent-based modeling (ABM), which is a forward-looking simulation technique which calculates “agents,” each of which represents an actor and how they interact with their “environment” or the total system. The models represent real and imagined scenarios, which allow for the discovery of potentially emergent issues or phenomena. Such models have increasingly been used to analyze complex issues like land use change. Agents are independent entities which have set goals to achieve. The agents can be countries, landowners, land tenants, citizens, etc. ABM is used to simulate human behavior in cities, for example whereby policy makers, planners or citizens are entities (agents) which interact with the city environment and are capable of making urban planning decisions [16]. In a rule-based approach, their behavior is fixed, meaning that decision-making functions and algorithms remain unchanged (i.e., they always react in the same way when confronted with a particular situation). While agents react to changes in their spatial and social environment, they neither adapt their rules in response nor intelligently learn from previous experiences. ABM can be useful to study the changes in the land use and to evaluate the projections.
The various development environment used for agent-based modeling are Anylogic, Cormas, Cougaar (via OpenMap) Framsticks, Janus (using JaSIM), MASON, Repast, SeSAm, VisualBots, and NetLogo. These environments provide tools to develop an agent-based model and provide a platform to represent model components, control model function, and evaluate and visualize model output [20].
Hybrid approaches have been developed by integrating different ML methods which has resulted in better performance and assessment. An example of a hybrid method is the integration of logistic regression, Markov chain and cellular automata [21] to model urban expansion in the metropolitan area of Tehran, Iran. The results of the simulation were compared with the actual land use map and the result matched 89% between the simulated and the actual. Another example is integration of cellular automata Markov chain (CA-MC) with artificial neural network [22] to enhance the simulation capacity in predicting the changes in land use. The study integrates ANN and CA-MC to incorporate several driving forces (economic, spatial and environmental variables) that impact land use change. The integration and the influence of the driving forces improved the model prediction. Among the hybrid approaches Kamusoko and Gamba (2015) [23] tested random forest–cellular automata to study urban land change in Harare metropolitan province, Zimbabwe. Cellular automata was used to calculate multiple-step transition rates from land use/land cover maps (1984, 2002 and 2008). RF model was used to compute transition potential maps. The study then compared this model with SVM-CA and logistic regression (LR) and CA. The result showed that RF-CA outperformed SVM-CA and LR-CA models. Hybrid Urban Expansion Model (HUEM) was used by Mustafa and Cools (2018) [24] that integrates LR, CA, AB to simulate future urban development in Wallonia, Belgium. The urban expansion is simulated between 1990 and 2000. The calibration results are analyzed by comparing the projection for the 2000 simulated map with the actual 2000 land use map. The HEUM model uses three agent sets, developer agent, farmer agent and planning permission authority agent. The performance of HEUM is compared with other spatial expansion models, i.e., Logit model, CA model, CA-Logit model. The comparison shows that the performance of HEUM model is better than other models in terms of allocation ability.
3. Materials and Methods
3.1. Research Approach
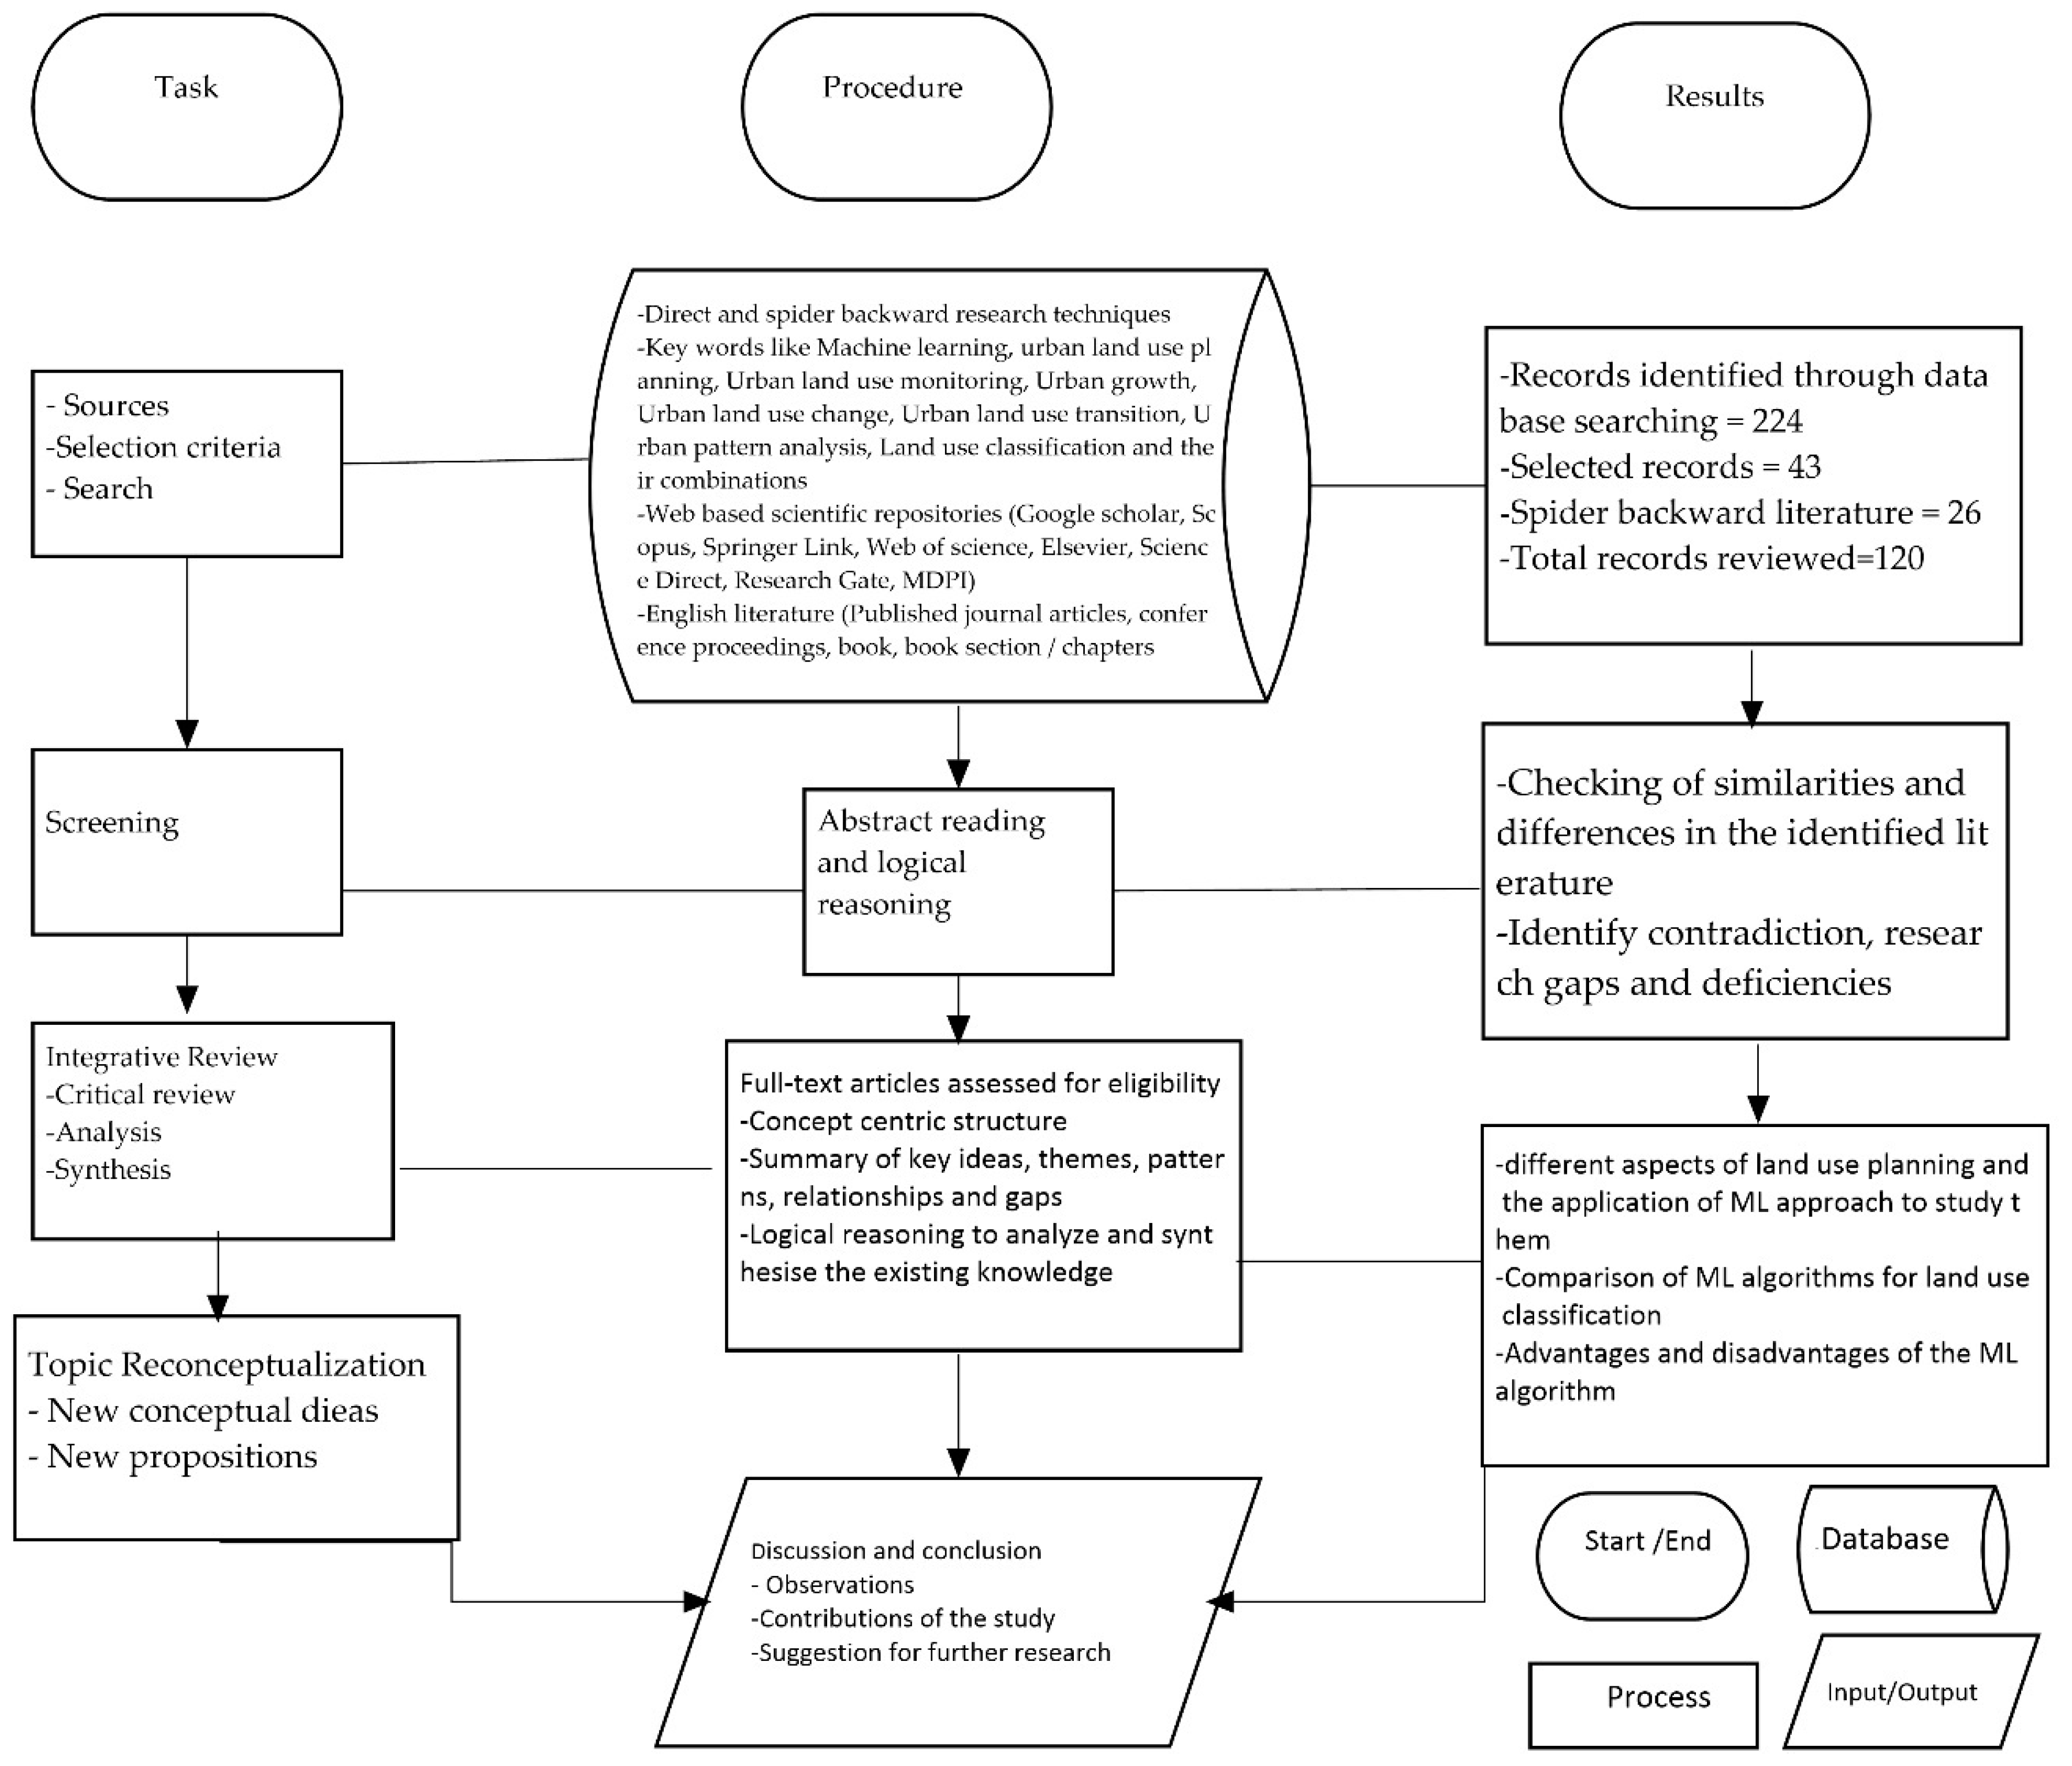
The review article is based on an integrative approach relying on secondary data. It is a concept-centric qualitative approach drawing on deductive logical reasoning to create new scientific knowledge from the existing facts in literature and inform future research, policies and decision making. The researchers use their own knowledge about the topic in order to critically analyze and synthesize the existing knowledge about different concepts, theories and principles and deduct their own conceptualization from the reviewed general facts. Webster and Watson [25] and Torraco [26] argue that this approach adopts critical review, analysis and synthesis of existing knowledge about the topic under research, with the object of devising possible relationships among various research variables, identifying knowledge gaps and contradictions, and seeking opportunities for future research. The aim of the research is the potential to reconceptualize the expanding and diversified knowledge base of the topic as it develops over time [25]. Spatial and temporal limitations (boundaries) were not considered throughout the review process for internal validity purposes. This led to review of both old and new geographically unlimited available literature material on the topic as an appropriate method for this type of research approach which requires comprehensive and broad literature. For the purpose of avoiding various conceptual deviations, misuse and linguistic bias, both empirical (primary) and review (secondary) literature were limited to English language. The following subsection explains the process and method for identification of literature (search, selection criteria and its sources, database, repositories) screening, eligibility and inclusion (Figure 1).
3.2. Data Sources and Research Method
Once the limits of the literature search were defined, we conducted the literature identification. The search strategy involved keywords and their combination. The list of keywords and their structure is given in Table 3.
The methodology adopted consisted of selecting books, articles, journals, review papers and research papers dealing with land use planning and the various ML applications adopted for studying and analyzing the various components of land use planning. The objective of literature search and selection was not to derive an all-encompassing list of author-centric publications referring to specific ML algorithms, but to derive a content-specific review of publications which most adequately describe specific ML algorithms, specifically the procedures, popularity (i.e., frequency of use, frequency of citation, etc.), advantages and disadvantages, applicability, functional and interoperability requirements. The framework of the paper is designed on the basis of both test case and use case approach [27]. Research papers where the algorithm is a function of the commercial software and also where it has been independently developed by the user wherein functional requirements are taken care by the developer were examined.
Land use planning is a flexible, adaptive and iterative process and is based on the needs, capacities and the institutional guidelines in place. There are two approaches to land use planning, one is systematic or top-down approach which is institutionalized and is based on technical surveys and the other is collaborative/participatory planning also known as the bottom-up approach which is based on people’s participation and is in accordance with the socio-cultural, economic, technological and environmental conditions.
There is limited interoperability among the ML methods. The data types are generally incompatible. Some of the programming languages in which ML tools are written are java, R and python. ML tools are supported on third party environments and can be run in the background without the user having to write a code. The selected ML algorithms can be reviewed for their functionality, interoperability requirements and their applications in land use planning. The emphasis is given on land use growth, land use zoning, land use classification, land use restrictions, land use allocation. These ML algorithms were chosen because of their popularity (i.e., frequency of use, frequency of citation, etc.), in land use planning phases, processes and/or decision making. There is awareness of the chosen algorithms among researchers and they have wide range of application. For the purpose of reviewing the algorithms, relevant literature was selected where the algorithm is used as an application and the functionalities of the algorithm are used and analyzed for their performance. For the comparison of the algorithms/models the advantages and disadvantages are discussed. The papers range from classification of data to simulation models for land use change and growth.
A comparison of various ML algorithms/models for land use planning which includes land use classification, land use change and land use growth indicates that each of the algorithms have their own advantages and disadvantages. Selection of the appropriate algorithm/model depends largely on the objective and the quality/type of data sets available (both graphic and non-graphic).
4. Results and Discussion
Machine learning algorithms are listed in Table 4 with their advantages and their applications.
Support vector machine (SVM) is popular because of its ability to use nonlinear boundaries and locate boundaries of training data. Classifying algorithm SVM does not require very large training samples. Sensitivity of SVM algorithm is experimented on rapid eye images in [28] for land use classification. For comparison, the traditional maximum likelihood classification was also performed in the same set of images. The results of the research indicated that model parameters and kernel type play an important role in the accuracy of the classification using the SVM algorithm. However, it can be deduced from various research papers that the results of the SVM depend on the choice of the kernel and the regularization parameters.
ANN approaches have a distinct advantage over statistical classification methods in that they are non-parametric and require little or no a priori knowledge of the distribution model of input data. Additional superior advantages of ANNs include parallel computation, the ability to estimate the nonlinear relationship between the input data and desired outputs, and fast generalization capability. Many previous studies on the classification of multispectral images have confirmed that ANNs perform better than traditional classification methods in terms of classification accuracy, such as maximum likelihood classifiers [29].
Random forest algorithm is used for satellite and aerial image classification. Its ability is to handle large numbers of features like texture, contextual, spatial, spectral and structural without affecting the overall accuracy of the classification. In an experimental study, the authors [7] integrate the random forest method with spatial metrics and texture analysis and find that the use of this method seems to be limited to flat cities with a small number of high-rise constructions. In the research by Belgiu et al. (2014) [30], building types are classified by means of domain ontology and machine learning using airborne laser scanner data. In the study, RF classifier has been applied to select the relevant features for predicting the classes of interest. RF classification model has been used to study the urbanity index between Germany and France [31]. The study involved defining urbanity on the basis of travel behavior. The aim of the study is the identification and comparison of different urban structures at zip code level across Germany and France. It was concluded that the adaptation of the RF model provided an effective methodology for the automated assessment of level of urbanity of different areas.
Cellular automata models are sometimes described as a type of agent-based model. The key difference is that, for cellular models, spatial entities are the basic units of simulation and the topology (or connection) between those units remains fixed, whereas agent-based models described in Table 5 represent decision making units that have a flexible and dynamic relationship with land units [20]. Specific advantages of agent-based models include their ability to represent individual decision makers and their interactions, to incorporate social processes, non-monetary influences on decision making, and to dynamically link social and environmental processes [32]. A relevant example of an agent-based model is simulation of informal settlement growth in Dar es Salam, Tanzania [32] where a vector based, micro scale housing model is developed to simulate the growth of informal settlements.
Some of the research work carried out using different methods of ML and modeling by the researchers is given in Table 5 with the advantages, disadvantages and their applications.
4.1. Machine Learning Models and Their Applications
4.1.1. Algorithms/Models to Study Urban Growth, Patterns and Land Use Change
Several studies have been carried out using empirical data sets to compare the performance of machine learning/statistical models to study the aspects of land use planning. Most of the studies focus on urban growth/expansion, land use change and patterns of land use. The most commonly used models to study urban growth and change are logistic regression and cellular automata. The performance of some of the machine learning algorithms and statistical approaches for the studies reviewed is shown in Table 6.
In addition to the above commonly used ML algorithms and statistical models, several other published papers have applied not so common ML algorithms to obtain their results. To study the factors contributing to urban land use patterns, Decraene et al. (2013) [38] developed a dynamic urban growth model that aims to construct artificial cities from the bottom-up using the measure of spatial entropy and index of dissimilarity. The study applies a CA model which relies on the range of influence of different land use sectors (residential, business and industrial). Four statistical modeling approaches are compared for modeling land use change; they are Markov chain, logistic regression, generalized additive models and survival analysis [39]. The methods were compared on the basis of accuracy (overall and by land use type, sample size and spatial independence by means of conventional and spatial cross-validation). Logistic regression and survival analysis were more accurate for specific land use type. It was concluded that hybrid approaches outperformed individual statistical approaches. SVMs have been used in a variety of application domains including land use change modeling. SVM based land use modeling technique is applied to study the change in land use classes for the municipality of Zemun, Republic of Siberia for a 10 year time period [40]. The SVM modeling procedure entails finding a function which maps attributes of a grid cell at a time point to its land use class at time + 1. The population change index (PCI) was used as an attribute and it was calculated as the ratio of change in the number of inhabitants per each cell between two censuses: 2001, 2011. Correlation based feature subset reduces the number of initial attributes to an informative subset for a more efficient model less sensitive to the SVP parameter changes. It is concluded that the SVM based LUC model is sensitive to the choice of datasets used for training and validation, the selection of attributes and optimal learning parameters.
4.1.2. Commonly Used Algorithms for Land Use Classification
RF algorithm is evaluated for its performance in land use classification (Rodriguez-Galiano, Ghimire, Rogan, Chica-Olmo, & Rigol-Sanchez, 2012) [41] using multitemporal Landsat-5 thematic mapper data of a large heterogeneous area. The study area selected for the project is the province of Granada in Southern Spain. The study also compares the performance of the RF algorithm with conventional classification trees (CT). It was concluded that RF provides more significant differentiation of land cover categories. A hybrid approach of classification has been adopted by [42]. In the modified method, the object-oriented approach is combined with deep convolutional neural network (COCNN). The object-oriented method is used to construct a multiscale sample set to provide high precision training data. Ten land use types are classified using remote sensing images covering an area around Fuxian lake. Convolution kernels is regarded as the most sensitive element of the CNN and is responsible for directly extracting the lowest level feature on the original image. The result of this approach has been compared with the outputs obtained from CNN and the modified approach has shown to improve the results. It is concluded in the paper that the result is dependent on the kernel size and for the object-oriented training sets a kernel size of 3 × 3 has been used.
4.1.3. Limitation
The research cannot be exhaustive as the number of papers which have been published on urban land use planning using ML algorithms and statistical models majorly focus on two aspects of urban sprawl/growth and land use transition/change. The author was interested in other aspects of urban land use planning like zoning, land allocation, land restrictions but sufficient published literature was not available to cover these aspects. There are numerous published research papers on use of classification algorithm to classify land use but the majority of them are covering algorithms like deep learning, SVM, random forest and very few papers on algorithms such as logistic regression, MRF, k-nearest neighbors, naive Bayes, etc.
5. Conclusions
This comparative study is an analysis of the various ML methods used in land use planning along with their advantages and disadvantages. The study also has brought out the applicability of ML algorithms to specific task of land use planning. Some of the articles deal with the testing of the performance of specific ML algorithms and while others have dealt with specific requirements of land use planning. In particular, the aspects of urban land use change, relevant to understand the spatio-temporal patterns of urbanization are prominent in the literature. To a lesser extent, the socio-political reasons and causes of these patterns are part of these studies, although it can be imagined that ML algorithms could also address part of these via other types of data repositories. The review of various publications on ML algorithms and their applications in land use planning demonstrates that most of the ML algorithms operate at the pixel level and have limited practicality when working with VHR imagery, in contrast to object-based image analysis. In general, non-parametric algorithms are computationally more expensive compared to linear models. The efforts are more towards minimizing the complexity and lowering the computational cost. The comparison of the various algorithms indicates further that random forest is relatively more robust for classification. The choice of the ML methods relies largely on the type of datasets and understanding of the researcher. It has been seen that hybrid approaches like pixel based and object-based approaches are gaining popularity to get the optimum/desired results for modeling urban growth, land use change, settlement patterns and classification.
The benefit of this review is that it enables the boundary work between practitioners and future researchers in either land use planning or in the application of technical spatial and information scientific tools. The overview tables present the links.
Further research should go in the direction of utilizing empirical data sets and applying the algorithms to analyze their performance and suitability for studying aspects of land use planning. Experiments on deep learning, SVM, random forest and GANS for land use classification should check the overall classification accuracy of each of the algorithms. In addition, experiments with spectral, texture, structural and contextual image features should be undertaken to improve the accuracy of classification. The performance of the hybrid approach should be tested to get best results in classification, modeling of urban land use growth, change and transition.
Author Contributions
Conceptualization, V.C. and W.T.d.V.; methodology, V.C. and W.T.d.V.; investigation, V.C. and W.T.d.V.; writing—original draft preparation, V.C. and W.T.d.V.; writing—review and editing, V.C. and W.T.d.V.; supervision, W.T.d.V. Both authors have read and agreed to the published version of the manuscript.
Funding
This research was funded by TUM open access publishing fund.
Institutional Review Board Statement
Not applicable.
Informed Consent Statement
Not applicable.
Data Availability Statement
Not applicable.
Conflicts of Interest
The authors declare no conflict of interest. The funders had no role in the design of the study; in the collection, analyses, or interpretation of data; in the writing of the manuscript, or in the decision to publish the results.
References
- Samardžić, M.; Kovačević, M.; Bajat, B.; Dragićević, S. Machine learning techniques for modelling short term land-use change. ISPRS Int. J. Geo-Inf. 2017, 6, 387. [Google Scholar] [CrossRef] [Green Version]
- Cao, C.; Dragićević, S.; Li, S. Land-use change detection with convolutional neural network methods. Environments 2019, 6, 25. [Google Scholar] [CrossRef] [Green Version]
- Hagenauer, J.; Omrani, H.; Helbich, M. Assessing the performance of 38 machine learning models: The case of land consumption rates in Bavaria, Germany. Int. J. Geogr. Inf. Sci. 2019, 33, 1399–1419. [Google Scholar] [CrossRef] [Green Version]
- Amler, B.; Betke, D.; Eger, H.; Ehrich, C.; Kohler, A.; Kutter, A.; von Lossau, A.; Müller, U.; Seidemann, S.; Steurer, R. Land Use Planning Methods, Strategies and Tools; Deutsche Gesellschaft Für Technische Zusammenarbeit (GTZ) GmbH: Eschborn, Germany, 1999. [Google Scholar]
- Gidudu, A.; Hulley, G.; Marwala, T. Classification of images using Support Vector Machines. arXiv 2007, arXiv:0709.3967v1. [Google Scholar]
- Pal, M.; Mather, P.M. Support vector machines for classification in remote sensing. Int. J. Remote Sens. 2005, 26, 1007–1011. [Google Scholar] [CrossRef]
- Ruiz Hernandez, I.E.; Shi, W. A Random Forests classification method for urban land-use mapping integrating spatial metrics and texture analysis. Int. J. Remote Sens. 2018, 39, 1175–1198. [Google Scholar] [CrossRef]
- Duque, J.C.; Patino, J.E.; Betancourt, A. Exploring the potential of machine learning for automatic slum identification from VHR imagery. Remote Sens. 2017, 9, 895. [Google Scholar] [CrossRef] [Green Version]
- hd-pro, Applying Edge Detection to Feature Extraction and Pixel Integrity. (n.d.). Retrieved 13 April 2019. Available online: https://medium.com/hd-pro/applying-edge-detection-to-feature-extraction-and-pixel-integrity-2d39d9460842 (accessed on 16 January 2021).
- Lecun, Y.; Bengio, Y.; Hinton, G. Deep learning. Nature 2015, 521, 436–444. [Google Scholar] [CrossRef]
- Vali, A.; Comai, S.; Matteucci, M. Deep Learning for Land Use and Land Cover Classification Based on Hyperspectral and Multispectral Earth Observation Data: A Review. Remote Sens. 2020, 12, 2495. [Google Scholar] [CrossRef]
- Maithani, S. A neural network based urban growth model of an Indian city. J. Indian Soc. Remote Sens. 2009, 37, 363–376. [Google Scholar] [CrossRef]
- Tso, B.; Mather, P.M. Classification Methods for Remotely Sensed Data, 2nd ed.; CRC Press, LLC: Boca Raton, FL, USA, 2001; pp. 255–278. [Google Scholar] [CrossRef]
- Li, G.; Cai, Z.; Qian, Y. Identifying Urban Poverty Using High-Resolution. Satellite. Land 2021, 10, 648. [Google Scholar] [CrossRef]
- Nong, Y.; Du, Q. Urban growth pattern modeling using logistic regression. Geo-Spat. Inf. Sci. 2011, 14, 62–67. [Google Scholar] [CrossRef]
- Clarke, K.C. Cellular Automata and Agent-Based Models. In Handbook of Regional Science; Springer: Berlin/Heidelberg, Germany, 2015. [Google Scholar] [CrossRef]
- Espínola, M.; Ayala, R.; Leguizamón, S.; Menenti, M. Classification of Satellite Images Using the Cellular Automata Approach. In The Open Knowlege Society; A Computer Science and Information Systems Manifesto: Berlin/Heidelberg, Germany, 2008; pp. 521–526. [Google Scholar]
- Berberoğlu, S.; Akin, A.; Clarke, K.C. Cellular automata modeling approaches to forecast urban growth for adana, Turkey: A comparative approach. Landsc. Urban Plan. 2016, 153, 11–27. [Google Scholar] [CrossRef]
- Hu, Z.; Lo, C.P. Modeling urban growth in Atlanta using logistic regression. Comput. Environ. Urban Syst. 2007, 31, 667–688. [Google Scholar] [CrossRef]
- National research council. Advancing Land Change Modeling; The National Academic Press: Washington, DC, USA, 2014; pp. 93–96. [Google Scholar] [CrossRef]
- Arsanjani, J.J.; Helbich, M.; Kainz, W.; Boloorani, A.D. Integration of logistic regression, Markov chain and cellular automata models to simulate urban expansion. Int. J. Appl. Earth Obs. Geoinf. 2012, 21, 265–275. [Google Scholar] [CrossRef]
- Gharaibeh, A.; Shaamala, A.; Obeidat, R.; Al-kofahi, S. Heliyon Improving land-use change modeling by integrating ANN with Cellular Automata-Markov Chain model. Heliyon 2020, 6, e05092. [Google Scholar] [CrossRef]
- Kamusoko, C.; Gamba, J. Simulating Urban Growth Using a Random Forest-Cellular Automata (RF-CA) Model. ISPRS Int. J. Geo-Inf. 2015, 4, 447–470. [Google Scholar] [CrossRef]
- Mustafa, A.; Cools, M.; Saadi, I.; Teller, J. Coupling agent-based, cellular automata and logistic regression into a hybrid urban expansion model (HUEM). Land Use Policy 2017, 69, 529–540. [Google Scholar] [CrossRef] [Green Version]
- Webster, J.; Watson, R.T. Analyzing the Past to Prepare for the Future: Writing a Literature Review. MIS Q. 2002, 26, xiii–xxiii. [Google Scholar]
- Torraco, R.J. Writing Integrative Literature Reviews: Guidelines and Examples. Hum. Resour. Dev. Rev. 2005, 4, 356–367. [Google Scholar] [CrossRef]
- Rodríguez, G.; Jesús, J.; Cuaresma, E.; Jose, M.; Risoto, M.; Valderrama, M.T. Generation of Test Cases from Functional Requirements. A Survey. May 2014. Available online: http://www.lsi.us.es/javierj/investigacion_ficheros/sv10.pdf (accessed on 27 July 2020).
- Ustuner, M.; Sanli, F.B.; Dixon, B. Application of Support Vector Machines for Landuse Classification Using High-Resolution RapidEye Images: A Sensitivity Analysis. Eur. J. Remote Sens. 2017, 48, 403–422. [Google Scholar] [CrossRef]
- Yuan, H.; Van Der Wiele, C.F.; Khorram, S. An automated artificial neural network system for land use/land cover classification from landsat TM imagery. Remote Sens. 2009, 1, 243–265. [Google Scholar] [CrossRef] [Green Version]
- Belgiu, M.; Tomljenovic, I.; Lampoltshammer, T.J.; Blaschke, T.; Höfle, B. Ontology-based classification of building types detected from airborne laser scanning data. Remote Sens. 2014, 6, 1347–1366. [Google Scholar] [CrossRef] [Green Version]
- Niklas, U.; von Behren, S.; Soylu, T.; Kopp, J.; Chlond, B.; Vortisch, P. Spatial Factor—Using a Random Forest Classification Model to Measure an Internationally Comparable Urbanity Index. Urban Sci. 2020, 4, 36. [Google Scholar] [CrossRef]
- Flacke, J.; Retsios, B. Computers, Environment and Urban Systems Simulating informal settlement growth in Dar es Salaam, Tanzania: An agent-based housing model. Comput. Environ. Urban Syst. 2011, 35, 93–103. [Google Scholar] [CrossRef]
- Xie, C. Support Vector Machines for Land Use Change Modeling. UCGE Reports 20243. 2006. Available online: http://www.ucalgary.ca/engo_webdocs/BH/06.20243.ChenglinXie.pdf (accessed on 12 June 2020).
- Feng, Y.; Liu, Y.; Batty, M. Modeling urban growth with GIS based cellular automata and least squares SVM rules: A case study in Qingpu–Songjiang area of Shanghai, China. Stoch. Environ. Res. Risk Assess 2016, 30, 1387–1400. [Google Scholar] [CrossRef]
- Abdi, A.M. Land cover and land use classification performance of machine learning algorithms in a boreal landscape using Sentinel-2 data. GISci. Remote Sens. 2020, 57, 1–20. [Google Scholar] [CrossRef] [Green Version]
- Batisani, N.; Yarnal, B. Urban expansion in Centre County, Pennsylvania: Spatial dynamics and landscape transformations. Appl. Geogr. 2009, 29, 235–249. [Google Scholar] [CrossRef]
- Albert, A.; Strano, E.; Kaur, J.; Gonzalez, M. Modeling urbanization patterns with generative adversarial networks. arXiv 2018, arXiv:1801.02710. [Google Scholar]
- Decraene, J.; Monterola, C.; Lee, G.K.K.; Hung, T.G.G.; Batty, M. The emergence of urban land use patterns driven by dispersion and aggregation mechanisms. PLoS ONE 2013, 8, e80309. [Google Scholar] [CrossRef]
- Change, L.; Sun, B.; Robinson, D.T. Comparisons of Statistical Approaches for Modelling Land-Use Change. Land 2018, 7, 144. [Google Scholar] [CrossRef] [Green Version]
- Samardžić-Petrović, M.; Dragićević, S.; Kovačević, M.; Bajat, B. Modeling Urban Land Use Changes Using Support Vector Machines. Trans. GIS 2016, 20, 718–734. [Google Scholar] [CrossRef]
- Rodriguez-Galiano, V.F.; Ghimire, B.; Rogan, J.; Chica-Olmo, M.; Rigol-Sanchez, J.P. An assessment of the effectiveness of a random forest classifier for land-cover classification. ISPRS J. Photogramm. Remote Sens. 2012, 67, 93–104. [Google Scholar] [CrossRef]
- Jin, B.; Ye, P.; Zhang, X.; Song, W.; Li, S. Object-Oriented Method Combined with Deep Convolutional Neural Networks for Land-Use-Type Classification of Remote Sensing Images. J. Indian Soc. Remote Sens. 2019, 47, 951–965. [Google Scholar] [CrossRef] [Green Version]
Figure 1.
PRISMA showing the steps of methodology.


Table 1.
Land use planning indicators with measurements, data required and applications.
| Indicators | Measurements | Data | Application |
|---|---|---|---|
| Urban expansion | Built-up density, settlement patterns, population distribution | EO based data, i.e., classified images, building footprints, urban heat islands | Classification and simulation (CA, spatial logistics regression, SVM, random forest, CNN) |
| Land restrictions | Land use/land cover change, built-up and non-built-up spaces, | Master plan, building by-laws, land use regulations | Classification, extraction of EO products like DEM, vegetation cover |
| Land allocations | Govt. policies, population growth, population distribution | Census data, socio-economic data | Spatial logistic regression, cellular automata |
| Zoning | Govt. policies and by-laws | Master plan, classified images | Planned development |
| Land use change | Settlement patterns, urban growth processes, (aggregated, compact, dispersed) population growth | Spatio-temporal EO based data | Spatial metrics, cellular automata, spatial logistic regression, agent-based modeling |
Table 2.
List of image features.
| Variables/Image Feature | Description | Examples | Description | Application in Land Use Planning |
|---|---|---|---|---|
| Spectral features | Provide information regarding the spectral response of objects, which differ for land coverage types, states of vegetation, soil composition, building materials [8] | NDVI (normalized difference vegetation index)—to measure/identify biomass | NDVI = (NIR−RED)/(NIR+RED) | Distinguishing built-up areas from non-built-up, green vegetation from barren land |
| SAVI (soil adjusted vegetation index) | SAVI = 1.5 × (NIR-R)/(NIR+R+0.5) | Differentiate between vegetation and built-up | ||
| BAI (built-up area index) | BAI = (B-NIR)/(B+NIR) | Built-up areas index has good performance in detecting asphalt and concrete surfaces | ||
| NDWI (normalized difference water index) | NDWI = (G-NIR)/(G+NIR) | Enhances water features and helps in distinguishing water features from other ground objects | ||
| Texture features | Characterize the spatial distribution of intensity values of an image and data on contrast, uniformity, rugosity, etc. [8] | GLCM (grey level co-occurrence matrix)—specifically relevant when measuring, qualifying | GLCM is a tabulation of how often different combinations of pixel brightness values (grey levels) occur in an image | Measuring spatial patterns which are repetitive on the image like crop land and built-up |
| Structural features | Help in identifying the spatial arrangement of elements in terms of the randomness or regularity of their distribution [8] | Edge detection filter specifically relevant when measuring, qualifying | Edge detection is a technique used to find the boundaries of features in an image. This uses an algorithm that searches for discontinuities in pixel brightness in an image that is converted to grayscale. (“Applying Edge Detection To Feature Extraction And Pixel Integrity,” n.d [9]) | For shape recognition, edge enhancement |
Table 3.
Keywords and related terms.
| Keywords | Description | Related/Alternative Keywords |
|---|---|---|
| Land use planning | Spatial arrangement of land between competing and conflicting uses | Urban planning, land allocation, urban design |
| Urban growth modeling | Statistical model that involves economics, demography, geography, sociology to explore the mechanisms of increase in urban areas | Urban agglomeration, built-up density |
| Machine learning | Type of knowledge engineering | ML algorithm, neural network, SVM, random forest |
| Urban land use change | Conversion of type of use of a piece of land by humans | Land use conversion, land use transition, land use transformation |
| Urban land use classification | Grouping of land into different categories based on their use | Zoning, urban land management |
| Urban land use patterns | Layout or arrangement of uses of land | Urban form, framework, urban structure, arrangement, urban fabric |
| Urban expansion | General increase in the land area or the population size of an urban area | Sprawl, urbanization, urban development |
| Artificial intelligence | Algorithm developed to perform tasks by learning or identifying patterns | Machine learning, deep learning, neural network, pattern recognition |
| Urban built-up area extraction | Extraction of building footprints and other manmade features | Classification, aggregation, conurbation, urban spread |
| Urban land use monitoring | To detect changes in land use over a period of time | Land development, land regulation, land management |
Table 4.
Machine learning algorithms and their advantages.
| Machine Learning Algorithms | Advantage/Useful When/Appropriate for Applications Related to |
|---|---|
| Support vector machines (SVMs) | - Once the hyperplane is found SVMs tend to generalize well - Once the boundary of hyperplane is established most training data is redundant - Powerful algorithm for land use pattern recognition - Capability of contextual feature extraction |
| Markov random field (MRF) | MRF combines both pixel information and region information |
| Convolutional neural network (CNN) | Local spatial coherence in input image makes CCN suited for feature extraction |
| Random forest (RF) | - Can deal with large number of features - It incorporates spectral bands and other feature selection layers like soil index, water index, NDVI - It incorporates texture features for classification which include metrics like entropy, variance, morphology, line feature, etc. - It avoids overfitting |
Table 5.
Statistical modeling approaches.
| Machine Learning Models | Advantages | Disadvantages | Particularly Useful for Applications of |
|---|---|---|---|
| Spatial logistic regression | -Can incorporate socio-economic and demographic factors -Logistic regression allows multi-scale calibration due to less demand of computation resource | -Lack of temporal dynamics -Does not consider location preferences, policies | Urban growth, land use change, land allocation |
| Cellular automata | -Phenomena of sprawl can be efficiently simulated in CA models -CA models produce outputs according to the transition rules | -High demand of computation power -Capability to handle temporal dynamics | Land use change, land allocation |
| Agent based modeling | - It incorporates human behavior - Bottom up approach | -Variability in the results because of randomization of agents at initialization for combination of parameter settings -Hard to calibrate | Urban growth and land use change |
Table 6.
Machine learning algorithms and their performance.
| Author and Year | Study Area | Data Used | Method | Performance |
|---|---|---|---|---|
| 1.Urban growth pattern modeling using logistic regression [15] | Jiayu County, Hubei Province, China | Vector data, map of the county, topographic map, DEM and data on population, agriculture, industrial from secondary data sources | Logistic regression modeling | Less demand of computation resources, vector-feature-based spatial analysis has higher accuracy, procedure is most effective when group membership is a truly categorical variable |
| 2. Support vector machines for land use change modeling [33] | Calgary, Southern Alberta, USA | Chronological land use data Landsat TM and ETM, demographic data, and transportation data (major roads and LRT lines), elevation data, community map, city amenity map, community service center map, and shopping center distribution map | Support vector machine (SVM) | Improved SVMs can greatly improve the accuracy and reliability of land use change modeling especially when the underlying data distribution is unknown and the dataset is significantly unbalanced |
| 3. Modelling urban growth with GIS based cellular automata and least squares SVM rules [34] | Qingpu–Songjiang area of Shanghai, China | Landsat images covering the study area acquired on 18 July 1992 and 24 March 2008 were used, topographic map at a scale of 1:50,000 as the reference data for georectification | MachCA model which is cellular automata (CA) with nonlinear transition rules based on least squares support vector machines (LS-SVM) | LS-SVM method is relatively complex in its theory and implementation. Therefore, it requires an understanding of the mechanisms of urban dynamics as well as mastery over the requisite mathematical and computer knowledge for its application |
| 4. Land cover and land use classification performance of machine learning algorithms in a boreal landscape using Sentinel-2 data [35] | Uppsala in South-Central Sweden | Sentinal-2 multi temporal images was used covering an area of 10 × 12 km mixed-use landscape | SVM, RF, extreme gradient boosting (Xgboost), and deep learning (DL) | The results show that the highest overall accuracy was produced by support vector machines closely followed by extreme gradient boosting, RF and finally deep learning |
| Urban expansion in Centre County, Pennsylvania: spatial dynamics and landscape transformations [36] | Centre County, Pennsylvania | Landsat TM images of the county for 1993 and 2000 | Cross-tabulation; logistic regression; CLUE-S regional modeling framework | Although the model is able to simulate urban land use location at the county level, it is less able to simulate these locations at the sub-county level due to non-availability of data at the appropriate scale |
| Modeling urbanization patterns with generative adversarial networks [37] | Global training samples of 30,000 cities (urban footprints) | Global training samples of 30,000 cities (urban footprints) https://github.com/adrianalbert/citygan (accessed on 4 April 2021). | Generative adversarial networks (GANs) | GAN model is able to generate realistic urban patterns that capture the great diversity of urban forms across the globe |
Publisher’s Note: MDPI stays neutral with regard to jurisdictional claims in published maps and institutional affiliations. |
© 2021 by the authors. Licensee MDPI, Basel, Switzerland. This article is an open access article distributed under the terms and conditions of the Creative Commons Attribution (CC BY) license (https://creativecommons.org/licenses/by/4.0/).
Share and Cite
MDPI and ACS Style
Chaturvedi, V.; de Vries, W.T. Machine Learning Algorithms for Urban Land Use Planning: A Review. Urban Sci. 2021, 5, 68. https://0-doi-org.brum.beds.ac.uk/10.3390/urbansci5030068
AMA Style
Chaturvedi V, de Vries WT. Machine Learning Algorithms for Urban Land Use Planning: A Review. Urban Science. 2021; 5(3):68. https://0-doi-org.brum.beds.ac.uk/10.3390/urbansci5030068
Chicago/Turabian StyleChaturvedi, Vineet, and Walter T. de Vries. 2021. "Machine Learning Algorithms for Urban Land Use Planning: A Review" Urban Science 5, no. 3: 68. https://0-doi-org.brum.beds.ac.uk/10.3390/urbansci5030068