Article

Spatial Information Gaps on Deprived Urban Areas (Slums) in Low-and-Middle-Income-Countries: A User-Centered Approach

1
Faculty of Geo-Information Science and Earth Observation (ITC), University of Twente, 7514 AE Enschede, The Netherlands
2
Department of Geosciences, Environment and Society, Université Libre de Bruxelles (ULB), 1050 Brussels, Belgium
3
Division of Geoinformatics, KTH Royal Institute of Technology, 10044 Stockholm, Sweden
4
School of Architecture (ETSAUN), University of Navarra (UN), 31009 Pamplona, Spain
*
Author to whom correspondence should be addressed.
Submission received: 30 June 2021 / Revised: 11 September 2021 / Accepted: 21 September 2021 / Published: 26 September 2021

Abstract

:
Routine and accurate data on deprivation are needed for urban planning and decision support at various scales (i.e., from community to international). However, analyzing information requirements of diverse users on urban deprivation, we found that data are often not available or inaccessible. To bridge this data gap, Earth Observation (EO) data can support access to frequently updated spatial information. However, a user-centered approach is urgently required for the production of EO-based mapping products. Combining an online survey and several forms of user interactions, we defined five system specifications (derived from user requirements) for designing an open-access spatial information system for deprived urban areas. First, gridded maps represent the optimal spatial granularity to deal with high uncertainties of boundaries of deprived areas and to protect privacy. Second, a high temporal granularity of 1–2 years is important to respond to the high spatial dynamics of urban areas. Third, detailed local-scale information should be part of a city-to-global information system. Fourth, both aspects, community assets and risks, need to be part of an information system, and such data need to be combined with local community-based information. Fifth, in particular, civil society and government users should have fair access to data that bridges the digital barriers. A data ecosystem on urban deprivation meeting these requirements will be able to support community-level action for improving living conditions in deprived areas, local science-based policymaking, and tracking progress towards global targets such as the SDGs.

1. Introduction

Urbanization in Low-and Middle-Income Countries (LMICs) is coupled with a vast increase of people living in deprived areas (commonly known as slums) [1]. The UN estimates that a billion people currently live in slums, a number that is estimated to reach 2 billion by 2050 [2]. Poverty levels worldwide are measured by socioeconomic status (SES) and appear to be insufficient to fully conceptualise deprivation levels. The characterisation of deprived urban areas remains an undeveloped field. When these areas are mapped, they are generally represented by their outer boundary, but characterisation (e.g., differences in living conditions) within each area is missing.
Spatial data on deprived areas are mostly unavailable, and if available, they are outdated or often come with large gaps [3]. Reliable city-scale data are urgently required for tracking global policy goals such as the urban SDGs, for local policy support, or for disaster preparedness and the management of humanitarian crises (e.g., pandemics such as COVID-19) [4,5,6]. The increasing availability of spatial data, notably Earth Observation (EO) data, has the potential to fill these data gaps when they are combined with ground-based knowledge [7]. EO allows the continuous gathering of physical and environmental data, e.g., in the form of satellite images of the planet Earth. Presently, several hundreds of EO satellites provide data that range from Very-High Resolution (VHR) images (e.g., 0.3–1 m) to low resolution meteorological satellite images (e.g., 1–4 km). Maps derived from EO (captured by satellites, aircrafts, or drones) provide information on the location and extent of deprived areas within a city, and/or on their characteristics (e.g., land cover, built-up density, street network, etc.). In satellite images, deprived urban areas can be identified by their physical characteristics (Figure 1). These characteristics have been conceptualised in the Generic Slum Ontology (GSO) at three spatial scales (i.e., object, settlement and environs) [8]. At the object level, buildings have specific characteristics, e.g., small roof areas, specific roofing materials, etc. At the settlement level, high built-up densities, an absence of vegetation, and irregular patterns are common. At the environs level, areas are often found at hazardous locations that have access to livelihood opportunities. Such information is supporting EO-based mapping. Common mapping outputs are either in the form of binary or multi-class maps, delineating deprived areas (e.g., [9,10,11]).
While EO studies have increasingly developed methods to map the location, extent and dynamics of deprived areas, most scientific studies provide neither easily accessible methods and tools nor operational data sets. Very few openly available and downloadable datasets on deprived urban areas exist (Table 1). Moreover, content, documentation, and coverage vary and do not necessarily respond to user needs. In general, there is limited communication and understanding between the EO research and data production community and local government, civil society, and community users about their data needs [11,12]. This is particularly true in rapidly developing urban areas of LMICs, due to the mismatch of methods developed in research labs that fall short in understanding the local data needs and user information requirements.
Making EO-based spatial data on deprived areas publicly available might even be harmful to local communities by revealing details without their knowledge or consent [12,18]. Therefore, data on deprived areas need to be made available in a responsible manner to protect group privacy and minimize the risk of stigmatization or misuse [19]. Thus, central problems from the perspective of urban data users are (1) data are not available or (2) do not match their requirements, and (3) users’ geo-ethical questions are not clarified.
There is a large number of methods available in the field of EO for producing information about deprivation. Such studies [20,21,22,23,24] stressed the potential of EO data and machine learning methods to fill data gaps on deprived areas. Most results showed that with the help of VHR images and machine learning-based methods, deprived areas can be mapped and characterised relatively accurately [20,25,26]. Physical parameters (e.g., building densities) are quite straightforward to extract from EO data, while the extraction of social parameters (e.g., via EO proxy indicators) is more complex, but often possible. Therefore, users could benefit from EO innovations if their information needs were better understood by EO researchers [27]. This is a pre-requisite to achieve impact and contribute to societal progress on the ground [28].
User information needs for data on deprived areas are diverse, with many disciplines requiring reliable and up-to-date data urgently. For example, health professionals require reliable data on the location of deprived areas to assess the variations of health outcomes between deprived areas and well-serviced urban areas [5,29,30,31]. As another example, in case of disasters, people living in deprived areas often drop out of any compensation scheme (i.e., in the recovery process) as there are no official records of their existence [32,33,34]. To fully understand local data needs, towards a user-centered approach, a dialogue with local users, in particular communities, needs to include opportunities and risks of the increasing amount of data available. Therefore, the EO community needs to better understand and engage with local communities on how to optimize innovations for boosting communities’ benefits. In general, user-centered approaches involve users in every step of a design, e.g., the design of an information system [35]. Such a design process includes context analysis, defining user requirements, designing solutions, and evaluation [36,37]. Putting users at the centre should ultimately reduce the digital divide and bridge communications gaps between local users and EO-researchers [19]. Responding to user requirements, this means that researchers need to consider how research outputs could support short- and long-term societal changes, through evidence-based policymaking [4,38]. For example, the EO community had very limited operational data about deprived areas available to support action against the COVID-19 outbreak, leaving local authorities and other governmental and humanitarian organizations without data on more than one billion people in densely built-up deprived areas. The absence of operational data was essentially caused by the fact that urban EO methods are developed with insufficient input from local users. For example, methods are often tested on small areas of a few km2, while questions of scalability and transferability are ignored [27]. Consequently, neither do most studies produce city-level delineations of deprived areas (due to image and computational costs), nor is the next step taken to provide a locally relevant characterisation of deprived areas.
Towards the design of solutions, an integrated mapping framework is urgently required to combine EO and relevant local datasets linked to the emerging data needs of different user groups [39]. To achieve this, ethical data sharing and mapping guidelines are needed [19]. For example, to reduce risks for deprived communities, unnecessary details in data should be avoided, and data aggregation should be considered (Figure 2). Such aggregated data can provide the degree of “deprivation” per cell or city block [40]. As such, users can select their locally adapted thresholds when categorical maps are required, protecting individual and group privacy in published data, combined with transparency in methods [28]. Ultimately, such an information system will require a continuous evaluation and an agile design to respond to emerging information needs [41].
The research project SLUMAP (Remote Sensing for Slum Mapping and Characterisation in sub-Saharan African Cities) is an effort to develop an open-source framework with suitable methods and tools for mapping and characterising deprived areas in sub-Saharan Africa (SSA), taking into account costs, benefits, and user information requirements. We observe a major gap between the fast developments in EO/Artificial Intelligence (AI) methods and local user needs related to spatial information on deprived urban areas. This gap is a general issue shared across LMICs. Therefore, the aim of this paper is the design of a framework towards a user-centred approach for the production of spatial data on deprived urban areas (with a general focus on LMICs cities). This will strengthen the link between technology and information needs at different levels and ensure that research developments will contribute to addressing information gaps.

2. Materials and Methods

To develop a framework for mapping and characterising deprived areas in support of pro-poor policies, it is essential to understand the user information needs (including potential users). This is done in the context of minimizing gaps caused by inconsistent and unavailable data and contribute to the local monitoring of the SDG indicator 11.1.1 (i.e., the proportion of the urban population living in slums, informal settlements, or inadequate housing).

2.1. Setup of the User Needs Assessment

Any user-centred approach, before entering the design phase, requires defining the context and assumptions. To define the context, we went broader than SSA. The unavailability of data on deprived urban areas is a general problem in LMICs, and additionally, SDG 11.1.1 is a global goal. Therefore, the user interaction was focusing on the LMICs in general. However, two cities in SSA countries (Nairobi and Lagos) where we have good relations with community-based groups have been used to get detailed insights to community-based information needs. In addition, we also had discussions and workshops with groups in Latin America and Asia (e.g., [42]). We assume that the diversity of interactions provides general insights into data needs in LMICs.
Next, we mapped different users and grouped them into major groups based on scale, i.e., (i) international, (ii) local (country/city), and (iii) community levels. Certainly, a degree of diversity is present within these groups as they will differ according to different geographic contexts, but we assume that our 3-level categorization is the most meaningful for the objectives of this study:
a.
At the international level, the information needs assessment covers intergovernmental organizations, such as UN-Habitat or the European Commission, and the global research community working on deprived areas.
b.
At the national and in particular local/city level, planning departments and planning ministries (government), as well as the private sector (e.g., planning or GIS consultants), are covered that require timely information about deprived areas, e.g., to map the dynamics and characteristics of deprived areas for facilitating science-based policymaking.
c.
At the community level, community-based organizations (CBOs) and non-governmental organizations (NGOs) are covered to understand data needs for intra-slum communities, making these places visible in a responsible way, and helping to promote the improvement of their living conditions.

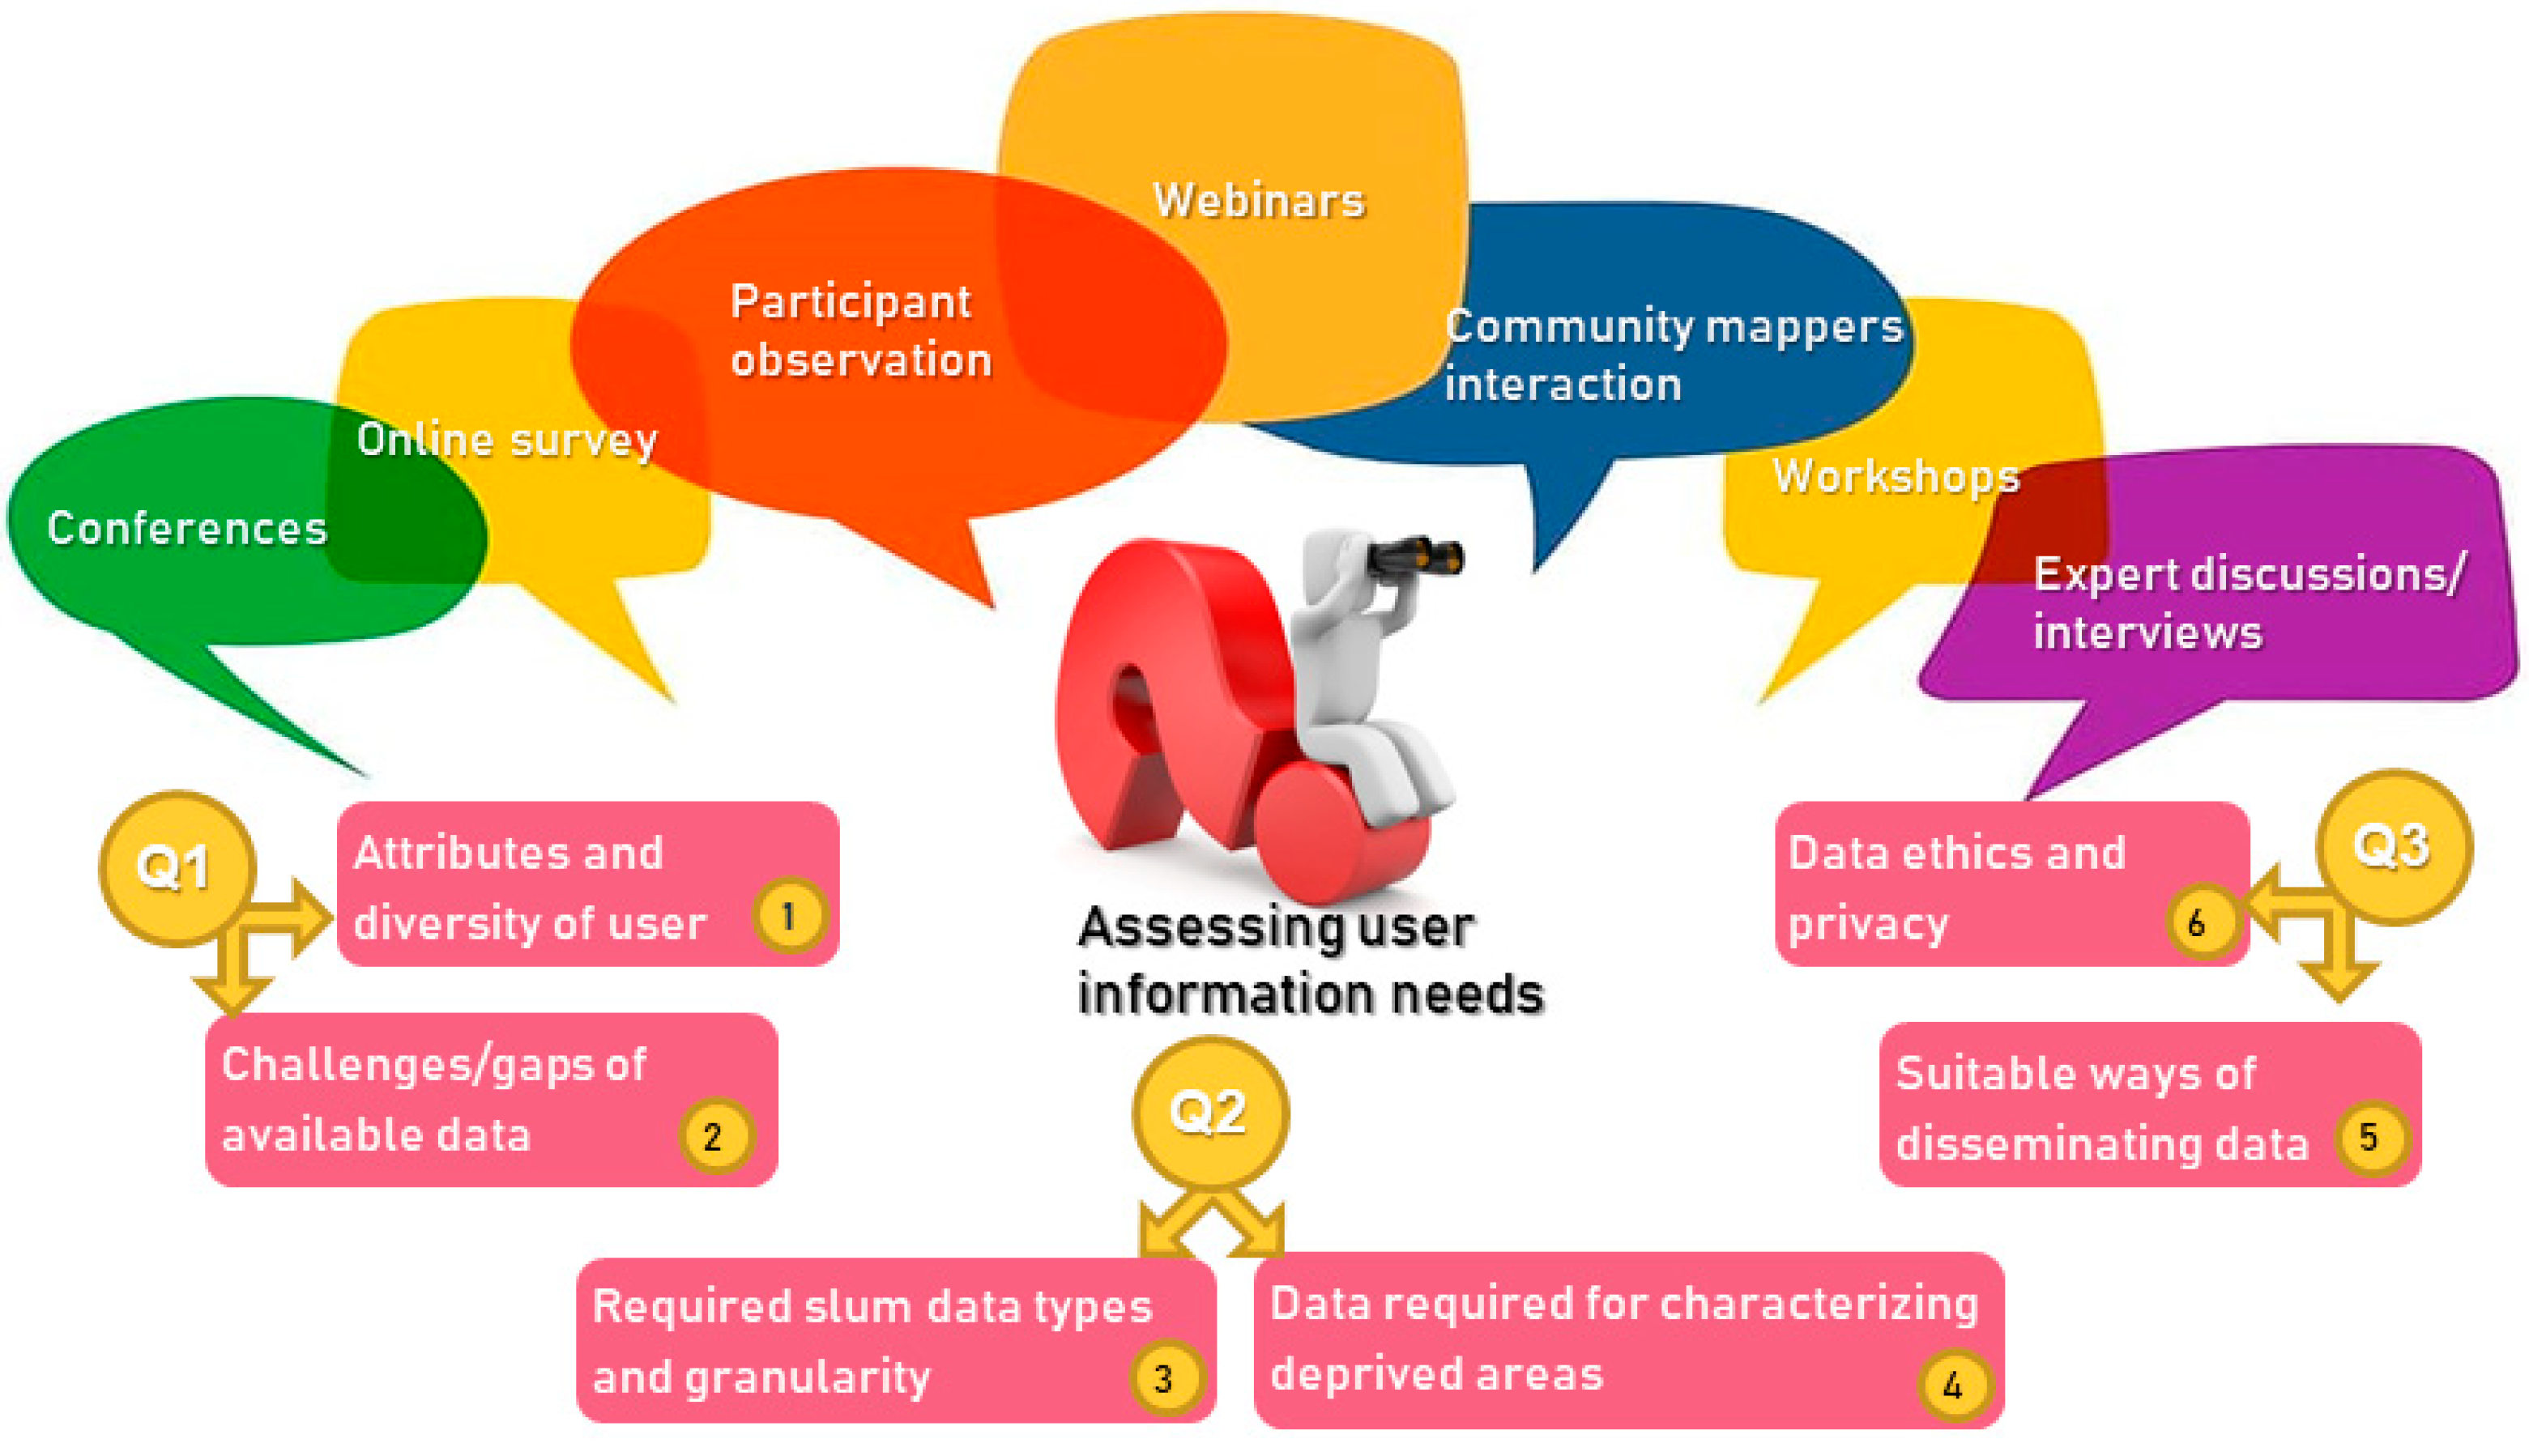
2.2. Data Collection on User Needs

To effectively understand user requirements, we performed a thorough assessment of information requirements, appropriate methods, and dissemination to relevant users. A diverse set of quantitative and qualitative data collection instruments have been used to access information and develop an understanding of diverse information needs. For the data collection, ethics clearance of the ITC ethics committee has been obtained. The data were collected during the period 2019–2021 using the following methods and sources:
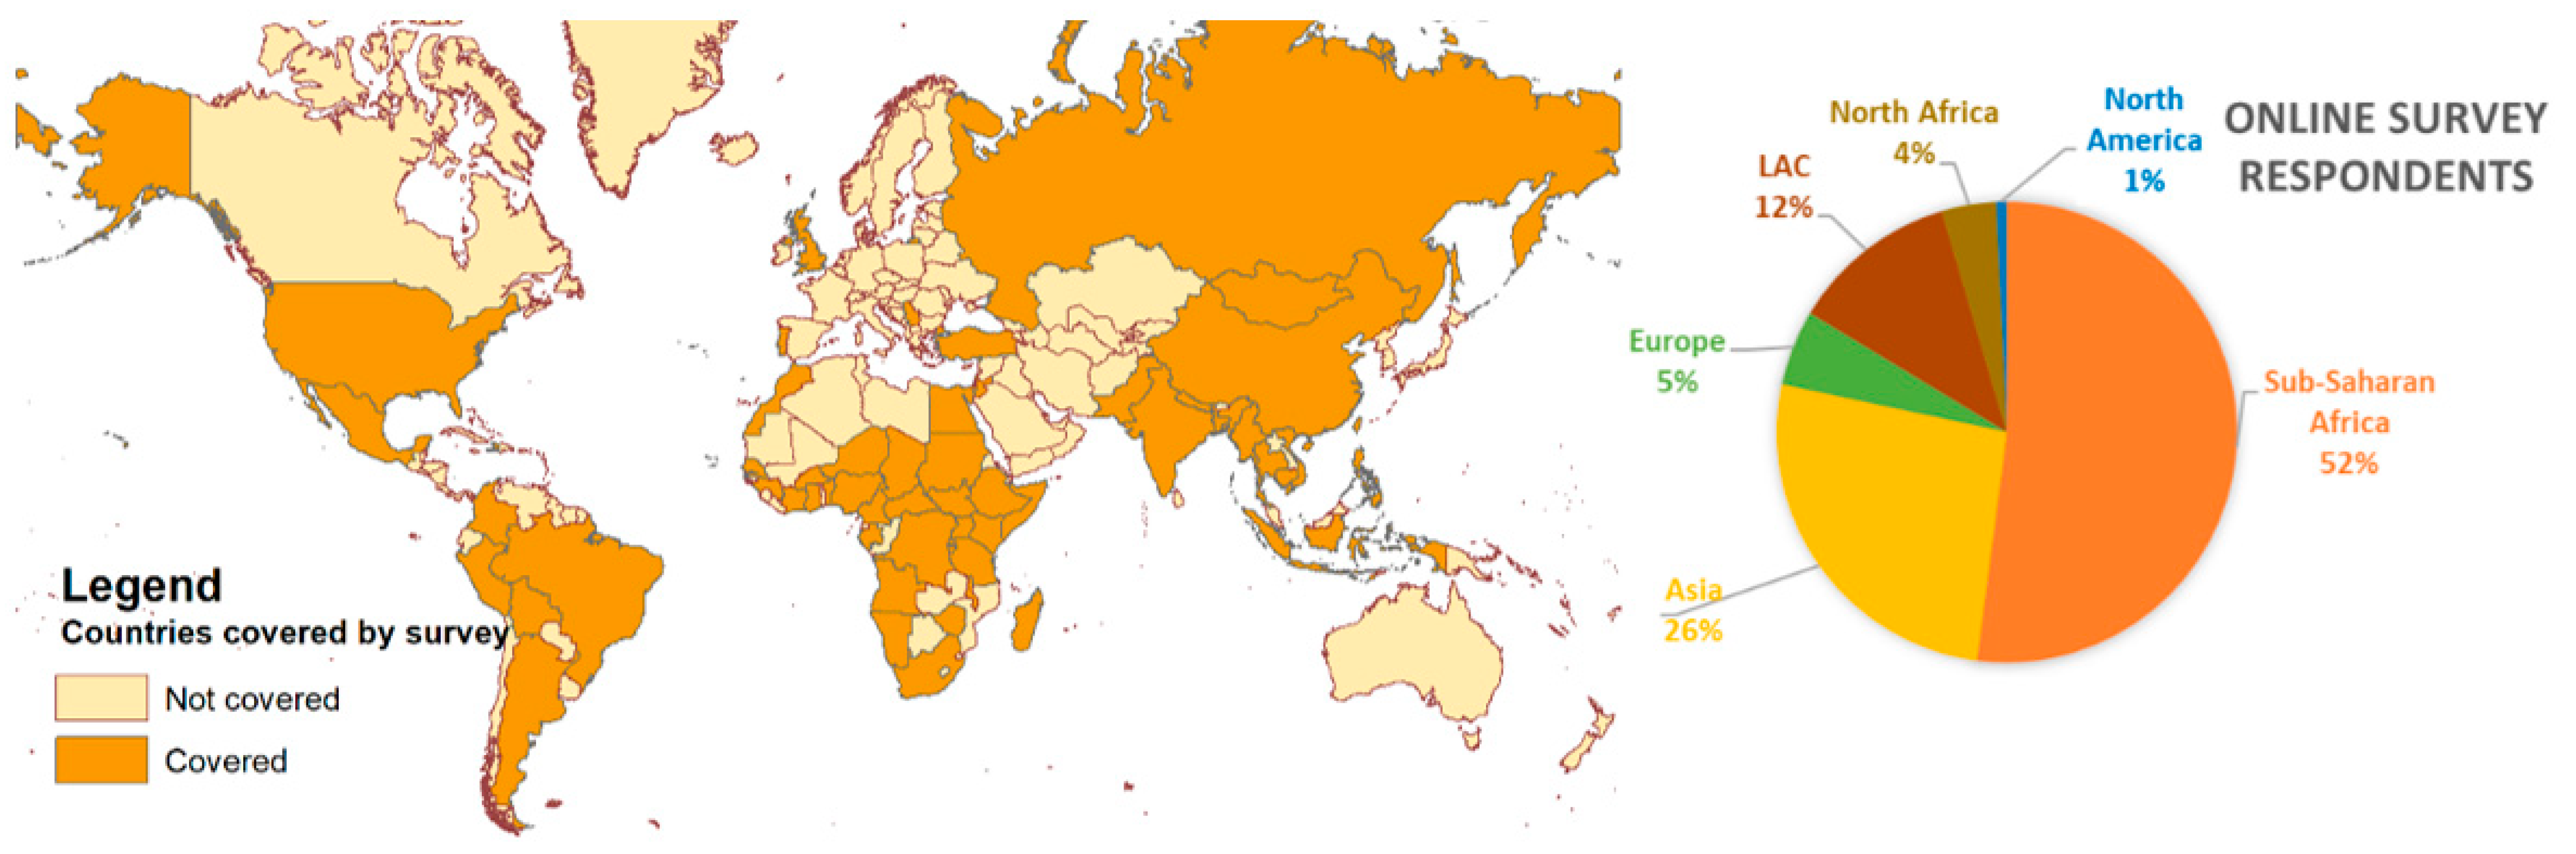
  • Online survey of users (experts) working with deprived areas/slum-related spatial data (N = 112), conducted June–October 2020, using LimeSurvey (https://www.limesurvey.org, accessed 23 September 2021). The complete results of the online survey are available as Supplementary Material (LMIC focus).
  • Participant observation (a qualitative data collection method) and summarizing discussion of several workshops linked with SLUMAP and the Integrated Deprived Area Mapping System (IDEAMAPS) [43]:
    -
    Human Planet Forum (Fall 2019) (global focus);
    -
    World Urban Forum (Spring 2020) (LMIC focus);
    -
    Several webinars (e.g., the IDEAMAPS Lounge webinar series) on deprived area mapping (throughout 2020) (LMIC focus);
    -
    Local IDEAMAPS workshops in Lagos and Accra (Fall 2020) (SSA focus);
    -
    Community mappers interaction Nairobi and Nigeria (Summer 2020–Spring 2021)—actively contributing to the establishment of a group (https://www.communitymappers.com, accessed 23 September 2021) and development of a community mapper training curriculum (Summer 2021) (SSA focus);
    -
    Several webinars of community-based (mapping) and discussions with CBOs (throughout 2020) (LMIC focus);
  • Expert discussions and interviews with national and local planning authorities and national statistical offices (Spring 2019–Spring 2021) (LMIC focus).
This mix of methods allowed us to receive feedback from a diverse group of users on information needs (e.g., deprived areas) and requirements (e.g., spatial and temporal granularity). The online survey was distributed to a targeted group of experts based on the authors’ networks, authors of publications in the field, and disseminated to participants in relevant events. During several workshop sessions, an online interactive tool (Mentimeter [44]) was used to capture the feedback of users, by replying to questions or statements from a mobile phone or other devices. During data collection, the term ‘slum’ was used, as it is widely understood by users based on the definition of UN-Habitat [45]. However, during many interactions with local users and communities, a general understanding was developed that ‘slum’ has a stigmatizing connotation. Therefore, for presenting the results, we use the term ‘deprived area’ or ‘deprived community’.

2.3. Framing the Analysis of User Needs

The findings of the online survey were analysed quantitatively, split into different user groups, i.e., international organizations, researchers, private sector, national government, local government, and civil society/NGO. The findings from workshops were summarized via notetaking to provide an understanding of user needs and information requirements. During several workshops, Mentimeter graphs and word clouds were used to collect feedback on important aspects (e.g., type of information required, access to open data).
The anticipated user requirement framework is critical to implement mapping of deprived areas while minimizing costs and making methods transferable and scalable across LMIC cities (presently ongoing in several SSA cities). The major analytical categories used to develop the framework (Figure 3) relate to (1) an understanding of the different user groups, (2) the challenges/gaps of data on deprived areas, (3) the spatial extent and updating frequency required, (4) the data required for characterising deprived areas, (5) suitable ways of disseminating deprived areas data, and (6) data ethics and privacy.
The result section is structured around three key questions (linked to the six information categories (in Figure 3)) that we aimed to answer during the different interactions, which were the following:
-
What do diverse users identify as the major gaps in presently available spatial data on deprived areas (Q1)?
-
What are the specific needs on characteristics and granularity of base data on deprived areas (Q2)?
-
How should spatial data on deprived urban areas be provided and disseminated to respond to privacy concerns (Q3)?
Answers to these questions will inform the development of a spatial information system on deprived urban areas that is responsible, provides frequently updated datasets, and is flexible in terms of user interaction.

3. Results

The results provide an overview of user needs in relation to the three questions (Figure 3). Each section combines the quantitative results of the online survey with a summary of results from user interactions (e.g., workshops).

3.1. Major Gaps in Available Spatial Data on Deprived Areas

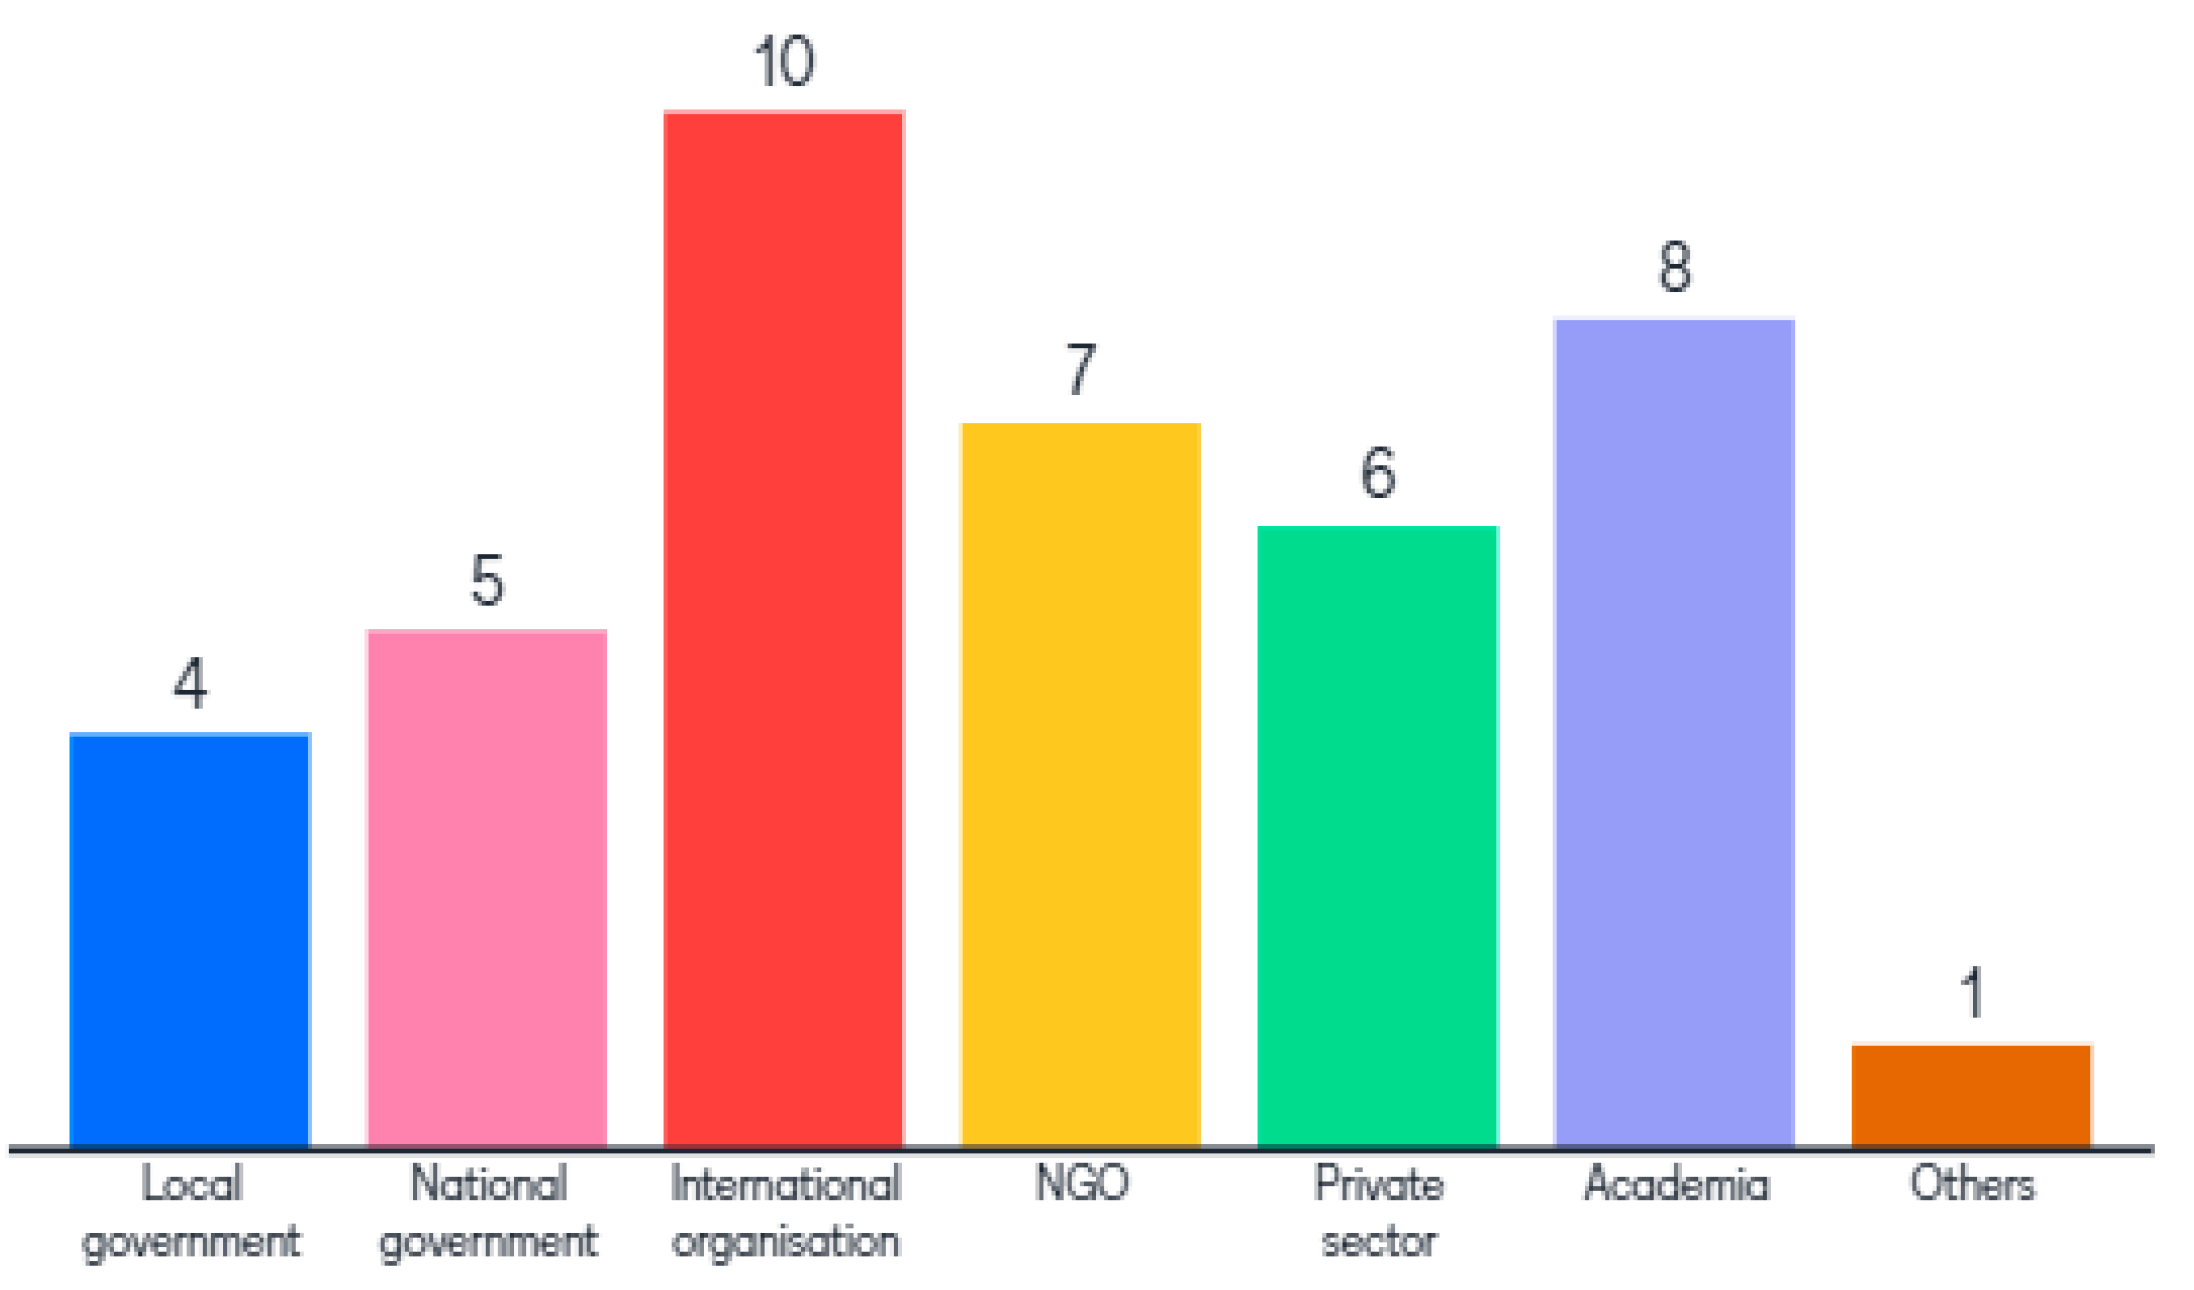
3.1.1. Attributes and Diversity of User Groups

Respondents (N = 112) to the online survey represented a broad range of users working with data on deprived areas and poverty from a large number of LMICs (Figure 4), with around half of the respondents from SSA and the other half split between Asia, Latin America and the Caribbean (LAC), North Africa, and a few from North America and Europe. The respondents represent CBOs, NGOs, the private sector, different levels of governments, international organizations, and academic institutions. While the majority of respondents (around 65%) belonged to research institutes and universities, around 13% worked for the government, 7% for international organizations, 7% for civil society organizations, and 8% for the private sector. The professional fields of respondents included city/regional planning, geo-information sciences, remote sensing, data science and Artificial Intelligence (AI), environmental science, economy, architecture, health, land management, civil engineering, water resource management, sociology, urban anthropology, statistics, and political science.
Conversely, workshops had a larger attendance of local and national government representatives, international agency, and NGO representatives. Figure 5, for example, indicates the distribution of participants in one workshop at the World Urban Forum 2020.

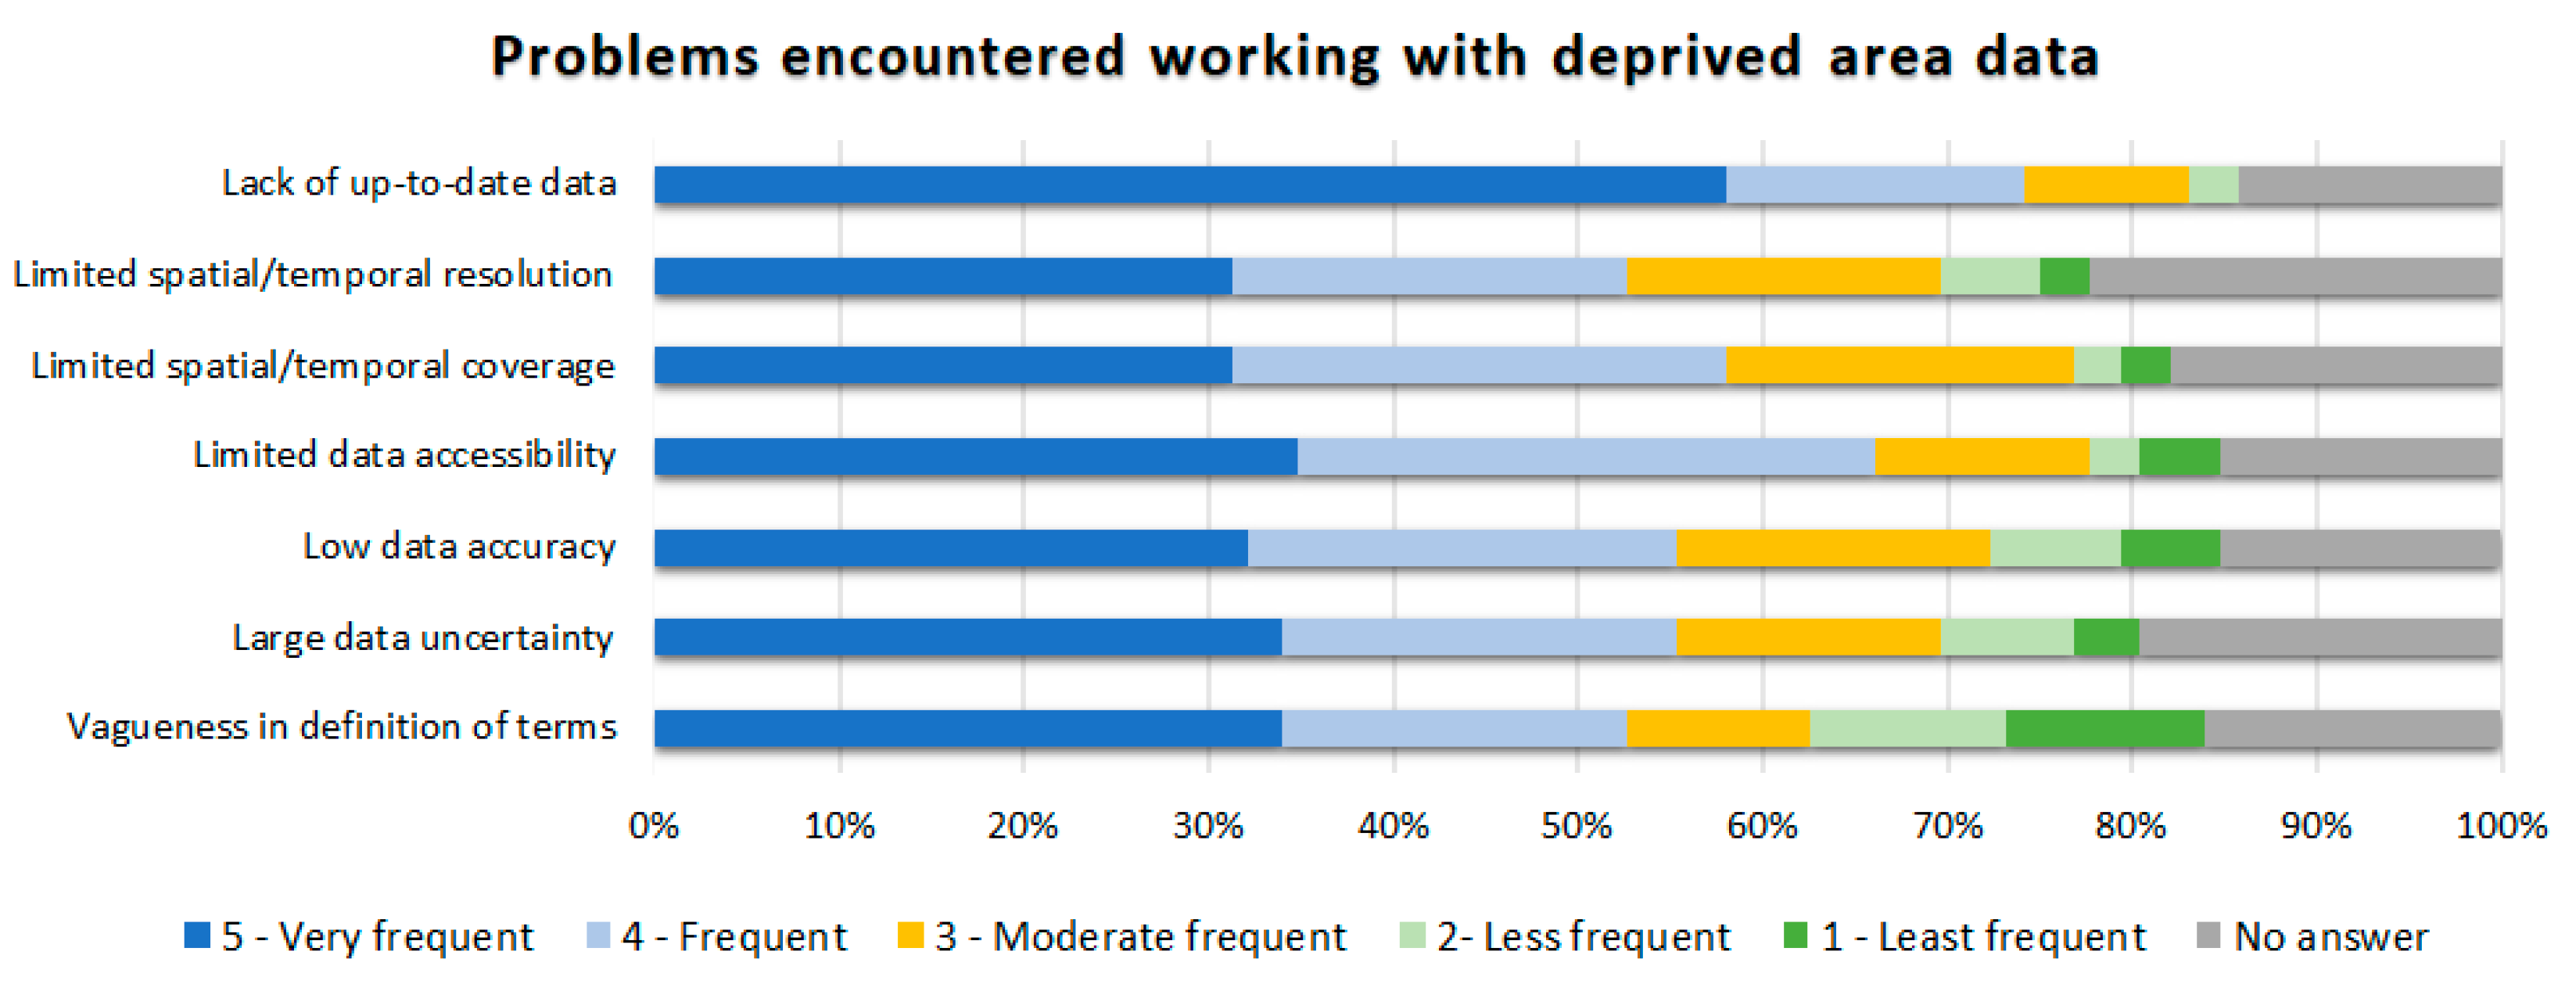
3.1.2. The Challenges and Gaps of Data on Deprived Areas

Conceptualizing problems experienced when working with data on deprived areas, in both the online survey and the workshops/expert discussions, the main issues were the availability of up-to-date data, limited access and/or low accuracies (when data are available) (Figure 6). Data on deprived areas are commonly not available; for example, in the online survey, around one third of respondents reported that they do not have access to digital data on deprived urban areas at all. CBOs stressed that data are collected in their areas but are ‘commonly not given back to them’ (data not accessible to them—in an easily accessible format).
Commonly, data were generated using field-based participatory mapping or human image interpretation methods (Figure 7). In general, these methods produced reliable mapping results; however, being very time and resource-intensive, the data were also not updated regularly or were only available for limited geographic areas. The major groups working with satellite or drone imagery were the private sector, followed by civil society organizations, researchers, and the national/local government (Figure 7). However, most respondents used deprived area maps generated with human image interpretation, and only the private sector showed a considerable share of AI-based methods (Figure 7).
During the workshops, participants were asked reasons that make deprived area/slum data important for their work; responses were summarized in the form of a word cloud (Figure 8). Prominent reasons related to improving conditions in deprived areas such as basic services and health. Furthermore, information on physical, environmental conditions, and population data were needed for the planning of short-term relief and long-term development. Thus, data are required to assess unaddressed needs and existing conditions that contribute to deprivation and to develop plans that improve local living conditions for inhabitants. This stresses the importance to understand such areas not as homogenous entities, but rather to call for data that reflect the specific local deprivation conditions.
During expert interactions, the chronic lack of base data (e.g., data about buildings and roads/paths) was strongly expressed. Available maps were often outdated and covered only part of the city. Moreover, data beyond the administrative city boundary (i.e., suburban and peri-urban areas) were often reported as highly dynamic with sparser data coverage. The missing data problem was also strongly stressed by CBOs, which have become more visible during the COVID-19 pandemic [5,46,47]. These missing data reported as needed at the community level, included updated population numbers to evidence and communicate about populations in need of food supply, data on health and other services, and environmental conditions such as those that contribute to health risks (e.g., the accumulation of waste piles—a problem that became even more acute during the COVID-19 lockdowns [47,48]). Furthermore, data needs for open spaces and their physical characteristics have been expressed to inform pro-poor policies.

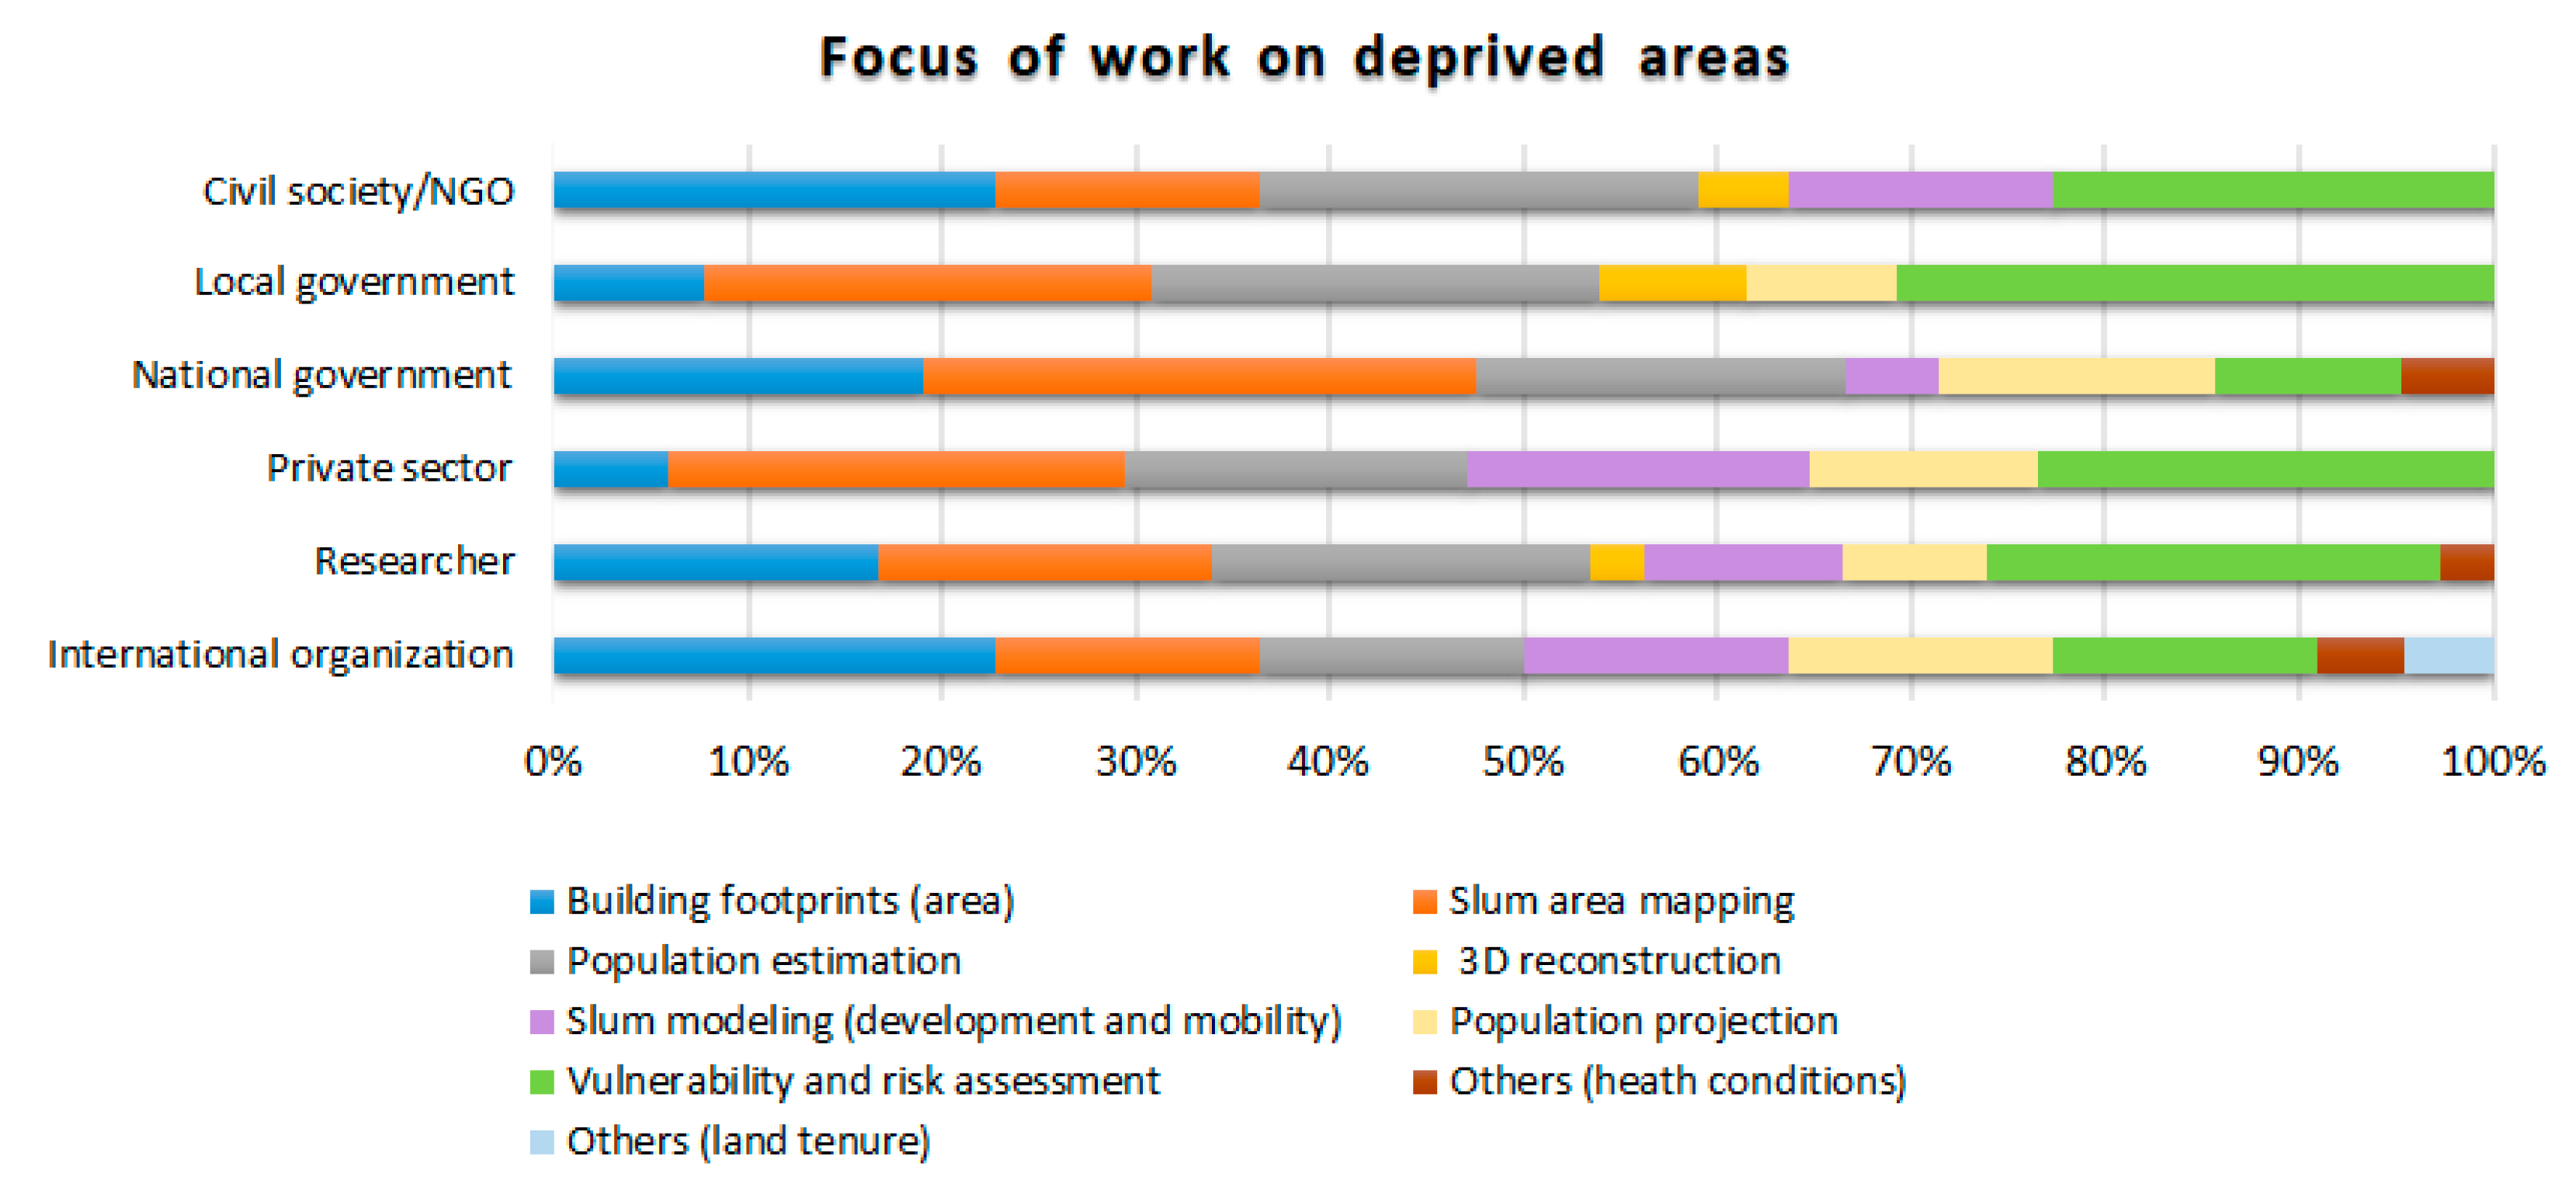
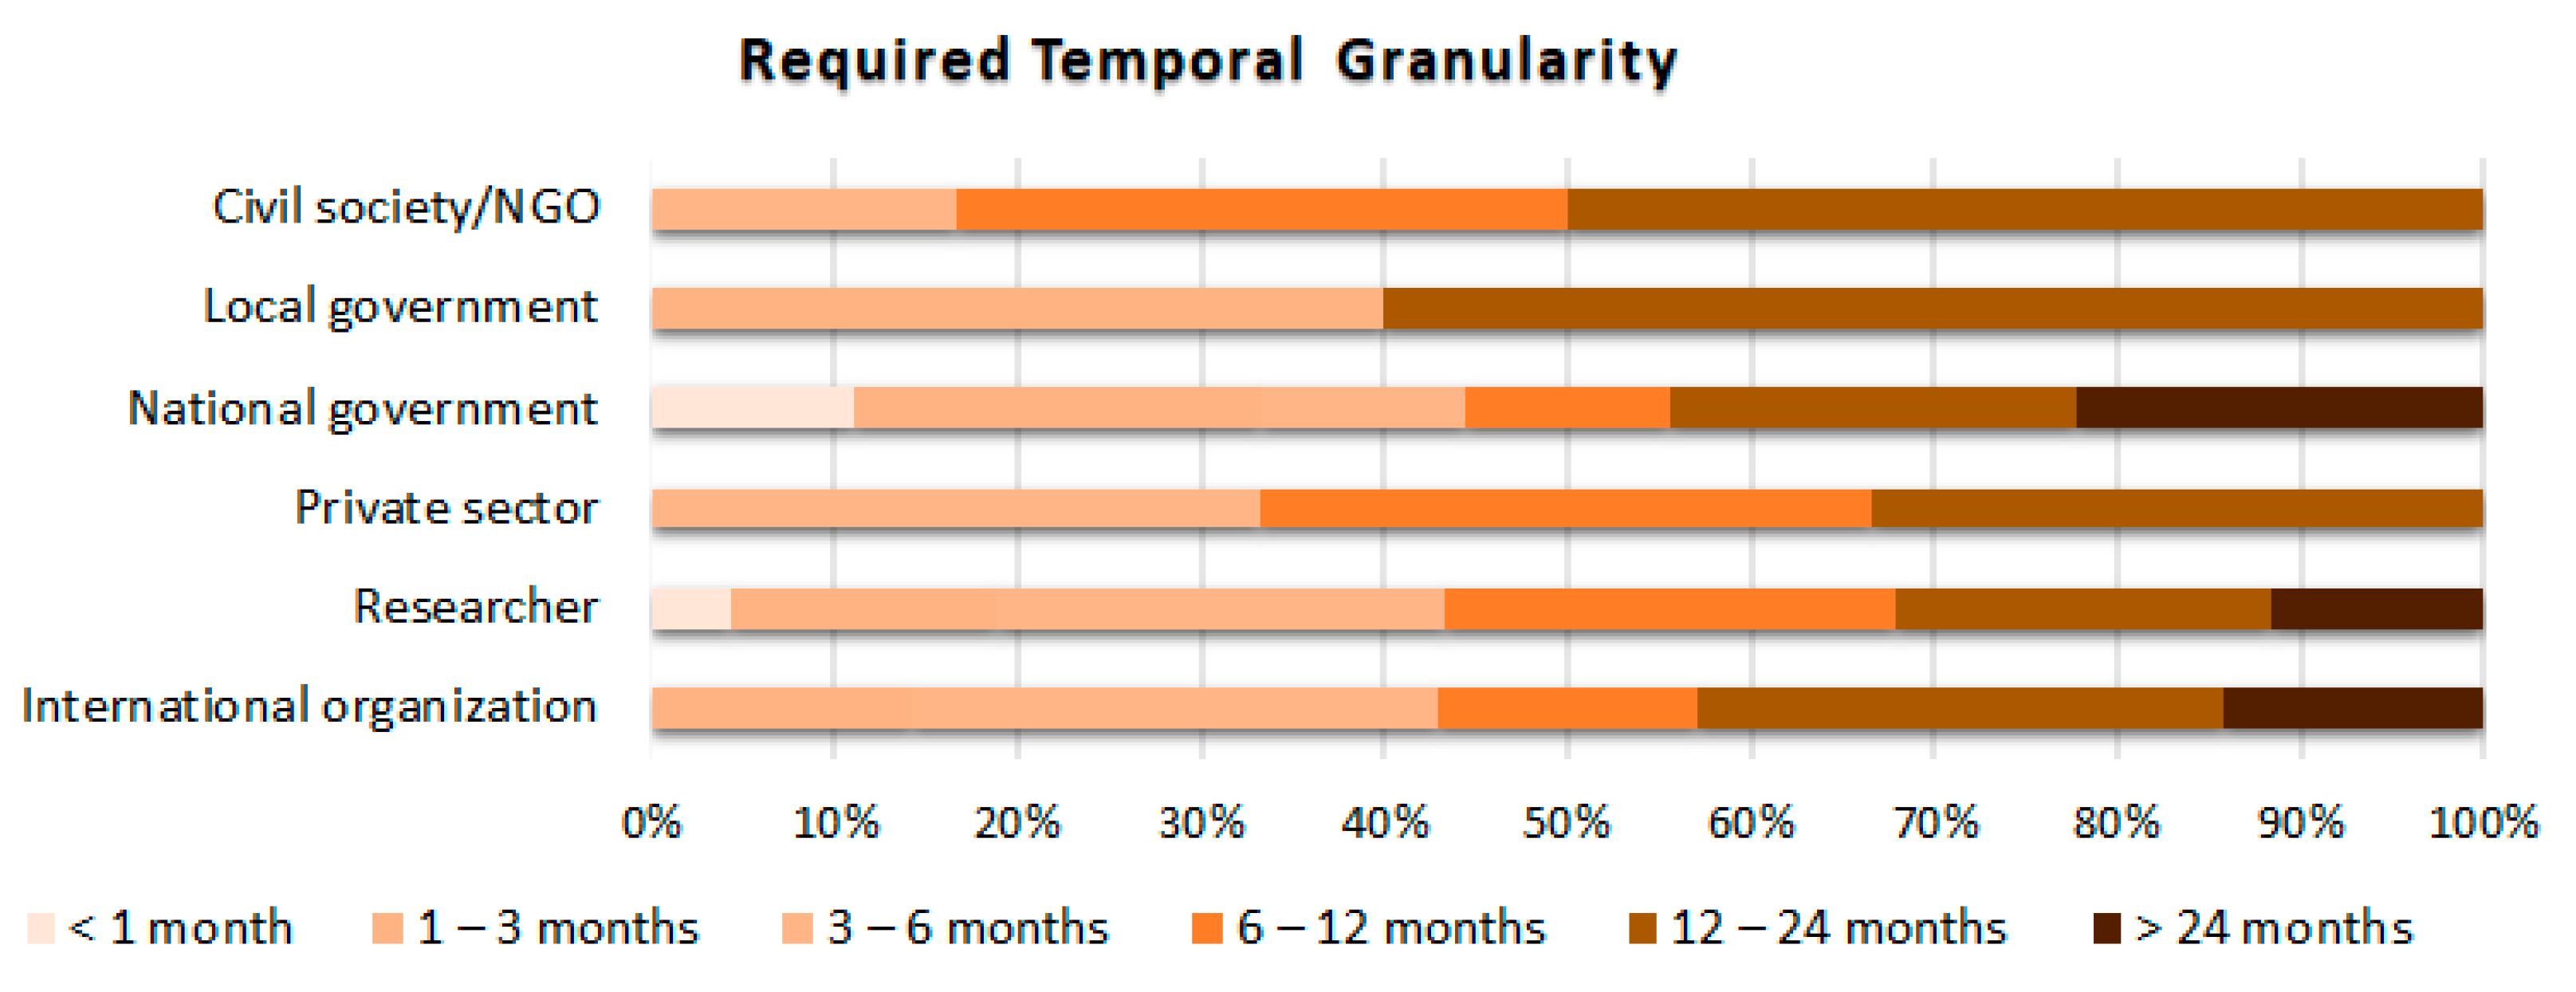
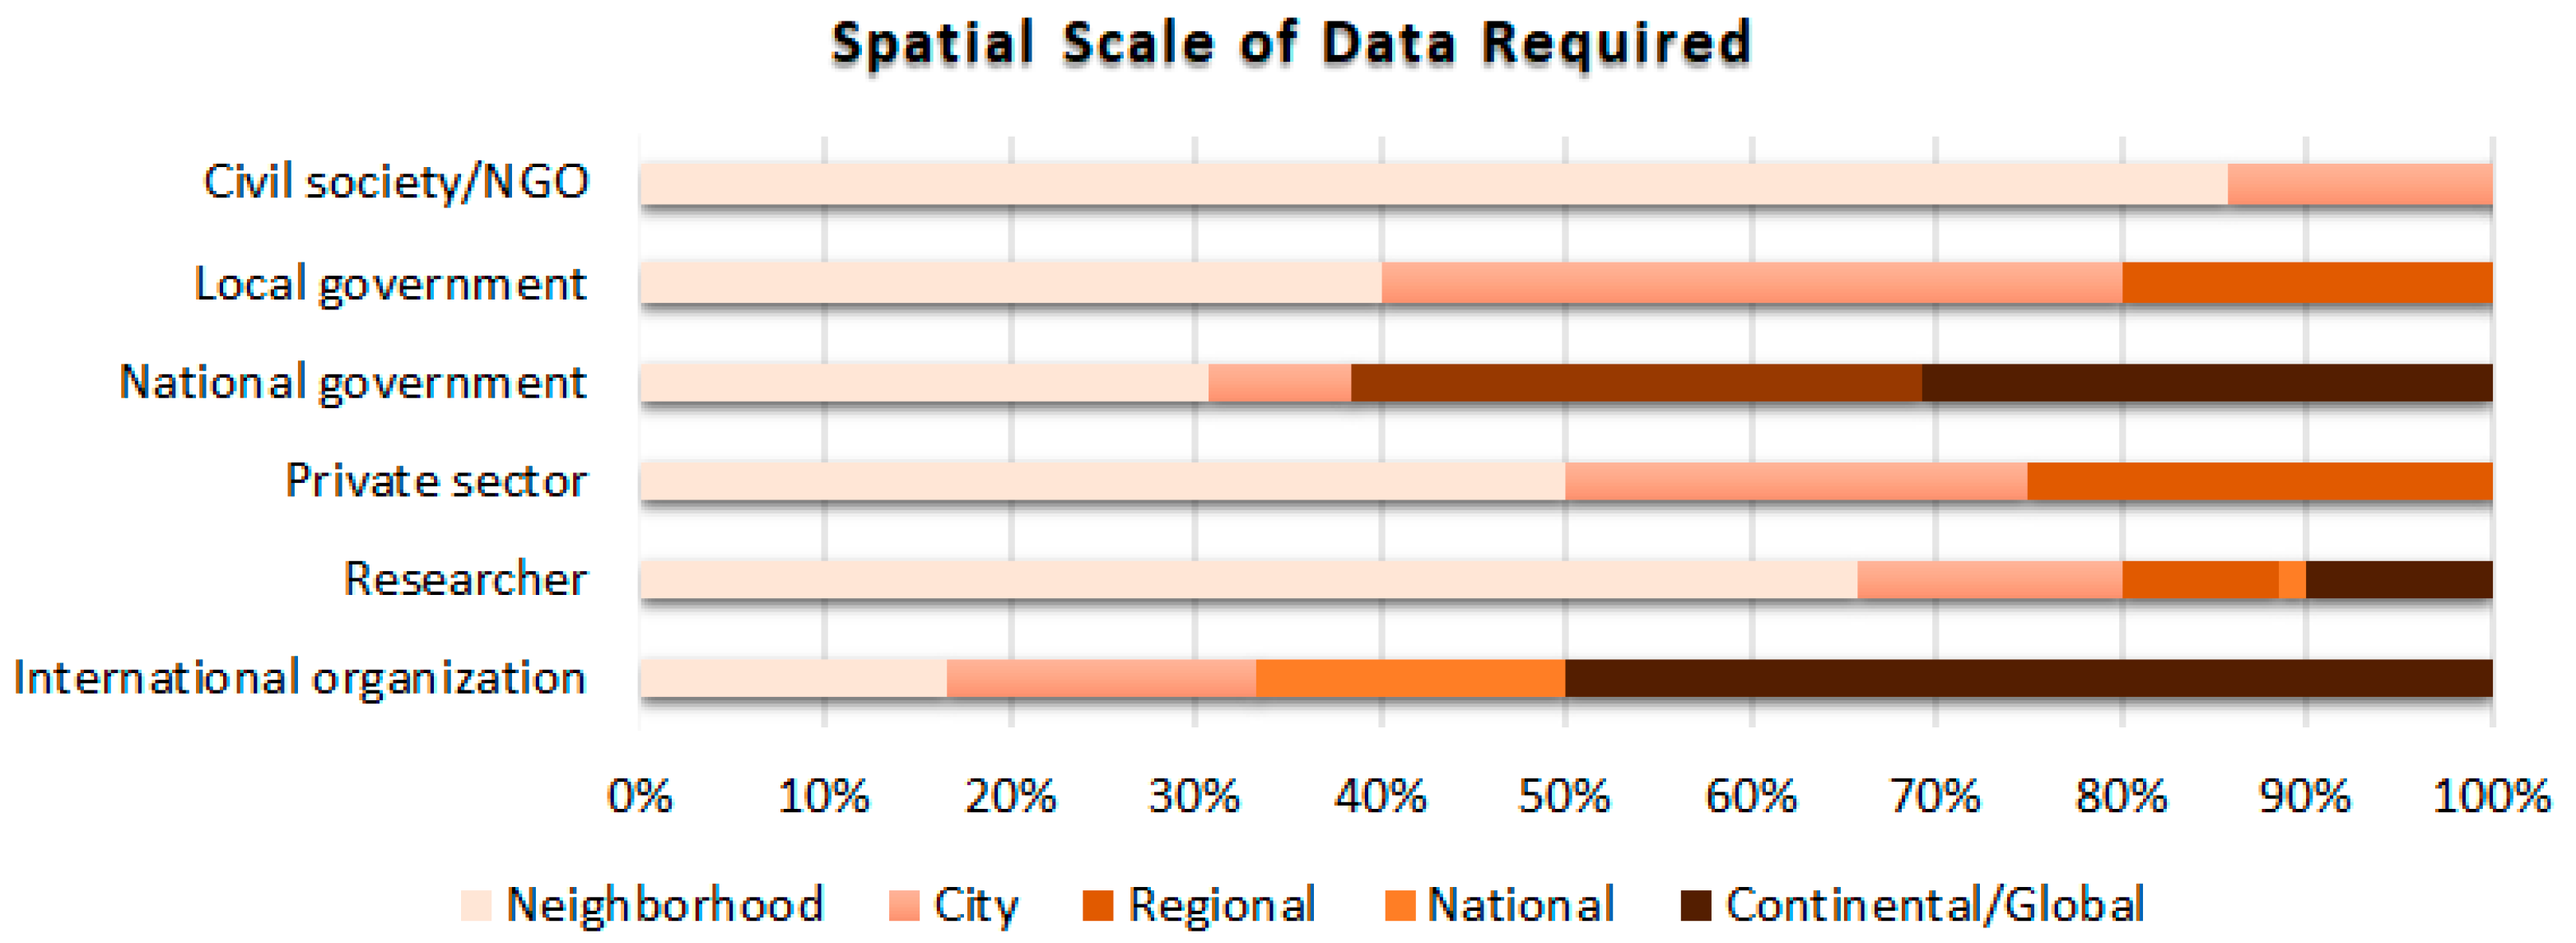
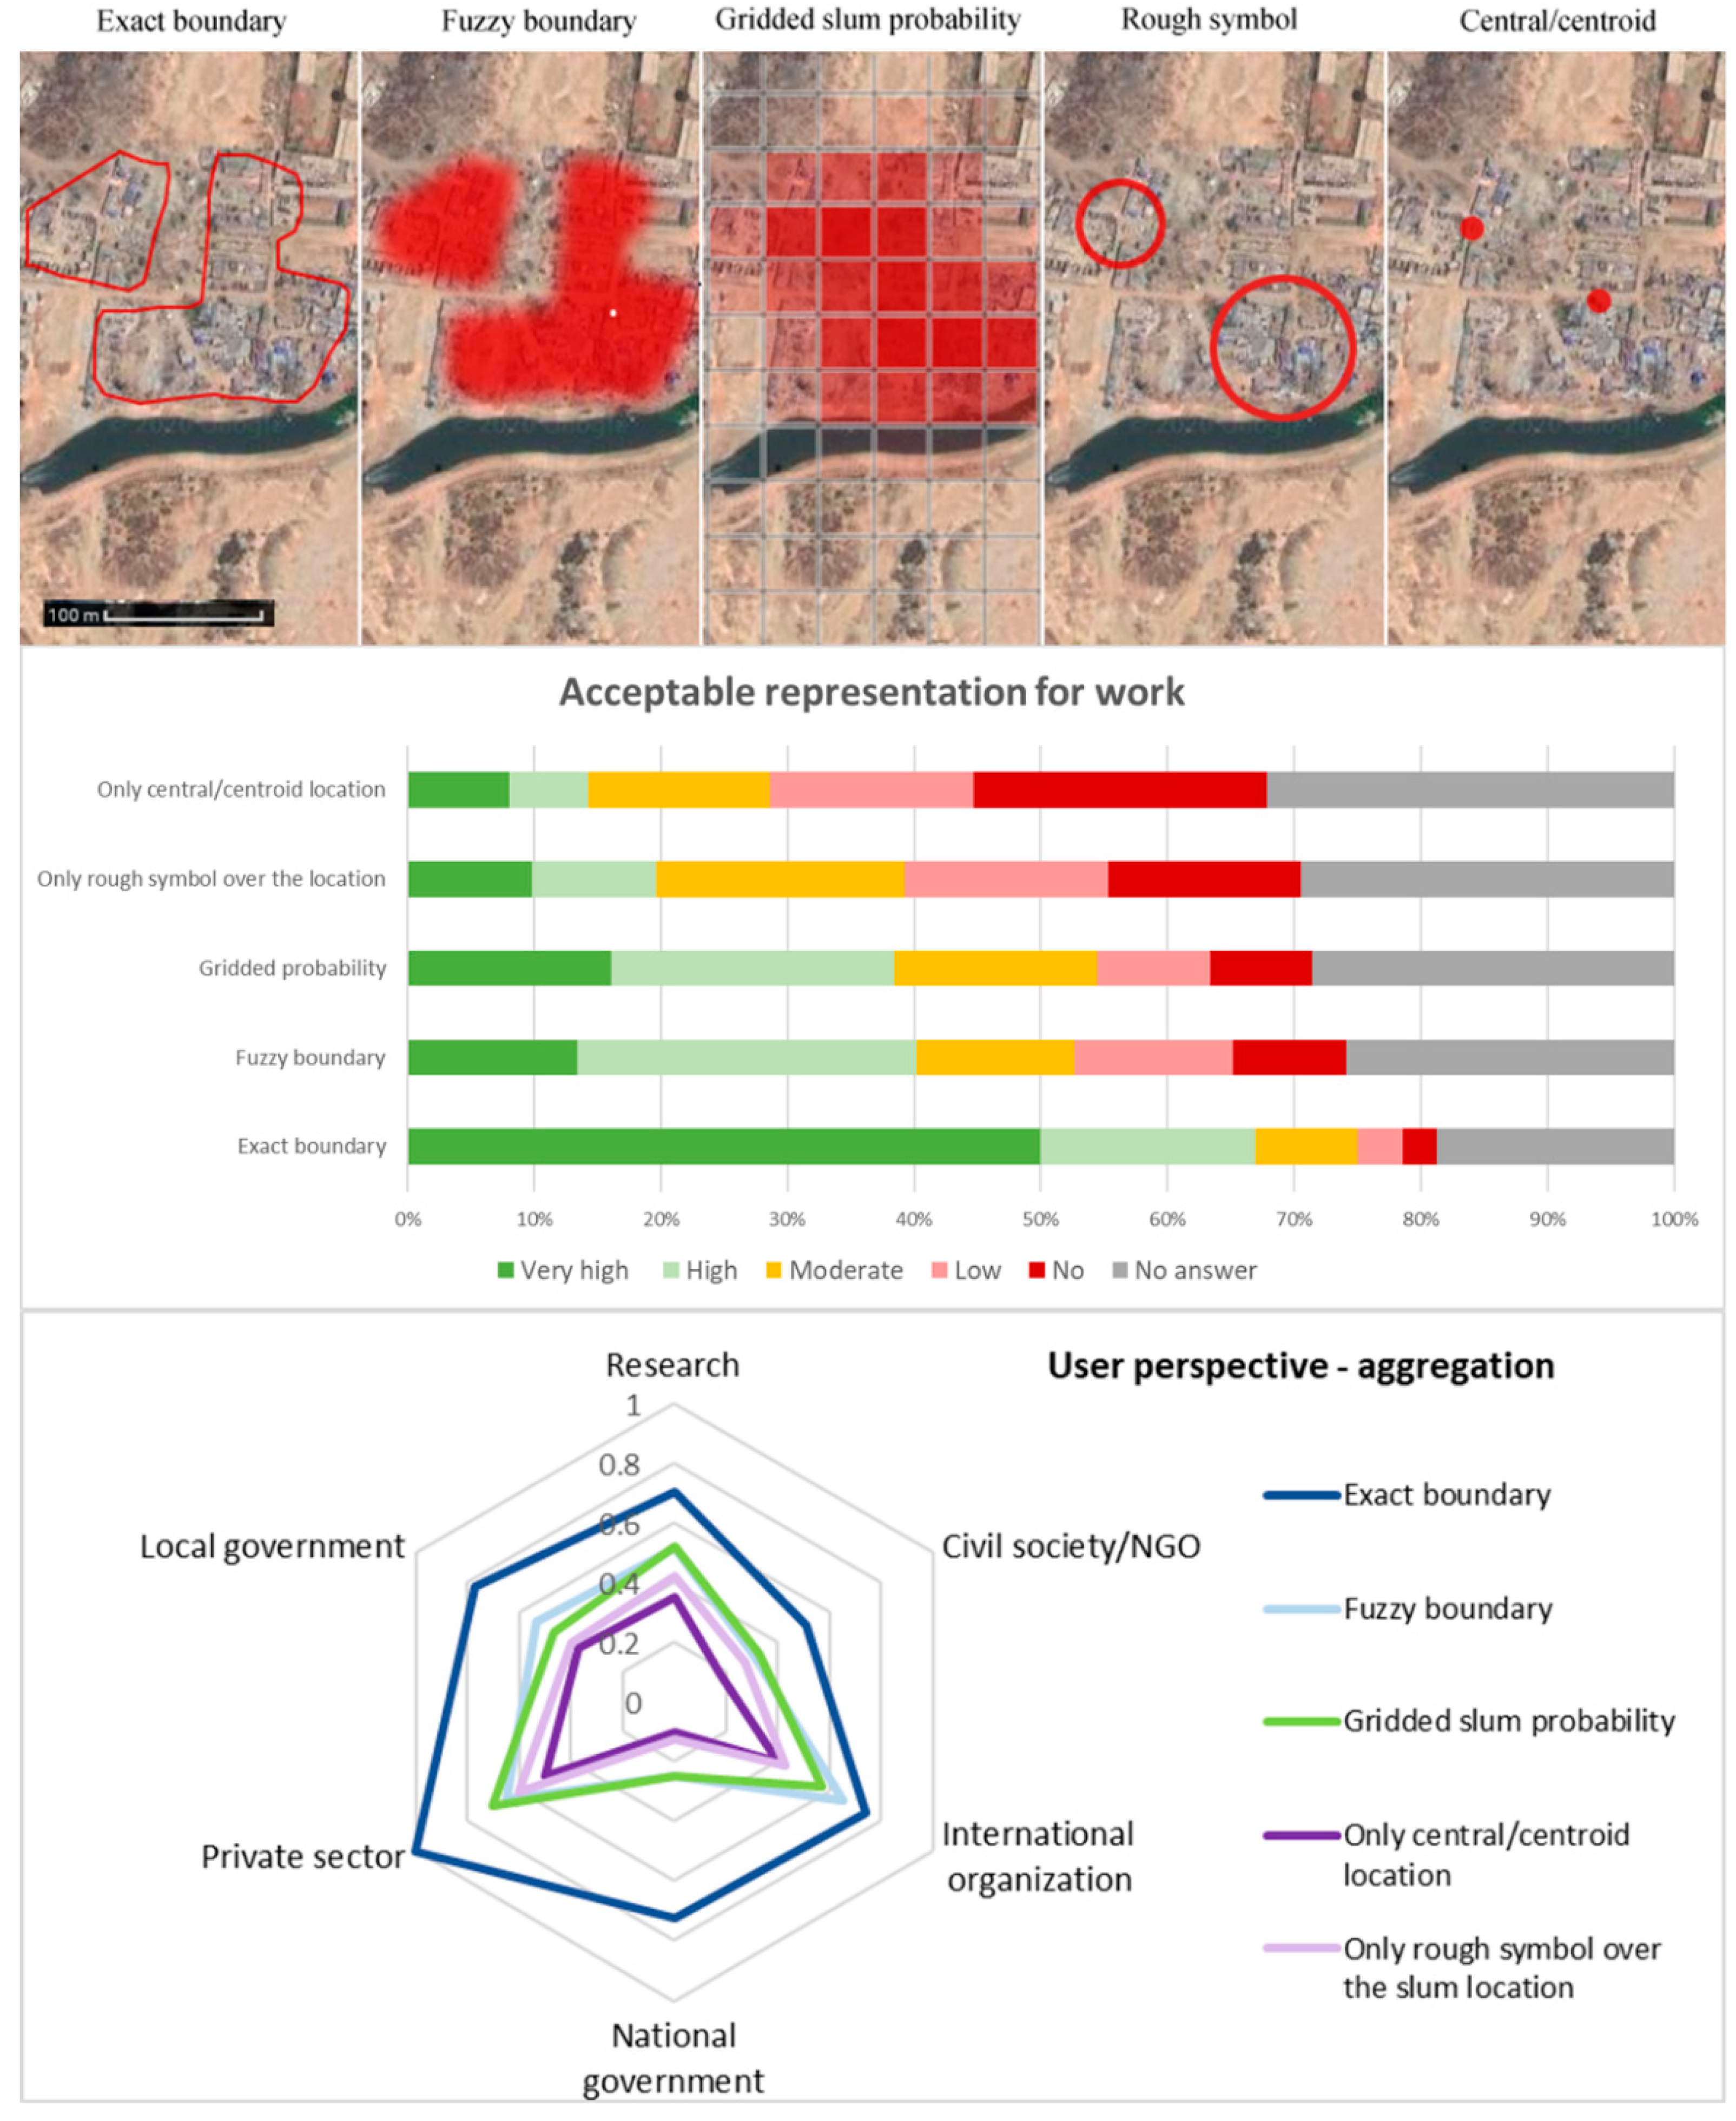
3.2. Characteristics of Deprived Areas and Required Granularity

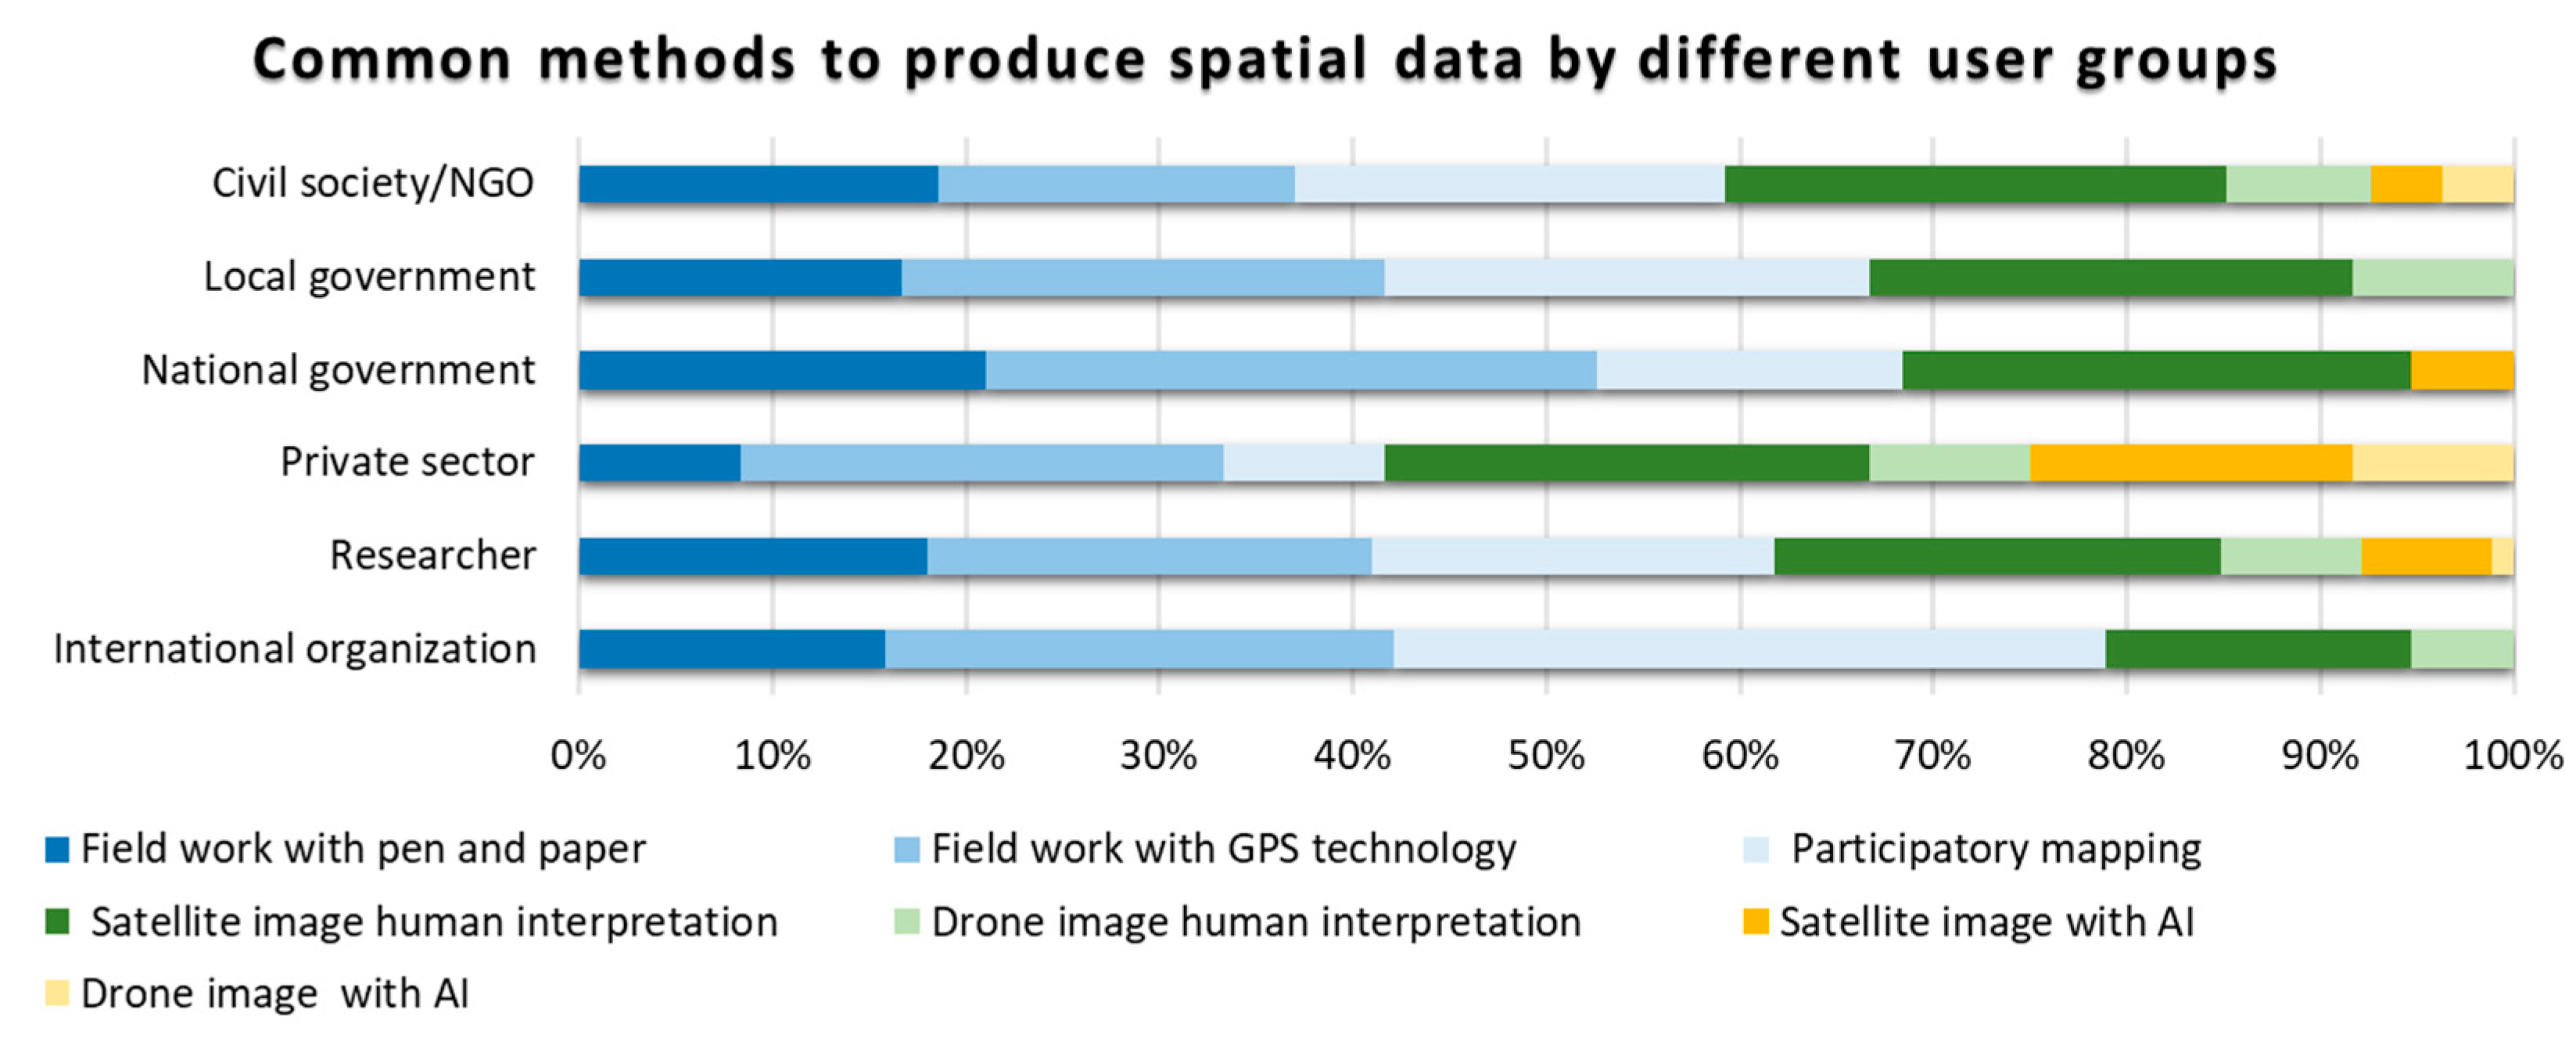
3.2.1. Type, Spatial Extent, and Update Frequency of Required Data

To address the missing data problem, EO has, in principle, much to offer in terms of large area coverage with high temporal granularity to complement detailed ground-based data. However, the user information requirements with respect to the type, spatial extent, and the spatiotemporal granularity of the deprived areas are not well understood by the EO community. The results of the online survey show that most respondents work on population, vulnerability and risk or general deprived area mapping and building footprint extraction (Figure 9). There were small differences between groups, e.g., the national/local government and private sector mostly focused on slum area mapping, while building-level information was most desired by civil society/NGOs and international organizations. Three-dimensional information needs were only stressed by local governments, civil society/NGOs, and researchers (Figure 9).
Frequent updates were required; in general, an annual update would be satisfactory (Figure 10); however, local users desired more frequent updates. The frequency of the update also relates to the scale and type of data. For example, data on land tenure might have a lower required temporal granularity as compared to data on health conditions.
In the online survey, the most desired area coverages were the neighbourhood and city scales; however, when filtering the replies for government and international organizations, there was a preference for city to national scale, and global coverage was particularly desired by international organizations (Figure 11). During the workshop at the WUF, with the greater presence of government representatives, there was a strong vote for city or urban regional spatial coverage (with almost 70%), also stressing that “slums” should not be seen as “islands within the formal city” but as an integral part of the city and that mapping the entire urban region is the most appropriate. This would also allow users to highlight deprived areas within formal/planned urban areas.

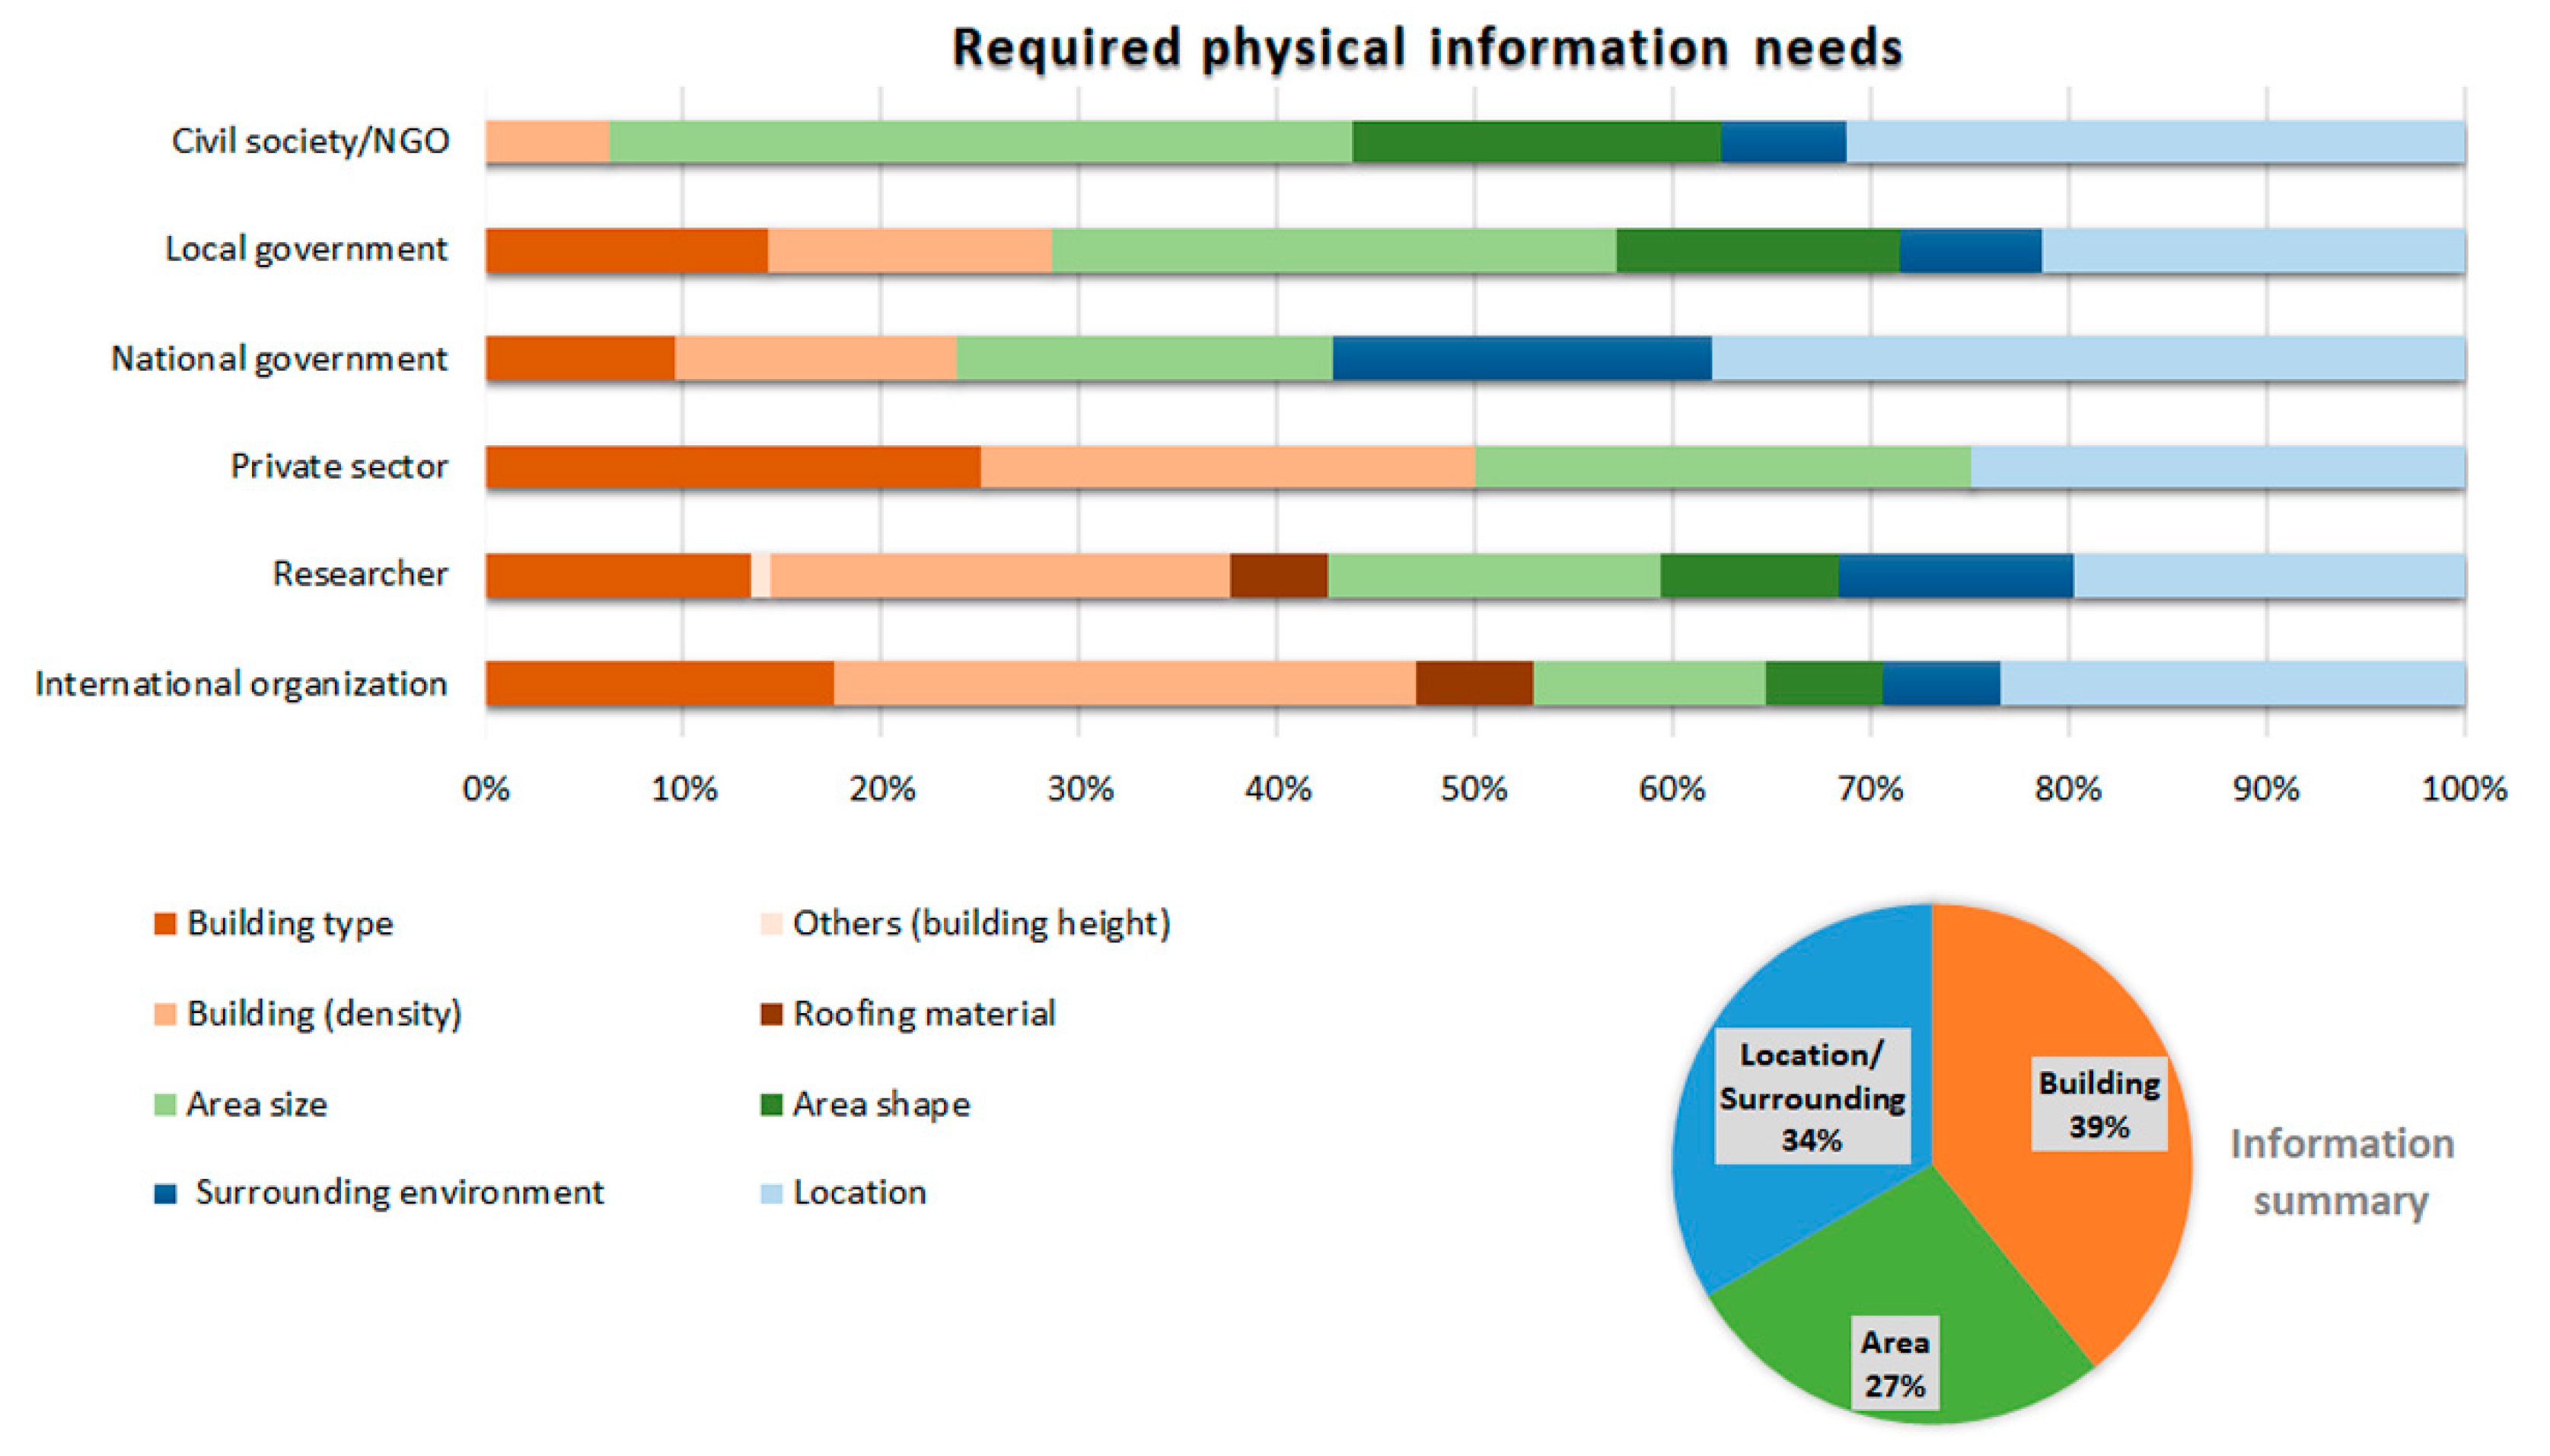
3.2.2. Characteristics of Deprived Areas Data

Beyond data on the location and extent of deprived areas, detailed data are also required for characterising such areas. Results showed that area location was very important, followed by built-up density, area size, building types, and environmental conditions (Figure 12). Interestingly, among international users, building-related information was more desired than area-related information by the local users. The surrounding and location information (i.e., the environment or neighbourhood context of areas) was most interesting to national governments, civil society/NGOs, and researchers. This is related to an interest in understanding the risks (e.g., industrial contamination) and opportunities of locations (e.g., economic opportunities).
During the workshops, participants also reported that data on services, facilities, safety (e.g., streetlights), environmental conditions, pollution (e.g., waste accumulation), health, and socioeconomic conditions were important (Figure 13). A salient point stressed throughout interactions with users, and in particular by CBOs, was the value of focusing on neighbourhood assets (e.g., cultural assets) and not only on what these areas lack. Relatedly, they emphasized the importance of understanding and providing data on the potentials of areas that are classified as deprived in terms of culture, existing (self-helped) services, socioeconomic potentials, and locational and physical assets.

3.3. Dissemination and Privacy Concerns

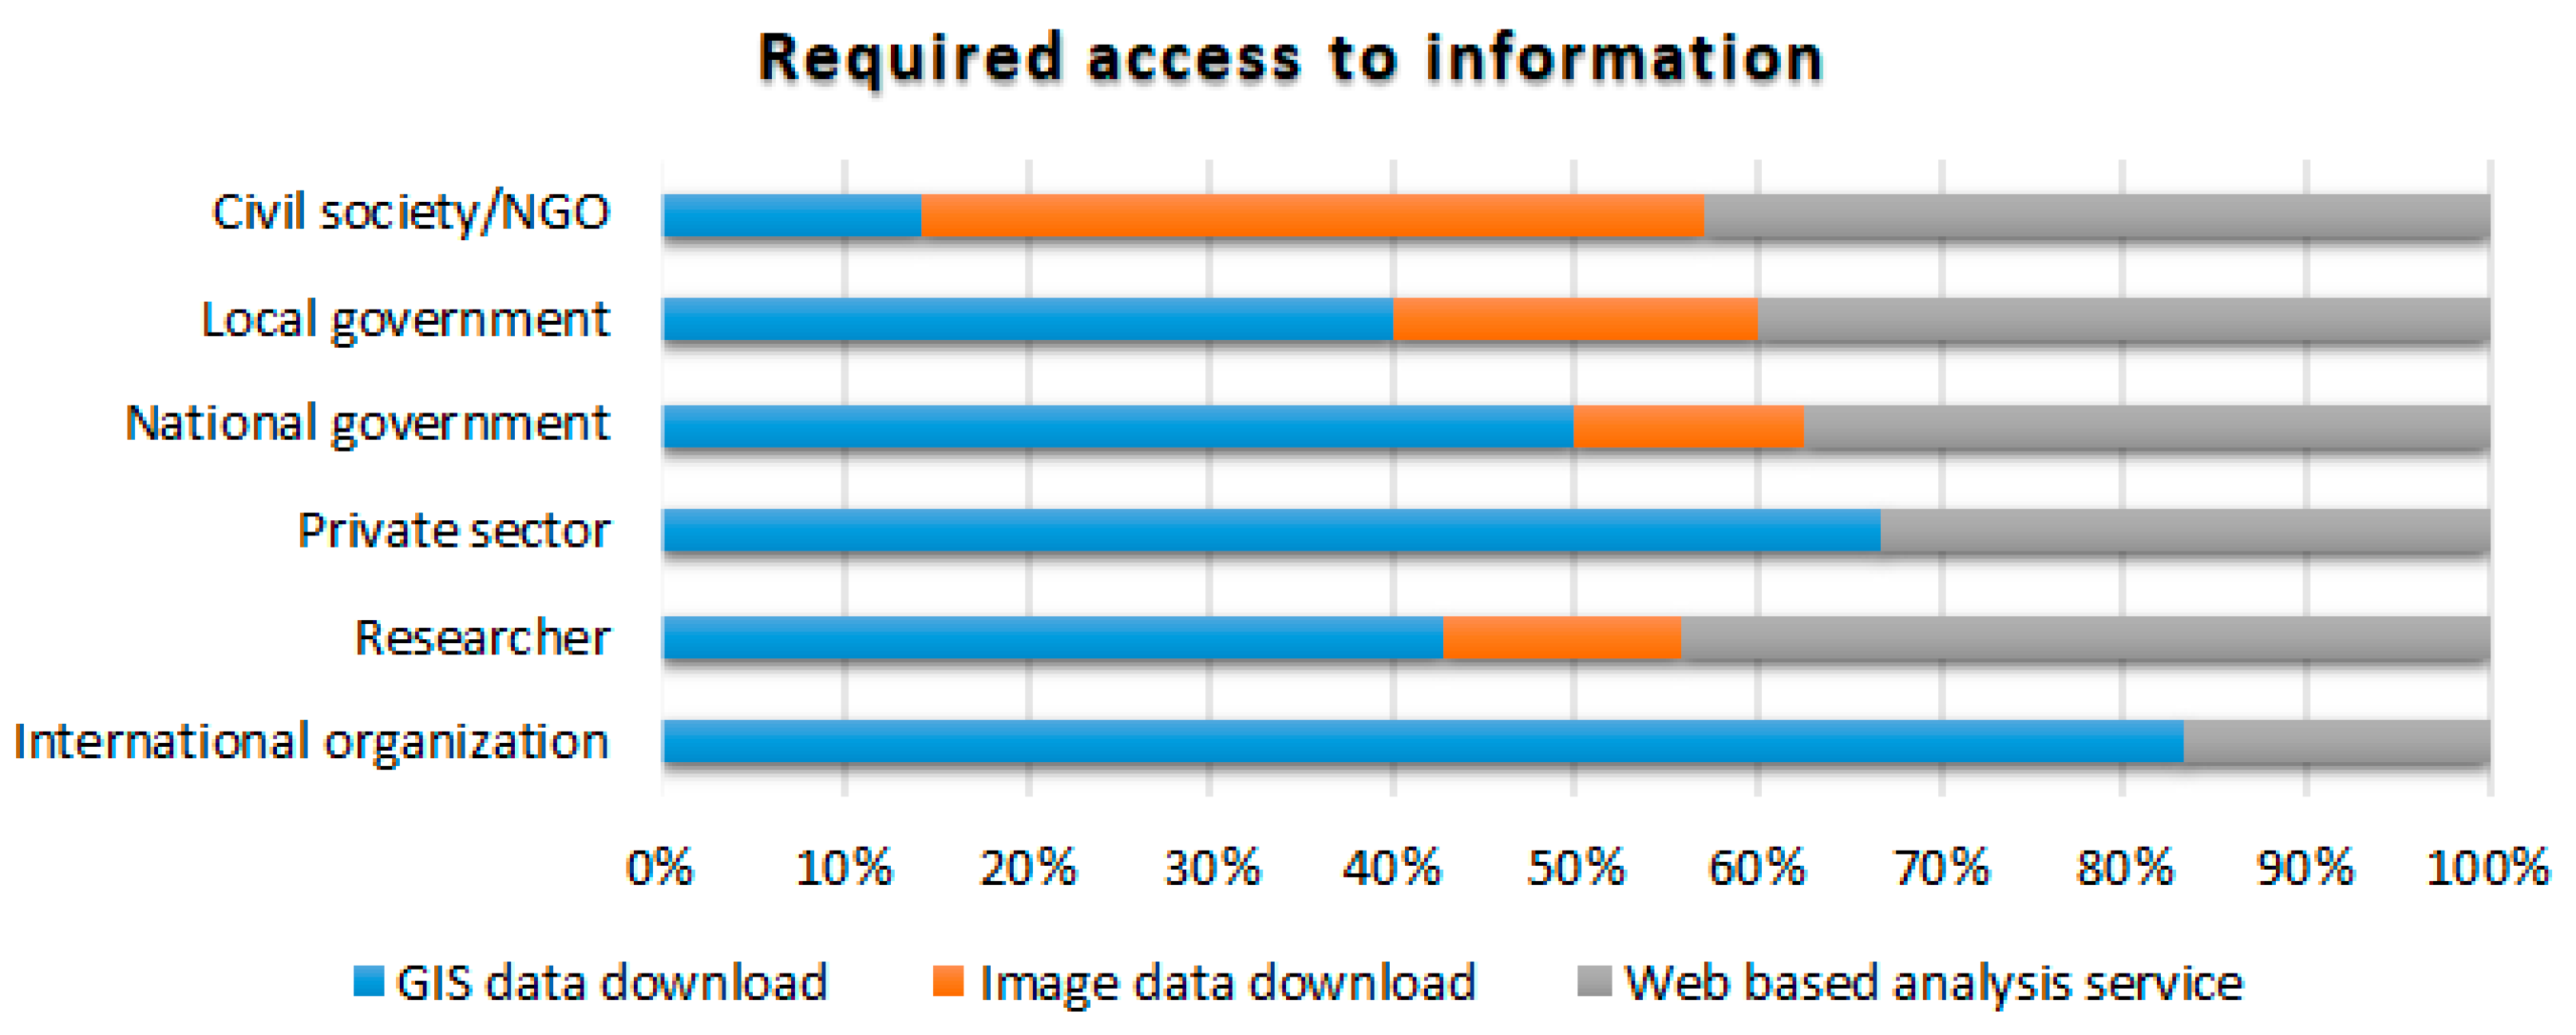
3.3.1. Suitable Ways of Disseminating Deprived Area Data

An open question to many groups is how to disseminate and share data on deprived areas, challenges related to data ownership and privacy. CBOs stressed their frustration and fatigue about data being collected from them but never being provided with the data or results, nor being able to access them (e.g., many open data repositories are not in an accessible format to them). For this reason, community groups expressed a strong preference for community-based data collection (e.g., [49]); however, many of these groups said they required more local capacities to manage data collection and the storage of data. The results of the online survey showed a preference for data access via data download, closely followed by web-based data analysis (Figure 14). Image data (i.e., access to EO data) were mainly desired by civil society/NGO, local and national governments, and researchers. This was likely because access to EO data, and particularly access to high spatial resolution EO data, is often restricted by commercial providers (copyrights) or the ability to download and process open EO data. Web-based services were desired by researchers and local users. However, local users would require easy access.
When making data on deprived areas publicly available, it is important to decide on a suitable aggregation level. EO-based deprived area maps are mostly available either as pixel-based information, which is typically very confusing for non-EO experts due to their noisy nature, or information aggregated at defined units (e.g., segments, street blocks, or grids). The question of how to make data available should account for requirements on data privacy (see the following section). An important aspect is to ensure that unnecessary details are not reported, restricting public information to what strictly supports pro-poor, evidence-based policymaking. Another essential aspect is to make data accessible to communities.
Results of the online survey showed a preference for an exact boundary, with a moderate acceptance for fuzzy boundaries or gridded formats (Figure 15). The strongest preference for an exact boundary was among national governments and private companies. However, during expert discussions, high uncertainties of exact boundaries were stressed, which also related to the conceptual uncertainties on how an area is defined (e.g., Are multi-story buildings found in many deprived areas, included in that area? Are formal areas with degrading living conditions deprived areas?). Thus, fuzzy boundaries or gridded systems (displaying probabilities) were thought to better represent the fuzzy nature of deprived areas.

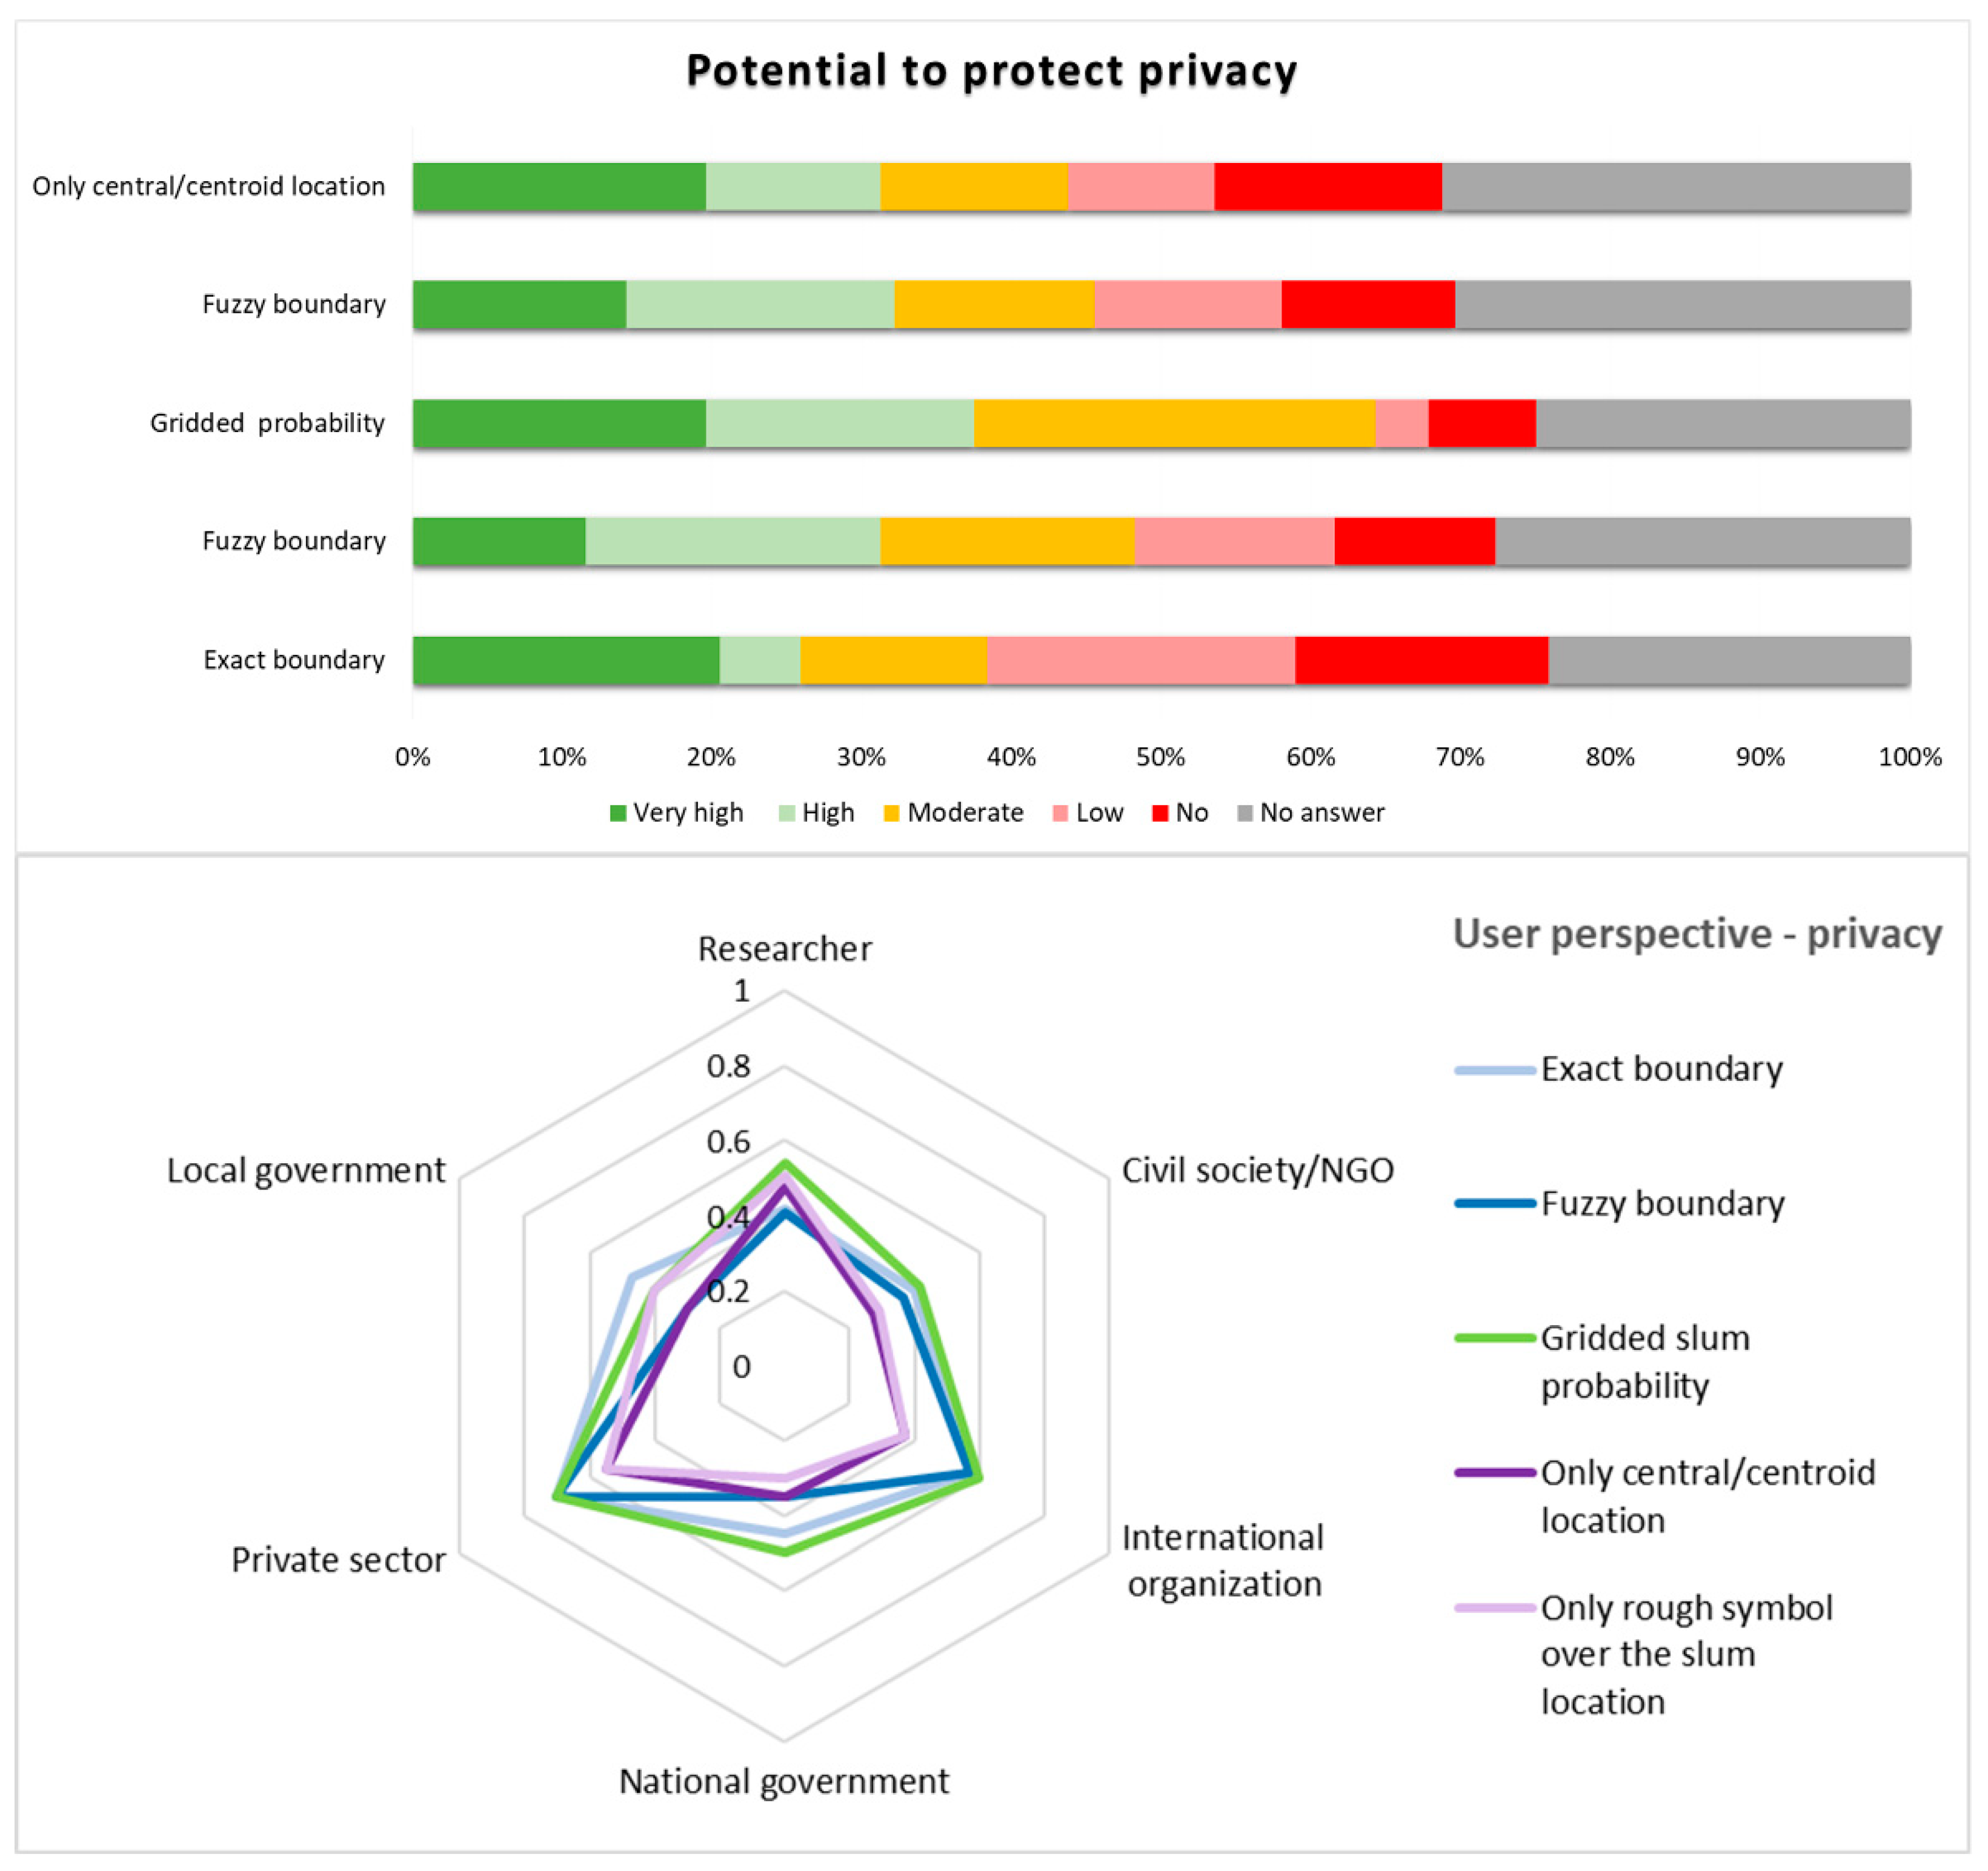
3.3.2. Data Ethics and Privacy Concerns

The results of the online survey showed a preference for gridded mapping systems when aiming to protect the privacy and avoid exposing vulnerable populations (Figure 16). Splitting the results by groups, national governments, civil society/NGO, researchers, and international organizations had a preference for the gridded system. Somewhat greater concerns about making maps of exact deprived area boundaries public were rooted in concerns about high eviction pressure in many LMIC cities. For example, in Nairobi, even during the government ban that was supposed to stop evictions and protect communities during the first COVID-19 restrictions, communities were evicted (on 4 May 2020, more than 7000 inhabitants of the Kariobangi neighborhood were dislocated). In addition, within a city, different deprived areas face different levels of eviction risk. For example, new or temporary settlements often face a higher eviction risk than older, saturated, and larger settlements, where CBOs have established good contacts with local governments. During the workshops, participants stressed that the main problem of EO-based data generation was the top-down mapping approach used, where communities were neither involved nor enabled to access the data.

4. Discussion

The first part of the discussion section summarizes the gaps identified in the user interactions, the second section outlines the key requirements of a user-centred mapping approach, and the third section provides an outlook to implications for EO-based approaches to provide user-centred information.

4.1. Identified Gaps in Spatial Information

The results of the user interactions showed that routine city/urban-region scale data on deprivation are typically missing but would be urgently required across user groups. Required data were specifically on buildings and area types to support the prioritization of actions and plan improvements. For example, building data are an important input to improve population models [50], as people living in deprived areas are the least likely to be counted and served [3,47]. In particular, CBOs stressed that spatial information is urgently required by deprived communities, their allies, and local governments to consider their needs with regard to planning and service provision. Information extracted from EO-data captures several physical characteristics related to their location, environment, and built-up structure about deprived and not-deprived urban areas that provide valuable information for urban information systems. However, such information is commonly missing. While EO data allow for frequent updates of basic physical information on deprived areas [51], available data are not easily accessible (and often not accessible at all) to local users. Furthermore, for many available data, insufficient information (e.g., in terms of metadata) is provided. Users felt that they were being left in the dark about validation and the general accuracy of data. Local users having experience with EO data stressed that it is necessary to combine these data with local data to understand the multiple aspects of deprivation, as well as to validate mapping outputs.

4.2. Understanding User Information Needs

We summarised the findings (from the user interaction) in form of a framework for the development of an open-access tool oriented towards pro-poor and science-based deprived area policymaking, into five main user’s information requirements (Figure 17). These five requirements include (1) the spatial granularity of the data, (2) the temporal granularity, (3) the geographic coverage, (4) the provision of data for characterising assets and risks, and (5) easy access to data (considering potential ethical issues). First, with respect to spatial granularity, data need to be aggregated to deal with high uncertainties and the fuzzy nature of deprived area boundaries but also to protect the privacy of communities [19]. For this purpose, a mapping system based on grids or street blocks is most suitable [27,52]. Second, high temporal granularity is crucial to respond to the high development dynamics of deprived areas. Such maps should optimally include information about physical, socioeconomic, and environmental dynamics [53]. For this purpose, updates on an almost annual basis would be optimal (1–2 years). Third, diverse geographic coverage (scale) for different user groups is desired, i.e., the geographic coverage should be adaptable to fit the requirements of different user groups. At the community level, detailed data on communities is required, but baseline information at the city level or metropolitan (urban regional) scale is also important for service provision and strategic planning. For some academic and international organizations, global data sets that cover not only the primary cities but include all types of urban areas as well as secondary and urbanizing zones are more desirable [11]. Fourth, assets and risk characterisation should be considered, as deprived areas should be seen more holistically as a part of urban areas in LMICs. For this purpose, data sets need to combine various data levels on morphology, socioeconomic characteristics, demography, land, culture, services, health, and environmental conditions [28]. This will allow for locally owned development strategies that build on local potentials and aim at the improvement of living conditions. Finally, all user groups need easy access to data and convenient usage of data for lifting the digital barriers at local and community levels. In particular, data need to be presented in multiple formats and be accessible from low or intermediate bandwidth settings. Furthermore, disseminated data should be clearly documented, locally validated first, and provided with guidelines on data ethics [19].

4.3. EO-Based Mapping in Response to User Needs

Presently, most EO studies do not respond to local users’ concerns: the developed algorithms are not understandable (due to their high technical complexity), data are not produced in a format that is easy to access (i.e., open, free, well documented, and accessible format), and the resulting maps are not well accepted, notably because training and validation, e.g., of AI-based algorithms are often performed without ground reference data. The presented framework (Figure 17) intends to guide the development of an open-access tool for science-based deprived area policymaking, driven by user information needs. In future work, it will be important to explore the combination of community-based data with free and low-cost EO data to support frequent and urban region-scale baseline information on deprived urban areas as well as the transferability of AI-based algorithms between cities. Moreover, outputs need to be accessible and understandable for local users. An example of such an effort is done by the IDEAMAPS Network [28], combining EO, open spatial data and community-based data. This combination of layers captures multiple aspects of deprivation fosters a better understanding of the different domains of deprivation (e.g., social hazards and assets), beyond the strictly physical characteristics of deprivation measured by EO data [54,55]. Furthermore, such a combination also provides local interaction and the validation of mapping outputs.

5. Conclusions

Deprived areas form a major but neglected urban type in fast urbanizing LMICs. Such areas are typically associated with poor living and housing conditions, overcrowding, and tenure insecurity and will require prioritizing investments to improve living conditions. Such prioritization necessitates reliable and up-to-date spatial information. However, our results showed that spatial information on such areas is commonly not accessible to users, in particular to local users (e.g., NGOs and CBOs). EO data and mapping products are increasingly available but not accessible to many users, because detailed commercial EO data are expensive, and EO mapping products, in general, are not delivered in an easily accessible and understandable format. To make EO data and mapping products accessible in support of science-based deprived area policymaking at different scales, it is essential to consider five main user information requirements: (1) a spatial granularity that allows for aggregated (gridded) data production, (2) an annual temporal granularity, (3) a geographic coverage at an urban regional level, (4) a balanced assets and risk characterisation, and (5) easy access to data, in particular for local users (e.g., in the form of summary reports or dashboards). Innovation is required for providing spatial information that meets requirements in terms of modelling approaches, exchange, access, and transparency to ultimately support science-based deprived area policymaking at different scales. In particular, local users (local governments, NGOs, and CBOs) should be included in the process as stakeholders.

Supplementary Materials

The following are available online at https://0-www-mdpi-com.brum.beds.ac.uk/article/10.3390/urbansci5040072/s1, Table S1: Summary Results of Online Survey–Conducted 2020-21 by SLUMAP.

Author Contributions

Conceptualization, M.K., J.W., D.R.T., and S.V.; methodology, M.K., J.W., D.R.T., and S.V.; software, J.W.; formal analysis, M.K.; data curation, J.W.; writing—original draft preparation, M.K., J.W., D.R.T., A.A., M.O., and S.V.; writing—review and editing, M.K., J.W., D.R.T., S.G., A.A., M.O., S.G., and S.V.; visualization, M.K. and J.W.; project administration, S.V.; funding acquisition, M.K. and S.G. All authors have read and agreed to the published version of the manuscript.

Funding

The research pertaining to these results received financial aid from the Belgian Federal Science Policy according to the agreement of subsidy no. (SR/11/380) (SLUMAP: http://slumap.ulb.be/ accessed on 10 June 2021), from NWO grant number VI. Veni. 194.025 and from the GCRF Digital Innovation for Development in Africa panel (EPSRC Reference: EP/T029900/1).

Institutional Review Board Statement

The study was conducted according to the guidelines of the Declaration of Helsinki, and approved by the Ethics Committee of the Faculty ITC (University of Twente, Enschede, The Netherlands (https://www.itc.nl/about-itc/organization/boards-councils/ethics-committee) on 25 May 2020.

Informed Consent Statement

Informed consent was obtained from all subjects involved in the study.

Data Availability Statement

The results of the online survey is available as Supplementary Material (https://slummap.net/index.php/take-a-survey/, accessed 23 September 2021). All data will be archived via https://easy.dans.knaw.nl, accessed 23 September 2021.

Acknowledgments

Special thanks to colleagues from the Justice & Empowerment Initiatives, Community Mappers, SDI, JRC, and UN-Habitat and all participants in surveys and workshops to share their experiences and insights.

Conflicts of Interest

The authors declare no conflict of interest. The funders had no role in the design of the study; in the collection, analyses, or interpretation of data; in the writing of the manuscript, or in the decision to publish the results.

References

  1. United Nations Statistics Division. The Sustainable Development Goals Report 2018. Available online: https://unstats.un.org/sdgs/report/2018/overview/ (accessed on 12 September 2020).
  2. UN Department of Economic and Social Affairs Population Division. World Population Prospects: The 2017 Revision; UN Department of Economic and Social Affairs Population Division: New York, NY, USA, 2017. [Google Scholar]
  3. Carr-Hill, R. Missing millions and measuring development progress. World Dev. 2013, 46, 30–44. [Google Scholar] [CrossRef]
  4. Brito, P.L.; Kuffer, M.; Koeva, M.; Pedrassoli, J.C.; Wang, J.; Costa, F.; Freitas, A.D.D. The Spatial Dimension of COVID-19: The Potential of Earth Observation Data in Support of Slum Communities with Evidence from Brazil. ISPRS Int. J. Geo-Inf. 2020, 9, 557. [Google Scholar] [CrossRef]
  5. Corburn, J.; Vlahov, D.; Mberu, B.; Riley, L.; Caiaffa, W.T.; Rashid, S.F.; Ko, A.; Patel, S.; Jukur, S.; Martínez-Herrera, E.; et al. Slum Health: Arresting COVID-19 and Improving Well-Being in Urban Informal Settlements. J. Urban Health 2020, 97, 348–357. [Google Scholar] [CrossRef] [Green Version]
  6. Smit, W. The challenge of COVID-19 in African cities: An urgent call for informal settlement upgrading. Cities Health 2020, 1–3. [Google Scholar] [CrossRef]
  7. Roy, D.; Bernal, D.; Lees, M. An exploratory factor analysis model for slum severity index in Mexico City. Urban Stud. 2020, 57, 789–805. [Google Scholar] [CrossRef] [Green Version]
  8. Kohli, D.; Sliuzas, R.V.; Kerle, N.; Stein, A. An ontology of slums for image-based classification. Comput. Environ. Urban Syst. 2012, 36, 154–163. [Google Scholar] [CrossRef]
  9. Williams, T.K.A.; Wei, T.; Zhu, X. Mapping Urban Slum Settlements Using Very High-Resolution Imagery and Land Boundary Data. IEEE J. Sel. Top. Appl. Earth Obs. Remote Sens. 2020, 13, 166–177. [Google Scholar] [CrossRef]
  10. Wurm, M.; Stark, T.; Zhu, X.X.; Weigand, M.; Taubenböck, H. Semantic segmentation of slums in satellite images using transfer learning on fully convolutional neural networks. ISPRS J. Photogramm. Remote Sens. 2019, 150, 59–69. [Google Scholar] [CrossRef]
  11. Zhu, Z.; Zhou, Y.; Seto, K.C.; Stokes, E.C.; Deng, C.; Pickett, S.T.A.; Taubenböck, H. Understanding an urbanizing planet: Strategic directions for remote sensing. Remote Sens. Environ. 2019, 228, 164–182. [Google Scholar] [CrossRef]
  12. SDI. Know Your City: Slum Dwellers Count. Available online: https://sdinet.org/2018/02/know-city-slum-dwellers-count/ (accessed on 23 September 2020).
  13. Gruebner, O.; Sachs, J.; Nockert, A.; Frings, M.; Khan, M.H.; Lakes, T.; Hostert, P. Mapping the slums of Dhaka from 2006 to 2010. Dataset Pap. Sci. 2014, 2014, 1–7. [Google Scholar] [CrossRef] [Green Version]
  14. Falco, E.; Zambrano-Verratti, J.; Kleinhans, R. Web-based participatory mapping in informal settlements: The slums of Caracas, Venezuela. Habitat Int. 2019, 94, 102038. [Google Scholar] [CrossRef]
  15. Kit, O.; Lüdeke, M. Automated detection of slum area change in Hyderabad, India using multitemporal satellite imagery. ISPRS J. Photogramm. Remote Sens. 2013, 83, 130–137. [Google Scholar]
  16. Mahabir, R.; Agouris, P.; Stefanidis, A.; Croitoru, A.; Crooks, A.T. Detecting and mapping slums using open data: A case study in Kenya. Int. J. Digit. Earth 2018, 13, 683–707. [Google Scholar] [CrossRef]
  17. Chi, G.; Fang, H.; Chatterjee, S.; Blumenstock, J.E. Micro-Estimates of Wealth for all Low-and Middle-Income Countries. arXiv 2021, arXiv:abs/2104.07761. [Google Scholar]
  18. University of Chicago. Million Neighborhoods Initiative. Available online: https://millionneighborhoods.org/ (accessed on 3 January 2020).
  19. Kuffer, M.; Wang, J.; Nagenborg, M.; Pfeffer, K.; Kohli, D.; Sliuzas, R.; Persello, C. The Scope of Earth-Observation to Improve the Consistency of the SDG Slum Indicator. ISPRS Int. J. Geo-Inf. 2018, 7, 428. [Google Scholar] [CrossRef] [Green Version]
  20. Wurm, M.; Taubenböck, H. Detecting social groups from space—Assessment of remote sensing-based mapped morphological slums using income data. Remote Sens. Lett. 2018, 9, 41–50. [Google Scholar] [CrossRef]
  21. Duque, J.C.; Patino, J.E.; Betancourt, A. Exploring the Potential of Machine Learning for Automatic Slum Identification from VHR Imagery. Remote Sens. 2017, 9, 895. [Google Scholar] [CrossRef] [Green Version]
  22. Taubenböck, H.; Kraff, N.J.; Wurm, M. The morphology of the arrival city—A global categorization based on literature surveys and remotely sensed data. Appl. Geogr. 2018, 92, 150–167. [Google Scholar] [CrossRef]
  23. Persello, C.; Stein, A. Deep Fully Convolutional Networks for the Detection of Informal Settlements in VHR Images. IEEE Geosci. Remote Sens. Lett. 2017, 14, 2325–2329. [Google Scholar] [CrossRef]
  24. Kuffer, M.; Pfeffer, K.; Sliuzas, R. Slums from space—15 years of slum mapping using remote sensing. Remote Sens. 2016, 8, 455. [Google Scholar] [CrossRef] [Green Version]
  25. Engstrom, R.; Sandborn, A.; Yu, Q.; Burgdorfer, J.; Stow, D.A.; Weeks, J.; Graesser, J. Mapping slums using spatial features in Accra, Ghana. In Joint Urban Remote Sensing Event (JURSE); IEEE: Lausanne, Switzerland, 2015; pp. 1–4. [Google Scholar]
  26. Verma, D.; Jana, A.; Ramamritham, K. Transfer learning approach to map urban slums using high and medium resolution satellite imagery. Habitat Int. 2019, 88, 101981. [Google Scholar] [CrossRef]
  27. Kuffer, M.; Thomson, D.R.; Boo, G.; Mahabir, R.; Grippa, T.; Vanhuysse, S.; Engstrom, R.; Ndugwa, R.; Makau, J.; Darin, E.; et al. The Role of Earth Observation in an Integrated Deprived Area Mapping “System” for Low-to-Middle Income Countries. Remote Sens. 2020, 12, 982. [Google Scholar] [CrossRef] [Green Version]
  28. Thomson, D.R.; Kuffer, M.; Boo, G.; Hati, B.; Grippa, T.; Elsey, H.; Linard, C.; Mahabir, R.; Kyobutungi, C.; Maviti, J.; et al. Need for an Integrated Deprived Area “Slum” Mapping System (IDEAMAPS) in Low-and Middle-Income Countries (LMICs). Soc. Sci. 2020, 9, 80. [Google Scholar] [CrossRef]
  29. de Albuquerque, J.P.; Yeboah, G.; Pitidis, V.; Ulbrich, P. In Towards a participatory methodology for community data generation to analyse urban health inequalities: A multi-country case study. In Proceedings of the 52nd Hawaii International Conference on System Sciences, Grand Wailea, HI, USA, 8–11 January 2019; pp. 3925–3926. [Google Scholar]
  30. Ezeh, A.; Oyebode, O.; Satterthwaite, D.; Chen, Y.-F.; Ndugwa, R.; Sartori, J.; Mberu, B.; Melendez-Torres, G.J.; Haregu, T.; Watson, S.I.; et al. The history, geography, and sociology of slums and the health problems of people who live in slums. Lancet 2017, 389, 547–558. [Google Scholar] [CrossRef]
  31. Lilford, R.J.; Oyebode, O.; Satterthwaite, D.; Melendez-Torres, G.J.; Chen, Y.-F.; Mberu, B.; Watson, S.I.; Sartori, J.; Ndugwa, R.; Caiaffa, W.; et al. Improving the health and welfare of people who live in slums. Lancet 2017, 389, 559–570. [Google Scholar] [CrossRef]
  32. Wardrop, N.A.; Jochem, W.C.; Bird, T.J.; Chamberlain, H.R.; Clarke, D.; Kerr, D.; Bengtsson, L.; Juran, S.; Seaman, V.; Tatem, A.J. Spatially disaggregated population estimates in the absence of national population and housing census data. Proc. Natl. Acad. Sci. USA 2018, 115, 3529. [Google Scholar] [CrossRef] [PubMed] [Green Version]
  33. Wang, S.; So, E.; Smith, P. Detecting tents to estimate the displaced populations for post-disaster relief using high resolution satellite imagery. Int. J. Appl. Earth Obs. Geoinf. 2015, 36, 87–93. [Google Scholar] [CrossRef]
  34. de Sherbinin, A.; Bukvic, A.; Rohat, G.; Gall, M.; McCusker, B.; Preston, B.; Apotsos, A.; Fish, C.; Kienberger, S.; Muhonda, P.; et al. Climate vulnerability mapping: A systematic review and future prospects. WIREs Clim. Chang. 2019, 10, e600. [Google Scholar] [CrossRef]
  35. Abras, C.; Maloney-Krichmar, D.; Preece, J. User-centered design. Bainbridge, W. Encyclopedia of Human-Computer Interaction. Thousand Oaks Sage Publ. 2004, 37, 445–456. [Google Scholar]
  36. Hewitt, R.J.; Macleod, C.J.A. What Do Users Really Need? Participatory Development of Decision Support Tools for Environmental Management Based on Outcomes. Environments 2017, 4, 88. [Google Scholar] [CrossRef] [Green Version]
  37. Wong, K.; Ellul, C. User requirements gathering for 3D geographic information in the United Kingdom. ISPRS Ann. Photogramm. Remote Sens. Spat. Inf. Sci. 2017, 4, 125–132. [Google Scholar] [CrossRef] [Green Version]
  38. Whitworth, A. (Ed.) Towards a Spatial Social Policy. In Bridging the Gap between Geography and Social Policy, 1st ed.; Bristol University Press: Bristol, UK, 2019. [Google Scholar]
  39. Soman, S.; Beukes, A.; Nederhood, C.; Marchio, N.; Bettencourt, L.M.A. Worldwide Detection of Informal Settlements via Topological Analysis of Crowdsourced Digital Maps. ISPRS Int. J. Geo-Inf. 2020, 9, 685. [Google Scholar] [CrossRef]
  40. Novack, T.; Kux, H.; Feitosa, R.Q.; Costa, G.A.O.P. A knowledge-based, transferable approach for block-based urban land-use classification. Int. J. Remote Sens. 2014, 35, 4739–4757. [Google Scholar] [CrossRef]
  41. Brhel, M.; Meth, H.; Maedche, A.; Werder, K. Exploring principles of user-centered agile software development: A literature review. Inf. Softw. Technol. 2015, 61, 163–181. [Google Scholar] [CrossRef]
  42. Brito, P.L. Community Mapping Online Event 2021. Federal University of Bahia, Brazil. 2021. Available online: https://www.youtube.com/playlist?list=PL63qkxAMZRh-PyM64b64QqeiQKlSQbJ_69Br (accessed on 1 June 2021).
  43. Kawulich, B.B. Participant observation as a data collection method. Forum Qual. Soz. Forum Qual. Soc. Res. 2005, 6, 43. [Google Scholar]
  44. Quiroz Canlas, F.; Nair, S.; Doss, A.N. Mentimeter App in Computer Science Courses: Integration Model and Students’ Reception. In Proceedings of the 2020 12th International Conference on Education Technology and Computers, London, UK, 23–26 October 2020; Association for Computing Machinery: New York, NY, USA, 2020; pp. 1–5. [Google Scholar]
  45. UN-Habitat. Slums Almanac 2015-16. Tracking Improvement in the Lives of Slum Dwellers; UN-Habitat: Nairobi, Kenya, 2016. [Google Scholar]
  46. IdeaMapsNetwork. COVID-19 in African Cities: Impacts, Responses and Policies Recommendations. Available online: https://ideamapsnetwork.org/covid-19-in-african-cities-impacts-responses-and-policies-recommendations/ (accessed on 15 November 2020).
  47. Justice & Empowerment Initiatives—Nigeria (JEI). Impact of Covid19 on Lagos Informal Settlements & Vulnerable Urban Poor Populations; Lagos, Nigeria. Available online: https://static1.squarespace.com/static/535d0435e4b0586b1fc64b54/t/5ee9db41f7dd700403e136f3/1592384435834/C19+Survey+Lagos+Findings+Report+%28June+2020%29_FINAL.pdf (accessed on 15 November 2020).
  48. IdeaMapsNetwork. Community Mappers Identify and Respond to Needs in Informal Settlements during COVID-19. Available online: https://ideamapsnetwork.org/community-mappers-survey-informal-settlements-during-covid-19/ (accessed on 15 November 2020).
  49. Wanjiru, N. Community Voices #1: Waste Management Solutions; Vice Versa. Available online: https://viceversaonline.nl/2021/09/10/community-voices-1-waste-management-solutions/ (accessed on 10 September 2021).
  50. Leyk, S.; Gaughan, A.E.; Adamo, S.B.; de Sherbinin, A.; Balk, D.; Freire, S.; Rose, A.; Stevens, F.R.; Blankespoor, B.; Frye, C.; et al. The spatial allocation of population: A review of large-scale gridded population data products and their fitness for use. Earth Syst. Sci. Data 2019, 11, 1385–1409. [Google Scholar] [CrossRef] [Green Version]
  51. Badmos, O.S.; Rienow, A.; Callo-Concha, D.; Greve, K.; Jürgens, C. Simulating slum growth in Lagos: An integration of rule based and empirical based model. Comput. Environ. Urban Syst. 2019, 77, 101369. [Google Scholar] [CrossRef]
  52. Grippa, T.; Georganos, S.; Zarougui, S.; Bognounou, P.; Diboulo, E.; Forget, Y.; Lennert, M.; Vanhuysse, S.; Mboga, N.; Wolff, E. Mapping Urban Land Use at Street Block Level Using OpenStreetMap, Remote Sensing Data, and Spatial Metrics. ISPRS Int. J. Geo-Inf. 2018, 7, 246. [Google Scholar] [CrossRef] [Green Version]
  53. Dubovyk, O.; Sliuzas, R.; Flacke, J. Spatio-temporal modelling of informal settlement development in Sancaktepe district, Istanbul, Turkey. ISPRS J. Photogramm. Remote Sens. 2011, 66, 235–246. [Google Scholar] [CrossRef]
  54. Arribas-Bel, D.; Patino, J.E.; Duque, J.C. Remote sensing-based measurement of living environment deprivation: Improving classical approaches with machine learning. PLoS ONE 2017, 12, e0176684. [Google Scholar]
  55. Baud, I.; Sridharan, N.; Pfeffer, K. Mapping urban poverty for local governance in an Indian mega-city: The case of Delhi. Urban Stud. 2008, 45, 1385–1412. [Google Scholar] [CrossRef]
Figure 1. Left: Satellite image of an urban setting, with a deprived area (South) and a planned area (North); Source: Google Earth image showing part of Kibera slum. Right: Ground photos within deprived areas in Nairobi (Source: Angela Abascal).
Urbansci 05 00072 g001
Figure 2. Gridded mapping frame to aggregate deprived areas, the example is showing Kibera slum in Nairobi (displayed on top of a PlanetScope image).
Urbansci 05 00072 g002
Figure 3. Assessing users’ information needs on deprived urban areas (Q1–3 refer to key questions detailed out in the section below).
Urbansci 05 00072 g003
Figure 4. Geographic coverage (users working with deprived areas data) (left) and geographic distribution of online survey respondents in percentage (right).
Urbansci 05 00072 g004
Figure 5. Professional groups of participants during a workshop at the World Urban Forum in Abu Dhabi (February 2020).
Urbansci 05 00072 g005
Figure 6. Results of the online expert survey, problems of deprived areas data encountered (N = 112).
Urbansci 05 00072 g006
Figure 7. Results of the online expert survey, methods of deprived areas data collection (N = 112).
Urbansci 05 00072 g007
Figure 8. Word cloud of participants of several workshops (using Mentimeter) asking for reasons why deprived area related data are needed.
Urbansci 05 00072 g008
Figure 9. Results of online expert survey on the focus of work concerning deprived areas related data (multiple answers).
Urbansci 05 00072 g009
Figure 10. Results of online expert survey on the required temporal granularity of maps on deprived areas (in %) (N = 112).
Urbansci 05 00072 g010
Figure 11. Results of the online expert survey on the required spatial coverage of deprived areas data (in %) (N = 112).
Urbansci 05 00072 g011
Figure 12. Results of the online expert survey on the required physical deprived areas characteristics (multiple answers).
Urbansci 05 00072 g012
Figure 13. Word cloud of interaction with participants of WUF workshop (using Mentimeter) local data (characteristics) of deprived area information requirements by users.
Urbansci 05 00072 g013
Figure 14. Results of the online expert survey, desired method of access to deprived area data (multiple answers).
Urbansci 05 00072 g014
Figure 15. Suitable aggregation levels (upper), results of the online expert survey on the acceptable aggregation level of deprived area data (in %) (N = 112) (middle), user group preference scores of aggregation levels (1 = high preference and 0 = no preference) (lower).
Urbansci 05 00072 g015
Figure 16. Results of the online expert survey, potential of data aggregation to protect privacy (in %) (N = 112) (upper), user group preference scores of aggregation levels (1 = high preference and 0 = no preference) (lower).
Urbansci 05 00072 g016
Figure 17. Summary of user information requirements on deprived urban areas.
Urbansci 05 00072 g017
Table 1. Existing open datasets that provide the location and characteristics of deprived urban areas.
Open PlatformAuthor/InstitutionGeographic Coverage (GC)GC NameYearUpdatedReferenced WorkSourcePixel Size
km
Spatial DataData DescriptionOther DataOther Data
Description
Links
Mapping Urban InformalityJess Kersey / UC BerkleyCity scaleDhaka2006, 2010NoGruebner et al. [13]EO and CensusNAgeojsonSlum Boundary1 indicator *1*1: ward name; *2: population and administrative data; *3: administrative data; *4: data on health, facilities, infrastructure etc.; *5: location, type and description of faclitiesLinks: Mapping Urban Informality: http://www.mappingurbaninformality.com/; RWI: https://data.humdata.org/dataset/relative-wealth-index; Mapillary: https://www.mapillary.com/, 23 September 2021; HOT: https://data.humdata.org/organization/hot; https://data.unhabitat.org/pages/slum-data-surveys, 23 September 2021
City scaleCaracas2019NoFalco et al. [14]SurveyNAgeojsonSlum Boundary12 indicators *2
City scaleRio de Janeiro20142019Instituto Pereira PassosCensusNAgeojsonSlum Boundary18 indicators *3
City scaleMumbai2017NoMunicipality Mumbai planningCensus AND SurveyNAgeojsonSlum BoundaryYes
City scaleHyderabad2014NoKit & Lüdeke [15]EO0.6geojsonSlum BoundaryNo
City scaleBuenos Aires2018NoDymaxion LabsEONAgeojsonSlum BoundaryNo
City scaleGuatemala2018NoDymaxion LabsEONAgeojsonSlum BoundaryNo
City scaleTegucigalpa2018NoDymaxion LabsEONAgeojsonSlum BoundaryNo
City scaleAsunción2018NoDymaxion LabsEONAgeojsonSlum BoundaryNo
City scaleLima2019NoDymaxion LabsEONAgeojsonSlum BoundaryNo
City scaleMontevideo2018NoDymaxion LabsEONAgeojsonSlum BoundaryNo
City scaleNairobi2018NoMahabir et al. [16]EONAgeojsonSlum BoundaryNo
City scaleMombasa2018NoMahabir et al. [16]EONAgeojsonSlum BoundaryNo
City scalePort-au-Prince2020NoJess KerseyNANAgeojsonSlum BoundaryNo
The relative
wealth Index
(RWI)
UC Berkeley Center and Facebook’s Data for GoodWorldwide92 LMIC Countries2021NoChi et al. [17]EO and topographic maps and mobile network and connectivity data2.4csvRWI griddedNo
MapillaryMapillaryWorldwideAll Countries2013Up-to-dateNoStreet View ImagesNAjpgNANo
Humanitarian
Open Street Map
(HOT)
Humanitarian Open Street MapsWorldwide246 Countries2013Up-to-dateNoHumanitarian community mappingNACsv
Shp
Garmin IMG
Geopackage
KML
polygons36 tags *4
Informal settlements’ vulnerability mappingUN-HabitatKenya city/settlement scaleKisumu and 3 settlements in Nairobi2020NoUN-HabitatSurveyNAshp
KML
Xls
Geodatabase
pointsFacility types *5
Footer: *1: ward name; *2: population and administrative data; *3: administrative data; *4: data on health, facilities, infrastructure etc.; *5: location, type and description of facilities.
Publisher’s Note: MDPI stays neutral with regard to jurisdictional claims in published maps and institutional affiliations.

