Article

Correlations between Spatial Attributes and Visitor Stay in Chinese Gardens: A Case Study of the Ningbo Tianyige Museum Gardens

1
Laboratory of Architectural and Urban Ergonomics, Division of Global Architecture, Graduate School of Engineering, Osaka University, Suita 565-0871, Japan
2
Institution of Architectural History & Theory, School of Architecture, Tianjin University, Tianjin 300072, China
*
Author to whom correspondence should be addressed.
Submission received: 25 August 2021 / Revised: 18 September 2021 / Accepted: 23 September 2021 / Published: 1 October 2021

Abstract

:
Despite the growing popularity of Chinese gardens, few studies have explored Chinese garden tourism and the relationship between garden space and visitor behavior. Addressing this gap, this study examines the correlations between spatial attributes and visitor stay distribution in the Ningbo Tianyige Museum gardens. This study divided the garden space into twenty units across four types—water, architecture, veranda, and rockery—and identified spatial attributes using measurements and configurational calculations. Visitor stay data was comprised of 1061 cases with a stay interval of more than 30 s in three investigation periods. Results produced three primary findings. First, architecture and water spaces had the highest visitor stay density, followed by veranda space and then rockery space. Second, there is a correlation between visitor stay density and six spatial attributes: integration, choice, width, length, enclosure ratio, and seating. Third, although each type has distinctive attributes, they can be divided into two groups: (1) spacious and highly accessible open spaces (water and architecture types); (2) long narrow spaces with low accessibility and abundant seating facilities (veranda and rockery types). By exploring the relationship between Chinese gardens and modern tourism, this study provides valuable insights and suggestions for the planning and management of Chinese garden tourism.

1. Introduction

1.1. Background

There is a long tradition of visiting gardens in China. In ancient times, Chinese gardens satisfied people’s desire for natural landscapes while serving various recreational and spiritual functions. While imperial and private gardens were built to entertain the elite [1], temple gardens [2] and suburban landscape gardens [3] were easily accessible by the public. However, following the Taiping Rebellion in the mid-nineteenth century, many traditional Chinese gardens gradually declined and fell into disrepair [4]. Scholars began mapping and documenting existing gardens from the first half of the twentieth century [5,6,7,8]. These gardens were gradually restored and opened to the public since the foundation of the People’s Republic of China in 1949. Contemporary practices of Chinese gardens, such as people’s parks, began flourishing with the nationwide greening movement from 1956 [9,10,11] and the design of many public and cultural buildings incorporated elements and features of Chinese gardens [12,13,14]. With the flourishing garden culture, Chinese gardens regained their popularity, recently emerging as a significant feature of Chinese tourism and urban life.

1.2. Literature Review

Traditional Chinese gardens now face the dual challenge of opening to the public while protecting and conserving the garden and its history. In the realm of heritage conservation, some studies on Chinese gardens have traced the historical development of gardens and evaluated their current conservation status [15,16,17]. Studies on world garden heritage have also paid attention to the development and utilization of garden heritage, such as contemporary landscape and public space design [18,19,20]. Research on visiting gardens, parks, and green spaces can be divided into two categories: visitor experience or preference, and visitor behavior.
Chinese gardens offer a unique concept of the garden experience [21]. The final chapter of Yuan Ye—the seventeenth-century treatise on Chinese garden design—which deals with “borrowed scenery,” provides the best description of visiting a Chinese garden in great detail with imaginative and poetic language [22,23]. Modern scholars like Tong Jun and Chen Congzhou have examined various aspects of the garden experience. Tong emphasized the importance of the garden owner’s taste [5], and Chen juxtaposed the song lyrics with garden photography [24,25]. More broadly, research on garden experiences has examined a variety of factors, including visual [26,27], auditory [28], walking and sensory [29,30], literary and associative [31], and other physiological and psychological responses [32]. Some studies have also examined experiences in Japanese gardens [33,34]. Recently, space syntax theory has been applied in the analysis of complex configurations of garden space and experience [30,35,36,37].
Research on visitor preference has been widely applied to evaluate landscapes, parks, and green spaces. Research on visual preference includes landscapes and spatial elements [38,39], as well as the aesthetic preferences [40] and the physiological and psychological responses of participants [41,42]. Scholars have also examined preferences for types of vegetation [43,44] and trees [45,46] in urban parks and green spaces.
Research on visitor behavior in gardens and urban parks can be classified according to the research purpose, namely, visitor study and environmental behavior study. Visitor study focuses on recording and analyzing visitor behavior to understand and capture the psychological activities and visiting habits of visitors to, in turn, improve the spatial composition, display layout, and tour route design. Quantitative visitor studies have employed timing and tracking methods [47], as well as automated sensor-based positioning and tracking methods [48]. Visitor behavior studies have investigated a variety of factors, including viewing [49], stopping [50], walking [51], photographing [52,53], facial expressions [54], and external influence factors [55]. Meanwhile, environmental behavior study mainly deals with human behaviors, psychological motivations, and environmental influencing factors in a particular environment to improve environmental and behavioral design [56]. Several scholars have investigated the use of public spaces in cities [57,58,59], while others have explored visitor distribution and utilization in forests and urban parks [60,61,62]. Researchers have also identified the correlations between visitor behavior and environmental factors [63,64], as well as the behaviors of certain groups, such as the elderly [65,66] and low-income groups [67].
Current studies on Chinese gardens have primarily focused on tracing their historical development, as well as the spatial composition and artistic conceptions of gardens. However, few studies have explored the utilization of Chinese gardens as public spaces for tourism and recreation [68,69,70]. Moreover, as urban parks and green spaces become more popular for recreation [71,72], Chinese gardens may become the preferred spaces of traditional Chinese society [18]. This preference has triggered the burgeoning development of Chinese garden research and construction practices, underscoring the value of this study.

1.3. Research Aim and Objective

The overall aim of the study was to identify the openness of the garden space in Ningbo Tianyige Museum and its attractiveness to visitors. The openness of garden space primarily depends on spatial attributes, such as dimension, form, scale, accessibility, visibility, functions, and facilities, and it can be assessed based on the way in which visitors utilize the garden space [20]. The analyses focused on the following three research problems:
  • What are the spatial characteristics of Tianyige Museum gardens with different spatial types?
  • How are the visitor stays distributed in the Tianyige Museum gardens?
  • Which spatial attributes have an impact on the visitor stay preferences?
Therefore, the main objectives of this study were to (1) analyze the spatial elements and composition of Tianyige Museum gardens; (2) quantitatively analyze the distribution characteristics of visitor stay; and (3) examine the correlations between spatial attributes and visitor stay distribution. By exploring the new relationship between Chinese gardens and modern tourism, this study provides useful insights and suggestions for the planning and management of Chinese garden tourism. The findings of this study may also contribute to the utilization and development of both Chinese and East Asian gardens.

1.4. Research Structure

This paper is structured in five sections. Following this Section 1 introduction, Section 2 introduces the study area, identifies the spatial attributes based on measurements and configurational calculations, and defines the methodology of the study, including the data collection and data analysis methods. Section 3 presents the investigation results of visitor stay distribution and the analyses of correlations between spatial attributes and visitor stay distribution in detail. Section 4 concludes the main findings and discusses the spatial characteristics of the Tianyige Museum gardens and influencing factors on visitor stay. Finally, the conclusions, suggestions, limitations and future research are presented in Section 5 (Figure 1).

2. Materials and Methods

2.1. Study Area: Ningbo Tianyige Museum Gardens

Tianyige Museum is located in Ningbo, Zhengjiang, China (Figure 2a–c). Featuring the renowned Tianyige (Tianyi Pavilion), Tianyige Museum is dedicated to the art of book collecting and occupies an area of 34,000 m2. Originally built as the private library of Fan Qin during the Ming Dynasty (1368–1644), Tianyige is now the oldest private library in China.
Figure 3 presents the site plan of Tianyige Museum. The northern part of the museum is home to the former residence of the Fan family, the Tianyige group, and the new library; the central part of the museum contains the East Garden and the South Garden; while the southern part of the museum contains the Chen Ancestral Hall, the Qin Ancestral Hall, and the Painting and Calligraphy Gallery. The garden area of the Tianyige Museum (hereinafter, Tianyige garden), which comprises both the East and South Garden, constitutes the research objects of this study. Although originally restored in 1959, the East Garden was redesigned several times and finally reconstructed between 1983 and 1986 under the supervision of designer Chen Congzhou [73]. The South Garden was built west of East Garden in 1996, and it was designed as a courtyard with the ancient libraries of the Shuibei Pavilion and Baojing Hall relocated to South Garden for protection [74].
Chen Congzhou, the designer of East Garden, is a famous twentieth-century Chinese architecture and garden scholar [75,76]. Chen Congzhou began studying Chinese gardens in the 1950s and subsequently participated in the restoration of traditional gardens of Suzhou, Yangzhou, and Shanghai in Southeast China. Over the next several decades, he devoted himself to the investigation, research, restoration, and construction of Chinese gardens. Among his garden practices, the most famous are the restoration of Yu Garden in Shanghai, the design of Nan Garden in Kunming, and the reconstruction of Shuihui Garden (Water Painting Garden) in Rugao, Jiangsu. Chen Congzhou had visited Tianyige Museum many times, and the East Garden was built under his careful guidance and supervision from 1983 to 1986 (Figure 4). However, compared with his other garden practices, there are relatively few studies on the East Garden.
Several factors influenced the selection of Tianyige garden as this study’s research object. First, Tianyige garden was designed following the classical style of the Tianyige group in the Ming Dynasty, and its scale is similar to that of other Jiangnan gardens—that is, gardens in Southeast China. Compared with other Jiangnan gardens, there are few studies on Tianyige garden. Second, as it is not a historical heritage garden, Tianyige garden is more open in terms of management and visitors can access the whole garden. Third, unlike the crowded visitor flow of famous gardens in Suzhou, the visitor flow of Tianyige garden is relatively moderate, which is in line with the garden capacity. Apart from ensuring a better visiting experience, a moderate visitor flow could provide reliable investigation data.

2.2. Spatial Analysis

2.2.1. Spatial Elements of the Garden

In Figure 5, the main garden elements are marked with four different legends, and all buildings and entrances are sequenced from 1 to 21. The triangle symbols mark the main entrances of the two gardens. Regarding the four legends, the blue legend shows the pond or water, which occupies a large portion of the garden; the purple legend represents architecture and pavilions; the green legend marks the rockery in the East Garden; and the red legend marks the veranda, which protects and exhibits stone tablets in the courtyard wall.
In regard to the numbers, Numbers 4, 5, 16, 17, and 18 are historical buildings, which were relocated to Tianyige Museum from other places in Ningbo for protection. Numbers 4 and 17 are currently used to exhibit ancient inscriptions and local chronicles. Numbers 5 and 18 are souvenir shops providing a space for short breaks. Number 16 is used as an academic studio and is rarely open to the public. Numbers 2 and 9 are two larger stone structures known as A Hundred Goose Pavilion and Eight Lion Pavilion, while Numbers 10, 11, and 19 are three small pavilions. Numbers 3 and 21 are lavatories. Figure 6 shows eight illustrations of the main elements in Tianyige garden.
In terms of planting, camphor trees were planted on the original site of the East Garden several decades before the garden was built and retained in the design of the East Garden [73]. In addition to water and architectural features, the South Garden is also decorated with trees. As the planting of trees was widely distributed across Tianyige garden, they are not marked on the site plan.
Examination of the museum’s main tour route revealed the following. After entering through the northwest museum gate—the main entrance—visitors pass through the northern part of the museum and enter the East Garden via entrance No. 1. Following the completion of their tour of the East Garden, visitors usually leave the garden via entrance No. 12 or 13 and enter the southern part of the museum. Later, the visitors return to the South Garden via entrance No. 20 and pass through entrance No. 6 or No. 14 to enter the northern part of the museum, where their tour ends. Additionally, entrance No. 8 is an important gate connecting the East Garden and South Garden.

2.2.2. Classification of Garden Space

According to the four main spatial elements presented in Figure 5—namely, water, architecture, veranda, and rockery [18,77]—accessible open space was classified into four space types per the influence of the nearest elements presented in Figure 7. Accessible open space mainly refers to the outdoor pavements and semi-open spaces, such as that under eaves and in verandas. Inaccessible space—such as water, vegetation, and rockery hills—and the interior spaces of buildings are not included. The spatial diagrams of the four types illustrate the relationship between the space and its nearest spatial elements.
This study further divided the four types of space into smaller units according to the relationship between the space and the surrounding and visible elements in Table 1, thereby ensuring the internal unity of the spatial characteristics and elemental composition of each garden unit. Using the aforementioned approach, this study selected twenty space segments as the basic units of the garden space: A1–A5 for Type A: water space, B1–B5 for Type B: Architecture space, C1–C8 for Type C: Veranda space, and D1–D2 for Type D: Rockery space. Figure 8 shows the plans of the twenty garden units comprising Tianyige garden. Considering the width of the garden path typically ranges between 1.5 and 3 m, each unit was divided into 1.5-m square grids, so that visitor stay data could be recorded per grid of the garden unit [78].

2.2.3. Measurement Attributes of the Twenty Garden Units

Spatial attributes were identified from existing research on gardens and urban parks [30,60], including measurement and configurational attributes, which were assumed to be related to tourist stay distribution. Scenery attributes like planting and trees are not included in this study due to the high density and complex interactions of scenery in the small garden area.
Measurement attributes refer to the basic parameters of the garden units, such as dimension, scale, and facility. The length, width, perimeter, enclosure length, enclosure height, and seating length were measured based on the garden plan. The length/width (L/W), width/height (D/H), and enclosure ratio (enclosure length/perimeter) were calculated by the measured parameters. Among these attributes, the width and L/W determine whether the garden unit is a path or a domain—that is, whether the garden unit is a longitudinal and continuous path with a unidirectional axis, or a centralized domain area characterized by multidirectional axes [79,80,81]. The D/H and enclosure ratios indicate the field of vision and sense of closure [82,83].
Seating in the garden can be divided into primary seating and supplementary or secondary seating [84]. Primary seating refers to fixed benches and chairs placed in carefully selected and demarcated locations, as well as in the veranda. Supplementary or secondary seating refers to various informal sitting opportunities, including stairways, pedestals, steps, and low railings, which integrate into the surrounding environments. Figure 9 shows the seating plan of Tianyige garden.
Table 2 shows the measurement attributes of the twenty garden units. As the garden units in Types C and D appear to be paths, their L/W parameter was not calculated. Moreover, the D/H and enclosure ratio of Type D are estimated values due to the vegetation and rockeries.

2.2.4. Configurational Attributes of the Twenty Garden Units

Configurational attributes refer to the relationship between one space and other spaces in the topological spatial structure of the system based on space syntax theory. A convex map was utilized to analyze the configurational attributes of garden space. The integration and choice measures capture the structural importance of a node in a system, indicating the space’s potential for to-movement and through-movement, respectively. Appendix A explains the calculation methods of the space syntax measures [85,86].
The convex space of the garden was divided using AutoCAD software. Spaces located several topological steps out of the garden in Tianyige Museum were included in the convex map considering the connections between the garden area and other parts of the museum. Using DepthMapX 0.7.0 software, connection, choice, and integration with a radius of 3 and 5 were calculated in the convex map presented in Figure 10a–d. In Figure 10, the two nodes directly connected by a solid line indicate that the topological distance between them is 1; in other words, they can access each other in one step. Different colors represent the different ranges of the calculation values. The area of the Tianyige garden is demarcated by the dotted line.
Table 3 presents the calculation values of connectivity, choice, and integration of the twenty units based on the analysis of the convex map. When a garden unit is divided into multiple convex spaces, the average value of all the convex spaces is adopted as the calculation result.

2.3. Data Collection

The investigation of visitor stay distribution in Tianyige garden was conducted over a ten-day period from 1 July to 10 July 2019. The investigation took place during the high season of tourism in Ningbo, which coincides with the school summer vacation. The weather was typically overcast and rainy, with the temperature ranging between 22 °C and 30 °C. The research methods were literature review and field observation.

2.3.1. Visitor Flow and Activities

By surveying the previous studies, a questionnaire survey report of visitors from 2017 to 2020 conducted by Tianyige Museum and Ningbo University [87,88,89,90] is available on Tianyige Museum’s official website. The report serves as supplemental material for this study and is helpful for comprehensively grasping the visitor composition and general information in Tianyige Museum in the last four years.
According to the findings of the questionnaire survey report of Tianyige Museum from 2017 to 2020, the number of annual visitors increased each year except for 2020, making for an average of approximately 570,000 visitors per year. The museum saw an equal amount of male and female visitors. Nearly 30 percent of visitors were part of tour groups, and about 70 percent were first-time visitors. The majority of visitors were students, followed by retirees. In terms of companion relationships, the majority visited with relatives, followed by clients and colleagues. Nearly 70 percent of visitors noted a preference to travel in summer and autumn. The main purposes of their visit were gaining cultural experience, children’s play, and family activities. In respect of visitor impressions, most visitors noted the museum’s cultural atmosphere and unique garden characteristics. Visitors also suggested increasing tourism interactions and providing more open space.
Visitor flow data for Tianyige Museum were collected on 6 July 2019 (Saturday) and 10 July 2019 (Wednesday). This study selected one workday and one weekend day to conduct a comparison. On the two days of observation, the number of people in Tianyige Museum was collected in real-time at half-hour intervals via mobile devices using the museum’s official app [91]. Figure 11 shows the daily visitor flow on 6 July 2019, and 10 July 2019. According to the collected data, visitor flow on the weekend (6 July) was almost double that on the workday (10 July). In terms of daily visitors, visitor flow was highest around 10:00–11:30 a.m. and 2:00–4:00 p.m., and lowest at 12:00–13:30 p.m.
Based on field investigation and observation over the ten days, this study categorizes visitors into three categories: individual guests, tour groups with guides, and primary school student groups with teachers. Visitor activities included sightseeing, watching exhibitions, relaxing, socializing, photography, live-streaming, and picnicking. On some weekends and summer weekday mornings, primary school students and their teachers could be seen in the garden enjoying outdoor activities like group visits, sketching, and picnicking (Figure 12a–f).

2.3.2. Visitor Stay Record

Based on field observation, visitors preferred to stay at their favorite places to enjoy the scenery, take photographs, or rest. Accordingly, visitor stay was recorded to analyze how attractive different spaces were to visitors. Three periods out of the dates in Figure 11 were chosen to record visitor stay: namely, the morning of 6 July 2019 (Period 1); the afternoon of 6 July 2019 (Period 2); and the afternoon of 10 July 2019 (Period 3). The three periods included weekdays and weekends and differed in terms of visitor composition. Previous studies on visitor temporal-spatial behavior in Chinese gardens found that visitors spent an average of 30–60 s in most areas of the garden [30]. Based on this study’s field observation, most short stays in Tianyige garden lasted up to 30 s if the visitor wished to take a photograph or have a short rest. Therefore, 30 s was identified as a minimum valid stay period in the recording of data.
To record visitor stay distribution in the whole garden, the garden was divided into five observational areas: water, architecture, and rockery parts in the East Garden, and the northern and southern yards of the South Garden (Figure 13). The area of each part is suitable for mobile observation by the recorder with high efficiency. Field observation and recording of visitor stay were conducted one part at a time. During a period of ten minutes of observation in each part, visitors who stayed for more than 30 s were recorded on the garden plan with their visitor numbers and locations manually. The final visitor stay data was comprised of 1061 valid cases in the three periods.

2.4. Data Analysis

Figure 14a–c illustrates the process of dividing the visitor stay record data into each grid and the calculation methods. Figure 14a shows the original records of visitor stays, each dot representing one stay of a visitor. In Figure 14b, the number of visitor stays was calculated in each grid. In Figure 14c, the shading of each grid represents the number of visitor stays in the observational periods.
This study then calculated the visitor numbers and grid numbers of the twenty garden units and analyzed the visitor stay density and dispersion of each unit. Visitor stay density refers to the average number of visitor stays in one grid of the garden unit, while visitor stay dispersion refers to the degree to which visitor stays were scattered in different grids of the garden unit. Visitor stay density and dispersion in each garden unit were calculated using statistical methods. More specifically, the number of visitors in grid i was considered as the variable xi, the total number of people in the garden unit was the sum of sample m, and the number of grids in the unit was sample size n.
The mean x ¯ , standard deviation s, and coefficient of variation vs of each unit were calculated using to the following Equations (1)–(3):
x ¯ = i = 1 n x i n = m n
s = i = 1 n x i x ¯ 2 n 1
v s = s x ¯
where x ¯ represents the mean visitor stay of the unit, s represents the standard variation of visitor stays of the unit, and vs represents the coefficient of variation in visitor stays of the unit. The mean represents the visitor stay density of the unit, while the standard deviation and coefficient of variation reflect the degree to which visitor stays are evenly distributed [92].
After calculating the mean visitor stay and coefficients of each garden unit, scatter plots and box plot diagrams were used to analyze the data distribution and identify outliers in the mean and coefficients values. Outliers of the mean and coefficients values were excluded from the model after inspection. Scatter plot diagrams were examined before each correlation test to avoid abnormal scenarios. Pearson correlation tests were conducted to analyze the correlations between visitor stay distribution and spatial attributes. All analyses were performed using IBM SPSS Statistics Version 22 software (IBM, New York, NY, USA).

3. Results

3.1. Visitor Stay Distribution Statistics

Figure 15a–c comprises three distribution maps of visitor stay on 6 July and 10 July 2019. Visitors in Figure 15a primarily consisted of groups of primary school students in Period 1 (Saturday morning of 6 July 2019). Figure 15b presents the visitor stay distribution during the peak hour in Period 2 (Saturday afternoon, 6 July 2019). Visitors mainly consisted of groups and individual visitors. At this time, visitors tended to gather in central areas, such as the architecture and water space and were relatively evenly distributed. Figure 15c shows the visitor stay distribution in Period 3 (Wednesday afternoon of 10 July 2019). There were significantly fewer visitors on weekdays compared to the weekend, and visitors were generally scattered throughout the garden.
The visitor stay distribution statistics of the twenty garden units in the three maps presented in Table 4 were calculated based on the data in Figure 15a–c. The mean of each path refers to the average number of visitors in each grid, which represents the visitor density of each unit. The standard deviation and coefficient of variation indicate the visitor stay dispersion of the unit. In this respect, the standard deviation is the absolute value of dispersion degree, while the coefficient of variation is the relative value of dispersion considering the mean of each unit, enabling comparison.
Figure 16a–b presents the box plots of mean visitor stay and coefficients of variation in three periods. In Figure 16a, outlier C5 appears in Maps 2 and 3. In Figure 16b, outlier D2 appears in Map 2, and outlier C2 appears in Map 3. Based on an evaluation of the outlier units in the garden plan, C5 is the only veranda unit that is not adjacent to the garden wall and opens on both sides, and it connects the main buildings and entrances in the South Garden with higher accessibility. D2 and C2 are the two longest units in the rockery and veranda space, resulting in uneven visitor stay distribution. Accordingly, these three values can be considered abnormal and are discarded from the entire series to prevent them from influencing further analysis.

3.2. Correlations between Visitor Stay Density and Spatial Attributes

This study analyzed the correlations between visitor stay density and spatial attributes of the twenty garden units using a Pearson correlation test. The outlier C5 of the mean value in Maps 2 and 3 was excluded from the test. As Table 5 shows, the results of the Pearson correlation test indicate that the mean visitor stay is significantly positively related to choice R5 in Map 2, r = 0.488, p < 0.05, integration R3 in Map 2, r = 0.580, p < 0.01, and integration R5 in Map 2, r = 0.517, p < 0.05. It is significantly negatively associated with length in Map 2, r = −0.496, p < 0.05, as well as length in Map 3, r = −0.490, p < 0.05. It is also weakly positively related to choice R3, width, and seating and negatively connected to enclosure ratio. Results revealed no correlation between mean visitor stay and L/W or D/H.
Considering the significant difference in the width and L/W attribute values of the twenty units in Table 2, this study conducted further correlation analysis of two groups (Table 6). The first group comprised water and architecture spaces (Types A and B), where most of the units are spacious and more likely to be an area rather than a path. The second group comprised veranda and rockery spaces (Types C and D), which are characterized by long and narrow paths.
Results show that the correlations in Types C and D are more significant than those in Types A and B. The mean visitor stay of Types C and D is significantly positively related to the width in Map 1, r = 0.737, p < 0.05, and seating in Map 1, r = 0.681, p < 0.05, and negatively associated with length in Map 3, r = −0.718, p < 0.05. It is also weakly negatively connected to the enclosure ratio. The mean visitor stay of Type A and B is weakly positively connected to enclosure ratio in Map 2 and seating in Map 1.

3.3. Correlations between Visitor Stay Dispersion and Spatial Attributes

This study analyzed the correlations between the visitor stay dispersion and spatial attributes of the twenty garden units using a Pearson correlation test. Outliers C5, D2, and C2 in Maps 2 and 3 were excluded from the test. The coefficient of variation of visitor stay was assumed to be related to length and width attributes, causing uneven accessibility in different parts of the garden unit.
According to the Pearson correlation test results presented in Table 7, the coefficient of variation of visitor stay is significantly and negatively associated with mean of visitor stay in Map 1, r = −0.792, p < 0.01, Map 2, r = −0.845, p < 0.01, and Map 3, r = −0.856, p < 0.01. It is also weakly positively associated with length (significantly in Map 2, r = 0.545, p < 0.05) and negatively associated with width.
Considering that the confounding mean visitor stay variable is related to both the coefficient of variation and spatial attributes (length and width), this study employed a partial correlation test to mitigate misleading information from the confounding variable. The partial correlation coefficient between X and Y, controlling for Z, is written as ryx.z in Equation (4):
r yx . z = r yx r yz r xz 1 r yz 2 1 r xz 2
where ryx, ryz, and rxz are zero-order coefficients between all the variables (Y and X, Y and Z, X and Z) [92]. The mean visitor stay values, which are unrelated to the coefficient of variation or spatial attributes, were excluded from the partial correlation test and identified as NA.
Table 8 presents the results of the partial correlation test, controlling for mean visitor stay. The significant correlation with length in Map 2 disappeared (r = 0.094), indicating that the correlation may be due to the controlling variable. Therefore, mean visitor stay partially explains the correlation between the coefficient of variation of visitor stay and spatial attributes of the twenty gardens units examined in this study.

3.4. Characteristics of Visitor Stay Distribution and the Four Types of Garden Space

Figure 17a-c shows the characteristics of visitor stay distribution and the four types of garden space. Figure 17a presents a comparison of visitor stay density in the four types of garden space in column charts. Figure 17b compares visitor stay dispersion in the four types of garden space in column charts. Figure 17c presents the average values of the attributes of the four types of garden space and four typical garden units in radar charts. Six spatial attributes related to the visitor stay density were taken as axis variables: integration R3, choice R5, width, length, enclosure ratio, and seating. A unified scale was adopted in the radar chart axis by calculating the percentages of variable values comparing the maximum. The dotted line represents the total average values.
As Figure 17a,b show, water and architecture spaces (Types A and B) have the highest visitor stay density and lowest visitor stay dispersion. The visitor stay density of veranda space (Type C) is lower than that of the water and architecture spaces (Type A and B), followed by rockery space (Type D), which has the highest visitor stay dispersion. Meanwhile, Figure 17c shows that the four types of garden space have distinctive attributes. The four typical garden units (A5, B1, C6, D2) at the bottom of Figure 17c show the individual cases which can represent the four types. Among them, A5 and C6 are typical water and veranda spaces in the South Garden, while B1 and D2 are typical architecture and rockery spaces in the East Garden.

4. Discussion

4.1. Main Findings

The main findings of this study can be summarized in five points as follows. First, visitor flow on weekends was almost twice that on weekdays; peak hours are 10:00–11:30 a.m. and 2:00–4:00 p.m., while off-peak hours are 12:00–13:30 p.m. On weekends (Maps 1 and 2), architecture and water spaces enjoyed high visitor flow, while veranda space occasionally experiences high visitor flow from particular student groups. On weekdays (Map 3), visitors were relatively evenly distributed in the architecture, water, and veranda spaces.
Second, in respect of visitor groups, individual guests and tour groups preferred water space, followed by architecture space and then veranda space. Primary school student groups preferred architecture spaces, followed by veranda space. Essentially, most visitors were more interested in the beautiful scenery of the garden, resulting in the water space being more popular among general visitors. As primary school students usually played in groups, they tended to prefer spacious open spaces with shelter and adequate seating facilities.
Third, there is a correlation between visitor stay density and six spatial attributes: integration, choice, width, length, enclosure ratio, and seating. The visitor stay density of all types is significantly positively related to integration R3 and R5 and choice R5 in Map 2 and negatively associated with length in Maps 2 and 3. The visitor stay density of veranda and rockery types is significantly positively related to width and seating in Map 1 and negatively associated with length in Map 3.
Fourth, visitor stay dispersion is significantly negatively related to visitor stay density. A partial correlation test controlling for visitor stay density revealed no correlation between visitor stay dispersion and length and width.
Fifth, the four types of garden space have distinctive attributes and can be divided into two groups: centralized, spacious, and highly accessible open space, like Types A and B; and narrow, longitudinal paths with low accessibility and abundant seating facilities like Types C and D. The two groups reflect different patterns of visitor stay distribution.

4.2. Spatial Composition of Tianyige Garden

4.2.1. Composition Elements of Tianyige Garden Space

Although the composition and style of Chinese gardens have varied across different historical periods, Chinese gardens have retained distinctive features referred to as “garden genes”. Tong Jun identifies the basic elements of a garden based on the Chinese character “園” (garden). He says, “The outer circle (囗 Encircle) resembles a courtyard wall, and within the circle are buildings (土 Soil), ponds (口 Mouth), rockery and trees (衣 Clothes) [5]”. Liu Dunzhen similarly summarized the basic concept of a garden as comprising a combination of rockery, ponds, trees, and houses, under the guiding principle of a poetic and artistic concept [7]. Quantitative studies comparing ancient and modern gardens have identified five basic elements of Chinese gardens: buildings, plants, rockery, water, and garden paths or squares [18,77]. This study identified four garden elements: water, architecture, veranda, and rockery. As most verandas in Tianyige garden are the combination of the courtyard wall and veranda surrounding the entire garden, they were considered as an independent spatial element. Similarly, several other studies have focused on the veranda space of Chinese gardens [93,94,95].
Regarding the proportion of each garden element comprising a Chinese garden, Wu [77] indicates that the area of buildings is typically much smaller than other garden elements if the residential buildings outside the garden are excluded. Analyzing the proportion of elements from a three-dimensional perspective, Yang [18] found that plants and water make up the largest proportion of the garden, followed by buildings. In a quantitative analysis of the elements of the Tianyige East Garden, Liu [96] similarly found that the total area occupied by buildings was smaller than both that of rockery space and garden paths. However, the results of this study show that architecture space—that is, buildings—have the highest visitor stay density. This finding is due to the high accessibility and functionality of architectural space, as well as the inaccessibility of water and rockery spaces. As noted in the second chapter of Yuan Ye, “the first step to set up the foundation of a garden is to decide the location of the main building” [97]. Indeed, the buildings play the most fundamental role in Chinese gardens.

4.2.2. Forms and Configurations of Tianyige Garden Space

The layout of Tianyige garden closely resembles that of Jiangnan gardens insofar as the layout of the East Garden is centers on water. Similar examples include the northwestern part of Zhan Garden in Nanjing, the central part of the Lingering Garden in Suzhou, the western part of Lion Grove Garden in Suzhou, the central part of Master-of-Nets Garden in Suzhou, and Yipu Garden in Suzhou [98]. However, the layout of the East Garden is slightly different from the aforementioned examples in terms of the axial organization of garden elements. In traditional gardens, the main building usually served as the living room while providing the best view of the garden. Accordingly, the main building is conventionally located in the central area in front of the main theme of the garden scenery, close to the water and facing the main axis of the pond and rockery. Contrary to convention, the two buildings in the East Garden do not face the main view of the garden (i.e., the water and rockery scenery); rather, they are located parallel to the axis of the water and rockery. One reason for this break with tradition is that the buildings in the East Garden have become exhibition spaces. Moreover, these buildings were relocated from elsewhere in Ningbo, their size too big to match the garden scale. Positioning the two buildings such that they faced the pond and rockery directly would have undermined the balance of the garden—the oversized building disrupting the broadness of the water and rockery [73]. This clever axial organization also provides an alternative tour route, enriching the traditional centralized layout.
The rockery in the Tianyige garden is buried in thick woods and huge buildings, rendering an overall view of the rockery impossible and emphasizing the depth of garden space. Camphor trees were planted in the East Garden, creating the atmosphere of a wild mountain forest, similar to that of the Canglang Pavilion in Suzhou [98]. However, unlike the complicated verandas separating the garden space in the Suzhou gardens of the middle and later Qing Dynasty, the verandas in Tianyige garden are simple and linear, surrounding the garden with walls. The simple verandas, soil and stone rockery, and square pond embody the garden form and configuration of the Ming Dynasty [99].

4.2.3. Distinctive Characteristics of Tianyige Garden Space

Despite sharing several similarities with other traditional Jiangnan gardens, Tianyige garden is unique in three ways. First, Tianyige garden is home to a collection of historical items, with a variety of ancient buildings, stone pavilions, stone tablets, and other historical items having been relocated from other parts of Ningbo to the garden for protection [74]. Second, the intended function of Tianyige garden is unique compared to traditional gardens insofar as it was originally designed to serve the museum and its visitors. In this respect, the garden is actually a subsidiary of the museum intended to reduce the potential overwhelming of the ancient Tianyige Library. Third, Tianyige garden follows the gardening ideology of adhering to local conditions. Rather than following the style of traditional gardens, Tianyige garden has absorbed the local characteristics of Ningbo—for instance, it uses local stones in the rockery and retains the original camphor trees [73]. Therefore, Tianyige Garden is a valuable exploration of contemporary Chinese garden design.

4.3. Attractiveness and Openness of the Garden Space

4.3.1. Attractiveness of the Four Types of Garden Space

In terms of the attractiveness of garden elements, previous studies [100,101] have examined the visitor stay points and attractiveness of garden elements in the Master-of-Nets Garden and Lingering Garden in Suzhou. These studies found that most visitors to the Master-of-Nets Garden preferred to stay in the building areas (including indoor space, external platforms, and spaces under the eaves) and that the water elements had the highest attractiveness. However, due to the small area and compact layout of the Master-of-Nets Garden, several elements are likely to have multiple influences on visitors. As such, the attractiveness of the garden elements in the Lingering Garden appears similar to that of Tianyige garden, although the Lingering Garden has a much higher proportion of buildings. In other words, the buildings in the Tianyige garden attract the most visitors despite occupying a smaller area proportion than those of the Lingering Garden.
As most of the main scenery—the best viewpoints—in Tianyige garden can be found around the water area, visitor stay density is highest in the water space in Map 2 (Figure 17a). Architecture space also attracts a large number of visitors because it functions exhibition space, resulting in high visitor stay density in architecture space in all three maps. Veranda space shows a moderate visitor stay density due to its provision of seating facilities and good views of the scenery. However, visitor stay distribution was found to vary across different parts of veranda space; for instance, the most popular veranda unit was C5, which has high accessibility and a wide vision. Rockery space had the fewest visitors, with visitor stay primarily concentrated in the pavilions. As such, rockery space was found to be the least attractive space to most visitors.
The three time periods examined in this study reflect different visitor stay distribution situations. Map 2 of the weekend period and Map 3 of the weekday period are most typical, while Map 1 is unique insofar as it shows how primary school student groups utilized the garden. In respect of the latter, architecture and veranda spaces provided students with spacious shelters and abundant seating facilities for a variety of activities, including picnics, painting, and socializing, reflecting the flexible utilization of the garden space for both individuals and large groups.

4.3.2. Openness of the Garden Space Based on Six Spatial Attributes

According to the upper three attributes (choice R5, integration R3, and width) and the lower three attributes (length, enclosure ratio, and seating) in the radar charts of Figure 17c, the four types of space can be divided into two groups: Types A and B, in which the upper three attribute values are larger than average and lower three attribute values are smaller than average; and Types C and D, in which the upper three attribute values are smaller than average and lower three attribute values are larger than average. Units in Types A and B are centralized, spacious, and highly accessible open spaces, while units in Types C and D units are longitudinal narrow paths with low accessibility and abundant seating facilities. The two groups thus reflect different patterns of visitor stay distribution.
Accessibility (integration and choice) was found to be significantly positively related to visitor stay density in all garden units. As accessibility can determine the proportion of first-time visits to a space, it serves as a basic factor in determining whether a space is popular to visitors [30]. However, high visitor flow does not necessarily lead to high visitor stay density. Indeed, while veranda unit C3 is located on the main tour route and close to the south entrance of the East Garden with high accessibility, it has low visitor stay density and only serves as a pass space. Therefore, other influencing factors are also important in visitor stay distribution.
While both length and width are related to visitor stay density, width is more interpretable and found to be particularly significant in Types C and D. The average widths of water space (3.7 m) and architecture space (5.7 m) are wider than the total average width (3.1 m) of garden space, as is the typical case of unit A5 (5.5 m) of water space and unit B1 (6.4 m) of architecture space. This may be another important reason for higher visitor stay density in Types A and B. Existing research on urban forest parks also indicates that visitors prefer paths wider than 3 m, and the relationship between path use and length is yet to be identified [60].
Enclosure ratio is related to visitor stay density insofar as it directly affects the visibility of the surrounding environments and scenery, and the visual characteristics of a space play a decisive role in spatial attraction [30]. The correlation results of this study indicate that the enclosure ratio is weakly positively related to visitor stay density in Types A and B, which have enclosure ratios below 50 percent, and weakly negatively related to visitor stay density in Types C and D, where most enclosure ratios are above 50 percent. This may indicate that a moderate enclosure ratio is more conducive to visitor stay distribution.
Seating is also an important attribute related to visitor stay distribution, especially in veranda space. In this study, accessibility and width, which are supposed to promote visitor stay behaviors, were found to be below average in the veranda space, except for seating. Existing studies suggest that visitors tend to stay on verandas that provide good views of the main scenery or water [102,103]. This may account for the high visitor stay density of veranda space units C1, C5, and C7.

4.4. Visitors and Activities

Visitor flow is essential to the experience of a garden. Tianyige Museum saw almost 739,000 visitors in 2019 [89]. In contrast, Shanghai’s commercial areas of Yu Garden—which was also restored by Chen Congzhou—saw some 40 million visitors in 2019 [104], making the garden overcrowded throughout the year. Evidently, each Chinese garden has an optimal visitor capacity, which is essential to making it a high-quality green public open space in the city rather than a tourist hotspot.
This study divided visitors into three categories: individual visitors, group visitors, and student groups. Another study of visitors in Tianyige Museum [105] classified users more comprehensively, including book borrowers, museum visitors, patriotic activity participants, exhibition visitors, and other academic and social activities participants. This reflects the fact of Tianyige Museum’s multiple identities, including a library, museum, historical archive, exhibition hall, tourist attraction, as well as a base for local primary and secondary school excursions and activities. It also demonstrates how Chinese garden space can be adapted to serve multiple functions and activities.
Compared with visitor activities in urban parks [106], Tianyige garden is not used for exercise and is less popular for socializing, with most visitors immersed in the garden environment. This finding indicates that the Tianyige garden environment aligns with the culture surrounding book collection and historical relics and that the garden also provides a green open space for rest and recreation in the museum.

5. Conclusions

Through examining the correlations between spatial attributes and visitor stay distribution in the gardens of Ningbo Tianyige Museum, this study revealed the openness of this garden space and its attractiveness to visitors. Results reveal that the garden’s architecture and water spaces enjoyed a highly dense and evenly distributed visitor stay. Veranda space had a lower stay density, followed by rockery space. Visitor stay density is significantly negatively related to visitor stay dispersion, and there is a correlation between stay density and six spatial attributes: integration, choice, width, length, enclosure ratio, and seating. The results of this study indicate that Tianyige garden is a classical-style garden with innovations in terms of its spatial composition [73,74]. The distinctive attributes of the four types of garden space reflect different patterns of visitor stay distribution. Tianyige garden can cater to diverse visitor groups and provide a space for a wide range of activities [20], demonstrating the openness of Chinese gardens as urban public spaces [107,108,109].
This study could contribute to the visitor studies as well as environmental behavior studies in Chinese gardens and other urban green spaces [64,65]. The findings of this study could also provide useful insights for the planning and management of Chinese garden tourism [29,30]. Furthermore, this study is of great value with respect to the utilization of green public open spaces in cities. With the proposal of constructing a high-quality “Park City” in China [110,111], Chinese gardens will play a critical role in creating a natural atmosphere, humanized environment, a pleasant and picturesque urban life, and a healthy and ecological city.
Based on its findings, this study provides the following suggestions for improving the traveling experience and utilization of Chinese gardens. First, visitors tend to find wider spaces more open and attractive; however, it is important that the scale matches the overall layout and style of the garden. Concerning the narrow and winding garden paths, tour routes with signposting can serve to reduce the accessibility to avoid heavy visitor traffic, thereby improving visitor experience. Second, architecture and water spaces are quite popular among visitors, which means that these two types of space should be appropriately arranged and connected by verandas, thereby balancing the attractiveness of the entire garden space. Third, better route design can improve the accessibility and visibility of marginal spaces like verandas. Other attractive elements like architecture and water can be combined with verandas or “borrowed scenery” to improve the visual experience of the landscape from the veranda. Fourth, more functions and facilities—such as supplementary or secondary seating—can be added to architecture and water spaces to improve visitor activities and experience.
This study had three limitations. First, this study has a relatively small sample size, with only twenty garden units extracted from the garden as samples due to the overall garden scale. Second, this study did not control for other unknown factors that may influence the visitor stay behaviors; different seasons and climatic conditions were also not considered. Third, this study only conducted qualitative observation and analysis of visitor activities. A more detailed behavioral study may better explain the communal nature and utilization of garden space at the Tianyige Museum. Future research should examine the correlations between the length of visitor stay and spatial attributes, thereby elucidating the spatial requirements of different lengths of visitor stay and facilitating the identification of optimal rest stops in the garden. Researchers should also examine the unique attributes and advantages of Chinese classical garden space to propose strategies to improve the traveling experience and utilization of gardens in China.

Author Contributions

Conceptualization, J.Y. (Jia Yu) and T.Y.; methodology, J.Y. (Jia Yu), T.Y., and E.I.; software, J.Y. (Jia Yu); investigation, J.Y. (Jia Yu) and J.Y. (Jing Yang); resources, J.Y. (Jia Yu) and J.Y. (Jing Yang); writing—original draft preparation, J.Y. (Jia Yu); writing—review and editing, J.Y. (Jia Yu), T.Y., E.I., and J.Y. (Jing Yang); funding acquisition, J.Y. (Jing Yang). All authors have read and agreed to the published version of the manuscript.
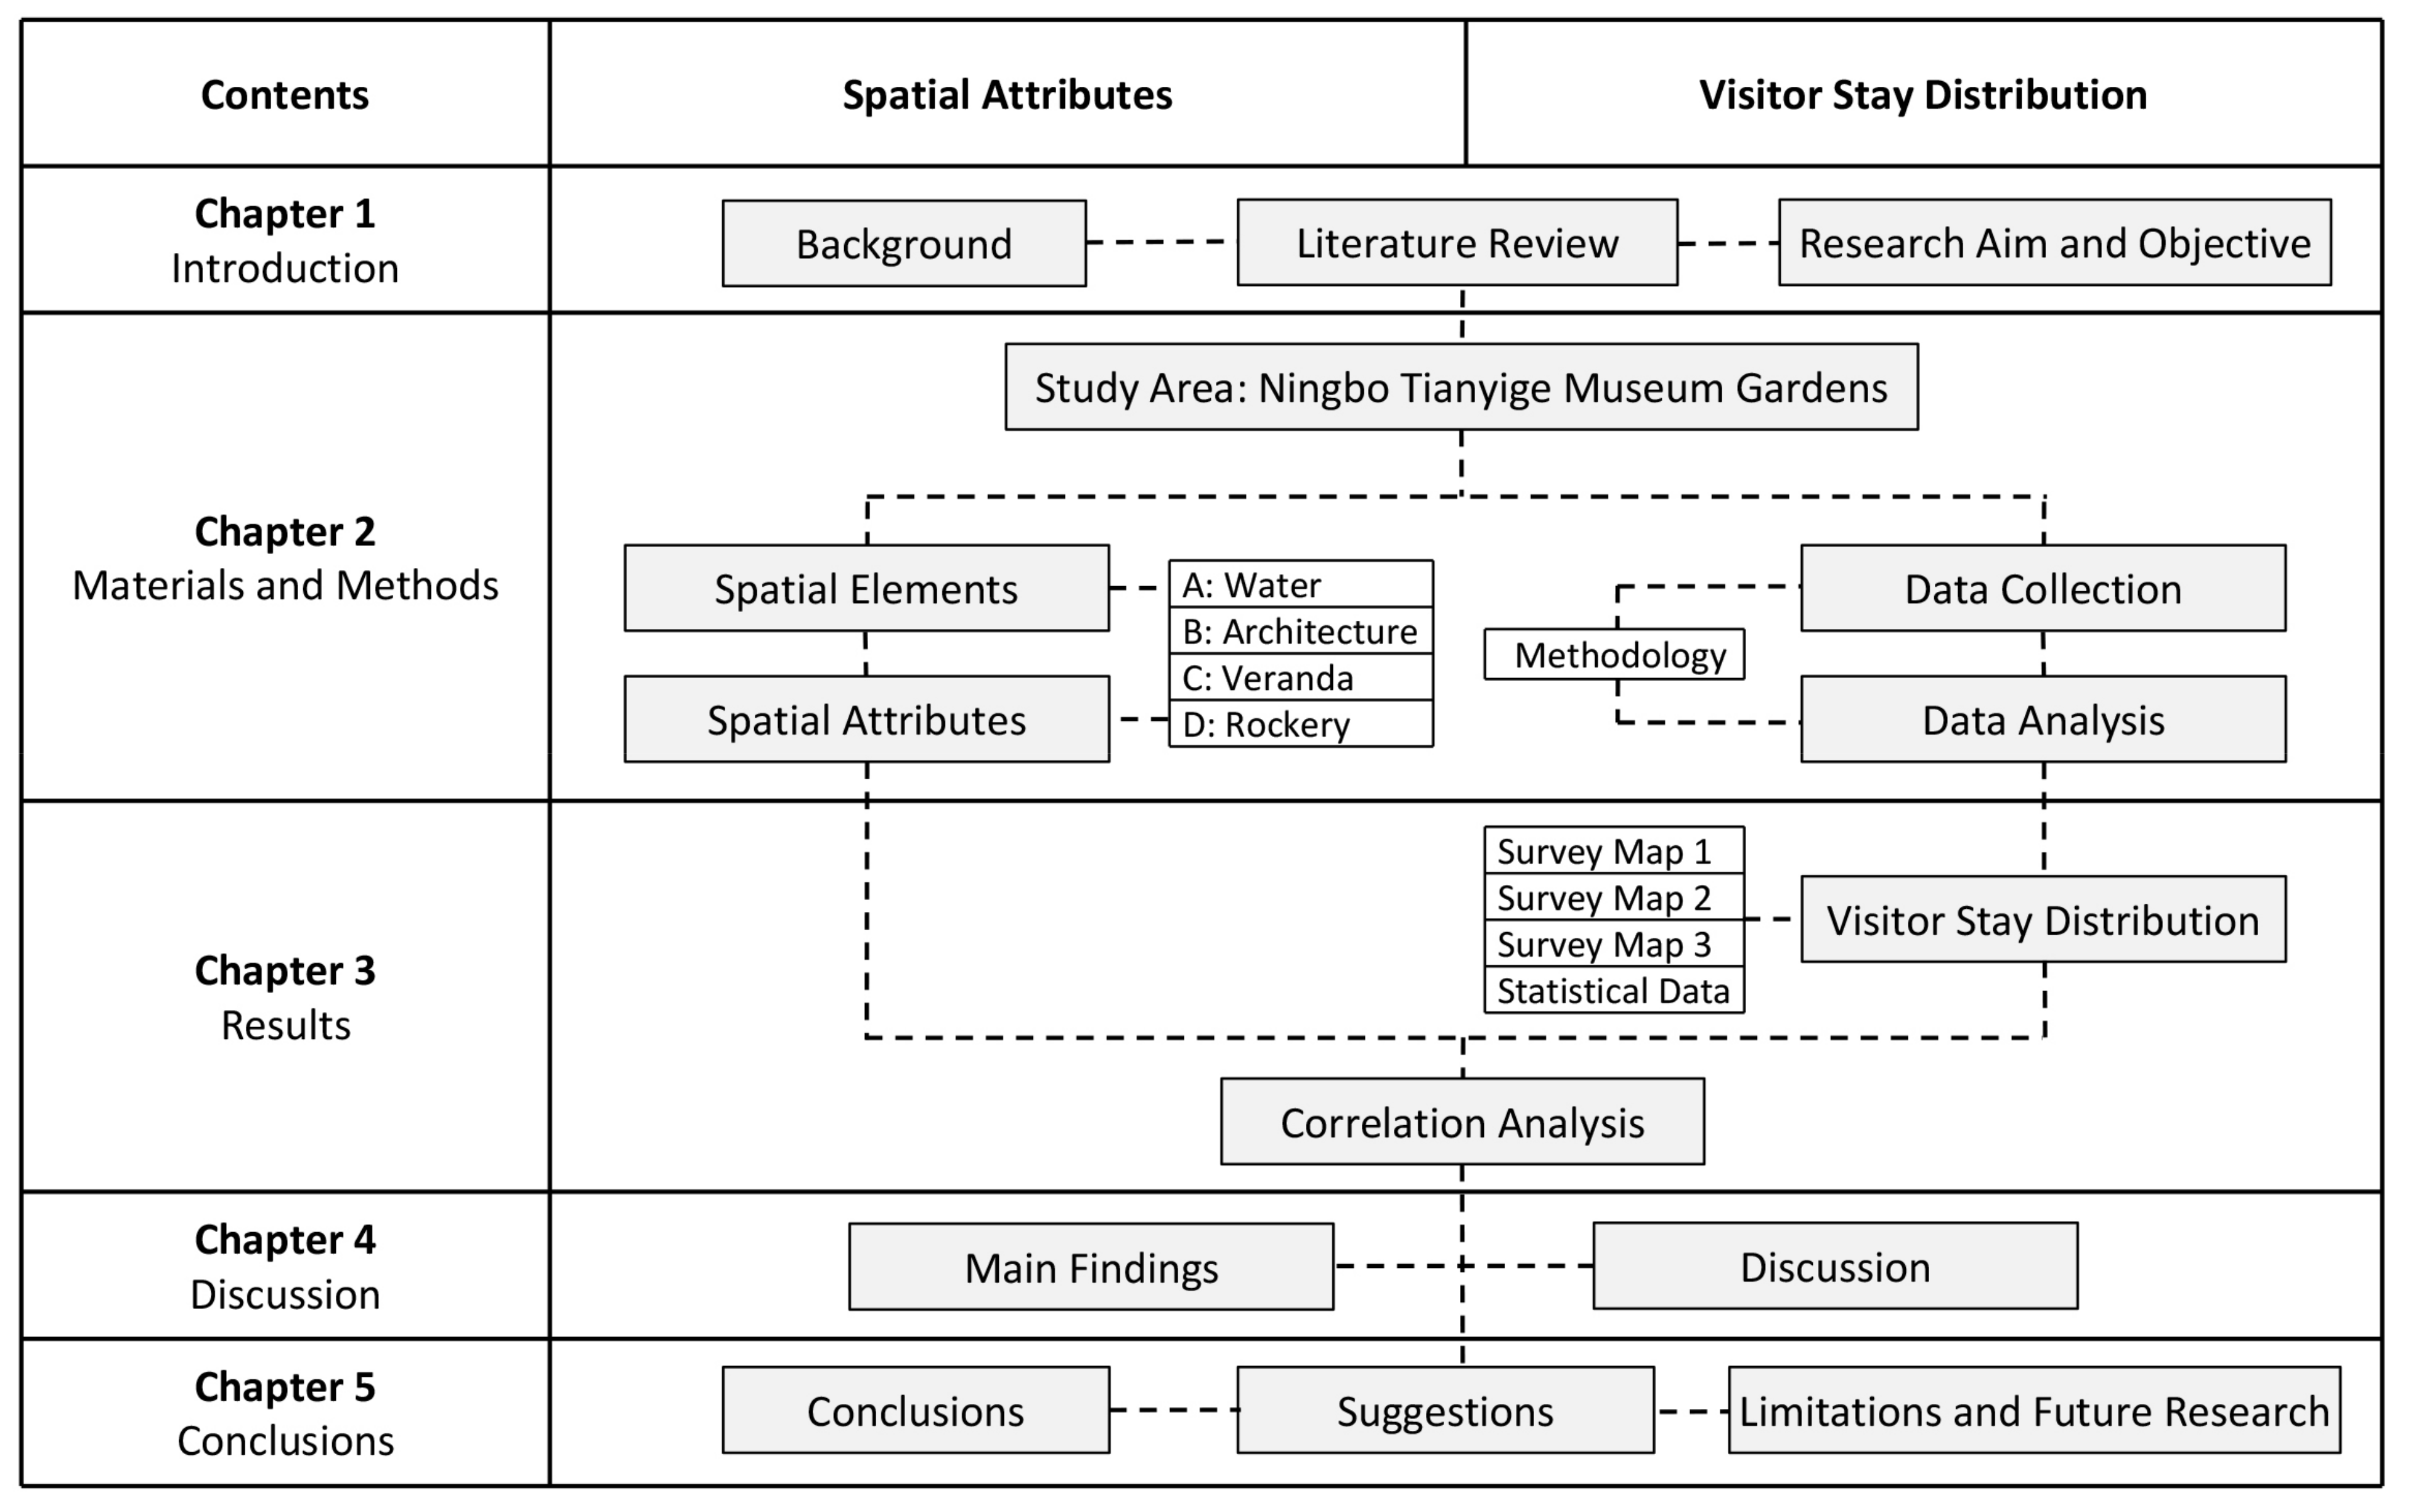
Funding

This research was funded by NATIONAL NATURAL SCIENCE FOUNDATION OF CHINA, grant number 51978445 and 52038007.

Institutional Review Board Statement

Ethical review and approval were waived for this study, due to it did not collect critical personal information.

Informed Consent Statement

Not applicable.

Data Availability Statement

Data supporting the findings of this study are available within the article and from the corresponding author J.Y. on request.

Acknowledgments

The authors wish to thank Zhang Liang of Ningbo Tianyige Museum for the support during the investigation, as well as The National Natural Science Foundation of China for their generous financial supports. The authors also wish to extend their gratitude to Aoki Takashi of Osaka University, Iida Tadasu of Kwansei Gakuin University, and Itami Koji of Mukogawa Women’s University for their advice and help throughout this project.

Conflicts of Interest

The authors have no conflict of interest to declare.

Appendix A. Calculation Methods of Space Syntax Measures

In space syntax theory, connectivity is defined as the number of nodes that connect directly to a given node. Choice captures how likely a given node may be passed through in journeys from all nodes to all other nodes in the system. Choice can be estimated as the ratio between the number of shortest paths through node i and the total number of all shortest paths in the model, as shown in (A1):
Choice i = { # shortest   paths   through   i } { # all   shortest   paths }
space i has a strong choice value when many of the shortest paths connecting all spaces of a system, pass through it.
Integration examines the degree to which a given node is integrated or segregated from the whole system (global integration) or a partial system comprising nodes a few steps away (local integration). The node with a high integration value means it is easier to access from other nodes because it is located at a shallow level of the system. In contrast, the node with a small integration value represents the segregation trend because it is difficult to reach. It is measured by the Real Relative Asymmetry (RRA) [86] as follows (A2)–(A5):
Integratio n i = 1 RRA i
RRA i = 2 MD i 1 D N N 2
D N = 2 N log 2 N + 2 3 1 + 1 N 1 N 2
MD i = D i N 1
where N is the total number of nodes, DN is the normalization parameter to counter the size effect, and MD (mean depth) is the average number of syntactic steps from a given node i to any other nodes (all nodes or nodes several steps away).
The depth is the basic concept of a topological distance between nodes. Two open spaces, i and j, are said to be at depth dij if the least number of syntactic steps needed to reach one node from the other is dij. The concept of depth can be extended to global depth, the sum of all depths from a given origin, as follows (A6):
D i = j = 1 N d ij
Consistent with global depth, the local depth only summarizes the distance between that particular node and the nodes within a search radius.

References

  1. Wang, J.Y. On the earliest form of garden in China. Acta Hortic. Sin. 1965, 4, 101–106. [Google Scholar]
  2. Wang, J.Y. The historical development of Chinese landscape garden. Chin. Landsc. Archit. 1985, 1, 34–38. [Google Scholar]
  3. Meng, Z.Z. The artistic characteristics and public attribute of Chinese garden: A case of Yangzhou. China Anc. City 2015, 29, 4–7. [Google Scholar]
  4. Zhou, W.Q. History of Chinese Classical Gardens; Tsinghua University Press: Beijing, China, 1990; pp. 183–184. [Google Scholar]
  5. Tong, J. Records of Jiangnan Gardens, 2nd ed.; China Architecture & Building Press: Beijing, China, 1984; pp. 3–14. [Google Scholar]
  6. Tong, J. Glimpses of Gardens in Eastern China; China Architecture & Building Press: Beijing, China, 1997; pp. 1–38. [Google Scholar]
  7. Liu, D.Z. Suzhou Classical Gardens; China Architecture & Building Press: Beijing, China, 1979; pp. 3–50. [Google Scholar]
  8. Chen, C.Z. Suzhou Gardens, centenary ed.; Tongji University Press: Shanghai, China, 2018; pp. 10–71. [Google Scholar]
  9. Zhao, J.J.; Woudstra, J. ‘Making green the motherland’: Greening the Chinese socialist undertaking (1949–1978). Stud. Hist. Gard. Des. L. 2012, 32, 312–330. [Google Scholar] [CrossRef]
  10. Zhao, J.J. Sixty years of landscape policies and development in China (1): ‘Chinese also new’. Landsc. Archit. 2009, 26, 102–105. [Google Scholar] [CrossRef]
  11. Zhao, J.J. Sixty years of landscape policies and development in China (4): Garden revolution. Landsc. Archit. 2009, 26, 75–79. [Google Scholar] [CrossRef]
  12. Lin, G.S. The development of the practice of contemporary Chinese landscape architecture—A critic based on five perspectives. In Proceedings of the 2010 47th International Federation of Landscape Architects World Congress (47th IFLA 2010), Suzhou, China, 28–30 March 2010; pp. 309–313. [Google Scholar]
  13. Wang, D. The Outline Study on the Chinese Modern Landscape Design (1949–1978) Development Program. Master’s Thesis, Hainan University, Haikou, China, 2012. [Google Scholar]
  14. Wang, N.N. The Historical Development of People’ Parks in New China (1949–1978). Master’s Thesis, Huazhong University of Science and Technology, Wuhan, China, 2016. [Google Scholar]
  15. Gao, L.; Woudstra, J. From landscape of gods to landscape of man: Imperial altars in Beijing. Stud. Hist. Gard. Des. L. 2011, 31, 231–268. [Google Scholar] [CrossRef]
  16. Yue, Z. Chinese garden heritage reservation study based on the history of Zhuozheng Garden. In Proceedings of the International Symposium on Prof. Chen Zhi’s Gardening Thought & Doctoral Forum of Landscape Architecture Theories and Practice, Nanjing, China, 14–15 November 2009; pp. 129–132. [Google Scholar]
  17. Gu, G.C.; Cheng, Y.; Li, L.; Guo, L.; Deng, H. The research of changes of the Chinese historical private classical garden and the authenticity of the protection. J. Hum. Settl. West China 2018, 33, 69–77. [Google Scholar] [CrossRef]
  18. Yang, B.; Volkman, N. From traditional to contemporary: Revelations in Chinese garden and public space design. Urban Des. Int. 2010, 15, 208–220. [Google Scholar] [CrossRef] [Green Version]
  19. Öztürk, H. The Sadabad Park project in İstanbul—Balancing garden heritage conservation and contemporary park design. J. Landsc. Archit. 2009, 4, 70–81. [Google Scholar] [CrossRef]
  20. Rostami, R.; Lamit, H.; Khoshnava, S.M.; Rostami, R. Successful public places: A case study of historical Persian gardens. Urban For. Urban Green. 2016, 15, 211–224. [Google Scholar] [CrossRef]
  21. Fung, S.; Huang, J. Mutuality and the cultures of landscape architecture. New Archit. 2001, 19, 4–7. [Google Scholar]
  22. Fung, S.; Jackson, M. Four key terms in the history of Chinese gardens. In Proceedings of the International Conference on Chinese Architectural History, Hong Kong, China, 7–10 August 1995; pp. 21–42. [Google Scholar]
  23. Fung, S. Self, scene and action: The final chapter of Yuan Ye. In Landscapes of Memory and Experience; Birksted, J., Ed.; Spon Press: London, UK, 2000; pp. 129–136. [Google Scholar]
  24. Chen, C.Z. On Chinese Gardens; Tongji University Press: Shanghai, China, 1984; pp. 1–58. [Google Scholar]
  25. Fung, S. Longing and belonging in Chinese garden history. In Perspectives on Garden Histories; Conan, M., Ed.; Dumbarton Oaks: Washington, DC, USA, 1999; pp. 205–219. [Google Scholar]
  26. Fung, S.; Liu, S.D.; Sun, Y. Aperspectival effects in the Liu Yuan, Suzhou. Archit. J. 2016, 56, 36–39. [Google Scholar]
  27. Yu, R.R.; Gu, N.; Ostwald, M. The mathematics of spatial transparency and mystery: Using syntactical data to visualise and analyse the properties of the Yuyuan Garden. Vis. Eng. 2016, 4, 4. [Google Scholar] [CrossRef] [Green Version]
  28. Yuan, X.; Wu, S. Soundscape of classical Chinese garden. Front. Archit. Civ. Eng. China 2008, 2, 172–178. [Google Scholar] [CrossRef]
  29. Yu, R.R.; Ostwald, M. Spatio-visual experience of movement through the Yuyuan Garden: A computational analysis based on isovists and visibility graphs. Front. Archit. Res. 2018, 7, 497–509. [Google Scholar] [CrossRef]
  30. Zhang, T.T.; Lian, Z.F.; Xu, Y.N. Combining GPS and space syntax analysis to improve understanding of visitor temporal–spatial behaviour: A case study of the Lion Grove in China. Landsc. Res. 2020, 45, 534–546. [Google Scholar] [CrossRef]
  31. Mu, X.D. Image, word and Chinese gardens: Juxtaposition of photograph and lyric by Chen Congzhou. J. Tongji Univ. Soc. Sci. Sect. 2018, 29, 48–63. [Google Scholar]
  32. Elsadek, M.; Sun, M.; Sugiyama, R.; Fujii, E. Cross-cultural comparison of physiological and psychological responses to different garden styles. Urban For. Urban Green. 2019, 38, 74–83. [Google Scholar] [CrossRef]
  33. Suthasupa, S. Kenrokuen’s six garden attributes and the understanding-and-exploration approach. Procedia Soc. Behav. Sci. 2012, 50, 657–666. [Google Scholar] [CrossRef] [Green Version]
  34. Tsumita, H.; Fukushima, K.; Shimazu, M. Study of the landscape composition and psychological evaluation in Japanese Zakanshiki garden. J. Archit. Plann. AIJ 2016, 81, 2393–2399. [Google Scholar] [CrossRef] [Green Version]
  35. Sun, P. The Contrast Interpretation of Chinese Classical Gardens between Space Syntax Theory and Traditional Theories: The Space Research of Chengde Mountain Resort. Ph.D. Thesis, Beijing Forestry University, Beijing, China, 2012. [Google Scholar]
  36. Chen, R. Research on Traditional Chinese Garden’s Space Syntax and Insights into Contemporary Regional Reconstruction. Master’s Thesis, Tsinghua University, Beijing, China, 2012. [Google Scholar]
  37. Luo, J.C.; Hong, B. Analysis of the characteristics of Beijing Grand View Garden based on space syntax. South Archit. 2019, 190, 93–98. [Google Scholar] [CrossRef]
  38. Polat, A.T.; Akay, A. Relationships between the visual preferences of urban recreation area users and various landscape design elements. Urban For. Urban Green. 2015, 14, 573–582. [Google Scholar] [CrossRef]
  39. Lindemann-Matthies, P.; Köhler, K. Naturalized versus traditional school grounds: Which elements do students prefer and why? Urban For. Urban Green. 2019, 46, 126475. [Google Scholar] [CrossRef]
  40. Wang, R.; Zhao, J.; Liu, Z. Consensus in visual preferences: The effects of aesthetic quality and landscape types. Urban For. Urban Green. 2016, 20, 210–217. [Google Scholar] [CrossRef]
  41. Lin, W.; Chen, Q.B.; Jiang, M.Y.; Zhang, X.X.; Liu, Z.F.; Tao, J.Y.; Wu, L.J.; Xu, S.; Kang, Y.S.; Zeng, Q.Y. The effect of green space behaviour and per capita area in small urban green spaces on psychophysiological responses. Landsc. Urban. Plan. 2019, 192, 103637. [Google Scholar] [CrossRef]
  42. Deng, L.; Li, X.; Luo, H.; Fu, E.K.; Ma, J.; Sun, L.X.; Huang, Z.; Cai, S.Z.; Jia, Y. Empirical study of landscape types, landscape elements and landscape components of the urban park promoting physiological and psychological restoration. Urban For. Urban Green. 2020, 48, 126488. [Google Scholar] [CrossRef]
  43. Harris, V.; Kendal, D.; Hahs, A.K.; Threlfall, C.G. Green space context and vegetation complexity shape people’s preferences for urban public parks and residential gardens. Landsc. Res. 2018, 43, 150–162. [Google Scholar] [CrossRef]
  44. Rahnema, S.; Sedaghathoor, S.; Allahyari, M.S.; Damalas, C.A.; Bilali, H.E. Preferences and emotion perceptions of ornamental plant species for green space designing among urban park users in Iran. Urban For. Urban Green. 2019, 39, 98–108. [Google Scholar] [CrossRef]
  45. Zhao, J.W.; Xu, W.Y.; Li, R.J. Visual preference of trees: The effects of tree attributes and seasons. Urban For. Urban Green. 2017, 25, 19–25. [Google Scholar] [CrossRef]
  46. Qiu, L.; Yu, N.; Gao, Y.; Zhang, T.; Gao, T. Public visual preference for dead wood in different types of landscape. Forests 2021, 12, 44. [Google Scholar] [CrossRef]
  47. Yalowitz, S.S.; Bronnenkant, K. Timing and tracking: Unlocking visitor behavior. Visit. Stud. 2009, 12, 47–64. [Google Scholar] [CrossRef]
  48. Mygind, L.; Bentsen, P. Reviewing automated sensor-based visitor tracking studies: Beyond traditional observational methods? Visit. Stud. 2017, 20, 202–217. [Google Scholar] [CrossRef]
  49. Zwinkels, J.; Oudegeest, T.; Laterveer, M. Using visitor observation to evaluate exhibits at the Rotterdam zoo aquarium. Visit. Stud. 2009, 12, 65–77. [Google Scholar] [CrossRef]
  50. Kirchgessner, M.L.; Sewall, B.J. The impact of environmental, social, and animal factors on visitor stay times at big cat exhibits. Visit. Stud. 2015, 18, 150–167. [Google Scholar] [CrossRef]
  51. Skov, M.; Lykke, M.; Jantzen, C. Introducing walk-alongs in visitor studies: A mobile method approach to studying user experience. Visit. Stud. 2018, 21, 189–210. [Google Scholar] [CrossRef]
  52. Stylianou-Lambert, T. Photographing in the art museum: Visitor attitudes and motivations. Visit. Stud. 2017, 20, 114–137. [Google Scholar] [CrossRef]
  53. Song, X.P.; Richards, D.R.; He, P.; Tan, P.Y. Does geo-located social media reflect the visit frequency of urban parks? A city-wide analysis using the count and content of photographs. Landsc. Urban. Plan. 2020, 203, 103908. [Google Scholar] [CrossRef]
  54. Wei, H.X.; Ma, B.Q.; Hauer, R.J.; Liu, C.Y.; Chen, X.; He, X.Y. Relationship between environmental factors and facial expressions of visitors during the urban forest experience. Urban For. Urban Green. 2020, 53, 126699. [Google Scholar] [CrossRef]
  55. Fox, D. External agents of change: A 10-year trend study of garden visitor behaviour in England. Tour. Recreat. Res. 2017, 42, 446–456. [Google Scholar] [CrossRef]
  56. Li, D.Z. Introduction to Environmental Ethology; Tsinghua University Press: Beijing, China, 1999; pp. 1–11. [Google Scholar]
  57. Do, D.T.; Cheng, Y.; Shojai, A.; Chen, Y. Public park behaviour in Da Nang: An investigation into how open space is used. Front. Archit. Res. 2019, 8, 454–470. [Google Scholar] [CrossRef]
  58. Sharif, A.A. User activities and the heterogeneity of urban space: The case of Dahiyat Al Hussein park. Front. Archit. Res. 2020, 9, 837–857. [Google Scholar] [CrossRef]
  59. Sonti, N.F.; Campbell, L.K.; Svendsen, E.S.; Johnson, M.L.; Novem Auyeung, D.S. Fear and fascination: Use and perceptions of New York City’s forests, wetlands, and landscaped park areas. Urban For. Urban Green. 2020, 49, 126601. [Google Scholar] [CrossRef]
  60. Zhai, Y.J.; Baran, P.K.; Wu, C.Z. Can trail spatial attributes predict trail use level in urban forest park? An examination integrating GPS data and space syntax theory. Urban For. Urban Green. 2018, 29, 171–182. [Google Scholar] [CrossRef]
  61. Zhai, Y.J.; Baran, P.K.; Wu, C.Z. Spatial distributions and use patterns of user groups in urban forest parks: An examination utilizing GPS tracker. Urban For. Urban Green. 2018, 35, 32–44. [Google Scholar] [CrossRef]
  62. Hu, X.Y.; Shen, P.Y.; Shi, Y.; Zhang, Z.H. Using Wi-Fi probe and location data to analyze the human distribution characteristics of green spaces: A case study of the Yanfu Greenland Park, China. Urban For. Urban Green. 2020, 54, 126733. [Google Scholar] [CrossRef]
  63. Guan, P.; Xu, X.D.; Xu, N.; Wang, W. Analyses of the impact of built environment factors of small public green spaces on public health—A case study on the old city center of Nanjing, Jiangsu Province. Landsc. Archit. Front. 2020, 8, 76–92. [Google Scholar] [CrossRef]
  64. Jiang, J.Y.; Chen, M.; Zhang, J.H. Analyses of elderly visitors’ behaviors to community parks in Shanghai and the impact factors. Landsc. Archit. Front. 2020, 8, 94–109. [Google Scholar] [CrossRef]
  65. Zhai, Y.J.; Baran, P.K. Urban park pathway design characteristics and senior walking behavior. Urban For. Urban Green. 2017, 21, 60–73. [Google Scholar] [CrossRef]
  66. Zhai, Y.J.; Li, D.Y.; Wu, C.Z.; Wu, H.B. Urban park facility use and intensity of seniors’ physical activity—An examination combining accelerometer and GPS tracking. Landsc. Urban. Plan. 2021, 205, 103950. [Google Scholar] [CrossRef]
  67. Cohen, D.A.; Han, B.; Derose, K.P.; Williamson, S.; Marsh, T.; Raaen, L.; McKenzie, T.L. The paradox of parks in low-income areas: Park use and perceived threats. Environ. Behav. 2016, 48, 230–245. [Google Scholar] [CrossRef] [PubMed]
  68. Chen, F.F. The Summary Reviews of Chinese Garden History Studies. Master’s Thesis, Tianjin University, Tianjin, China, 2007. [Google Scholar]
  69. Zhang, T.T. The Summary Reviews of Chinese Garden History Studies (2006–2011). Master’s Thesis, Tianjin University, Tianjin, China, 2012. [Google Scholar]
  70. Gu, Z.X.; Zhang, Q.P. Research status and future trends of domestic studies on Suzhou classical gardens in the past two decades: Bibliometric analysis based on CNKI. Chin. Landsc. Archit. 2018, 34, 73–77. [Google Scholar]
  71. Jim, C.Y.; Chen, W.Y. Recreation–amenity use and contingent valuation of urban greenspaces in Guangzhou, China. Landsc. Urban. Plan. 2006, 75, 81–96. [Google Scholar] [CrossRef]
  72. Jim, C.Y.; Chen, W.Y. Leisure participation pattern of residents in a new Chinese city. Ann. Assoc. Am. Geogr. 2009, 99, 657–673. [Google Scholar] [CrossRef]
  73. Lin, Q.Q.; Zhang, L.; Wu, G.L. Study on Chen Congzhou’s gardening theory from construction process of East Garden in Tianyige Museum. Landsc. Archit. 2019, 36, 42–46. [Google Scholar] [CrossRef]
  74. Shi, Z.Q. A preliminary study on Tianyige garden. In Tianyi Pavilion Series, 10th ed.; Tianyige, M., Ed.; Zhejiang Ancient Books Publishing House: Hangzhou, China, 2012; pp. 224–228. [Google Scholar]
  75. Lai, D.L. 20th century aesthetic studies of the Chinese garden and the contributions of Chen Congzhou. Architect 2018, 16, 15–22. [Google Scholar]
  76. Gu, K. Tentative study on historiographical context of Chen Congzhou’s Chinese garden research: Correlation and comparison with Liu Dunzhen and Tong Jun. Architect 2019, 17, 66–72. [Google Scholar]
  77. Wu, X.Y. Comparison of differences between ancient and modern gardens. Chin. Landsc. Archit. 1999, 15, 64–65. [Google Scholar]
  78. Zhang, Y.Z.; Zhao, S.C. Spatial composition and pedestrian behavior characteristics in the traditional commercial streets of Lhasa, Tibet. J. Archit. Plann. AIJ 2018, 83, 45–54. [Google Scholar] [CrossRef] [Green Version]
  79. Lynch, K. The Image of the City; The MIT Press: Cambridge, MA, USA, 1960; pp. 46–72. [Google Scholar]
  80. Norberg-Schulz, C. Existence, Space & Architecture; Praeger: New York, NY, USA, 1971; pp. 17–27. [Google Scholar]
  81. Norberg-Schulz, C. Architecture: Presence, Language and Place; Skira: Milan, Italy, 2000; pp. 131–158. [Google Scholar]
  82. Ashihara, Y. Exterior Design in Architecture; Van Nostrand Reinhold Company: New York, NY, USA, 1981; pp. 42–50. [Google Scholar]
  83. Li, X. Research on the Contemporary Open Space of Zhongguancun West Zone of Beijing. Master’s Thesis, Tsinghua University, Beijing, China, 2011. [Google Scholar]
  84. Gehl, J. Life between Buildings: Using Public Space; Van Nostrand Reinhold Company: New York, NY, USA, 1987; pp. 155–162. [Google Scholar]
  85. Hillier, B.; Burdett, R.; Peponis, J.; Penn, A. Creating life: Or, does architecture determine anything? Archit. Comport./Archit. Behav. 1987, 3, 233–250. [Google Scholar]
  86. Kruger, M.J.T. On node and axial grid maps: Distance measures and related topics. In Proceedings of the European Conference on the Representation and Management of Urban Change, Cambridge, UK, 28–29 September 1989; pp. 1–34. [Google Scholar]
  87. Tianyige Museum. 2017 Visitor Survey Report of Tianyige Museum. Available online: http://www.tianyige.com.cn/news/notice/67a39924fefaa3326a8583ebc0b6cea3 (accessed on 24 August 2021).
  88. Tianyige Museum. 2018 Visitor Survey Report of Tianyige Museum. Available online: http://www.tianyige.com.cn/news/notice/22c6d704c499ca3bee2ce2112c9c2634 (accessed on 24 August 2021).
  89. Tianyige Museum. 2019 Visitor Survey Report of Tianyige Museum. Available online: http://www.tianyige.com.cn/news/notice/3bc241182db59f8cc323c1dc7eca83a3 (accessed on 24 August 2021).
  90. Tianyige Museum. 2020 Visitor Survey Report of Tianyige Museum. Available online: http://www.tianyige.com.cn/news/notice/8a59b3e992f1a824e231f6ee08480b22 (accessed on 24 August 2021).
  91. Tianyige Museum. Official App of Tianyige Museum: Version 1.9 for Android and version 2.9 for iOS. Available online: https://m.tyg.youwandao.com/download/ (accessed on 24 August 2021).
  92. Jia, J.P.; He, X.Q.; Jin, Y.J. Statistics, 7th ed.; China Renmin University Press: Beijing, China, 2018; pp. 67–88. [Google Scholar]
  93. Wen, Y.X. An Elementary Study on the Design of the Space of Verandas. Master’s Thesis, Southeast University, Nanjing, China, 2004. [Google Scholar]
  94. Zhang, X.Y. A Study on Design Theories of Traditional Chinese Garden-Passageway. Ph.D. Thesis, Beijing Forestry University, Beijing, China, 2007. [Google Scholar]
  95. Tang, Z. Research on Passageway Space Quantization Characteristic in Jiangnan Private Gardens. Master’s Thesis, Nanjing Agricultural University, Nanjing, China, 2009. [Google Scholar]
  96. Liu, J.H.; Yu, Y.F. Quantification study on space elements of Tianyige garden. J. Mt. Agric. Biol. 1999, 18, 167–170. [Google Scholar] [CrossRef]
  97. Ji, C. The Explanation of Yuan Ye, 2nd ed.; Chen, Z., Ed.; China Architecture & Building Press: Beijing, China, 1988; pp. 71–72. [Google Scholar]
  98. Pan, G.X. The problems of the layout of Suzhou gardens. J. Southeast Univ. 1963, 5, 45–65. [Google Scholar]
  99. Gu, K. Study on Gardens of Jiangnan Area in Ming Dynasty: Garden Ideas and Gardening Practices. Ph.D. Thesis, Southeast University, Nanjing, China, 2008. [Google Scholar]
  100. Ding, S.G.; Lu, P.; Liu, Y.Y.; Cheng, S. Stationary point method applied in spatial analysis on Chinese gardens: Taking an example of the Master of Nets Garden. J. Nanjing Agric. Univ. 2017, 40, 998–1006. [Google Scholar] [CrossRef]
  101. Ding, S.G.; Yang, Y.; Liu, Y.Y.; Niu, Y.; Lu, P. Study on regularities of stationary points distribution in Liu Garden based on visitors’ tour behaviors. Chin. Landsc. Archit. 2018, 34, 116–122. [Google Scholar]
  102. Senda, M.; Takagi, M.; Ogawa, K. Ro-space in the Chinese classical garden: Focused on the users’ understanding and their actions. J. Archit. Plan. Environ. Eng. Trans. AIJ 2001, 66, 261–267. [Google Scholar] [CrossRef]
  103. Ren, L.D.; Takagi, M.; Senda, M. Ro-space in the Chinese imperial garden analyzed by the users’ stay. J. Jpn. Inst. Landsc. Archit. 2005, 68, 421–424. [Google Scholar] [CrossRef] [Green Version]
  104. Shanghai Yuyuan Tourist Mart (Group) Co., Ltd. Annual Report of Yuyuan Inc. 2019. Available online: https://www.yuyuantm.com.cn/uploads/20200326161127/f.pdf (accessed on 24 August 2021).
  105. Yuan, F.F. Composition and Analysis of ‘Users’ of Tianyige. In Tianyi Pavilion Series, 11th ed.; Tianyige, M., Ed.; Zhejiang Ancient Books Publishing House: Hangzhou, China, 2013; pp. 165–167. [Google Scholar]
  106. Lv, H. Research on the Relationship between Recreation Activity and Space of the City Park. Ph.D. Thesis, Shandong Agricultural University, Taian, China, 2013. [Google Scholar]
  107. Su, M.M.; Wall, G. Residents’ use and perceptions of the Summer Palace world heritage site in Beijing, China. Int. J. Tour. Anthropol. 2014, 3, 357–369. [Google Scholar] [CrossRef]
  108. Su, M.M.; Wall, G. Exploring the shared use of world heritage sites: Residents and domestic tourists’ use and perceptions of the Summer Palace in Beijing. Int. J. Tourism Res. 2015, 17, 591–601. [Google Scholar] [CrossRef]
  109. Gu, X.S. Harmony between cultural heritage site and community: Taking the Mountain Resort in Chengde as an example. J. Hebei Norm. Univ. Natl. 2012, 32, 33–35. [Google Scholar] [CrossRef]
  110. Sun, Z.; Sun, S.W.; Li, C.C. Exploration of Park City: Connotation, concept and development. Chin. Landsc. Archit. 2021, 37, 14–17. [Google Scholar] [CrossRef]
  111. Ye, J.N.; Zhang, Y.; Wang, H. The new mode of the construction and development of Park City from the perspective of humanism in the new era. Chin. Landsc. Archit. 2021, 37, 24–28. [Google Scholar] [CrossRef]
Figure 1. Research structure and framework. Source: Own work.
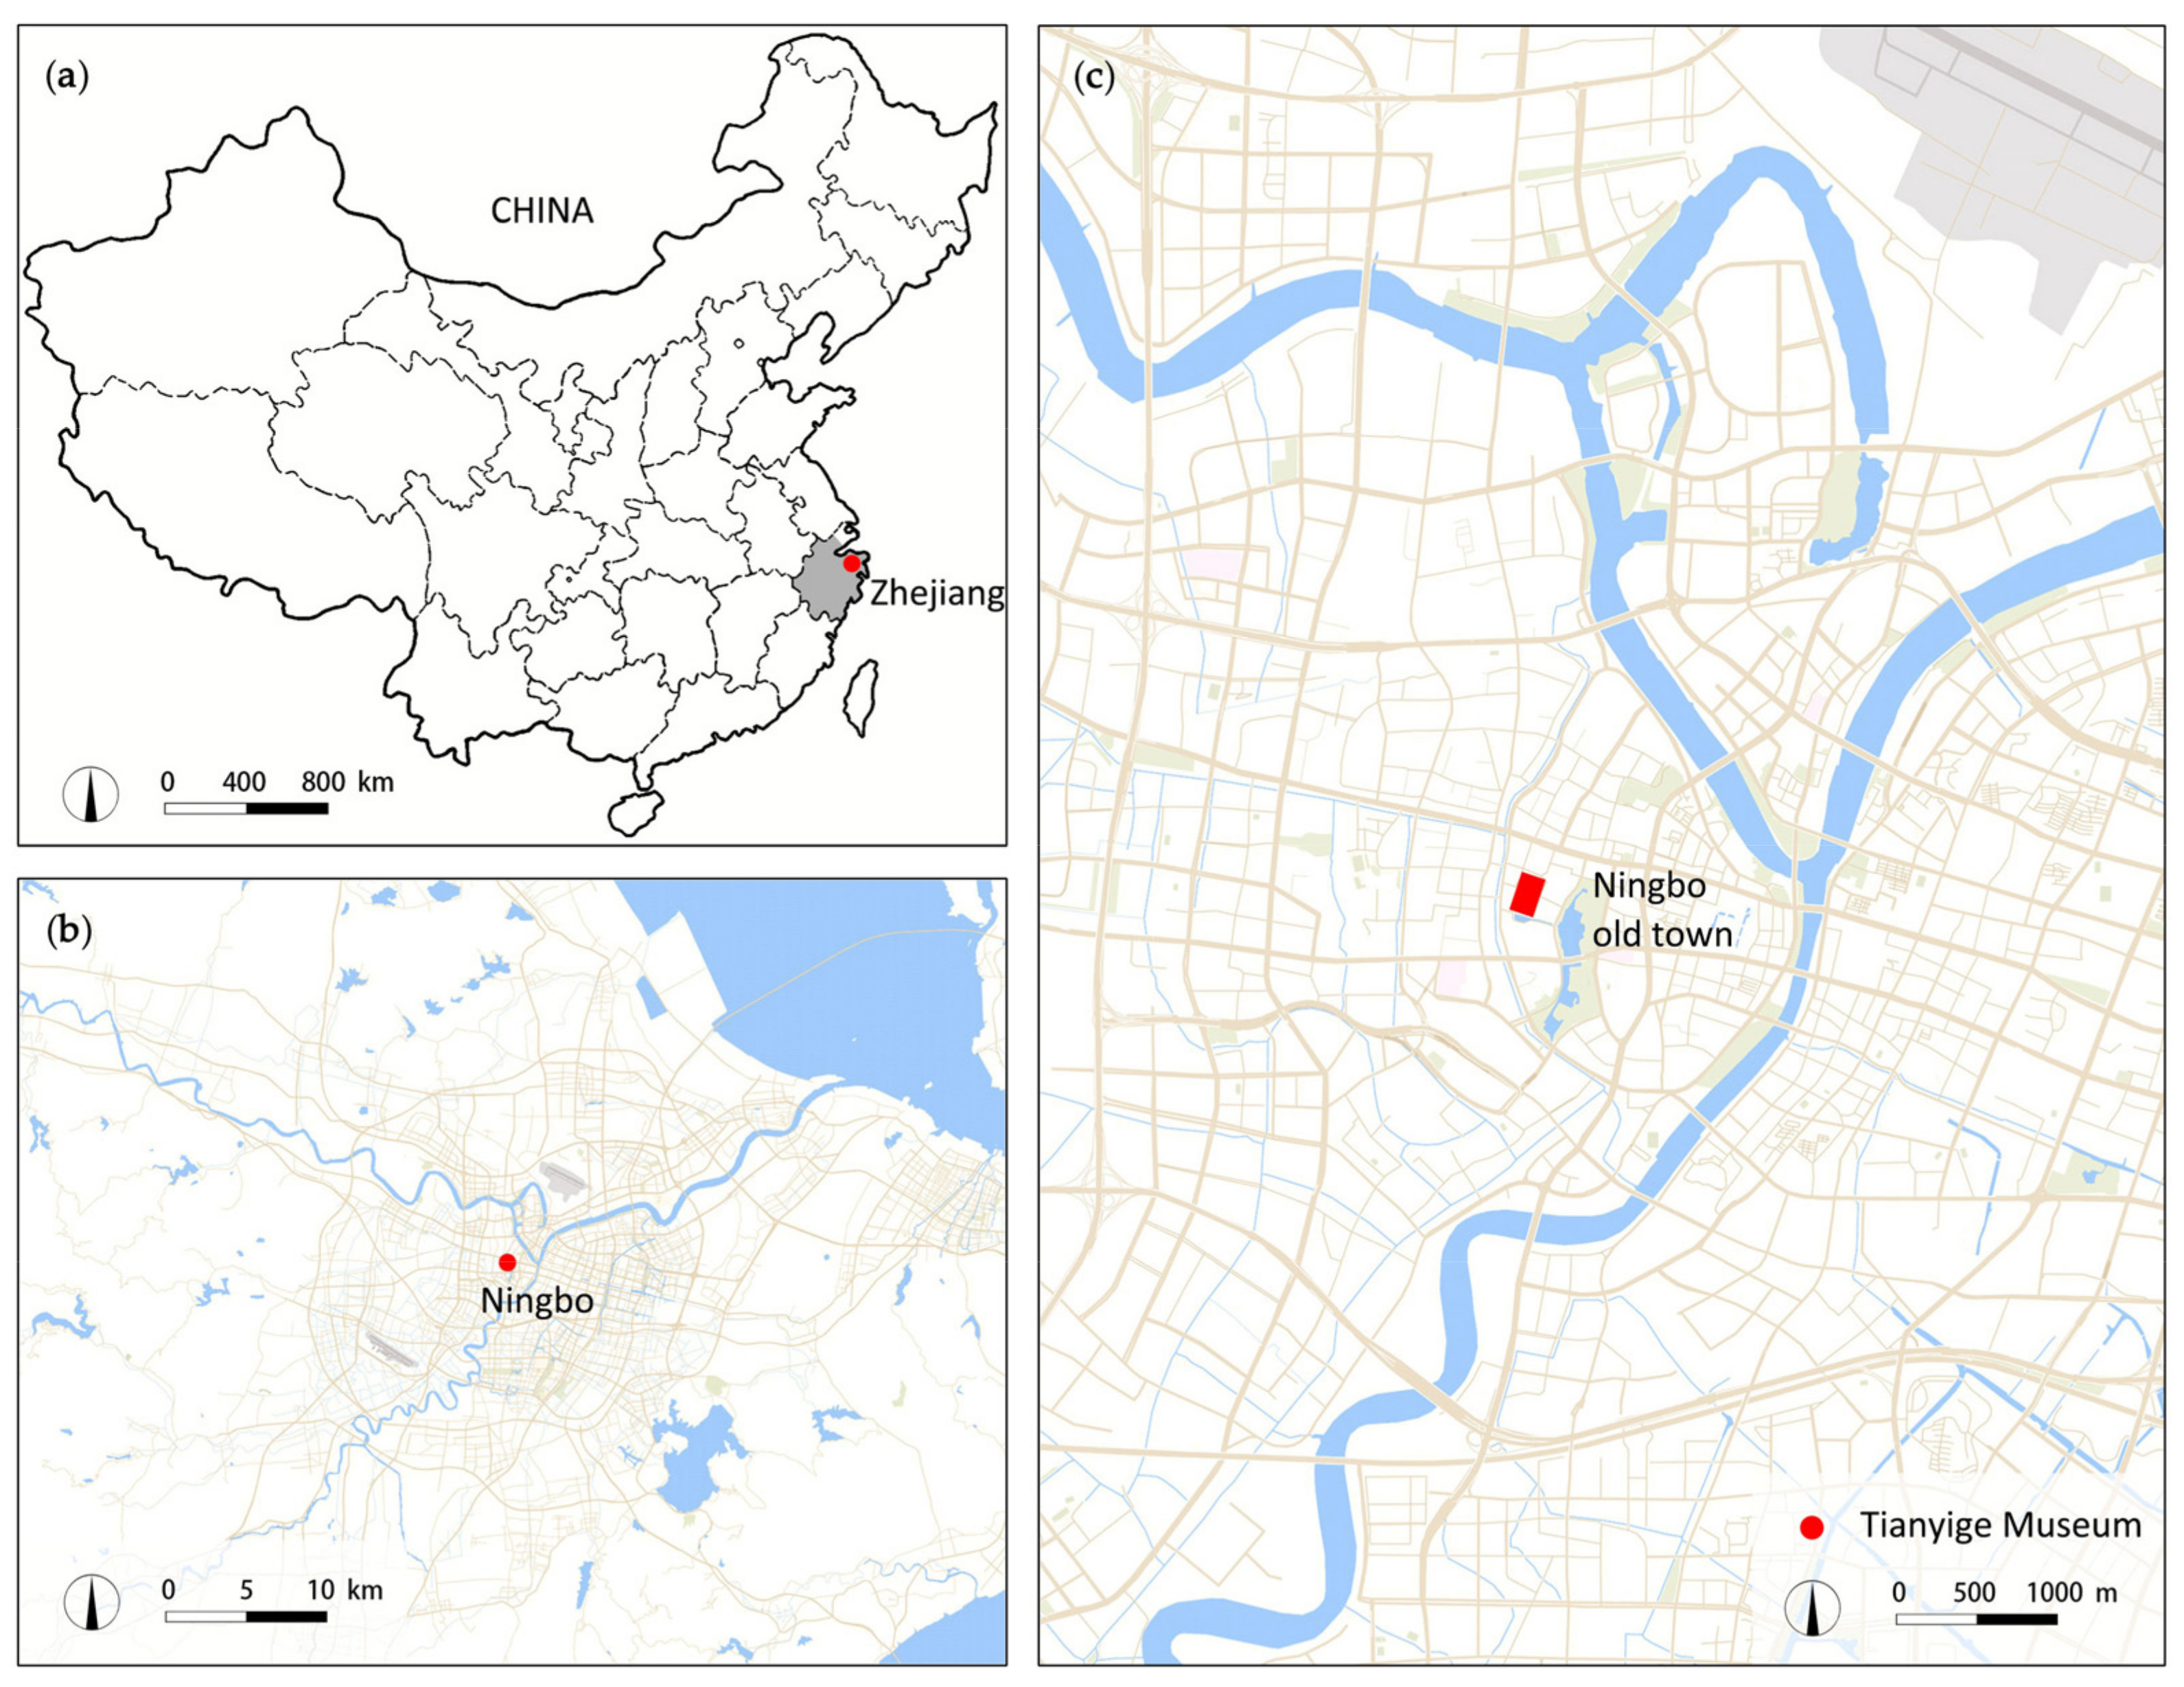
Urbansci 05 00074 g001
Figure 2. The location of the study area: (a) Zhejiang province in China; (b) Ningbo city in northeast Zhejiang province; (c) Tianyige Museum in Ningbo old town. Source: Own work.
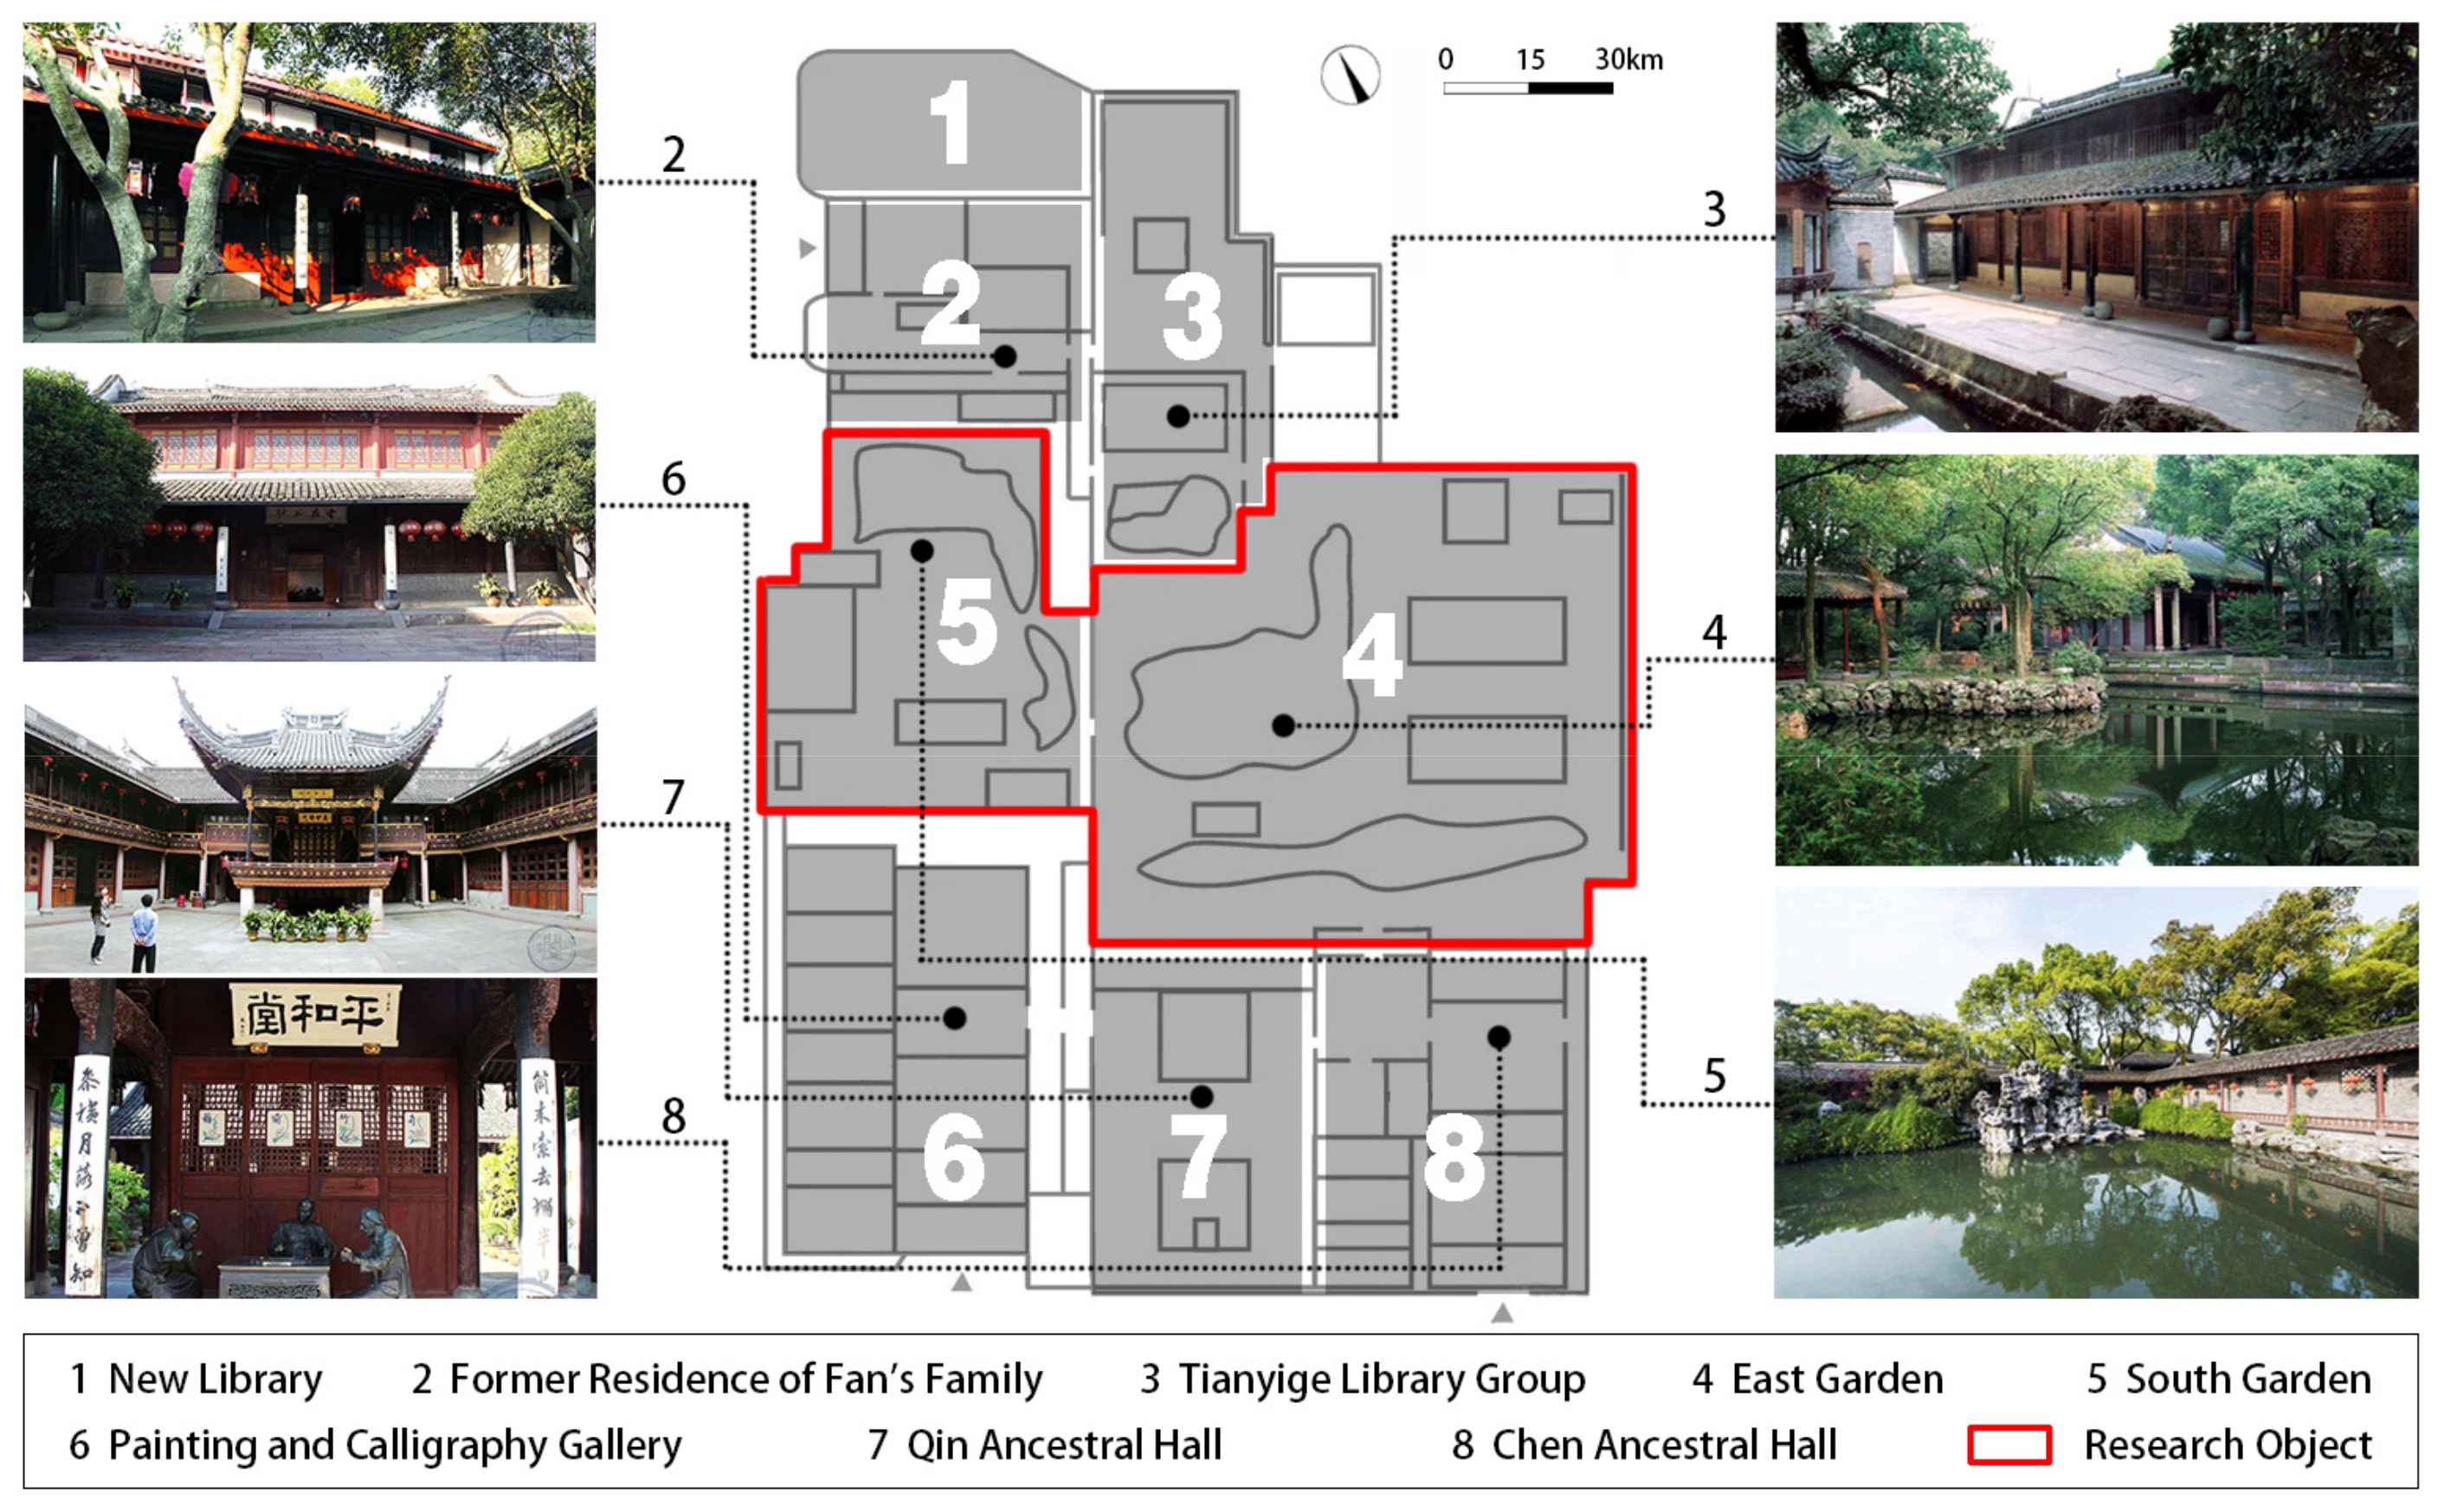
Urbansci 05 00074 g002
Figure 3. The site plan of Ningbo Tianyige Museum is composed of eight architecture and garden groups. The research object Tianyige garden includes East Garden (4) and South Garden (5). Source: Own work.
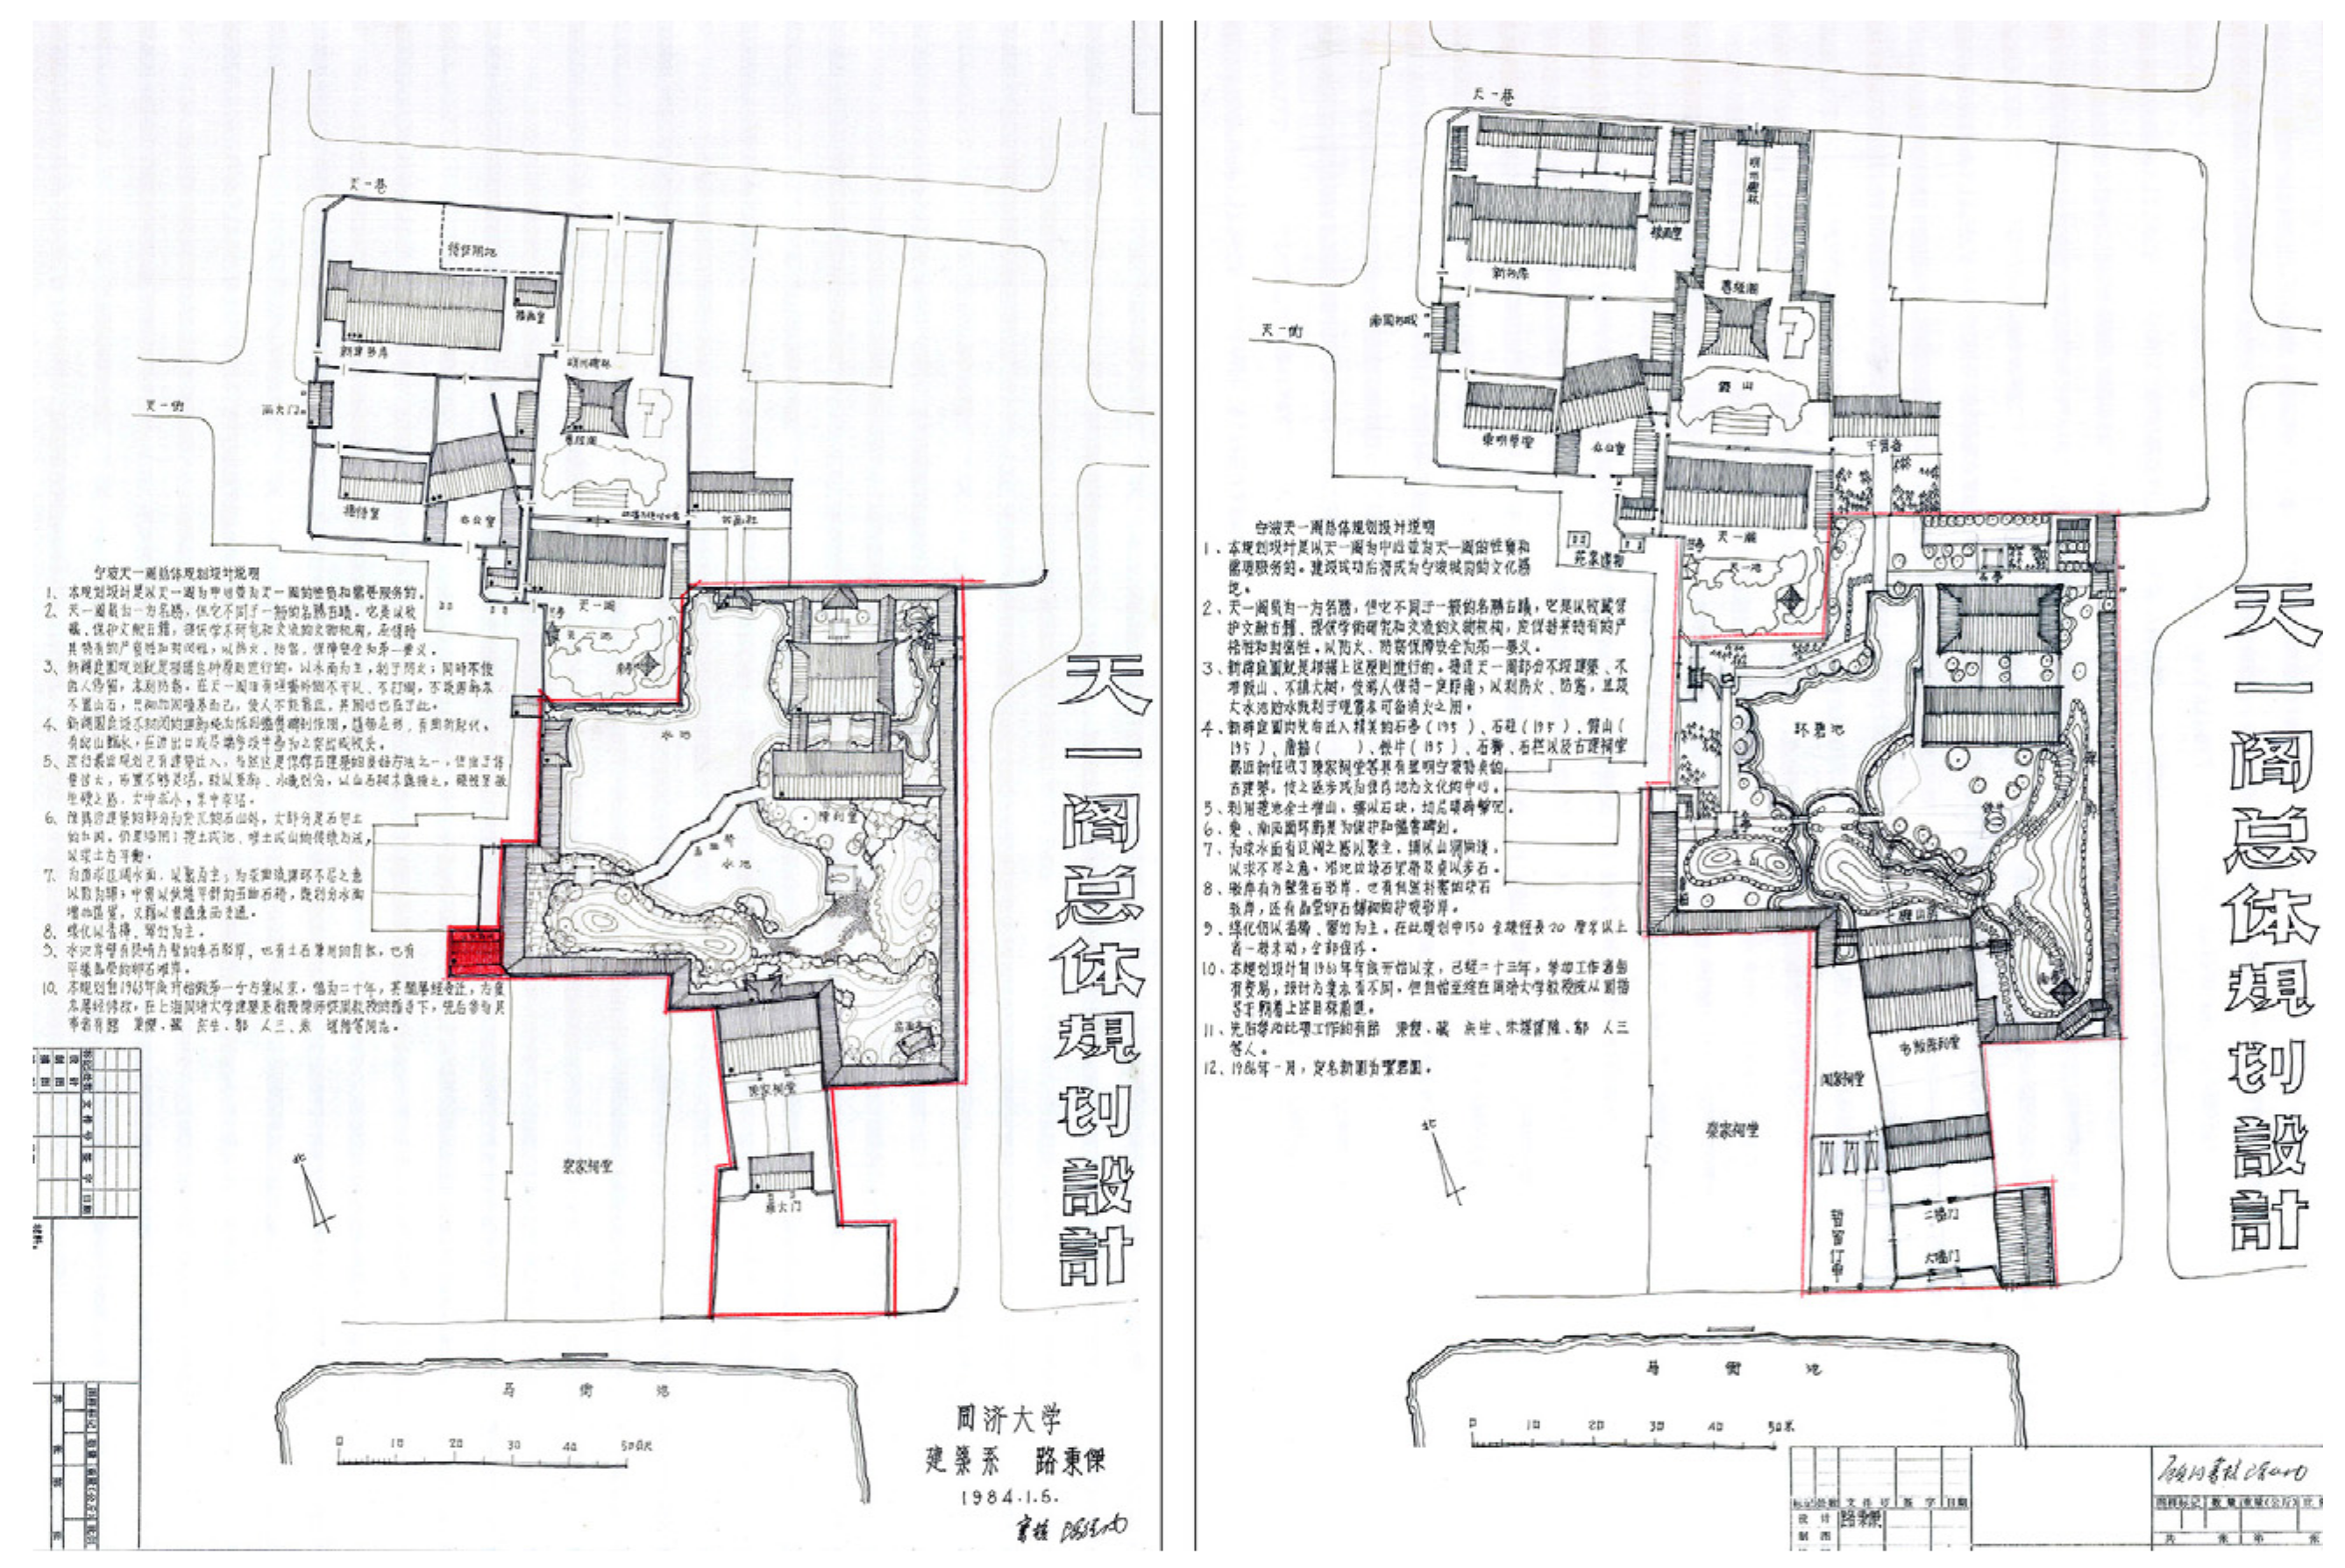
Urbansci 05 00074 g003
Figure 4. Design manuscripts of East Garden by Lu Bingjie and Chen Congzhou of Tongji University in 1984. English version of the Chinese title: Overall Planning and Design of the Tianyige Museum. Source: Tianyige Museum. Adapted with permission from Ningbo Tianyige Museum (2021) The designer of this picture is Chinese, and the original version is only in Chinese.
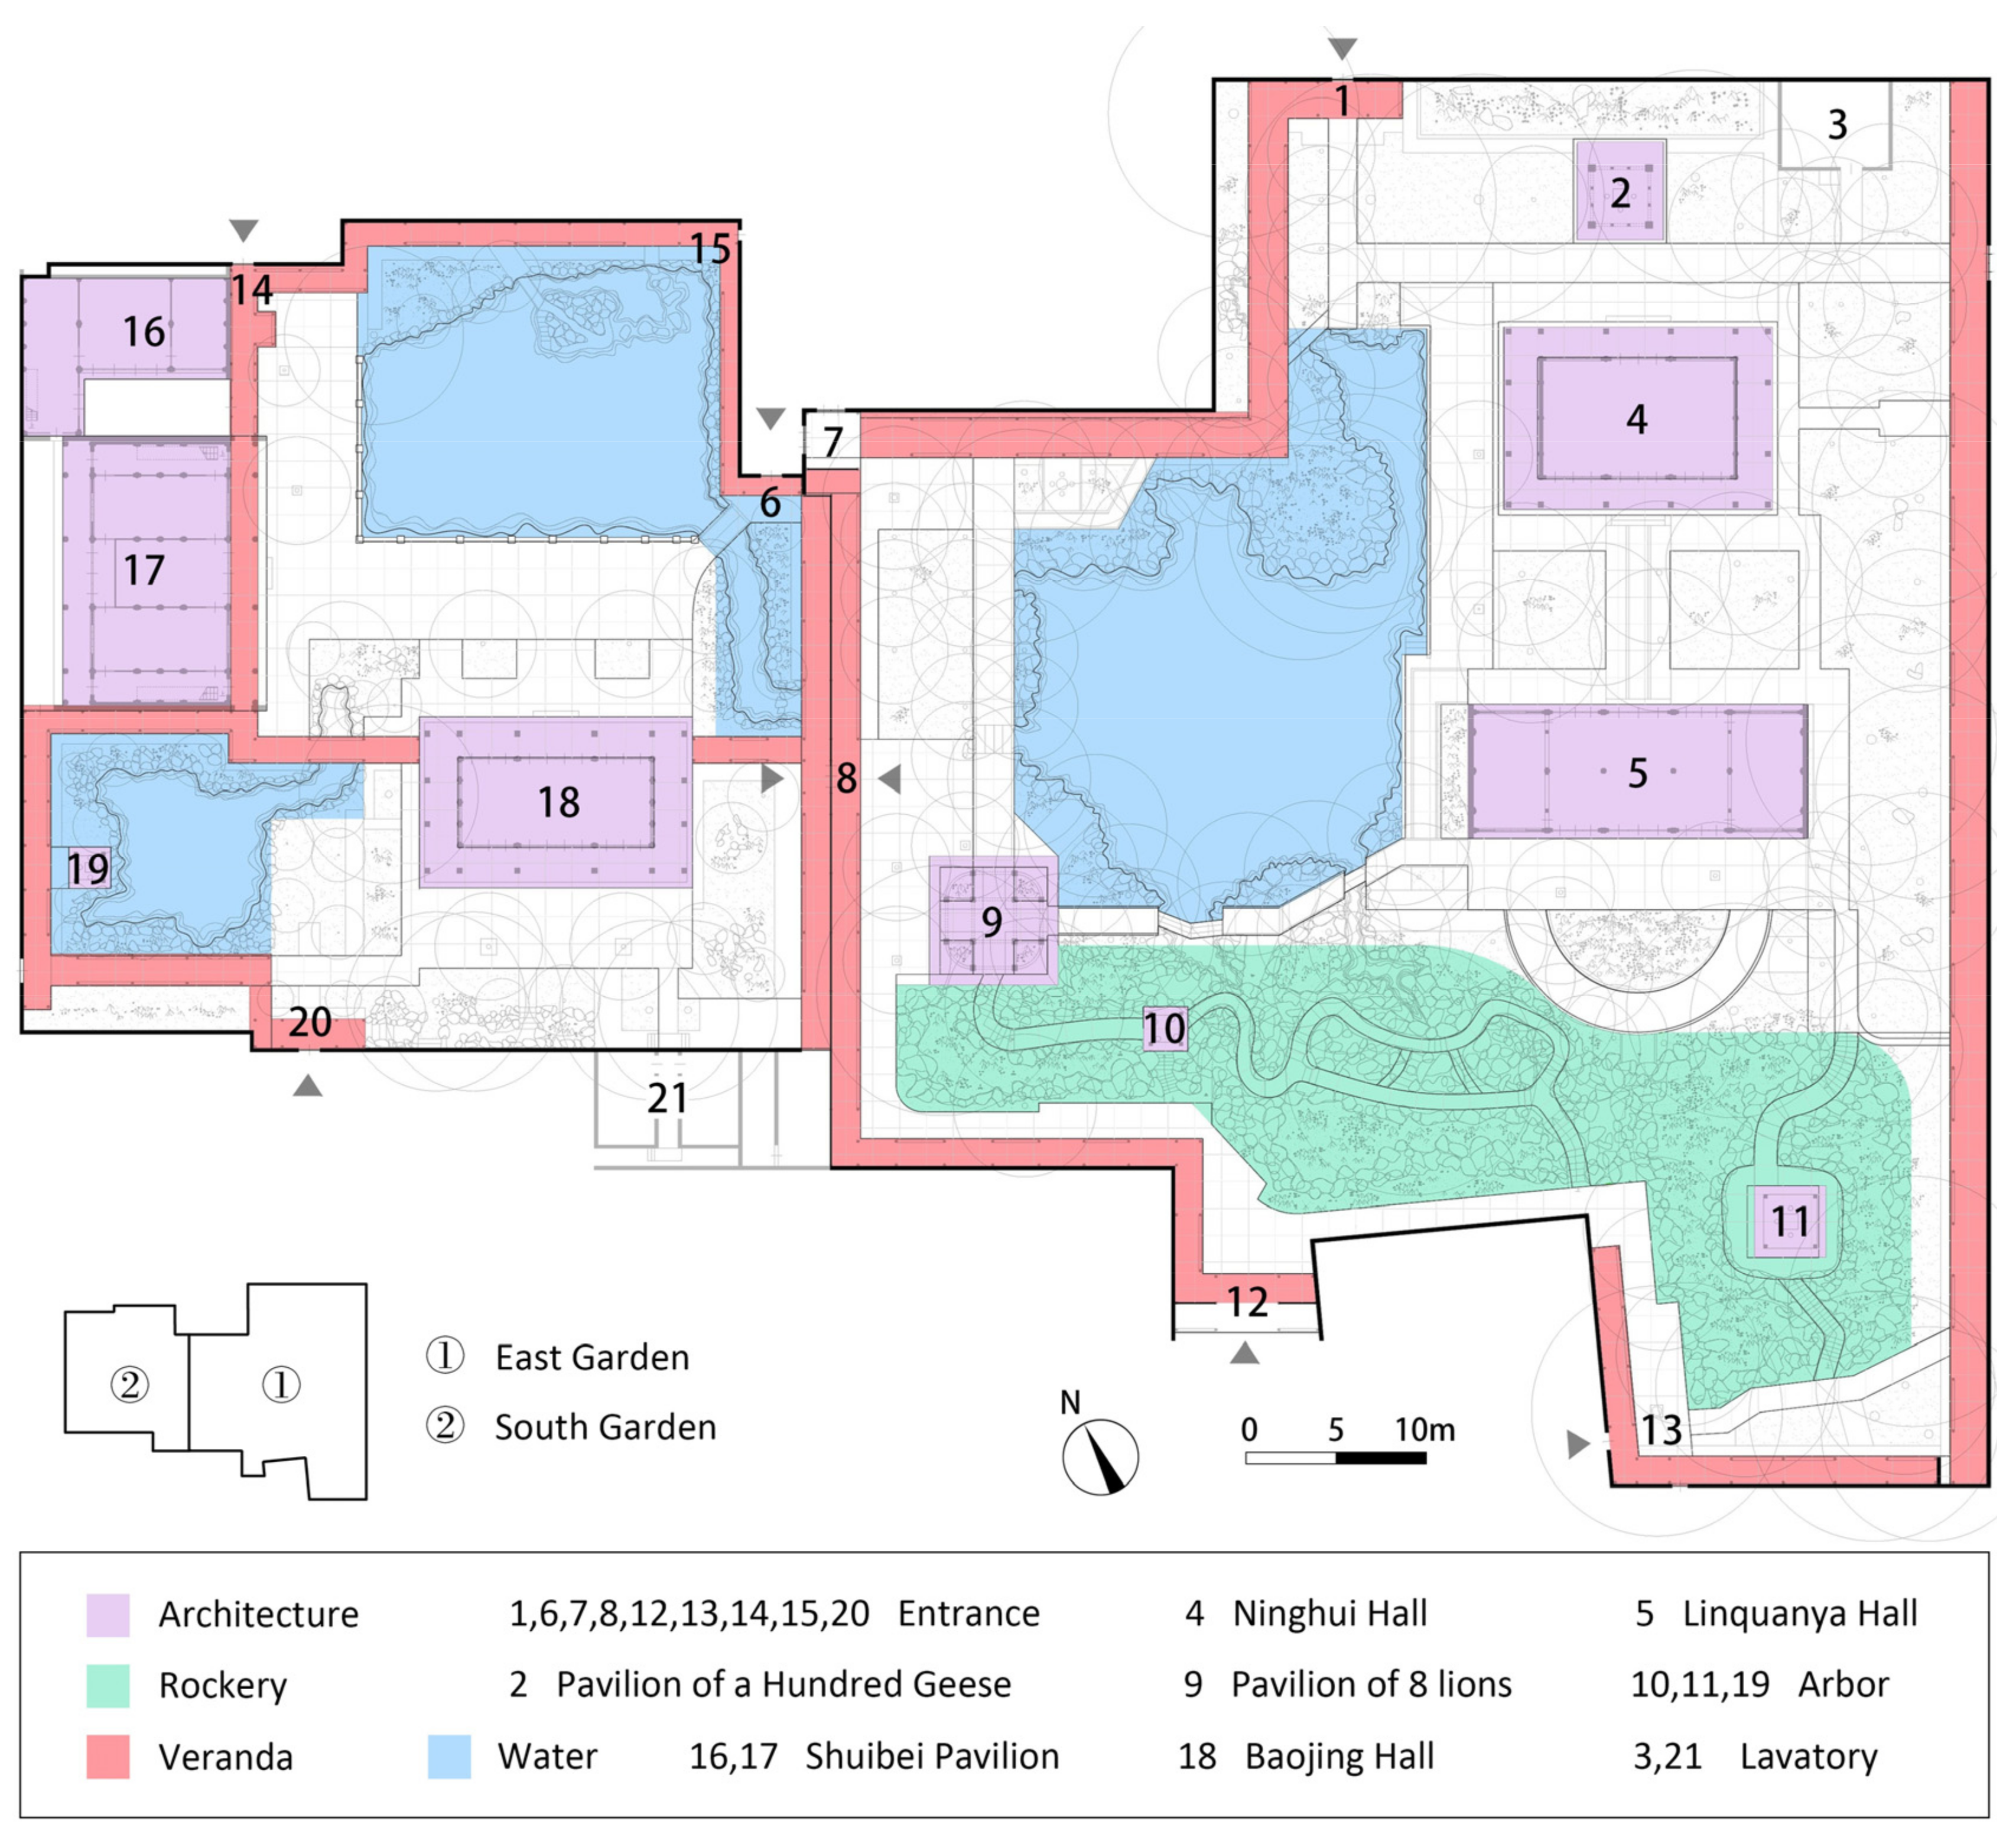
Urbansci 05 00074 g004
Figure 5. Plan of Tianyige garden with garden elements. Sequence number from 1 to 21. Source: Own work.
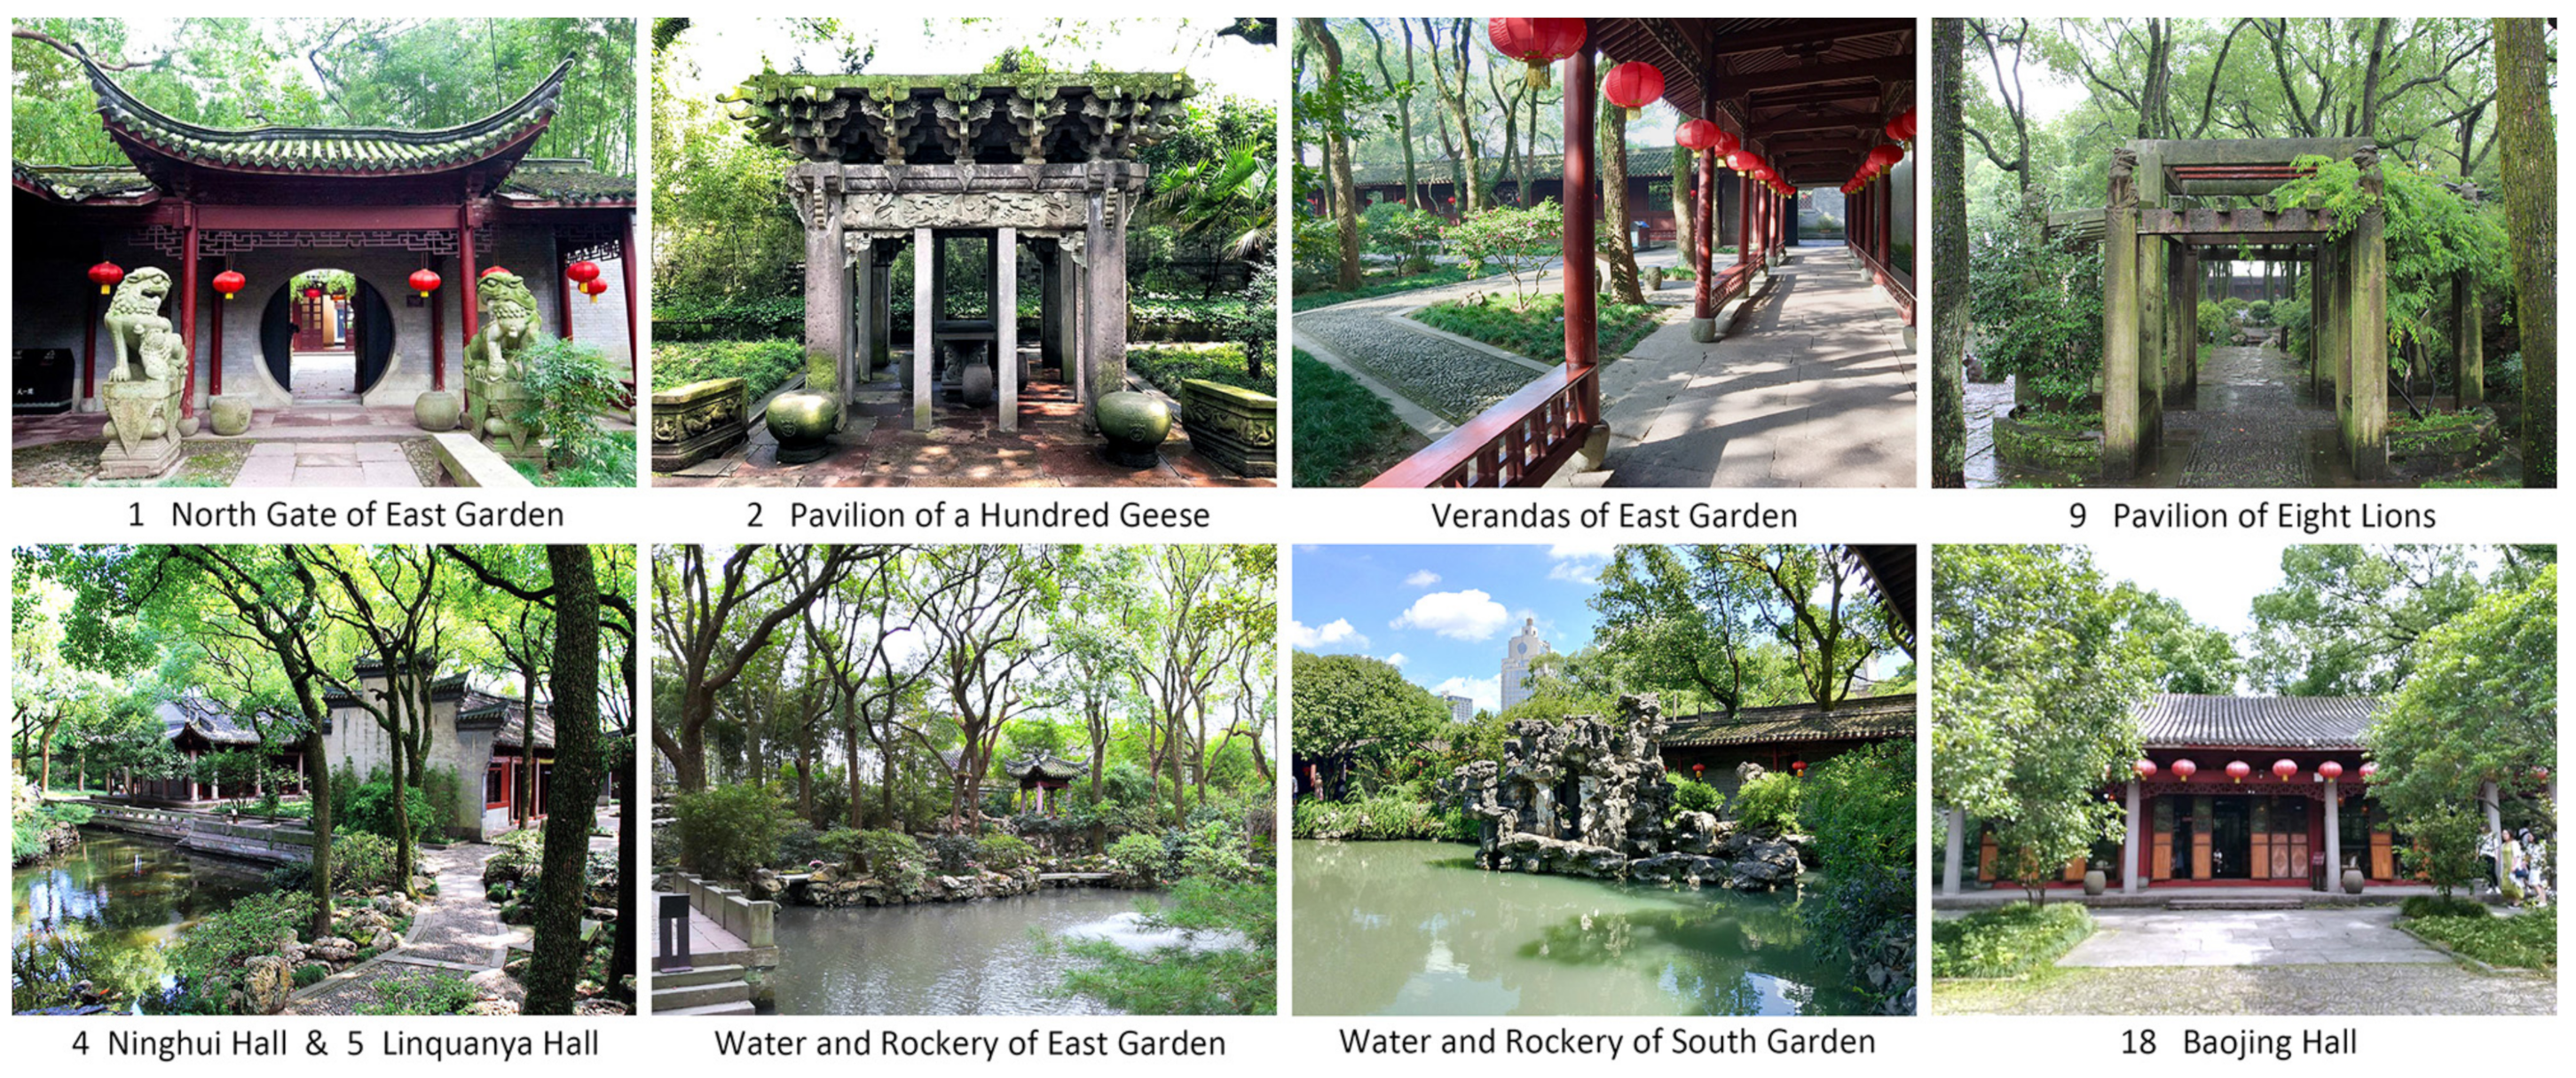
Urbansci 05 00074 g005
Figure 6. Illustrations of main garden elements in Tianyige garden. Sequence numbers corresponding the elements in Figure 5. Source: Own work.
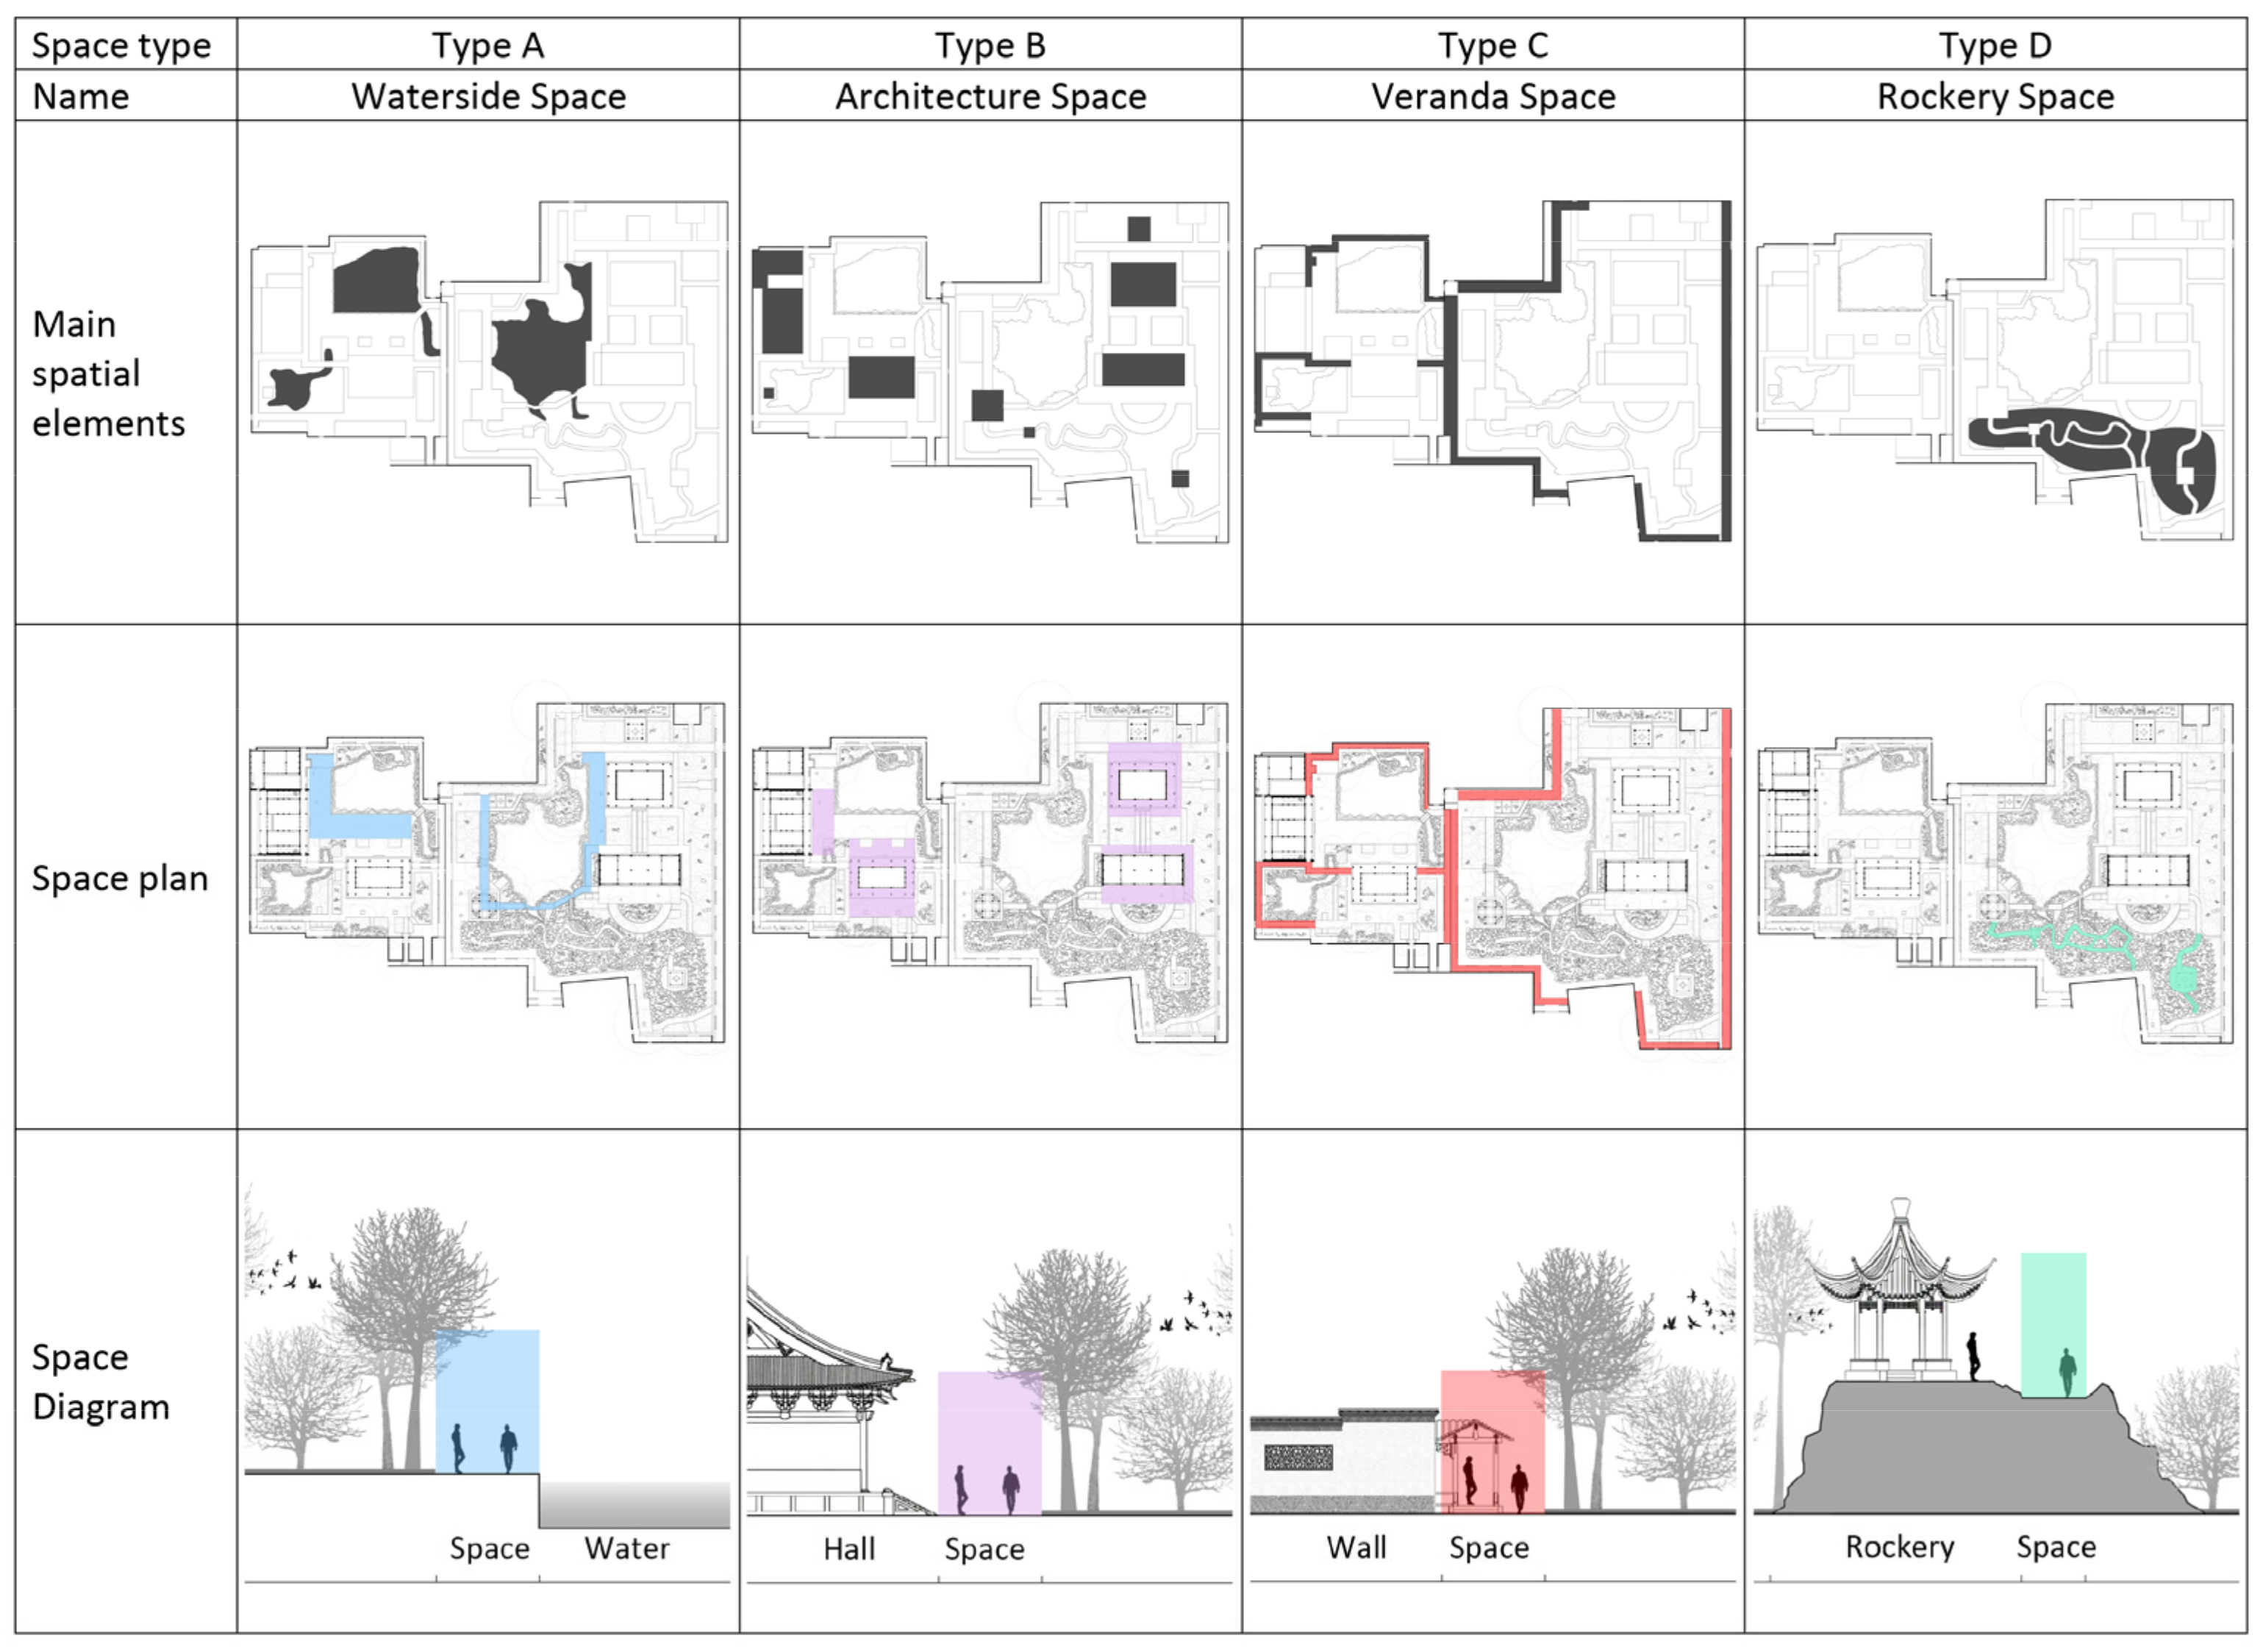
Urbansci 05 00074 g006
Figure 7. Classification of accessible open garden space according to the four main spatial elements, with spatial elements plans, space plans and diagrams. Source: Own work.
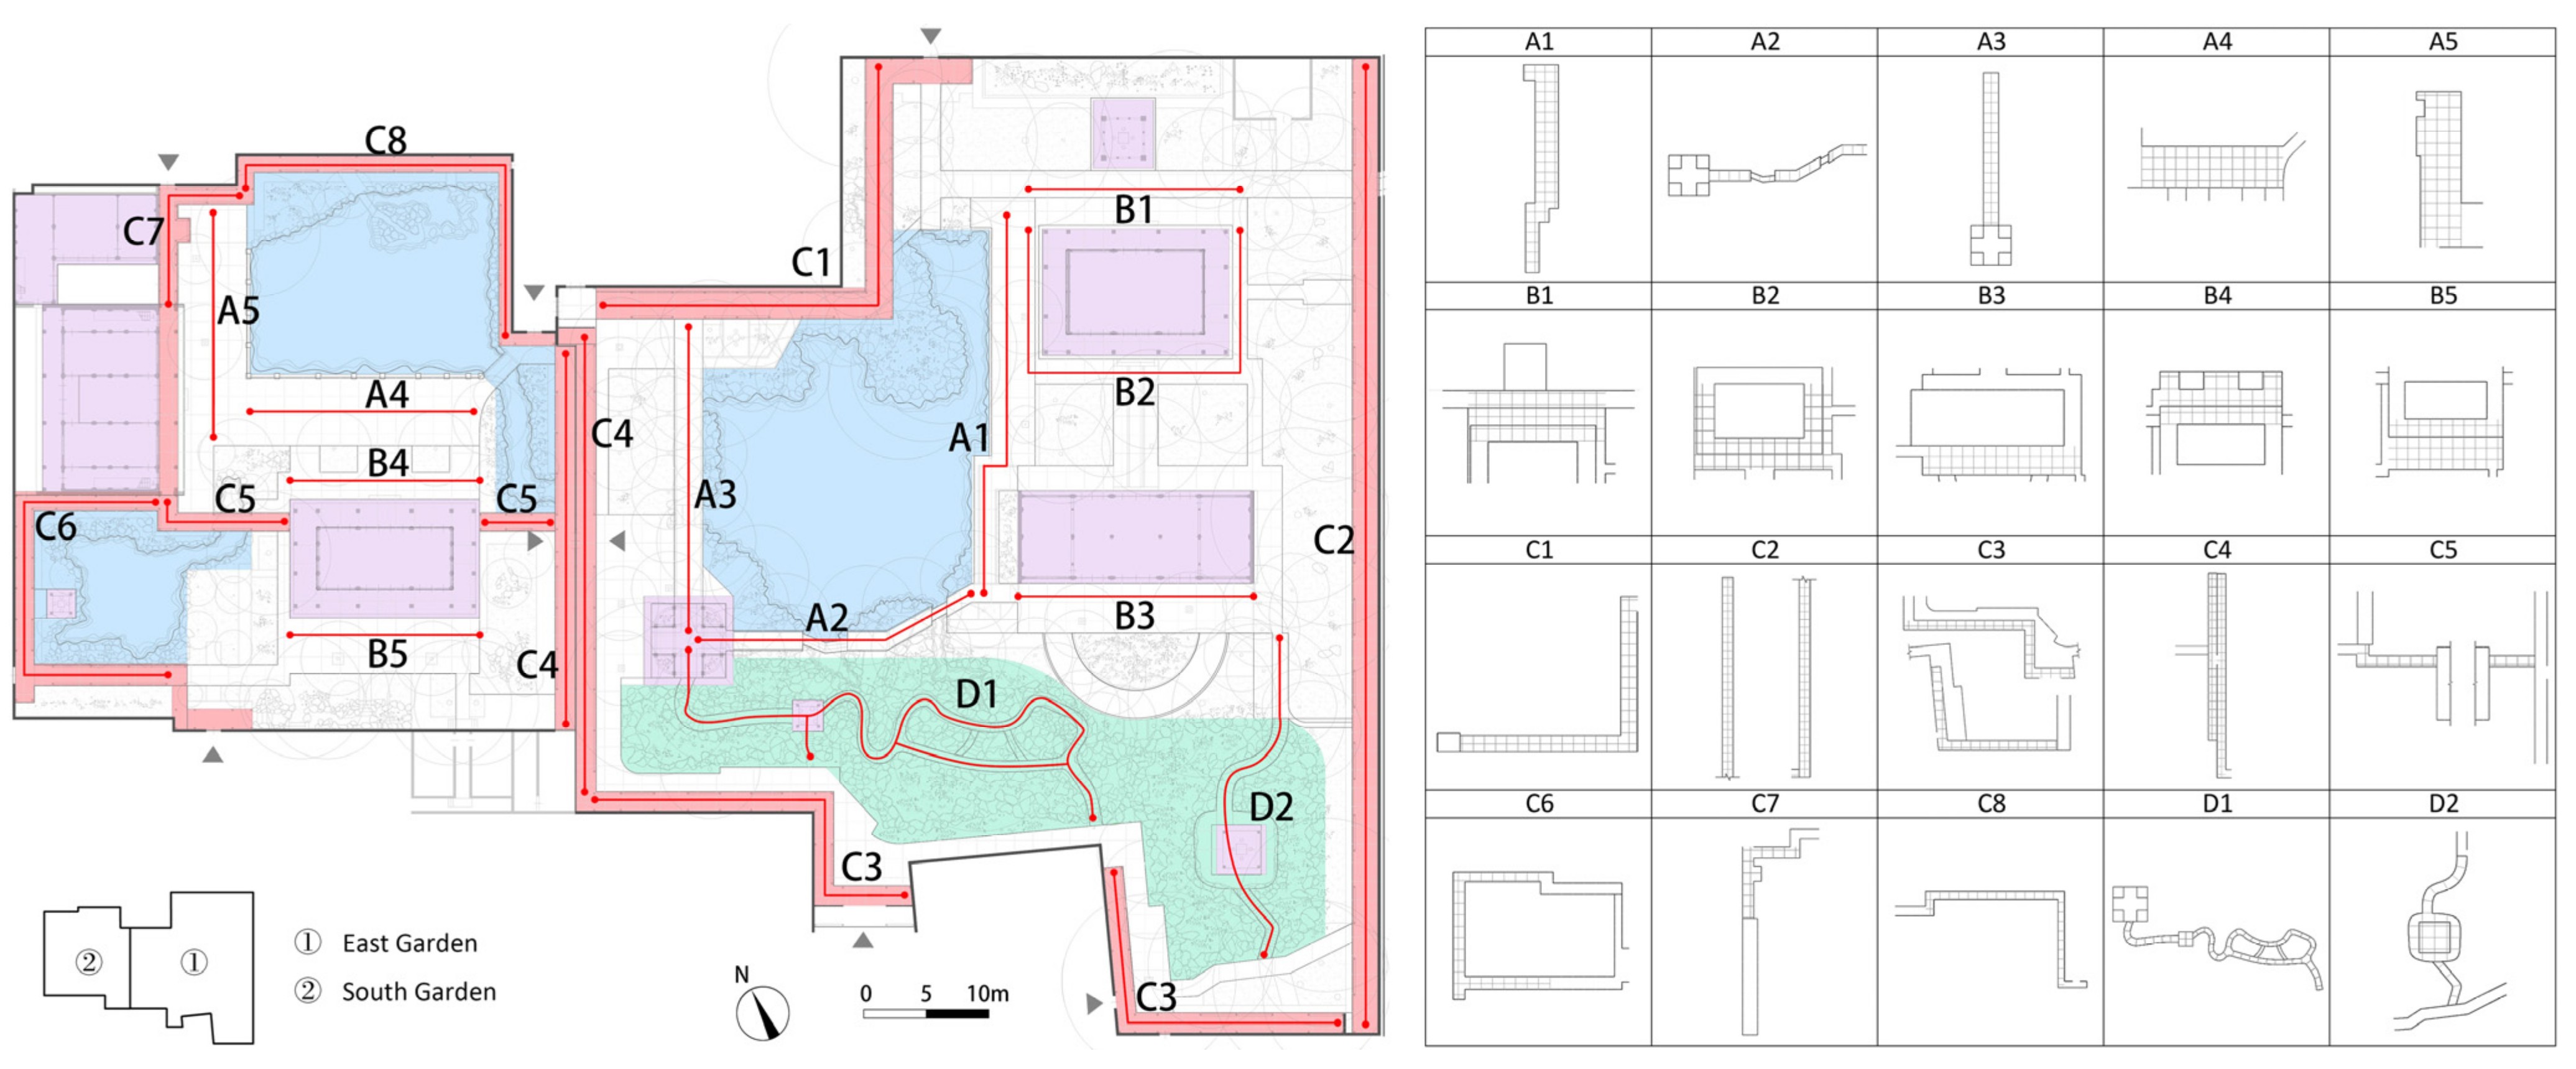
Urbansci 05 00074 g007
Figure 8. Plans of twenty garden units of four types in Tianyige garden, with 1.5-m square grids. Source: own work.
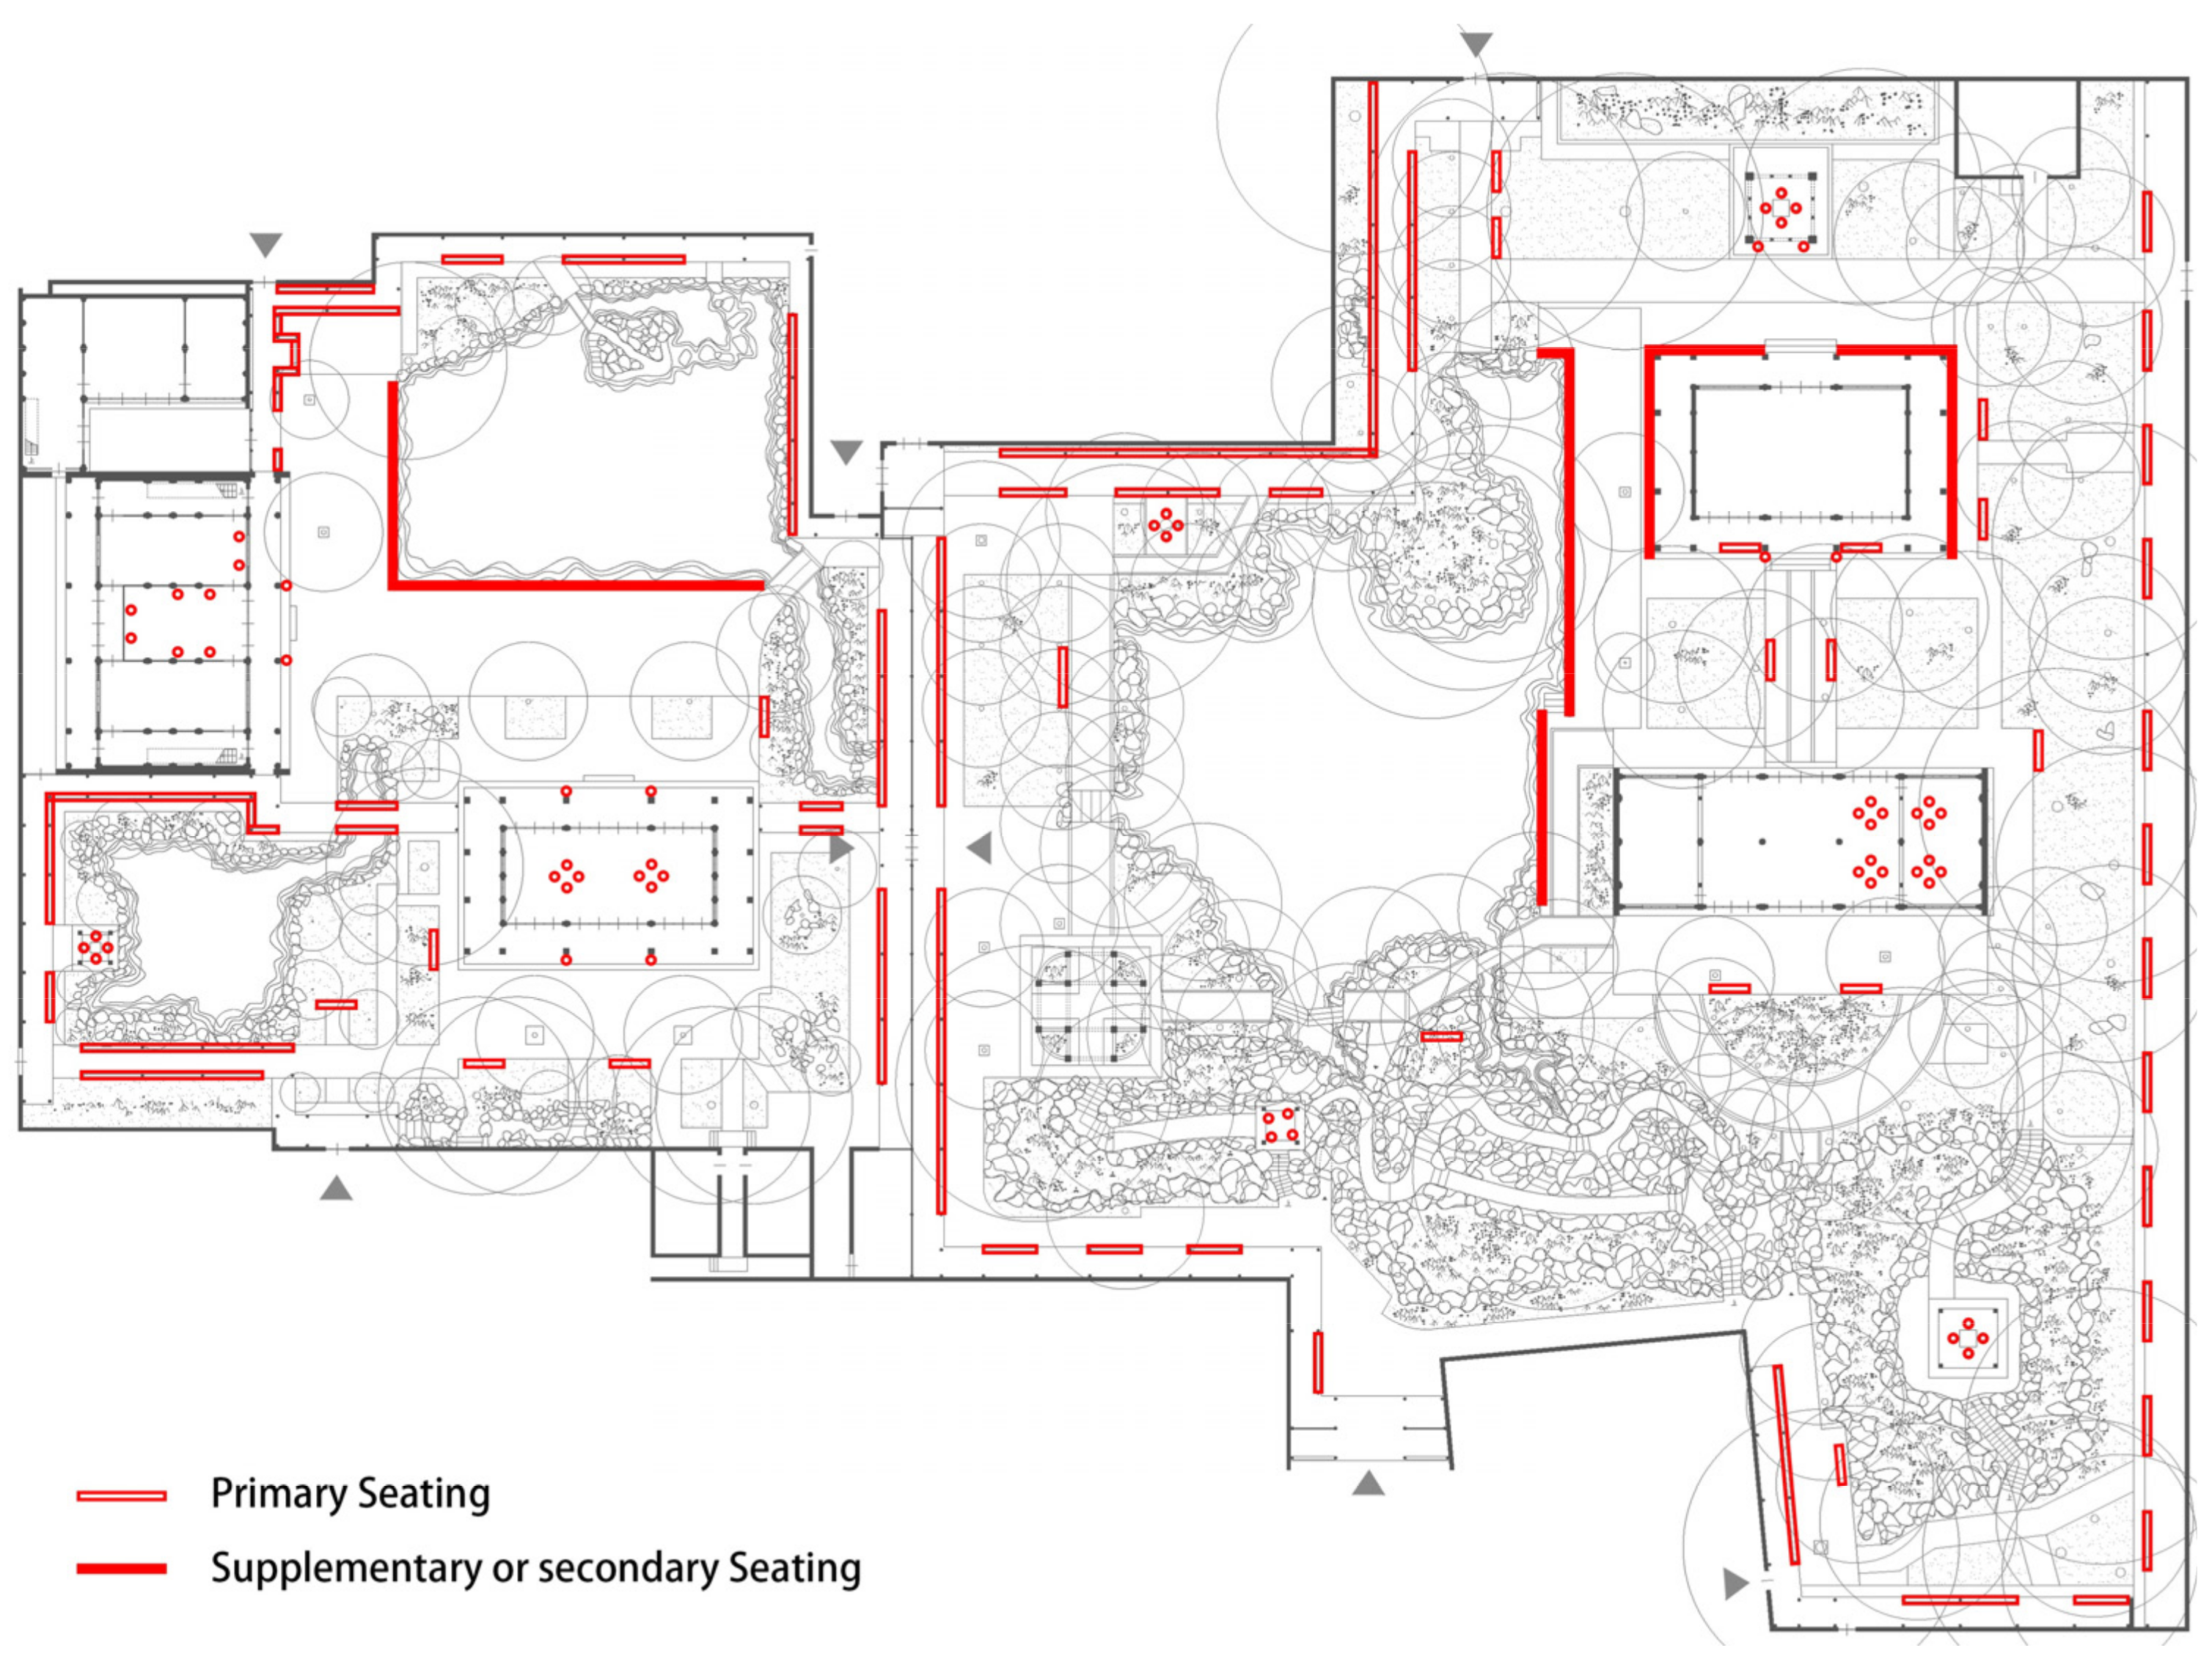
Urbansci 05 00074 g008
Figure 9. Seating plan of Tianyige garden, containing primary seating and supplementary or secondary seating. Source: Own work.
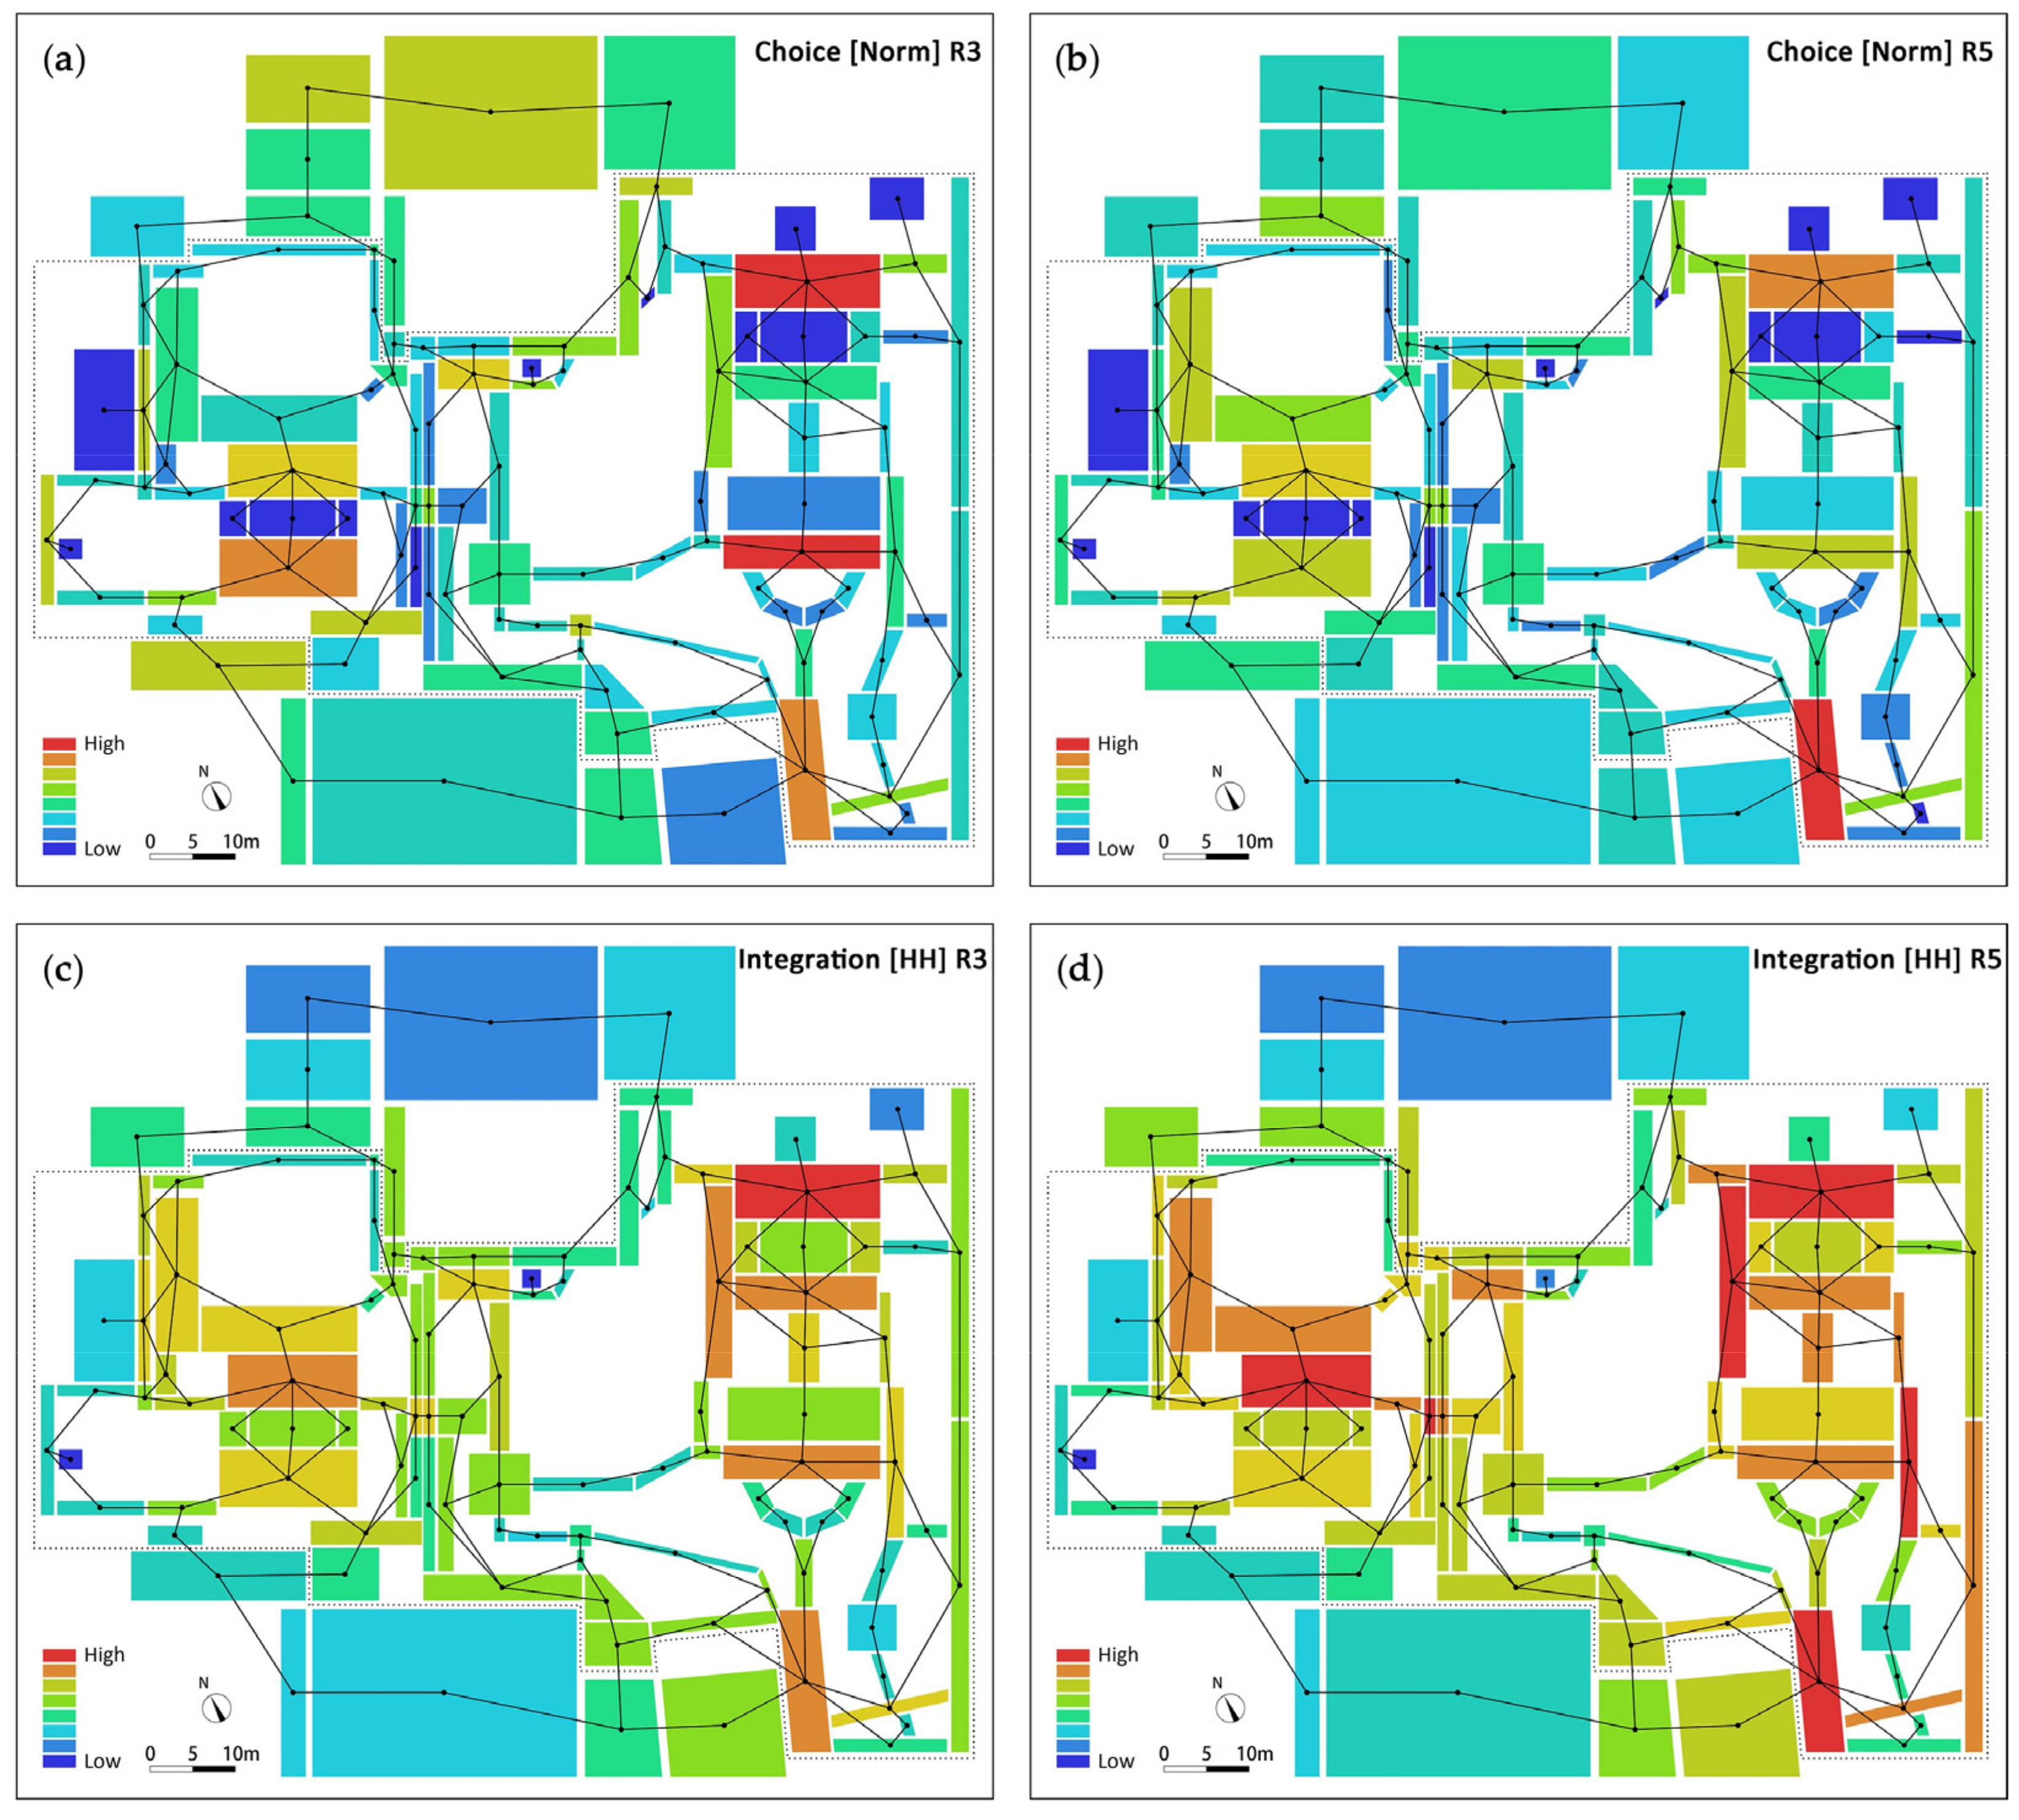
Urbansci 05 00074 g009
Figure 10. Convex map calculations of Tianyige garden: (a) Choice [Norm] with a radius of 3; (b) Choice [Norm] with a radius of 5; (c) Integration [HH] with a radius of 3; (d) Integration [HH] with a radius of 5. Source: Own work.
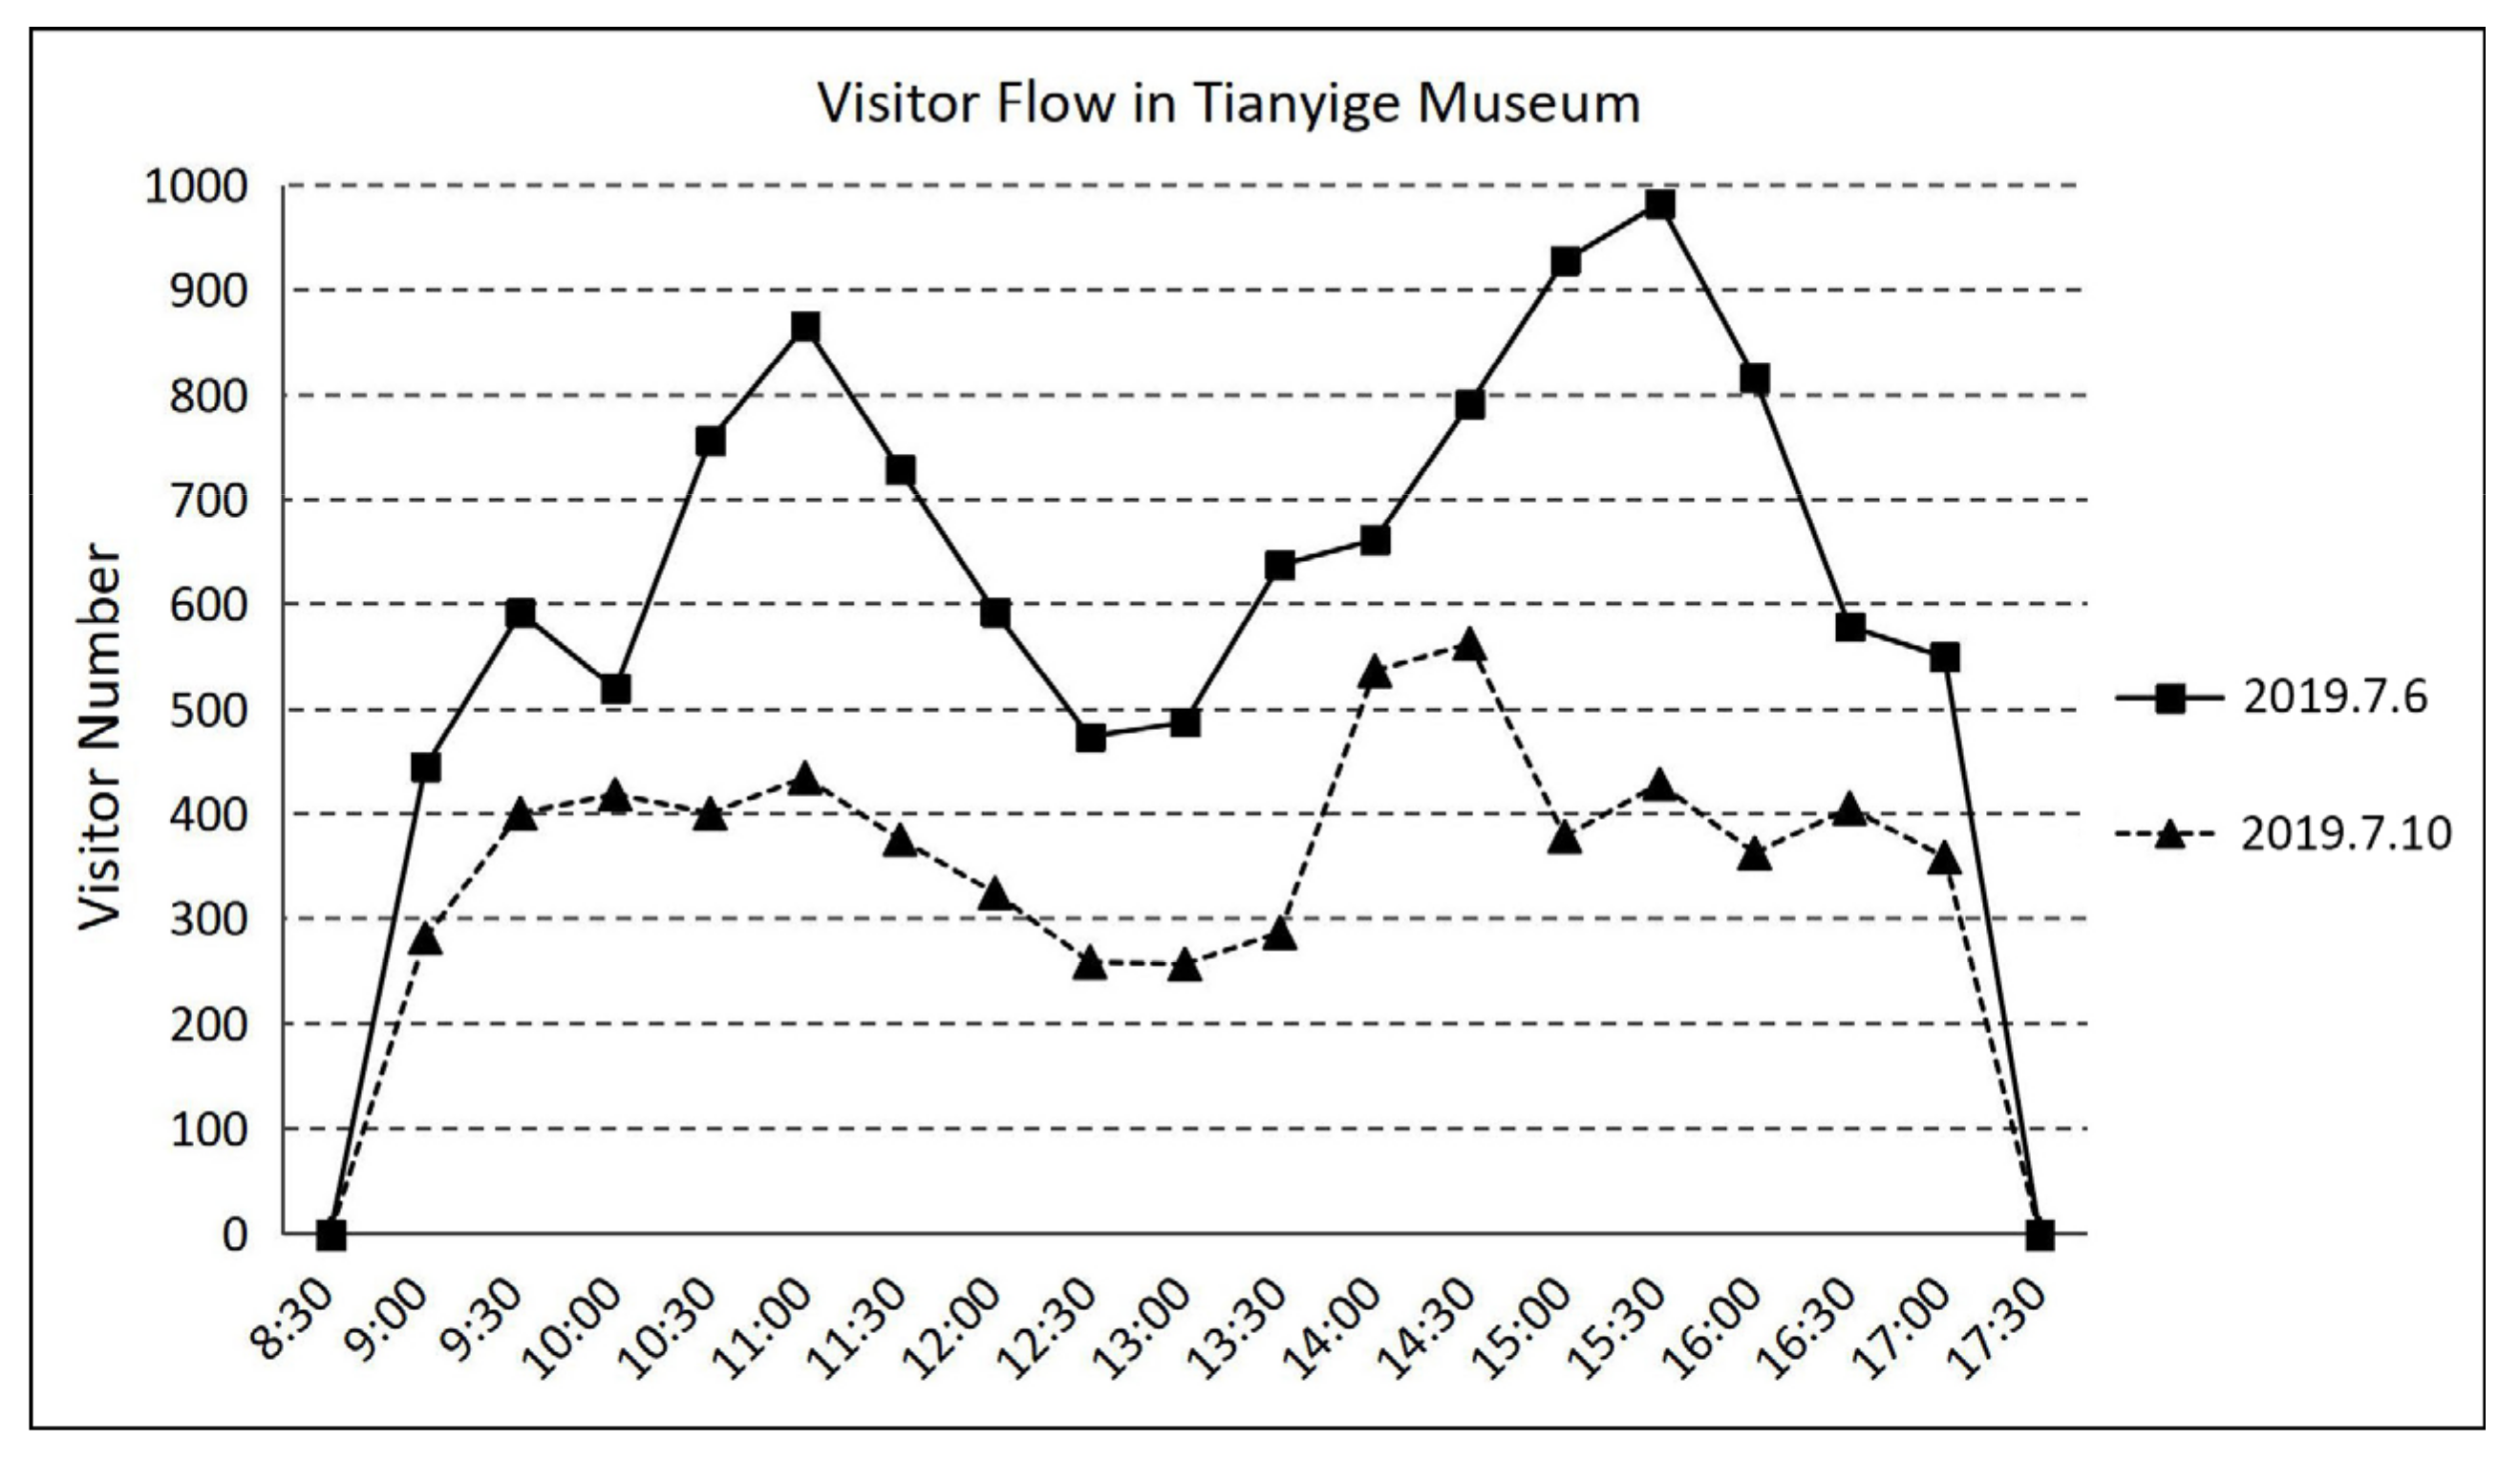
Urbansci 05 00074 g010
Figure 11. Visitor flow in Tianyige Museum on 6 July (Saturday), and 10 July (Wednesday), 2019. Data source: Tianyige Museum, author’s drawing.
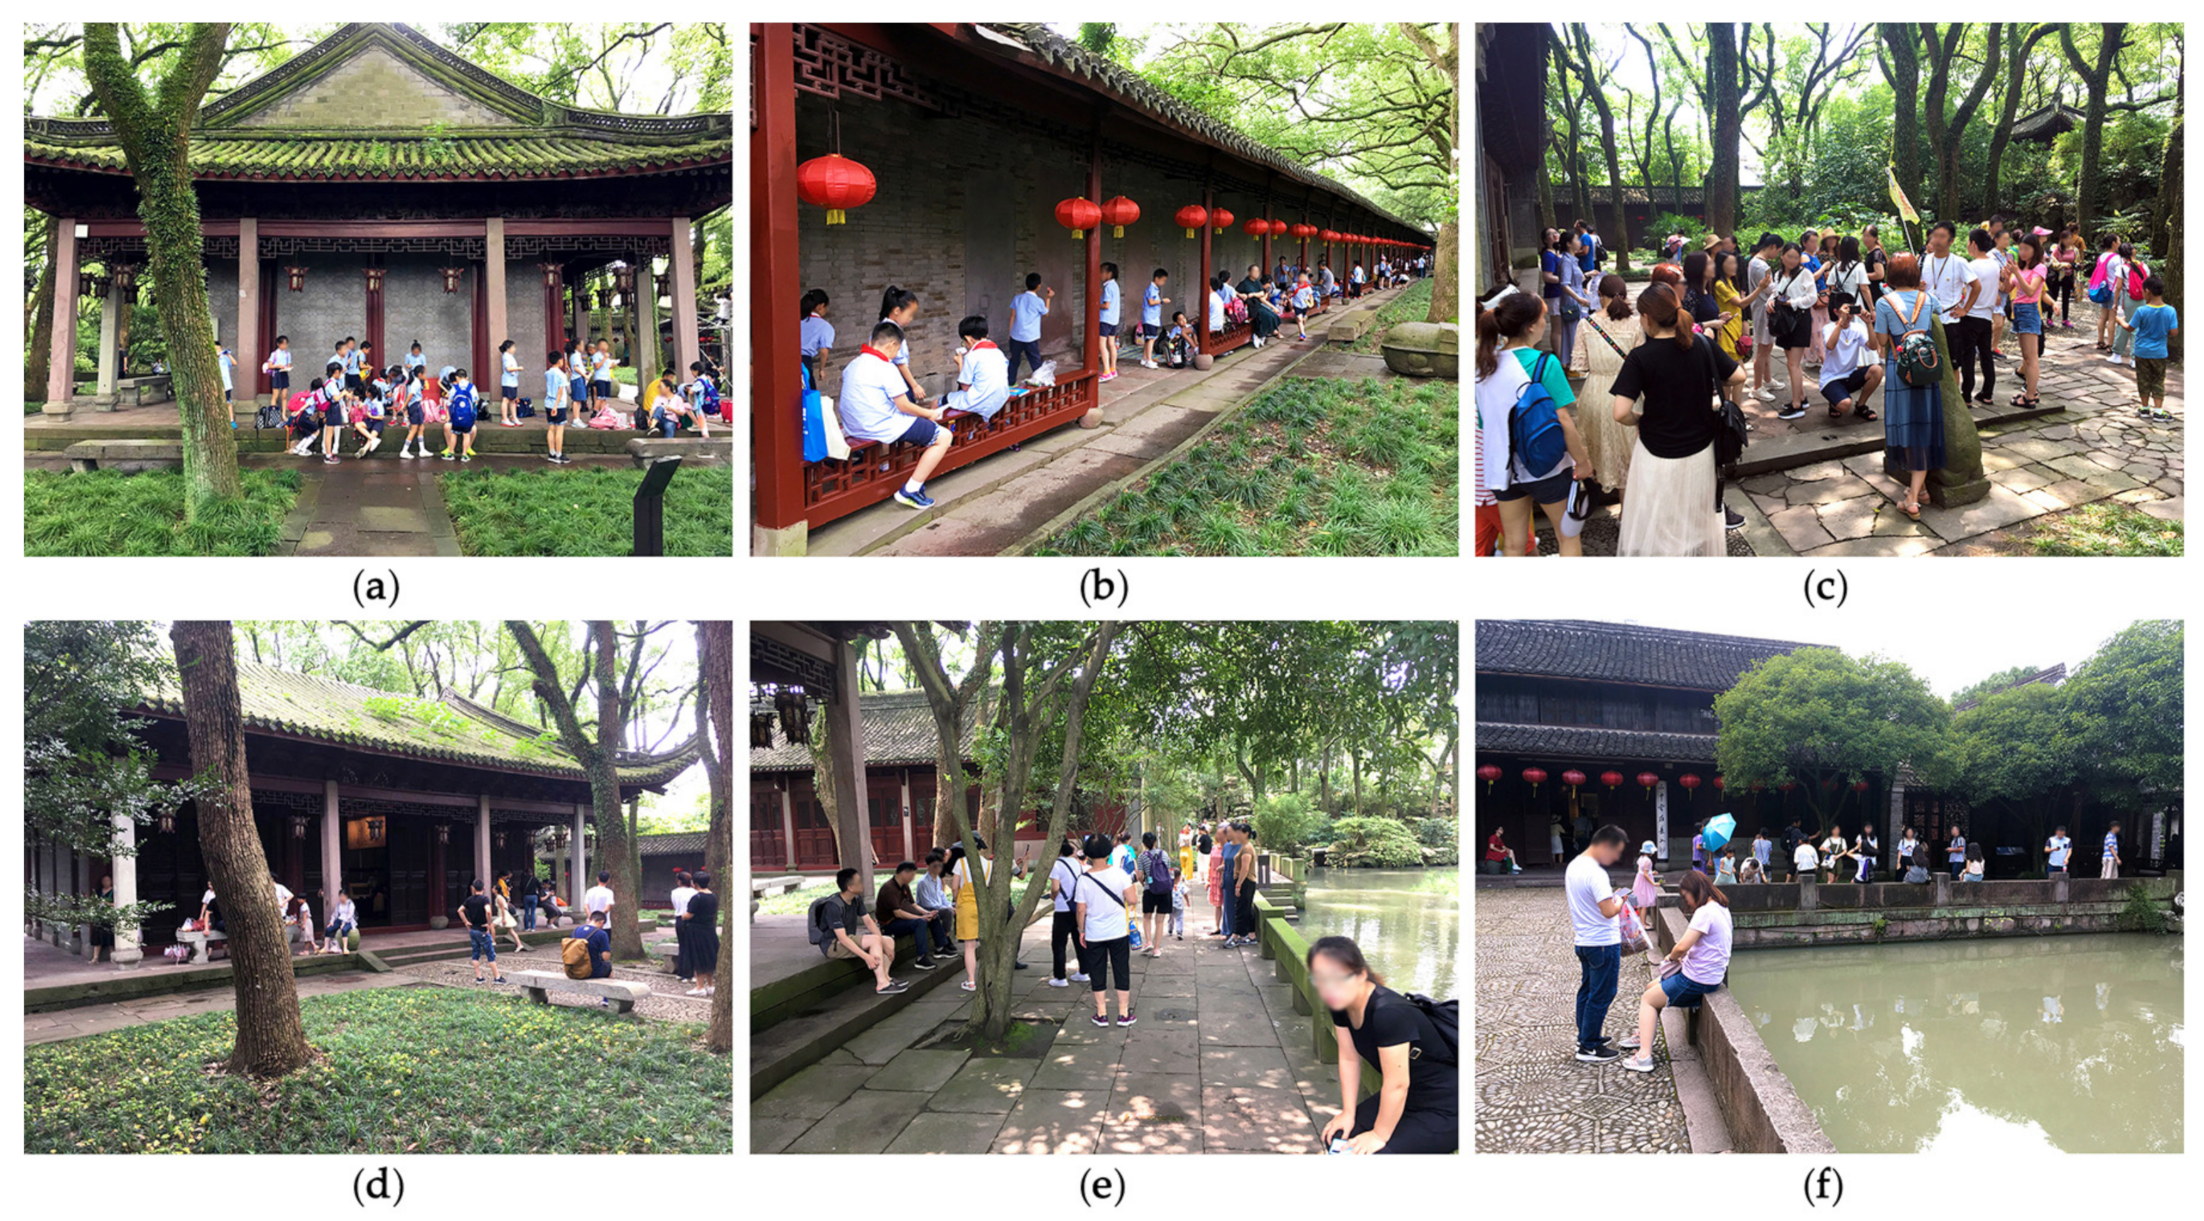
Urbansci 05 00074 g011
Figure 12. Illustrations of visitors and activities in Tianyige garden: (a) Student groups resting under the eaves of Ninghui Hall (B2) of the East Garden; (b) Student groups playing in verandas (C2) of the East Garden; (c) Tour groups at Linquanya Hall (B3) of the East Garden; (d) Individual visitors at Ninghui Hall (B2) of the East Garden; (e) Visitors staying in waterside space (A1) of the East Garden; (f) Visitors staying in waterside space (A4 and A5) of the South Garden. Source: Own work.
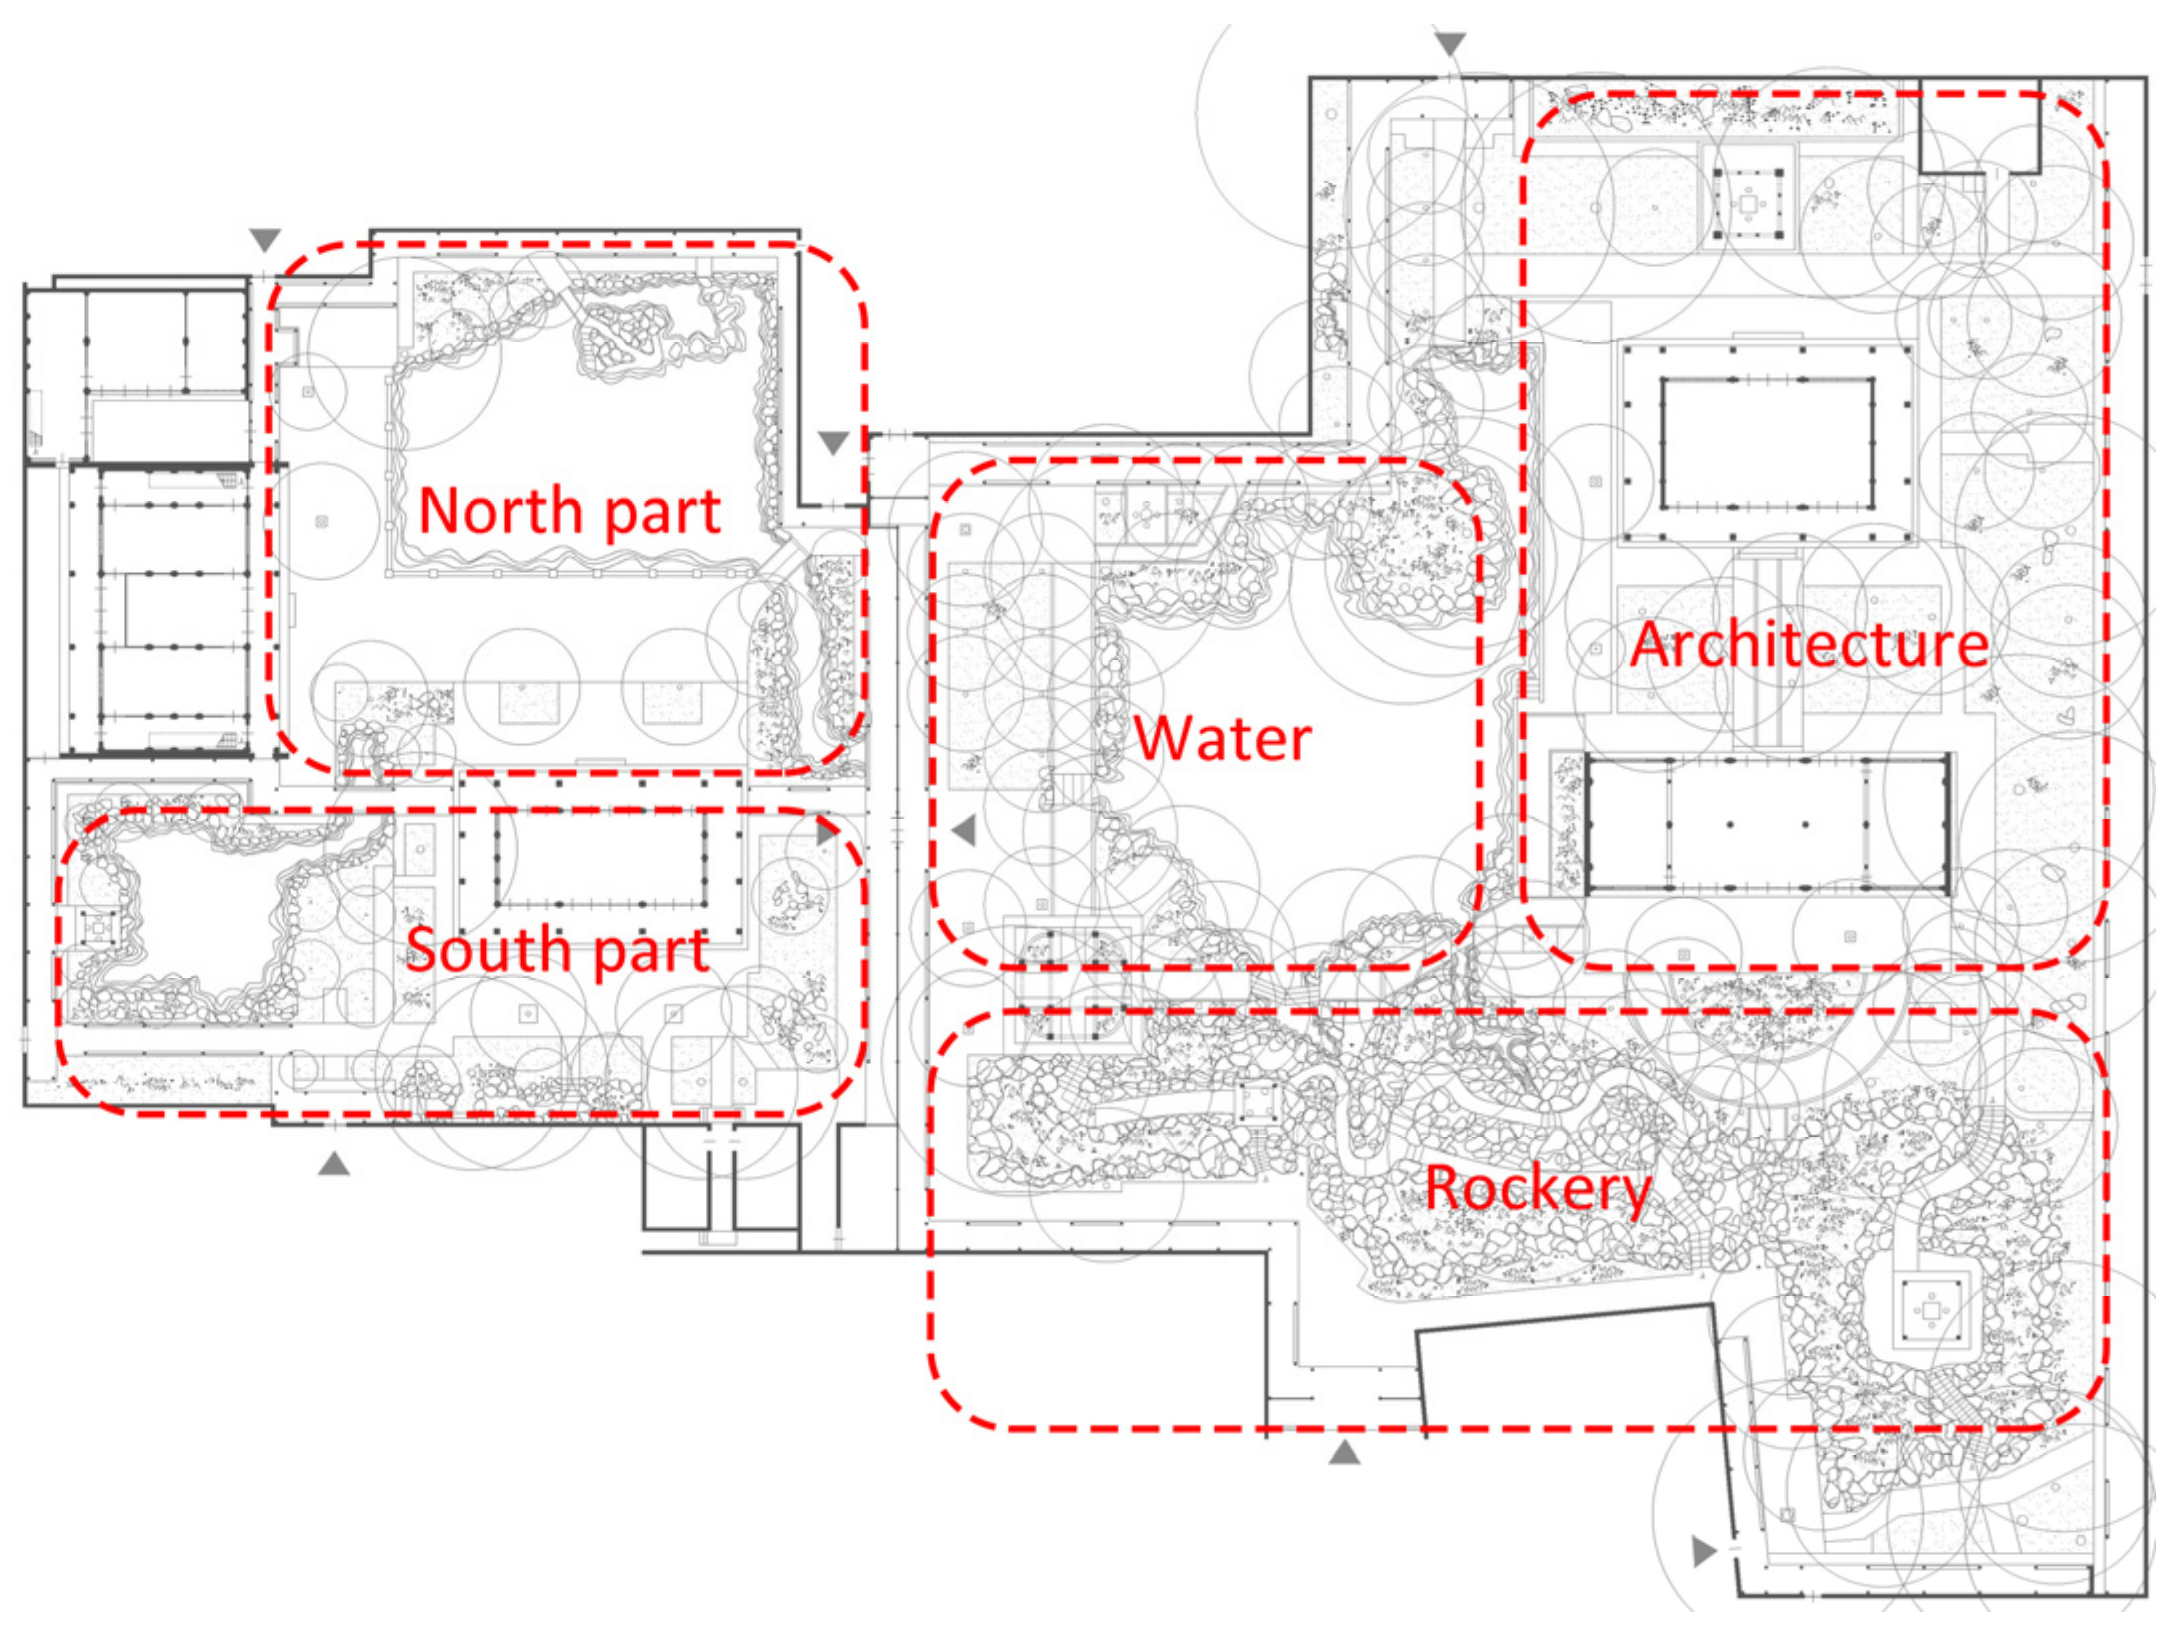
Urbansci 05 00074 g012
Figure 13. Five observational areas in Tianyige garden: water, architecture, and rockery parts in the East Garden, and the northern and southern yards of the South Garden. Source: Own work.
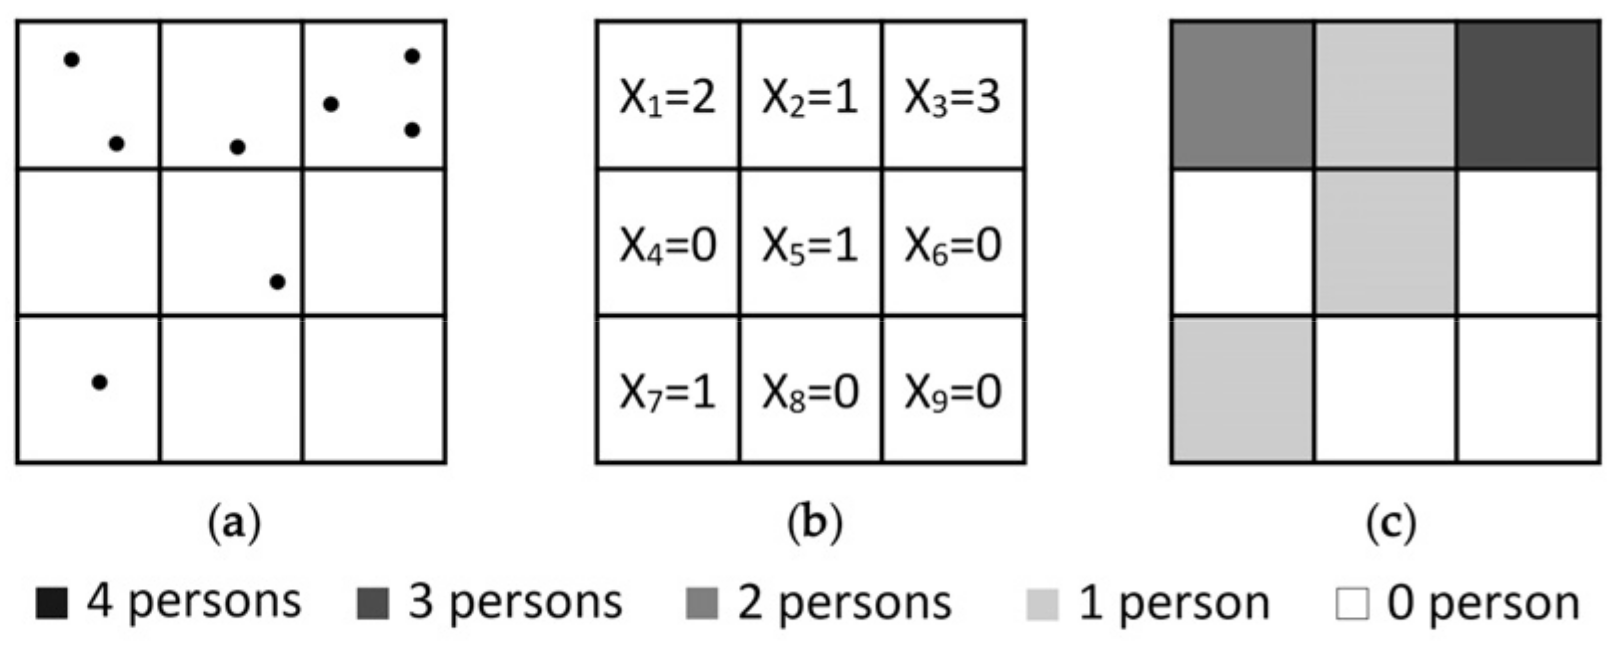
Urbansci 05 00074 g013
Figure 14. Calculation method of stay visitor number in grids: (a) Original records with one dot as a stay visitor; (b) Calculation of stay visitor number in each grid; (c) The shading of grids representing the number of visitor stays. Source: Own work.
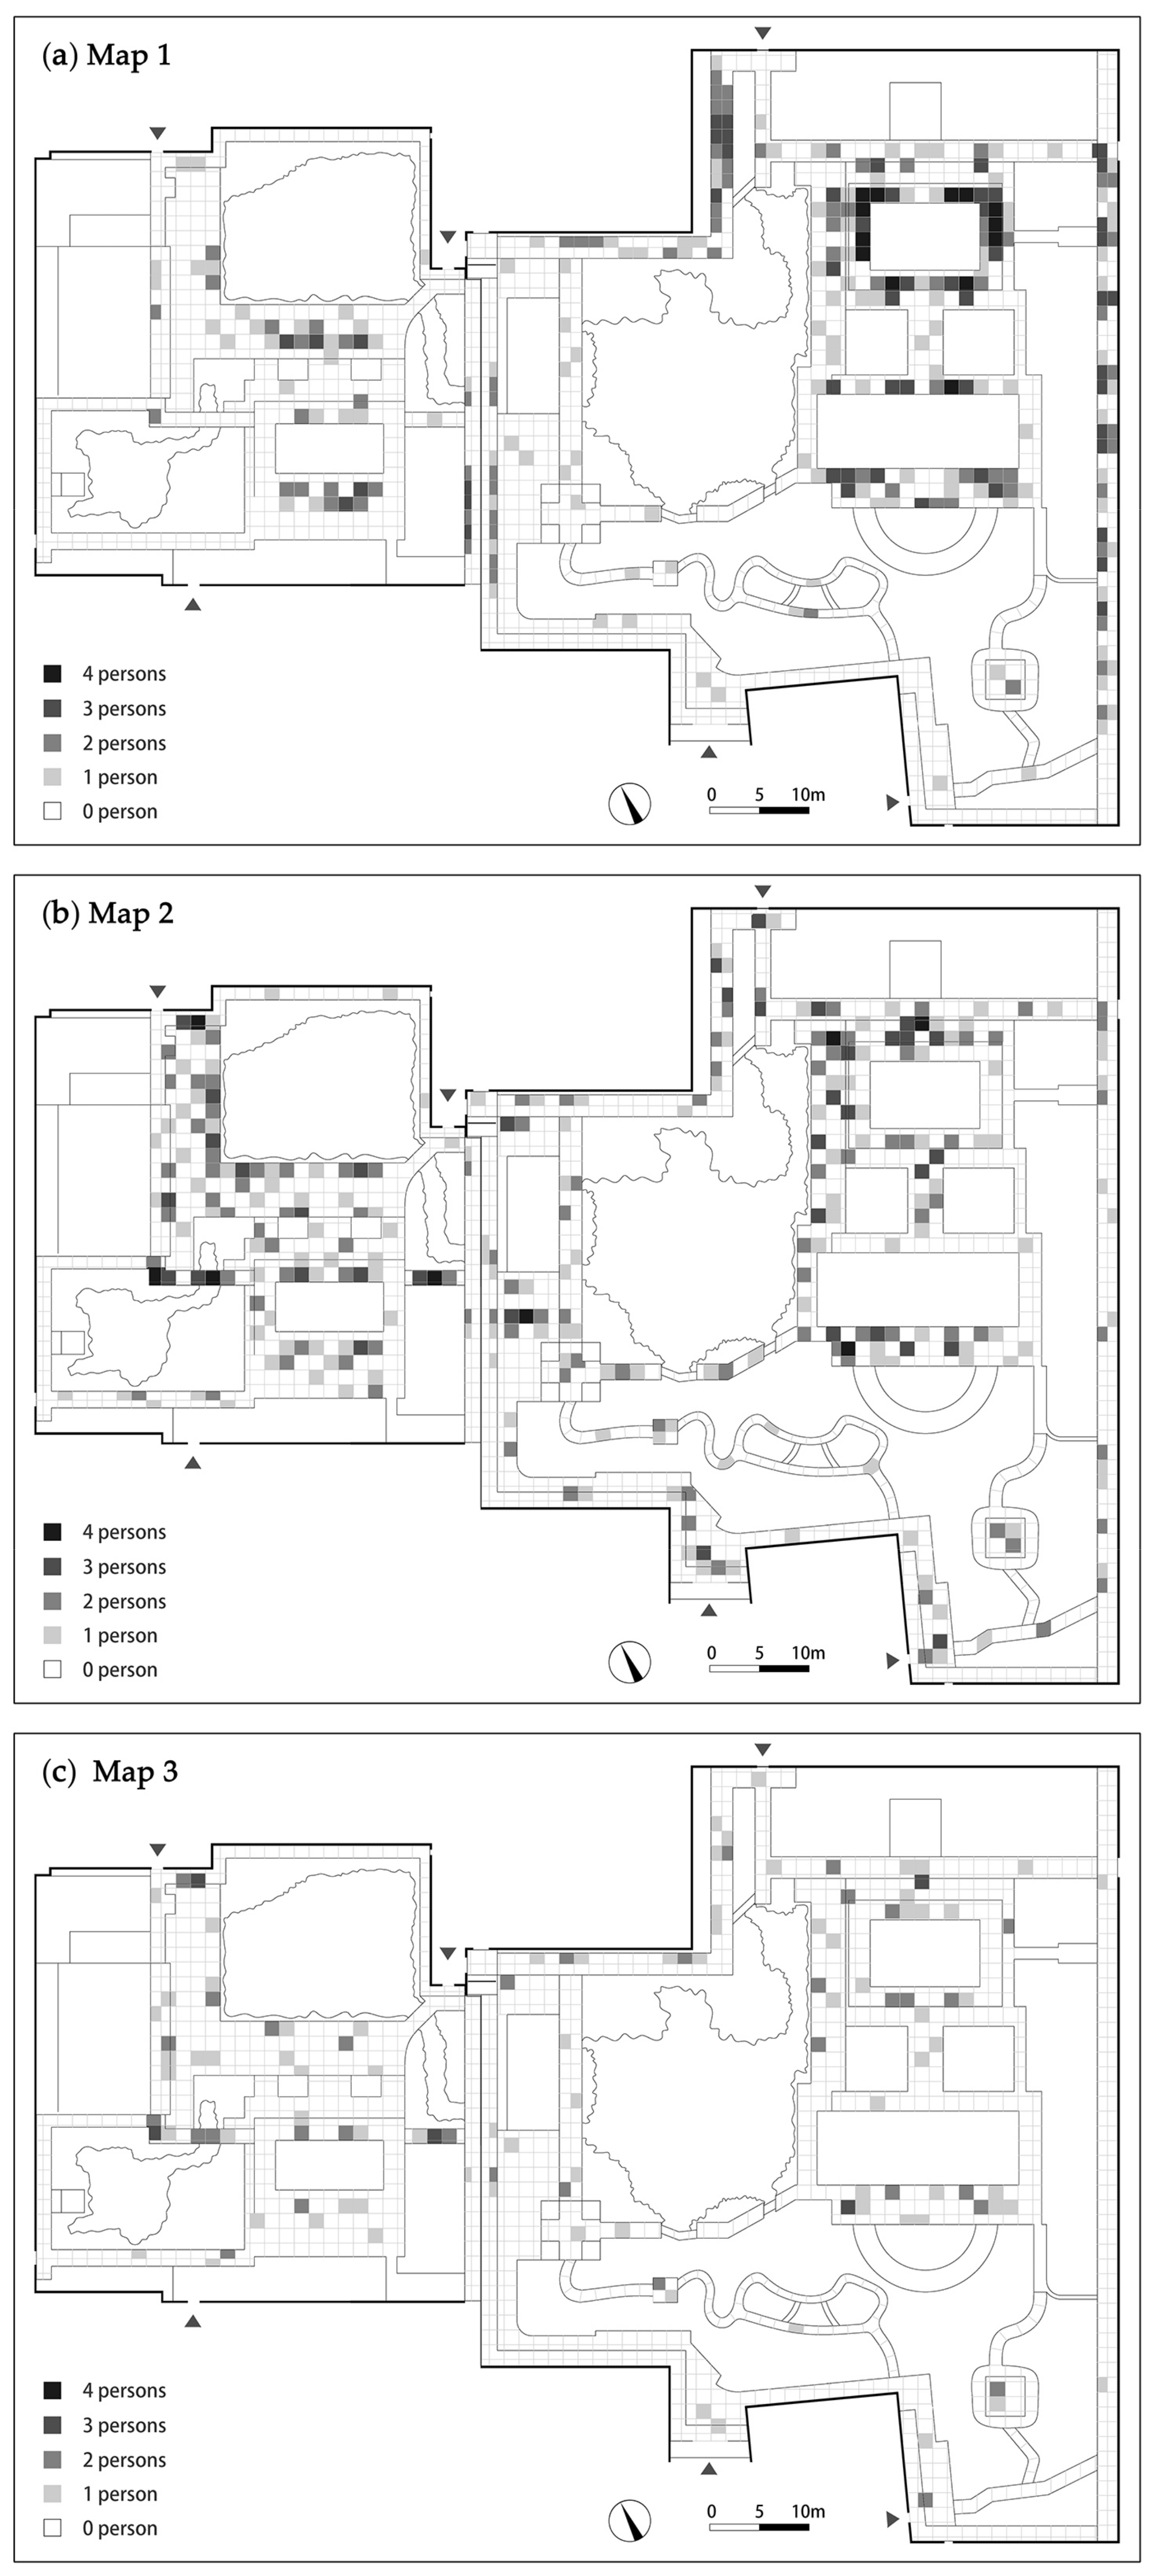
Urbansci 05 00074 g014
Figure 15. Visitor stay distribution maps in three periods: (a) Map 1 in the Saturday morning of 6 July 2019; (b) Map 2 in the Saturday afternoon of 6 July 2019; (c) Map 3 on the Wednesday afternoon of 10 July 2019. Source: Own work.
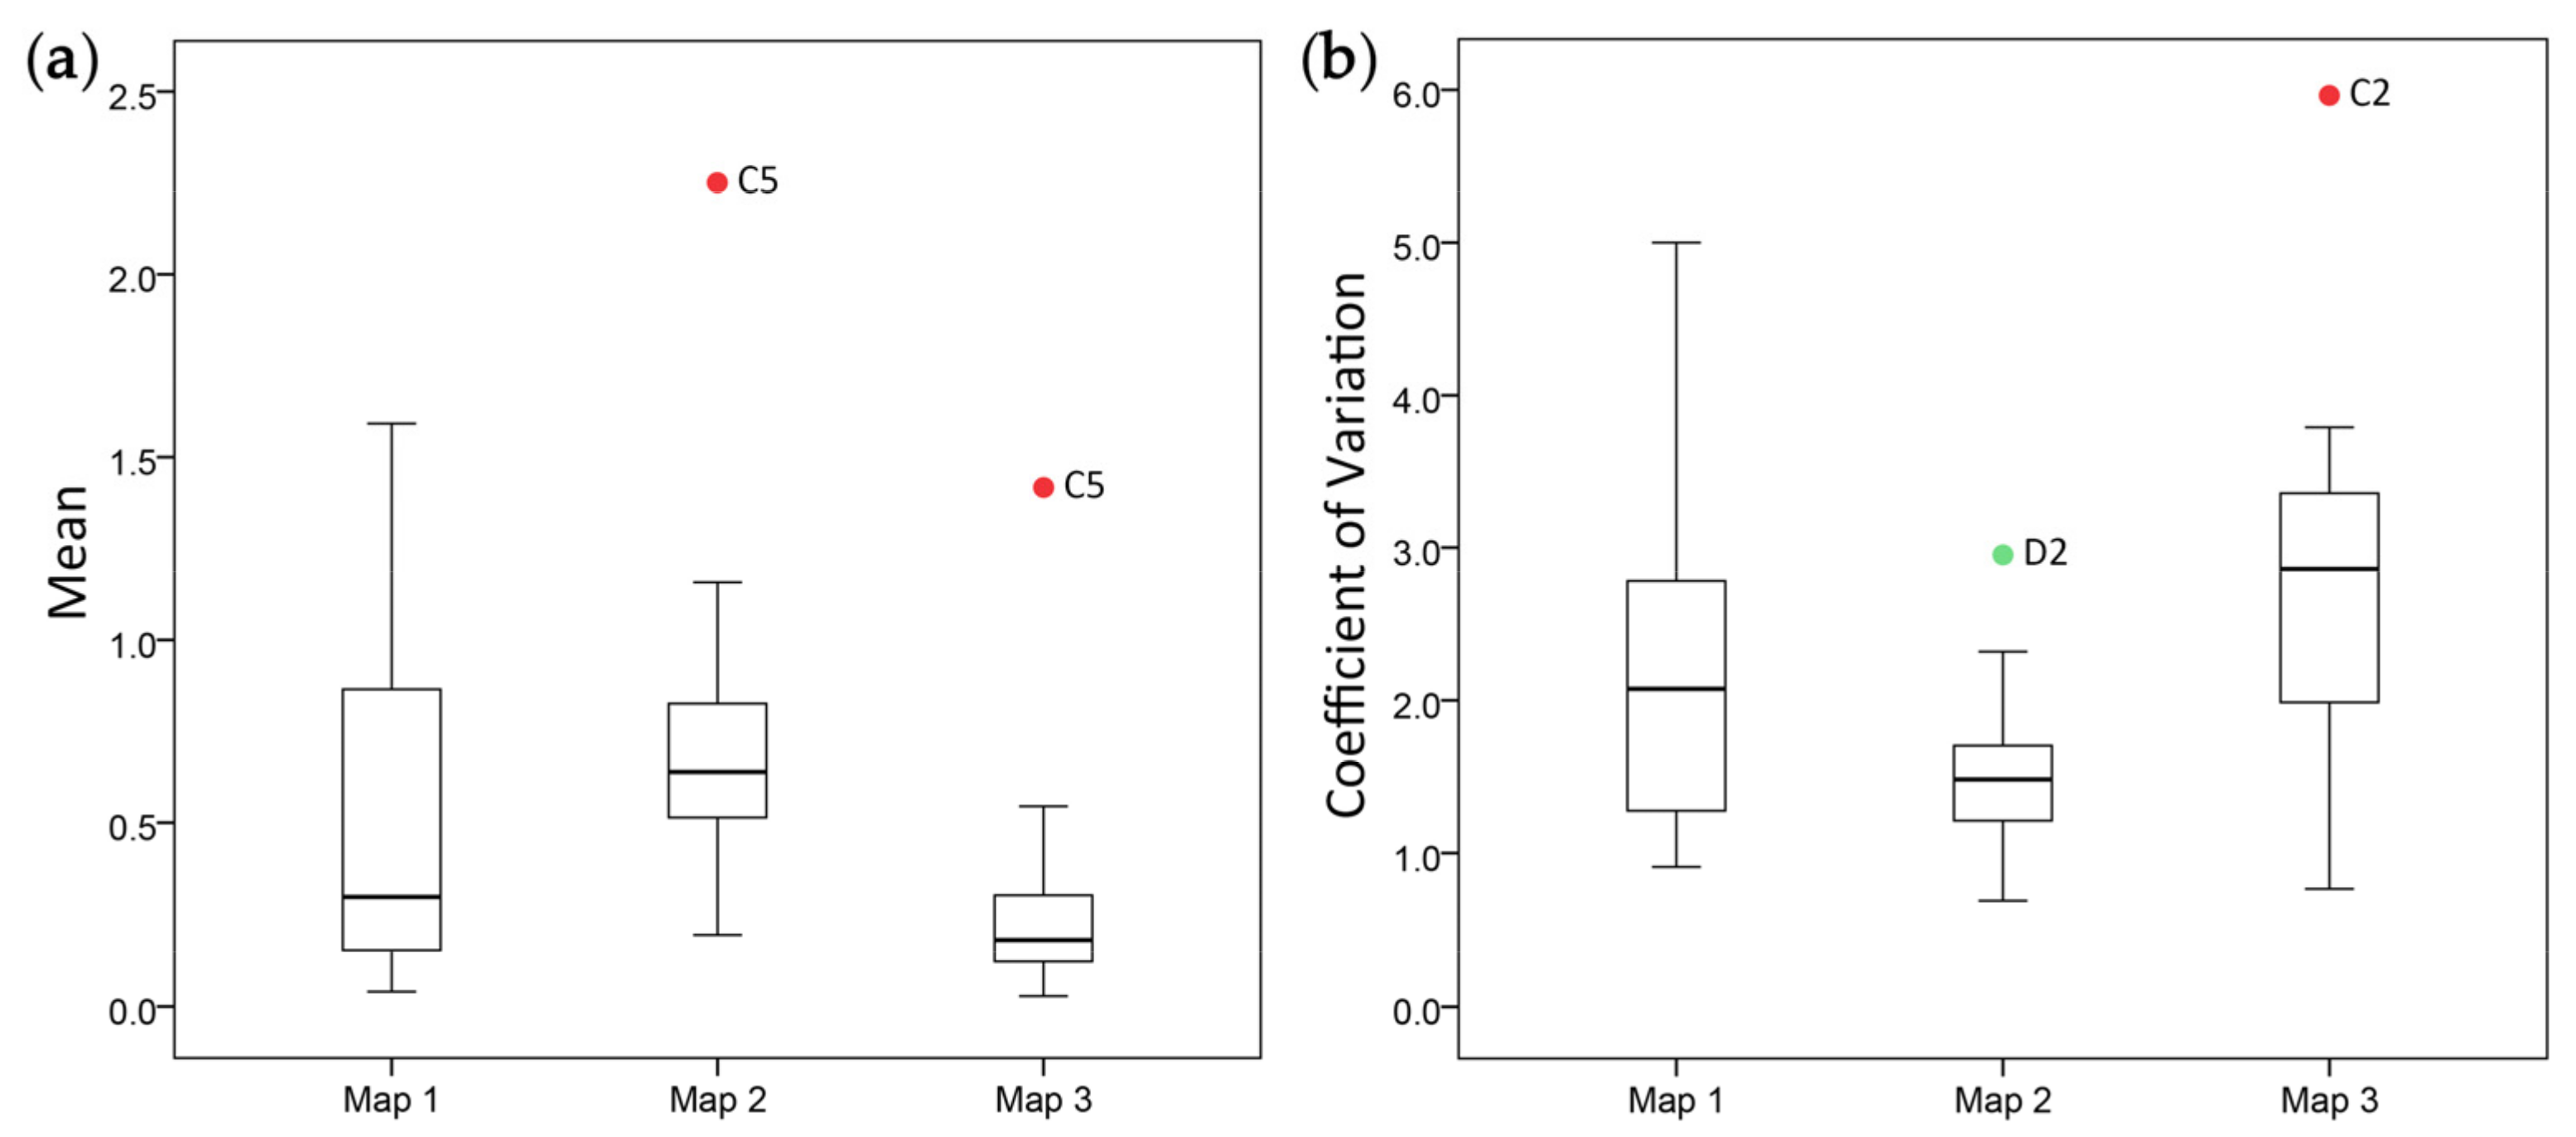
Urbansci 05 00074 g015
Figure 16. Box plots of visitor stay mean and coefficient of variation in three periods: (a) Box plots of visitor stay mean, with an outlier C5 in Map 2 and 3; (b) Box plots of visitor stay coefficient of variation, with outliers D2 in Map 2 and C2 in Map 3. Source: Own work.
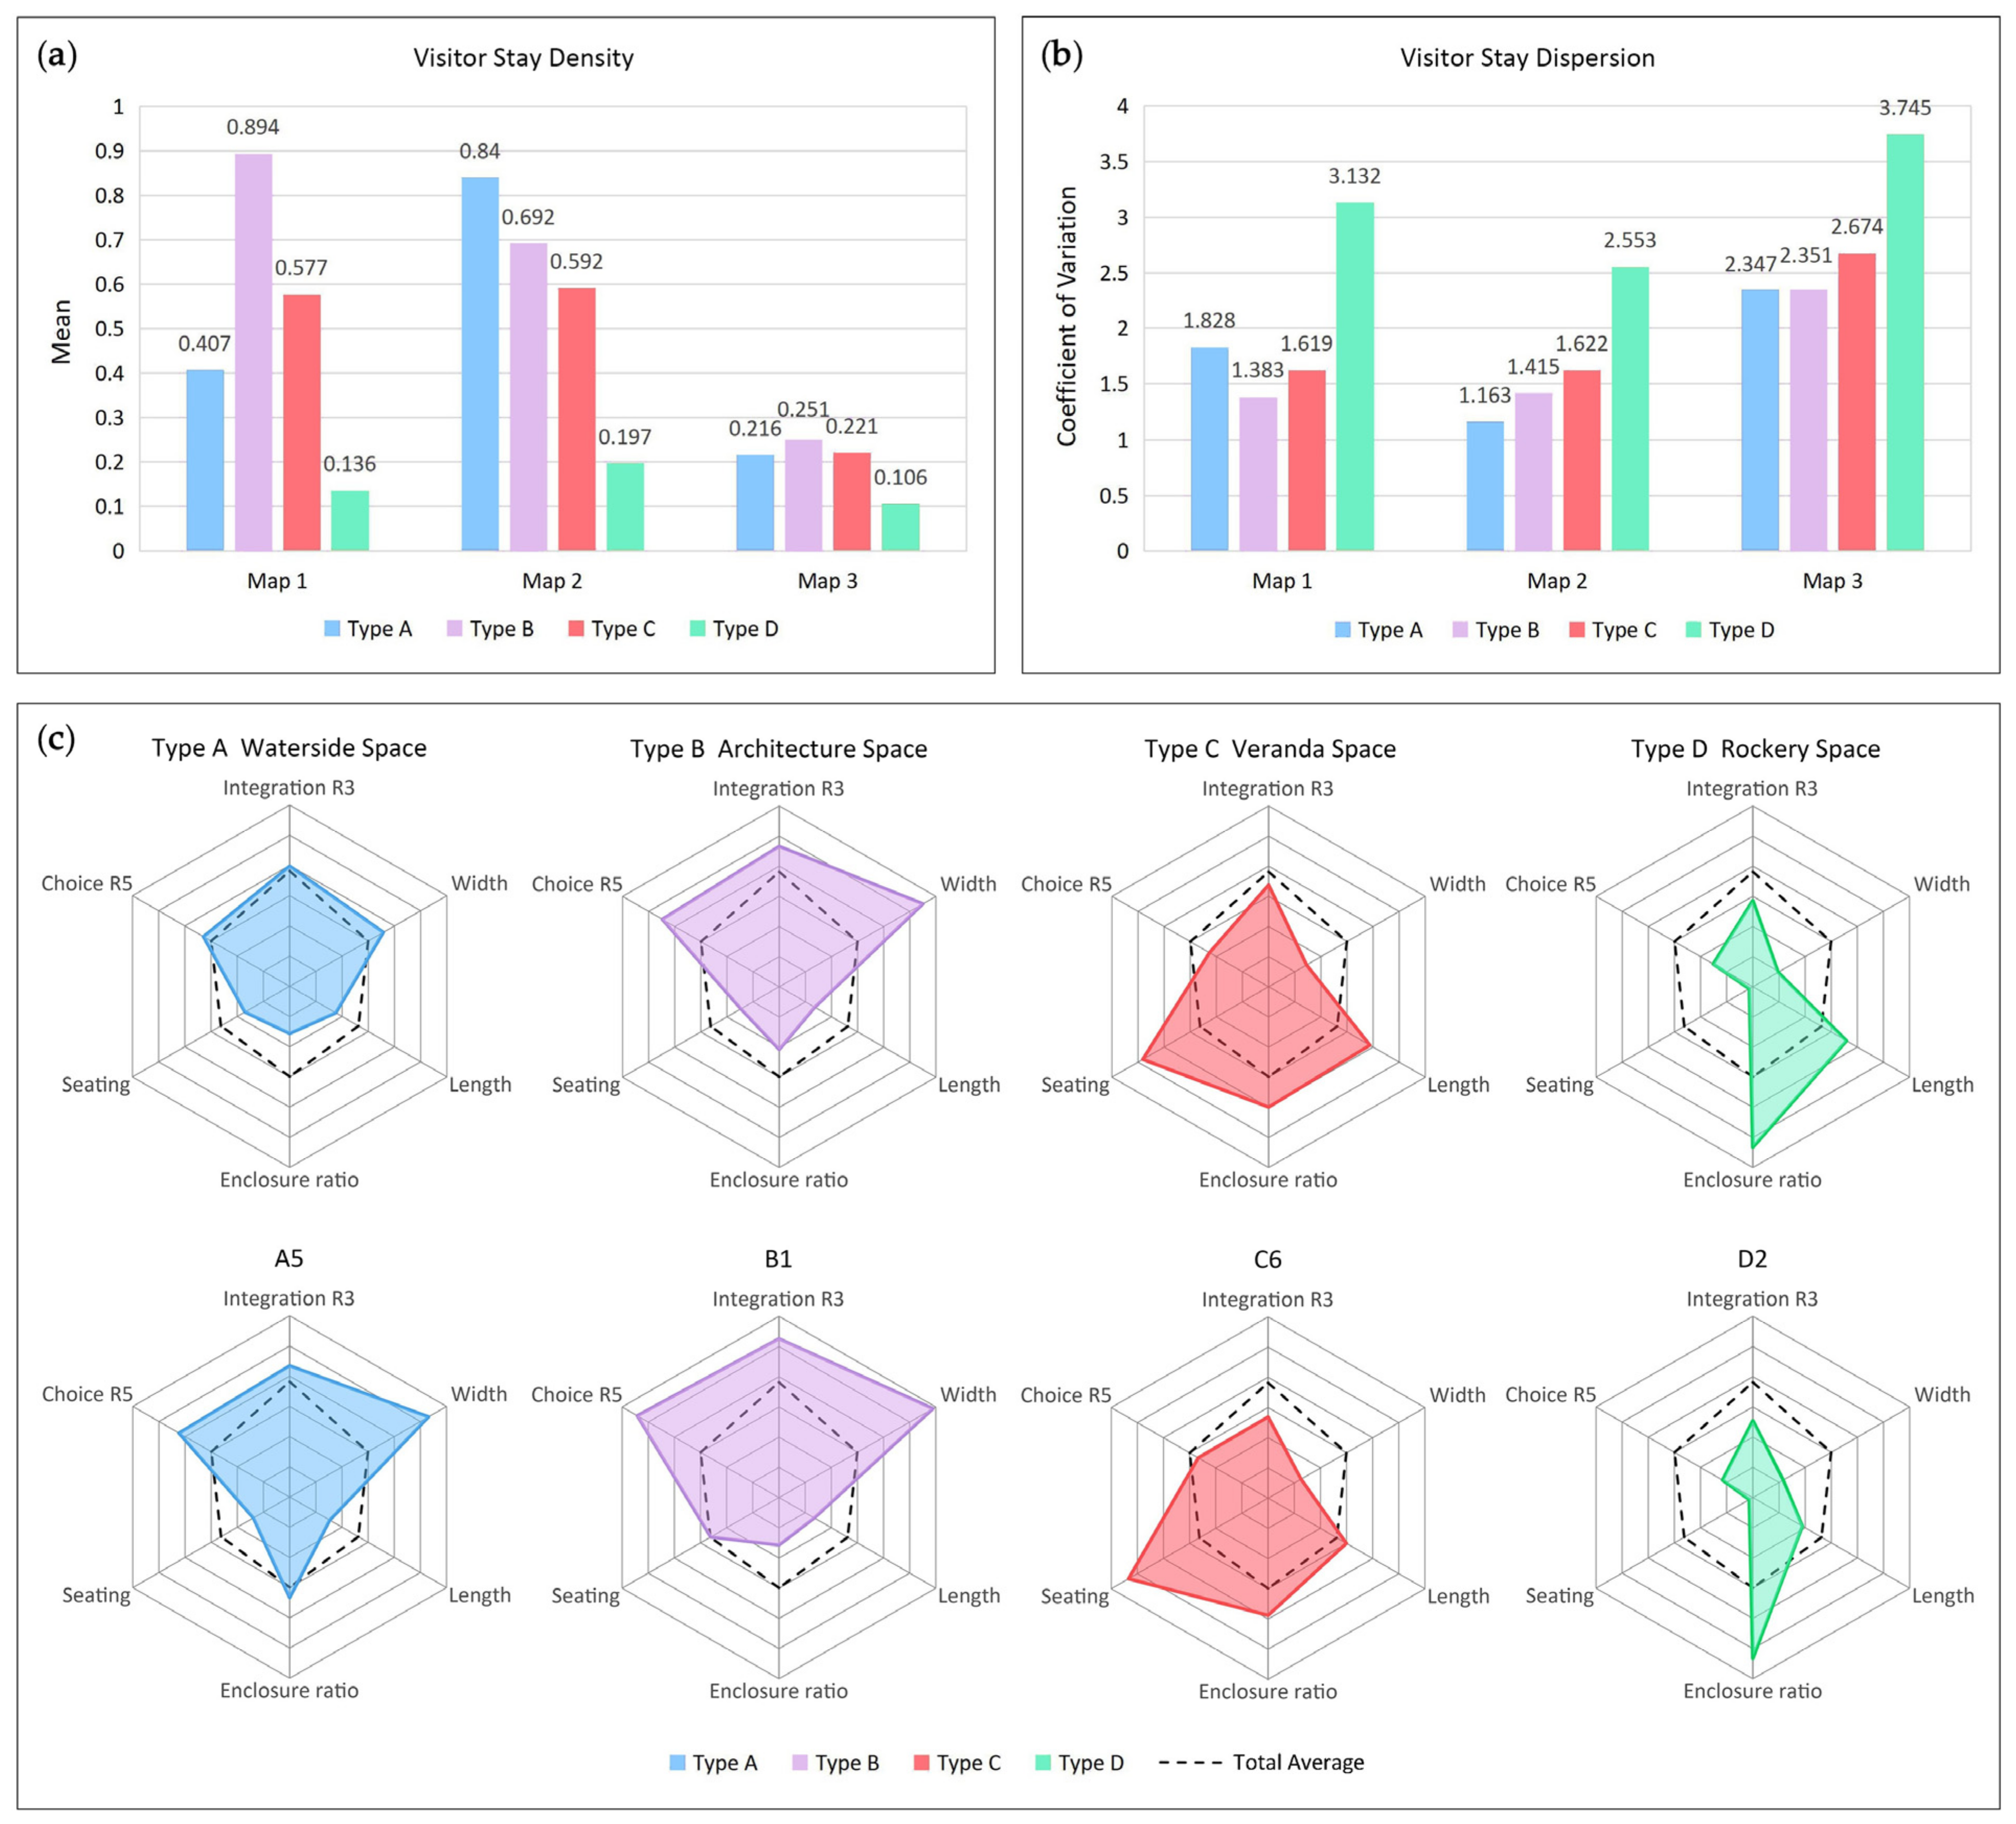
Urbansci 05 00074 g016
Figure 17. Characteristics of visitor stay distribution and four types of garden space: (a) Visitor stay density of four types in column charts; (b) Visitor stay dispersion of four types in column charts; (c) Characteristics of four types of garden space and four typical garden units in radar charts. Source: Own work.
Urbansci 05 00074 g017
Table 1. Relationship with spatial elements of twenty garden units. Source: own work.
TypeUnitMain ElementRoofAdjacent ElementsOther Visible Elements
Type AA1WaterFully openWater, ArchitectureVeranda, Rockery
A2WaterFully openWater, RockeryArchitecture, Veranda
A3WaterFully openWater, GrassVeranda, Rockery
A4WaterFully openWater, PavementArchitecture, Veranda
A5WaterFully openWater, ArchitectureVeranda
Type BB1ArchitecturePartial roofArchitecture, GrassVeranda
B2ArchitecturePartial roofArchitecture, GrassWater, Veranda
B3ArchitecturePartial roofArchitecture, GrassWater, Veranda, Rockery
B4ArchitecturePartial roofArchitecture, PavementWater, Veranda
B5ArchitecturePartial roofArchitecture, GrassWater, Veranda
Type CC1VerandaFull roofWall, WaterArchitecture, Rockery
C2VerandaFull roofWall, GrassArchitecture, Rockery
C3VerandaFull roofWall, RockeryNone
C4VerandaFull roofWall, Pavement, GrassWater, Architecture, Rockery
C5VerandaFull roofWater, GrassArchitecture
C6VerandaFull roofWall, WaterArchitecture
C7VerandaFull roofWall, PavementWater, Architecture
C8VerandaFull roofWall, WaterArchitecture
Type DD1RockeryFully openRockeryWater, Architecture
D2RockeryFully openRockeryNone
Table 2. Measurement attributes of twenty garden units (in meters from length to seating). Source: own work.
TypeUnitLengthWidthPerimeterEnclo. LengthEnclo. HeightSeatingL/WD/HEnclos. Ratio
Type AA130.93.568.814.35.030.06.6570.70020.8%
A220.21.543.420.23.52.013.4670.42946.5%
A322.32.349.203.03.09.6962.8670
A418.85.548.604.018.83.4182.6250
A519.45.549.824.55.010.43.8041.10050.0%
Type BB117.16.447.011.14.519.62.6721.42223.6%
B217.14.169.424.74.525.64.1710.91135.6%
B321.34.351.224.03.64.04.9531.19446.9%
B415.36.744.011.04.02.02.2841.67525.0%
B515.36.844.211.04.04.02.2501.70024.9%
Type CC142.81.989.444.73.060.2NA0.63350.0%
C278.51.9160.880.43.034.8NA0.63350.0%
C363.61.3129.897.43.029.5NA0.43375.0%
C468.61.4142.871.43.049.9NA0.46750.0%
C517.91.538.89.74.013.1NA1.35025.0%
C638.01.378.645.83.040.1NA0.43358.3%
C714.81.532.616.33.018.9NA0.50050.0%
C837.81.378.267.03.020.3NA0.43385.7%
Type DD167.00.9135.8NA21.0NA0.50080.0%
D224.01.250.4NA21.0NA0.50080.0%
Table 3. Configurational attributes of twenty garden units (calculation values of convex map). Source: own work.
TypeUnitConnectivityChoice [Norm] R3Choice [Norm] R5Integration [HH] R3Integration [HH] R5
Type AA160.2290.2702.0151.382
A220.1520.0831.1371.039
A330.1630.1631.6041.218
A430.1660.2351.7261.299
A550.2260.2601.8141.281
Type BB170.4470.3332.1951.328
B260.2160.1831.8961.311
B350.4560.2871.9241.242
B460.3400.3161.9171.350
B550.3970.2581.7931.206
Type CC130.2580.1841.5991.052
C230.1440.1831.4571.218
C360.3020.1481.5381.201
C450.1410.1141.4591.174
C530.1360.1111.6361.233
C620.1670.1641.1210.965
C740.1760.1421.5041.143
C830.1280.0671.1840.990
Type DD130.1450.1151.3251.031
D220.1330.0711.0621.004
Table 4. Visitor stay distribution statistics of twenty garden units in three periods. Source: Own work.
TypeUnitGridVisitor NumberMeanStandard DeviationCoefficient of Variation
Map 1Map 2Map 3Map 1Map 2Map 3Map 1Map 2Map 3Map 1Map 2Map 3
Type AA144203470.4550.7730.1590.8201.0970.4791.8021.4193.013
A2111810.0910.7270.0910.3020.7860.3023.3191.0813.319
A32371760.3040.7390.2610.4700.8100.5411.5461.0962.073
A446273390.5870.7170.1960.9090.9810.5001.5491.3682.551
A5381144120.2891.1580.3160.6110.9450.5742.1140.8161.816
Sum16266136350.4070.8400.2160.7440.9770.5071.8281.1632.347
Type BB1495043141.0200.8780.2861.3311.1300.6451.3051.2872.255
B2497829131.5920.5920.2651.4850.8880.6050.9331.5002.283
B3384738171.2371.0000.4471.1251.1390.7600.9091.1391.700
B44582560.1780.5560.1330.4900.8670.4572.7531.5593.436
B546202270.4350.4780.1520.8860.7810.4202.0371.6342.763
Sum227203157570.8940.6920.2511.2360.9790.5901.3831.4152.351
Type CC1423626150.8570.6190.3571.0720.9090.6181.2511.4681.731
C271662320.9300.3240.0281.1250.6500.1671.2102.0065.964
C34452950.1140.6590.1140.3210.8880.3872.8161.3473.395
C447412660.8720.5530.1281.0130.8290.3971.1621.4993.102
C512327170.2502.2501.4170.6221.5451.0842.4880.6870.765
C6251940.0400.3600.1600.2000.6380.4735.0001.7722.956
C71121060.1820.9090.5450.4051.4461.0362.2251.5911.901
C82031150.1500.5500.2500.3661.0990.7862.4401.9983.144
Sum272157161600.5770.5920.2210.9340.9600.5911.6191.6222.674
Type DD1406840.1500.2000.1000.4270.4640.3792.8472.3203.790
D2263530.1150.1920.1150.4310.5670.4313.7482.9533.748
Sum6691370.1360.1970.1060.4260.5030.3973.1322.5533.745
Sum7274354671590.5980.6420.2190.9980.9510.5581.6691.4812.548
Table 5. Pearson correlation test with visitor stay mean and spatial attributes. Source: Own work.
MeanPearson Correlation (r)
Choice [Norm] R3Choice [Norm] R5Integration [HH] R3Integration [HH] R5
Map 1 (N = 20)0.3800.3940.552 *0.445 *
Map 2 (N = 19)0.4130.488 *0.580 **0.517 *
Map 3 (N = 19)0.3020.2290.3310.104
MeanPearson Correlation (r)
LengthWidthL/W (N = 9)D/HEnclosure ratioSeating
Map 1 (N = 20)0.0180.326−0.1130.104−0.2710.329
Map 2 (N = 19)−0.496 *0.4170.1720.277−0.398−0.074
Map 3 (N = 19)−0.490 *0.1400.1920.112−0.1190.023
* Correlation is significant at the 0.05 level (2-tailed). ** Correlation is significant at the 0.01 level (2-tailed).
Table 6. Pearson correlation test with visitor stay mean and spatial attributes in two groups. Source: Own work.
MeanPearson Correlation (r)
LengthWidthL/W (N = 9)D/HEnclosure RatioSeating
Type A&BMap 1 (N = 10)−0.1280.113−0.113−0.1540.1630.474
Map 2 (N = 10)0.312−0.1080.172−0.1960.4230.041
Map 3 (N = 10)0.0230.0720.1920.0690.2680.022
Type C&DMap 1 (N = 10)0.5100.737 *NA0.086−0.4440.681 *
Map 2 (N = 9)−0.3220.360NA−0.090−0.4010.383
Map 3 (N = 9)−0.718 *0.245NA0.054−0.3110.121
* Correlation is significant at the 0.05 level (2-tailed).
Table 7. Pearson correlation test with visitor stay coefficient of variation and spatial attributes. Source: Own work.
Map 1 (N = 20)
Pearson Correlation (r)Coefficient of Variation 1Mean 1LengthWidth
Coefficient of Variation 11−0.792 **−0.019−0.358
Mean 1−0.792 **10.0180.326
Length−0.0190.0181NA
Width−0.3580.326NA1
Map 2 (N = 18)
Pearson Correlation (r)Coefficient of Variation 2Mean 2LengthWidth
Coefficient of Variation 21−0.845 **0.545 *−0.377
Mean 2−0.845 **1−0.597 **0.368
Length0.545 *−0.597 **1NA
Width−0.3770.368NA1
Map 3 (N = 18)
Pearson Correlation (r)Coefficient of Variation 3Mean 3LengthWidth
Coefficient of Variation 31−0.856 **0.437−0.318
Mean 3−0.856 **1−0.3870.099
Length0.437−0.3871NA
Width−0.3180.099NA1
* Correlation is significant at the 0.05 level (2-tailed). ** Correlation is significant at the 0.01 level (2-tailed).
Table 8. Partial correlation test with visitor stay coefficient of variation and spatial attributes, controlling the visitor stay mean. Source: Own work.
Coefficient of VariationControlCorrelation (r)
Mean 1Mean 2Mean 3LengthWidth
Map 1 (N = 20)None−0.792 ** −0.019−0.358
Mean 1 NA−0.174
Map 2 (N = 18)None −0.845 ** 0.545 *−0.377
Mean 2 0.094−0.132
Map 3 (N = 18)None −0.856 **0.437−0.318
Mean 3 0.222NA
* Correlation is significant at the 0.05 level (2-tailed). ** Correlation is significant at the 0.01 level (2-tailed).
Publisher’s Note: MDPI stays neutral with regard to jurisdictional claims in published maps and institutional affiliations.

