
Why House Prices Increase in the COVID-19 Recession: A Five-Country Empirical Study on the Real Interest Rate Hypothesis


Department of Property, The University of Auckland Business School, Auckland 1010, New Zealand
Urban Sci. 2021, 5(4), 77; https://0-doi-org.brum.beds.ac.uk/10.3390/urbansci5040077
Submission received: 20 August 2021
/
Revised: 28 September 2021
/
Accepted: 29 September 2021
/
Published: 5 October 2021
Abstract
:There are substantial rebounds in house prices in many developed economies after the outbreak of COVID-19. It provides a special opportunity to test the real interest rate hypothesis empirically as a “synchronized” price rebound implies a common cause of house price hikes across the economies. This study conducts a panel regression analysis on five economies, namely Australia, Canada, European Union, New Zealand, the United Kingdom, and the United States of America, to test the hypothesis. The data range from 2017Q1 to 2021Q1. The results confirm that the real interest rate imposes a negative and significant effect on house price growth rate after controlling for economic growth factors, unemployment factors, and cross-country fixed effects. The empirical result of the five housing markets shows that a 1% fall in the real interest rate caused a 1.5% increase in house prices, ceteris paribus, in this period. It also provides casual evidence refuting the economic growth hypothesis and the migrant hypothesis in New Zealand. The results provide far-reaching practical implications on housing policy and on the ways forward to solve housing affordability problems.
1. Introduction
Since the Global Financial Crisis, urban scientists have started investigating the Global Urban Housing Affordability Crisis [1,2]. Researchers of IMF also found that house prices are synchronized across countries, and they contended that it is caused by global interest rate shocks [3,4]. The COVID-19 pandemic provides a quasi-experiment to test their hypothesis.
Since the end of 2019, a contagious disease of a new coronavirus named by WHO as COVID-19 spread across the world. It has led to millions of deaths and a global recessionary period. Business operations are being seriously disrupted due to long periods of lockdown orders in many cities. Unemployment rates of many developed economies have risen to record highs. For example, the unemployment rates of the US and Canada rose to 14.8% and 13.7% in 2020, as reported by OECD [5]. However, contrary to people’s expectations, the housing prices of many countries skyrocketed rather than plummeted in this catastrophic event.
Contrary to a traditional theoretical prediction of a negative impact on housing markets by a pandemic [6], house prices in many countries went up substantially after the outbreak of COVID even when their GDP growth rates were negative, unemployment rates were unprecedentedly high, business operations were seriously disrupted, etc., [7] Knight Frank’s Global House Price Index [8], for example, showed that 91% and 93% of the 56 sampled countries recorded house price increases year-on-year in Q2 2020 and Q1 2021. It reported 22.1%, 13.2%, 10.8%, 10.2%, and 8.3% annual house prices increases in New Zealand, the US, Canada, the UK, and Australia, respectively, in Q1 2021. Mack & Martínez-García’s International House Prices Database [9] also revealed 80% and 88% of the 25 sampled countries recorded real house price increases in the same periods.
It is plausibly hypothesized that the counter-intuitive rebounds of house prices globally after the outbreak of COVID are the consequence of a synchronized counter-cyclical measure of cutting interest rates by central banks. Sahin and Girgin summarized that there were 207 interest rate cuts by central banks in 2020 [10]. Most of them happened in the first quarter of 2020 when 54 central banks tried to support the economies by cutting interest rates 73 times; some were even to historic lows. Yet, there has not been any empirical evidence studying this monetary policy hypothesis in the pandemic period [11,12]. This paper aims to test the hypothesis by a cross-country panel regression analysis as the synchronization of interest rate cuts by central banks globally after the outbreak of COVID provides a quasi-experiment to test the monetary policy hypothesis.
This study examines five countries with very strong growth in house prices after the outbreak of COVID. They are in alphabetic order Australia, Canada, New Zealand, the UK, and the US. The paper will be organized as follows. Section 2 is a literature review on studies of the monetary policy hypothesis. Section 3 outlines the research materials and methods used. Section 4 reports the results of the empirical tests. Section 5 discusses the findings and implications. Section 6 concludes.
2. Literature Review
Many previous studies showed that debt is the common linchpin of housing bubbles. There can be two major monetary policies that make more mortgage debts, either it is cheap to borrow (lower real interest rate) or easy to borrow (fewer borrowing constraints or lending constraints). For example, Mian and Sufi (2011) found “evidence of a strong link between asset prices and household borrowing” ([13], p. 2155), and Favara and Imbs (2015) showed “a causal chain going from an expansion in credit to house prices” ([14], p. 984).
The negative effect of the real interest rate on house prices has been widely studied in one-country studies [15,16,17,18,19,20]. Mayer and Sinai (2009) explained the effects as follows: “A lower real interest rate reduces the user cost because the cost of debt financing is lower, as is the opportunity cost of investing equity in a house. In practical terms, when the real interest rate is low, homeownership is relatively attractive because mortgage payments are low and alternative investments do not yield much” ([15], p. 8).
Ryan-Collins (2019) further explained the relationship by a Housing-Finance Feedback Cycle that when unlimited credit and money flows into an inherently finite supply of property, house prices will rise. However, higher house prices would further result in more credit. He found a qualitatively strong association between mortgage credit and real house prices in advanced economies since 1870 and contended that in the past, “policymakers have largely focused attention on supply-side issues, such as the insufficient new building of homes, excessive immigration, and restrictive planning rules.” ([21], p. 19).
Another strand of studies on monetary policy hypothesis is on the easiness of borrowing. For example, Favilukis, Ludvigson, and van Nieuwerburgh (2017) showed the impact of the relaxation of borrowing constraints on house prices [22]. Khandani, Lo, and Merton (2013) showed by a simulation that if housing refinancing is not restricted, it can lead to a systemic risk due to a ratchet effect when home prices rise [23].
There have also been some cross-country studies to test the monetary policy hypothesis. Ahearne et al. (2005), for instance, found that certain financial conditions, such as low interest rates, ample liquidity, and financial deregulation, were usually present in past house price surges, but they did not conduct any empirical tests and could not rule out other explanatory factors, such as business-cycle shocks and demographics [24]. Other cross-country empirical studies encountered the same problem of controlling other factors. Almost all these studies tried to include relevant variables in the regression models, and most of them included real interest rate or housing credit as explanatory variables. For example, Tsatsaronis and Zhu (2004) found that house prices generally depend on inflation, yield curve, and bank credit [25], and Égert and Mihaljek (2007) showed that house prices are determined by GDP per capita, real interest rates, housing credit, and demographic factors, etc., [26]. Algieri (2013) indicated that changes in real income, long-run interest rates, stock prices, and inflation are determinants of house prices [27]. Vogiazas and Alexiou (2017) also found that housing prices depend on the real gross domestic product, bank credit growth, long-term bond yields, and real effective exchange rate [28]. However, Tripathi (2019) found that real interest rate does not have any effect on real house prices [29]. In other words, there is still no consensus on the monetary policy hypothesis.
It is noted that these studies do not control confounding bias or endogeneity issues among variables, and they did not take an experimental intervention approach to take control of one or more variables. Their findings can be biased and, at best show, correlations between the variables rather than causation. An experimental intervention approach is a better way to test causality relationship, and endogeneity can be eliminated by experimental design [30]. For example, there have been many studies showing that house price increases can impose a house wealth effect which boosts economic growth [31,32]. In other words, the positive association between house price change and GDP growth can have a reverse causality issue (simultaneity).
In economic studies, a true experiment using randomized control design may not be viable, but a quasi-experimental design that uses non-randomized control groups can provide a more robust test on causality [33]. Quasi-experiments have been used in recent housing research, but most of them are at the microeconomic level, such as the effects of accessibility [34], airport operations [35,36], and purchase restrictions [37] on house prices. Yet, no quasi-experiment study on the monetary policy hypothesis so far has been done. This study is a first attempt.
3. Materials and Methods
3.1. Data
This study makes use of the International House Price Database [9] to collect quarterly real house price data of the five countries, as they provide a uniform construction method of price indices of different countries. The five countries are Australia (AUS), Canada (CAN), New Zealand (NZ), the United Kingdom (UK), and the United States of America (US). They are considered because they are located across three different continents, namely Oceania, North America, and Europe, which can avoid a regional bias. Their markets are also more transparent, and they are all developed OECD countries adopting market-oriented capitalism systems, which can minimize impacts due to institutional differences. These similarities among the five countries enable a test on the monetary policy hypothesis in a close-to-free market situation.
The quarterly GDP growth rates, unemployment rates, nominal short-term interest rates, and inflation rates of each country were collected from OECD data [38]. The real interest rates of each country were calculated by subtracting the inflation rate from the nominal short-term interest rate. Table 1 shows the descriptive statistics of the variables, and Table 2 shows their stationarities by ADF unit root tests. They show that real interest rates and GDP changes were stationary in the level terms, while house price indices and unemployment rates were stationary in the first differences.
3.2. Research Design
This study considered two quasi-experiments, one on the housing markets of New Zealand and the other on that of five countries. In the one-country model, the government of New Zealand provides two interventions to control two potential causes of house price hikes, namely (1) the migrants’ hypothesis [39] and (2) the housing supply hypothesis [40]. Since the enactment of the Overseas Investment Amendment Act in October 2018 in New Zealand, the number of Non-Citizen or Non-Resident (NCNR) Home Buyers plummeted substantially from an average of 800 cases before 2019 to less than 200 afterward. Whereas the average numbers of NCNR Home Sellers before and after the enactment were similar. In other words, the number of NCNR Home Sale exceeded the number of NCNR Home Purchase after the enactment, as shown in Figure 1. It acts as a good control on the migrant hypothesis via a policy intervention, i.e., the cause of house prices hike after 2019 is unlikely to be caused by migrants.
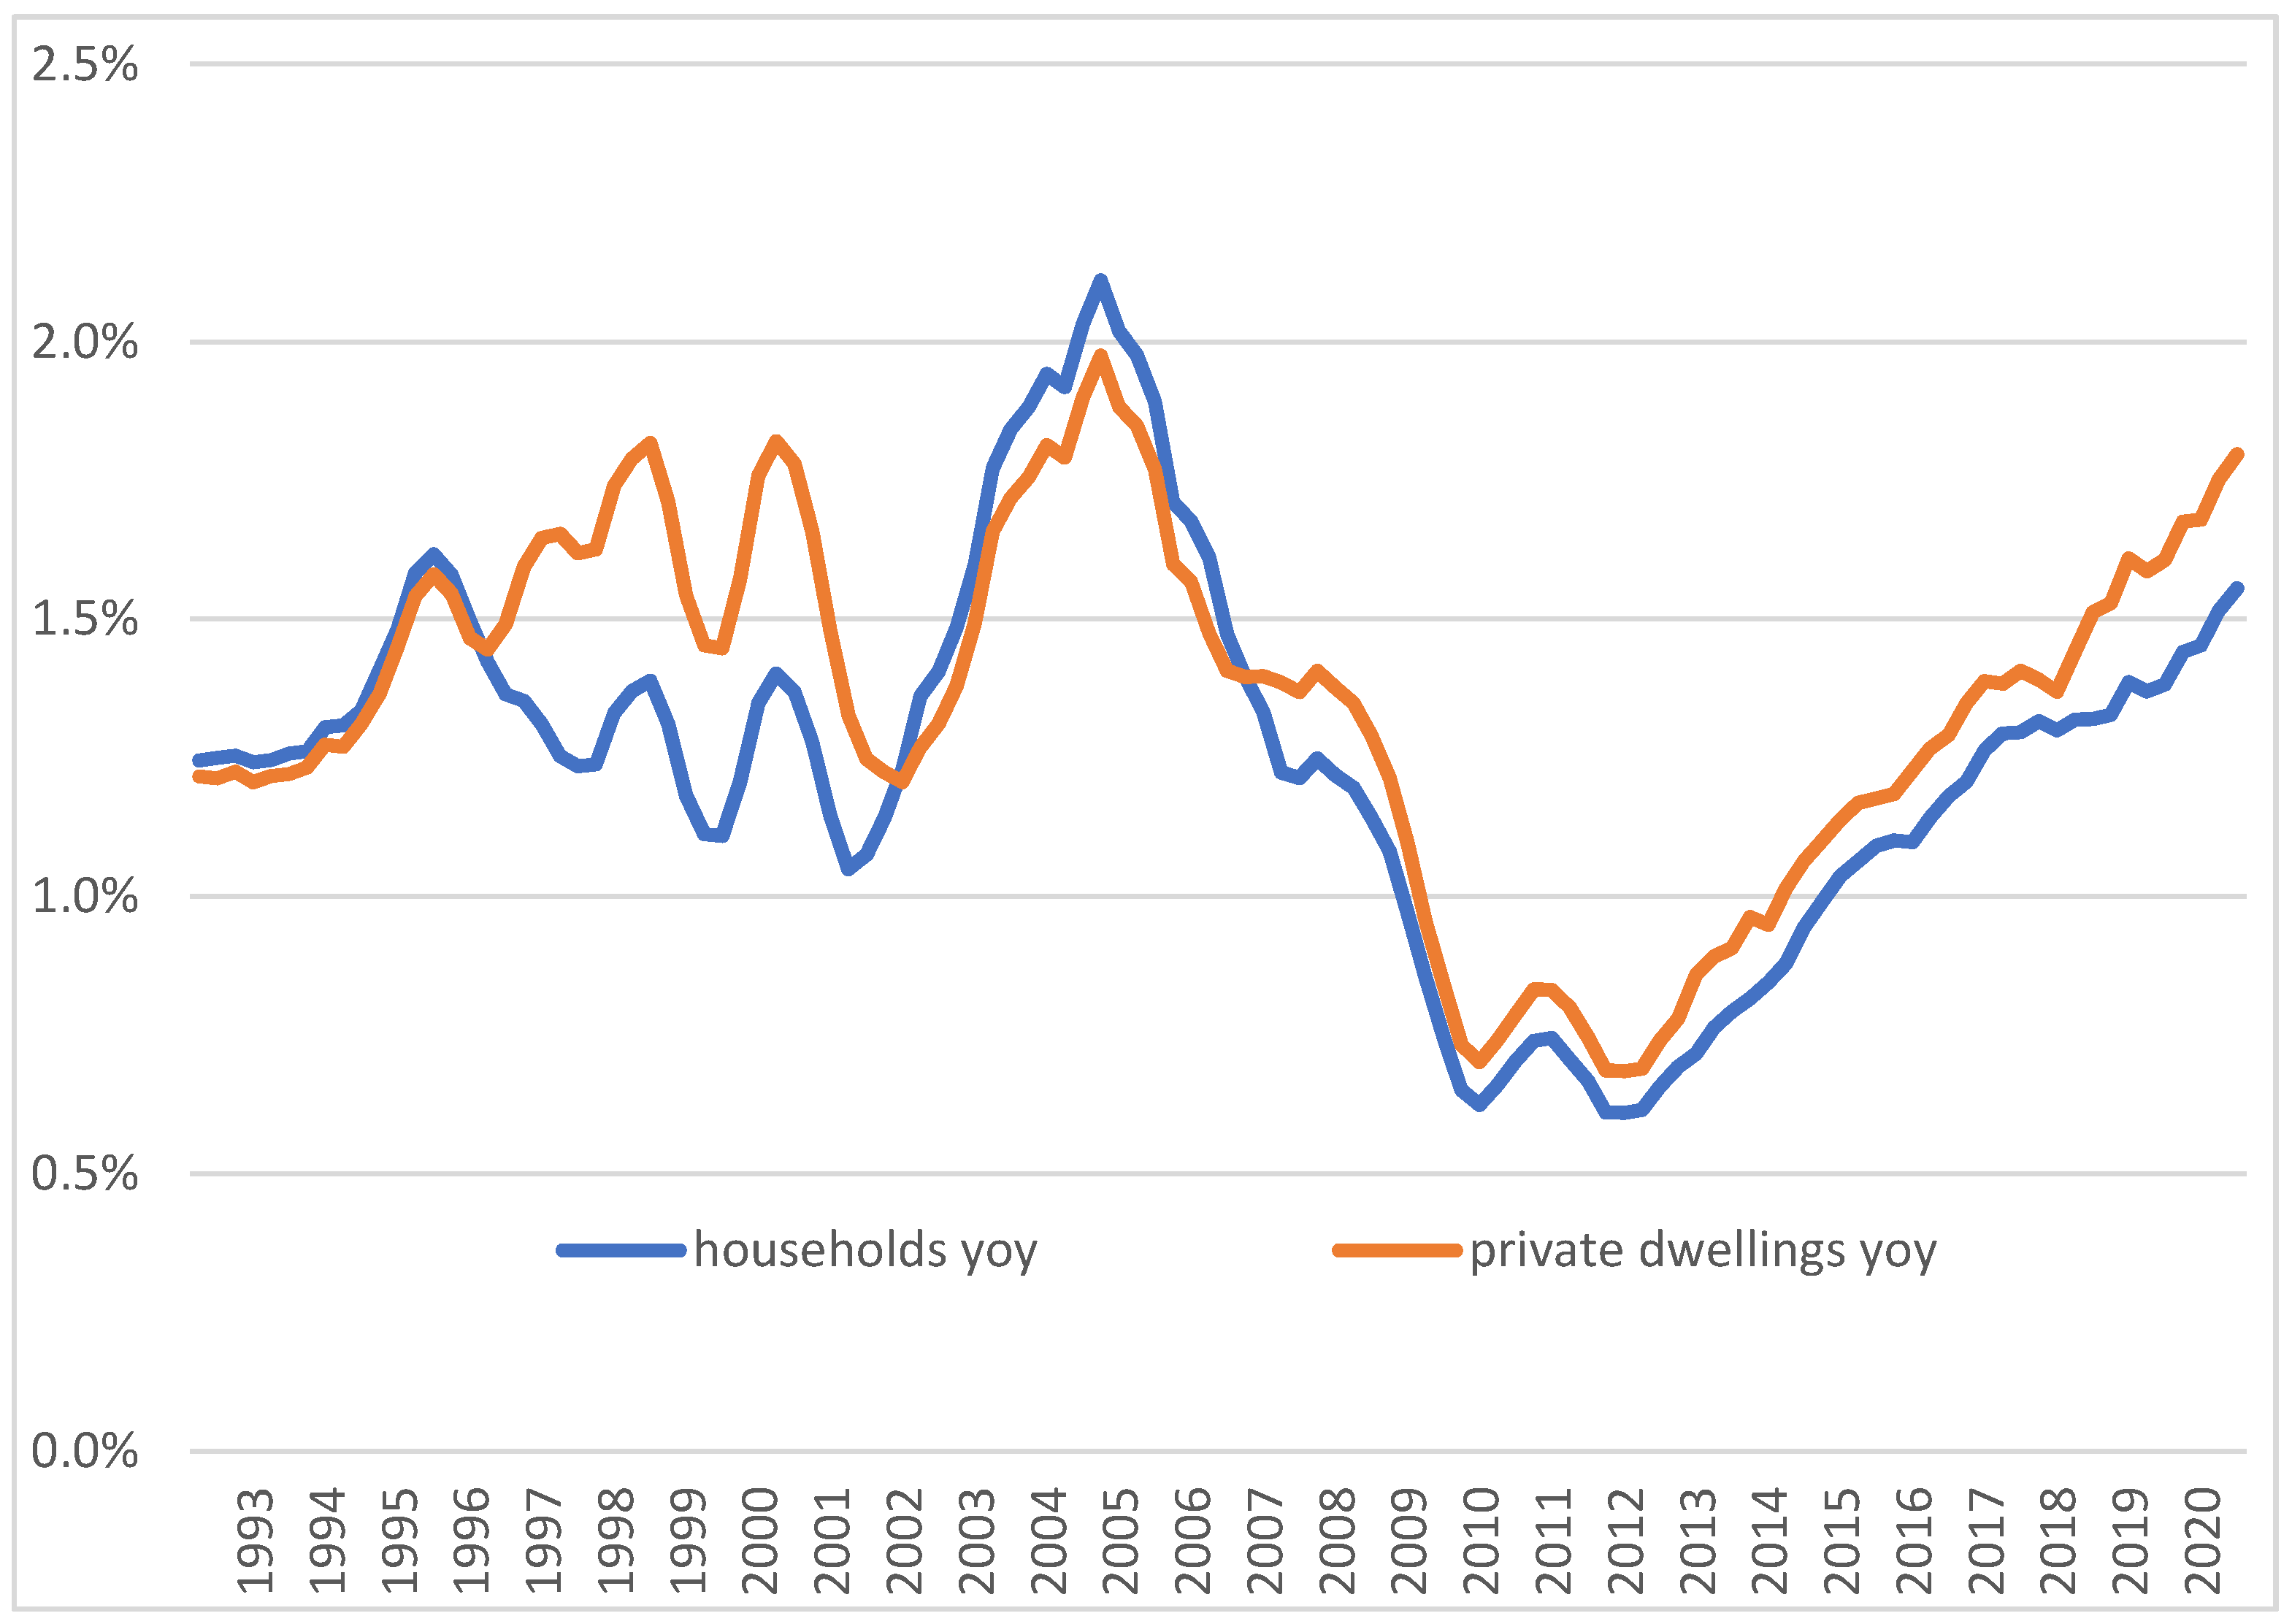
Furthermore, the insufficient housing supply hypothesis is also controlled by the continuous effort of the New Zealand government to increase the housing supply. For instance, it was reported that there were 1188 and 1585 surpluses out of 10,080 and 14,353 new dwellings completed compared to new dwellings required in Auckland [42]. Figure 2 further shows that the rate of increase in the number of private dwellings has been above that of the number of households in New Zealand since 2007.
3.3. Controls by Quasi-Experiment
With these two policy interventions together with the recessionary period after the outbreak of COVID, an one-country time series regression model is conducted on the housing markets of New Zealand to test the monetary policy hypothesis. This model provides three key contributions. First, in econometric models, it is hard to include a proxy for insufficient housing supply because data of vacancy rates are usually not available or not of good quality. The continuous surplus in housing completion in New Zealand controls this factor extraneously. Second, the migrants’ effect can have reverse causality with house prices and economic growth. It is difficult to specify their inter-relationships in a regression model. The regulatory restriction of foreign homebuyers controls the migrants’ effect on house prices via a policy intervention. Third, the recessionary period (continuous negative GDP growth rates) also controls the positive economic growth effect and the negative unemployment effect on house prices.
In addition to using an one-country time series regression (Equation (1)) study, a five-country panel regression model (Equation (2)) is exploited to test the monetary policy hypothesis, taking real interest rate as the proxy.
where ,, and are house price index, real interest rate, gross domestic products, and unemployment rates of country i at time t. control cross-country fixed effects in the panel model, for the autoregressive effect of house price changes in a one-quarter lag.are coefficients to be estimated. are the error terms.
A cross-country panel study can control local factors by a cross-sectional fixed effect, but it cannot sort out endogeneity and confounding biases. For example, there have been housing price growth periods coinciding with economic growth and negative real interest rate. As the explanatory variables are not independent but interrelated, their individual effect on house prices cannot be easily differentiated.
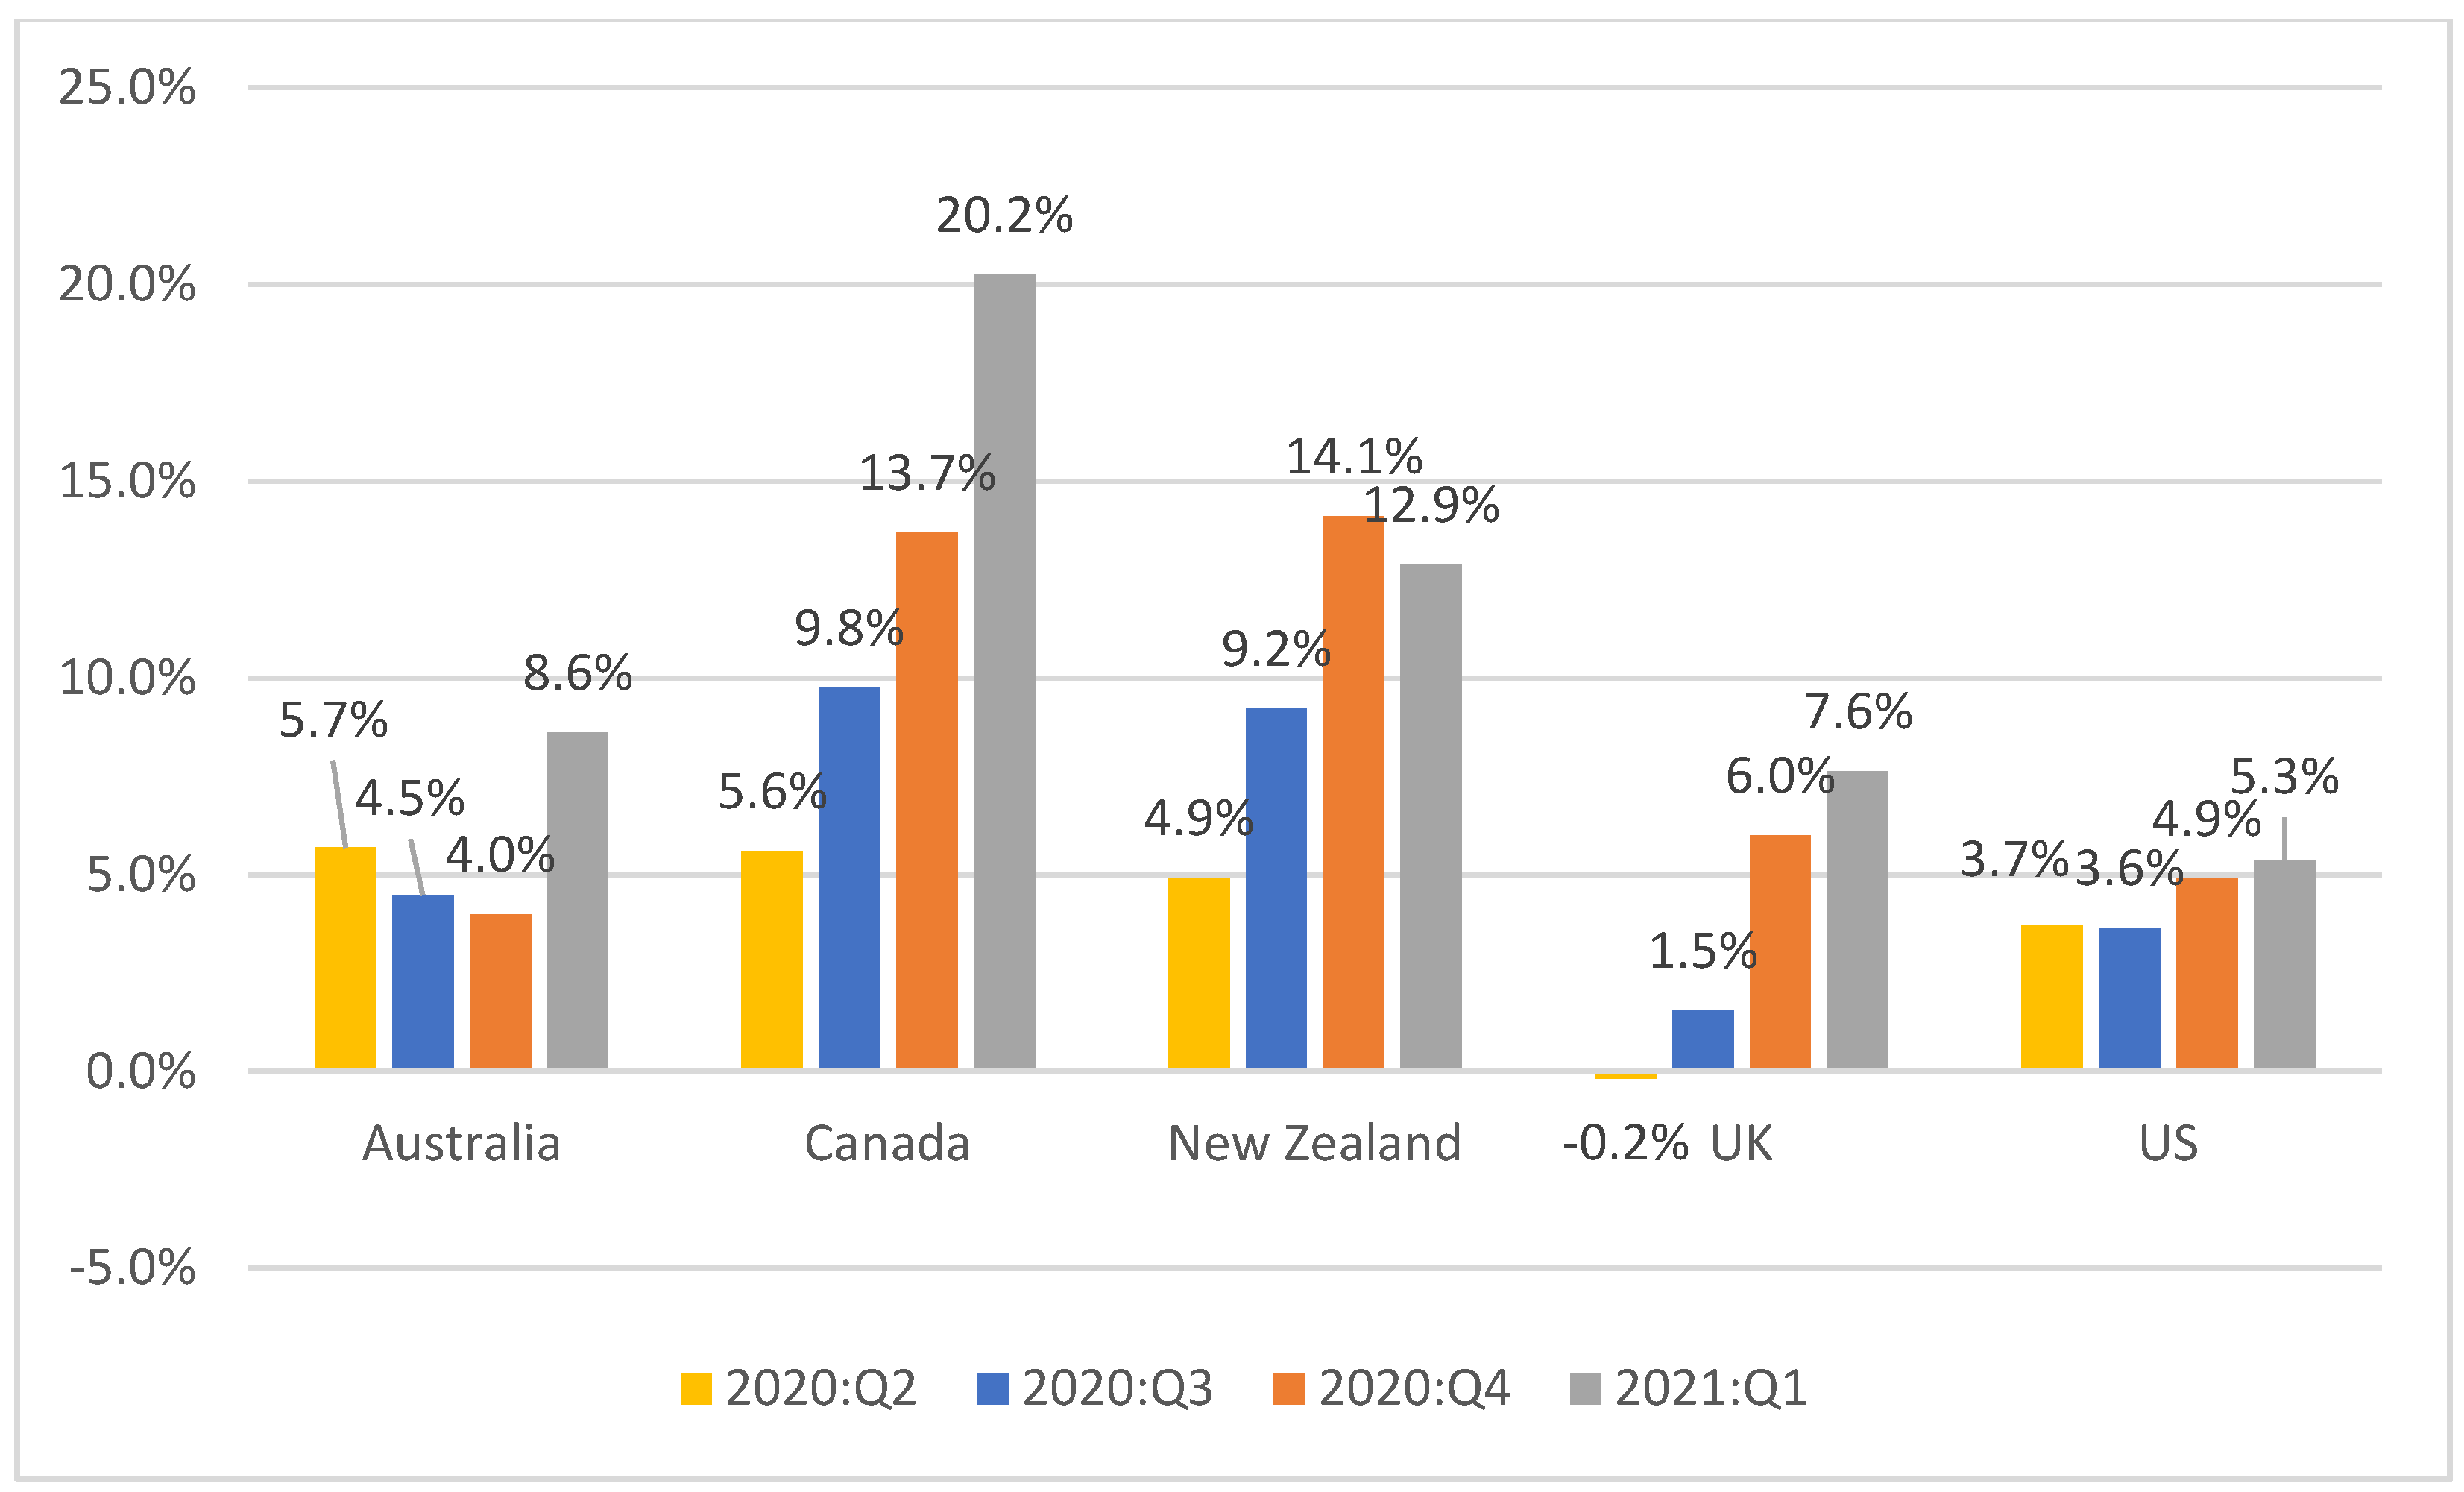
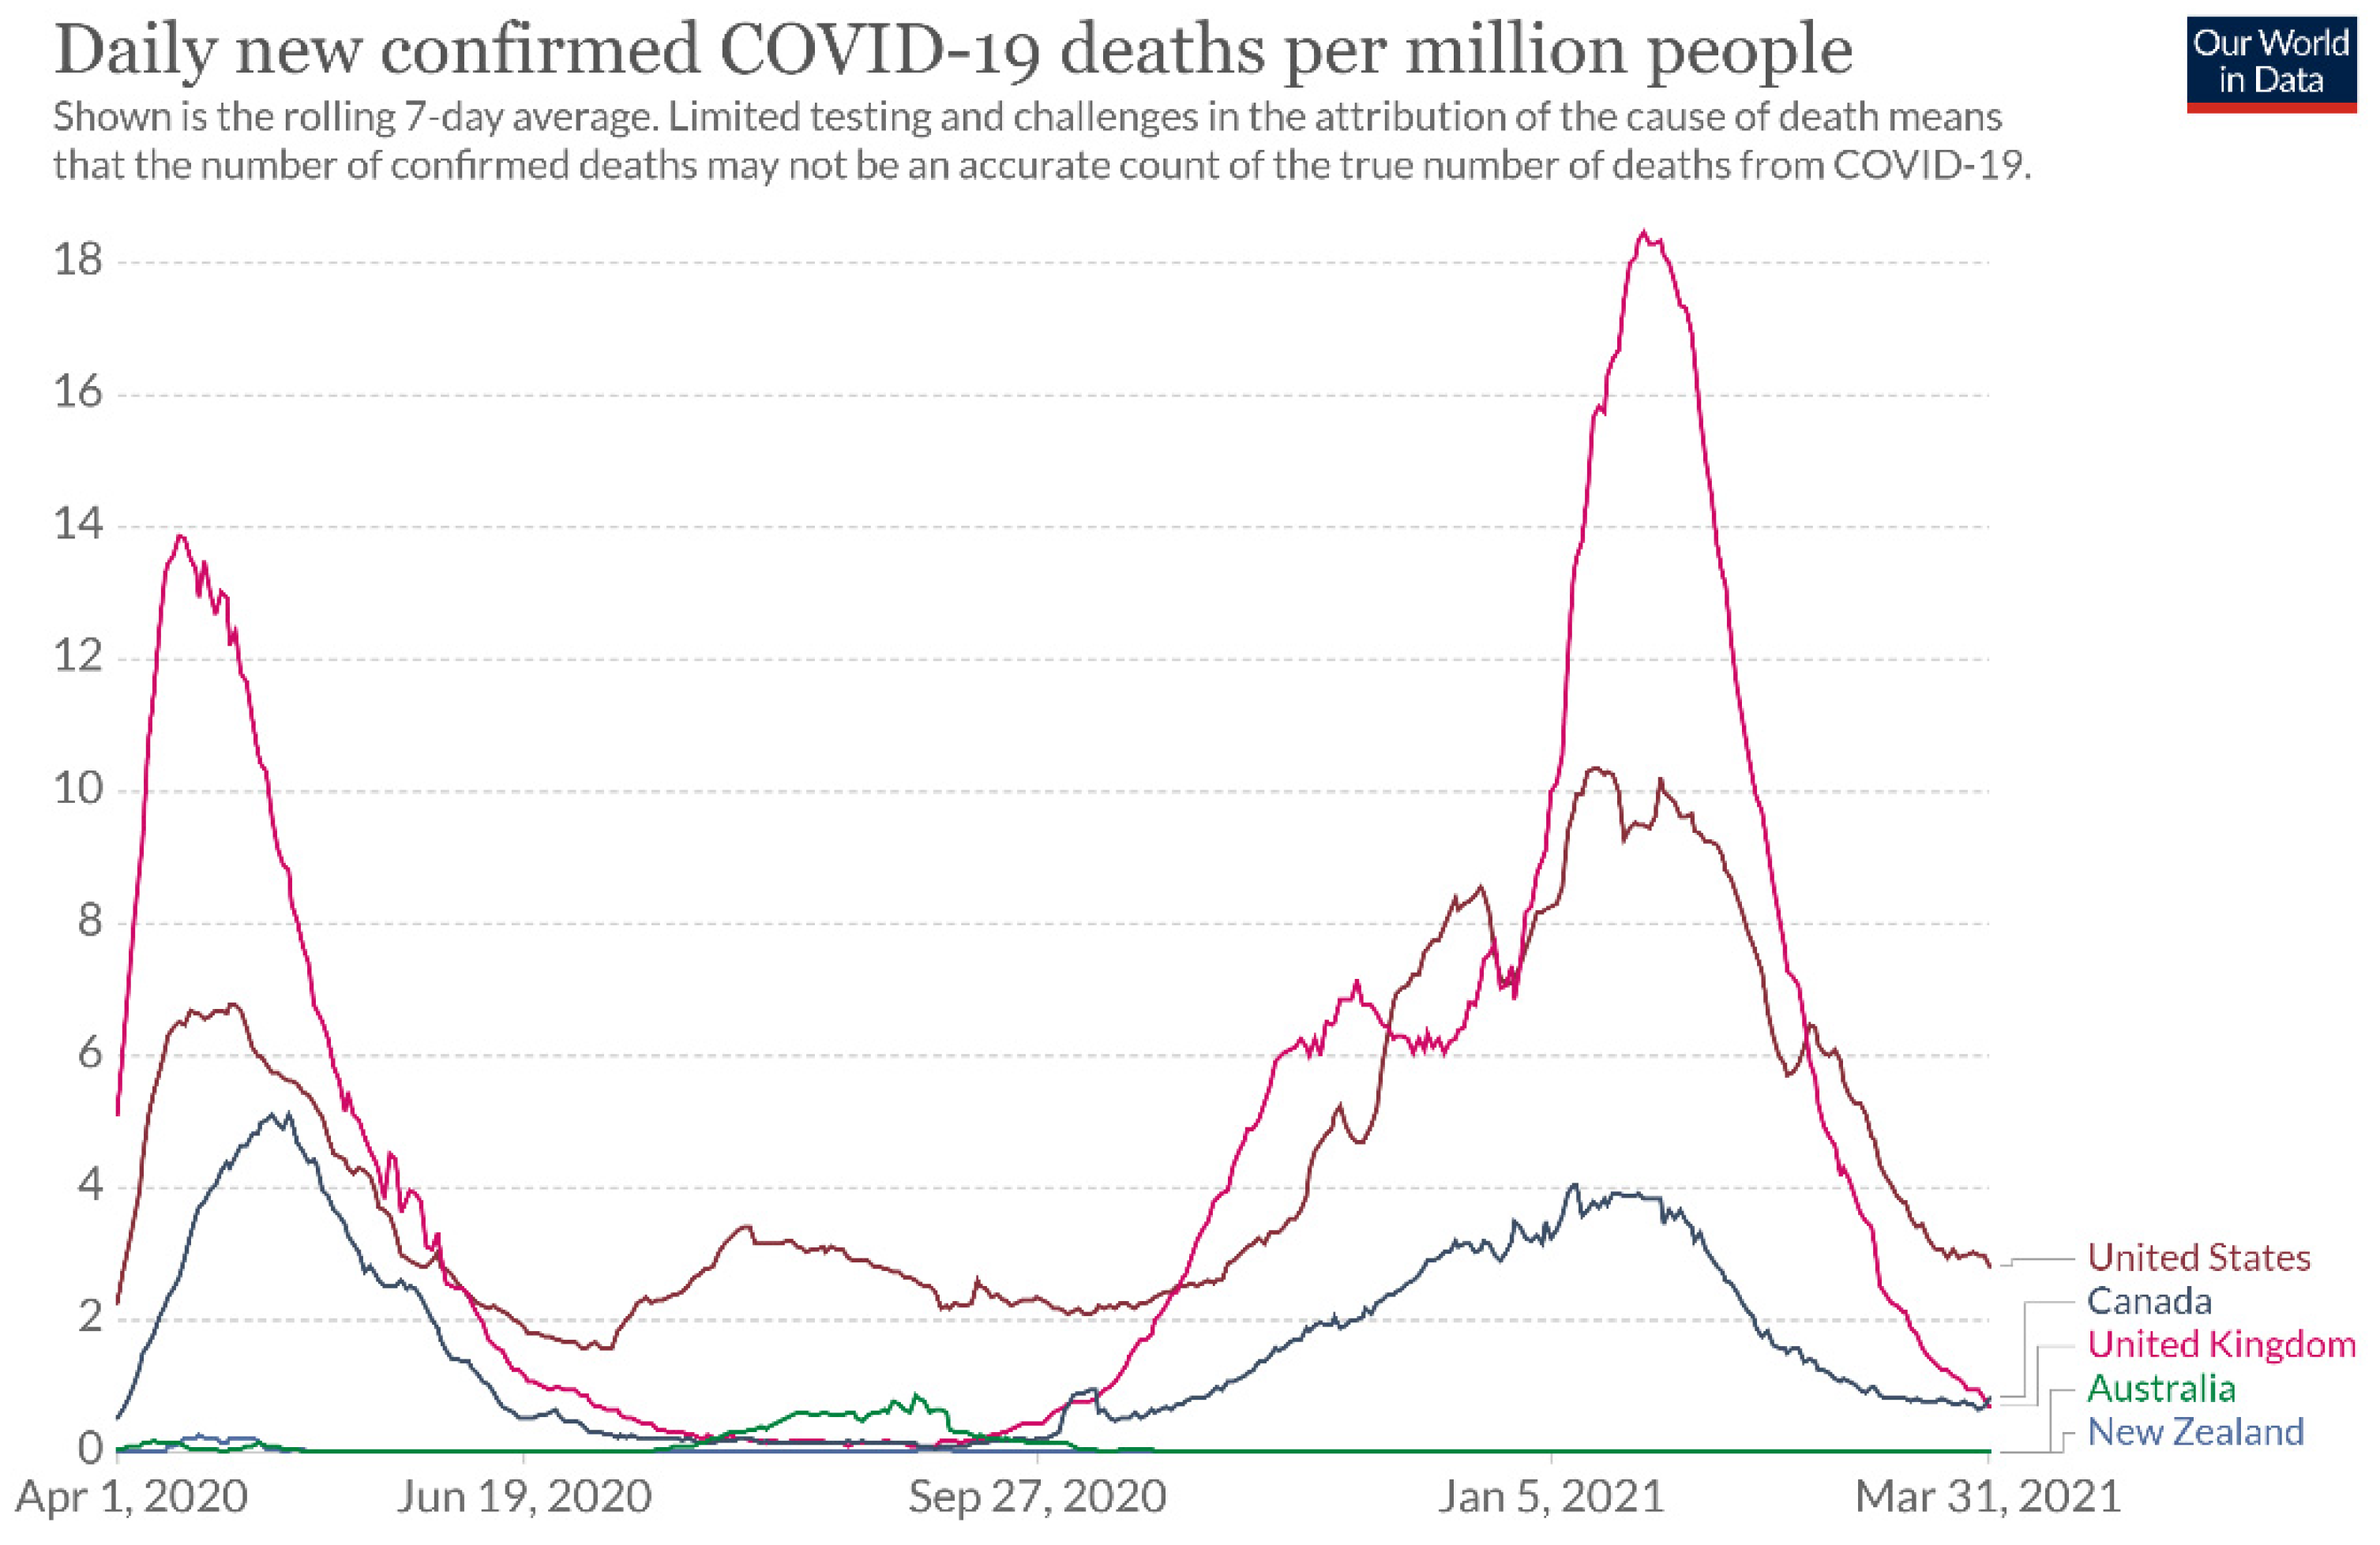
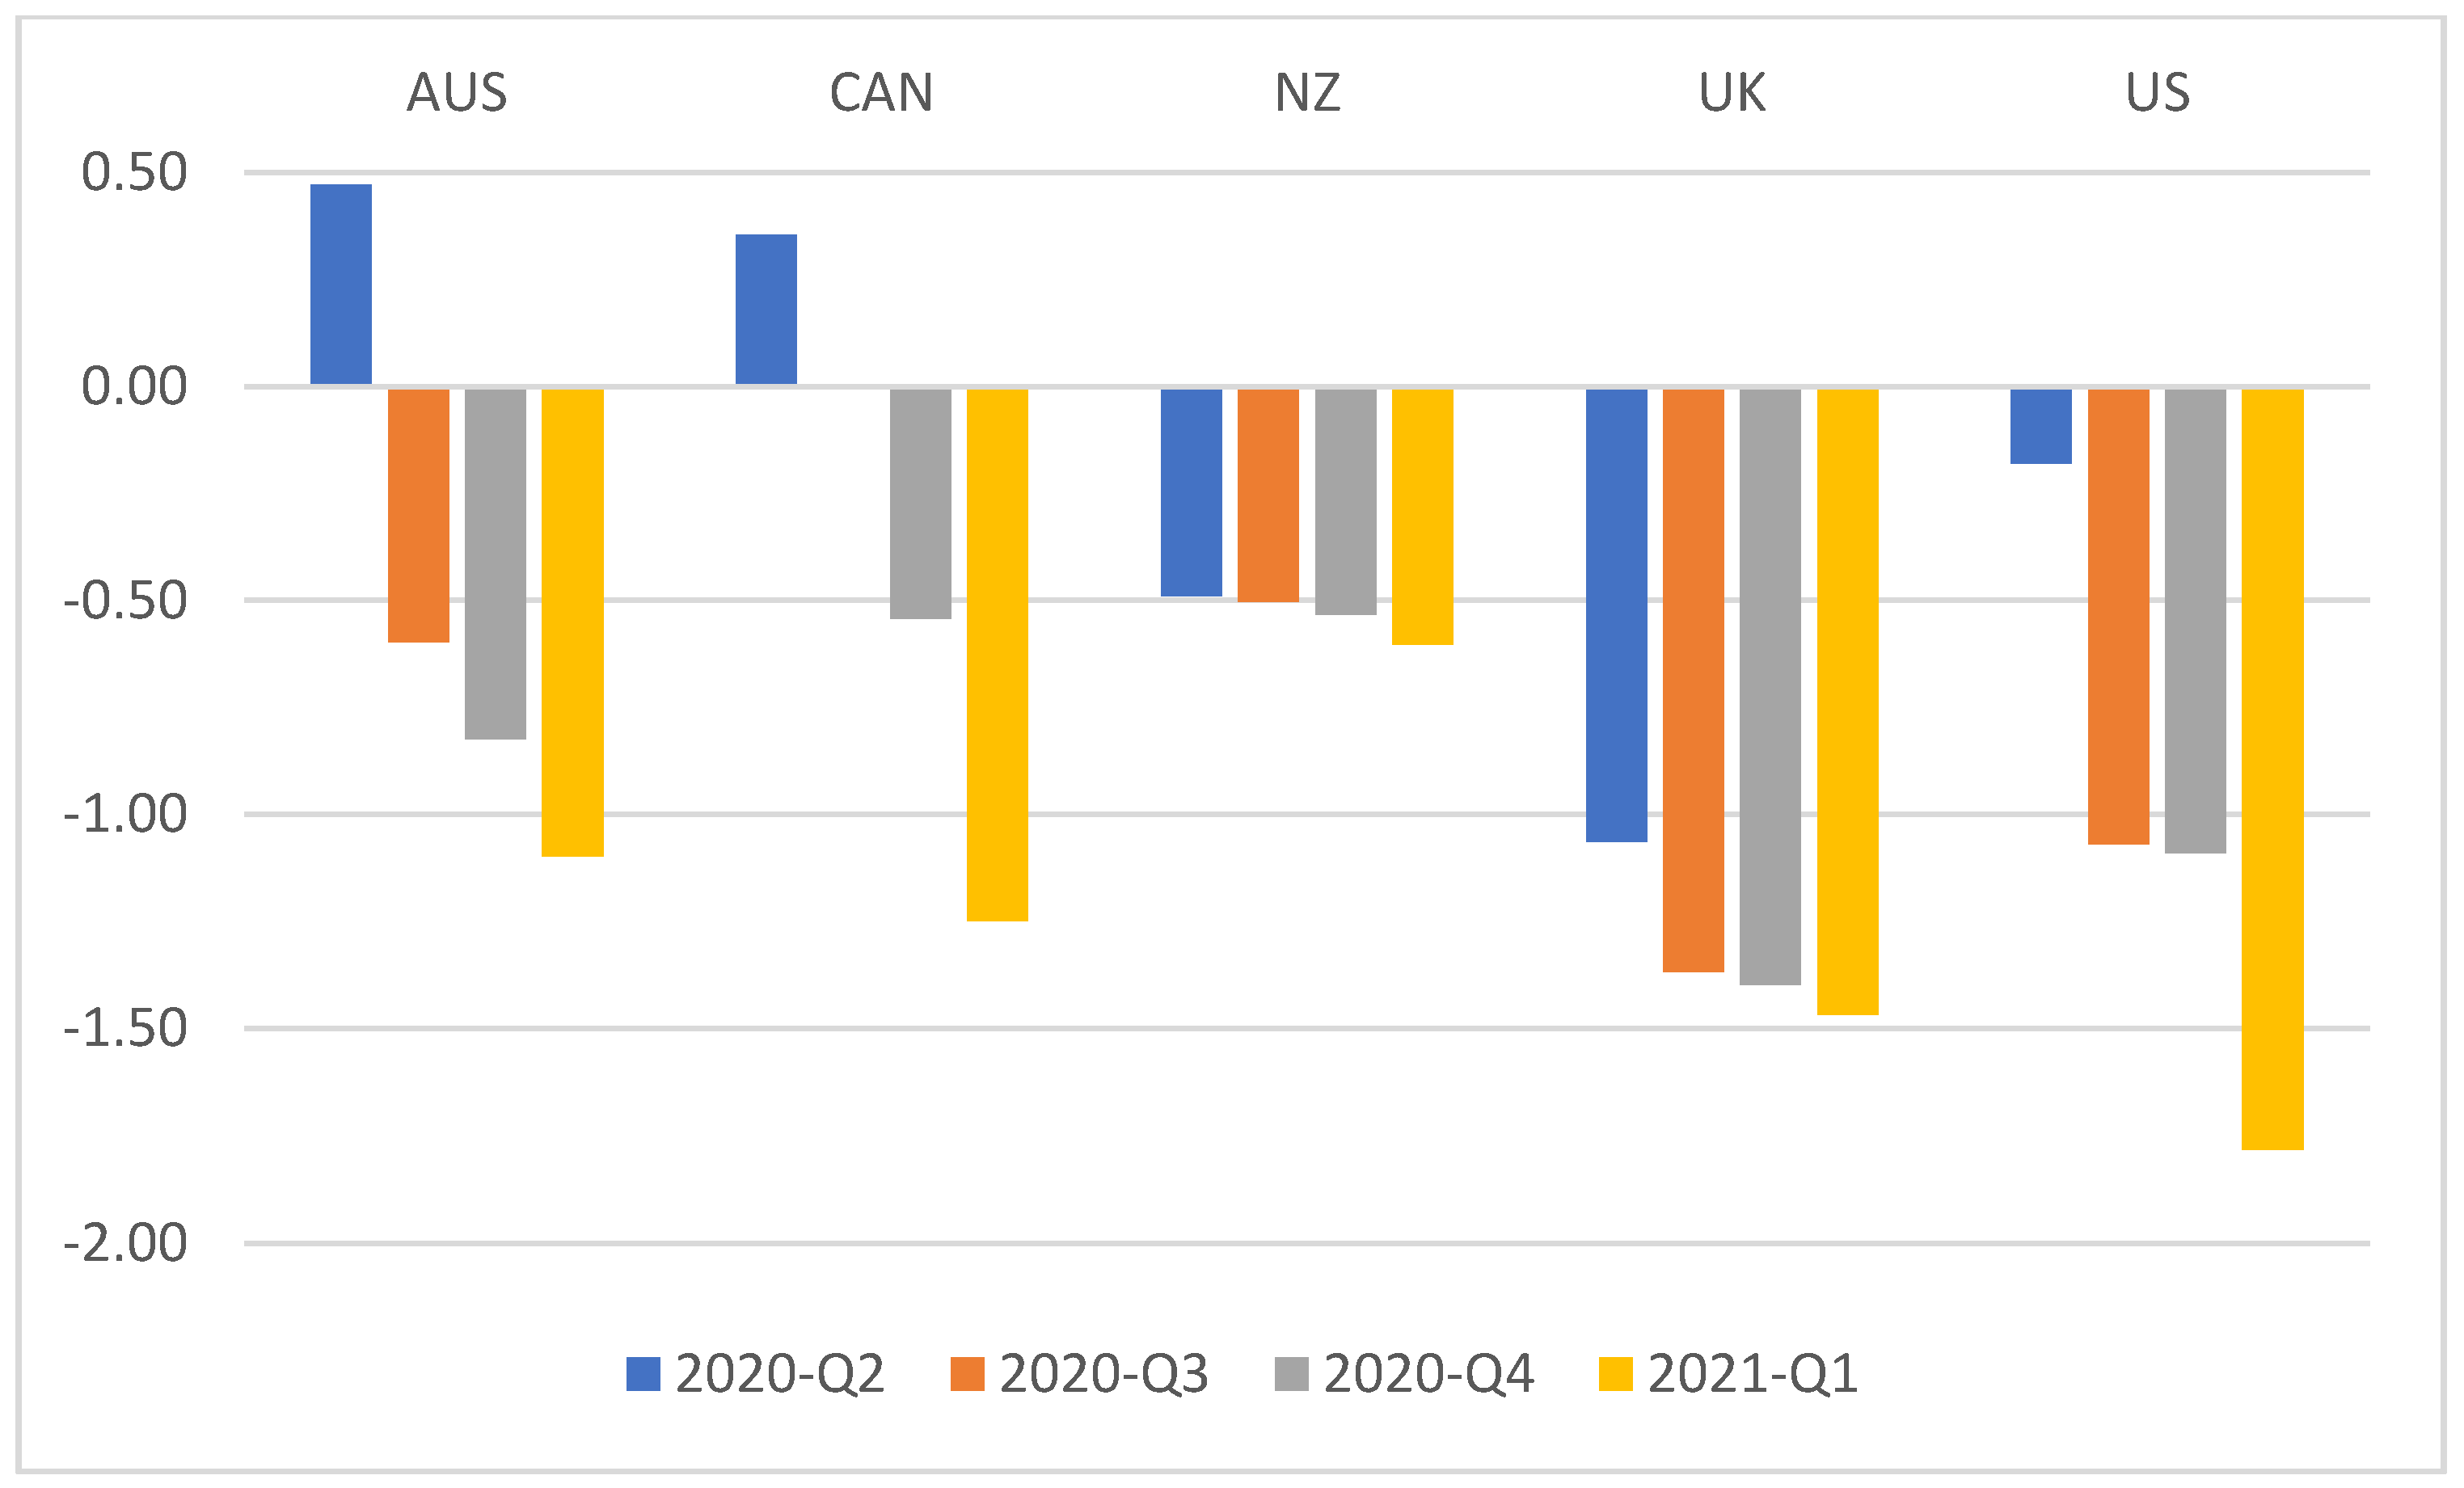
This study made use of the global recessionary period after the outbreak of COVID as a quasi-experiment to study the monetary policy hypothesis in the five-country panel analysis. Figure 3 shows the year-on-year changes of house prices of the five countries in Q3, Q4 of 2020, and Q1 of 2021. All showed positive growth rates. Canada and New Zealand, in particular, got double-digit growth rates in 2020Q4 and 2021Q1. They even showed a common trend of increasing growth rates reflecting that house price increase is not just a market price fluctuation. This phenomenon was contrary to the expectations of many people, as these countries have undergone complete or partial lockdowns, and the deadly virus has been spreading fiercely in the whole world. The 7-day rolling average of the COVID death rates relative to the population in these five countries shows two peaks in Q1 of 2020 and Q1 of 2021, as shown in Figure 4. The situations of Australia and New Zealand were better, but those in the US, UK, and Canada were worrying.
The pandemic has caused a global recession, and Figure 5 shows the GDP quarterly growth rates from 2020Q1 to 2020Q2 of the five countries. It is a unique situation when the GDP growth rates of many countries were negative, unemployment rates surged, and the central banks cut their interest rates substantially as a concerted effort to save the economies. In other words, after the outbreak of COVID, two of the three major factors (recession and unemployment) were pushing house prices to fall, and only one factor (real interest rate) was pulling house prices to rise.
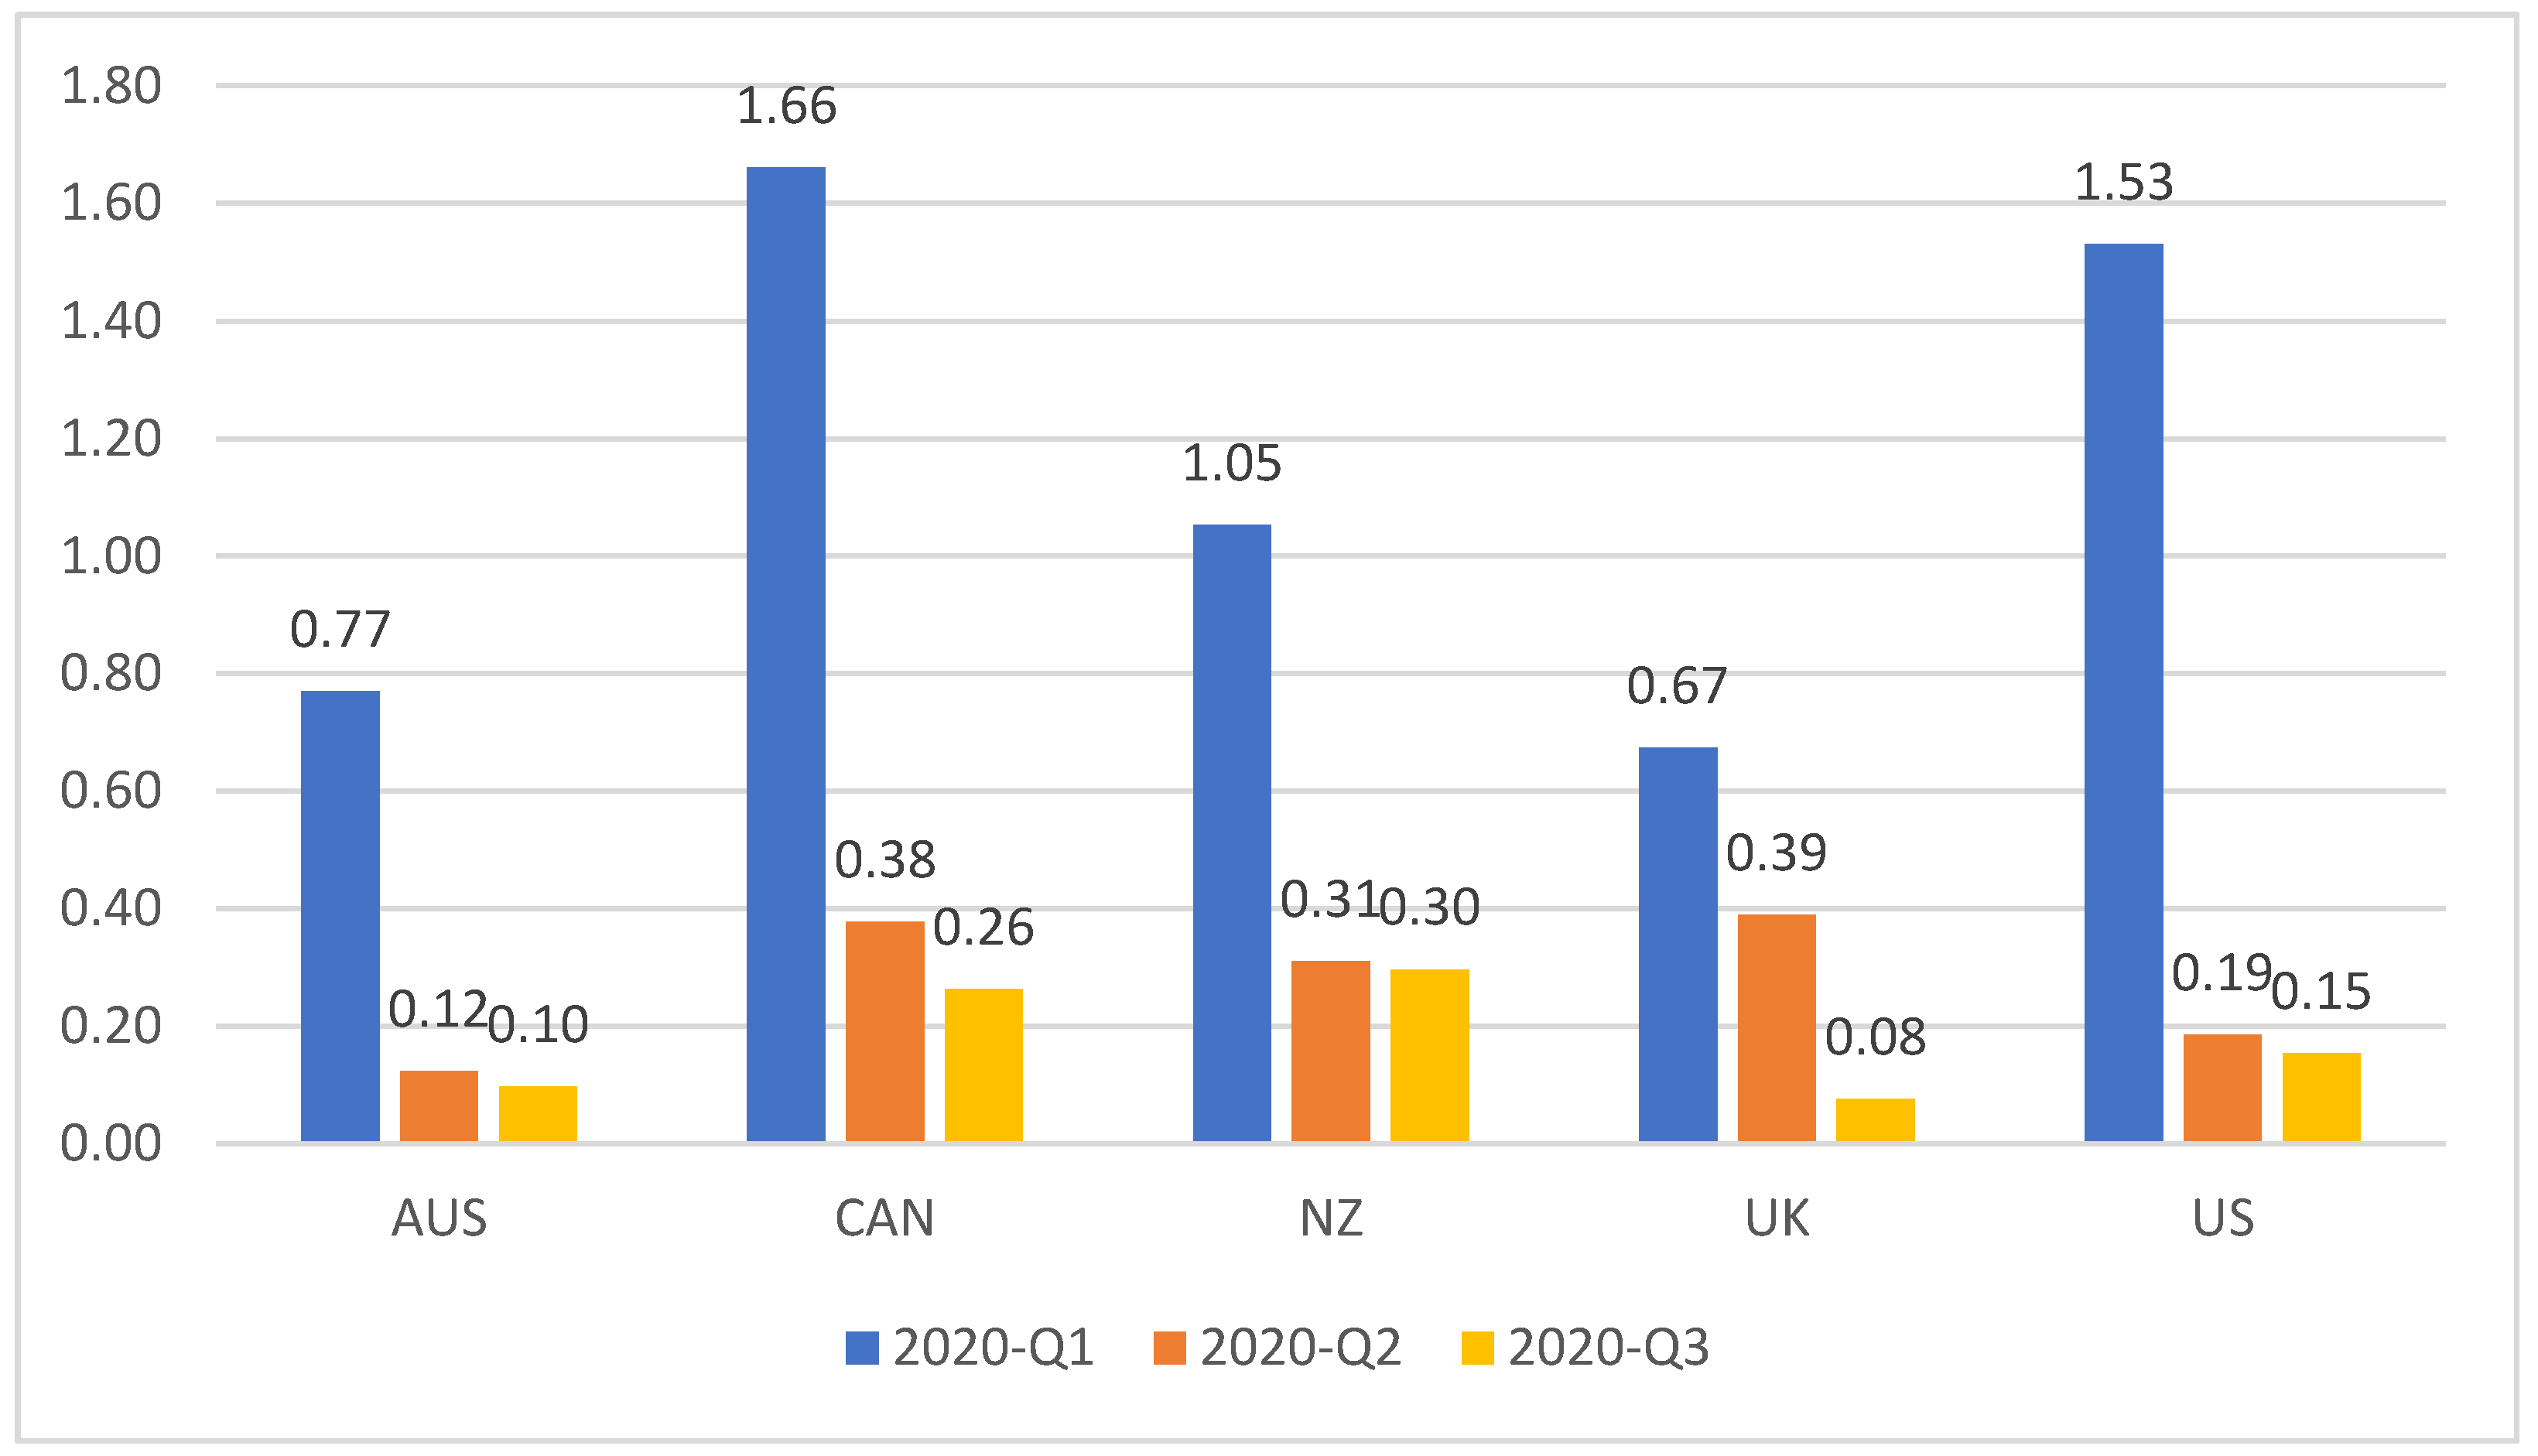
The synchronized interest rate cut is evident in Figure 6, which shows the short-term interest rates of each country before (2020Q1) and after (2020Q2, Q3) the outbreak of COVID. It resulted in a more negative real interest rate regime after 2020Q2, as shown in Figure 7. House prices globally were then rebounded with strong momentum almost at the same time. This works like an interventional experiment; when economic growth and unemployment effects are controlled to impose negative impacts on house prices, only real interest rates are reduced to test the responses of house prices globally.
4. Results
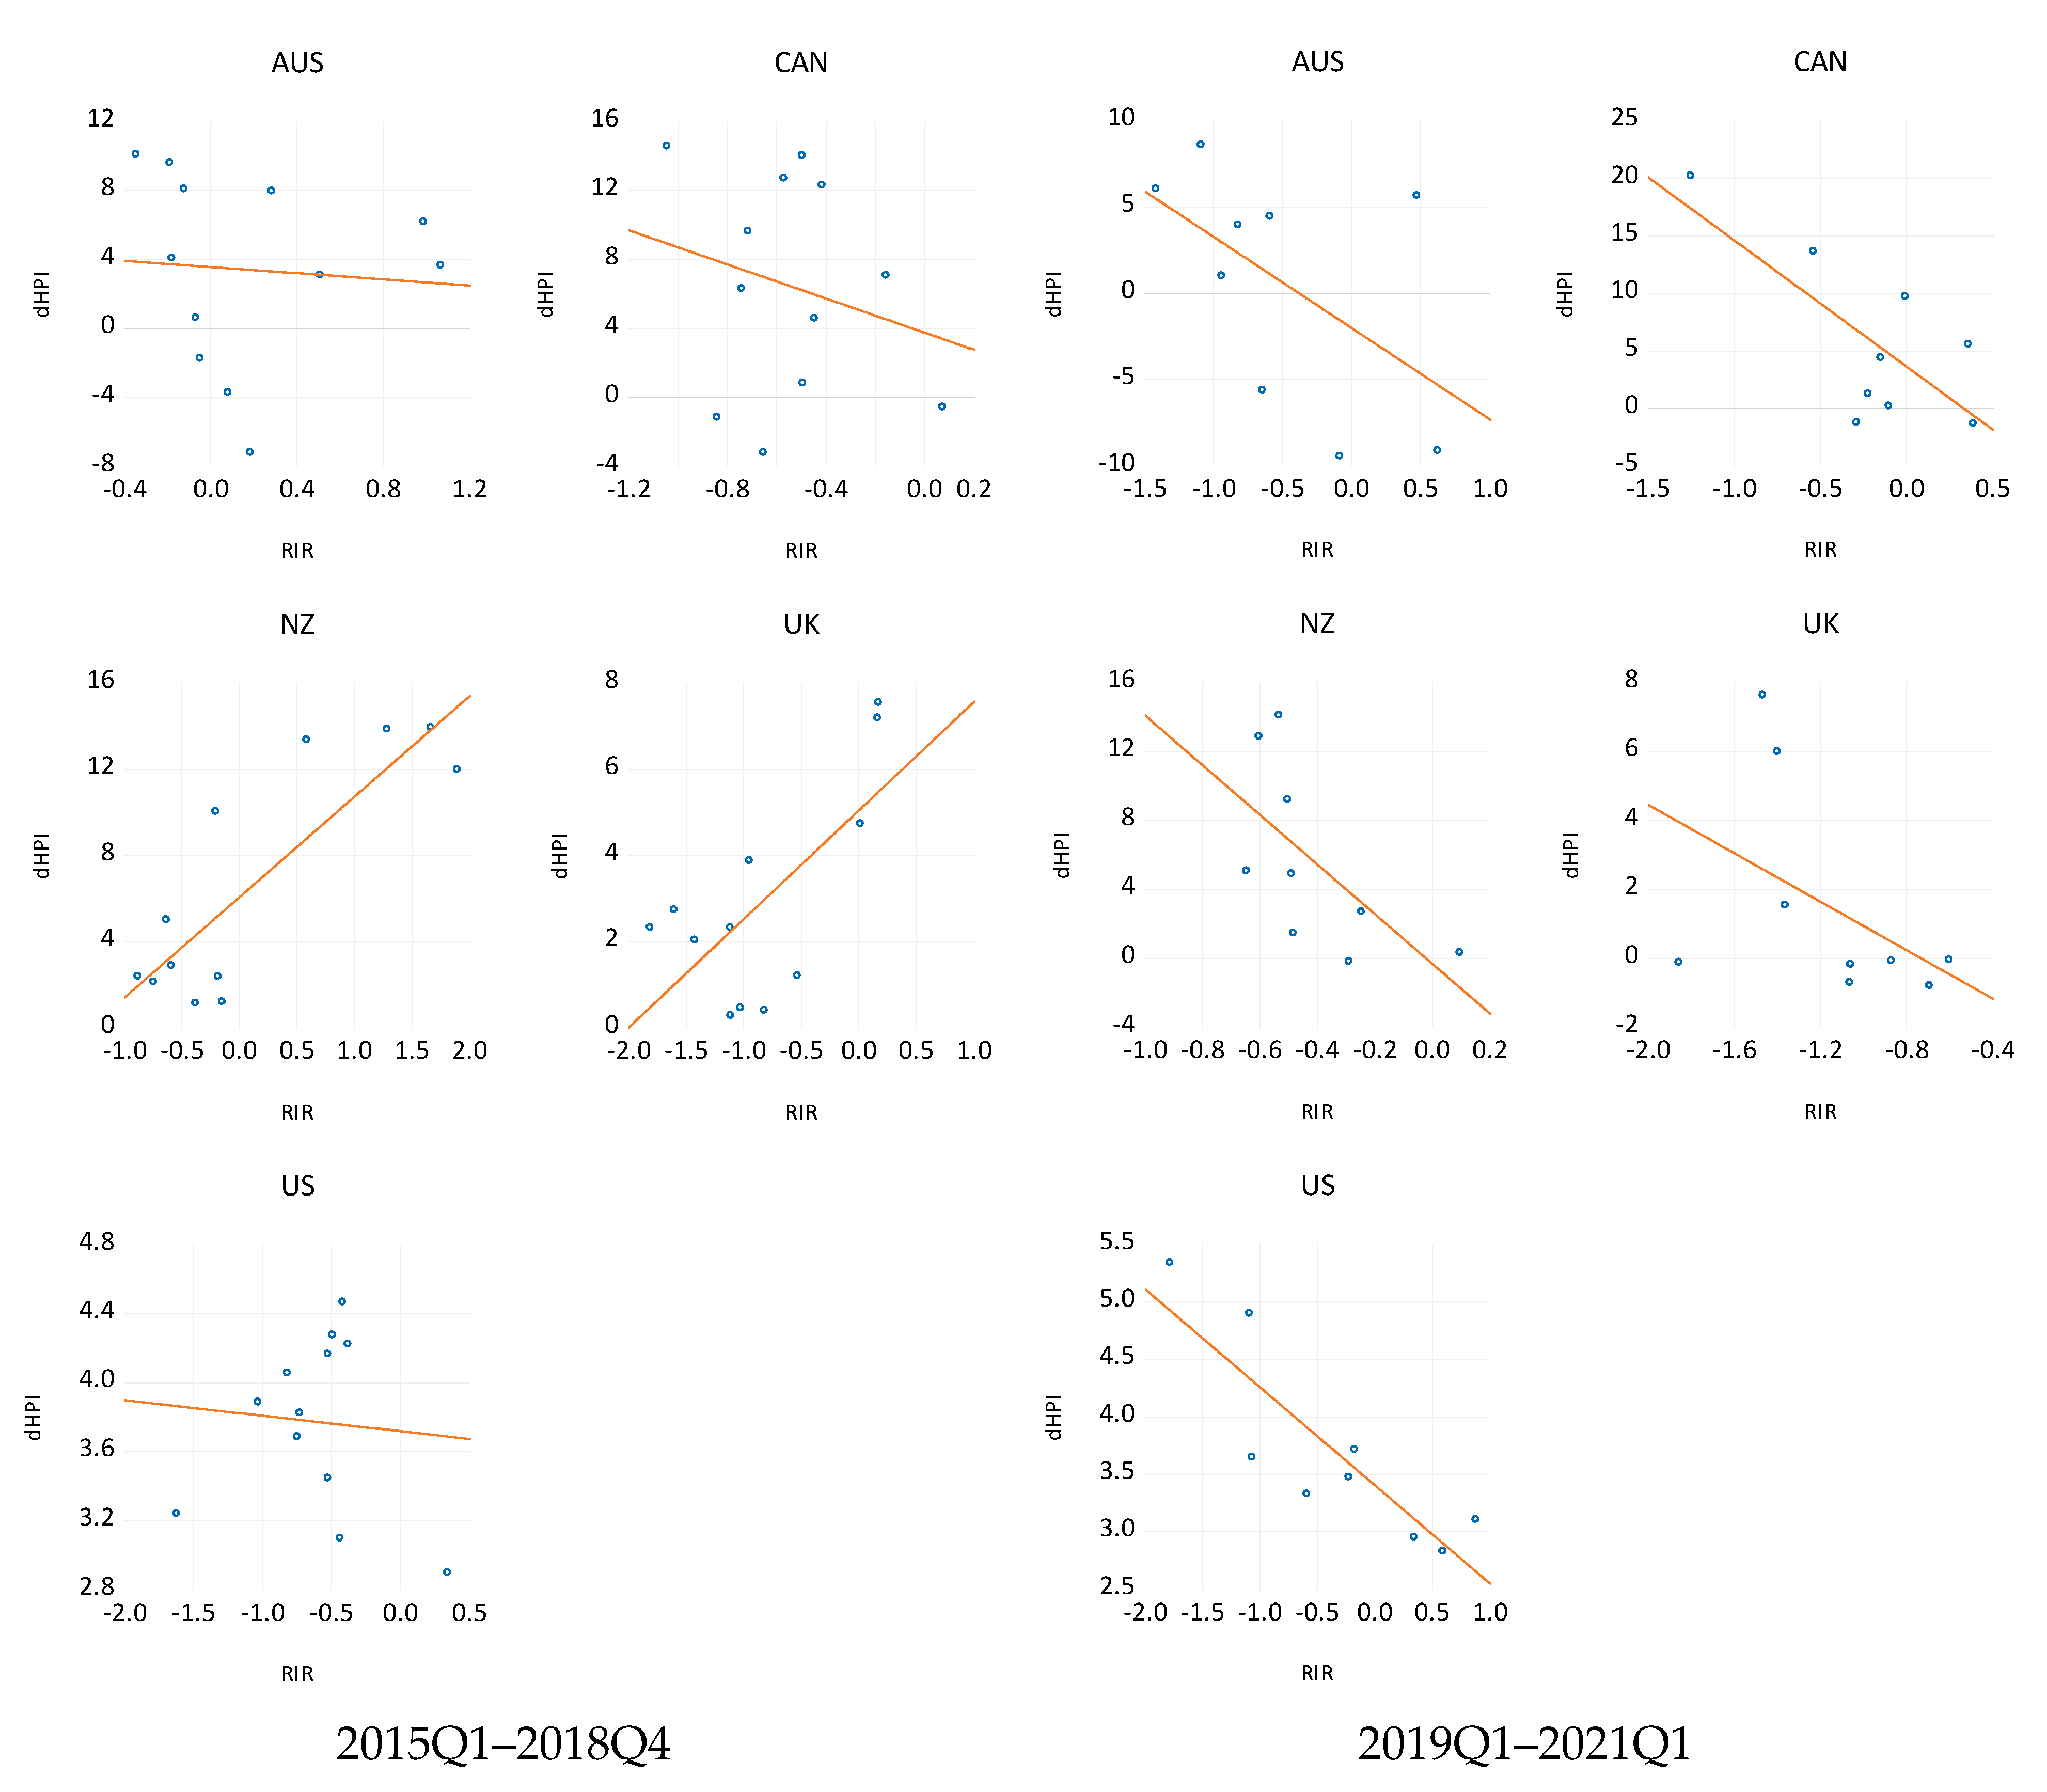
Before presenting the regression results, some casual observations based on scatterplots of house price changes and real interest rates are examined first. Figure 8 shows the correlation scatterplots of each country before and after 2019. In the pre-COVID period, since there were many other uncontrolled factors, such as the positive economic growths and low unemployment rates, that were mostly imposing positive effects on house prices, the negative association of real interest rate with house prices was not revealed in simple scatterplots (left panel of Figure 8). In contrast, since 2019, when both the economic growth and unemployment effects turned to impose negative effects on house prices, the dominant positive effect came from the real interest rates only. The negative associations between house price changes and real interest rates are clearly and uniformly shown in all the five countries (right panel of Figure 8).
Table 3 shows the empirical results of the one-country time series regression and the five-country panel regression models. In the one-country regression model (Model 1), probably due to the small number of observations, the coefficients were not statistically significant. Yet, the sign and magnitude of the RIR coefficient were negative at about −1.4%. In the five-country panel model (Model 2), the sign and magnitude of the RIR coefficient were negative at about −1.5%. The significance of the results of Model 2 provides rigorous evidence by means of a quasi-experiment on the monetary policy hypothesis. First, the model revealed a negative association between real interest rates and house price changes. The empirical result of the five housing markets showed that a 1% fall in the real interest rate caused a 1.5% increase in house prices, ceteris paribus, in this period, after controlling for the individual country effect.
Since in this special period, the interest rates were cut globally as a synchronized intervention, and, moreover, the economic growth effect and the unemployment effect were controlled to impose negative impacts on house price changes, the significant association of real interest rates and real house price changes, therefore, implies a causation relationship from real interest rates to house price changes. Economic growth factor showed a positive association with house price changes which was only statistically significant at the 10% level, and a strong autoregressive pattern was found.
5. Discussion
First, this is the first attempt to apply a quasi-experiment to study the monetary policy hypothesis. It is different from the previous studies relying on econometric methods to deal with confounding and endogeneity biases. This study, instead, exploited the special period after the outbreak of COVID-19 pandemic when the global economy was negatively affected. Central banks of most countries took a concerted effort to implement synchronized interest rate cuts, among other easing measures, to survive the economies. As a result, house prices increased globally with strong momentum.
These phenomena provided a unique opportunity to empirical test the monetary policy hypothesis, i.e., an expansionary monetary policy, such as negative real interest rate, causes house price increases, ceteris paribus. Applying a quasi-experimental approach in this period can first exclude the reason of economic growth because the global economy was hard hit by the pandemic, and most of the developed countries were under economic recession with high unemployment rates in 2020.
Better still, a cross-country panel regression analysis can also exclude local factors, such as migrants’ effects and insufficient housing supply factor, as these arguments can hardly co-exist after the outbreak of COVID in different countries, especially in New Zealand. This is because since the Overseas Investment Amendment Act came into effect in late October 2018 in New Zealand, non-citizen and non-resident (NCNR) are restricted from buying residential land and existing properties. Moreover, there has been a long period of housing surpluses and a higher rate of housing completion than the rate of household formation in New Zealand. The one-country regression model of New Zealand got highly similar results in both the signs and magnitudes of the coefficients, though statistically insignificant in the one-country model probably due to the short period of time, which provides further support on the empirical results of the five-country study.
The empirical results confirmed the monetary policy hypothesis, or more specifically the real interest rate hypothesis, by means of the quasi-experiment in the COVID period. The synchronized interest rate cuts by most central banks (to historic lows in some cases) during the COVID-19 period, as reported by Kingsly and Henri (2020) [45], acts as an intervention approach to test the causality relationship on top of the correlation association. The Reserve Bank of New Zealand, for example, decreased its Official Cash Rate from 1% to 0.25% in one go and removed the mortgage loan-to-value ratio restrictions in early 2020. The substantial reduction in interest rate resulted in a very low or even negative real interest rate regime, causing an increase in credit supply.
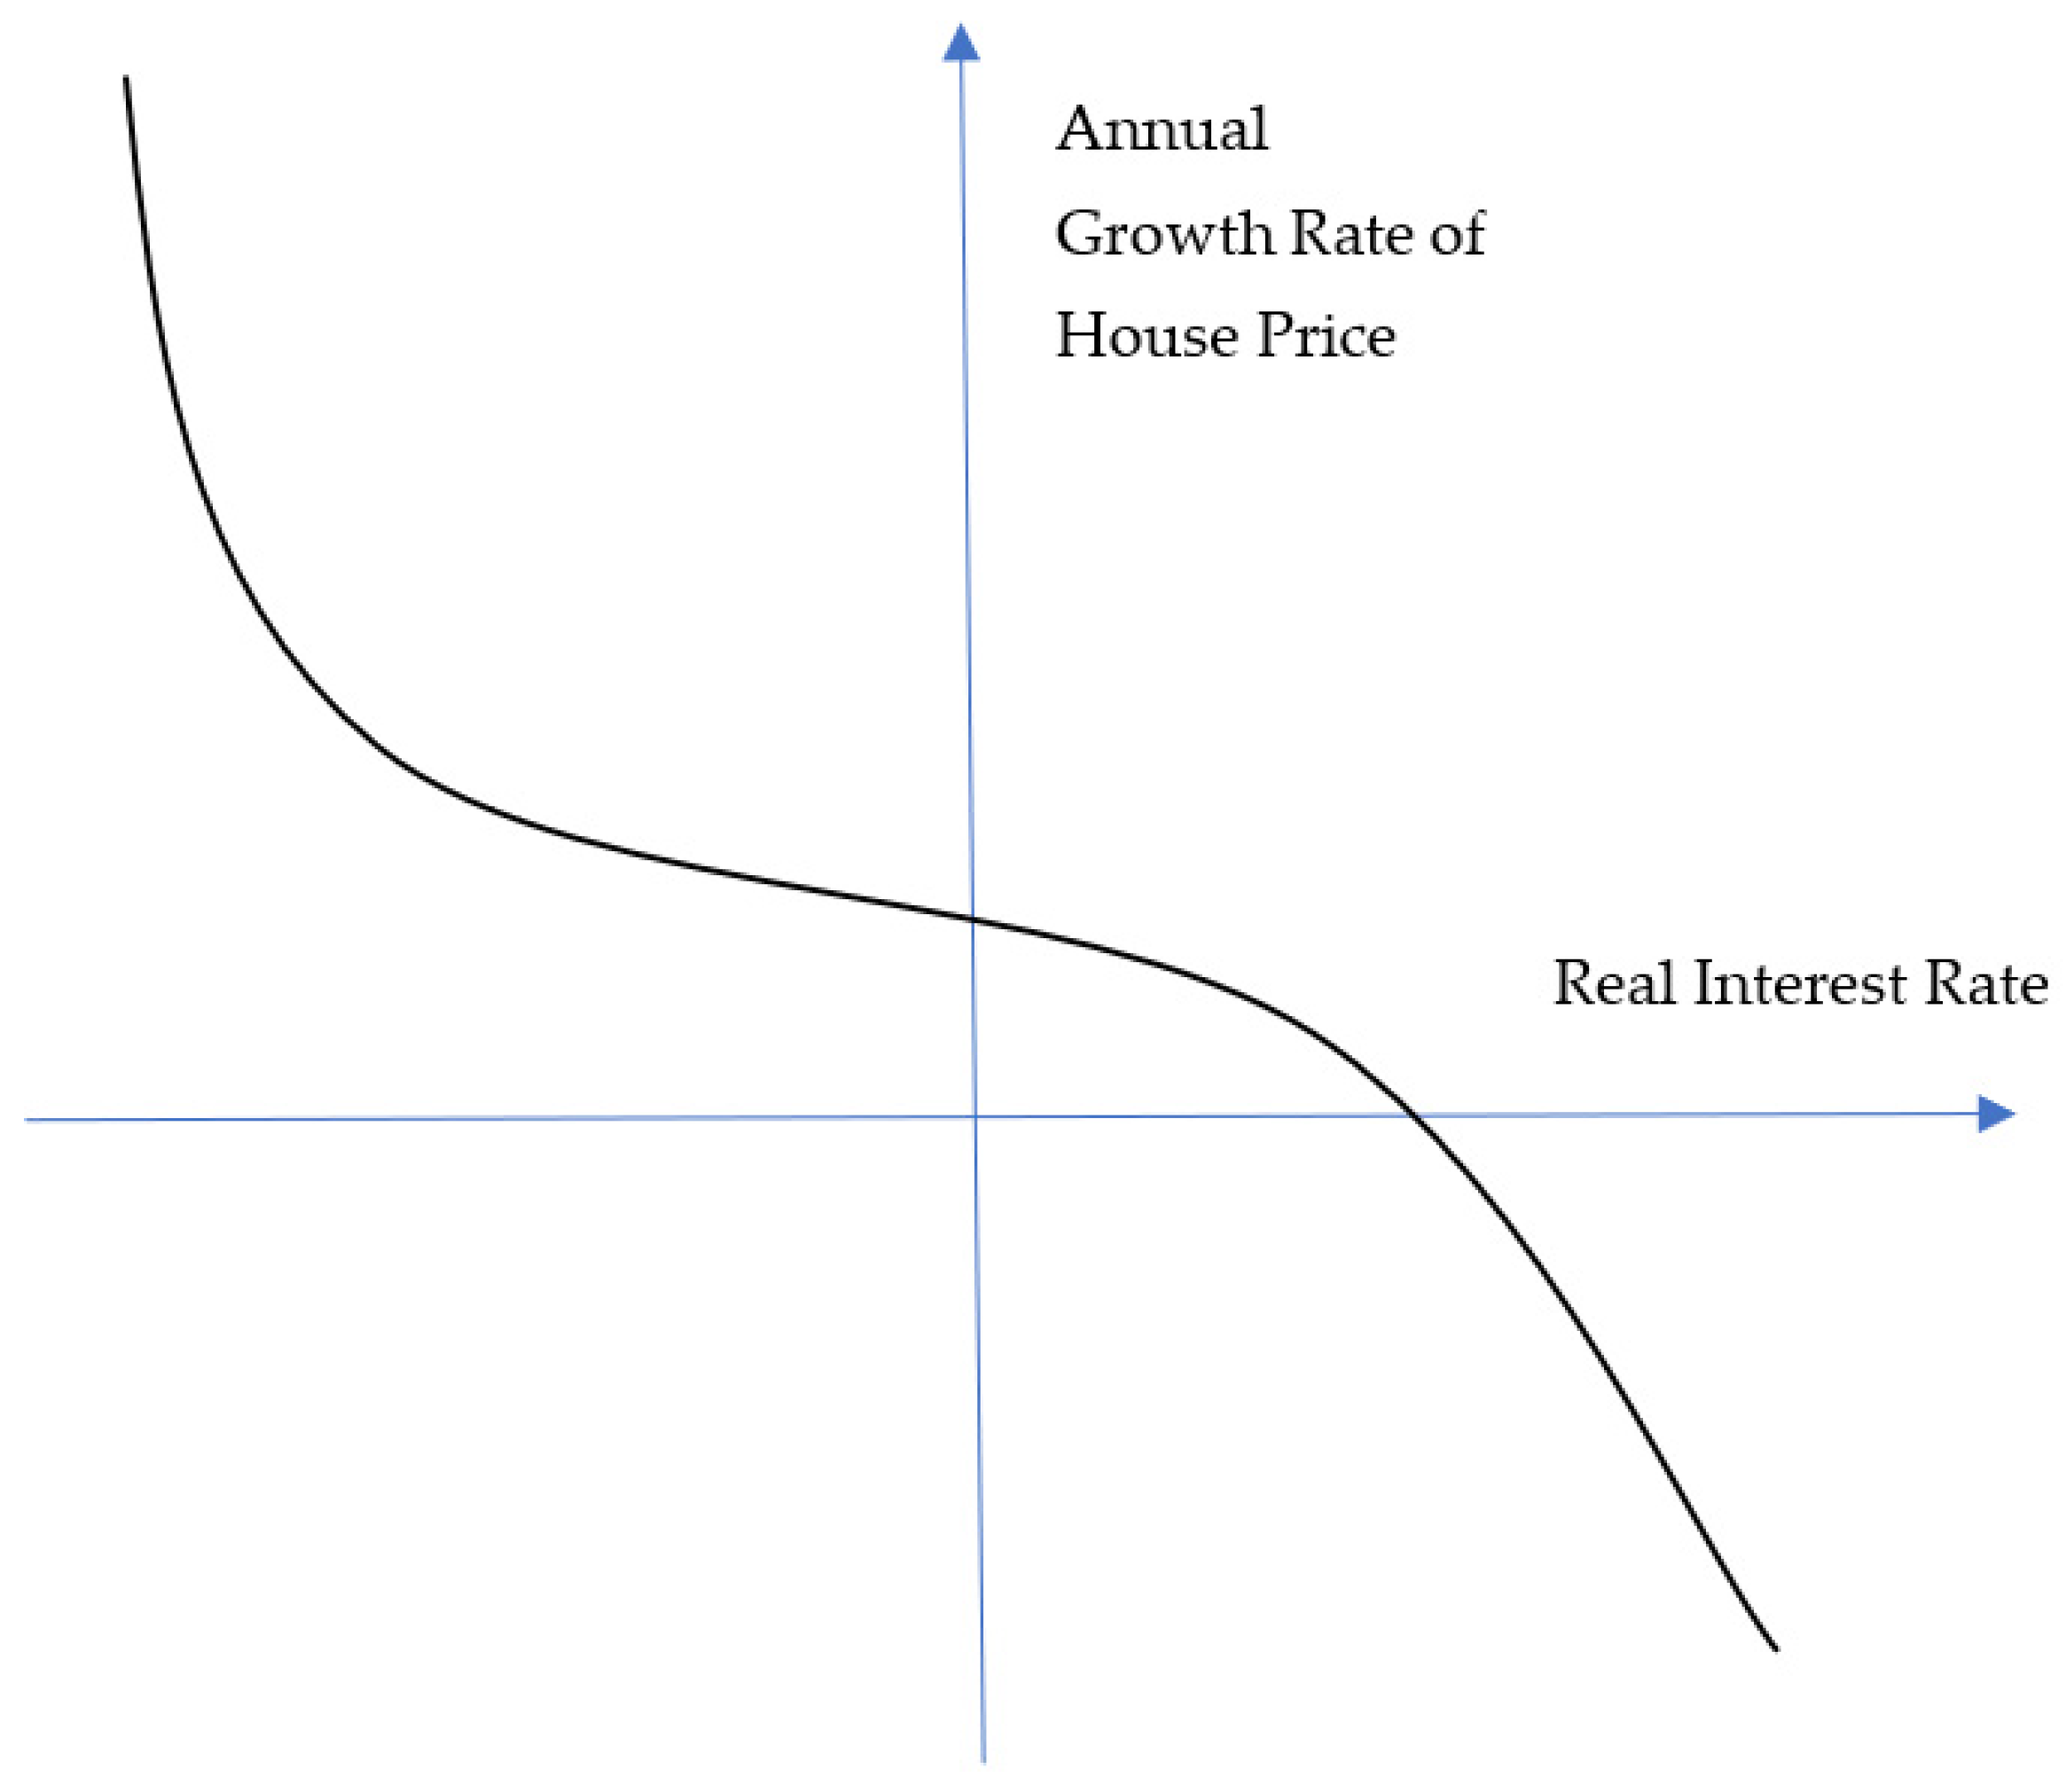
Intuitively, it is commonly believed that “cheap loans and looser lending requirements designed to stimulate the economy during the pandemic have attracted investors back into the market” [46]. Theoretically, Ryan-Collins (2018) argued that when “unlimited credit and money flows into an inherently finite supply of property, [it] causes rising house prices…” [47]. Empirically, there has been some evidence showing that abnormally low real interest rates could be associated with high property prices [18,19], yet the causality was not established until this study. Figure 9 suggests a theoretical relationship between real interest rate and house price growth for further studies.
6. Conclusions
This paper aims to test the hypothesis of the real interest rate effect on house price change by means of both an one-country time-series regression model and a five-country panel regression model on the data shortly before and after COVID. It took the pandemic as a quasi-experiment to examine the hypothesis, as it could exclude three key factors that are associated with house prices increase, namely positive economic growth, low unemployment rate, and other local factors. The synchronized house prices increases in many countries after the outbreak of COVID indicated that it was likely to be caused by a common shock rather than individual local issues, such as a tax policy or insufficient land supply. Furthermore, the global recessionary period after the outbreak of COVID also excluded the economic growth hypothesis. Better still, the restriction of foreign home buyers in New Zealand enabled control of the migrants’ effect.
After the outbreak of COVID, many central banks of developed countries cut their interest rates to unprecedented low levels, among other monetary easing measures. The almost synchronized reduction in interest rates globally resulted in negative real interest rates in these countries. It provided a unique opportunity to test the real interest rate hypothesis by a cross-country panel regression model as an interventional approach via a quasi-experiment.
Both the one-country and the five-country regression models’ results showed negative coefficients with similar magnitude of the real interest rate effect on house price change. The empirical result of the five housing markets showed that a 1% fall in the real interest rate caused a 1.5% increase in house prices, ceteris paribus, in this period. Furthermore, the restriction of foreign home buyers and the continuous increase in housing surplus in New Zealand also excluded the possibility of migrants’ and the insufficient house supply effects. The results confirmed the monetary policy hypothesis.
The results of this study are of important policy and practical implications. The debate between the monetary policy hypothesis and housing supply hypothesis has been keen in the past decades with no consensus. It is hard to control all local issues in an one-country analysis. This cross-country study with a quasi-experimental approach can provide crucial evidence to support the monetary policy hypothesis and to test causality. Mortgage policy and housing financialization schemes could cause housing and banking crises (García, 2019) [48]. How to strike a balance between economic growth and housing affordability by using monetary tools is an urgent post-COVID agenda for global leaders.
Funding
This research received no external funding.
Institutional Review Board Statement
Not applicable.
Informed Consent Statement
Not applicable.
Data Availability Statement
Acknowledgments
I thank the conference participants for providing constructive comments on the paper at the PRRES Conference 2020. Thanks also for the editor and reviewers’ constructive comments.
Conflicts of Interest
The authors declare no conflict of interest.
References
- Wetzstein, S. The global urban housing affordability crisis. Urban Stud. 2017, 54, 3159–3177. [Google Scholar] [CrossRef]
- Haffner, M.E.A.; Hulse, K. A fresh look at contemporary perspectives on urban housing affordability. Int. J. Urban Sci. 2019, 25, 59–79. [Google Scholar] [CrossRef] [Green Version]
- Hirata, H.; Kose, A.; Otrok, C.; Terrones, M. Global House Price Fluctuations: Synchronization and Determinants, IMF Working Paper WP/13/38, International Monetary Fund. 2013. Available online: https://www.imf.org/en/Publications/WP/Issues/2016/12/31/Global-House-Price-Fluctuations-Synchronization-and-Determinants-40302 (accessed on 4 August 2021).
- Katagiri, M. House Price Synchronization and Financial Openness: A Dynamic Factor Model Approach, IMF Working Paper WP/18/209. 2018. Available online: https://www.imf.org/en/Publications/WP/Issues/2018/09/28/House-Price-Synchronization-and-Financial-Openness-A-Dynamic-Factor-Model-Approach-46220?fbclid=IwAR1_ueffnK9Zl8V5wsqQML_ipIiI3ktcRC8trZfvb-sgIRVC-wu95eOQNps (accessed on 4 August 2021).
- OECD. Unemployment Rate—Total % of Labour Force, January 2019–March 2021. 2021. Available online: https://data.oecd.org/unemp/unemployment-rate.htm (accessed on 26 July 2021).
- Francke, M.; Korevaar, M. Housing markets in a pandemic: Evidence from historical outbreaks. J. Urban Econ. 2021, 123, 103333. [Google Scholar] [CrossRef]
- Wang, B. How Does COVID-19 Affect House Prices? A Cross-City Analysis. J. Risk Financ. Manag. 2021, 14, 47. [Google Scholar] [CrossRef]
- Knight Frank. Global House Price Index, Research, Q2 2020 and Q1 2021, Knight Frank. 2020, 2021. Available online: https://www.knightfrank.co.nz/research/global-house-price-index-q1-2021-8146.aspx (accessed on 26 July 2021).
- Mack, A.; Dallas, F.R.B.O.; Martínez-García, E. A Cross-Country Quarterly Database of Real House Prices: A Methodological Note. Fed. Reserv. Bank Dallas, Glob. Monetary Policy Inst. Work. Pap. 2011, 1-99. [Google Scholar] [CrossRef] [Green Version]
- Sahin, T.; Girgin, Y. Central Banks Cut Interest Rates 207 Times in 2020, AA Economy, 18 January 2021. Available online: Aa.com.tr/en/economy/central-banks-cut-interest-rates-207-times-in-2020/2113971 (accessed on 26 July 2021).
- Cheung, K.; Yiu, C.; Xiong, C. Housing Market in the Time of Pandemic: A Price Gradient Analysis from the COVID-19 Epicentre in China. J. Risk Financ. Manag. 2021, 14, 108. [Google Scholar] [CrossRef]
- Duca, J.V.; Hoesli, M.; Montezuma, J. The resilience and realignment of house prices in the era of Covid-19. J. Eur. Real Estate Res. 2021. [Google Scholar] [CrossRef]
- Mian, A.; Sufi, A. House Prices, Home Equity–Based Borrowing, and the US Household Leverage Crisis. Am. Econ. Rev. 2011, 101, 2132–2156. [Google Scholar] [CrossRef] [Green Version]
- Favara, G.; Imbs, J. Credit Supply and the Price of Housing. Am. Econ. Rev. 2015, 105, 958–992. [Google Scholar] [CrossRef] [Green Version]
- Himmelberg, C.; Mayer, C.; Sinai, T. Assessing High House Prices: Bubbles, Fundamentals and Misperceptions. J. Econ. Perspect. 2005, 19, 67–92. [Google Scholar] [CrossRef] [Green Version]
- Mayer, C.; Sinai, T. House Price Dynamics and Behavioral Finance, in Ch.5. In Policy Making Insights from Behavioral Economics; Foote, C.L., Goette, L., Meier, S., Eds.; Federal Reserve Bank of Boston: Boston, MA, USA, 2009. [Google Scholar]
- Taylor, J.B. Getting off Track: How Government Actions and Interventions Caused, Prolonged, and Worsened the Financial Crisis; Hoover Institution Press: Stanford, CA, USA, 2009. [Google Scholar]
- Yiu, C.Y. Negative real interest rate and housing bubble implosion—an empirical study in Hong Kong. J. Financ. Manag. Prop. Constr. 2009, 14, 257–270. [Google Scholar] [CrossRef] [Green Version]
- Yiu, C.Y.; Liusman, E. Negative Real Interest Rates and the Bursting of Spain’s Housing Bubbles: The Fourth Confirmed Case. In Proceedings of the International Conference on Banking, Real Estate and Financial Crises: Hong Kong, China and the World, Hong Kong, China, 17 January 2015. [Google Scholar]
- Landvoigt, T.; Piazzesi, M.; Schneider, M. The Housing Market (s) of San Diego. Am. Econ. Rev. 2015, 105, 1371–1407. [Google Scholar] [CrossRef] [Green Version]
- Ryan-Collins, J. Breaking the housing–finance cycle: Macroeconomic policy reforms for more affordable homes. Environ. Plan. A Econ. Space 2019, 53, 480–502. [Google Scholar] [CrossRef]
- Favilukis, J.; Ludvigson, S.; Nieuwerburgh, S.V. Macroeconomic implications of housing wealth, housing finance, and limited risk-sharing in general equilibrium. J. Political Econ. 2017, 125, 140–223. [Google Scholar] [CrossRef] [Green Version]
- Khandani, A.E.; Lo, A.W.; Merton, R.C. Systemic risk and the refinancing ratchet effect. J. Financ. Econ. 2013, 108, 29–45. [Google Scholar] [CrossRef] [Green Version]
- Ahearne, A.G.; Ammer, J.; Doyle, B.M.; Kole, L.S.; Martin, R.F. House Prices and Monetary Policy: A Cross-Country Study; Board of Governors of the Federal Reserve System: Washington, DC, USA, 2005.
- Tsatsaronis, K.; Zhu, H. What Drives Housing Price Dynamics: Cross Country Evidence. 2004. Available online: https://www.bis.org/publ/qtrpdf/r_qt0403f.pdf (accessed on 27 July 2021).
- Égert, B.; Mihaljek, D. Determinants of House Prices in Central and Eastern Europe. Comp. Econ. Stud. 2007, 49, 367–388. [Google Scholar] [CrossRef] [Green Version]
- Algieri, B. House Price Determinants: Fundamentals and Underlying Factors. Comp. Econ. Stud. 2013, 55, 315–341. [Google Scholar] [CrossRef]
- Vogiazas, S.; Alexiou, C. Determinants of Housing Prices and Bubble Detection: Evidence from Seven Advanced Economies. Atl. Econ. J. 2017, 45, 119–131. [Google Scholar] [CrossRef] [Green Version]
- Tripathi, S. Macroeconomic Determinants of Housing Prices: A Cross Country Level Analysis, MPRA Paper No. 98089. 2019. Available online: https://mpra.ub.uni-muenchen.de/98089/ (accessed on 27 July 2021).
- Antonakis, J.; Bendahan, S.; Jacquart, P.; Lalive, R. Causality and Endogeneity: Problems and Solutions, The Oxford Handbook of Leadership and Organizations. 2014. Available online: https://www.oxfordhandbooks.com/view/10.1093/oxfordhb/9780199755615.001.0001/oxfordhb-9780199755615-e-007 (accessed on 27 July 2021).
- Miller, N.; Peng, L.; Sklarz, M. House Prices and Economic Growth. J. Real Estate Financ. Econ. 2009, 42, 522–541. [Google Scholar] [CrossRef]
- Chan, H.L.; Woo, K.Y. Studying the Dynamic Relationships between Residential Property Prices, Stock Prices, and GDP: Lessons from Hong Kong. J. Hous. Res. 2013, 22, 75–89. [Google Scholar] [CrossRef]
- Bachman, V.R.; Schutt, R.K. The Practice of Research in Criminology and Criminal Justice; Sage: Thousand Oaks, CA, USA, 2006. [Google Scholar]
- Hoogendoorn, S.; Van Gemeren, J.; Verstraten, P.; Folmer, K. House prices and accessibility: Evidence from a quasi-experiment in transport infrastructure. J. Econ. Geogr. 2017, 19, 57–87. [Google Scholar] [CrossRef]
- Zheng, X.; Peng, W.; Hu, M. Airport noise and house prices: A quasi-experimental design study. Land Use Policy 2019, 90, 104287. [Google Scholar] [CrossRef]
- Kessel, D.; Tyrefors, B.; Vestman, R. The Housing Wealth Effect: Quasi-Experimental Evidence. Swedish House of Finance Research Paper, No. 19-5. 2019. Available online: http://0-dx-doi-org.brum.beds.ac.uk/10.2139/ssrn.3329395 (accessed on 27 July 2021).
- Deng, Y.; Liao, L.; Yu, J.; Zhang, Y. Capital Spillover, House Prices, and Consumer Spending: Quasi-Experimental Evidence from House Purchase Restrictions. Rev. Financ. Stud. 2021. [Google Scholar] [CrossRef]
- OECD. GDP, Unemployment Rate, Short-Term Interest Rate, Inflation Rate, Q1 2015–Q1 2021, OECD Data. 2021. Available online: https://data.oecd.org/ (accessed on 30 July 2021).
- Hyslop, D.R.; Le, T.; Mare, D.C.; Stillman, S. Housing Markets and Migration—Evidence from New Zealand, Motu Working Paper 19–14, Motu Economic and Public Policy Research. July 2019. Available online: http://motu-www.motu.org.nz/wpapers/19_14.pdf (accessed on 27 July 2021).
- Watson, E. A Closer Look at Some of the Supply and Demand Factors Influencing Residential Property Markets, Reserve Bank of New Zealand Analytical Note Series, AN2013/11. December 2013. Available online: https://www.rbnz.govt.nz/-/media/ReserveBank/Files/Publications/Analytical%20notes/2013/an2013-11.pdf?revision=5f2ad9d5-e9a8-4837-b456-84a6aae50ebf (accessed on 27 July 2021).
- Stats, N.Z. Property Transfer Statistics: September 2020 Quarter, Stats NZ. 2020. Available online: https://www.stats.govt.nz/information-releases/property-transfer-statistics-september-2020-quarter (accessed on 30 October 2020).
- Ninness, G. Auckland’s Housing Crisis Starting to Ease as Supply Starts to Overtake Demand and Accumulated Housing Shortage Starts to Shrink, Interest.co.nz. 24 November 2020. Available online: https://www.interest.co.nz/property/108084/aucklands-housing-crisis-starting-ease-supply-starts-overtake-demand-and-accumulated (accessed on 28 July 2021).
- Stats, N.Z. Dwelling and Household Estimates: Sep 2020 Quarter, Stats NZ. 2020. Available online: https://www.stats.govt.nz/information-releases/dwelling-and-household-estimates-september-2020-quarter (accessed on 7 October 2020).
- Our World in Data. Daily New Confirmed COVID-19 Deaths Per Million People, Johns Hopkins University CSSE COVID-19 Data Extracted from Our World in Data COVID-19 Dataset. 2021. Available online: https://ourworldindata.org/coronavirus (accessed on 29 July 2021).
- Kingsly, K.; Henri, K. Central Banks Respond to COVID-19 to Stave off a Financial Crisis, They Need for Targeted Fiscal Measures Should Not Be Understated, SSRN. 2020. Available online: https://ssrn.com/abstract=3562320 (accessed on 26 July 2021).
- Taylor, p. New Zealand House Prices Soar Despite COVID Recession, Worsening Affordability Crisis, Guardian, 29 October 2020. Available online: https://www.theguardian.com/world/2020/oct/29/new-zealand-house-prices-soar-despite-covid-recession-worsening-affordability-crisis (accessed on 26 July 2021).
- Ryan-Collins, J. Why Can’t You Afford a Home? Polity Press: Cambridge, UK, 2019. [Google Scholar]
- García, I. Historically Illustrating the Shift to Neoliberalism in the U.S. Home Mortgage Market. Societies 2019, 9, 6. [Google Scholar] [CrossRef] [Green Version]
Figure 1.
Home transfers by non-citizen or non-resident (NCNR) buyers and sellers in New Zealand, March 2017–September 2020. Source: data from StatsNZ [41].
Figure 1.
Home transfers by non-citizen or non-resident (NCNR) buyers and sellers in New Zealand, March 2017–September 2020. Source: data from StatsNZ [41].

Figure 2.
Year-on-year % changes of number of households and number of private dwellings in New Zealand, June 1992–September 2020. Source: StatsNZ (2020) [43].
Figure 2.
Year-on-year % changes of number of households and number of private dwellings in New Zealand, June 1992–September 2020. Source: StatsNZ (2020) [43].

Figure 3.
Year-on-year % change in house price indices during COVID of the five countries from Q2 of 2020 to Q1 of 2021. Source: [9].
Figure 3.
Year-on-year % change in house price indices during COVID of the five countries from Q2 of 2020 to Q1 of 2021. Source: [9].

Figure 4.
Seven-day rolling average of daily new confirmed COVID deaths per million people of the five countries from 1 April 2020 to 31 March 2021. Source: [44].
Figure 4.
Seven-day rolling average of daily new confirmed COVID deaths per million people of the five countries from 1 April 2020 to 31 March 2021. Source: [44].

Figure 5.
Quarter-on-quarter % change in GDP during COVID of the five countries from 2020Q1 to 2020Q2. Source: OECD [38].
Figure 5.
Quarter-on-quarter % change in GDP during COVID of the five countries from 2020Q1 to 2020Q2. Source: OECD [38].

Figure 6.
Percentage changes of central banks’ interest rates before and after the outbreak of COVID. Source: OECD [38].
Figure 6.
Percentage changes of central banks’ interest rates before and after the outbreak of COVID. Source: OECD [38].

Figure 7.
Real interest rates of the five countries before and after the outbreak of COVID. Source: calculated by the author.
Figure 7.
Real interest rates of the five countries before and after the outbreak of COVID. Source: calculated by the author.

Figure 8.
Scatterplots of real house prices year-on-year changes and real interest rates before and after the outbreak of COVID in the five countries. Source: International House Price Databases [9] and OECD [38].

Figure 9.
A theoretical diagram of the relationship between real interest rate and house price growth, ceteris paribus.
Figure 9.
A theoretical diagram of the relationship between real interest rate and house price growth, ceteris paribus.


| Variable | Country | Mean | Standard Deviation | Minimum | Maximum |
|---|---|---|---|---|---|
| HPI, House Price Index | AUS | 153.64 | 6.46 | 141.94 | 165.71 |
| CAN | 186.87 | 12.14 | 178.16 | 223.75 | |
| NZ | 167.60 | 10.64 | 157.88 | 193.36 | |
| UK | 114.41 | 2.62 | 112.13 | 121.97 | |
| US | 98.62 | 4.42 | 91.34 | 106.85 | |
| RIR, Real Interest Rate (%) | AUS | −0.31 | 0.55 | −1.42 | 0.62 |
| CAN | −0.35 | 0.45 | −1.25 | 0.39 | |
| NZ | −0.44 | 0.25 | −0.88 | 0.10 | |
| UK | −1.17 | 0.40 | −1.86 | −0.53 | |
| US | −0.47 | 0.73 | −1.78 | 0.88 | |
| ΔGDP, Gross Domestic Products Quarter-on-Quarter Change (%) | AUS | 0.48 | 3.46 | −6.97 | 2.16 |
| CAN | 0.38 | 9.10 | −11.28 | 3.74 | |
| NZ | 0.67 | 14.07 | −10.83 | 4.48 | |
| UK | −0.10 | 16.95 | −19.47 | 6.52 | |
| US | 0.43 | 7.48 | −8.99 | 3.00 | |
| UNE, Unemployment Rate (%) | AUS | 5.66 | 0.65 | 5.03 | 7.02 |
| CAN | 6.99 | 2.02 | 5.60 | 13.10 | |
| NZ | 4.45 | 0.37 | 4.00 | 5.20 | |
| UK | 4.25 | 0.42 | 3.77 | 5.22 | |
| US | 5.08 | 2.49 | 3.60 | 13.07 | |
| Period | 2017Q1–2021Q1 | ||||
| Number of Observations | 85 Obs (17 periods × 5 countries) | ||||
Table 2.
Unit Root Tests of Variables, 2017Q1–2021Q1. Notes: figures are statistics, *** and ** represent p-value ≤ 0.01 and 0.05, respectively.
Table 2.
Unit Root Tests of Variables, 2017Q1–2021Q1. Notes: figures are statistics, *** and ** represent p-value ≤ 0.01 and 0.05, respectively.
| Variable | Level | First-Difference | ||
|---|---|---|---|---|
| ADF—Fisher Chi-Square | ADF—Choi Z-Stat | ADF—Fisher Chi-Square | ADF—Choi Z-Stat | |
| HPI, House Price Index and dlog (HPI), House Price Quarter-on-Quarter Change (%) | 2.35 | 4.07 | 21.21 ** | −2.18 ** |
| RIR, Real Interest Rate (%) | 23.04 ** | −2.40 *** | ||
| dlog (GDP), Gross Domestic Products Quarter-on-Quarter Change (%) | 45.48 *** | −5.13 *** | ||
| UNE, Unemployment Rate (%) and d(UNE) | 13.17 | −1.36 | 32.92 *** | −3.90 *** |
Table 3.
Results of the one-country and five-country regression models on house price changes.
| Dependent Variables | Model 1—One-Country Time Series | Model 2—Five-Country Panel |
|---|---|---|
| Constant | 0.005 (0.25) | 0.001 (0.30) |
| RIR | −0.014 (−0.41) | −0.015 (−3.739) *** |
| dlog (GDP) | 0.001 (0.52) | 0.001 (1.69) * |
| d (UNE) | 0.008 (0.24) | 0.002 (1.33) |
| AR (1) | 0.285 (1.00) | 0.434 (3.84) *** |
| Dependent Variable | dlog (HPI) | |
| Fixed Effect | NA | Cross-country fixed effects |
| No. of Observations | 17 | 85 |
| Adj. R-sq | 0.02 | 0.31 |
Figures in parenthesis are t-statistics, *** and * represent p-value ≤ 0.01 and 0.10, respectively.
Publisher’s Note: MDPI stays neutral with regard to jurisdictional claims in published maps and institutional affiliations. |
© 2021 by the author. Licensee MDPI, Basel, Switzerland. This article is an open access article distributed under the terms and conditions of the Creative Commons Attribution (CC BY) license (https://creativecommons.org/licenses/by/4.0/).
Share and Cite
MDPI and ACS Style
Yiu, C.Y. Why House Prices Increase in the COVID-19 Recession: A Five-Country Empirical Study on the Real Interest Rate Hypothesis. Urban Sci. 2021, 5, 77. https://0-doi-org.brum.beds.ac.uk/10.3390/urbansci5040077
AMA Style
Yiu CY. Why House Prices Increase in the COVID-19 Recession: A Five-Country Empirical Study on the Real Interest Rate Hypothesis. Urban Science. 2021; 5(4):77. https://0-doi-org.brum.beds.ac.uk/10.3390/urbansci5040077
Chicago/Turabian StyleYiu, Chung Yim. 2021. "Why House Prices Increase in the COVID-19 Recession: A Five-Country Empirical Study on the Real Interest Rate Hypothesis" Urban Science 5, no. 4: 77. https://0-doi-org.brum.beds.ac.uk/10.3390/urbansci5040077