
Exposure of Malaysian Children to Air Pollutants over the School Day


1
Department of Environmental and Occupational Health, Faculty of Medicine and Health Sciences, Universiti Putra Malaysia, Serdang 43400, Selangor, Malaysia
2
Department of Marine Environment and Engineering, National Sun Yat-sen University, Kaohsiung 80424, Taiwan
3
School of Environmental Sciences, University of East Anglia, Norwich NR4 7TJ, UK
*
Author to whom correspondence should be addressed.
Urban Sci. 2022, 6(1), 4; https://0-doi-org.brum.beds.ac.uk/10.3390/urbansci6010004
Submission received: 3 December 2021
/
Revised: 30 December 2021
/
Accepted: 12 January 2022
/
Published: 18 January 2022
(This article belongs to the Special Issue Healthy City Science: Citizens, Experts and Urban Governance)
Abstract
:Children are sensitive to air pollution and spend long hours in and around their schools, so the school day has an important impact on their overall exposure. This study of Kuala Lumpur, Selangor and its surroundings assesses exposure to PM2.5 and NO2, from travel, play and study over a typical school day. Most Malaysian children in urban areas are driven to school, so they probably experience peak NO2 concentrations in the drop-off and pick-up zones. Cyclists are likely to receive the greatest school travel exposure during their commute, but typically, the largest cumulative exposure occurs in classrooms through the long school day. Indoor concentrations tend to be high, as classrooms are well ventilated with ambient air. Exposure to PM2.5 is relatively evenly spread across Selangor, but NO2 exposure tends to be higher in areas with a high population density and heavy traffic. Despite this, ambient PM2.5 may be more critical and exceed guidelines as it is a particular problem during periods of widespread biomass burning. A thoughtful adjustment to school approach roads, design of playgrounds and building layout and maintenance may help minimise exposure.
1. Introduction
The respiratory health of school children is a growing concern, so exposure to pollutants during their education is especially important, particularly when parents perceive that there are key issues related to safe travel to school [1,2,3]. The local environment surrounding schools has recently been reviewed by [4]. Additionally, the walk to school [5,6,7] and other travel modes represent further routes to exposure, along with the presence of high pollutant concentrations in areas where students are dropped off or picked up [8].
The classroom has often been the focus of research, as here, students accumulate exposure over long periods of time [9,10,11,12,13,14,15]. Some reduction in exposure is possible through careful building design, perhaps with the use of air conditioning [16,17], or the careful layout and placement of school buildings and the diversion of nearby traffic [18]. Much less is written about school playgrounds and roads that border schools [19,20], although there has long been a focus on air pollution in playgrounds and parks [21,22].
Malaysia, like many upper-middle-income countries, has seen rapid growth in population, urbanisation, and economic output, so the effect of air pollution and climate change on children has been of growing concern [23]. Local air quality is a function of the vehicular traffic [24], industrial activity [25] and haze pollution caused by biomass emissions, and from neighbouring countries [26]. The tropical climate and complex local meteorological conditions also affect the formation of secondary pollutants [27]. Vehicle ownership in Malaysia has increased rapidly, which has an effect on traffic-related emissions [28]. Abidin et al. [29] reported that children in a large number of Malaysian schools are exposed to levels of traffic-related air pollution (or TRAP) that exceed the WHO’s guidance limit values. The school day, as is common in tropical countries, begins early, but in some schools, a cohort attends in the afternoon (13:30/18:00), and some school children have extra classes in the afternoon and co-curricular activities. The school morning starts at 07:30, with a break at 10:00/10:30. Children are often dropped off by parents, but because the school day ends at 13:30, students are frequently transported by a van or bus to a transit house to await their parents. Some children may use public transport, or walk or ride bicycles, which provides exercise and empowers children, but roads typically lack footpaths [30] or cycle lanes. This discourages children from making their own way to school. Parents worry about security, and as yet, solutions such as walking buses [31] are uncommon.
This research examines the balance of exposure of children in Kuala Lumpur and its surroundings over a typical school day. This is relevant as approaches to reducing exposure to air pollution have focused on the choice of travel mode, play, sports, the ventilation of classrooms, and traffic regulation close to schools.
2. Materials and Methods
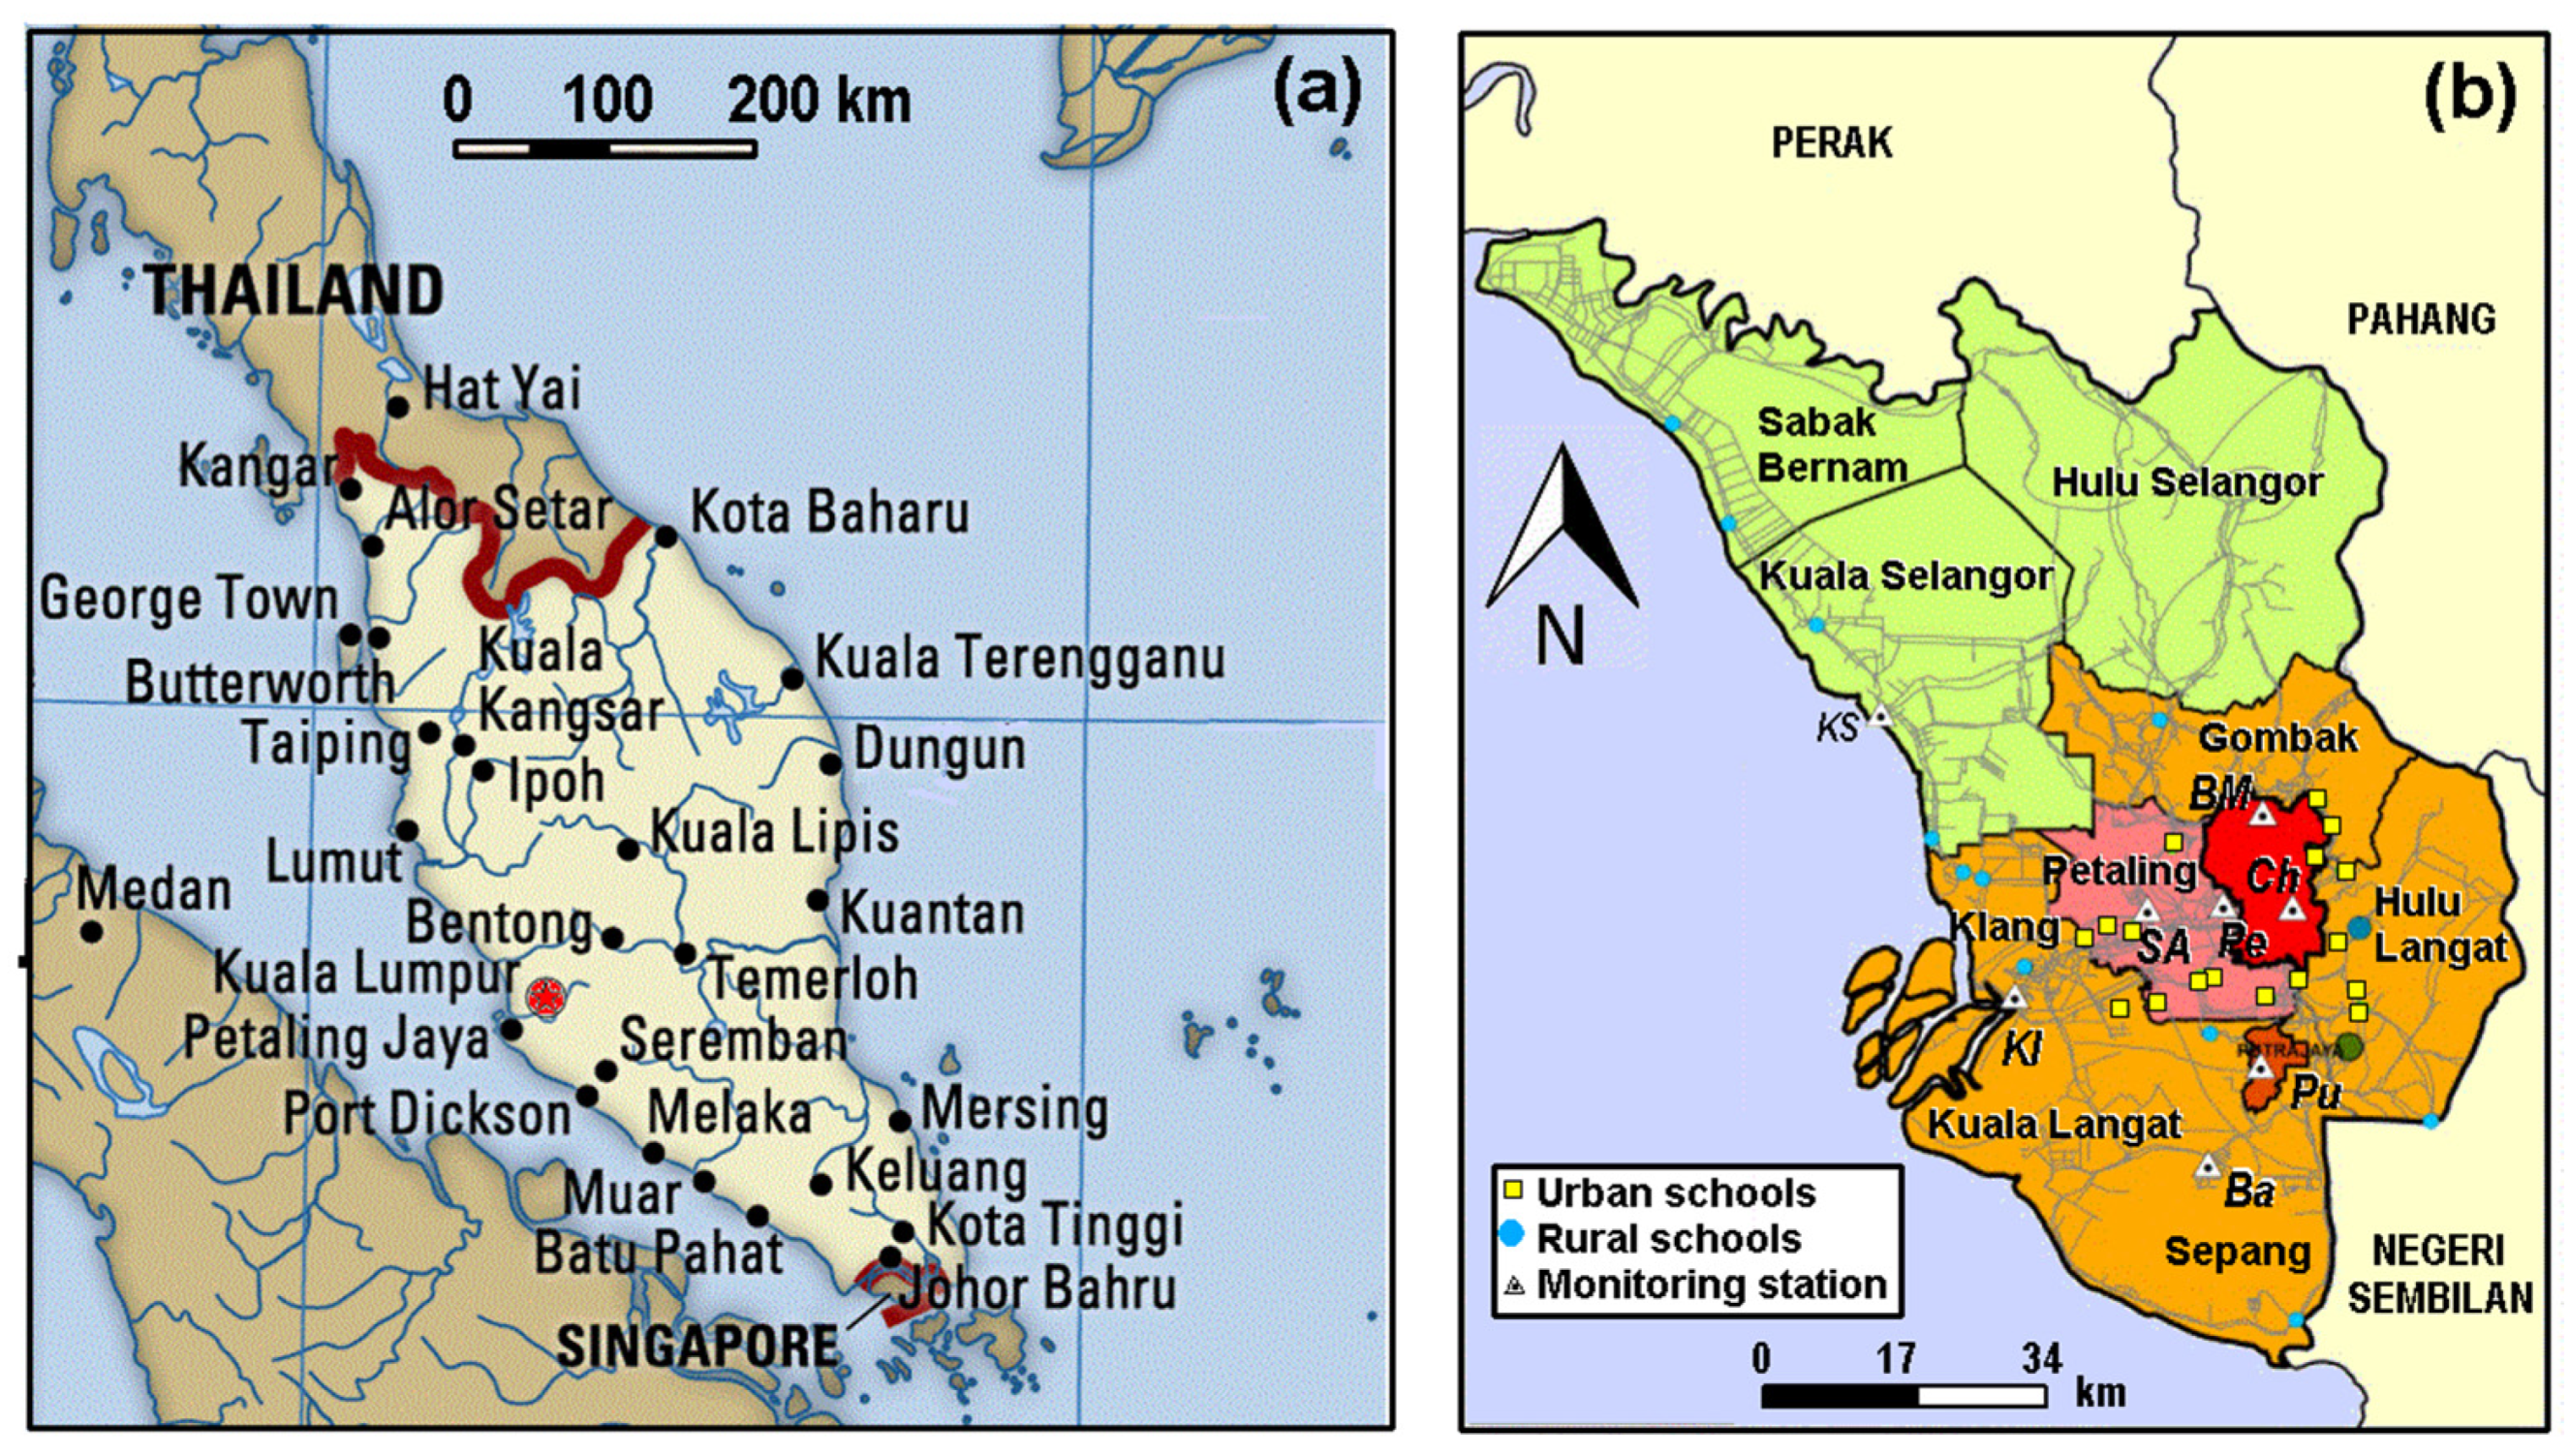
This study used a range of scholarly publications linked to the exposure of students to air pollution. Reports from Malaysian Institute of Road Safety Research (MIROS) provided details of student travel to school [32]. It further used available pollutant measurements (see http://apims.doe.gov.my/public_v2/api_table.html, accessed on 2 January 2022) from monitoring sites maintained by the Department of Environment Malaysia (Figure 1). Data from 2019 were used to avoid the effects of COVID-19 lockdowns, and the subsequent years, 2020 and 2021, were not used. The haze period (8 October 2019/26 October 2019), while discussed, was usually removed from the record to avoid bias.
Additionally, we measured PM2.5 concentrations in the drop-off and pick-up zones of schools with a DustTrak™ II Aerosol Monitor (Model 8532, TSI Inc., Shoreview, MN, USA). The instrument was set at a height of 0.8 m (breathing zone for the children) on the pavement; 2 m away from the point where cars and vans stopped for students and collected data 06:30/13:30 at 1 min resolution. The monitor was reset before and after each monitoring session according to the manufacturer’s instructions, with the monitor calibrated against the manufacturer’s high efficiency filter. The concentration range for this instrument ranges between 0.001 and 150 mg m−3.
The distribution of pollutant concentrations was often skewed, which can make the choice of statistical tests complicated. In this study, we often used medians and lower and upper quartiles (Q1 and Q3) to describe the central tendency and dispersion, frequently choosing box and whisker plots. Where sample numbers were large (>200), despite the skewed concentration data, parametric statistical tests were sometimes used, as the central limit should make parametric methods, such as ANOVA, valid. ANOVA used an online calculator, Astatsa (https://astatsa.com/, accessed on 2 January 2022), which provided post hoc multiple comparisons using Scheffé’s method.
3. Results
This section first examines the various exposure environments, and attempts to assess their likely importance from the literature, along with some measurements from the school entrance. The second part estimates the exposure of children during various periods throughout the school day.
3.1. Exposure Environments
3.1.1. Travel to and from School
There is a general belief that travel-to-school commuting results in a high proportion of the daily pollutant dose (e.g., [5]). The relevance of the school commute has been reviewed by Ma et al. [33]. Parental fears that walking to school exposes children to air pollutants can seem a little perverse given the potential increase in exposure to air pollutants that arises through parents’ choice of private transport for the trip to school. There is additional exposure in busy drop-off and pick-up zones. Specific studies show that some locations on the route to school can have high concentrations: bus stops [34] and pedestrian crossings [35]. However, travel is not necessarily the dominant contributor to daily exposure [18,36,37]. High respiratory rates and enhanced levels of physical activity during walking and cycling lead to the rapid inhalation of air pollutants.
The careful choice of route to school can reduce (10–30%) exposure to primary traffic pollutants (nitrogen oxides, NOx and carbon monoxide CO) [6], though the difference is insignificant for secondary pollutants (particulate matter, PM2.5 and PM10 and ntogen dioxide, NO2). A study in Manchester [7] found that walking along alternative routes, which are 2 min longer than faster routes, typically resulted in a 5 μg m3 reduction in NO2 exposure. The choice of cycling routes is also important [38]. Hatzopoulou et al. [39] argue that the number of diesel vehicles, strong sources of soot, were an important control of personal exposure to black carbon (BC), though the use of separated cycling lanes had less impact on exposure to BC. Cycle lanes are likely to have only subtle effects on exposure.
There has been special interest in the health benefits of active modes of transport to school, such as walking and cycling [40]. The choice to walk to school has been a matter of some interest. Socio-economic effects lead to disadvantaged children counter-intuitively walking to school less often [41]. Given parental fears about security, walking buses have been popular in some places. These may be seen as a way of lowering pollutant emissions [42] and may provide healthy routes [43]. Such schemes have health benefits [44], though they additionally encourage road safety awareness, acceptance of walking, and provide a space for conversation.
In Malaysia, students do not typically walk to school [45], even when living less than a kilometre away [30], in spite of the fact that the benefits of a pleasant walk to school are recognised. Primary concerns are the risk from traffic; this is understandable given the lack of footpaths in Malaysia [46]. A separate survey revealed that the fear of crime against children suggests that the safe distance for walking in public areas may be as little as 100 m [1].
3.1.2. Drop-Off and Pick-Up Zones
Increased exposure arises in congested pick-up and drop-off zones [8,43,47]. The places where students arrive by motor vehicles can be polluted because of idling vehicles [48,49], although anti-idling campaigns may help (e.g., [50]). The dwell times for children in these places are typically brief, so drop-off and pick-up zones contribute only a small proportion to daily exposure [8]. Despite parental frustration with driving children to school [51], they are reassured by confirming their safe arrival (e.g., [52]). Vanwolleghem et al. [53] suggest implementing drop-off spots as a way to promote walking to school. They suggest that these are associated with green spaces, quiet roads, separation from traffic [54], and safe crossings [55,56]. Many suggestions that relate to improving traffic safety could also reduce pollutants exposure.
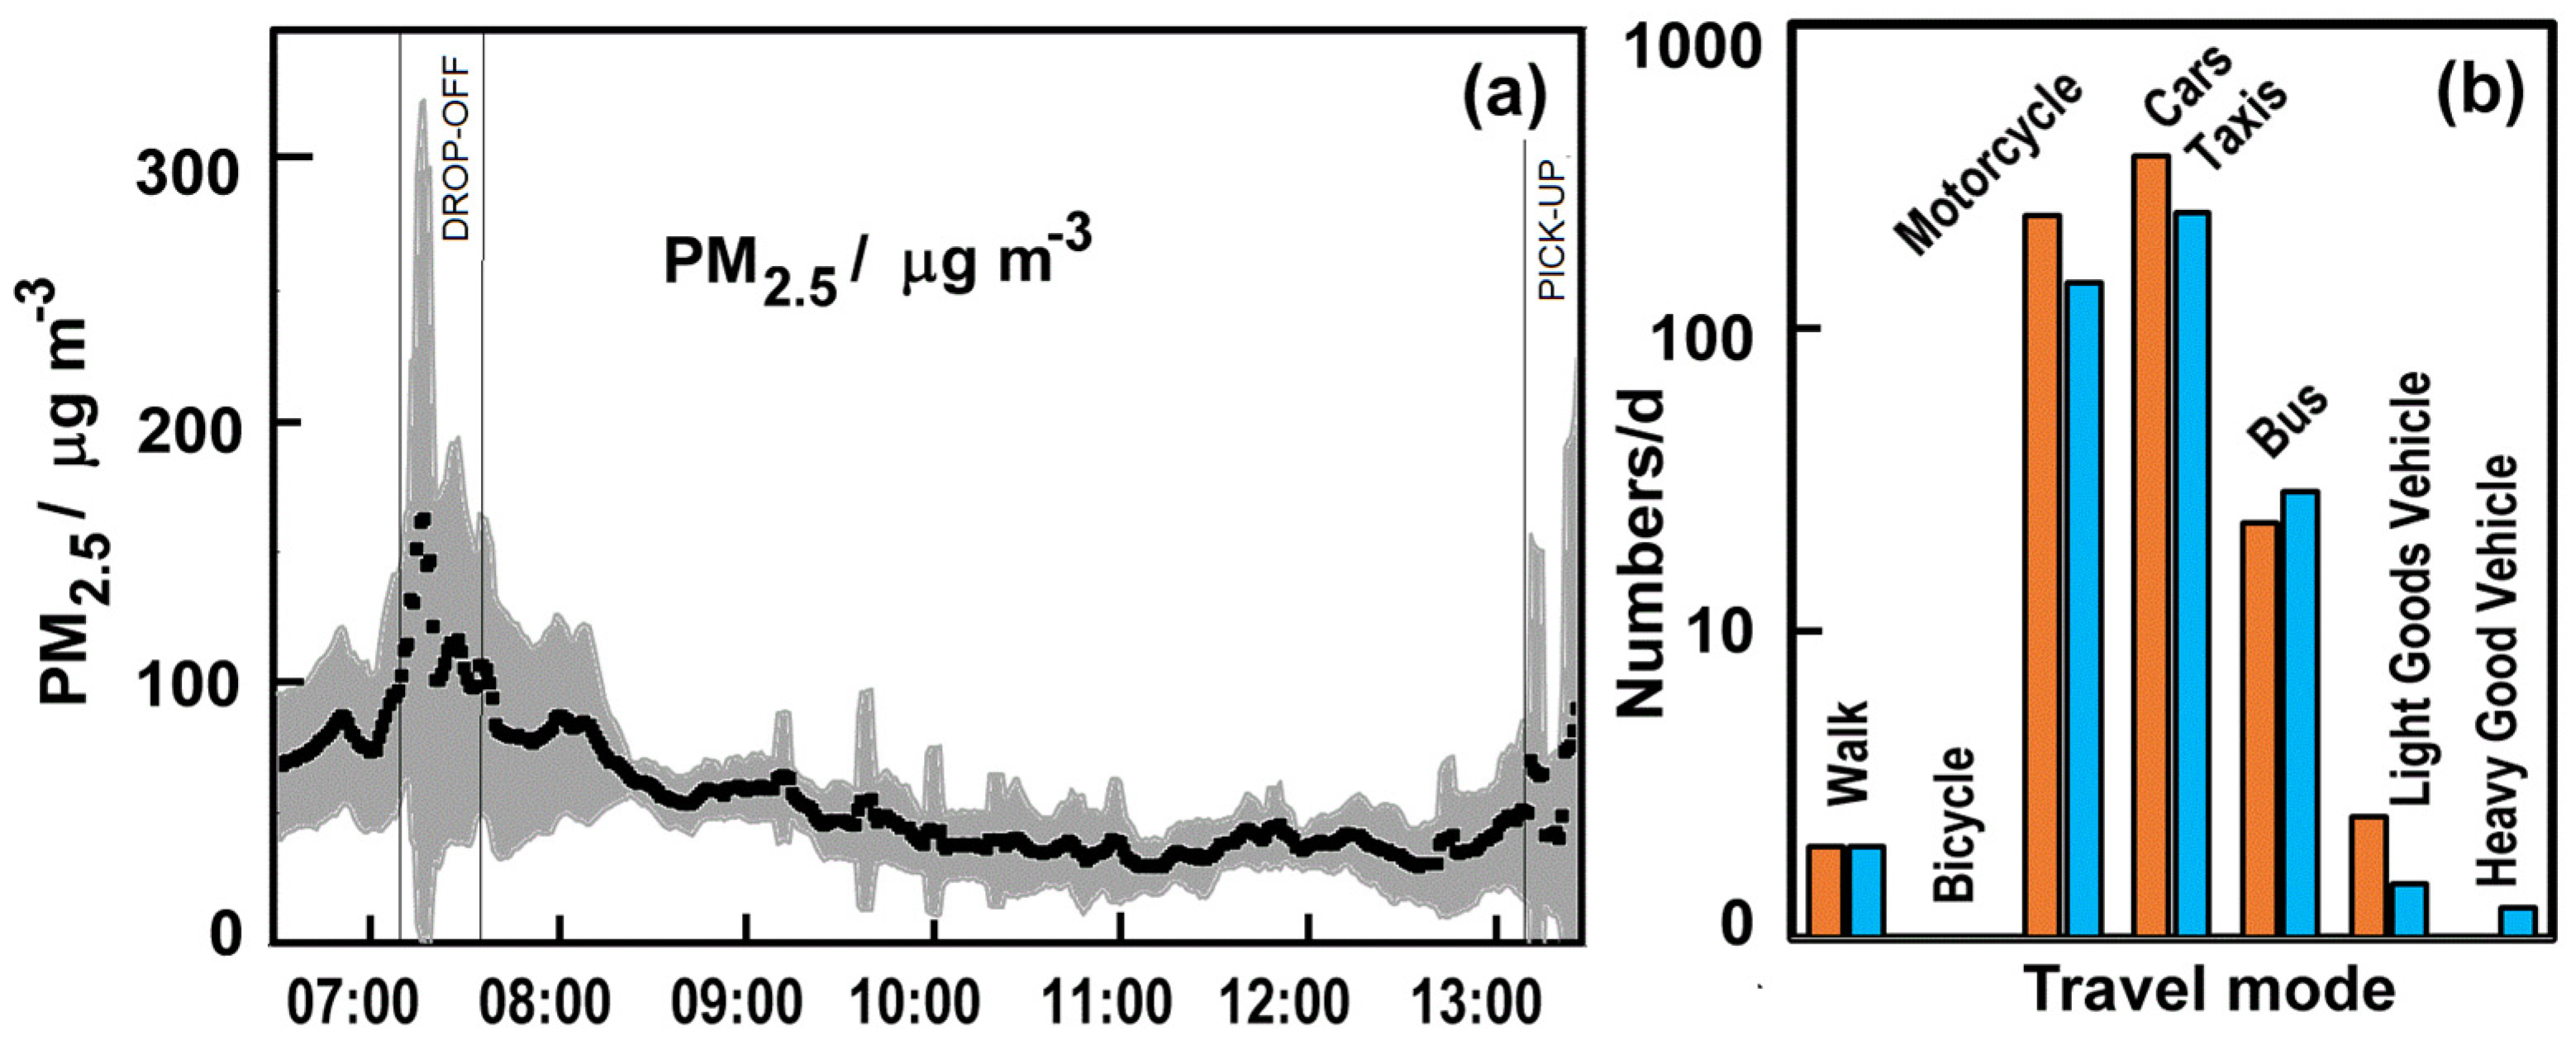
There are some measurements of pollutants in the drop-off and pick-up zones. Monitoring during drop-off shows that, although pollutant concentrations increased, the periods of enhanced pollution were shorter than during pick-up [19]. Cars queuing during drop-off hours intensify the concentration of PM2.5 by ~3 times [54]. Our PM2.5 measurements (Figure 2) made at a school in Bangi (Hulu Langat District), from four school days (2 January 2019 and 2 January 2020), showed a sharp peak at drop-off time. Higher concentrations arise during morning traffic, but there is a gradual improvement. In the early afternoon, some students can be delayed by play or conversations, so pollution at pick-up has a lower and broader peak; not unlike the observations from the United Kingdom [19]. As parents are still at work, vehicle numbers decline a little in the afternoon (Figure 2b), but buses are more frequent. The observations at the school entrance (tallied on a check sheet) suggest that most children come by vehicle (Figure 2b), but the number walking and cycling is likely to be underestimated, as these children may leave the school through minor gates. The results align with those of the MIROS questionnaire [32].
3.1.3. Classrooms
There are many studies of indoor pollution in schools. Fisk [57] recently reviewed research, with a special focus on ventilation, and notes that in: “hot and humid climates, increased ventilation rates in schools can increase time periods with an elevated indoor humidity, increasing the risk of indoor mould growth… and even with low ventilation rates, indoor humidity is often elevated”. In Malaysia, dampness in school buildings has been linked to observations that students had elevated FeNO levels (fractional exhaled nitric oxide), indicating ongoing lower airway inflammation [58,59]. Indoor materials such as chalk dust and cotton fibres [60] add to indoor particles, along with bioaerosols and pesticides.
Malaysia has been well served by studies of air pollution in the classroom [28,61,62,63], with Thailand [64,65] and Indonesia [66] also representing tropical climates, where schools are often highly ventilated. Abidin et al. [28] suggest that particulate matter was often from agricultural or non-vehicle sources. Concentrations of PM2.5 in Malaysian schools [28,61,62,63,67] suggest a median level of 22.6 μg m−3 (Q1 = 18.9 and Q3 = 24.325 μg m−3). Traffic-related NO2 was linked to the frequency of asthma symptoms among Malaysian children [28]. The concentrations found in schools (23 ppb in urban schools and 6.7 ppb in semi urban schools) bracket the recent WHO 24-h 2021 guideline of 13 ppb.
3.1.4. School Grounds
Children spend perhaps an hour each day on school grounds. They are likely to be rather active here, so it is unfortunate there are few studies of air pollution in this environment. School grounds are sometimes seen as a surrogate for outdoor air [68], and subject to both traffic and long-range transport sources [21]. Pollutants on soccer fields near busy roads were higher during recess, but exposure was difficult to define [20]. Concentrations in the playground were comparable to the main road during morning hours [54] with coarse particles arising from the resuspension of dust [54,69].
3.2. Exposure Estimates
3.2.1. Concentrations of PM2.5 and NO2
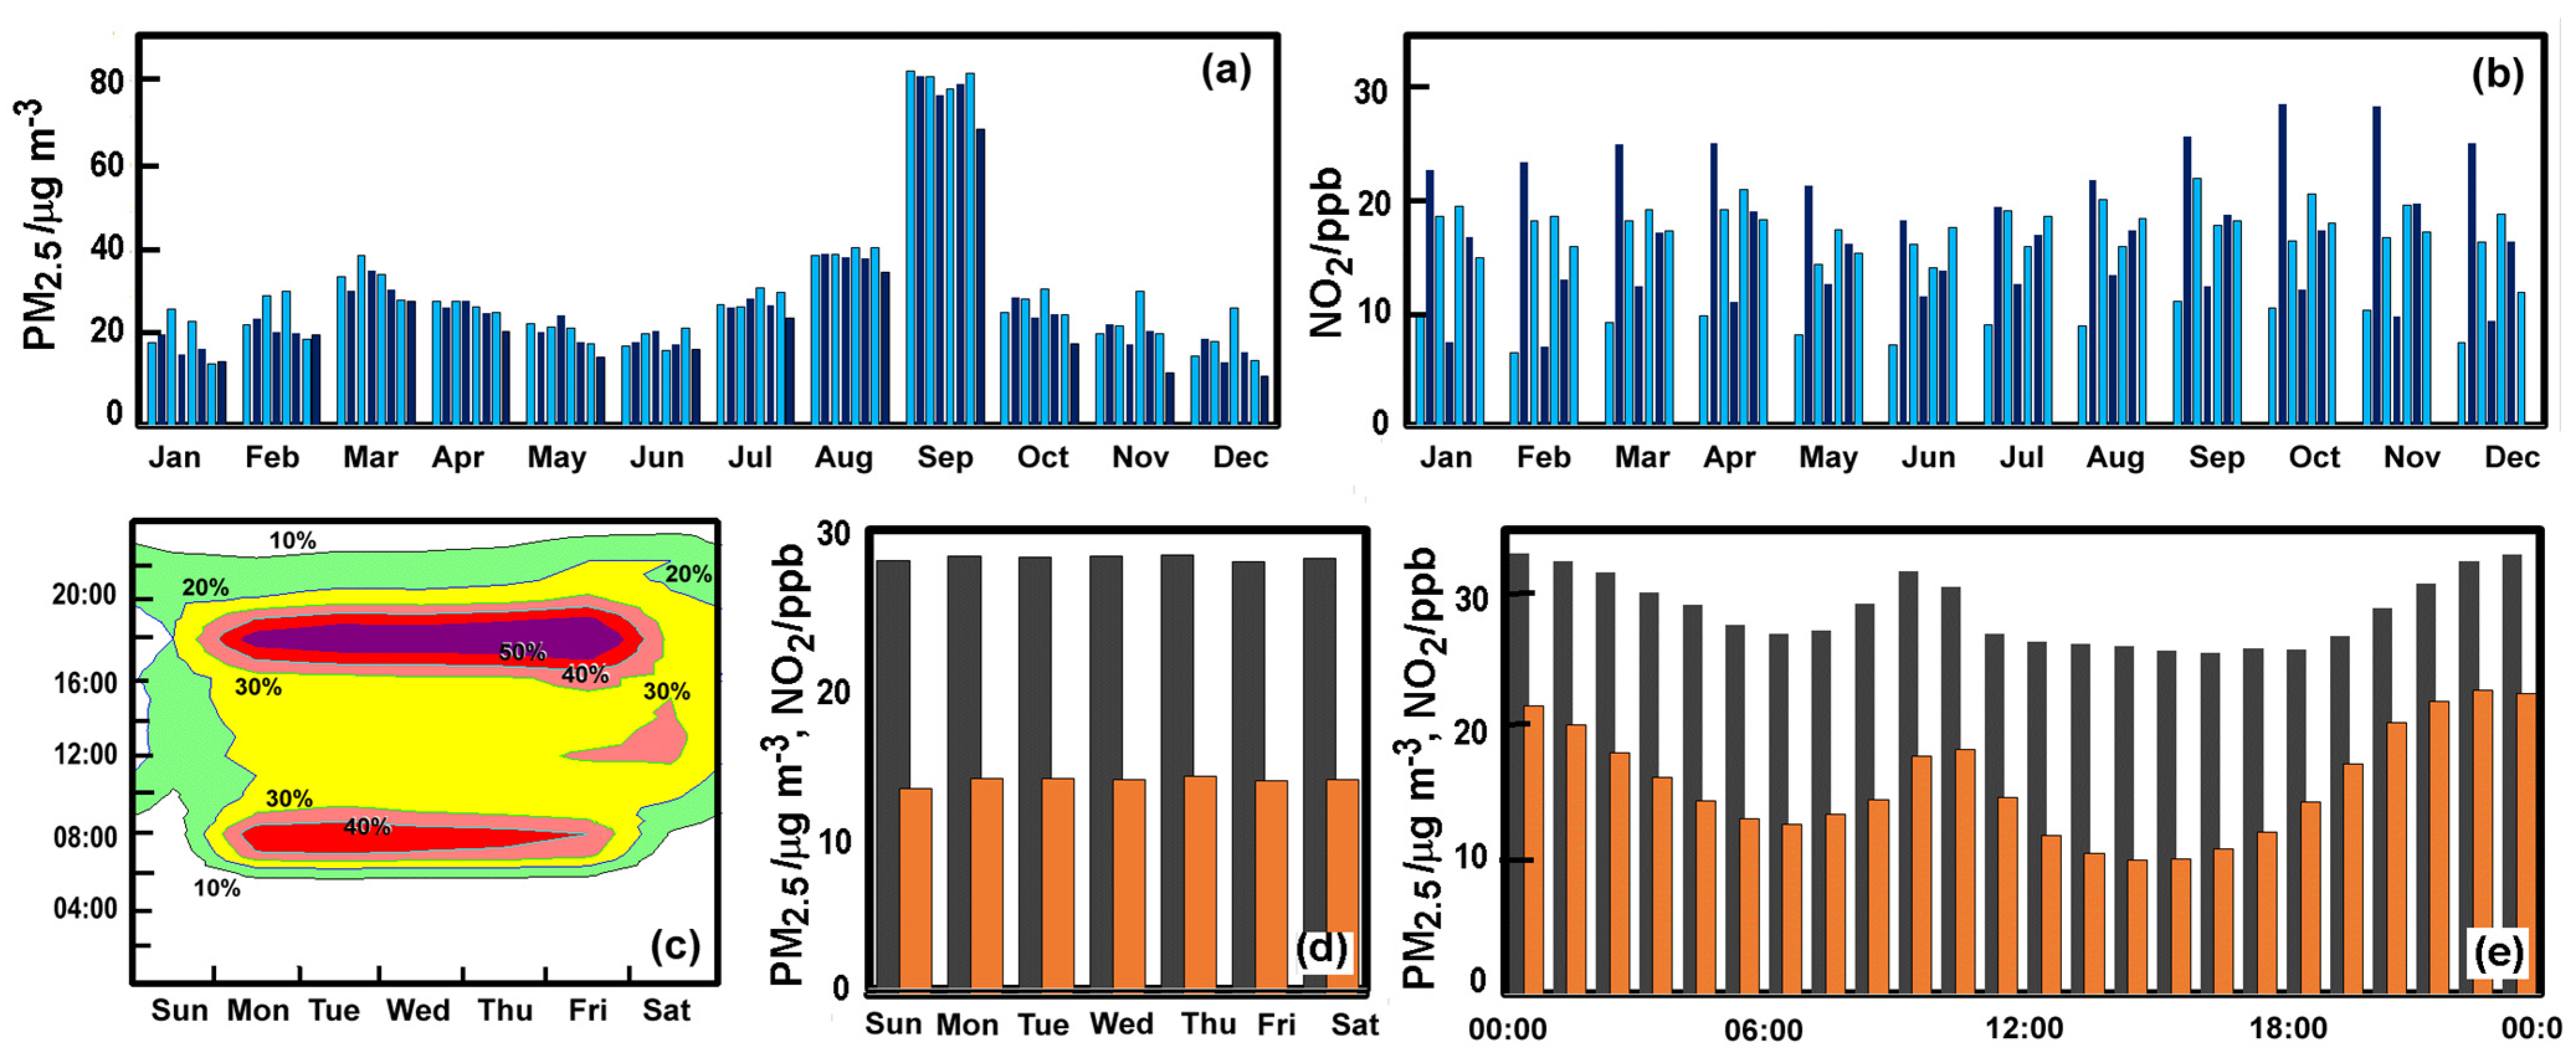
Air pollution in Malaysia is measured by the Department of Environment. We used hourly data for PM2.5 and NO2 and 2019 from sites at: Putrajaya, Petaling Jaya, Shah Alam, Banting, Klang, Cheras, Batu Muda, and Kuala Selangor (NO2 was not available at this last site). There is an annual cycle to PM2.5 concentrations, as shown in Figure 3a, though the extreme values in September result from widespread biomass burning. Such events are key drivers to the annual cycle in the Klang Valley [70]. Overall, the annual variation of NO2 is small (Figure 3b), but the monthly concentrations are regionally more variable than for PM2.5.
In subsequent analyses of variation in PM2.5, we have avoided the period of biomass haze 8 October 2019/26 October 2019, when local particulate concentrations were high, to focus on local emissions. Traffic congestion [71] follows a clearly weekly cycle in Kuala Lumpur (Figure 3c), which indicates a clear diurnal cycle (vertical axis) on weekdays, with a peak around 08:00, and a much stronger peak in the early evening, that grows more prominent as the week progresses (horizontal axis). Sunday and Saturday show less congestion. Traffic congestion only partially matches the weekly cycle of pollutant concentrations (Figure 3d), as both PM2.5 and NO2 reveal less noticeable changes on a seven-day cycle. This hints that there is a broader range of sources than traffic alone (e.g., industry agriculture and the secondary production of particles). The late evening peak may be due to a change in the meteorology at night, as wind speeds are low at night, limiting pollutant dispersion [72].
The amplitude of the diurnal cycle is not very high, especially for PM2.5 (Figure 3e), but it shows slight peaks late in the morning and at night. The pattern persists even on weekends. The cycle for NO2 is more noticeable, so daily changes in sources cause a greater variability. Overall daily emissions cause a late morning peak in pollutant levels; a time which coincides with the morning break, when children are likely to be playing outdoors.
On-road and roadside measurements of air pollution are not common in Malaysia, as the Department of Environment stations are essentially urban background sites. Some data are available for roadside environments from other countries in Southeast Asia [38,73,74]. The roadside values in Kuala Lumpur have been estimated here on the basis of data from Hong Kong [75], which has three roadside stations and 12 urban stations. Data from 2019 show the average roadside PM2.5 concentration to be 25.0 ± 1.7 μg m−3 and 19.3 ± 1.97 μg m−3 at the urban sites, making the ratio 1.3. The concentrations for NO2 are 42.4 ± 0.81 ppb and 21.7 ± 4.06 ppb, yielding a roadside:urban ratio of 1.95 (i.e., ~2). These observations are consistent with the values from Singapore (PM2.5~40 μg m−3) [38], Thailand (highly polluted areas 82–143 μg m−3) [74] and Vietnam (NO2 15–40 ppb) [73]. The roadside concentrations estimated here were used to calculate exposure during school travel. This was reasonable for walking, cycling and travelling by motorbike, but also an approximation for cars, as the indoor–outdoor ratio is close to one in a well ventilated vehicle [76].
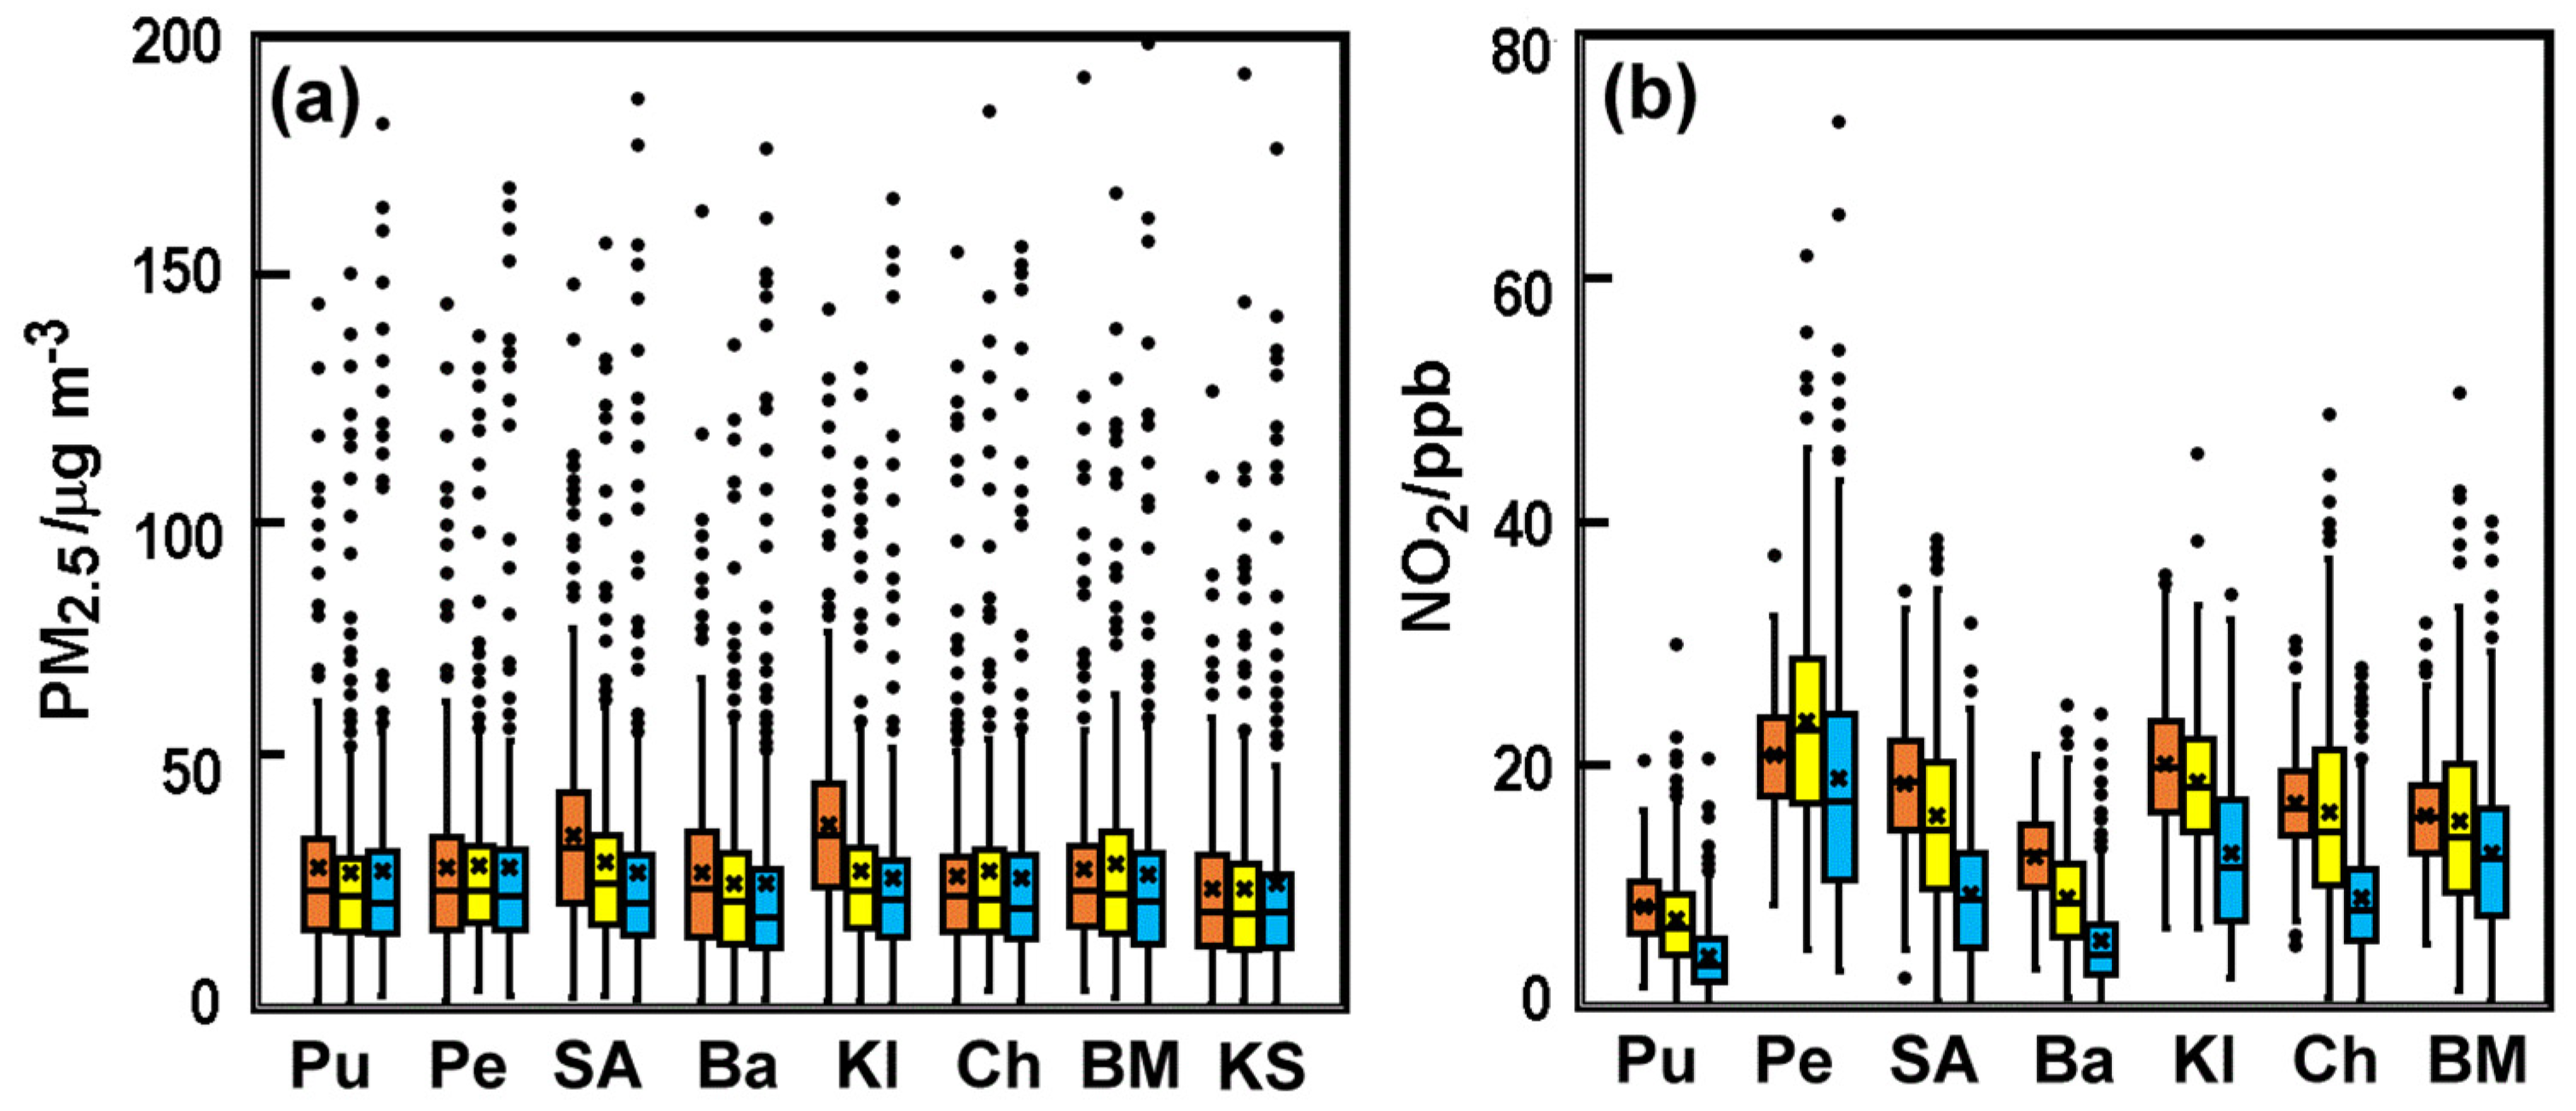
The concentrations of pollutants at critical hours of the school day when the students are outdoors: arriving (08:00), at play (11:00) and leaving (14:00), are shown in Figure 4. There is a tendency for the concentrations of both PM2.5 and NO2 to decline through the morning. We can also see greater intersite variability for NO2, as noted earlier. An ANOVA (DoF = 7) suggests that there is little significant difference between the PM2.5 from the sites at 11:00 (omnibus p~0.003) and 14:00 (omnibus p~0.6), and there were no significant differences between pairs using Scheffé’s comparison, though early morning in Shah Alam and Klang was distinctive from the other sites (p < 0.01). Given the range of particulate sources and the possibility of secondary production, homogeneity is to be expected. The ANOVA (DoF = 6) for the NO2 confirms the high intersite variability at all three periods (omnibus p < 0.0001 for all three periods). Pairwise, the sites were statistically distinctive, with few exceptions.
Exposure needs to consider daily concentration profiles, but this is difficult with fixed point monitors. However, averaged across a large population of school children, the representation will improve. We have adopted the values shown in Table 1. As the PM2.5 concentrations are evenly spread across the region, these are chosen in the same way as the various exposure periods (Table 1). The PM2.5 concentrations estimated for classrooms agree reasonably well with earlier Malaysian studies [28,61,62,63,67] that suggest median levels of 22.6 μg m−3 (Q1 = 18.9 and Q3 = 24.3 μg m−3) and indoor–outdoor ratios close to unity. Concentrations of NO2 measured in Malaysian classrooms were 23 ppb in the urban setting and 6.7 ppb for semi-urban schools [28].
The school grounds and classroom values are taken in the same way as hourly outdoor concentrations. This seems reasonable given that classrooms are well ventilated, but typically not air-conditioned. Roadside concentrations, as noted above, were estimated as 1.3 and 2 times the background values for PM2.5 and NO2. Drop-off and pick-up concentrations were set at twice the roadside values, and are in reasonable agreement with the few available measurements (Figure 2).
3.2.2. Student Exposure during the School Day
Given that children undertake different activities in their school day, ventilation rates (RVE/m3 min−1) vary. These are available from Exposure Factors Handbook of United States [77]. The lowest was associated with sitting (0.0073 m3 min−1), taken as typical of the classroom, along with standing (0.0085 m3 min−1) in the drop-off and pick-up zones, during play (0.0179 m3 min−1). Travel by vehicle assumes a 3:1 mix of car-bus (0.00789 m3 min−1) and motorcycle (0.01 m3 min−1) or walking (0.0178 m3 min−1), with cycling (0.035 m3 min−1) being the highest. These ventilation rates allow an inhaled dose (DI/μg) during daily activities to be estimated [78] according to Equation (1) [79]:
where c is the pollutant concentration (μg m−3) and Δt is the duration of exposure (min). This was estimated for each transport mode from Determination of the Exposure and Travel Mode to School [32], although these self-reported values may be subject to bias. However, a walk or cycle ride lasting 10 min and 15 min respectively by vehicle seemed reasonable.
DI = RVE c Δt
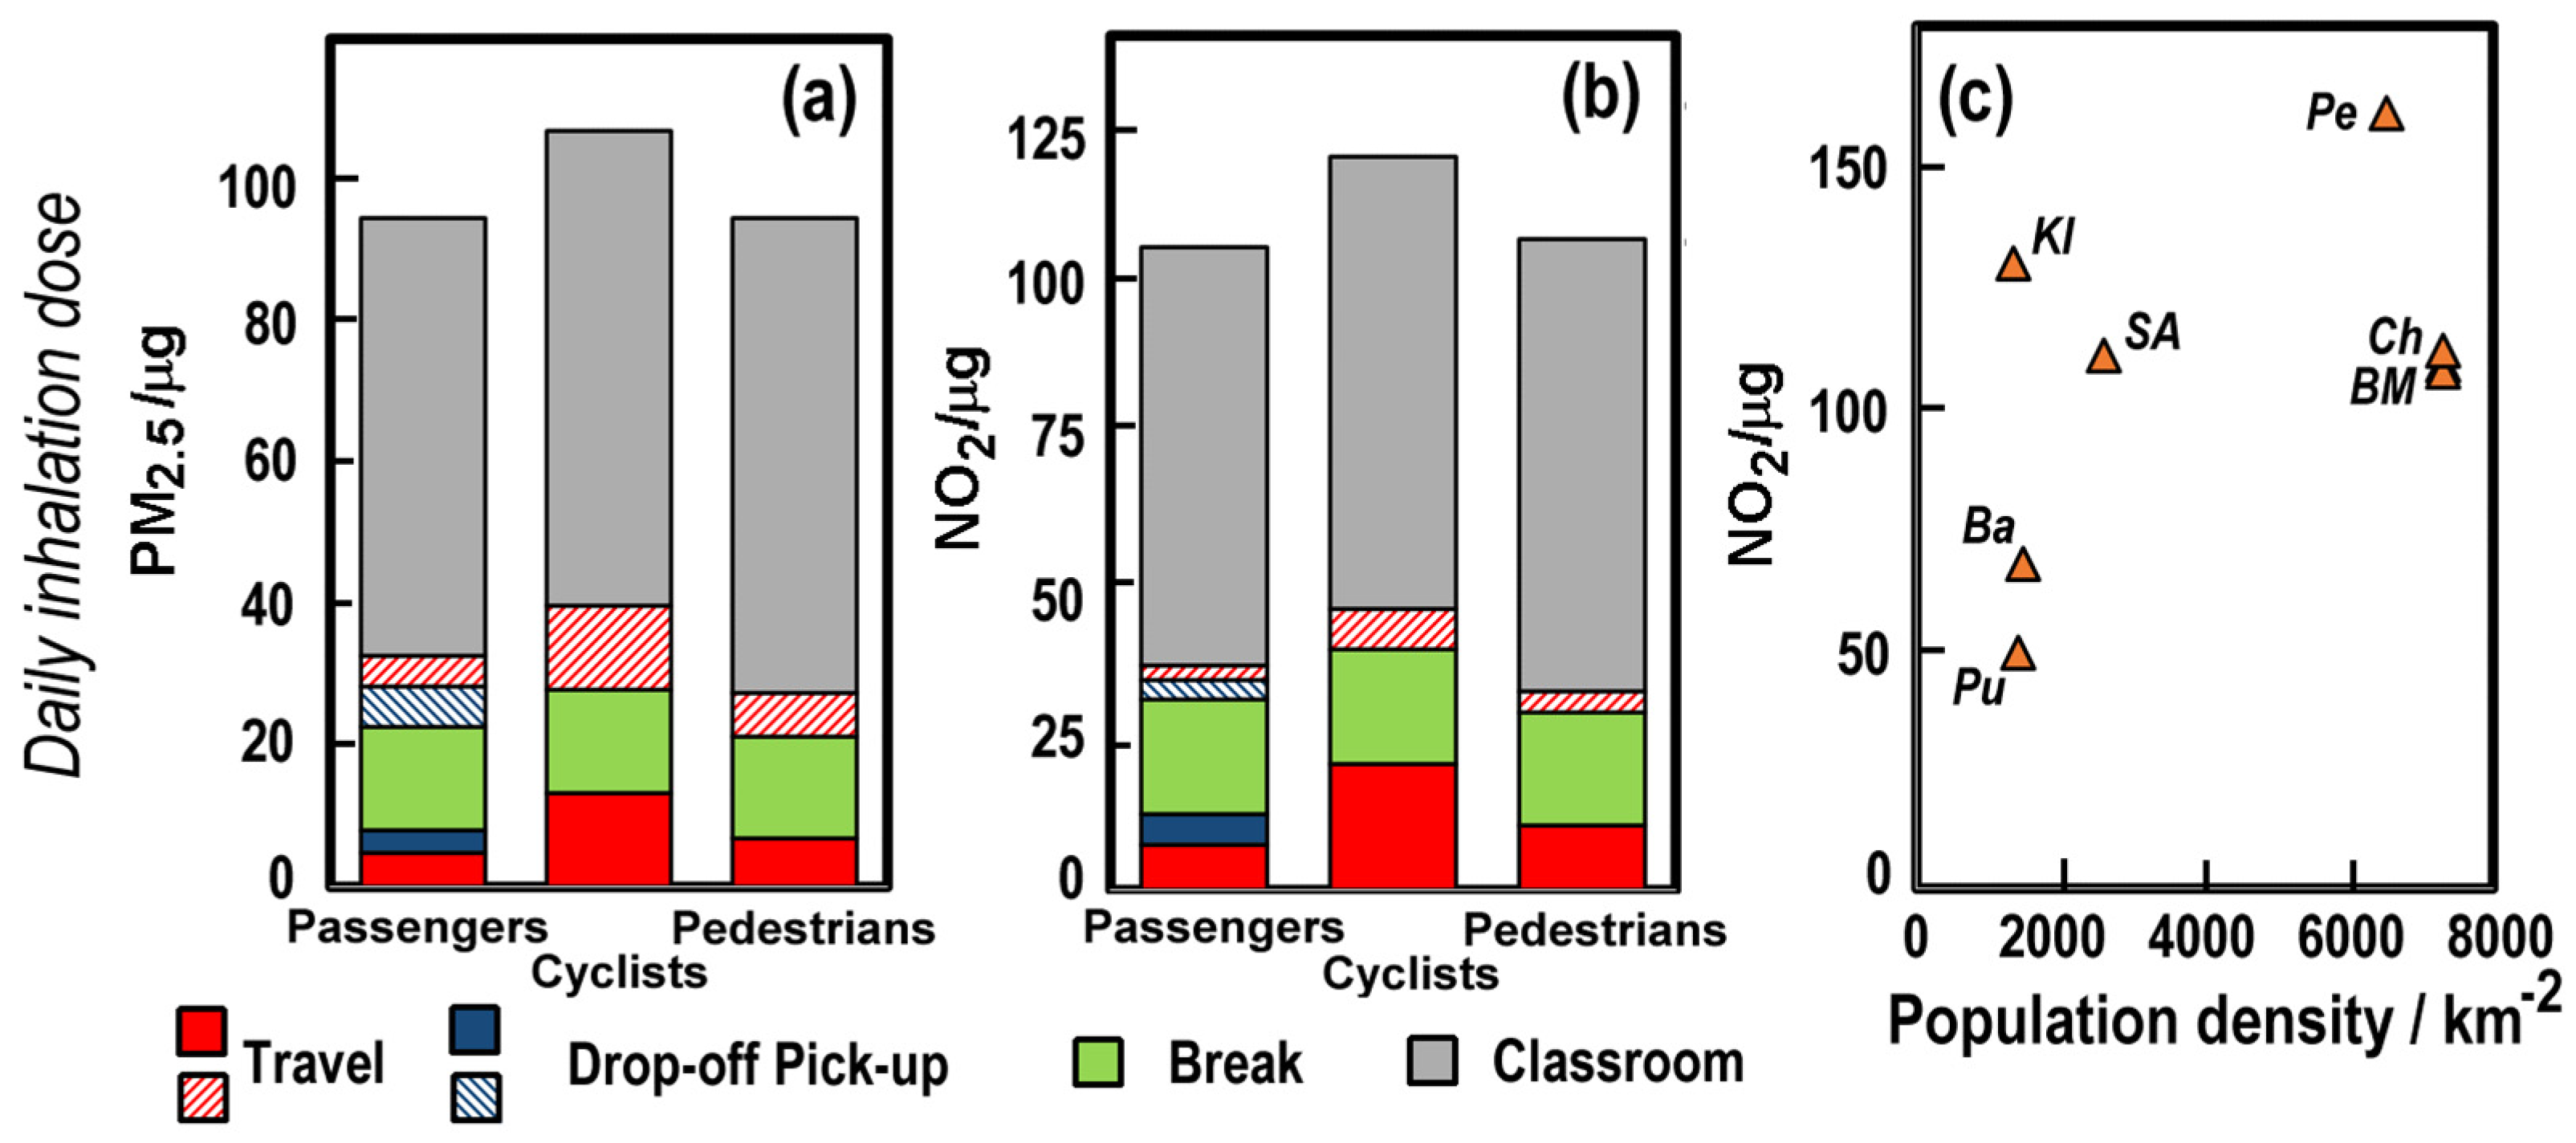
The school day exposure of schoolchildren to PM2.5 and NO2 in the Kuala Lumpur area with different travel choices is shown in Figure 5. Students who walk and cycle have slightly higher exposure to both PM2.5 and NO2 during travel, even though we allowed them to avoid exposure in the drop-off and pick-up areas. Cyclists have the highest exposure, which is the result of high ventilation rates.
The daily inhalation dose of NO2, among students using vehicles for the school trip, varies across the region, but has a loose relationship with population density (Figure 5c). This aligns with the emission estimates for Kuala Lumpur made using road network density and traffic volume [29]. Petaling Jaya has the highest inhalation dose for NO2, but Klang (Kl) is higher than expected. It is a busy port area, so traffic emissions may be disproportionately large for the relatively low population density: 842,146 people in 627 km2.
The calculations suggest that the school day inhalation dose of PM2.5 among Malaysian children is about a third that of Guangzhou residents (350 ± 75 μg) [80], and comparable with a person taking an outdoor trip in Singapore [38]. Evaluating air pollutant inhaled doses in relation to daily activities can serve as a reference point for a better understanding of the time and spatial pattern of pollution risks in a given area. It also helps formulate temporal-spatial prevention and control measures, as well as recommendations for individual risk avoidance [80]. Genetic and synergism factors complicate assessment response to exposure, and in the tropics, special considerations might relate to increase breathing rate when humidity and temperature are high [38].
4. Discussion
4.1. Relative Exposure
Our study suggests that, in Malaysia, about 10% of the school day exposure came from motorised travel to school, though perhaps another 5% could be added from exposure in the drop-off and pick-up zones. The travel contribution is highest for cyclists. Nevertheless, classroom exposure dominates in Malaysia, which may seem surprising given concerns that transport is most relevant to exposure. However, research in Malaysia has, perhaps correctly, focussed on classroom studies rather than on travel.
High exposure may be confused with high concentrations, so caution is needed when interpreting the data. Lim et al. [81] argue that high exposure tends to be greatest in the places where one spends the most time. However, roadside concentrations can readily exceed guideline values, so concerns about travel are not without justification. Our study reveals that there were no hourly NO2 exceedances for the USEPA hourly guideline value of 100 ppb. However, almost 200 h from the eight sites exceeded 50 ppb (i.e., a roadside exceedance, as this would notionally be 100 ppb under our roadside estimates).
Particulate matter is a special problem for Malaysia, given episodes of biomass derived haze where PM2.5 loadings are high. Although traffic generates particulate matter, travel does not always present the greatest risk. There is no hourly guidance value for PM2.5, but we nevertheless noted some 400 exceedances of the Malaysian 35 μg m−3 24-h guideline value across the eight sites, even when excluding the haze period.
Despite the relatively low impact of school travel on the daily dose, there has been increasing international concern over travel exposure. This is certainly a worthy area for study, as concentrations are high, and the kerbs of busy roads experience sharp peaks in NOx concentrations, although it falls away rapidly with distance on busy streets [82]. Additionally, there is a possibility of exposure to more recently released pollutants, e.g., ROS and black carbon [83].
4.2. Research Needs
There are studies of school trips from various parts of the world, but few from the tropics, though there is no particular reason why it might be different, given the great homogeneity of the urban experience in the contemporary world. However, what is noticeable in Malaysia is the lack of roadside measurements, despite a few from other Southeast Asian countries [38,73,74], so further work might be useful. There are few studies of the drop-off and pick-up zones, so again, more measurements would be of value. It would be useful to resolve the effect of the number of vehicles, types of vehicles, student wait times, parent behaviour, congestion, engines running in queues, air conditioning in cars, etc.
Classroom studies [62] are widely available, though it can be argued that research is needed on the long-term effects of exposure to indoor pollutants. There are likely associations between home exposure and questions of ethnicity, which may relate to environmental health disparities [58,59]. A key issue is the lack of understanding of the health effects of the rather unique collection particles at school that defines its indoor environment, as so little is known about the toxicity of indoor particles [84].
Playgrounds have been poorly studied, so these recreation areas represent a key gap in understanding exposure, given the high inhalation rates during play. In particular, pollutant exposure in school playgrounds deserves more attention during design. Air pollution and park layout have received some attention, with interest in controlling exposure through the distribution of occupants [85] and design features [86]. Suspended dust in playgrounds has been mentioned by researchers [54,69], and although the health impact is not known, it looks to be a relevant area of research.
4.3. Potential for Change
Cycling proved to have the highest travel exposure for school children, but the activity comes with positive benefits, such as exercise and the development of independence, so it is worthy of encouragement. Bicycle proficiency programs in classroom environments have attempted to increase cycling trips, while an individualized marketing strategy in Perth (Australia) resulted in positive changes towards more active travel behaviour [87]. It is also likely that training could help cyclists choose safer and less polluted routes.
Travelling to school by car still dominates Malaysia, where there is a fear that children might be kidnapped that pressures parents to drive them to school. A few public interest groups worry that children do not exercise enough when they do not walk or cycle. Risks certainly arise because of the lack of footpaths along many school routes, suggesting these could be “greened” and improved [88]. It is effective to provide drop-off spots to promote walking to school [53].
In terms of the classroom environment, detailed investigations of indoor air quality and the better maintenance of school classroom ventilation systems have been suggested [67], while there are also immediate measures (e.g., routine classroom cleaning, student zoning, and the installation of solid and vegetation barriers) [65]. The thoughtful redesign of school buildings and the grounds can be expensive, but over the longer term, whenever changes are planned, they are important considerations in reducing environmental exposure.
5. Conclusions
In Kuala Lumpur, most children are driven to and from school, and although this represents a better route to lower exposure than walking or cycling, it may not give students the best exercise or sense of independence. Pollutant levels are likely to be high in congested drop-off and pick-up areas where children can experience peak NO2 concentrations, but the length of exposure may be just ten minutes or so. Pollution and respiratory activities are high outdoors when children are at play, so exposure can accumulate more rapidly. However, cumulative exposure in well ventilated classrooms dominates the school day. Studies of the classroom environment are frequent in Malaysia, but less has been done on travel and playground exposure, where it is important to assess the importance of these brief periods of exercise. Measurements of pollutant concentrations at the roadside are uncommon, so may require further measurements. There are additionally opportunities to consider layouts of schools that minimise exposure and enhance safety.
Author Contributions
Conceptualization, methodology, visualization, E.E. and P.B.; data analysis, writing—original draft preparation P.B.; writing—review and editing, E.E. and P.B. All authors have read and agreed to the published version of the manuscript.
Funding
This research is supported by the Geran Inisiatif Putra Muda, Universiti Putra Malaysia (GP-IPM/2020/9683000).
Institutional Review Board Statement
Not applicable.
Informed Consent Statement
Not applicable.
Data Availability Statement
Data is publicly available at the websites referenced.
Conflicts of Interest
The authors declare no conflict of interest.
References
- Osman, M.M.; Abdullah, M.F.; Khalid, N.; Bachok, S.; Rabe, N.S.; Shuid, S.; Ponrahono, Z. Perception of parents and guardians on safe distance for children to travel to public areas. Plan. Malays. 2017, 12, 15. [Google Scholar]
- Periyakoil, D.; Das, H.P.; Miller, C.; Spanos, C.J.; Prata, N. Environmental Exposures in Singapore Schools: An Ecological Study. Int. J. Environ. Res. Public Health 2021, 18, 1843. [Google Scholar] [CrossRef]
- Shokoohi, R.; Hanif, N.R.; Dali, M.M. Children walking to and from school in Tehran: Associations with neighbourhood safety, parental concerns and children’s perceptions. Procedia-Soc. Behav. Sci. 2012, 38, 315–323. [Google Scholar] [CrossRef] [Green Version]
- Osborne, S.; Uche, O.; Mitsakou, C.; Exley, K.; Dimitroulopoulou, S. Air quality around schools: Part I-A comprehensive literature review across high-income countries. Environ. Res. 2021, 30, 110817. [Google Scholar] [CrossRef]
- Ahmed, S.; Adnan, M.; Janssens, D.; Wets, G. A Route to school Informational Intervention for Air Pollution Exposure Reduction. Sustain. Cities Soc. 2019, 53, 101965. [Google Scholar] [CrossRef]
- Hertel, O.; Hvidberg, M.; Ketzel, M.; Storm, L.; Stausgaard, L. A proper choice of route significantly reduces air pollution exposure—A study on bicycle and bus trips in urban streets. Sci. Total Environ. 2008, 389, 58–70.28. [Google Scholar] [CrossRef]
- Mölter, A.; Lindley, S. Influence of walking route choice on primary school children’s exposure to air pollution—A proof of concept study using simulation. Sci. Total Environ. 2015, 530, 257–262. [Google Scholar] [CrossRef] [PubMed]
- Adams, M.D.; Requia, W.J. How private vehicle use increases ambient air pollution concentrations at schools during the morning drop-off of children. Atmos. Environ. 2017, 165, 264–273. [Google Scholar] [CrossRef]
- Jamil, N.A.; Jalaludin, J.; Kamaruddin, A.S.; Ibrahim, M.H. Exposure to air pollutants PM10, NO2, SO2 and VOCs on the lung functions among school children living nearby the petrochemical industry area in Kemaman, Terengganu. Adv. Environ. Biol. 2015, 9, 55–64. [Google Scholar]
- Azizi, B.H.O.; Henry, R.L. Effects of indoor air pollution on lung function of primary school children in Kuala Lumpur. Pediatr. Pulmonol. 1990, 9, 24–29. [Google Scholar] [CrossRef] [PubMed]
- Fromme, H.; Twardella, D.; Dietrich, S.; Heitmann, D.; Schierl, R.; Liebl, B.; Rüden, H. Particulate matter in the indoor air of classrooms—Exploratory results from Munich and surrounding area. Atmos. Environ. 2007, 41, 854–866. [Google Scholar] [CrossRef]
- Janssen, N.A.; van Vliet, P.H.; Aarts, F.; Harssema, H.; Brunekreef, B. Assessment of exposure to traffic related air pollution of children attending schools near motorways. Atmos. Environ. 2001, 35, 3875–3884. [Google Scholar] [CrossRef]
- Majd, E.; McCormack, M.; Davis, M.; Curriero, F.; Berman, J.; Connolly, F.; Leaf, P.; Rule, A.; Green, T.; Clemons-Erby, D.; et al. Indoor air quality in inner-city schools and its associations with building characteristics and environmental factors. Environ. Res. 2019, 170, 83–91. [Google Scholar] [CrossRef]
- Mejía, J.F.; Choy, S.L.; Mengersen, K.; Morawska, L. Methodology for assessing exposure and impacts of air pollutants in school children: Data collection, analysis and health effects—A literature review. Atmos. Environ. 2011, 45, 813–823. [Google Scholar] [CrossRef]
- Rawi, M.N.; Azwani, N.; Jalaludin, J.; Chua, P.C. Indoor air quality and respiratory health among Malay preschool children in Selangor. BioMed Res. Int. 2015, 2015, 248178. [Google Scholar]
- Macneill, M.; Dobbin, N.; St-Jean, M.; Wallace, L.; Marro, L.; Shin, T.; You, H.; Kulka, R.; Allen, R.W.; Wheeler, A.J. Can changing the timing of outdoor air intake reduce indoor concentrations of traffic-related pollutants in schools? Indoor Air 2016, 26, 687–701. [Google Scholar] [CrossRef]
- McCarthy, M.C.; Ludwig, J.F.; Brown, S.G.; Vaughn, D.L.; Roberts, P.T. Filtration effectiveness of HVAC systems at near-roadway schools. Indoor Air 2013, 23, 196–207. [Google Scholar] [CrossRef]
- Rivas, I.; Querol, X.; Wright, J.; Sunyer, J. How to protect school children from the neurodevelopmental harms of air pollution by interventions in the school environment in the urban context. Environ. Int. 2018, 121, 199–206. [Google Scholar] [CrossRef]
- Hopley, E.; Brimblecombe, P. Diurnal cycles of carbon monoxide and nitric oxides near schools. Clean Air 2002, 32, 75–77. [Google Scholar]
- Rundell, K.W.; Caviston, R.; Hollenbach, A.M.; Murphy, K. Vehicular air pollution, playgrounds, and youth athletic fields. Inhal. Toxicol. 2006, 18, 541–547. [Google Scholar] [CrossRef]
- Ozdemir, H.; Mertoglu, B.; Demir, G.; Deniz, A.; Toros, H. Case study of PM pollution in playgrounds in Istanbul. Theor. Appl. Climatol. 2012, 108, 553–562. [Google Scholar] [CrossRef]
- Xing, Y.; Brimblecombe, P. Trees and parks as “the lungs of cities”. Urban For. Urban Green. 2020, 48, 126552. [Google Scholar] [CrossRef]
- UNICEF. Impact of Climate Change on Children: A Malaysian Perspective; United Nations Childrens’ Fund: Putrajaya, Malaysia, 2021. [Google Scholar]
- Shafie, S.H.; Mahmud, M. Urban air pollutant from motor vehicle emissions in Kuala Lumpur, Malaysia. Aerosol Air Qual. Res. 2020, 20, 2793–2804. [Google Scholar] [CrossRef]
- Mohtar, A.A.; Latif, M.T.; Baharudin, N.H.; Ahamad, F.; Chung, J.X.; Othman, M.; Juneng, L. Variation of major air pollutants in different seasonal conditions in an urban environment in Malaysia. Geosci. Lett. 2018, 5, 1–3. [Google Scholar] [CrossRef]
- Latif, M.T.; Othman, M.; Idris, N.; Juneng, L.; Abdullah, A.M.; Hamzah, W.P.; Khan, M.F.; Sulaiman, N.M.; Jewaratnam, J.; Aghamohammadi, N.; et al. Impact of regional haze towards air quality in Malaysia: A review. Atmos. Environ. 2018, 177, 28–44. [Google Scholar] [CrossRef]
- Velasco, E.; Roth, M. Review of Singapore’s air quality and greenhouse gas emissions: Current situation and opportunities. J. Air Waste Manag Assoc. 2012, 62, 625–641. [Google Scholar] [CrossRef] [Green Version]
- Abidin, E.Z.; Semple, S.; Rasdi, I.; Ismail, S.N.; Ayres, J.G. The relationship between air pollution and asthma in Malaysian schoolchildren. Air Qual. Atmos. Health 2014, 7, 421–432. [Google Scholar] [CrossRef]
- Azhari, A.; Abdul Halim, N.D.; Othman, M.; Latif, M.T.; Juneng, L.; Sofwan, N.M.; Stocker, J.; Johnson, K. Highly spatially resolved emission inventory of selected air pollutants in Kuala Lumpur’s urban environment. Atmos. Pollut. Res. 2021, 12, 12–22. [Google Scholar] [CrossRef]
- Osman, N.; Abdullah, Y.A.; Khalid, N.S. Factors influencing active travel mode to school for primary school children. Environ. Behav. Proc. J. 2020, 5, 13–19. [Google Scholar] [CrossRef]
- Kearns, R.A.; Collins, D.C.; Neuwelt, P.M. The walking school bus: Extending children’s geographies? Area 2003, 35, 285–292. [Google Scholar] [CrossRef]
- MIROS. Research Report MRR 305 Determination of the Exposure and Travel Mode to School; Malaysian Institute of Road Safety Research: Selangor, Malaysia, 2020; ISBN 978-967-2078-64-7. [Google Scholar]
- Ma, X.; Longley, I.; Gao, J.; Salmond, J. Assessing schoolchildren’s exposure to air pollution during the daily commute-A systematic review. Sci. Total Environ. 2020, 737, 140389. [Google Scholar] [CrossRef]
- Xing, Y.; Brimblecombe, P.; Ning, Z. Fine-scale spatial structure of air pollutant concentrations along bus routes. Sci. Total Environ. 2019, 658, 1–7. [Google Scholar] [CrossRef] [PubMed]
- Wang, Z.Y.; Zhao, H.M.; Peng, Z.R. Spatiotemporal analysis of pedestrian exposure to submicron and coarse particulate matter on crosswalk at urban intersection. Build. Environ. 2021, 204, 108149. [Google Scholar] [CrossRef]
- Buonanno, G.; Stabile, L.; Morawska, L.; Russi, A. Children exposure assessment to ultrafine particles and black carbon: The role of transport and cooking activities. Atmos. Environ. 2013, 79, 53–58. [Google Scholar] [CrossRef] [Green Version]
- Nieuwenhuijsen, M.J.; Donaire-Gonzalez, D.; Rivas, I.; de Castro, M.; Cirach, M.; Hoek, G.; Seto, E.; Jerrett, M.; Sunyer, J. Variability in and agreement between modeled and personal continuously measured black carbon levels using novel smartphone and sensor technologies. Environ. Sci. Technol. 2015, 49, 2977–2982. [Google Scholar] [CrossRef] [PubMed]
- Tran, P.T.M.; Zhao, M.; Yamamoto, K.; Minet, L.; Nguyen, T.; Balasubramanian, R. Cyclists’ personal exposure to traffic-related air pollution and its influence on bikeability. Transp. Res. D 2020, 88, 102563. [Google Scholar] [CrossRef]
- Hatzopoulou, M.; Weichenthal, S.; Dugum, H.; Pickett, G.; Miranda-Moreno, L.; Kulka, R.; Andersen, R.; Goldberg, M. The impact of traffic volume, composition, and road geometry on personal air pollution exposures among cyclists in Montreal, Canada. J. Expo. Sci. Environ. Epidemiol. 2013, 23, 46–51. [Google Scholar] [CrossRef]
- Tudor-Locke, C.; Ainsworth, B.E.; Popkin, B.M. Active commuting to school. Sports Med. 2001, 31, 309–313. [Google Scholar] [CrossRef]
- Panter, J.R.; Jones, A.P.; Van Sluijs, E.M.; Griffin, S.J. Neighborhood, route, and school environments and children’s active commuting. Am. J. Prev. Med. 2010, 38, 268–278. [Google Scholar] [CrossRef] [Green Version]
- Moening, K. Step by Step: How to Start a Walking School Bus at Your School, Safe Routes to School National Partnerships. 2016. Available online: https://saferoutespartnership.org/sites/default/files/resource_files/step-by-step-walking-school-bus.pdf (accessed on 2 January 2022).
- Dirks, K.; Salmond, J.; Talbot, N. Air pollution exposure in walking school bus routes: A New Zealand case study. Int. J. Environ. Res. Public Health 2018, 15, 2802. [Google Scholar] [CrossRef] [Green Version]
- Neuwelt, P.M.; Kearns, R.A. Health benefits of walking school buses in Auckland, New Zealand: Perceptions of children and adults. Child. Youth Environ. 2006, 16, 104–120. [Google Scholar]
- Nurulhuda, J.; Sharifah Allyana, S.M.R.; Nur Zarifah, H.; Azzuhana, R.; Askiah, J. Exposure School Travel among Primary School in Selangor, Malaysia. Int. J. Acad. Res. Bus. Soc. Sci. 2019, 9, 726–734. [Google Scholar]
- Dalton, M.A.; Longacre, M.R.; Drake, K.M.; Gibson, L.; Adachi-Mejia, A.M.; Swain, K.; Xie, H.; Owens, P.M. Built environment predictors of active travel to school among rural adolescents. Am. J. Prev. Med. 2011, 40, 312–319. [Google Scholar] [CrossRef] [PubMed] [Green Version]
- Collins, D.; Kearns, R.A. Walking school buses in the Auckland region: A longitudinal assessment. Transp. Policy 2010, 17, 1–8. [Google Scholar] [CrossRef]
- Eghbalnia, C.; Sharkey, K.; Garland-Porter, D.; Alam, M.; Crumpton, M.; Jones, C.; Ryan, P.H. A community-based participatory research partnership to reduce vehicle idling near public schools. J. Environ. Health 2013, 75, 14–19. [Google Scholar] [PubMed]
- Kim, J.Y.; Ryan, P.H.R.; Yermakov, M.; Schaffer, C.; Reponen, T.; Grinshpun, S.A. The effect of an anti-idling campaign on indoor aerosol at urban schools. Aerosol Air Qual. Res. 2014, 14, 585–595. [Google Scholar] [CrossRef] [Green Version]
- Ryan, P.H.; Reponen, T.; Simmons, M.; Yermakov, M.; Sharkey, K.; Garland-Porter, D.; Eghbalnia, C.; Grinshpun, S.A. The impact of an anti-idling campaign on outdoor air quality at four urban schools. Environ. Sci. Processes Impacts 2013, 15, 2030–2037. [Google Scholar] [CrossRef]
- Koehler, M. School Drop-Off Zones Can Be Total Madhouses. How Do We Solve That Problem? Greater Greater Washington. 2017. Available online: https://ggwash.org/view/62650/what-do-you-do-when-your-kids-school-drop-off-zone-is-a-total-madhouse (accessed on 14 January 2022).
- Sharifah Allyana, S.M.R.; Nurulhuda, J.; Nur Zarifah, H.; Azzuhana, R. Drop-off and Pick-up Zone in Selected Primary School in Selangor. Int. J. Acad. Res. Bus. Soc. Sci. 2020, 9, 138–144. [Google Scholar]
- Vanwolleghem, G.; D’Haese, S.; Van Dyck, D.; De Bourdeaudhuij, I.; Cardon, G. Feasibility and effectiveness of drop-off spots to promote walking to school. Int. J. Behav. Nutr. Phys. Act. 2014, 11, 1–11. [Google Scholar] [CrossRef] [PubMed] [Green Version]
- Kumar, P.; Omidvarborna, H.; Pilla, F.; Lewin, N. A primary school driven initiative to influence commuting style for dropping-off and picking-up of pupils. Sci. Total Environ. 2020, 727, 138360. [Google Scholar] [CrossRef]
- Sattanon, K.; Upala, P. Assessment of Parent’s Anxiety within Safety of Children: Primary schools in the upper southern part of Thailand. Environ. Behav Proc. J. 2017, 2, 415–425. [Google Scholar] [CrossRef] [Green Version]
- Sattanon, K.; Upala, P. Evaluation of Risk Factor for Children During Drop-off and Pick-up Time around the Primary School in Thailand. Open Transp. J. 2018, 28, 12. [Google Scholar] [CrossRef]
- Fisk, W.J. The ventilation problem in schools: Literature review. Indoor Air 2017, 27, 1039–1051. [Google Scholar] [CrossRef] [Green Version]
- Norbäck, D.; Hashim, J.H.; Hashim, Z.; Cai, G.-H.; Sooria, V.; Ismail, S.A.; Wieslander, G. Respiratory symptoms and fractional exhaled nitric oxide (FeNO) among students in Penang, Malaysia in relation to signs of dampness at school and fungal DNA in school dust. Sci. Total Environ. 2017, 577, 148–154. [Google Scholar] [CrossRef] [Green Version]
- Norbäck, D.; Hashim, Z.; Ali, F.; Hashim, J.H. Asthma symptoms and respiratory infections in Malaysian students-associations with ethnicity and chemical exposure at home and school. Environ. Res. 2021, 197, 111061. [Google Scholar] [CrossRef] [PubMed]
- Amato, F.; Rivas, I.; Viana, M.; Moreno, T.; Bouso, L.; Reche, C.; Àlvarez-Pedrerol, M.; Alastuey, A.; Sunyer, J.; Querol, X. Sources of indoor and outdoor PM2.5 concentrations in primary schools. Sci. Total Environ. 2014, 490, 757–765. [Google Scholar] [CrossRef]
- Alias, A.; Latif, M.T.; Othman, M.; Azhari, A.; Wahid, N.B.A.; Aiyub, K.; Khan, M.F. Compositions, source apportionment and health risks assessment of fine particulate matter in naturally-ventilated schools. Atmos. Pollut. Res. 2021, 12, 101190. [Google Scholar] [CrossRef]
- Isa, K.N.M.; Hashim, Z.; Jalaludin, J.; Norbäck, D.; Jabbar, M.A.; Hashim, J.H. The Impact of Exposure to Indoor Pollutants on Allergy and Lung Inflammation among School Children in Selangor, Malaysia: An Evaluation Using Factor Analysis. Aerosol Air Qual. Res. 2020, 20, 2371–2383. [Google Scholar]
- Suroto, A.; Shith, S.; Yusof, N.M.; Ramli, N.A. Impact of high particulate event on the indoor and outdoor fine particulate matter concentrations during the Southwest monsoon season. IOP Conf. Ser. Mater. Sci. Eng. 2020, 920, 012007. [Google Scholar] [CrossRef]
- Bootdee, S.; Phantu, S.; Lamlongrat, P.; Khumphai, T. Indoor nitrogen dioxide investigation and health risk assessment in primary schools at Rayong City, Thailand. Curr. Appl. Sci. Technol. 2019, 19, 248–262. [Google Scholar]
- Kaewrat, J.; Janta, R. Effect of COVID-19 prevention measures on air quality in Thailand. Aerosol Air Qual. Res. 2021, 1, 21. [Google Scholar] [CrossRef]
- Mulia, G.J.; Wispriyono, B.; Kusnoputranto, H.; Hartono, B.; Rozaliyani, A. Indoor Air Pollution and Respiratory Function on Primary School Students in West Jakarta, Indonesia. Open Public Health J. 2020, 13, 190–195. [Google Scholar] [CrossRef]
- Othman, M.; Latif, M.T.; Matsumi, Y. The exposure of children to PM2.5 and dust in indoor and outdoor school classrooms in Kuala Lumpur City Centre. Ecotoxicol. Environ. Saf. 2019, 170, 739–749. [Google Scholar] [CrossRef] [PubMed]
- Mohammadyan, M.; Alizadeh-Larimi, A.; Etemadinejad, S.; Latif, M.T.; Heibati, B.; Yetilmezsoy, K.; Abdul-Wahab, S.A.; Dadvand, P. Particulate air pollution at schools: Indoor-outdoor relationship and determinants of indoor concentrations. Aerosol Air Qual. Res. 2017, 17, 857–864. [Google Scholar] [CrossRef]
- Moreno, T.; Rivas, I.; Bouso, L.; Viana, M.; Jones, T.; Àlvarez-Pedrerol, M.; Alastuey, A.; Sunyer, J.; Querol, X. Variations in school playground and classroom atmospheric particulate chemistry. Atmos. Environ. 2014, 91, 162–171. [Google Scholar] [CrossRef]
- Amil, N.; Latif, M.T.; Khan, M.F.; Mohamad, M. Seasonal variability of PM2.5 composition and sources in the Klang Valley urban-industrial environment. Atmos. Chem. Phys. 2016, 16, 5357–5381. [Google Scholar] [CrossRef] [Green Version]
- Levinson, H.S.; Lomax, T.J. Developing a travel time congestion index. Transp. Res. Rec. 1996, 1564, 1–10. [Google Scholar] [CrossRef]
- Swarno, H.A.; Zaki, S.A.; Yusup, Y.; Ali, M.S.M.; Ahmad, N.H. Observation of diurnal variation of urban microclimate in Kuala Lumpur, Malaysia. Chem. Eng. Trans. 2017, 56, 523–528. [Google Scholar]
- Hung, N.T.; Ketzel, M.; Jensen, S.S.; Oanh, N.T.K. Air pollution modeling at road sides using the operational street pollution model—A case study in Hanoi, Vietnam. J. Air Waste Manag Assoc. 2010, 60, 1315–1326. [Google Scholar] [CrossRef] [PubMed]
- Jinsart, W.; Tamura, K.; Loetkamonwit, S.; Thepanondh, S.; Karita, K.; Yano, E. Roadside particulate air pollution in Bangkok. J. Air Waste Manag Assoc. 2002, 52, 1102–1110. [Google Scholar] [CrossRef] [Green Version]
- HKEPD. Air Quality in Hong Kong 2019 Statistical Summary, Air Science Group. Available online: https://www.aqhi.gov.hk/api_history/english/report/files/2019StatSummaryEn.pdf (accessed on 25 November 2021).
- Correia, C.; Martins, V.; Cunha-Lopes, I.; Faria, T.; Diapouli, E.; Eleftheriadis, K.; Almeida, S.M. Particle exposure and inhaled dose while commuting in Lisbon. Environ. Pollut. 2020, 257, 113547. [Google Scholar] [CrossRef]
- USEPA. Exposure Factors Handbook; United States Environmental Protection Agency, Office of Health, Environmental Assessment, Exposure Assessment Group: Washington, DC, USA, 1989. [Google Scholar]
- Beals, J.A.; Funk, L.M.; Fountain, R.; Sedman, R. Quantifying the distribution of inhalation exposure in human populations: Distribution of minute volumes in adults and children. Environ. Health Perspect. 1996, 104, 974–979. [Google Scholar] [CrossRef]
- Borghi, F.; Spinazzè, A.; Fanti, G.; Campagnolo, D.; Rovelli, S.; Keller, M.; Cattaneo, A.; Cavallo, D.M. Commuters’ personal exposure assessment and evaluation of inhaled dose to different atmospheric pollutants. Int. J. Environ. Res. Public Health 2020, 17, 3357. [Google Scholar] [CrossRef]
- Song, J.; Zhou, S.; Xu, J.; Su, L. From PM2.5 exposure to PM2.5 risks of inhaled dose in daily activities: Empirical evidence during workdays from Guangzhou, China. Atmos. Environ. 2021, 249, 118224. [Google Scholar] [CrossRef]
- Lim, S.; Kim, J.; Kim, T.; Lee, K.; Yang, W.; Jun, S.; Yu, S. Personal exposures to PM2.5 and their relationships with microenvironmental concentrations. Atmos. Environ. 2012, 47, 407–412. [Google Scholar] [CrossRef]
- Brimblecombe, P.; Chu, M.; Lui, C.-H.; Ning, Z. NOx and CO fluctuations in a busy street canyon. Environments 2021, 8, 137. [Google Scholar] [CrossRef]
- Gali, N.K.; Stevanovic, S.; Brimblecombe, P.; Brown, R.A.; Ristovski, Z.; Ning, Z. The diurnal characteristics of PM-bound ROS and its influencing factors at urban ambient and roadside environments. Atmos. Res. 2020, 244, 105039. [Google Scholar] [CrossRef]
- Ezani, E.; Brimblecombe, P.; Asha’ari, Z.H.; Fazil, A.A.; Ismail, S.N.S.; Ramly, Z.T.A.; Khan, M.F. Indoor and outdoor exposure to PM2.5 during covid-19 lockdown in suburban malaysia. Aerosol Air Qual. Res. 2021, 1, 20. [Google Scholar]
- Xing, Y.; Brimblecombe, P. Urban park layout and exposure to traffic-derived air pollutants. Landsc. Urban Plan. 2020, 194, 103682. [Google Scholar] [CrossRef]
- Xing, Y.; Brimblecombe, P. Traffic-derived noise, air pollution and urban park design. J. Urban Des. 2020, 25, 590–606. [Google Scholar] [CrossRef]
- Goulias, K.G.; Broeg, W.W.; James, B.; Graham, C. Travel behavior analysis of South Perth individualized marketing intervention. Transp. Res. Rec. 2002, 1807, 77–86. [Google Scholar] [CrossRef]
- Bozhilova, M.; Zhiyanski, M. Possible benefits from greening of public transport stops in Sofia, Bulgaria. Silva Balc. 2021, 22, 17. [Google Scholar] [CrossRef]
Figure 1.
(a) Map of peninsular Malaysia, with Kuala Lumpur as a red dot. (b) Map showing the State of Selangor with schools from the MIROS report (MIROS 2020), monitoring sites and districts of the State and the two Federal Territories of Kuala Lumpur (red) and of Putrajaya (red-brown). The monitoring sites are coded: Putrajaya (Pu), Petaling Jaya (Pe), Shah Alam (SA), Banting (Ba), Klang (Kl), Cheras (Ch), Batu Muda (BM), and Kuala Selangor (KS). Note: red colours are population densities > 1400 km−2, orange > 1000 km−2 and green > 200 km−2.

Figure 2.
(a) Four-day averaged PM2.5 concentration at a school drop-off zone smoothed with a five-point moving average with the standard deviation bound by the shaded area with local times on x-axis. (b) Student travel mode counts for 06:30/08:00 (orange) and 12:30/13:30 (blue) averaged for two schools.

Figure 3.
Annual cycle of hourly pollutant concentrations during 2019. (a) PM2.5 from the 8 sites and (b) NO2 from 7 sites (Kuala Selangor absent). They are presented in the order Putrajaya, Petaling Jaya, Shah Alam, Banting, Klang, Cheras, Batu Muda, and Kuala Selangor, with sites distinguished by alternate shading. (c) Smoothed temporal pattern of traffic congestion as a percentage in urban Kuala Lumpur https://www.tomtom.com/en_gb/traffic-index/kuala-lumpur-traffic/, accessed on 27 November 2021. (d) The weekly cycle of PM2.5 (dark shade) and NO2 (lighter orange shade) averaged over all the sites. (e) The diurnal cycle (as local times) averaged over the sites for PM2.5 and NO2.

Figure 4.
The concentrations of (a) PM2.5 and (b) NO2 at the sites for the hourly averages ending at 08:00 (orange), 11:00 (yellow), and 14:00 (blue). Note: The sites are coded Putrajaya (Pu), Petaling Jaya (Pe), Shah Alam (SA), Banting (Ba), Klang (Kl), Cheras (Ch), Batu Muda (BM), and Kuala Selangor (KS); the last for PM2.5 only. The boxes define Q1 and Q3, the line denotes the median, the X is the mean, and the whiskers run to the points that lie within 1.5 times the interquartile range above and below Q1 and Q3.

Figure 5.
Daily inhalation dose (µg) for (a) PM2.5 and (b) NO2 for exposure related to school. Note: hatched shading denotes afternoon exposure. (c) vehicular NO2 exposure as a function of population density for the site locations in Putrajaya (Pu), Petaling Jaya (Pe), Shah Alam (SA), Banting (Ba), Klang (Kl), Cheras (Ch), and Batu Muda (BM).


Table 1.
Pollutant concentrations (from hourly averages from 2019 data) adopted for various activities related to school at sites around Kuala Lumpur.
Table 1.
Pollutant concentrations (from hourly averages from 2019 data) adopted for various activities related to school at sites around Kuala Lumpur.
| Travel | Drop-Off | Break | Pick-Up | Travel | Class | |
|---|---|---|---|---|---|---|
| Time | ~07:30 | ~07:30 | 10:30–11:00 | ~13:30 | ~13:30 | 07:30–13:30 |
| Duration/min | 10–20 a | 5 | 30 | 10 | 10–20 a | 300 b |
| Time of pollution measurement | 07:00 to 08:00 | 07:00 to 08:00 | 10:00 to 11:00 | 13:00 to 14:00 | 13:00 to 14:00 | 07:00 to 14:00 |
| PM2.5/μg m−3 | 38 | 76 | 27 | 68 | 34 | 28 |
| NO2/ppb c | ||||||
| Putrajaya | 16 | 32 | 9 | 8 | 4 | 8 |
| Petaling Jaya | 41 | 81 | 30 | 37 | 19 | 26 |
| Shah Alam | 36 | 73 | 20 | 18 | 9 | 17 |
| Banting | 24 | 48 | 12 | 11 | 5 | 10 |
| Klang | 39 | 79 | 21 | 25 | 12 | 21 |
| Cheras | 33 | 66 | 20 | 17 | 9 | 17 |
| Batu Muda | 31 | 61 | 17 | 24 | 12 | 17 |
Notes: a, walk, 10 min; bike, 10 min; vehicle, 15 min estimated from MIROS Report No. 305 (MIROS, 2020). b, Children walking and on bicycles have less time travelling than those travelling by car, so their classroom times were adjusted by 25 min to bring total exposure to the same time length; c, occasional missing data for NO2 at 08:00 means that averages of 07:00 and 09:00 were taken for the travel-to and drop-off columns.
Publisher’s Note: MDPI stays neutral with regard to jurisdictional claims in published maps and institutional affiliations. |
© 2022 by the authors. Licensee MDPI, Basel, Switzerland. This article is an open access article distributed under the terms and conditions of the Creative Commons Attribution (CC BY) license (https://creativecommons.org/licenses/by/4.0/).
Share and Cite
MDPI and ACS Style
Ezani, E.; Brimblecombe, P. Exposure of Malaysian Children to Air Pollutants over the School Day. Urban Sci. 2022, 6, 4. https://0-doi-org.brum.beds.ac.uk/10.3390/urbansci6010004
AMA Style
Ezani E, Brimblecombe P. Exposure of Malaysian Children to Air Pollutants over the School Day. Urban Science. 2022; 6(1):4. https://0-doi-org.brum.beds.ac.uk/10.3390/urbansci6010004
Chicago/Turabian StyleEzani, Eliani, and Peter Brimblecombe. 2022. "Exposure of Malaysian Children to Air Pollutants over the School Day" Urban Science 6, no. 1: 4. https://0-doi-org.brum.beds.ac.uk/10.3390/urbansci6010004