Conceptual Design and Evaluation of Windshield Displays for Excavators


1
Division of Intelligent Future Technologies, Mälardalen University, Högskoleplan 1, 721 23 Västerås, Sweden
2
CrossControl AB, Varmvalsvägen 13, 721 30 Västerås, Sweden
*
Author to whom correspondence should be addressed.
Multimodal Technol. Interact. 2020, 4(4), 86; https://0-doi-org.brum.beds.ac.uk/10.3390/mti4040086
Submission received: 3 November 2020
/
Revised: 22 November 2020
/
Accepted: 25 November 2020
/
Published: 27 November 2020
Abstract
:This paper investigates the possible visualization using transparent displays, which could be placed on the excavator’s windshield. This way, the information could be presented closer to operators’ line of sight, without fully obstructing their view. Therefore, excavator operators could acquire the supportive information provided by the machine without diverting their attention from operational areas. To ensure that there is a match between the supportive information and operators’ contextual needs, we conducted four different activities as parts of our design process. Firstly, we looked at four relevant safety guidelines to determine which information is essential to perform safe operations. Secondly, we reviewed all commercially available technologies to discover their suitability in the excavator context. Thirdly, we conducted a design workshop to generate ideas on how the essential information should look like and behave based on the performed operation and the chosen available technology. Fourthly, we interviewed seven excavator operators to test their understanding and obtain their feedback on the proposed visualization concepts. The results indicated that four out of six visualization concepts that we proposed could be understood easily by the operators and we also revised them to better suit the operators’ way of thinking. All the operators also positively perceived this approach, since all of them included at least three visualization concepts to be presented on the windshield.
1. Introduction
Excavators are versatile machines that can be used for various purposes, for example, lifting, drilling, demolishing, and cutting, depending on the attachment being used. Due to their versatility, excavators are not only used in the construction sector, but also in other sectors, such as mining and forestry. Operating an excavator is a cognitively demanding task [1], as operators are required to control the machine, observe the surroundings, and possibly cooperate with nearby ground workers or machines. Kazan and Usmen [2] compared the accident data that involved four types of heavy machinery in the U.S. and they found that excavators were involved in 24.8% of 1200 reported accidents, where half of those excavator-related accidents led to fatalities. The operator’s misjudgment during hazardous situations was also cited as the most common cause of those accidents.
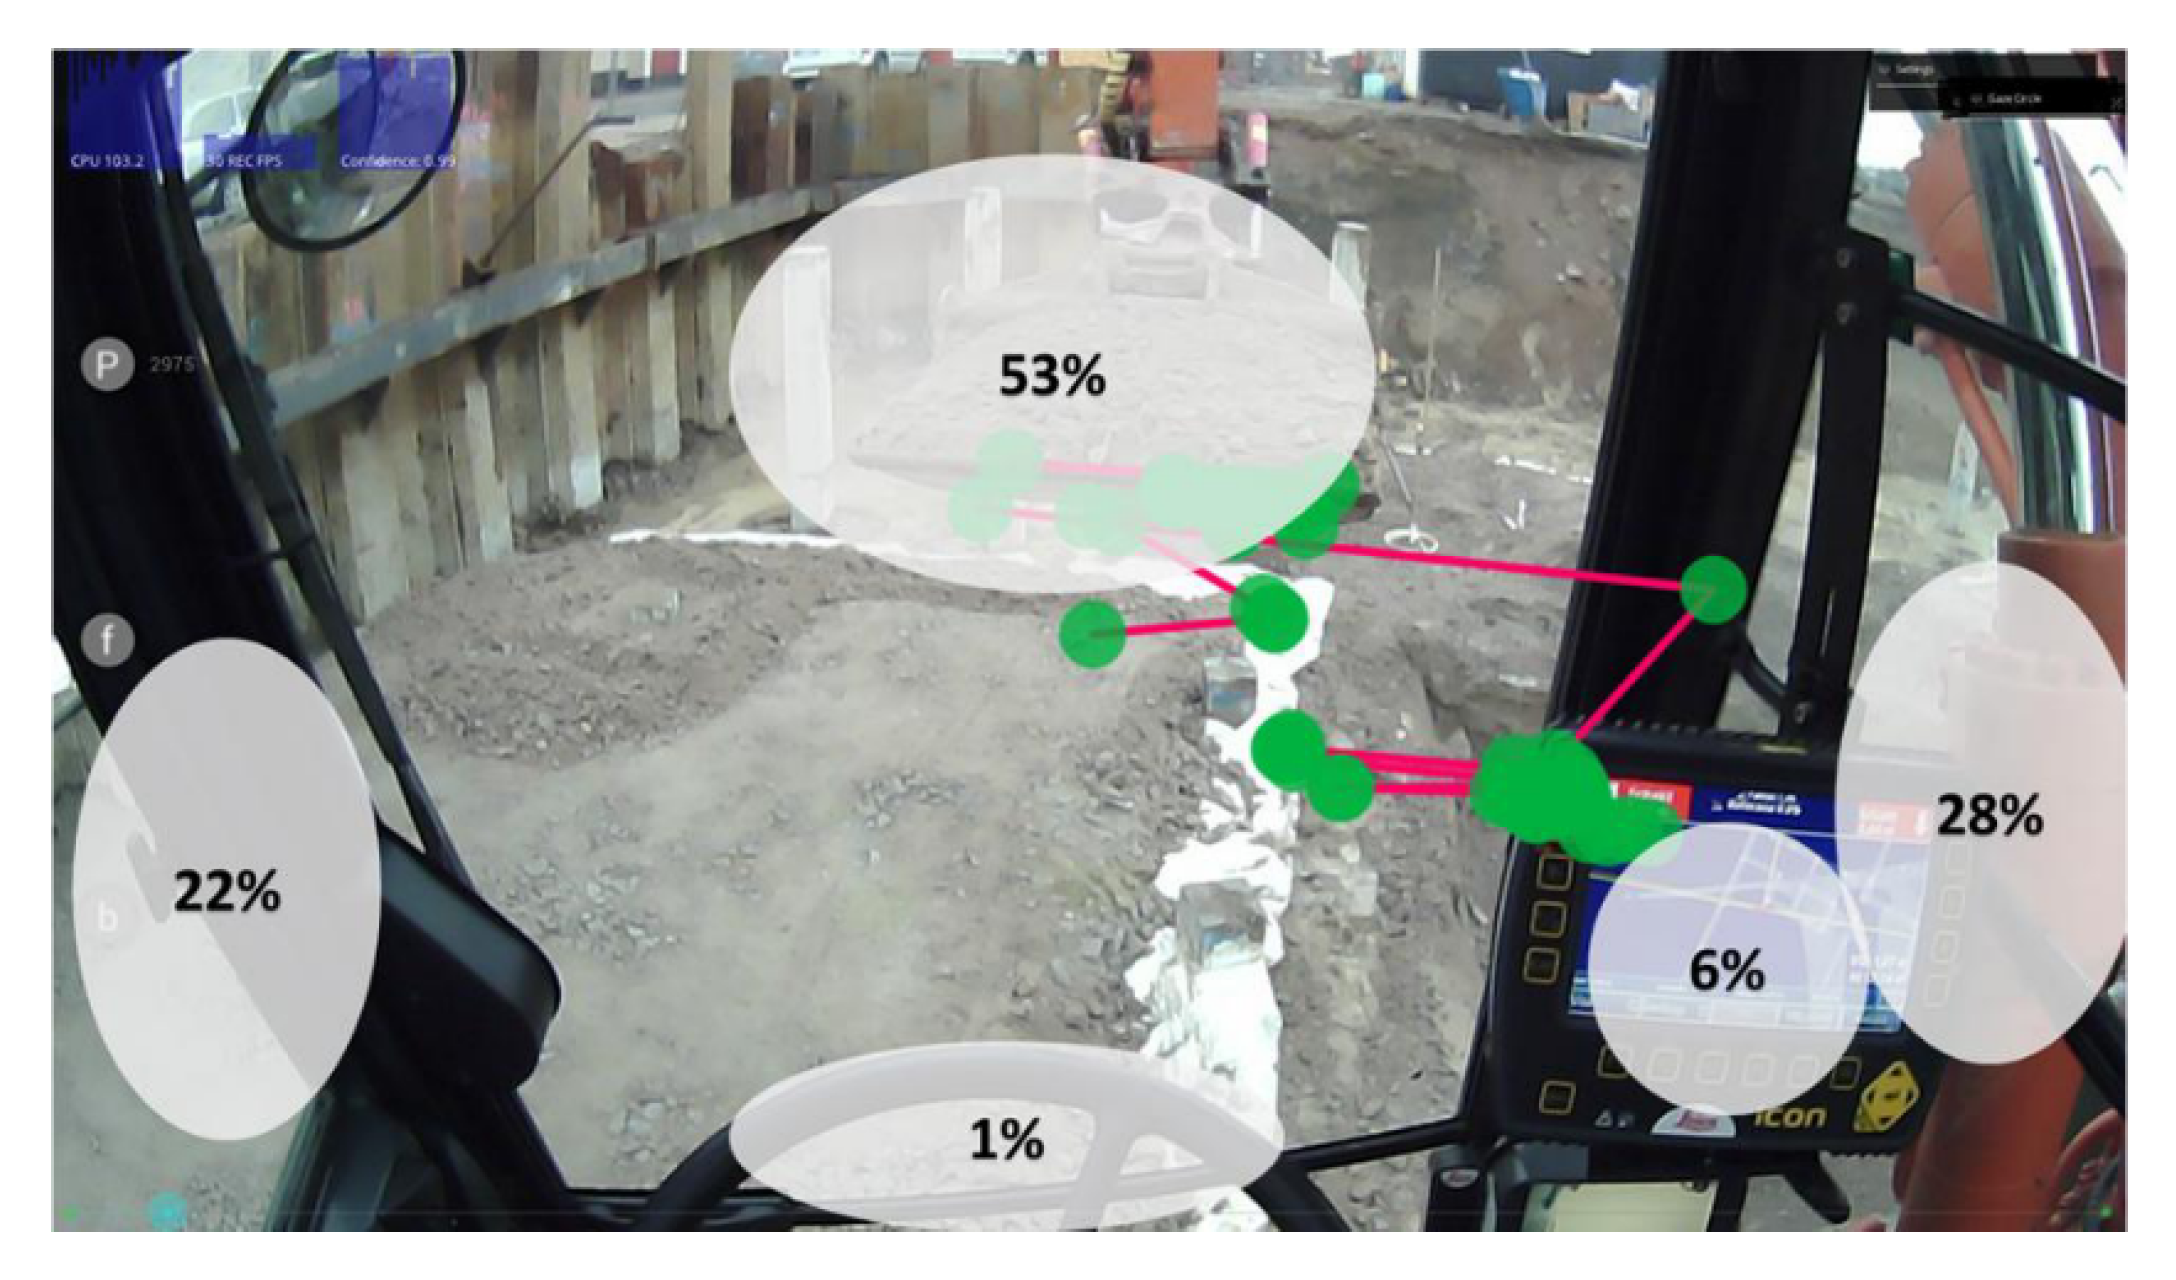
Modern excavators are increasingly equipped with information systems that provide supportive information to operators [3]. The supportive information is mainly presented using head-down displays, which are installed inside the cabin [4]. However, our prior research suggested that operators generally pay little attention to the presented information [5], as the head-down display is usually placed far from operational areas to avoid obstructing operators’ view (see Figure 1 for an example). This situation is not desirable, since operators are not fully aware of the information shown on the head-down display and they may not be able to act accordingly in hazardous situations. In addition, the benefit of having the supportive information is diminished if operators do not utilize it.
In this paper, we hypothesize that it would be beneficial for operators to have the supportive information presented near their line of sight, for example, on the windshield as they spend significant amount of time looking through it [5]. Therefore, operators could acquire the supportive information without diverting their attention from operational areas. The idea of presenting information on the windshield is not new at all, as it could be traced back to fighter planes in the 1970s [6], and since then the idea has been progressively adopted in the automotive domain [7]. In the heavy machinery domain, this approach led to mixed findings, where some studies suggested improved performance and some others suggested insignificant differences (see Sitompul and Wallmyr [8] for the review). Although there could be various reasons that influenced the participants’ overall performance, we found from the review that operators were rarely consulted when designing the proposed visualization systems, since their involvement was limited to evaluating the visualization systems that have been developed. Therefore, it is still unclear to what extent that there was a match between the presented information and the operator’s contextual needs in the visualization systems that have been proposed so far. This aspect is relevant to be addressed, since the match between the presented information and the performed task possibly reduces users’ cognitive workload and improves their performance [9,10], since less cognitive resources are spent to process the information and perform the required task.
In this paper, we focused on investigating how to design the information visualization on the excavator’s windshield that fits to operators’ contextual needs. In other words, we need to determine which information is needed by operators to operate the machine safely, when is the right time to present the information, where the information should be presented, and how the information should be visualized [11,12]. This approach would possibly prevent distracting and obstructing operators with less suitable information. To address these requirements, we have defined four research questions in this study:
- RQ1.
- What kind of information do operators need to know in order to perform safe operations?
- RQ2.
- What commercially available technologies can be used to present information near line of sight and what are their limitations?
- RQ3.
- How should the supportive information be visualized based on the chosen technology and the currently performed operation?
- RQ4.
- How do excavator operators perceive the proposed visualization approach?
2. Related Work
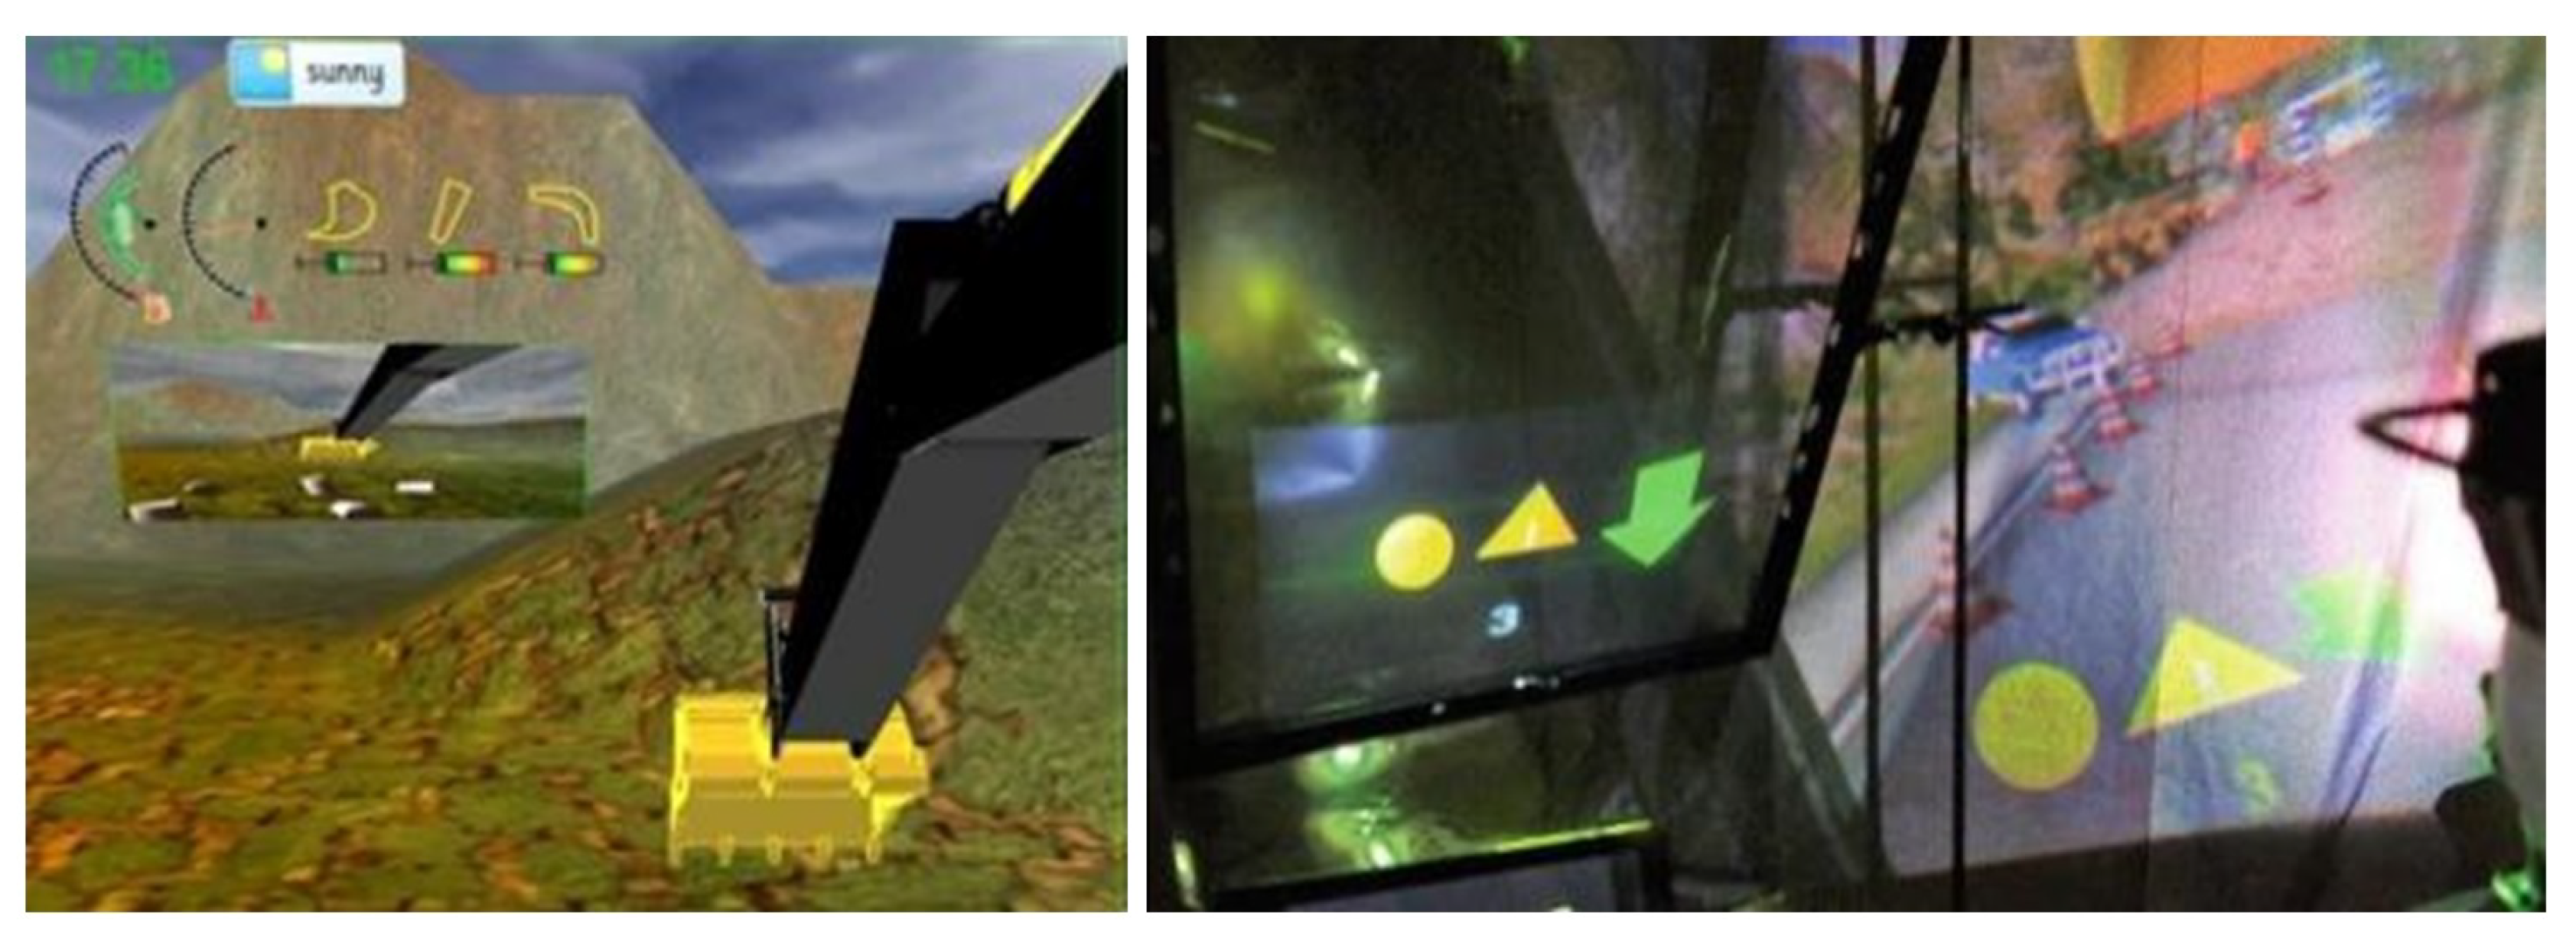
Considering the limitation of head-down displays, many studies have investigated new ways for visualizing information in heavy machinery, including excavators. The proposed approaches varied from one study to another, but we could see that presenting information on the windshield and projecting information directly on the object of interest as the most common approaches (see Sitompul and Wallmyr [8] for the review). Specifically for excavators, Akyeampong et al. [13] found that presenting the information on the windshield reduced mental workload compared to when the information was displayed in lower locations (see the left image in Figure 2). Based on our prior study [4], we also found that the information acquisition rate was higher when the information was projected directly on the windshield compared to when a head-down display was used (see the right image in Figure 2).
Similar to the two studies mentioned above, most of the studies in the heavy machinery domain were done in simulated environments, thus it is still unclear to what extent the proposed approaches would work in real machines and real operations. Nevertheless, there were six studies that built the physical visualization systems, which could be deployed in real machines. In the context of mobile cranes, Fang et al. [14] investigated the use of a bigger head-down display, where the operator could see multiple views around the machine and the supportive information. In the context of tractors, Fernandez et al. [15] explored the use of a head-mounted display that showed navigational information and which areas that have been treated by the tractor. Still in the context of tractors, Palonen et al. [16] also used a head-mounted display, but they probed on how to visualize the environment that was occluded by the machine’s part, thus operators could observe blind spots around the machine. Finally, there were three studies that explored the cabin’s windshield as a place to visualize the information. In the context of snowplow trucks, Rakauskas et al. [17] used a projection head-up display for indicating which areas that should be cleared from snow. Englund et al. [18] also used a projection head-up display to present bucking-related information on the forest harvester’s windshield. In the context of off-shore cranes, Kvalberg [19] considered using a transparent display, which is the display that emits its own light and becomes transparent when the light is off, for presenting the lifting load of an off-shore crane.
Only half of the aforementioned studies reported some kind of user evaluations, as the remaining studies were limited to technical evaluations only. Fang et al. [14] found that the operators required less time to complete the given task, had more correct responses, and produced higher level of situation awareness when using the proposed system, compared to when no support was provided. Yet, the operators still commented that the bigger head-down display was still considered too small and the presence of the display could also obstruct their view. Rakauskas et al. [17] found that the operators drove the snowplow truck more slowly, controlled the steer more frequently, and had higher mental workload, while using the projection head-up display. On the contrary, Englund et al. [18] found that there was no significant difference on operators’ performance when they were using the projection head-up display or the head-down display. There could be many reasons that influenced these different results, such as prior experience, which information that was presented, how the information was visualized, trust on new visualization systems, etc. However, based on the review [8], we found that the proposed visualization systems were mainly designed by the researchers and operators were rarely consulted. In the studies that involved real operators, their involvement was limited to the evaluation of physical visualization systems that have been developed. Therefore, it is still unclear to what extent the presented information matched the operators’ contextual needs. Taking this situation into account, there is a need for a study that proposes visualization systems based on the match between the presented information and operators’ contextual needs [9].
3. Methods
To address the research questions mentioned in Section 1, four different activities were conducted, as described in the following subsections.
3.1. Using Safety Guidelines to Find which Information Is Important for Safe Operations
To find the answer for “RQ1—What kind of information do operators need to know in order to perform safe operations?”, we used four safety guidelines [20,21,22,23] as the source of information on how to operate excavators safely. This information could also be collected by asking operators or domain experts. However, this approach may not be effective, since operators may have different operational preferences or requirements. On the other hand, the safety guidelines describe things that are applicable to all operators, regardless of different preferences. The safety guidelines do not only describe safety requirements for operators, but also for supervisors, maintenance workers, or ground workers, as well as safety requirements for before, during, and after the operation. However, in this study, we specifically focused on what excavator operators should know or do during the operation.
After reviewing the safety guidelines, we found that the requirements are mainly provided to prevent two kinds of incidents: collision and loss of balance. To prevent any collision, operators must know the presence of nearby ground workers, existing structures, or other machines that may exist, as well as be fully aware on what the excavator is about to do. To avoid the excavator from collapsing due to the loss of balance, which could occur due to various factors, such as unstable ground, steep ground, or lifting an excessive load, operators must know the current state of the machine and never operate the machine beyond the permissible conditions.
3.2. Reviewing Commercially Available Technologies for Presenting Information Near Line of Sight
To address “RQ2—What commercially available technologies can be used to present information near line of sight and what are their limitations?”, we reviewed the available technologies to discover their advantages and disadvantages in the heavy machinery context. Technologies play a vital role here, since they highly influence how the information could be formed and visualized to the user. We also used the lessons learned from prior studies in Section 2 that deployed the physical visualization systems in real machines and tested them with operators as an additional input on what would and would not work in practice.
After conducting the review, we found that all commercially available technologies have some advantages and disadvantages. Using head-mounted displays allows operators to see the supportive information exactly within their line of sight. However, this option could be ergonomically uncomfortable for operators, since they are also required to wear protective helmets [23]. Although newer head-mounted displays come with improved ergonomics, they are still uncomfortable to be worn for long hours [24]. Both projection head-up displays and transparent displays are two alternatives that could be considered, as operators could see the supportive information without wearing additional equipment. The main drawback of projection head-up displays is the projected information may deteriorate in bright environments [25]. Rakauskas et al. [17] had to conduct their experiment in the night to specifically avoid this issue. Englund et al. [18] carried out their experiment in the daytime and the operators commented that the contrast between the projected image and the environment was low, which made the presented information difficult to see. Unlike projection head-up displays, transparent displays are strong against external light, since they emit their own light instead of using reflection [26]. However, the information that could be visualized is fixed to what has been specified when the display is manufactured and the design cannot be modified later. Furthermore, current transparent displays are also limited in terms of colors, since only green and yellow are currently available. Here, we did not consider bigger head-down displays, like what Fang et al. [14] used, since the physical presence of the display could obstruct operators’ view.
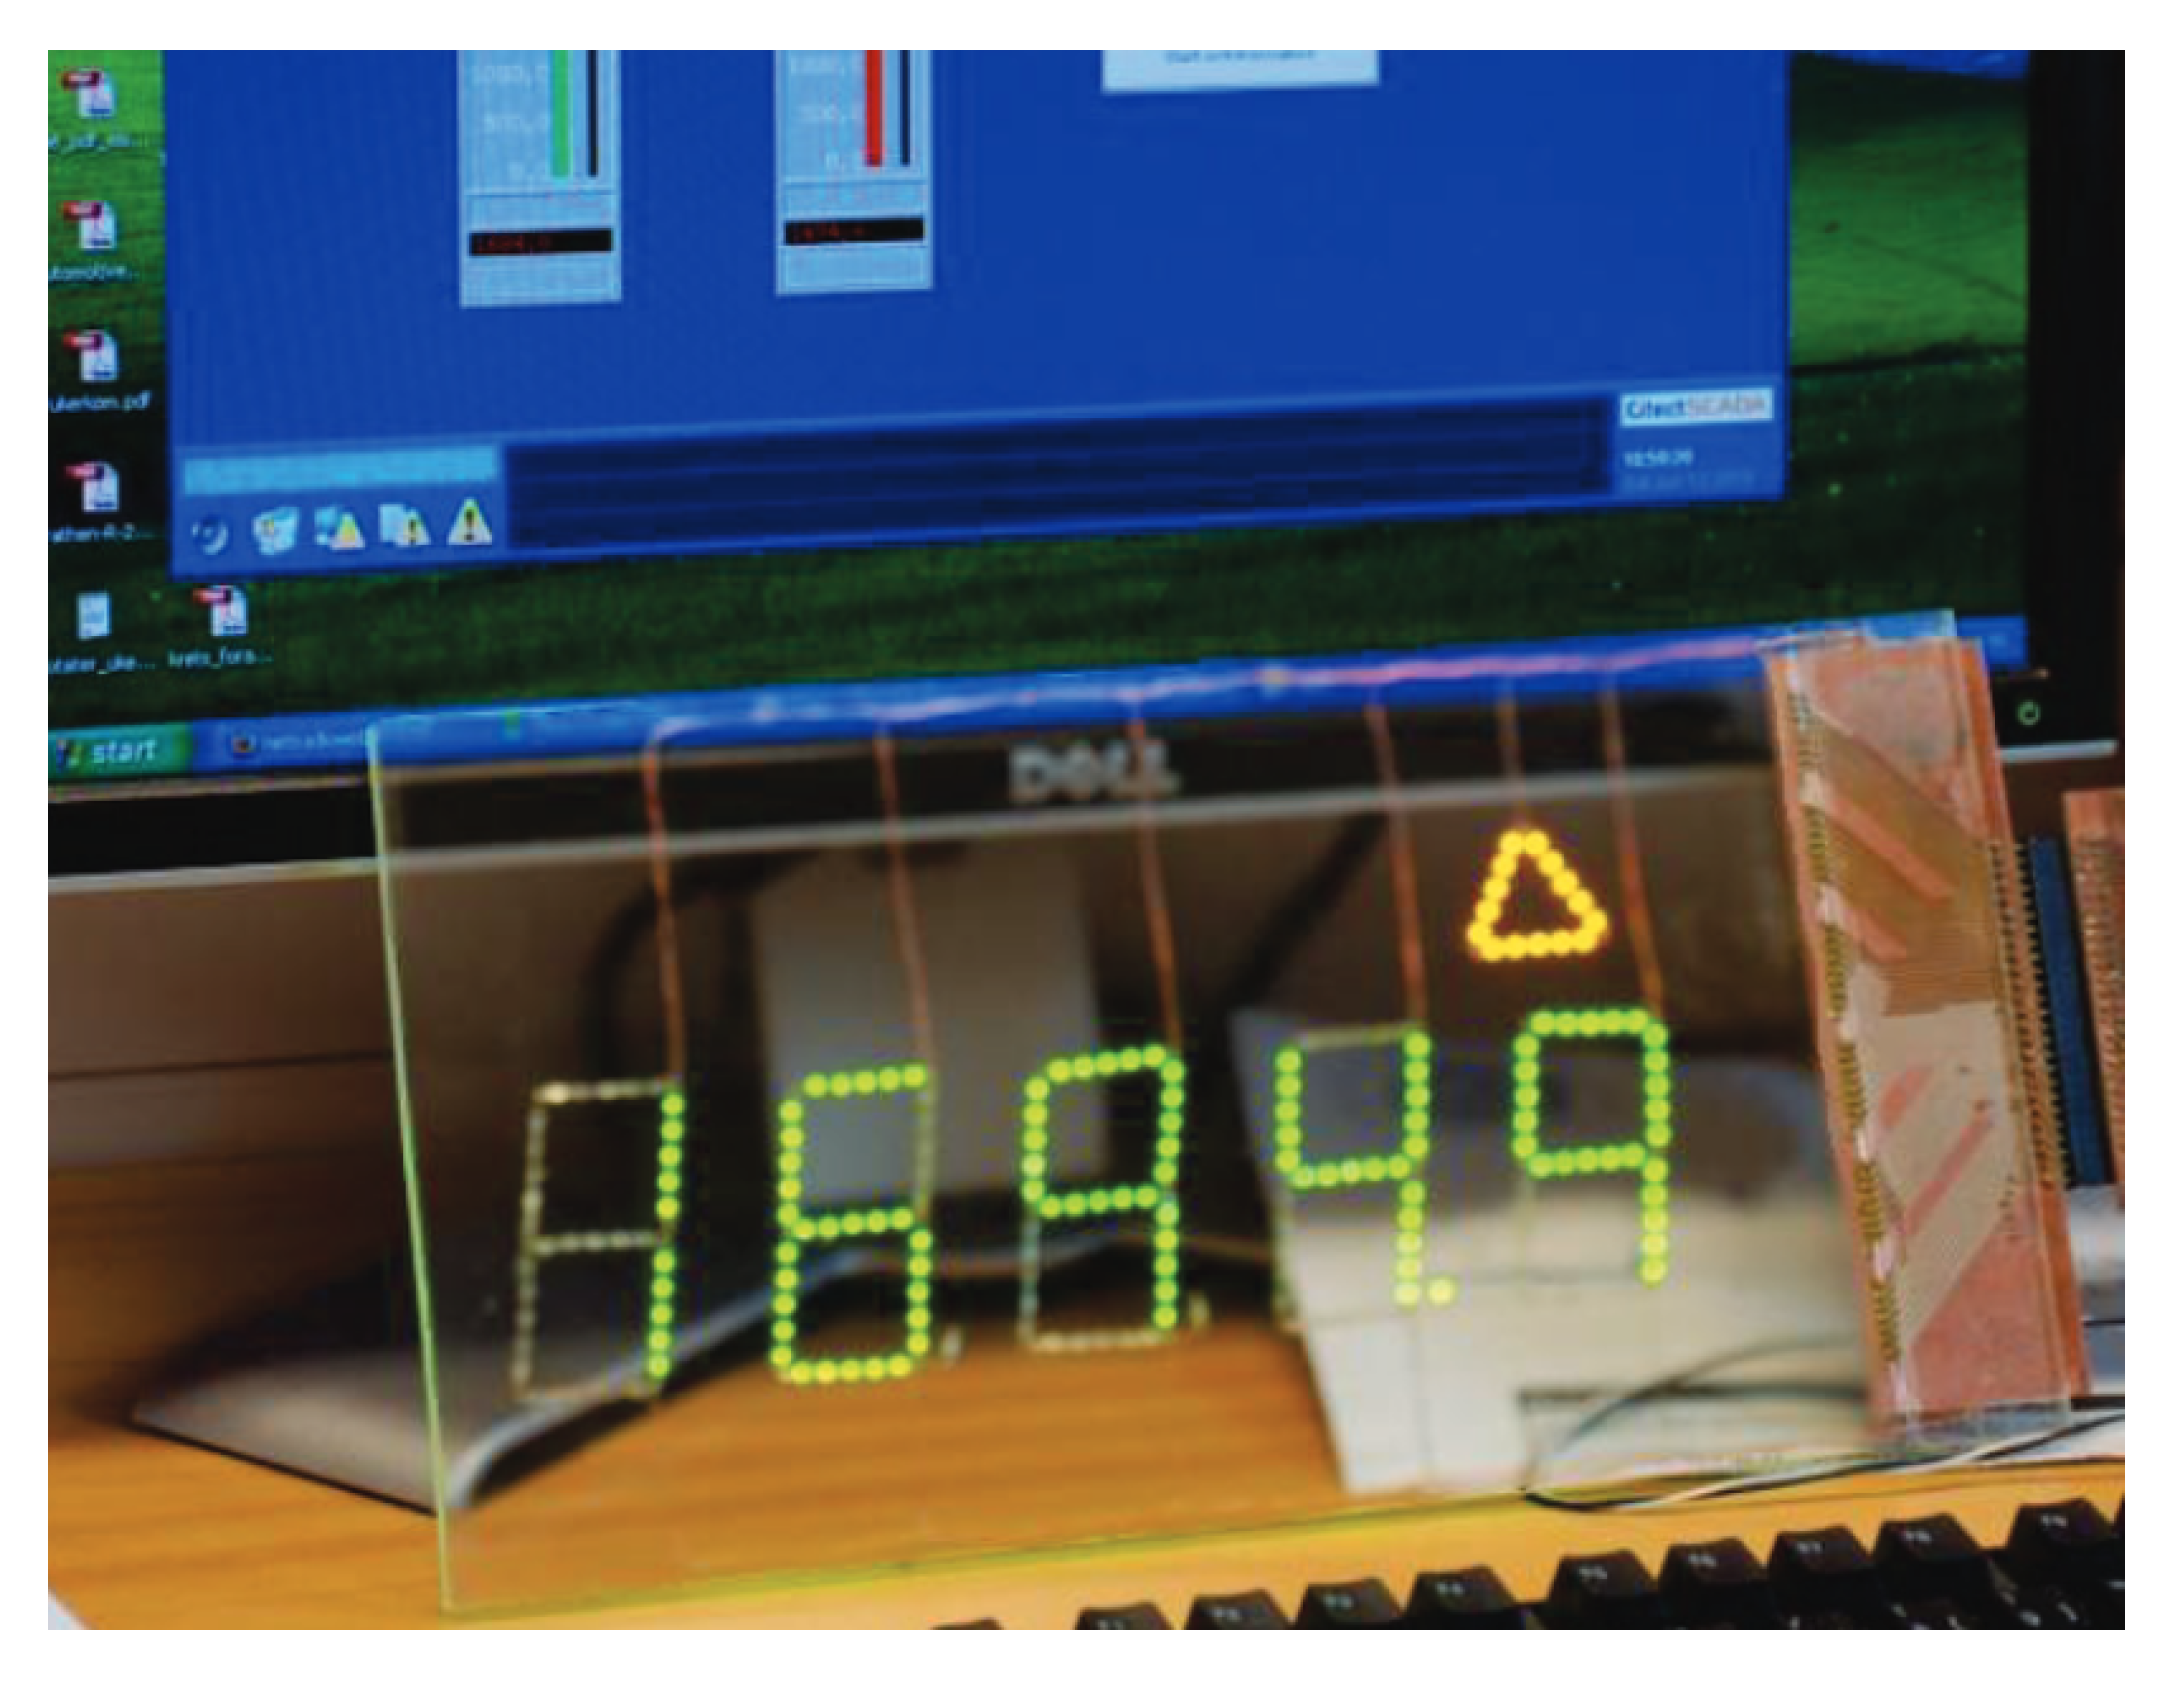
Taking into account both advantages and disadvantages of all commercially available technologies and the lessons learned from prior studies, we were interested to further explore how we could present supportive information to excavator operators using transparent displays. In addition, the use of transparent displays in the heavy machinery domain has also not been explored much in the literature, since what Kvalberg [19] has done was limited to the technical evaluation (see Figure 3). This choice also served as the boundary for our design space, since the type of displays highly influence how the information could be formed and visualized.
3.3. Conducting a Design Workshop to Generate Visualization Ideas
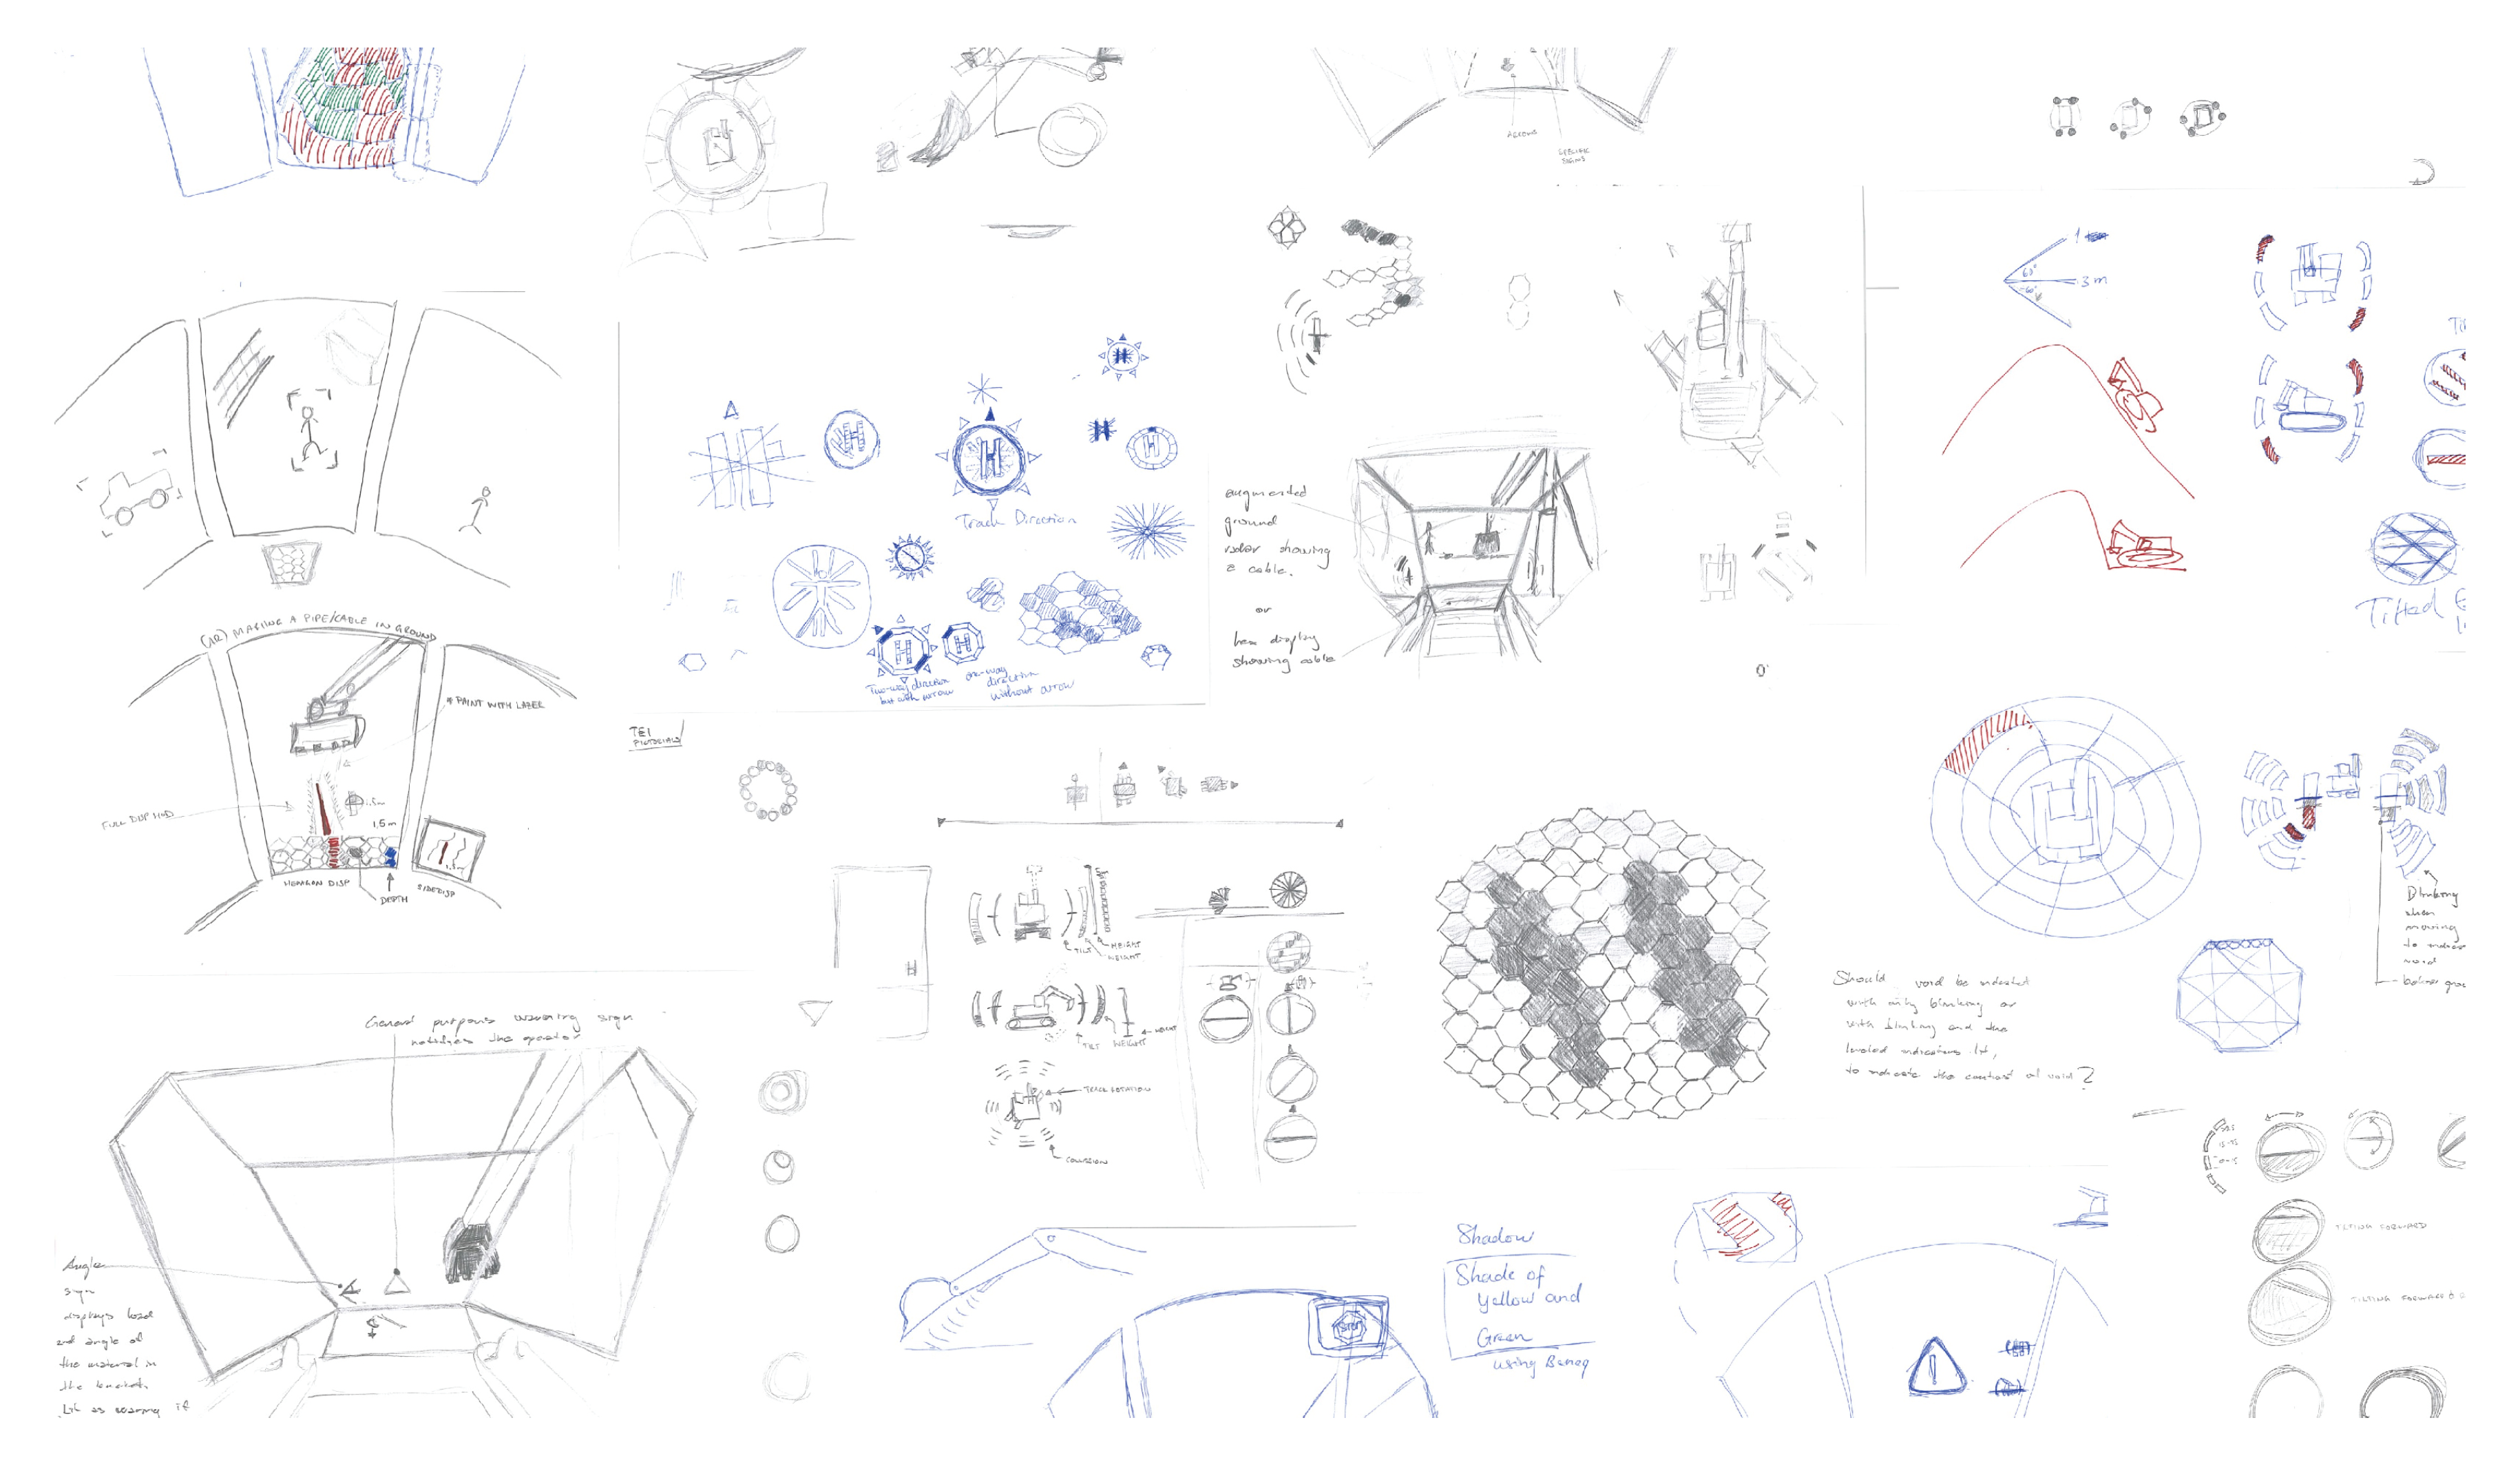
Regarding “RQ3—How should the supportive information be visualized based on the chosen technology and the currently performed operation?”, we approached this question through a design workshop, where three of us generated visualization ideas. We set the boundary for the design space based on the findings from the safety guidelines, thus we did not generate design visualization ideas beyond preventing collision and loss of balance. Through sketching, we explored a plethora of visualization ideas that could help excavator operators avoiding collisions with surrounding objects and maintaining the balance of the machine (see Figure 4). At the same time, we also scrutinized the sketches based on their suitability for representing the performed situation. As the chosen technology, transparent displays also bring some constraints on how the information can be designed and visualized. Transparent displays have a limited number of segments, where each segment can be either illuminated or not, and the illuminated segments should visually represent something. The segments in transparent displays can take different shapes, but their positions cannot be changed once the display has been manufactured [26]. We then selected some of the visualization concepts and refined their visual appearances and behaviors based on these design constraints.
As the result of the design workshop, we came up with visualization concepts for proximity warning, balance-related information, undercarriage direction, relative load capacity, and warning sign that suit both appearance and capability of transparent displays. Note that the different kinds of information mentioned above could be made available using existing technologies in modern excavators. The only exception is the proximity warning, since it is, to some extent, still under research and there are various ways that have been proposed so far (see Jo et al. [3] for the review). In this study, we assumed that the proximity information could be somehow made available using any kind of sensors, and thus we focused on how the information should be visualized based on transparent displays. As mentioned in Section 2, current transparent displays are still limited to green or yellow, thus we based our concepts with yellow color as this color is more appropriate to represent a warning. The description for each visualization concept is presented below.
3.3.1. Proximity Warning
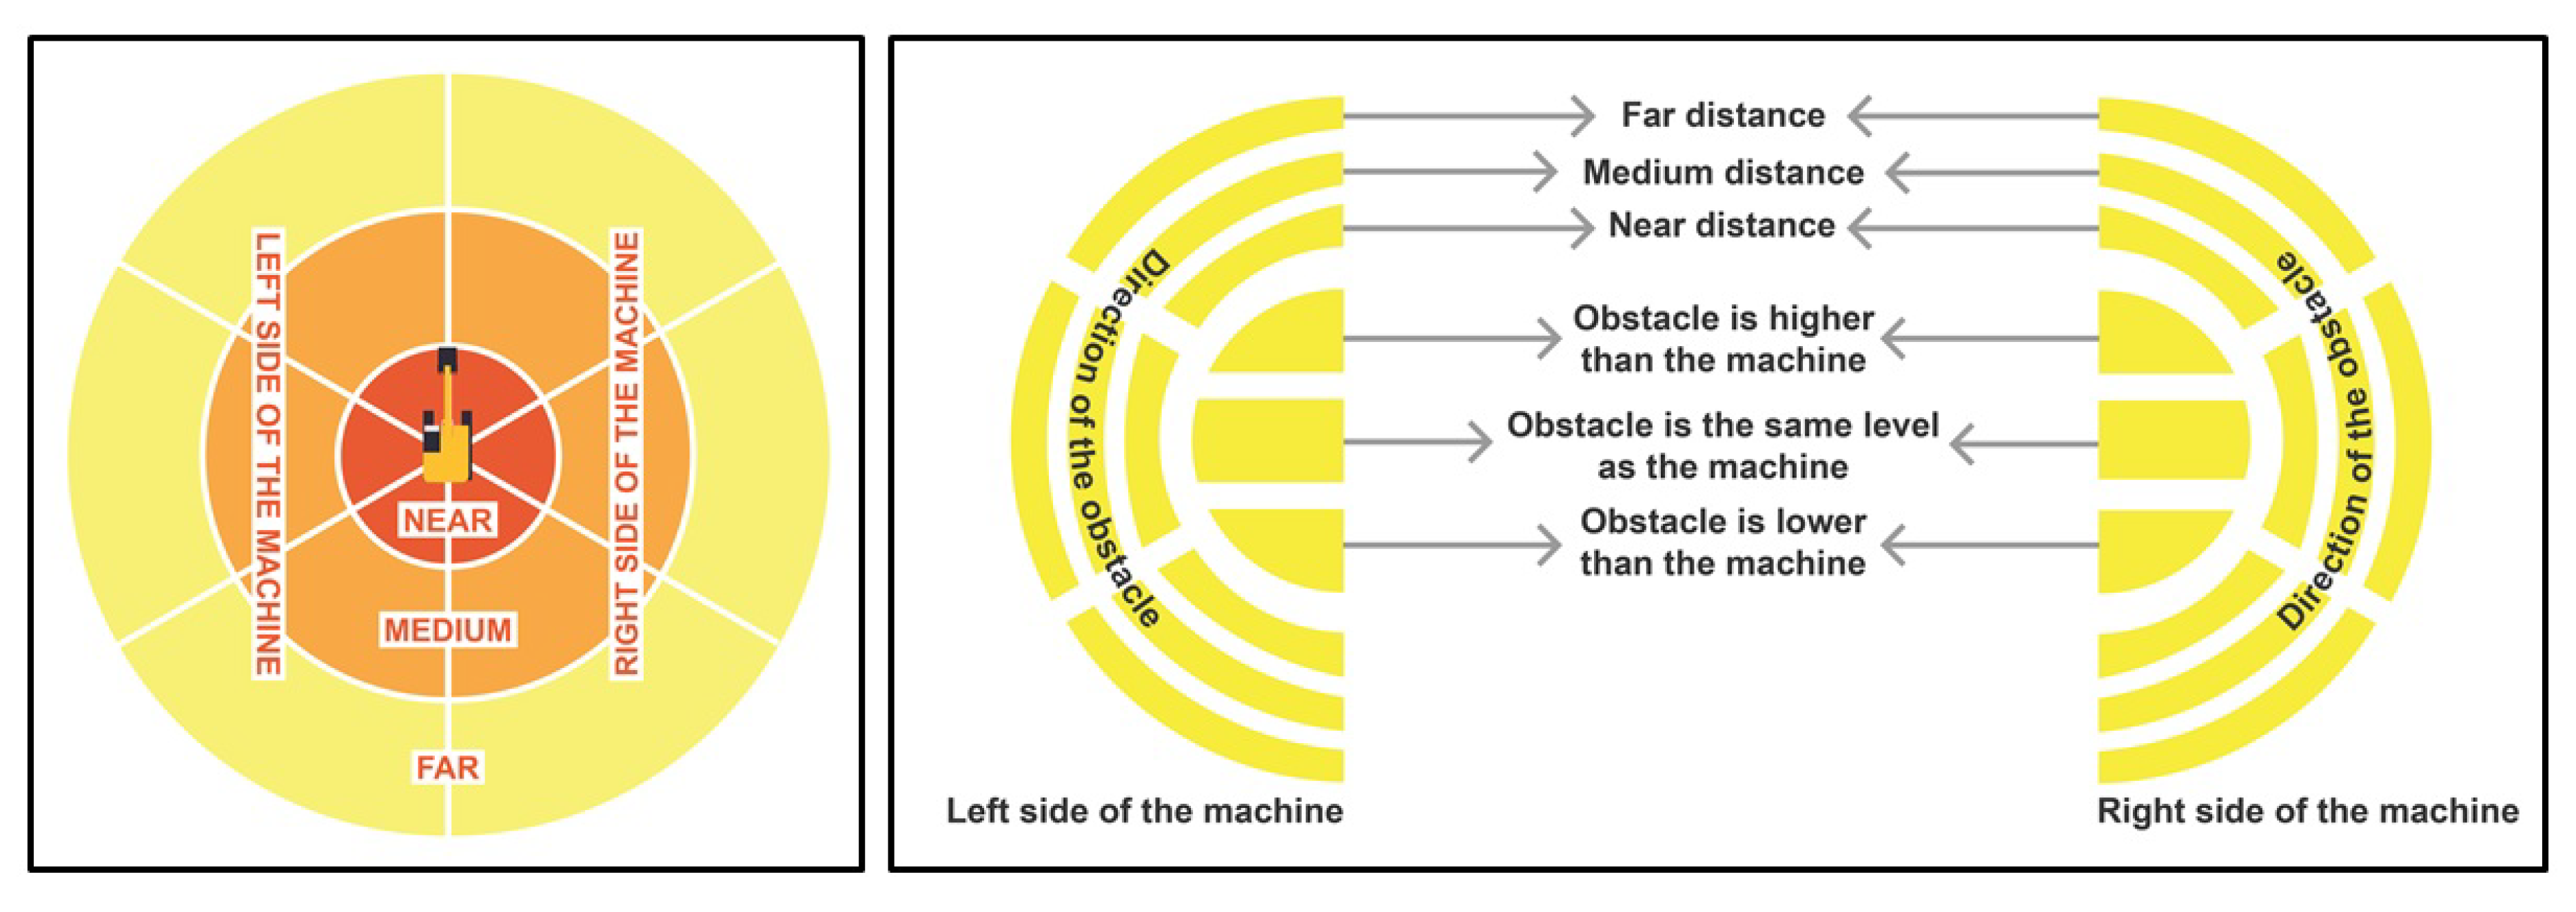
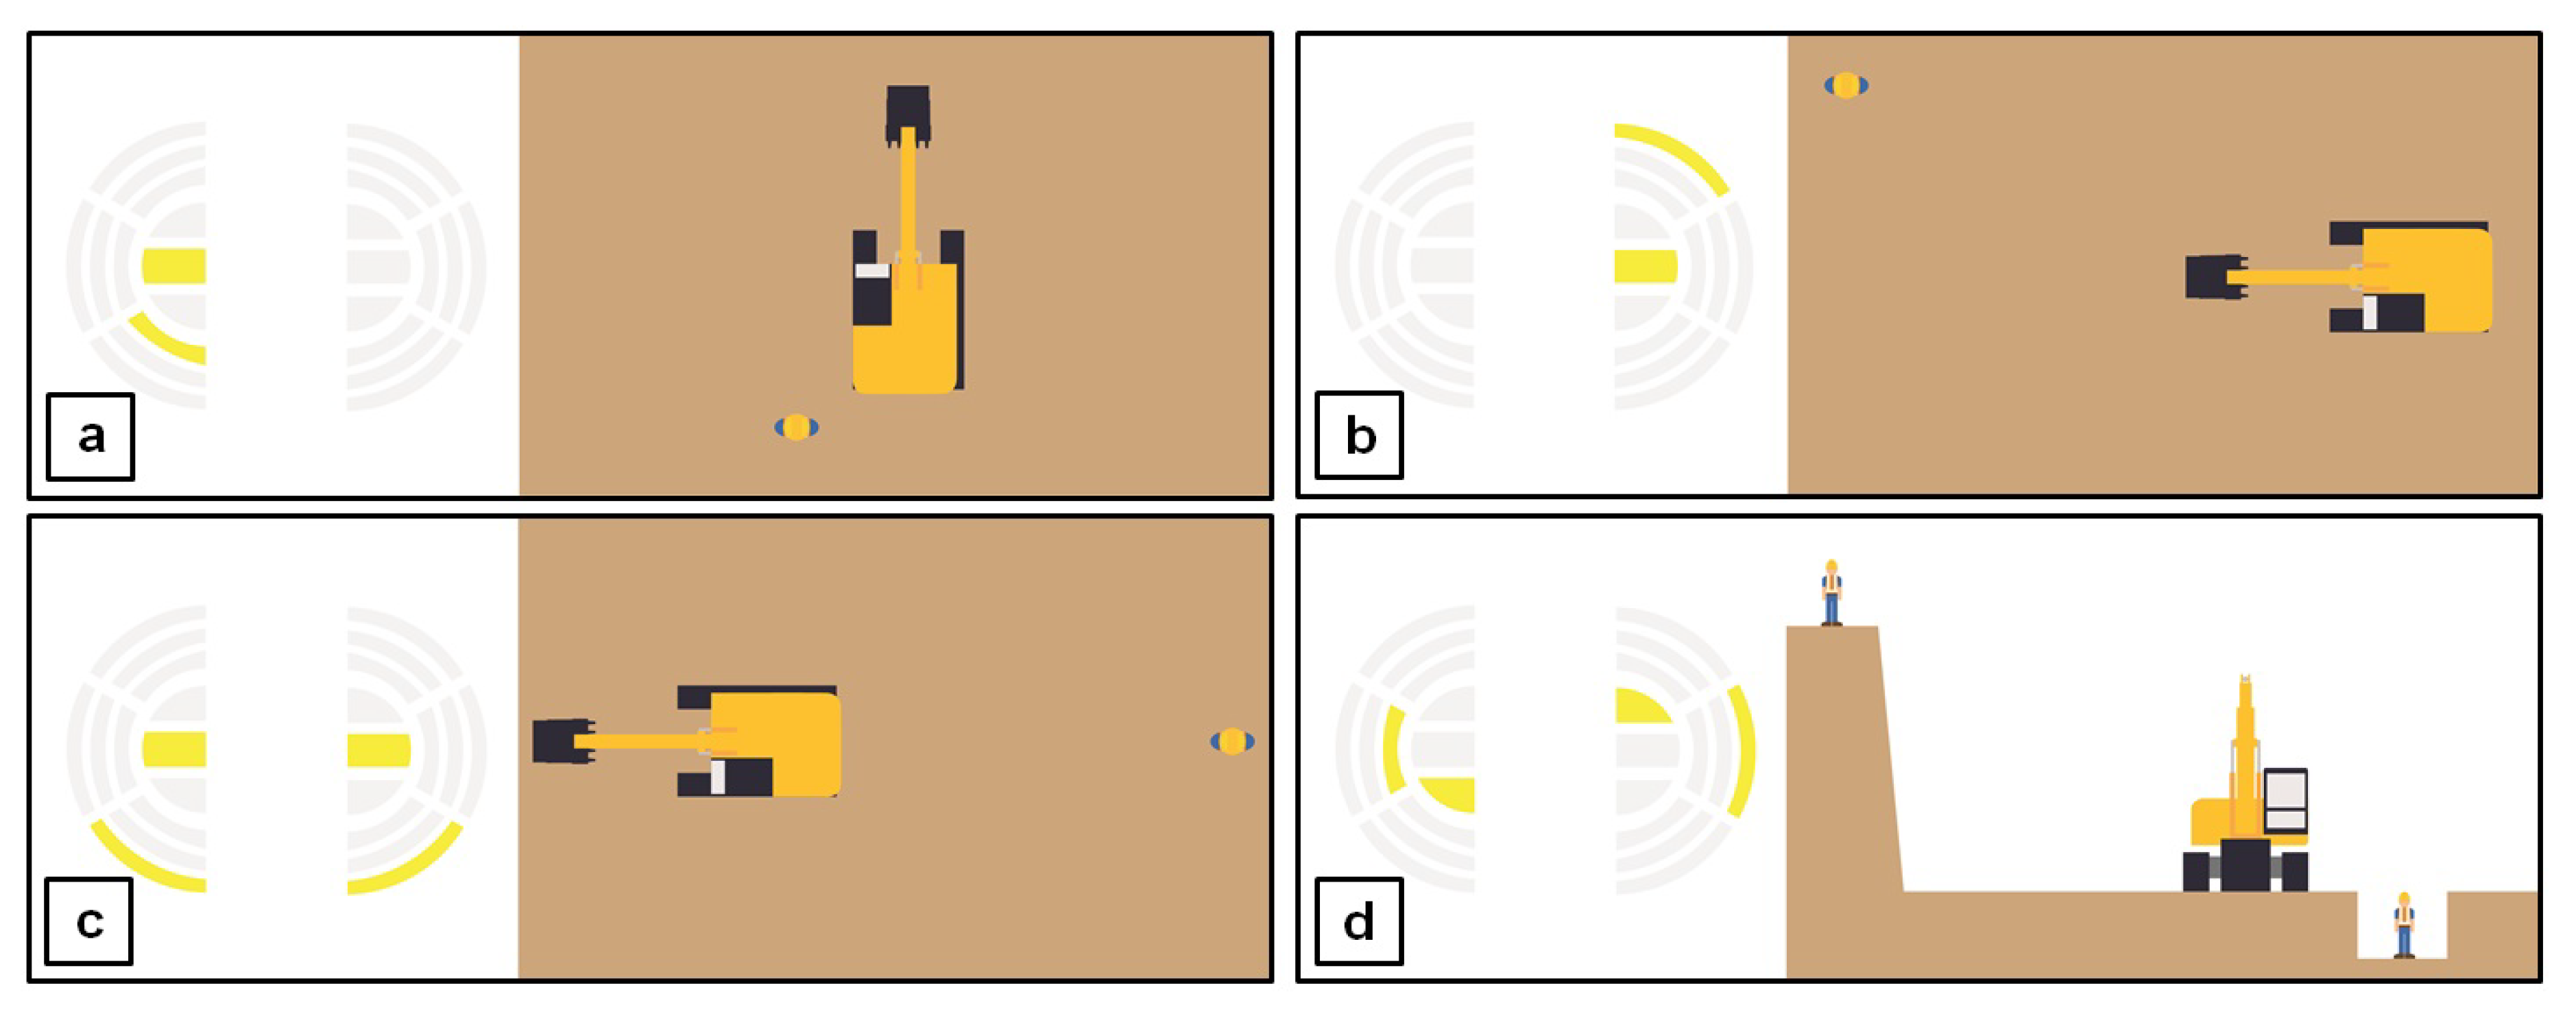
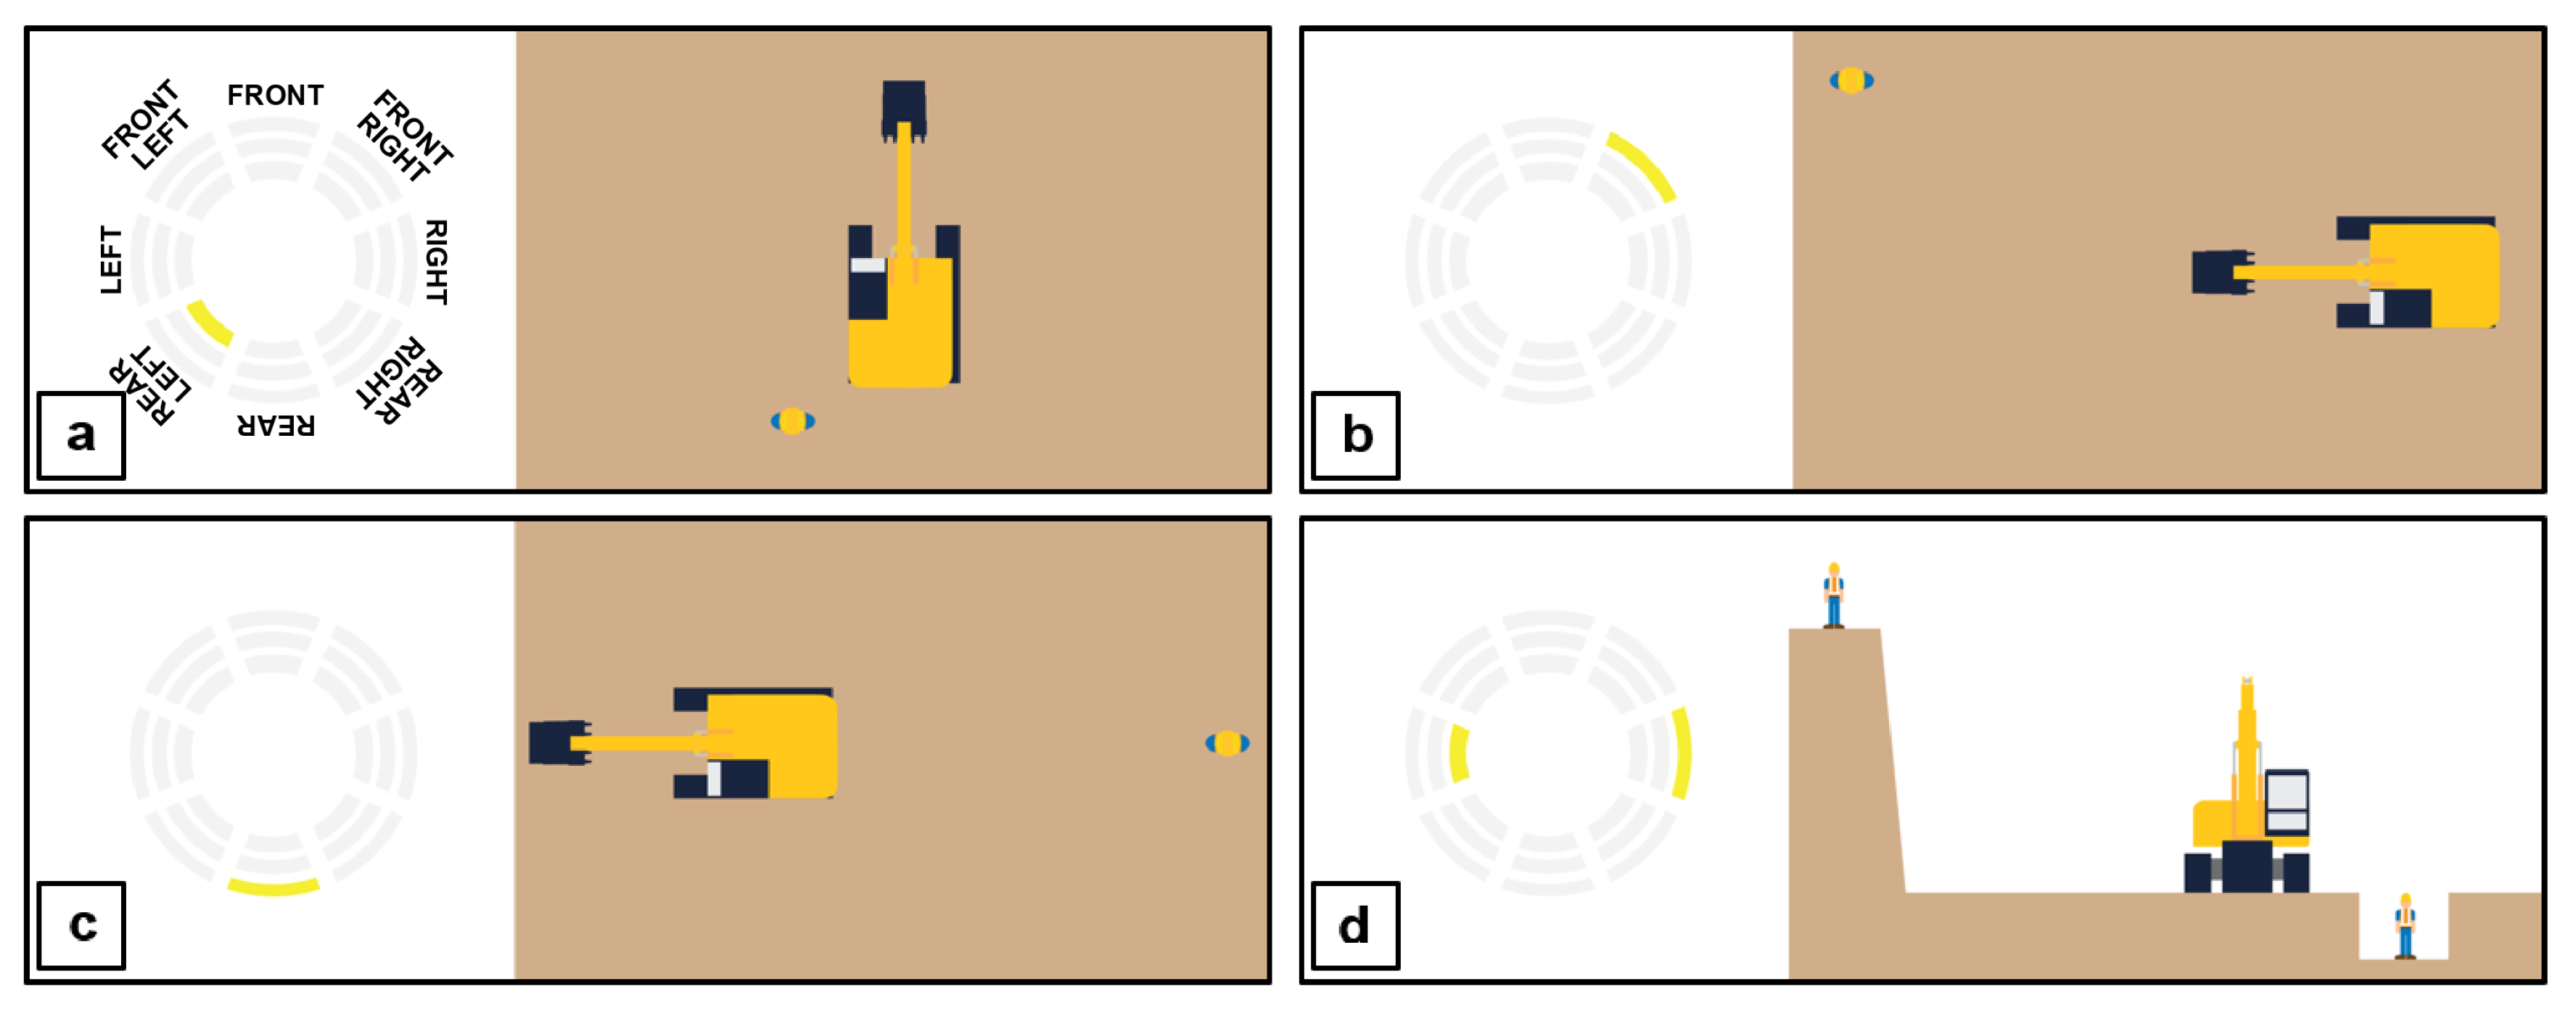
The proximity warning concept was made based on three circles that indicate three different distances from the excavator to the obstacle (see the left image in Figure 5). In this concept, there are two groups of segments that each represents the presence of obstacle(s) on the left side or the right side of the machine (see the right image in Figure 5). The visualization in this concept was always based on to the direction where the cabin is facing. The left segments will be turned on when there is an obstacle on the left side of the machine, and vice versa. The curved segments show the position of the obstacle and its proximity to the machine. The horizontal segments in the middle indicate the altitude of the obstacle with respect to the excavator. The images in Figure 6 illustrate some scenarios that use the proximity warning concept. Note that here we used humans as the obstacle for simplification purposes. In practice, the obstacle can also be structures, such as buildings or overhead power lines.
3.3.2. Balance-Related Information
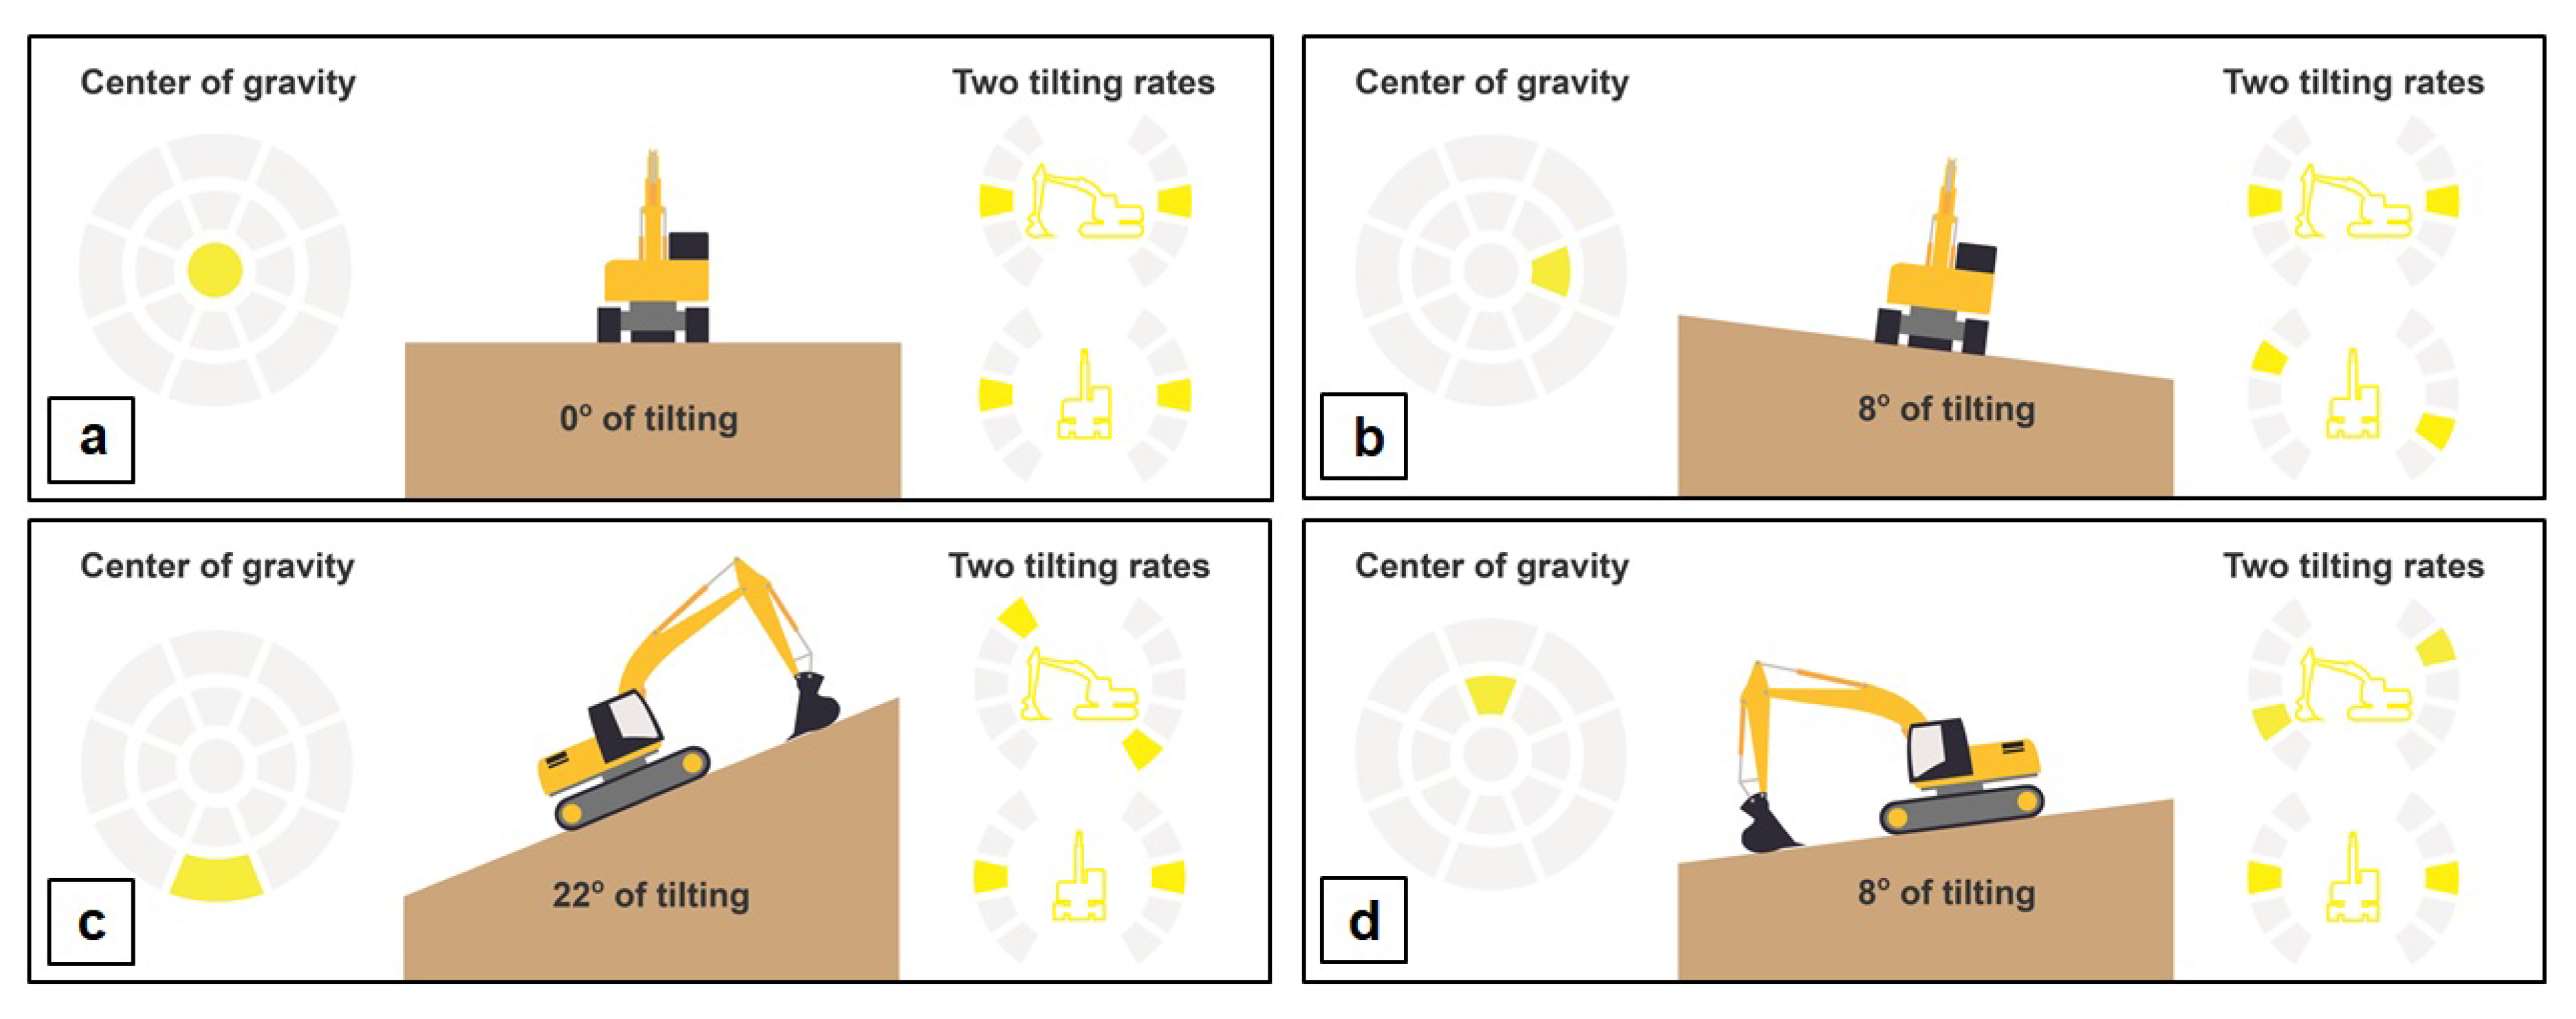
From the safety guidelines, we learned that the center of gravity of an excavator constantly changes depending on the steepness of the ground and also the performed operation. To maintain the machine’s balance, operators should ensure that the center of gravity does not go too far from the center of the machine, as the risk of tipping over is higher. We have created two concepts that indicate the balance of the excavator: ”center of gravity” and ”two tilting rates”. These names also imply what kind of information being visualized.
The first concept is called ”center of gravity”, since it shows the current position of the center of gravity with respect to the center of the machine from the top view. When the center of gravity is near the center of the machine (the circle in the center), it implies that the machine is in a very stable position (see the left image in Figure 7a). Each segment in this concept indicates the current position of the center of gravity. The left images in Figure 7b–d illustrate how this concept is visualized in some scenarios. Note that here we used the ground’s steepness as the influencing factor to simplify the illustrations. In practice, the operation being performed also influences the excavator’s balance.
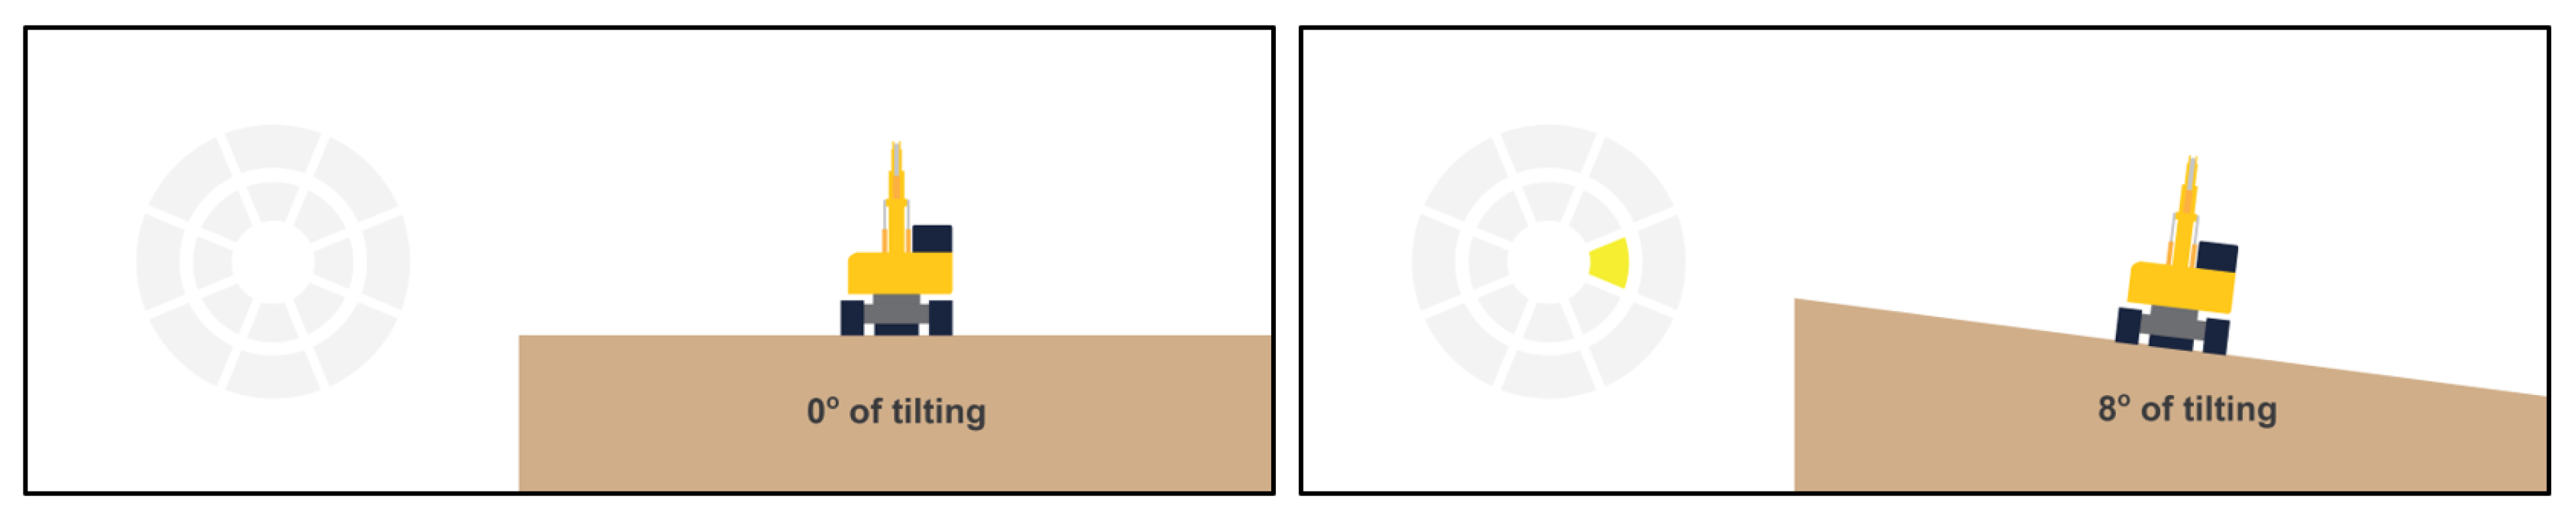
The second concept is called ”two tilting rates”, since it shows the tilting rate of the machine from two different angles simultaneously: side view (top ones in two tilting rates) and rear view (bottom ones in two tilting rates). The reason behind this was the fact that excavators can be tilted forward-backward (side view) and left-right (rear view). The acceptable tilting rate varies based on the excavator manufacturer. Here, we used 25 as the acceptable limit for illustration purposes. In this concept, we divided the tilting rate into five levels, which range from −25 to 25, and each segment represents one of these levels. One segment on both sides are illuminated together to visualize the tilt. For example, when the excavator is tilted to right side (see the right image in Figure 7b), the segments that indicate the rear view are illuminated to visualize the tilt, while the segments that indicate the side view remain stable. The opposite applies when the excavator is tilted backward (Figure 7c) or forward (Figure 7d), where the segments that indicate the side view are illuminated to visualize the tilt, while the segments that indicate the rear view remain stable.
3.3.3. Undercarriage Direction
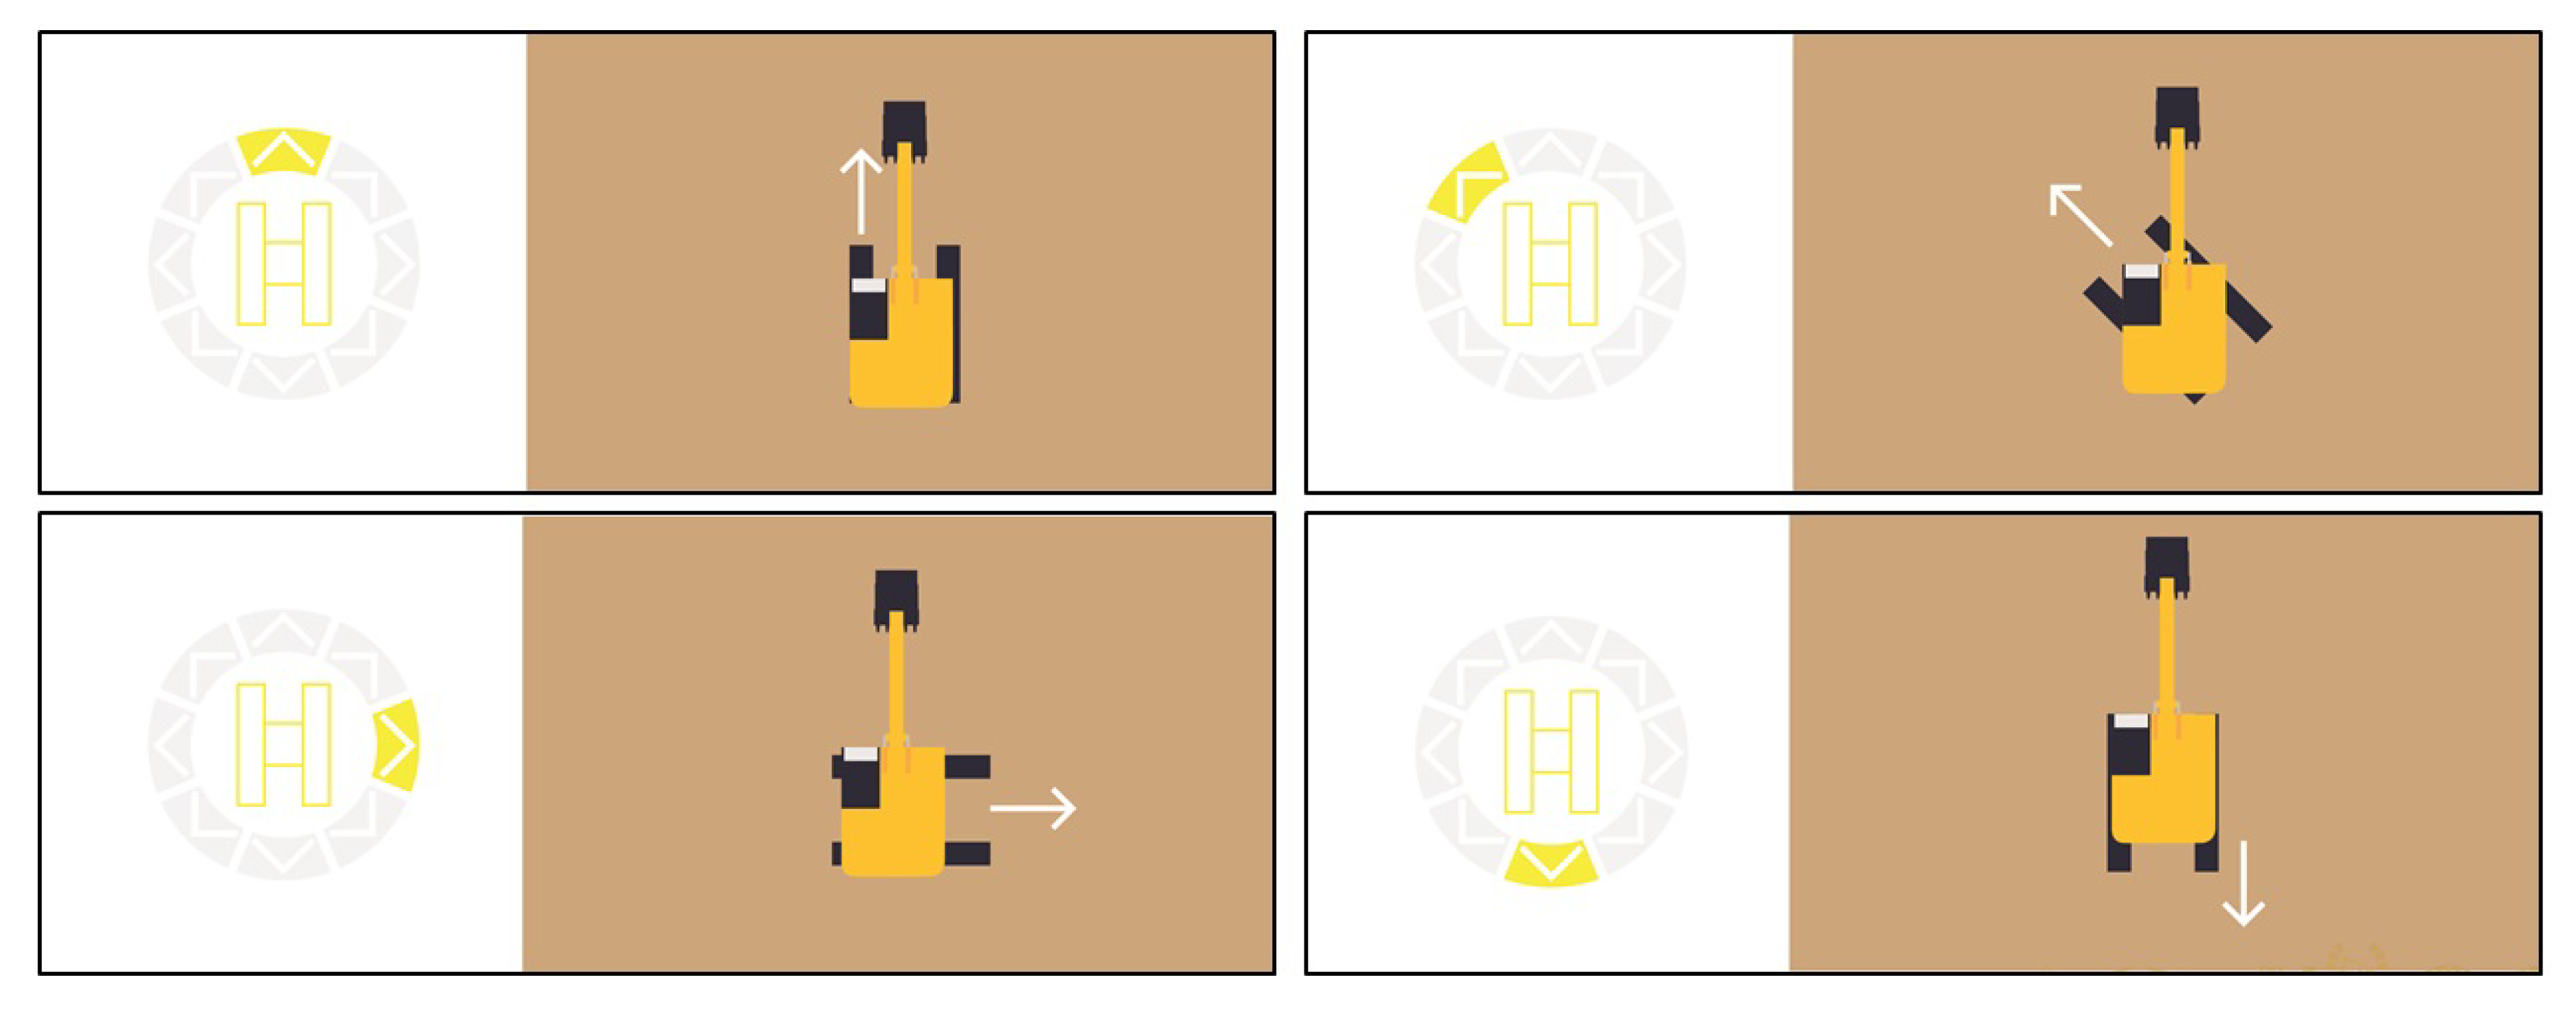
This concept was made based on the top view of the excavator and each segment indicates the current direction of the excavator’s undercarriage when moving forward. In this concept, the cabin will always be facing forward, while the undercarriage can face to eight different directions. See the images in Figure 8 for some scenarios that illustrate how this concept works.
3.3.4. Relative Load Capacity
In addition to digging, excavators can also be used for lifting. When using excavators for lifting operations, it is important to know the permissible maximum load capacity that can be lifted. From the safety guidelines, we also learned that the maximum load capacity constantly changes depending on few factors, such as the height of the lifted object from the ground, the distance between the lifted object and the center of the machine, and whether the lifting direction is on the same way or across the undercarriage. The maximum load capacity is decreasing if the object is lifted higher, farther from the center of the excavator, or the lifting direction is not align with the direction of the undercarriage. The maximum limit for each influencing factor is usually recorded in a document called ”the load chart” provided by the excavator manufacturer. Operators are advised to refer to the load chart before performing lifting operations, since exceeding the limit will cause the machine to tip over.
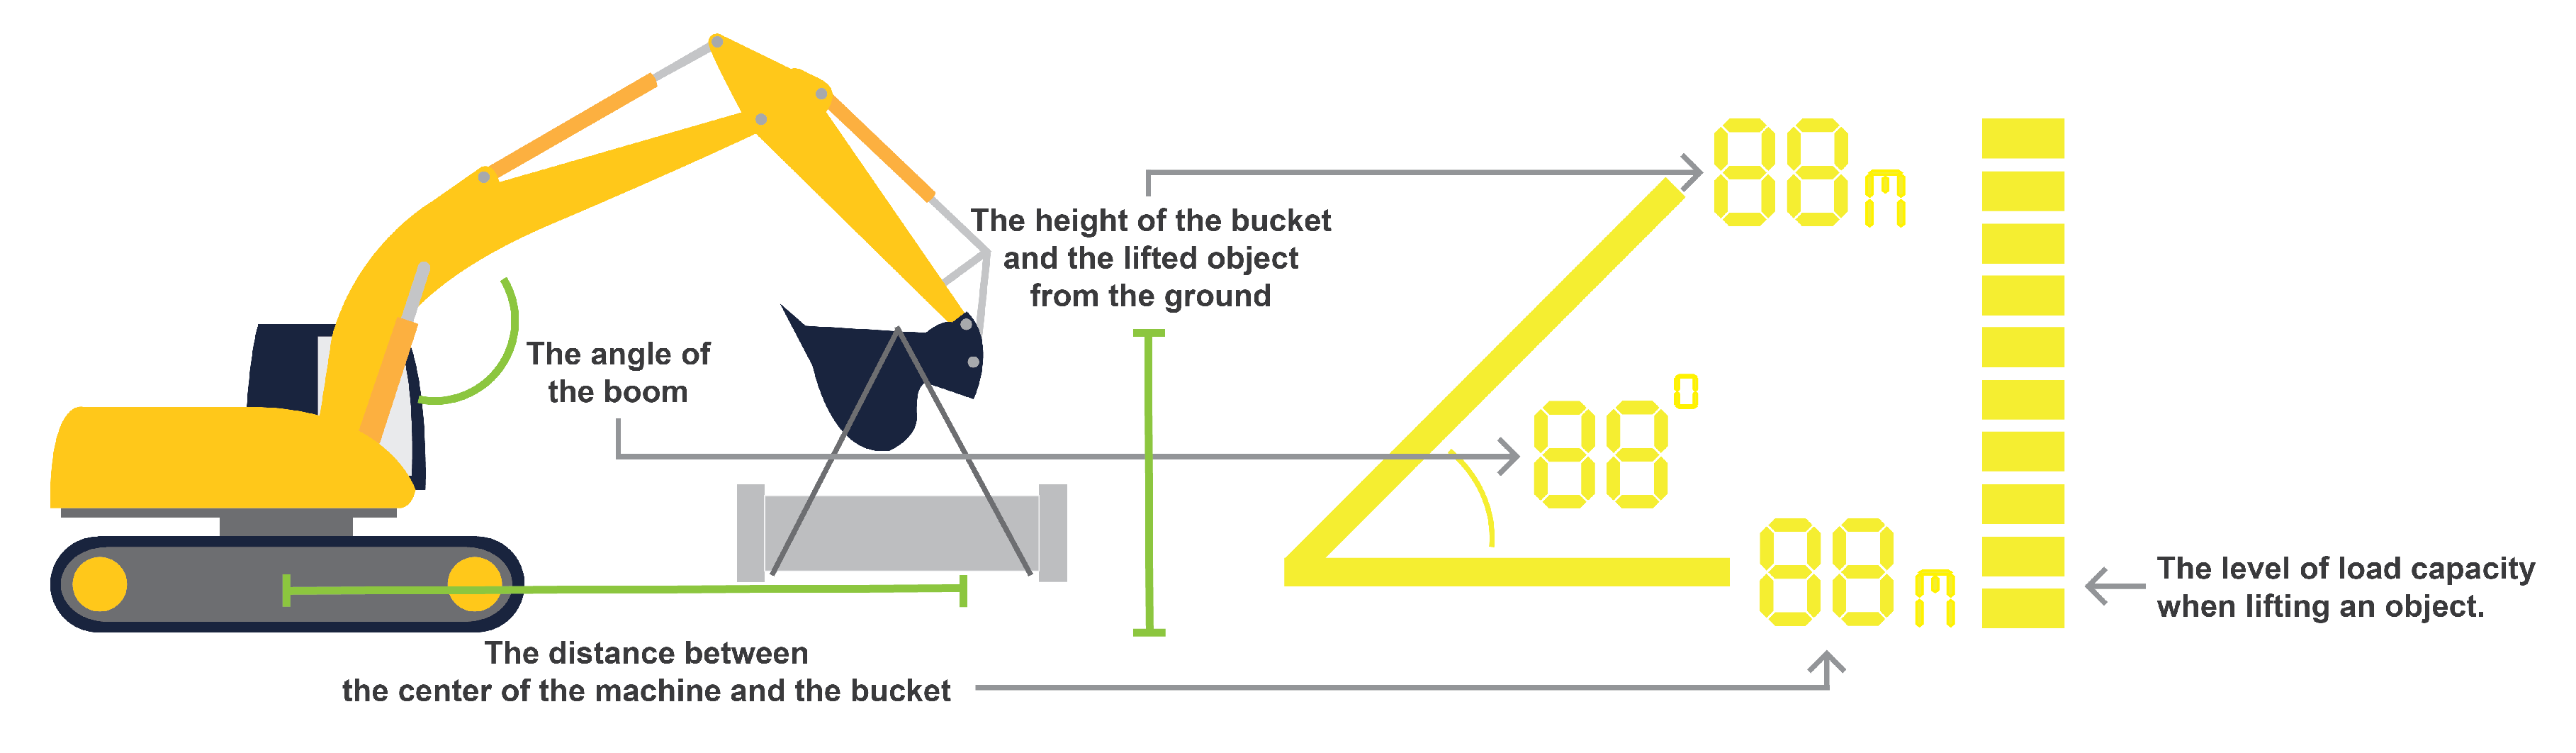
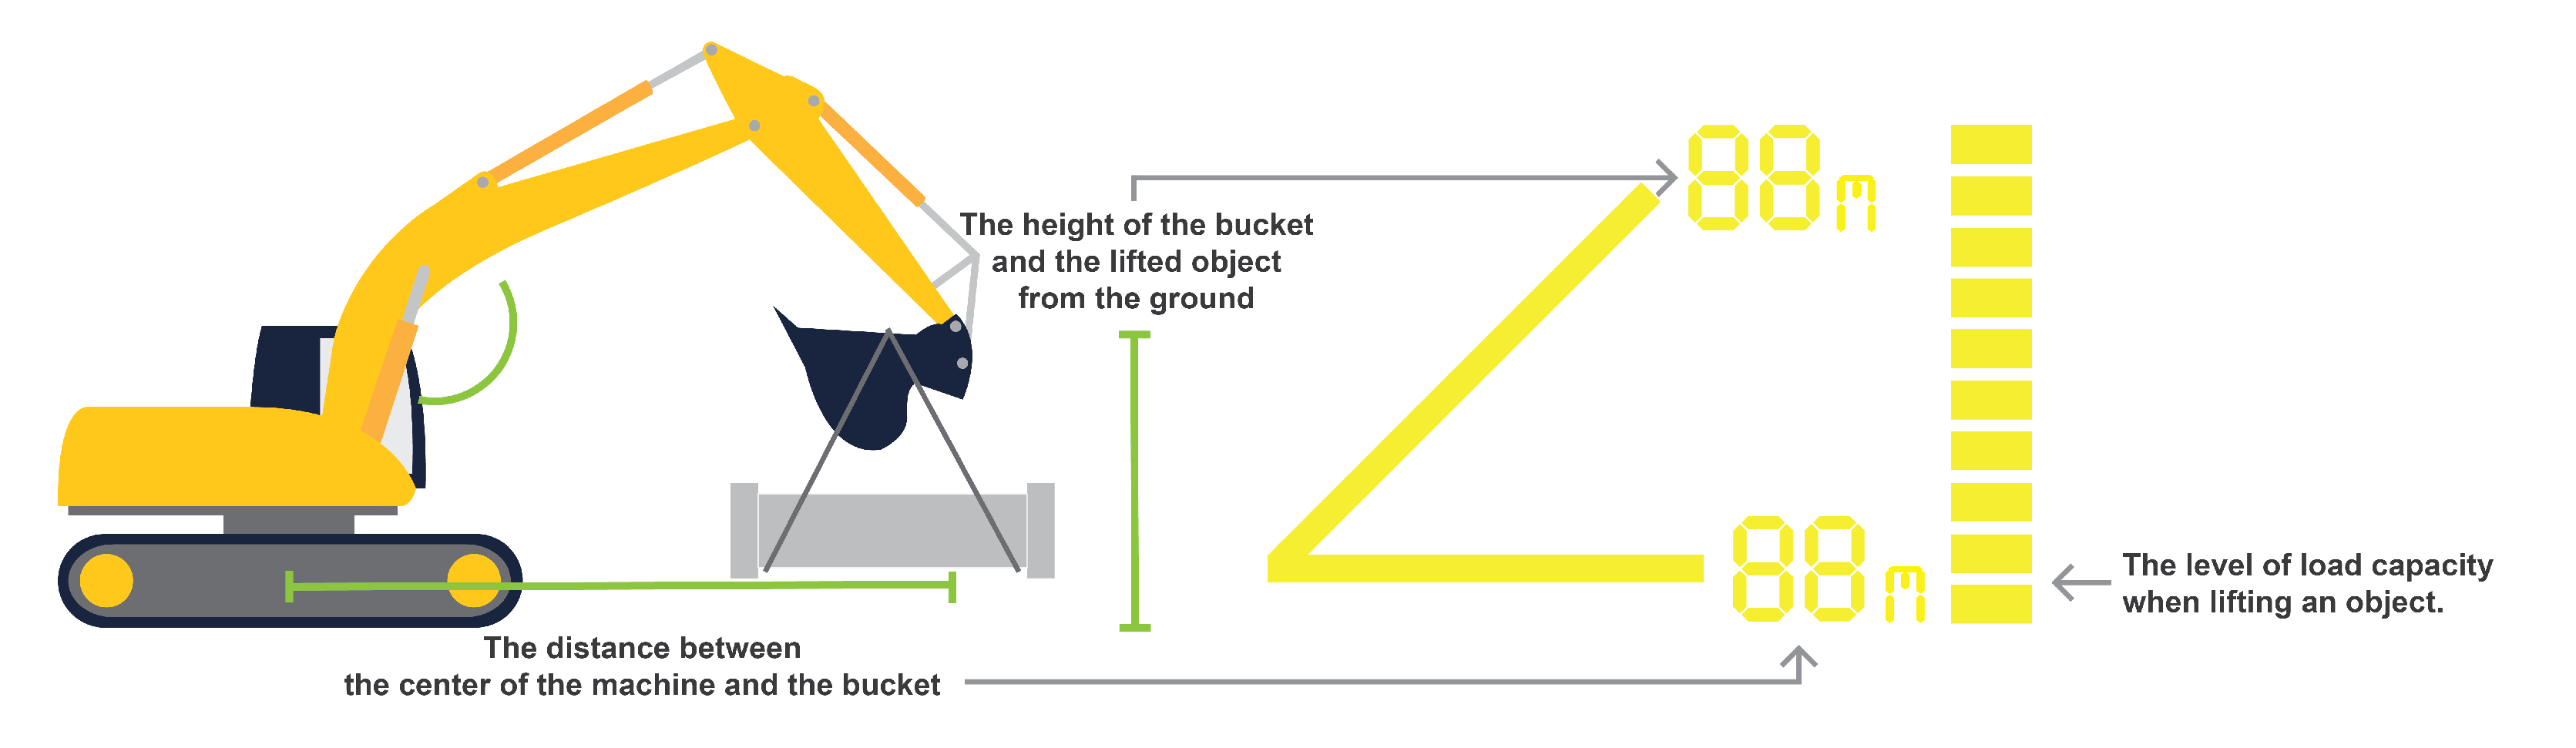
The concept that we made is called ”relative load capacity”, which indicates how much load an excavator is lifting compared to the maximum load capacity. This concept consists of four different pieces of information: the angle of the boom, the height of the bucket/lifted object from the ground, the distance between the bucket and the center of the machine, as well as ten blocks that represent the relative load capacity, where each block indicates 10% of the maximum load capacity (see Figure 9). To avoid the machine from tipping over, operators have to ensure that the top block is not turned on. See the images in Figure 10 for some scenarios that illustrate how the relative load capacity works.
3.3.5. Generic Warning Sign
The last concept was a generic warning sign that only appears when a collision or loss of balance is imminent to occur (see Figure 11). When this warning appears, operators should stop their current action.
3.4. Interviewing Operators to Get Their Feedback
Since we did not involve any excavator operators in our design workshop, we interviewed seven excavator operators and presented the generated concepts from our design workshop to get their feedback. This activity was also done to answer “RQ4—How do excavator operators perceive the proposed visualization approach?”. All the interviews were done at the operators’ respective workplaces and each interview lasted for one hour. After collecting the informed consent from the operators, the interviews were started with collecting some background information about the operators (see Table 1). We asked the operators about their age, experience, various excavators that they have operated (in terms of weight), and whether they were familiar with head-up displays. All the participants were males and six of them were working as professional operators. We also had one participant who owned an excavator and used it for personal use only, which we classified here as a hobbyist. One operator had no knowledge about head-up displays, while the remaining operators have seen advertisements or have tested one when test-driving a car.
We continued the interviews by explaining the meanings of the visualization concepts, which were printed on papers, to the operators. We also used some toys to help us in demonstrating the use of the visualization concepts, as shown in Figure 12. Once the operators have confirmed that they understood the logic behind each visualization concept, we then continued with some tests that evaluated the operators’ understanding. We showed some examples of the visualization concepts, which were also printed on papers, and then asked the operators to interact with the provided toys and move them around based on what kind of visualization that was shown to the operators (see Figure 13a–c). This approach was taken, since it would be easier for the operators to demonstrate their understanding through actions with the toys rather than to explain everything verbally. This approach is also different compared to the typical way of evaluating paper prototypes, where the researcher plays the ”computer” role and manipulates the paper prototype based on the input made by user [27]. As part of the evaluation, we showed ten examples using the proximity warning concept, eight examples for each concept of balance-related information, eight examples for the undercarriage direction concept, and ten examples using the relative load capacity concept. Only for the proximity warning concept, the provided examples had increasing difficulty, starting from one obstacle to multiple obstacles in different altitudes. The remaining visualization concepts did not have increasing difficulty, since the complexity among the different examples was mostly the same. Note that the generic warning concept was not evaluated, since its meaning was too obvious for the operators. Some of the provided examples are already shown in Section 3.3.1, Section 3.3.2, Section 3.3.3 and Section 3.3.4.
In the last part of the interviews, the operators were asked to choose which visualization concepts that they would like to have and where the concepts should be placed on the windshield. The visualization concepts were printed on a transparent film and cut into several pieces, which could be move around. We then presented a paper that has an image of excavator’s cabin printed on it. When evaluating a paper prototype, it is also common to provide some overlaid materials that the user can interact with, since this approach could provide the user some ideas on how the final interface may look like [28]. We then asked the operators to place the visualization concepts on the windshield according to their preferences. The operators were also free to exclude some of the visualization concepts, if they thought that some of the visualization concepts were unnecessary. Finally, the operators were asked to describe the reason behind the placement that they have made.
4. Results
This section presents the feedback on the proposed visualization concepts that we received from the operators, how they were revised, and where they should be placed on the windshield.
4.1. Comments on the Proximity Warning
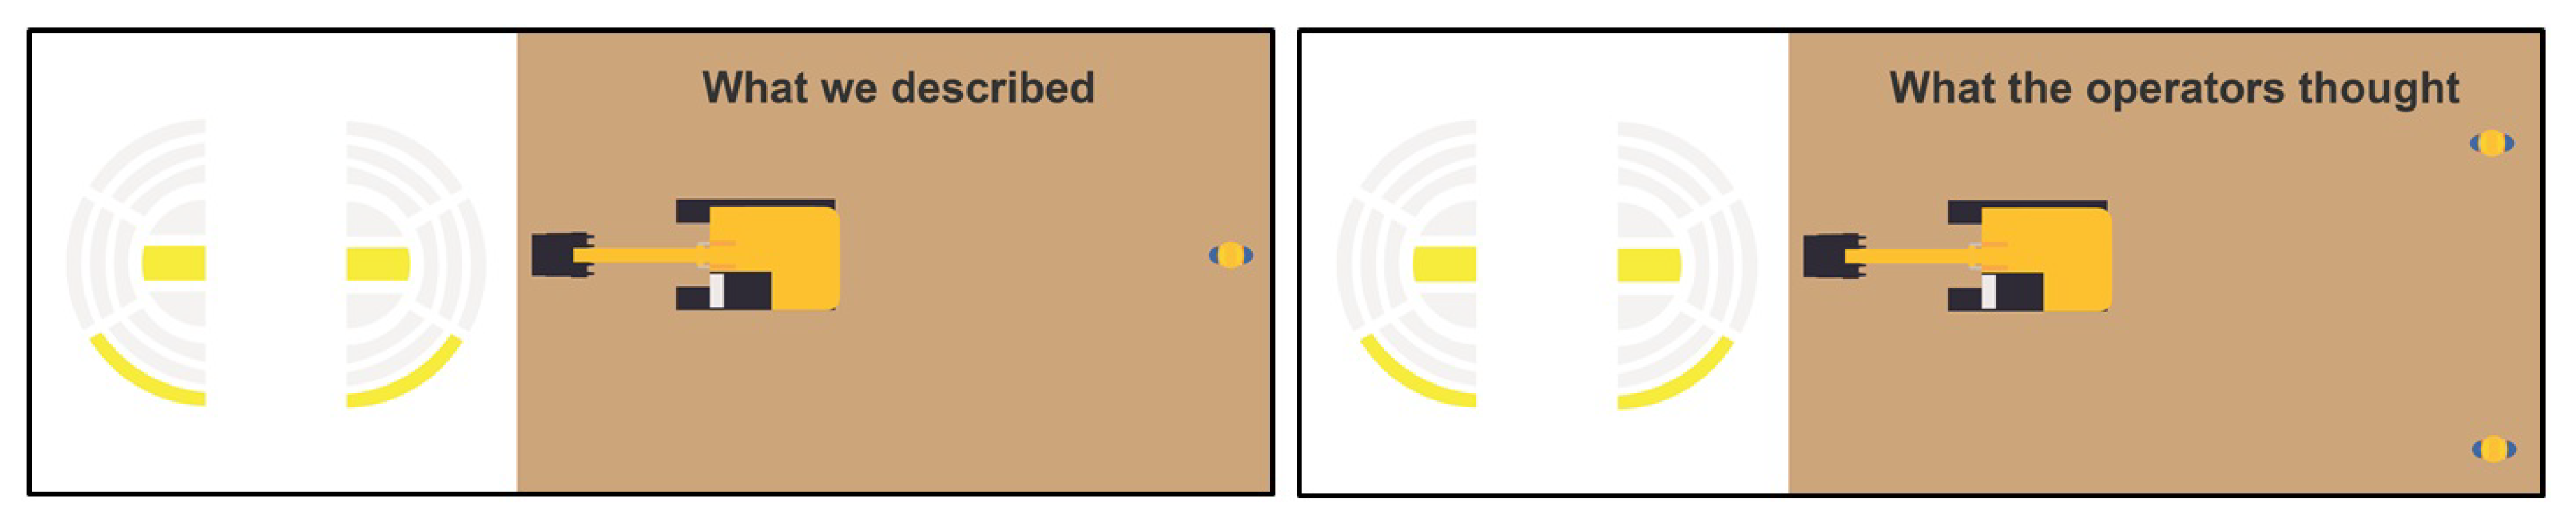
The operators could understand this concept without any problem when the obstacles existed on the left side or the right side only (see Figure 6a,b for the examples). The operators started to misinterpret the concept when there was an obstacle exactly in front or behind the machine. Although it was previously explained that, as the proximity warning was split into left and right sides, the same segment on both sides would be lit when the obstacle was exactly in front of or behind the machine (see Figure 6c for an example). The operators said that it would make more sense if each segment represents the obstacle that exists in one direction (see the images in Figure 14 for the illustration of this phenomenon). We then realized that this way of thinking was not wrong either, since if there are two obstacles with similar proximity, where one is on the left side and another one is on the right side, then the visualization will look like the right image in Figure 14. The operators further suggested that they would prefer to have the proximity warning concept in a complete circle, instead of separated half circles.
The operators could also use this concept well when the obstacles were on the same level. When the obstacles were on different altitudes (see Figure 6d for an example), they could pinpoint both position and proximity of the obstacle, but failed to determine whether the obstacle was lower, on the same level, or higher than the machine. They said that it was too difficult to process the position and the altitude separately. Operator #3 even suggested that it would be useful if both position and altitude of an obstacle can be somehow indicated using the same segment. Despite the importance of avoiding any collision with nearby objects, Operator #5 commented that he did not want to have the proximity warning concept presented on the windshield, due to its current complexity. The remaining operators still would like to have this concept presented on the windshield, given that the design could be revised in order to reduce the complexity.
We then incorporated the feedback from the operators by revising this concept into a complete circle with segment groups that point to eight different directions (see Figure 15a), thus the ambiguity problem shown in Figure 14, when an obstacle is in the front of or behind the machine, is solved. Unfortunately, we could not incorporate the comment from Operator #3 about indicating both position and altitude of an obstacle using the same segment, since it would make the design even more complex. To reduce the complexity of the design, we decided to remove the segments that indicate the altitude of the obstacle the obstacle. This decision reduced the number of information that the operators should acquire and process.
4.2. Comments on the Balance-Related Information
All the operators could use and understand both concepts without any problem. However, the concept of center of gravity was preferred by six operators, while only one operator who preferred the concept of two tilting rates. Regarding the concept of two tilting rates, six operators said that it was slightly more difficult to process two pieces of information simultaneously. Regarding the preference towards using the concept of center of gravity, Operator #7 even commented that operators only need to know where the center of gravity currently is and they do not need to know how much the machine is tilted. Operator #2 further commented that, for both concepts, the segment that indicates that the machine is in a stable position could be removed (see Figure 7a for an example), since that means there is nothing that operators should concern about. Since the operators preferred the concept of center of gravity and the feedback from Operator #2 did make sense, we revised this concept by removing the segment that indicates the machine is in a stable position (see Figure 16). This means that one of the segments will be turned only when the machine started to tilt.
Regarding whether either of the concepts should be presented on the windshield, Operator #1 decided to exclude any balance-related information. He argued that an experienced operator could feel the balance of the machine through the movement of the cabin, and thus such information is not needed for him. The other operators who included one of the balance-related information also commented a similar thing, but they argued that it is nonetheless nice to have something inside the cabin that could validate their gut feeling.
4.3. Comments on the Undercarriage Direction
This concept was understood instantly by the operators, and thus there was no further feedback regarding how the information should be visualized. However, only three operators who would like to have this concept presented on the windshield, while the remaining operators considered this information unnecessary, especially for experienced operators. Among three operators who included this concept, Operator #2 and Operator #4 said that it is a nice piece of information to have, although not very critical. Operator #7 also argued that this information would be useful when operating a large excavator, since operators can see the undercarriage, but the direction, where the undercarriage will move, is not always clearly visible.
4.4. Comments on the Relative Load Capacity
All the operators agreed with the logic behind this concept and all of them would like to have it presented on the windshield. However, the operators commented that there is too much information in this concept. The operators explained that the most important part in this concept is the ten blocks that represent the relative load capacity, as these blocks are the information that indicates whether the machine will collapse or not. The operators had different opinions whether to keep or remove the information about the height of the bucket/lifted object and the distance between the lifted object and the center of the machine. Although not always needed, both pieces of information would be useful when precision is needed. However, all the operators agreed that the information about the angle of the boom is unnecessary, and thus it could be removed. Considering the unanimity among the operators, we revised this concept by removing the information about the angle of the boom, while the other kinds of information remain the same (see Figure 17).
4.5. Comments on the Generic Warning Sign
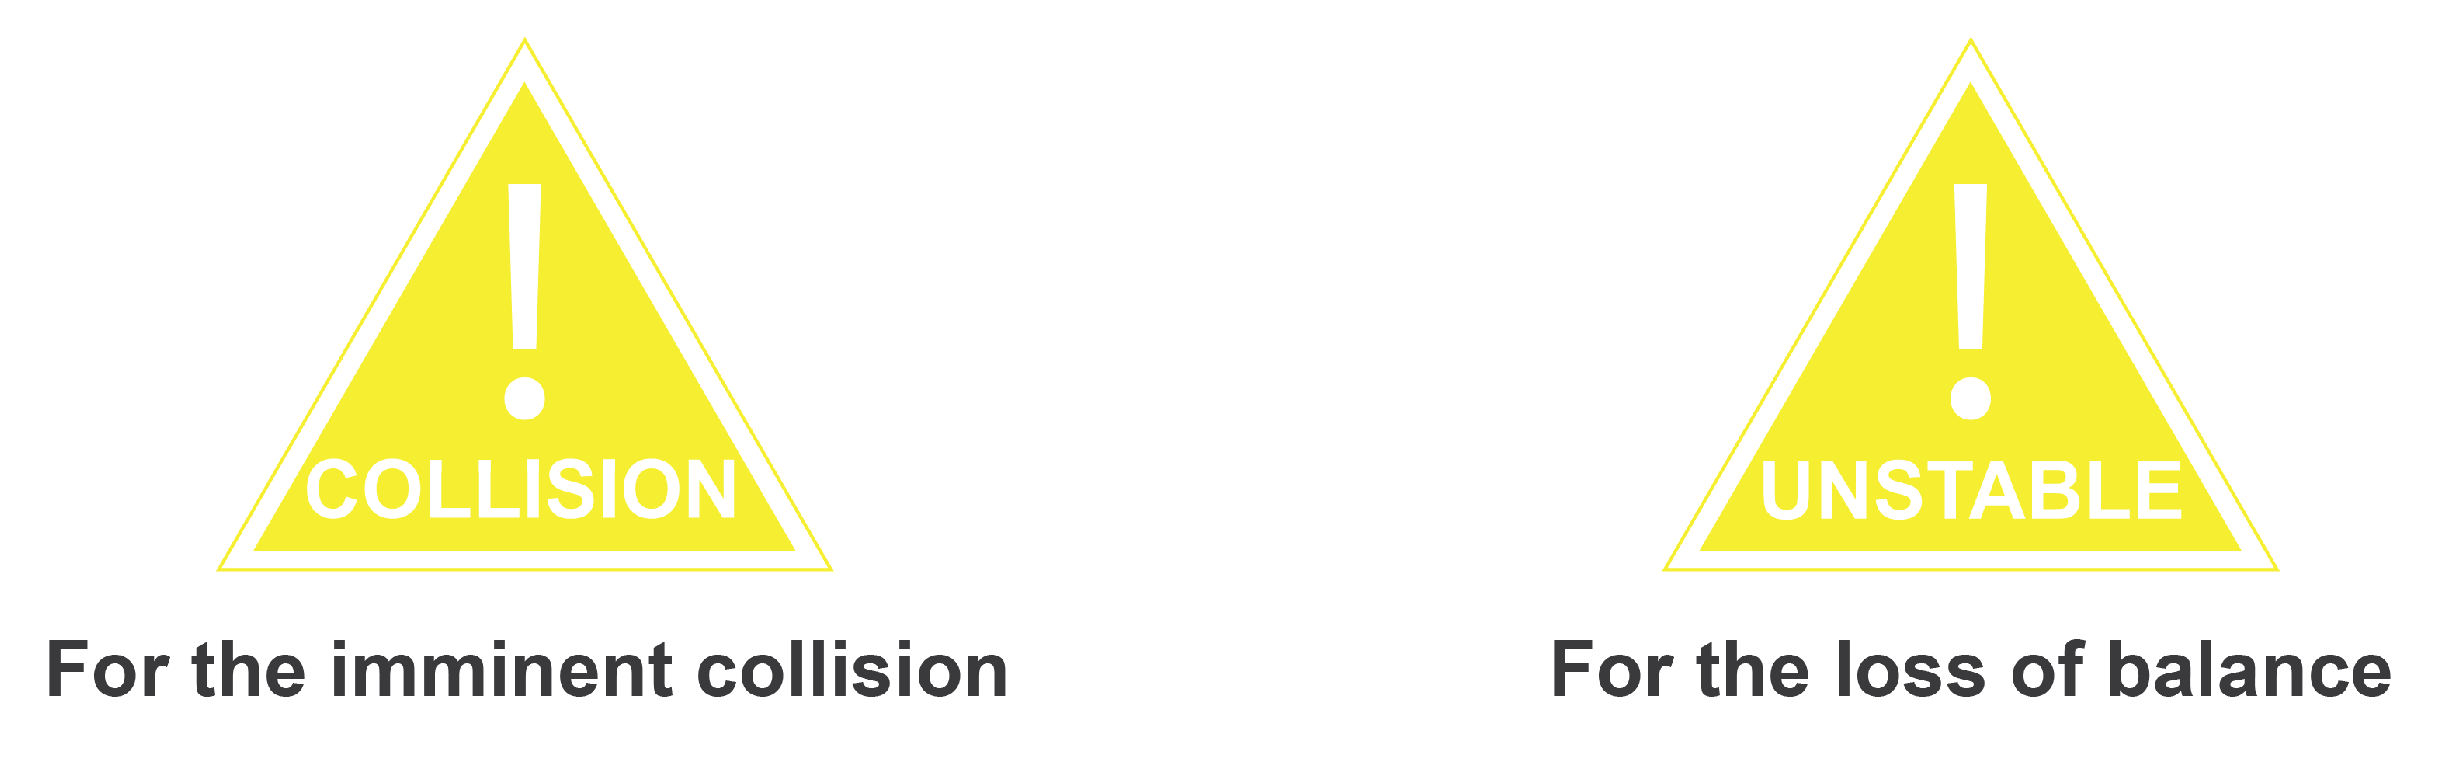
Even though this concept was not evaluated, all the operators understood its meaning instantly by looking at it. Six operators would like to have this information on the windshield, while Operator #3 would like to have this concept presented on the head-down display that exists in the cabin, as the head-down display can show something flashy that could attract his attention. Operator #3 further suggested that it would be good to have two versions of the warning sign: one is for the imminent collision and another one is for the loss of balance. Based on this comment, we decided to have two versions of the warning sign, where one is specifically for the imminent collision and the other one is for the loss of balance (see Figure 18). Therefore, it is much clearer for what kind of incidents that the warning represents.
4.6. Information Placement on the Windshield
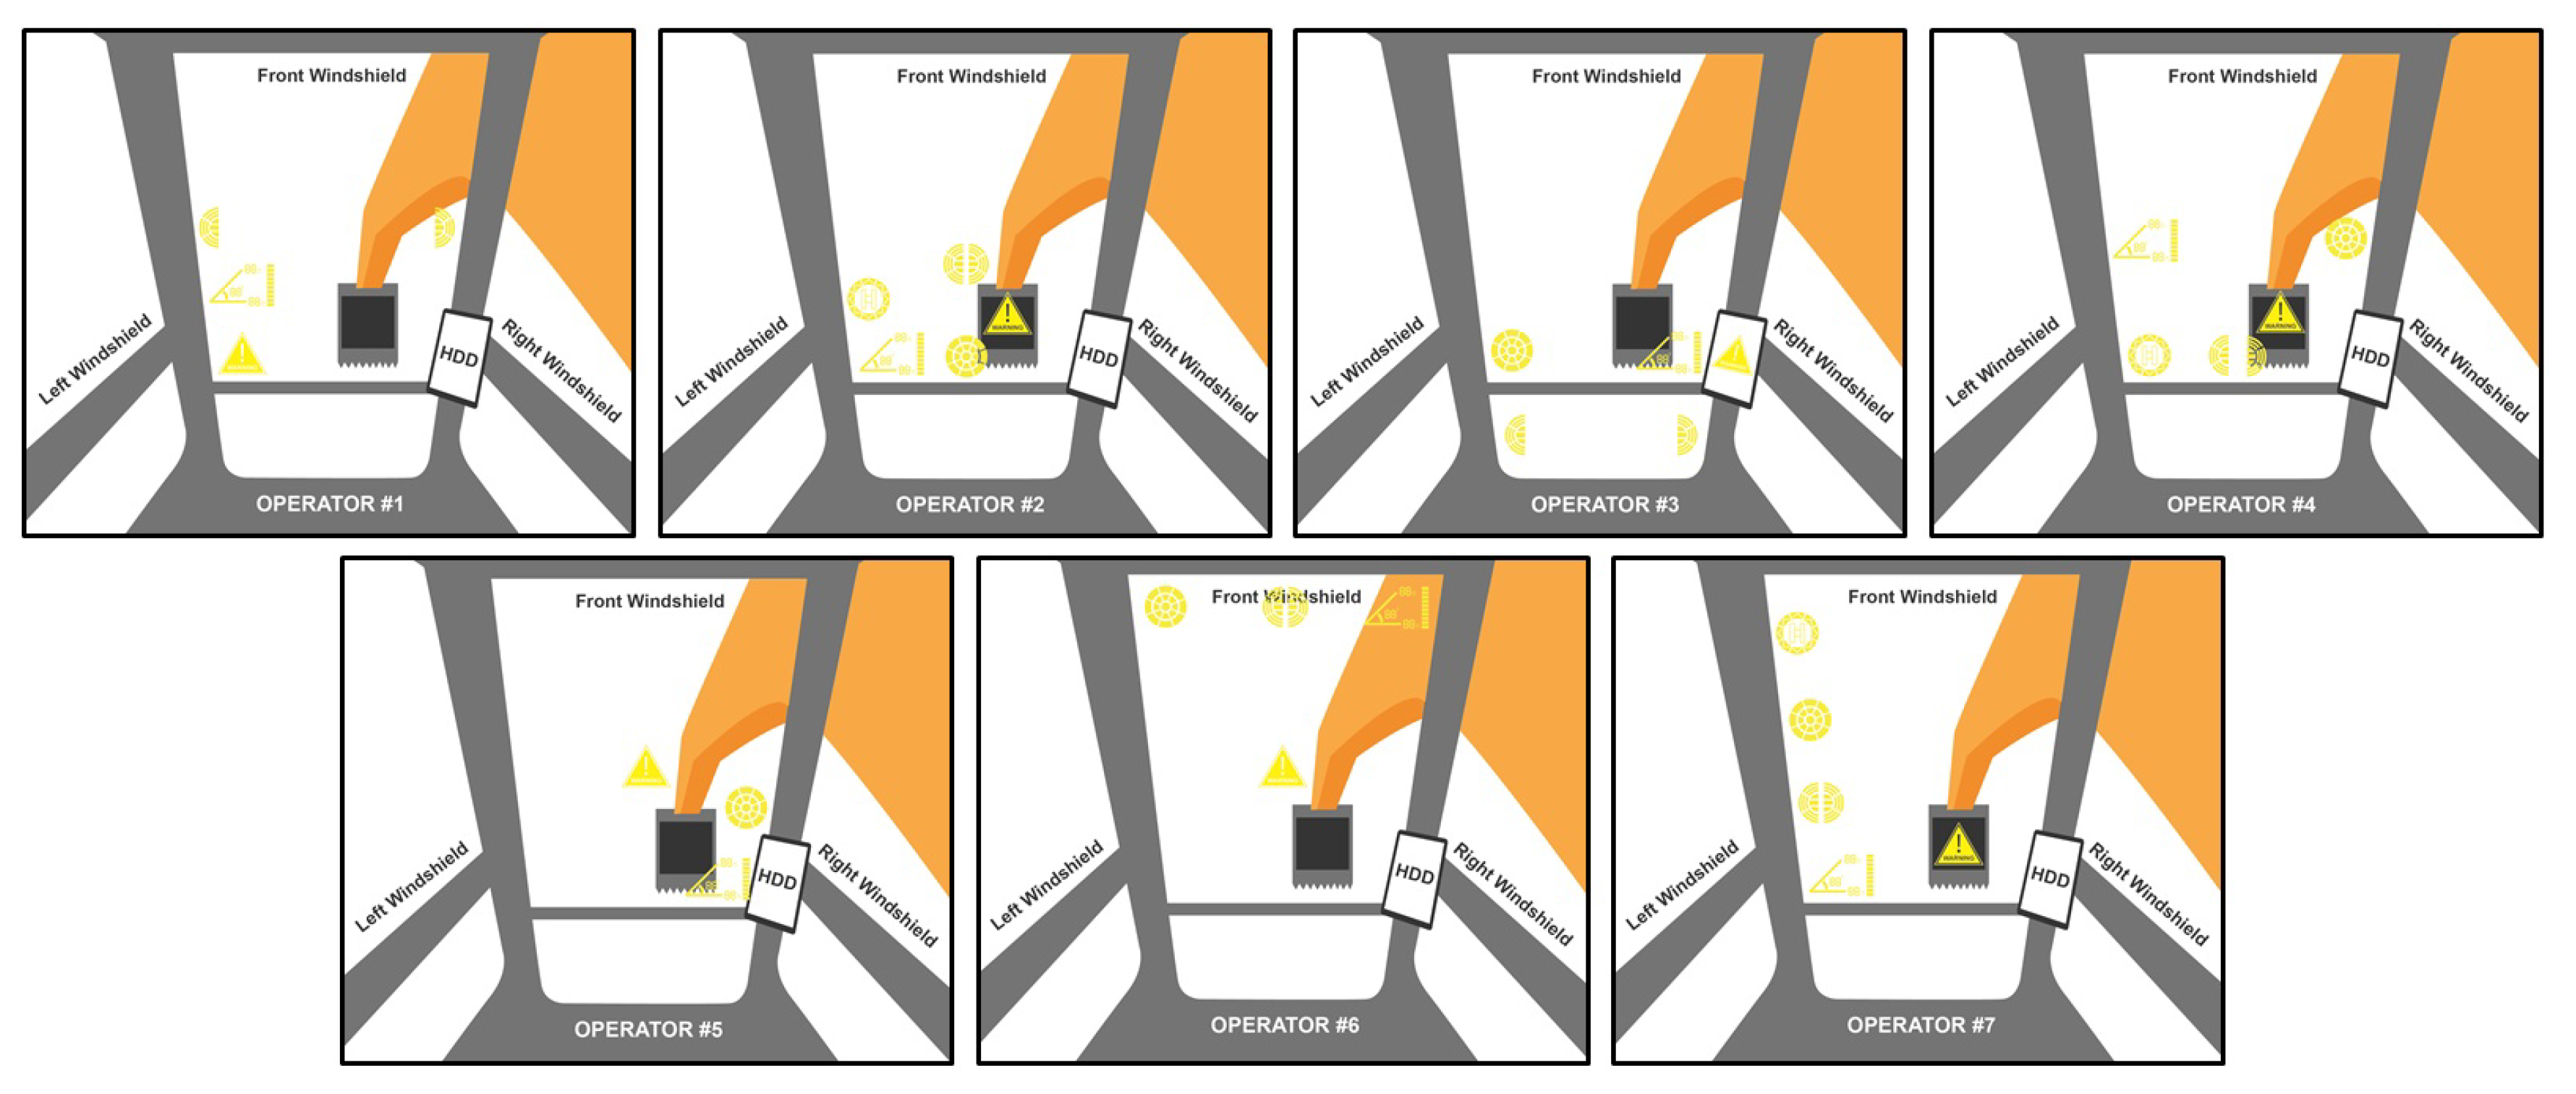
As the last part of the interviews, the operators were asked to choose which visualization concepts that they would like to be presented on the windshield and where they should be placed. Based on Figure 19, we could see that the operators were quite positive with this approach, since all of them decided to include at least three visualization concepts to be presented on the windshield. According to the placements that the operators have made, we could see that there is a pattern, where most of the information should be presented peripherally (see the images in Figure 19). The operators commented that they need to have the working area, for example, the area where the bucket is, to be free from any obstruction. However, there is an exception to this, as five operators would like to have the generic warning sign to be presented centrally, as shown in Figure 19. The operators argued that, as they pay attention to that area the most, placing the warning sign there will allow them to detect the warning instantly. Regarding the placement of other visualization concepts, we unfortunately could not get a firm indication from this study, as the operators’ preferences were quite diverse.
The operators also commented that the placement of information highly depends on the operation being performed. For example, when digging, the operators would spend most of their time looking down. In this case, it would be appropriate to have the information in lower positions. Similarly, the operators would mostly look above in a lifting operation. In this case, it would be useful to have the information in higher positions. The operators further commented that it would be great if the information can be moved around the windshield depending on their needs. Although this suggestion is reasonable, transparent displays are unfortunately designed to be installed in one fixed place, which is similar to how head-down displays and projection head-up displays are installed inside the cabin. Changing the placement of transparent displays is technically possible, but operators would need the help from a technician to do so.
5. Discussion
In this study, we used four safety guidelines to find what kinds of information that excavator operators should know to perform their work safely. Using this approach, we were able to come up with the list of information that could be relevant for operators, regardless of their operational preferences. In the end of the interviews, we also asked the operators if there were other kinds of information that they would like to have, but were not presented in this study. All the operators said that the list of information that we presented was sufficient.
Although the proposed visualization concepts were presented in the form of papers, all the operators showed engagement and we also managed to get valuable feedback on the proposed visualization concepts, as presented in Section 4.1, Section 4.2, Section 4.3, Section 4.4 and Section 4.5. As the operators were provided with some toys to interact with, it was easier for them to convey their understanding on the proposed concepts. The operators could just move the toys around to show what they meant, instead of describing everything verbally. It also worked the other way around, since we could easily confirm the operators’ answers through the toys, and thus preventing any misinterpretation to occur.
We used a paper-based prototype to propose and evaluate the visualization concepts, since we wanted to get feedback from the operators, where modifications could still be easily incorporated. Our approach was in contrast with the common practice in the heavy machinery domain, since the operators were involved after everything has been developed, as discussed in Section 2. Through this study, we at least managed to confirm that there is a match between the presented information, the performed operation, and the operators’ way of thinking. As presented in Section 4, four out of six visualization concepts generated in this study could be understood easily by the operators. Nevertheless, the reality is more complex and the actual excavator operation would also influence how operators acquire and utilize the presented information. Based on our prior research [4], we found that the information acquisition rate was decreasing when the situation complexity was increasing. However, even in such condition, the information acquisition rate for the head-up display was still higher compared to the head-down display.
The designs of the visualization concepts in this study were made based on a commercially available technology. This choice was made after careful consideration on both advantages and disadvantages of every commercially available technology, as discussed in Section 3.2. Furthermore, we also wanted to propose something that may actually be deployed not only in simulated environments, but also in real excavators in later stages, similar to what has been done by Rakauskas et al. [17] in snowplow trucks, Englund et al. [18] in forest harvesters, and Fang et al. [14] in mobile cranes. In the context of excavators, prior studies were still conducted in the simulated environments. Akyeampong et al. [13] visualized the information directly within the simulated environment, and thus it is unclear how the visualization would work in practice and what kind of technology would be needed to realize it. In our prior work [4], we used a projector to present the information on the windshield and we were aware that this approach could have disadvantages in bright environments.
Considering the feedback from the operators, as described in Section 3.3.2, that they could know the state of the machine based on the machine’s movement, it indicates that other modalities, such as haptic or auditory, could also be used as an alternative or complement to the visual information. However, it is important to note that excavators already produce loud noise and strong vibration due to the working engine and the performed operation [29,30]. Therefore, increasing the number of haptic or auditory information should be done cautiously, since multiple modalities may cause conflict and interference, which could deteriorate operators’ performance [31]. While the mainstream approach for presenting information in heavy machinery is still mainly using visual information [8], there were studies that investigated the use of force feedback or auditory cues to complement existing visual information in excavators. Regarding the use of force feedback, there are challenges on determining the appropriate way of delivering force feedback [32] and improving the ergonomics of haptic devices [33]. Desai et al. [34] investigated the use of auditory cues in excavators and the result indicated that operators performed better when using the auditory cues. However, as the study was done in a simulated environment, it is unclear to what extent the auditory cues would work in real operations.
6. Future Work
As this study was still limited to the match between the presented information and the operators’ contextual needs, high-fidelity prototypes are nonetheless needed to further evaluate the proposed visualization concepts in some operation scenarios. We would then then be able to determine the impact of having such visualization on operators’ performance in certain scenarios. One example could be the difference on the information acquisition between situations with less things to be observed, such as operations in mining sites, and situations with more things to be observed, for instance, operations in urban areas. Since we proposed several visualization concepts in this study, it would be interesting to firstly evaluate them one by one to determine how each visualization concept would help operators to perform their work. After that, we could try presenting multiple concepts simultaneously to investigate if there would be conflict or interference due to the presence of multiple visual information. Depending on the fidelity of the prototype, future evaluations could be done in simulated environments or real-world settings. Through this study, we were unable to determine the optimum information placement on the windshield. Taking that into account, future evaluations could also be carried out to determine which placement of information that will provide the optimum result on operators’ performance, similar to what Topliss et al. [35] has done in the automotive context.
Author Contributions
Conceptualization, T.A.S.; methodology, T.A.S., M.W. and R.L.; investigation, T.A.S. and M.W., formal analysis, T.A.S.; writing–original draft preparation, T.A.S.; visualization, T.A.S.; writing–review and editing, R.L.; supervision, R.L.; funding acquisition, M.W. All authors have read and agreed to the published version of the manuscript.
Funding
This research has received funding from the European Union’s Horizon 2020 research and innovation programme under the Marie Skłodowska-Curie grant agreement No 764951.
Acknowledgments
We would like to thank the excavator operators for their participation in this study.
Conflicts of Interest
The authors declare no conflict of interest. The funder had no role in the design of the study; in the collection, analyses, or interpretation of data; in the writing of the manuscript, or in the decision to publish the results.
References
- Hughes, K.; Jiang, X. Using discrete event simulation to model excavator operator performance. Hum. Factors Ergon. Manuf. Serv. Ind. 2010, 20, 408–423. [Google Scholar] [CrossRef]
- Kazan, E.; Usmen, M.A. Worker safety and injury severity analysis of earthmoving equipment accidents. J. Saf. Res. 2018, 65, 73–81. [Google Scholar] [CrossRef] [PubMed]
- Jo, B.W.; Lee, Y.S.; Kim, J.H.; Kim, D.K.; Choi, P.H. Proximity Warning and Excavator Control System for Prevention of Collision Accidents. Sustainability 2017, 9, 1488. [Google Scholar] [CrossRef] [Green Version]
- Wallmyr, M.; Sitompul, T.A.; Holstein, T.; Lindell, R. Evaluating Mixed Reality Notifications to Support Excavator Operator Awareness. In Human-Computer Interaction—INTERACT 2019-17th IFIP TC 13 International Conference, Proceedings, Part I; Springer: Cham, Switzerland, 2019; pp. 743–762. [Google Scholar] [CrossRef]
- Wallmyr, M. Seeing Through the Eyes of Heavy Vehicle Operators. In Human-Computer Interaction—INTERACT 2017; Springer: Cham, Switzerland, 2017; pp. 263–282. [Google Scholar] [CrossRef] [Green Version]
- Kress, B.; Victorien, R.; Meyrueis, P. Digital combiner achieves low cost and high reliability for head-up display applications. SPIE Newsroom 2009. [Google Scholar] [CrossRef]
- Haeuslschmid, R.; Pfleging, B.; Alt, F. A Design Space to Support the Development of Windshield Applications for the Car. In Proceedings of the 2016 CHI Conference on Human Factors in Computing Systems, San Jose, CA, USA, 7–12 May 2016; ACM: New York, NY, USA, 2016; pp. 5076–5091. [Google Scholar] [CrossRef]
- Sitompul, T.A.; Wallmyr, M. Using Augmented Reality to Improve Productivity and Safety for Heavy Machinery Operators: State of the Art. In Proceedings of the 17th International Conference on Virtual-Reality Continuum and Its Applications in Industry, Brisbane, Australia, 17–20 December 2019; ACM: New York, NY, USA, 2019; pp. 8:1–8:9. [Google Scholar] [CrossRef] [Green Version]
- Vessey, I.; Galletta, D. Cognitive Fit: An Empirical Study of Information Acquisition. Inf. Syst. Res. 1991, 2, 63–84. [Google Scholar] [CrossRef]
- Nuamah, J.K.; Seong, Y.; Jiang, S.; Park, E.; Mountjoy, D. Evaluating effectiveness of information visualizations using cognitive fit theory: A neuroergonomics approach. Appl. Ergon. 2020, 88, 103173. [Google Scholar] [CrossRef] [PubMed]
- Endsley, M.R.; Jones, D.G. Designing for Situation Awareness: An Approach to User-Centered Design, 2nd ed.; CRC Press: Boca Raton, FL, USA, 2016. [Google Scholar] [CrossRef]
- Fang, Y.; Cho, Y.K. Effectiveness Analysis from a Cognitive Perspective for a Real-Time Safety Assistance System for Mobile Crane Lifting Operations. J. Constr. Eng. Manag. 2017, 143, 05016025:1–05016025:11. [Google Scholar] [CrossRef]
- Akyeampong, J.; Udoka, S.; Caruso, G.; Bordegoni, M. Evaluation of hydraulic excavator Human–Machine Interface concepts using NASA TLX. Int. J. Ind. Ergon. 2014, 44, 374–382. [Google Scholar] [CrossRef]
- Fang, Y.; Cho, Y.K.; Durso, F.; Seo, J. Assessment of operator’s situation awareness for smart operation of mobile cranes. Autom. Constr. 2018, 85, 65–75. [Google Scholar] [CrossRef]
- Santana-Fernández, J.; Gil, J.G.; Del-Pozo-San-Cirilo, L. Design and Implementation of a GPS Guidance System for Agricultural Tractors Using Augmented Reality Technology. Sensors 2010, 10, 10435–10447. [Google Scholar] [CrossRef] [PubMed] [Green Version]
- Palonen, T.; Hyyti, H.; Visala, A. Augmented Reality in Forest Machine Cabin. IFAC-PapersOnLine 2017, 50, 5410–5417. [Google Scholar] [CrossRef]
- Rakauskas, M.E.; Ward, N.J.; Gorjestani, A.R.; Shankwitz, C.R.; Donath, M. Evaluation of a DGPS Driver Assistive System for Snowplows and Emergency Vehicles. In International Conference of Traffic and Transport Psychology; Elsevier: Nottingham, UK, 2005; pp. 257–272. [Google Scholar]
- Englund, M.; Lundström, H.; Brunberg, T.; Löfgren, B. Utvärdering av Head-Up Display för Visning av Apteringsinformation i Slutavverkning; Technical Report; Skogforsk: Uppsala, Sweden, 2015. [Google Scholar]
- Kvalberg, J.L. Head-Up Display in Driller and Crane Cabin. Master’s Thesis, Norwegian University of Science and Technology, Trondheim, Norway, 2010. [Google Scholar]
- Strategic Forum for Construction. Lifting Operations with Excavators; Construction Plant-hire Association: London, UK, 2008. [Google Scholar]
- Occupational Safety and Health Branch. Code of Practice on Safe Use of Excavators; Labour Department: Hong Kong, China, 2005. [Google Scholar]
- Health and Safety Executive. The Safe Use of Vehicles on Construction Sites; HSE Books: Sudbury, UK, 2009. [Google Scholar]
- CITB Construction Skills. Health and Safety Advice for Plant Operators; CITB Northern Ireland: Crumlin, UK, 2016. [Google Scholar]
- Segura, Á.; Moreno, A.; Brunetti, G.; Henn, T. Interaction and Ergonomics Issues in the Development of a Mixed Reality Construction Machinery Simulator for Safety Training. In Proceedings of the International Conference on Ergonomics and Health Aspects of Work with Computers, Beijing, China, 22–27 July 2007; Springer: Berlin/Heidelberg, Germany, 2007; pp. 290–299. [Google Scholar]
- Tretten, P.; Gärling, A.; Nilsson, R.; Larsson, T.C. An On-Road Study of Head-Up Display: Preferred Location and Acceptance Levels. Proc. Hum. Factors Ergon. Soc. Annu. Meet. 2011, 55, 1914–1918. [Google Scholar] [CrossRef] [Green Version]
- Abileah, A.; Harkonen, K.; Pakkala, A.; Smid, G. Transparent Electroluminescent (EL) Displays; Technical Report; Planar Systems: Beaverton, OR, USA, 2008. [Google Scholar]
- Snyder, C. Paper Prototyping: The Fast and Easy Way to Design and Refine User Interfaces; Morgan Kaufmann Publishers: San Francisco, CA, USA, 2003. [Google Scholar]
- Beaudouin-Lafon, M.; Mackay, W.E. Prototyping tools and techniques. In Human-Computer Interaction: Development Process; Sears, A., Jacko, J.A., Eds.; CRC Press: Boca Raton, FL, USA, 2009; Chapter 7; pp. 121–144. [Google Scholar]
- Schneider, S.; Buchholz, B.; Moir, S.; Virji, M.A. An Ergonomic Assessment of an Operating Engineer: A Pilot Study of Excavator Use. Appl. Occup. Environ. Hyg. 1997, 12, 23–27. [Google Scholar] [CrossRef]
- Cann, A.P.; Salmoni, A.W.; Vi, P.; Eger, T.R. An Exploratory Study of Whole-Body Vibration Exposure and Dose While Operating Heavy Equipment in the Construction Industry. Appl. Occup. Environ. Hyg. 2003, 18, 999–1005. [Google Scholar] [CrossRef] [PubMed]
- Osafo-Benoah, B.; Jiang, S. Empirical Investigation of Conflict and Interference within Haptic Controlled Human-Excavator Interface. In Advances in Usability Evaluation Part I, 1st ed.; Soares, M., Rebelo, F., Eds.; CRC Press: Boca Raton, FL, USA, 2019; Chapter 5; pp. 42–51. [Google Scholar]
- Osafo-Yeboah, B.; Jiang, S.; Delpish, R.; Jiang, Z.; Ntuen, C. Empirical study to investigate the range of force feedback necessary for best operator performance in a haptic controlled excavator interface. Int. J. Ind. Ergon. 2013, 43, 197–202. [Google Scholar] [CrossRef]
- Morosi, F.; Rossoni, M.; Caruso, G. Coordinated control paradigm for hydraulic excavator with haptic device. Autom. Constr. 2019, 105, 102848. [Google Scholar] [CrossRef]
- Desai, Y.; Davis, D.; Jiang, S.; Ward, A. The Effect of Auditory Cues on Haptic-Controlled Excavator Operator Performance. In Proceedings of the IIE Annual Conference Proceedings, Montreal, QC, Canada, 31 May–3 June 2014; IIE: Norcross, GA, USA, 2014; pp. 825–832. [Google Scholar]
- Topliss, B.H.; Pampel, S.M.; Burnett, G.; Gabbard, J.L. Evaluating Head-Up Displays across Windshield Locations. In Proceedings of the 11th International Conference on Automotive User Interfaces and Interactive Vehicular Applications, Utrecht, The Netherlands, 21–25 September 2019; ACM: New York, NY, USA, 2019; pp. 244–253. [Google Scholar] [CrossRef]
Figure 1.
Levels of attention on different areas when operating an excavator, which were measured using an eye-tracker [5].
Figure 1.
Levels of attention on different areas when operating an excavator, which were measured using an eye-tracker [5].

Figure 2.
The left image shows machine-related status, which is directly presented on the virtual windshield inside the virtual environment [13]. The right image shows navigational information and collision warning that are projected on a physical windshield inside the mixed reality environment [4].

Figure 3.
The image shows the transparent display prototype that was developed by Kvalberg [19]. The number indicates the current load that is lifted by an off-shore crane, while the yellow triangle indicates that the lifting load exceeds the permissible limit.
Figure 3.
The image shows the transparent display prototype that was developed by Kvalberg [19]. The number indicates the current load that is lifted by an off-shore crane, while the yellow triangle indicates that the lifting load exceeds the permissible limit.

Figure 4.
The image that shows some sketches generated from our design workshop. Some sketches on the left side were made as if the entire windshield could work as a display, which are currently not possible due to the limitation of transparent displays. The other sketches show some visualization concepts that were closely made based on both capability and limitation of transparent displays. We also explored how the visualization would change based on the currently performed operation.

Figure 5.
The left image illustrates how the obstacle’s position with respect to the excavator is determined whether it is on the left side or the right side of the machine, while the distance between the excavator and the obstacle is divided into three categories: near (1 radius of the machine), medium (2 radii), and far (3 radii). The right image indicates the meaning for each segment in the proximity warning concept.

Figure 6.
The images that illustrate how the proximity warning concept would change based on the position of the obstacle(s). (a) There is an obstacle near rear left of the machine. (b) There is a far obstacle in front right of the machine. (c) There is a far obstacle exactly behind the machine. As the visualization is split into left and right sides, the same segments on both sides are illuminated when there is an obstacle exactly in front of or behind the machine. (d) There are two obstacles with different altitudes. One obstacle is on the left side, near, and lower than the machine, while the other one is on the right side, far, and higher than the machine.

Figure 7.
The images that illustrate how both concepts that indicate the machine’s balance would change. (a) The ground is flat, thus the machine is in a very stable position. (b) The machine is tilted by 8 to the right side, and thus the center of gravity moves a bit to the right side. (c) The excavator is climbs the slope and the steepness is 22, thus the center of gravity moves to somewhere behind the excavator. (d) The excavator descends the slope and the steepness is 8, thus the center of gravity moves a bit to the front side of the excavator.

Figure 8.
In this concept, the cabin is always facing forward, while the undercarriage can point to eight different directions. Each segment represents one of these directions.
Figure 8.
In this concept, the cabin is always facing forward, while the undercarriage can point to eight different directions. Each segment represents one of these directions.

Figure 9.
The meaning for each component in the relative load capacity concept.

Figure 10.
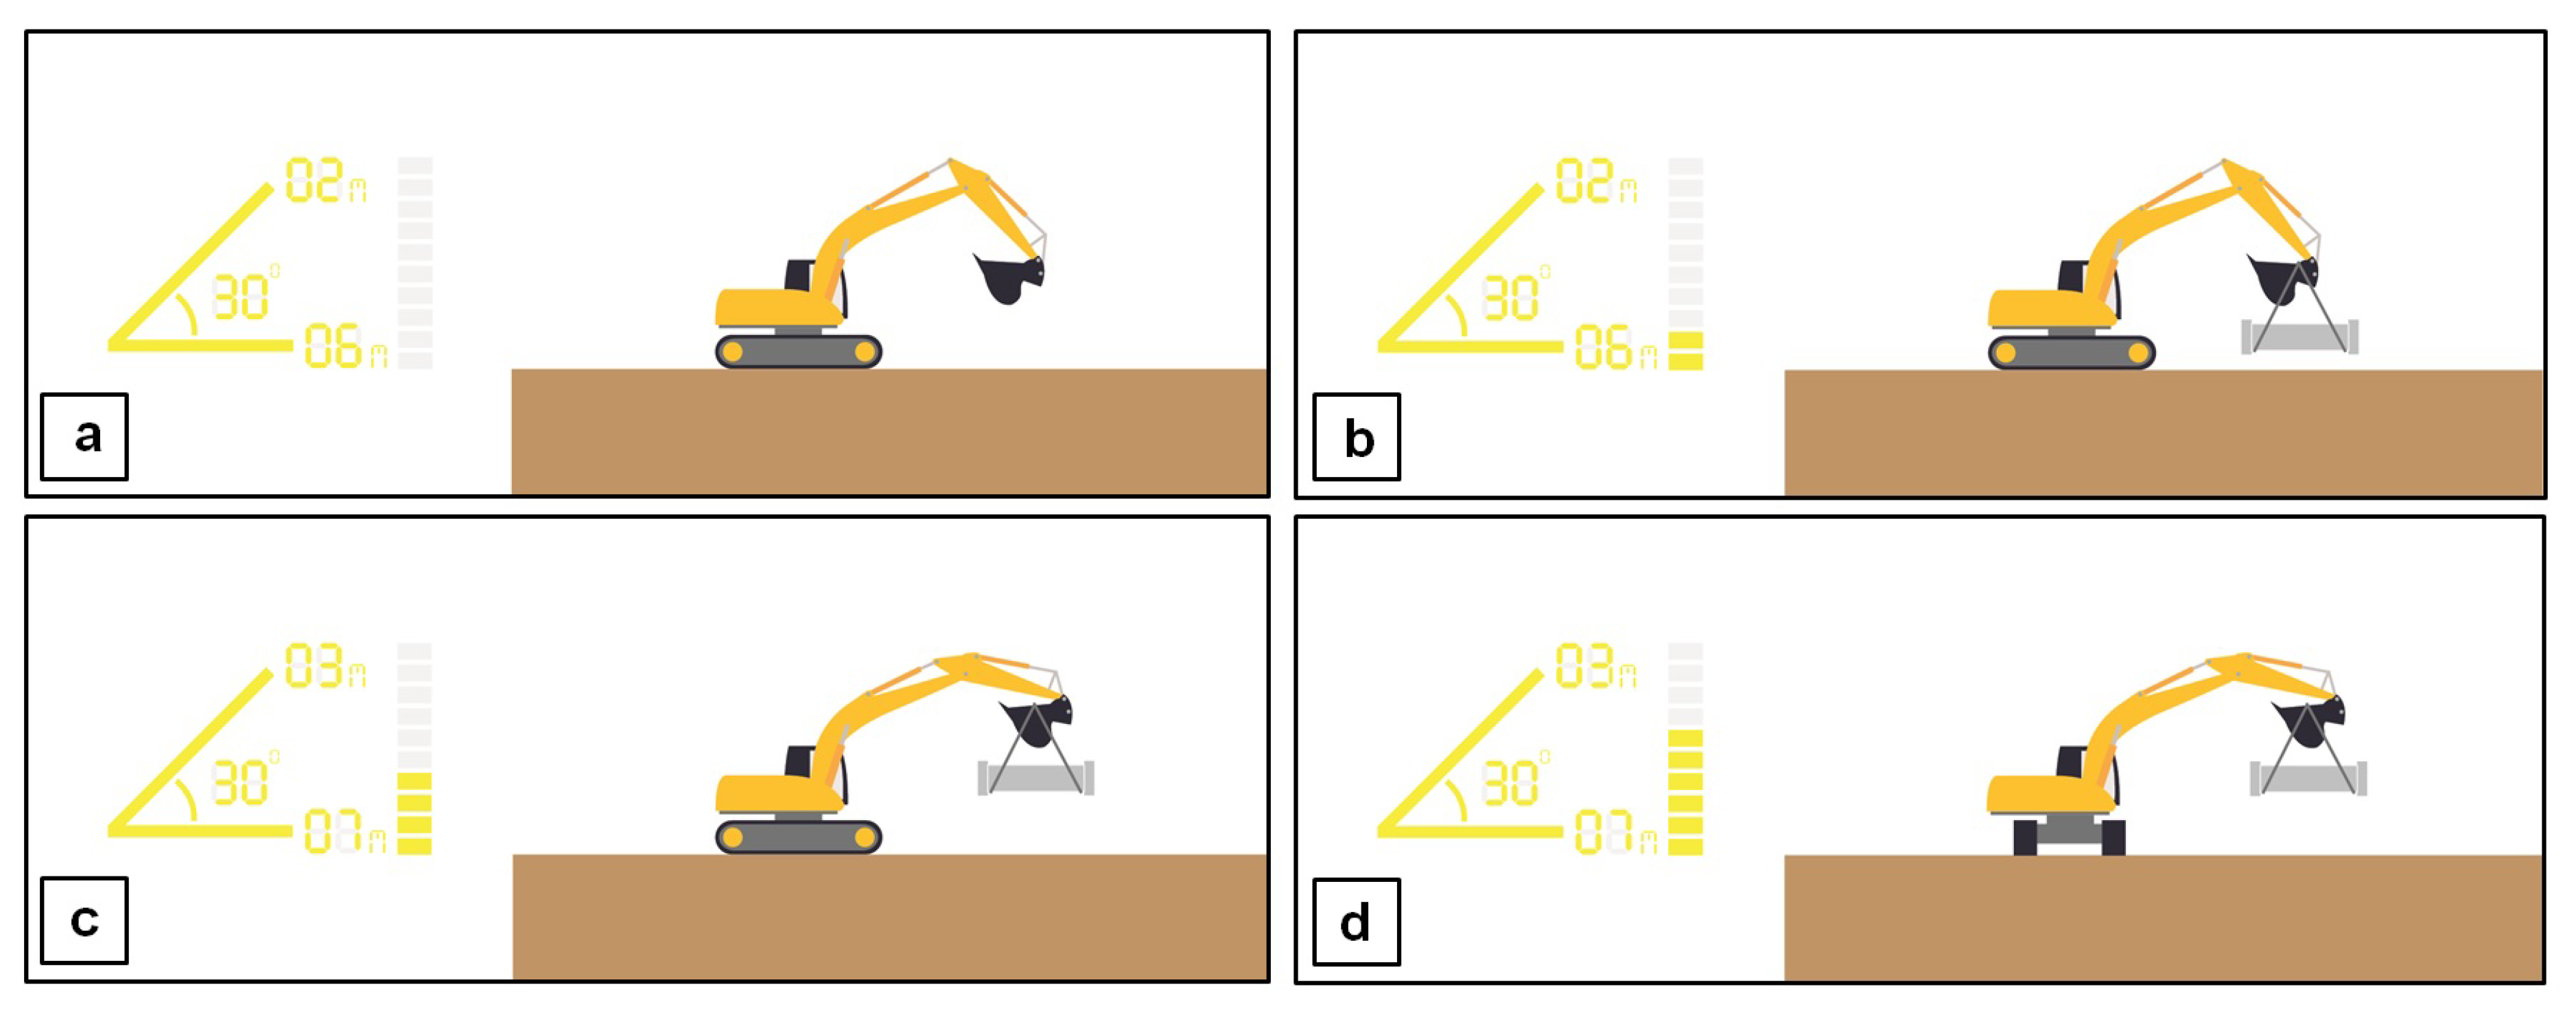
(a) Since the bucket is empty and there is no object being lifted, the relative load capacity is zero. (b) The excavator is lifting a pipe, where the height is 2 m and the distance is 6 m. In this position, the relative load capacity is 20%. (c) Still lifting the same pipe, but both height and distance are increasing, thus the relative load capacity goes higher. (d) Still lifting in the same position, but now the lifting direction is across the undercarriage, and thus the relative load capacity goes even higher. Note that both numbers and percentages here are used for giving examples only.
Figure 10.
(a) Since the bucket is empty and there is no object being lifted, the relative load capacity is zero. (b) The excavator is lifting a pipe, where the height is 2 m and the distance is 6 m. In this position, the relative load capacity is 20%. (c) Still lifting the same pipe, but both height and distance are increasing, thus the relative load capacity goes higher. (d) Still lifting in the same position, but now the lifting direction is across the undercarriage, and thus the relative load capacity goes even higher. Note that both numbers and percentages here are used for giving examples only.

Figure 11.
A generic warning that only appears when an accident is imminent to occur.

Figure 12.
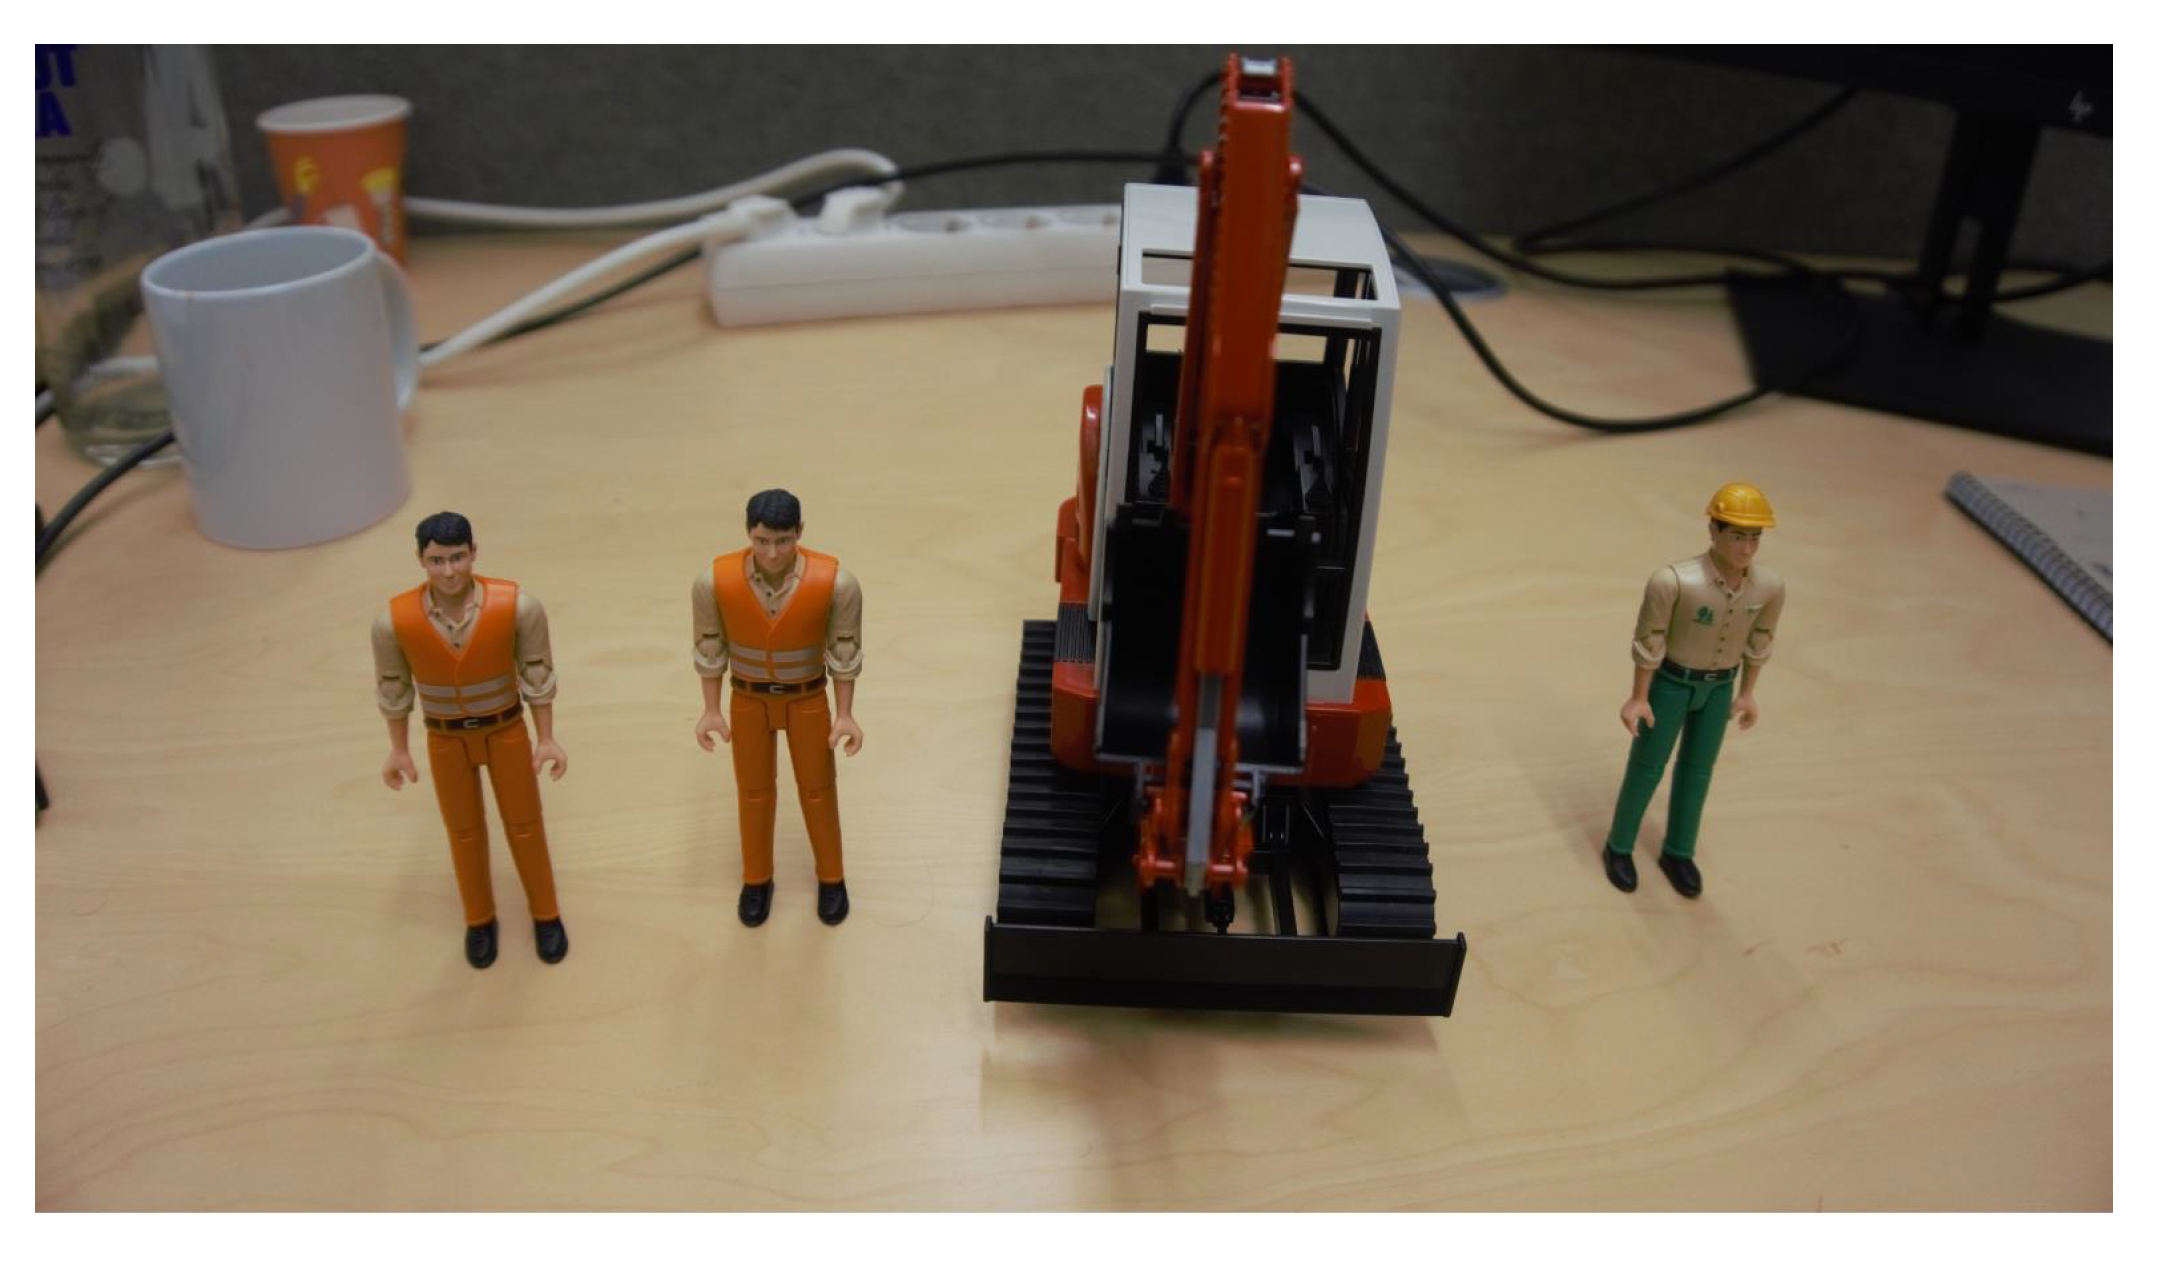
The toys that were used to visualize the logic behind the proposed concepts, as well as to test the operators’ understanding on the proposed concepts. In this study, the human toys were used as a representation of obstacles that may exist around the machine.
Figure 12.
The toys that were used to visualize the logic behind the proposed concepts, as well as to test the operators’ understanding on the proposed concepts. In this study, the human toys were used as a representation of obstacles that may exist around the machine.

Figure 13.
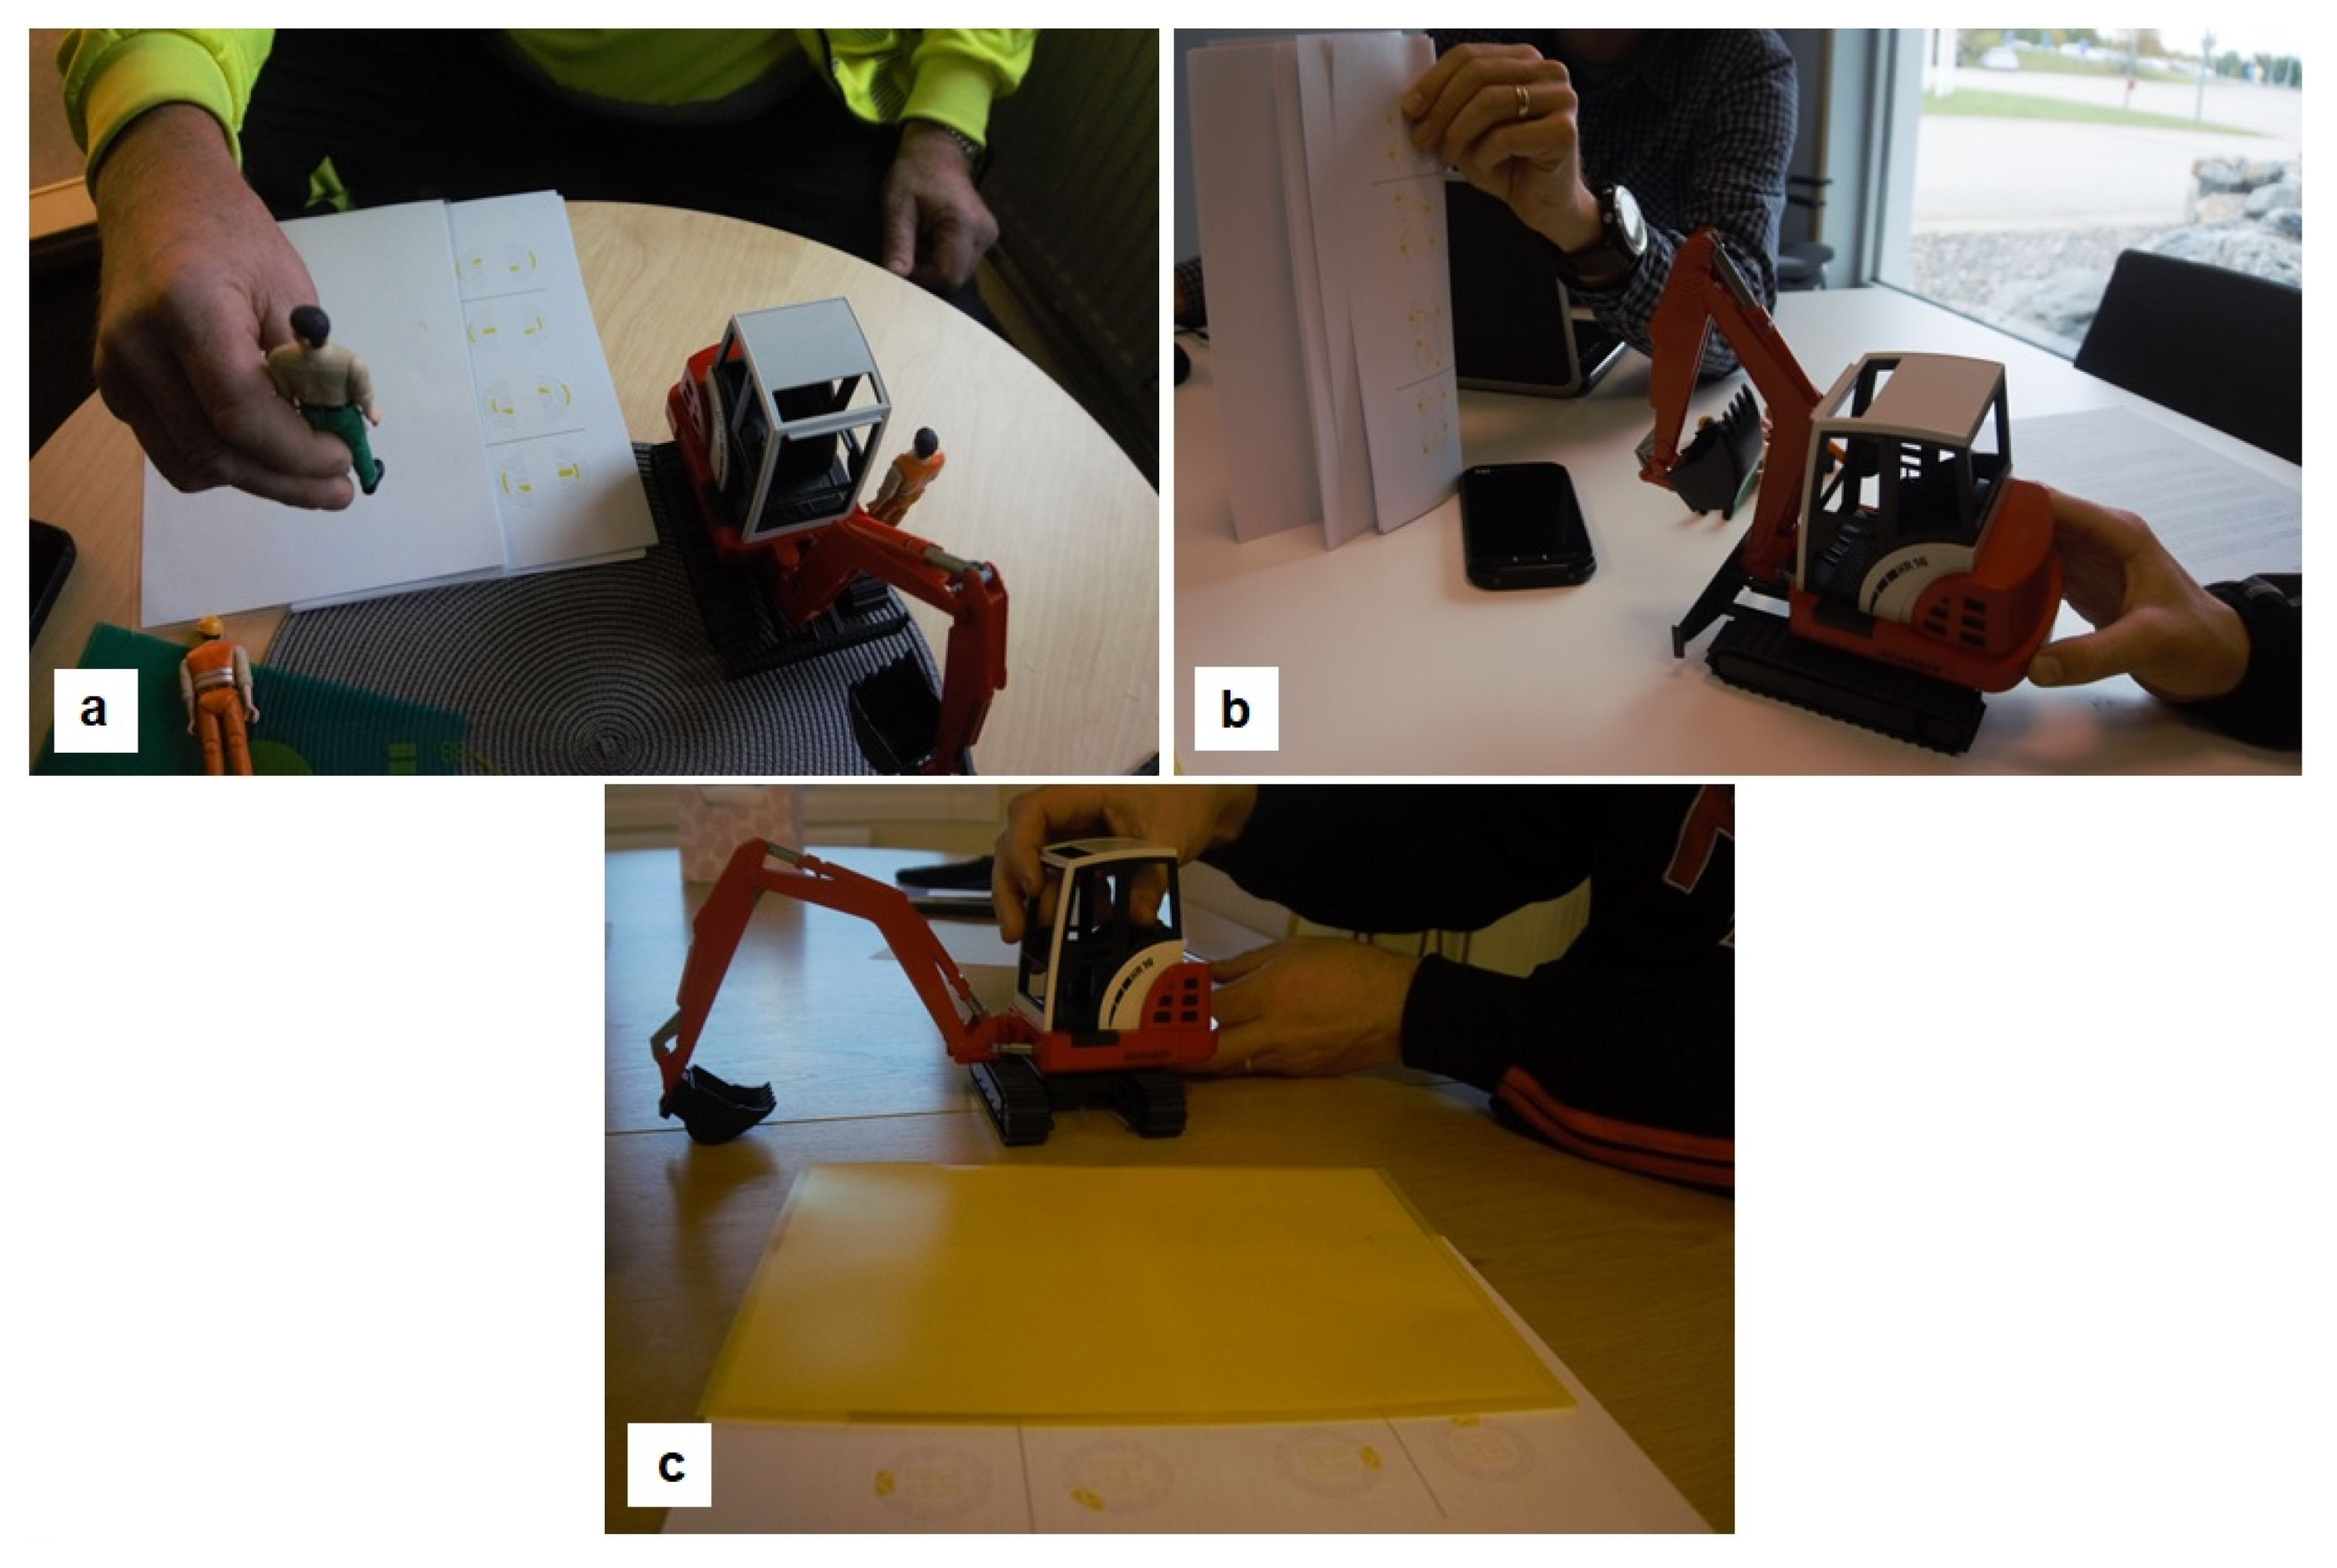
Some images that show how the evaluation was conducted. (a) The operators had to move the human toys to where the obstacle(s) is supposed to be based on the shown visualizations. (b) The operators had to tilt the excavator toy according to the shown visualizations to indicate the changing balance. (c) The operators rotated the undercarriage according to what is shown on the papers.
Figure 13.
Some images that show how the evaluation was conducted. (a) The operators had to move the human toys to where the obstacle(s) is supposed to be based on the shown visualizations. (b) The operators had to tilt the excavator toy according to the shown visualizations to indicate the changing balance. (c) The operators rotated the undercarriage according to what is shown on the papers.

Figure 14.
These images illustrate the different ways of thinking between the designers who created the concept and the operators who used the concept. As illustrated in the left image, We previously described that when the same segments on both sides are turned on, then it means the obstacle is exactly in the front of or behind the machine. As shown in the right image, the operators thought that this visualization means that there are two obstacles behind the machine.

Figure 15.
The proximity warning concept that has been revised by rearranging the areas that are represented by each segment, as shown in the top-left image, and removing the segments that indicate the obstacle’s altitude in order to avoid confusion. The inner, middle, and outer segments respectively indicate something that exists near (within 1 radius of the machine), medium (2 radii), and far (3 radii) from the machine. (a) There is an obstacle near rear left of the machine. (b) There is a far obstacle in the front left of the machine. (c) There is a far obstacle exactly behind the machine. (d) There are two obstacles on both left and right sides of the machine, but this concept no longer indicates the altitude of the obstacles.

Figure 16.
The revised concept of center of gravity. Note that the segment in the center of the concept, which indicates if the machine is in a stable position, has been removed. The left image shows that when the machine is in a stable position, all segments are turned off. As shown in the right image, one of the segments will be turned on only when the machine started to tilt.

Figure 17.
The meaning for each component in the relative load capacity concept that has been revised.
Figure 17.
The meaning for each component in the relative load capacity concept that has been revised.

Figure 18.
Two kinds of the warning sign. The left one is for when a collision is imminent to occur and the right one is for when the machine is about to tip over.
Figure 18.
Two kinds of the warning sign. The left one is for when a collision is imminent to occur and the right one is for when the machine is about to tip over.

Figure 19.
These images illustrate which visualization concepts that the operators preferred to have and where the information should be presented on the windshield. All the operators included at least three visualization concepts to be presented on the windshield. Note that the visualization concepts shown here are the ones before we revised them.


Table 1.
The profiles of excavator operators that we interviewed.
| No | Age | Status | Experience | Excavator Sizes | Knowledge on Head-Up Displays |
|---|---|---|---|---|---|
| 1 | 22 years old | Professional | 5 years | 14–65 tonnes | Has tried one in a car |
| 2 | 40 years old | Professional | 2 years | 1.5–75 tonnes | Has tried one in a car |
| 3 | 43 years old | Professional | 5 years | 5–25 tonnes | Has no knowledge |
| 4 | 53 years old | Hobbyist | 11 years | 1.1 tonnes | Has tried one in a car |
| 5 | 58 years old | Professional | 34 years | 14 tonnes | Has seen one, but never tried |
| 6 | 64 years old | Professional | 50 years | 1.5–95 tonnes | Has seen one, but never tried |
| 7 | 39 years old | Professional | 5 years | 1.5–30 tonnes | Has tried one in a car |
Publisher’s Note: MDPI stays neutral with regard to jurisdictional claims in published maps and institutional affiliations. |
© 2020 by the authors. Licensee MDPI, Basel, Switzerland. This article is an open access article distributed under the terms and conditions of the Creative Commons Attribution (CC BY) license (http://creativecommons.org/licenses/by/4.0/).
Share and Cite
MDPI and ACS Style
Sitompul, T.A.; Wallmyr, M.; Lindell, R. Conceptual Design and Evaluation of Windshield Displays for Excavators. Multimodal Technol. Interact. 2020, 4, 86. https://0-doi-org.brum.beds.ac.uk/10.3390/mti4040086
AMA Style
Sitompul TA, Wallmyr M, Lindell R. Conceptual Design and Evaluation of Windshield Displays for Excavators. Multimodal Technologies and Interaction. 2020; 4(4):86. https://0-doi-org.brum.beds.ac.uk/10.3390/mti4040086
Chicago/Turabian StyleSitompul, Taufik Akbar, Markus Wallmyr, and Rikard Lindell. 2020. "Conceptual Design and Evaluation of Windshield Displays for Excavators" Multimodal Technologies and Interaction 4, no. 4: 86. https://0-doi-org.brum.beds.ac.uk/10.3390/mti4040086