Article

Understanding the Headless Rider: Display-Based Awareness and Intent-Communication in Automated Vehicle-Pedestrian Interaction in Mixed Traffic

1
Center for Technology Experience, AIT Austrian Institute of Technology, 1210 Vienna, Austria
2
Center for Human-Computer Interaction, University of Salzburg, 5020 Salzburg, Austria
*
Author to whom correspondence should be addressed.
Multimodal Technol. Interact. 2021, 5(9), 51; https://0-doi-org.brum.beds.ac.uk/10.3390/mti5090051
Submission received: 16 February 2021 / Revised: 14 June 2021 / Accepted: 17 June 2021 / Published: 31 August 2021
(This article belongs to the Special Issue Interface and Experience Design for Future Mobility)

Abstract

:
Automated vehicles do not yet have clearly defined signaling methods towards other road users, which could complement natural communication practices with human drivers, such as eye contact or hand gestures. In order to establish trust, external human–machine interfaces (eHMIs) have been proposed, but so far, these have not been widely evaluated in natural traffic contexts. This paper presents a user study where 30 participants interacted with a functional display-based visual eHMI for an automated shuttle in mixed urban traffic. Two distinct features were investigated: the communication of (1) its awareness of different obstacles on the road ahead and (2) of its intention to start or to brake. The results indicate that the majority of participants in general regarded eHMIs as necessary for automated vehicles. When reflecting their experience with the eHMIs, about half of the participants experienced an increased comprehension and safety. The combined presentation of obstacle awareness and vehicle intentions helped more participants to understand the shuttle’s behavior than the presentation of obstacle awareness only, but fewer participants regarded this combination of awareness and intent to be safe. The strength of the found effects on subjective responses varied with regard to age and gender.

1. Introduction

Automatically driving vehicles (AVs) are neither an idea from science fiction, nor are they a vision for our far future anymore. The development of such “headless riders” is so advanced that they have already been introduced on public test tracks in several European cities [1]. One challenge for AVs and human road users is the change of communication culture in traffic situations: where once a human driver sat, making his or her awareness of other road users and intentions clear through explicit cues such as eye contact, facial expressions or gestures [2], there is now no one behind the windshield of an automated vehicle to communicate with. The different social communication practices that people are used to when moving and negotiating their way through traffic thus need to be transferred into appropriate forms of human–technology communication [3]. Previous research has recommended that automated vehicles should continually communicate the state and awareness of a vehicle, such that other traffic participants can develop an understanding on a case-by-case basis on when to rely on their behavior and when to remain more cautious [4,5]. If this form of trust calibration in different traffic situations can be established over a longer period of time, this is expected to result in overall trust in a system [6]. By contrast, as long as no new means of communication are established and deemed trustworthy, the permeation of traditional traffic with AVs therefore carries the risk of strongly decreasing feelings of safety for both AV passengers [7,8] and other road users (ORUs) and therefore leading to a societal rejection of the new technology [9].
The external communication of AVs is likely to play a crucial role in establishing trust and averting large scale rejection: the occurring lack of information about what the vehicle is aware of and intends to do can be compensated through external human–machine interfaces (eHMIs), such as light or audio signals, messages on displays which are installed on AVs, or with the help of laser projections on the street. Even though various studies have shown that external communication can promote other road users’ (ORUs’) sense of safety and trust [10,11], there is no consensus on whether or not such eHMIs are necessary for pedestrian–AV interaction or merely nice to have. Some studies (Clamann et al. [12] and Li et al. [13]) could find little added value in the AV’s external communication (e.g., in exceptional situations such as during the night) or none at all, as only a vanishing percentage of their participants included the proposed eHMIs in their decision-making processes.
As almost all prior studies in this subject were conducted in virtual reality, via wizard-of-Oz set-ups, or in an unrealistic, mostly non-mixed traffic setting [14]; in our study, we aimed to examine the effects of an AV’s external communication on pedestrians on a real road in mixed traffic. Hence, we determined the following first research question for our work.
RQ 1:
What are the overall effects of visual communication on pedestrians in real-world mixed traffic?
Prior studies and meta-analyses of approaches to eHMIs also demonstrate a wide variety of design prototypes and guidelines [14,15,16], yet there is no agreement on the ideal design and content used for eHMIs. These examinations also showed that visual communication design concepts were most prevalent. Thus, due to their ability to transmit complicated messages in a simple, easily understandable manner, visual eHMIs appear to be particularly suitable for the external communication purposes of AVs. Considering the information provided on the eHMI, specifically, awareness and intent communication seem promising to compensate for the lack of eye contact with and hand signals of a human driver. Due to the assumption of awareness communication alone not being sufficient to meet the ORU’s needs [11,17,18], most prior eHMI designs concentrated either on both awareness and intent or only the latter. In our study, we examined whether this assumption still holds under real, mixed traffic conditions. Thus, we specified our second research question as follows:
RQ 2:
Does the communication of intent complement the AV’s external awareness communication?
To answer these research questions, we developed a display-based awareness and intent communication prototype for an automated passenger shuttle bus. Furthermore, we examined its effects on especially vulnerable road users—pedestrians—after having been confronted with it in various crossing situations on a real road. We collected data with a questionnaire and conducted a semi-structured interview.
Contribution Statement. The contribution of this paper is twofold: firstly, we offer detailed observations on the influence of display-based external awareness and intent communication on pedestrians via the qualitative evaluation of in-depth interviews. Secondly, we examine—as one of the first—visual eHMI in the field in real mixed urban traffic, giving crucial insights on the real-world application of eHMIs.
The remainder of the paper is structured as follows: first, we introduce related work regarding existing approaches to eHMIs for automated vehicles. We then provide an introduction into the context of our study, which has been situated in a long-term living lab for automated shuttle operation and explain our eHMI’s content and design process. In the fourth section, we specify our sample of participants and the experimental design we chose to tackle our research questions. Eventually, we present and discuss the results of our study (Section 5) and discuss their implications (Section 6).

2. Related Work

Even though explicit communication with human drivers influences pedestrians’ behavior [19,20], there is no consensus with regard to whether external human–machine interfaces can compensate for the lack of eye communication. Studies investigating this question have reported mixed results—eHMIs affecting ORU’s trust and perceived safety, thus specifically influencing crossing decisions (e.g., [10,20,21,22,23]) and pedestrians relying predominantly on implicit communication through the AV’s behavior, implying the low importance of eHMIs for pedestrians’ decision-making processes (e.g., [12,24,25,26]). This points to eHMIs as a promising option to increase trust in and acceptance of AVs, but not a carved in stone necessity.
Besides, there is a huge variety of design concepts and applied measures, but again, there is no consensus on best practice approaches of external communication. A variety of meta-analyses [10,14,15,16,17] approached this problem by examining and categorizing existing concepts in order to derive guidelines for further concept development and research in this field. They found that visual eHMIs, such as textual or symbolic displays, LED strips, or projections, are the most prevalent form of external communication due to their ability to convey difficult messages and interrelationships in a quickly understandable way. Even though some concepts combine visual communication with auditory (e.g., [27]) or tactile signals (e.g., [28]), inclusive designs for visually impaired people have so far received very little attention [15,29]. Besides the lack of inclusive designs, the variety of eHMI research also suffers from a scarcity of mixed traffic designs and real-world experimental settings [14,15]: due to the considerable challenge that is posed by designing, prototyping, evaluating and conducting real-world mixed traffic AV studies, typically, most eHMI research took place in less realistic mixed traffic settings or simulated VR or Wizard-of-Oz settings, in which traffic was assumed to be only autonomous (e.g., [29]). There are very few explorations of mixed traffic, such as the one by Mahadevan et al. [28], which are still limited to a simulated VR environment. The lack of real-world mixed traffic investigation leaves a major research gap, which we approached with this study on real roads in Vienna, Austria.
Thus far, various concepts of visual external communication have been developed to compensate for the lack of interaction with the human driver. Schieben et al. [16] categorized these into four groups of displayed messages: (1) information about the AV’s driving mode in order for pedestrians to distinguish between the vehicle driving autonomously or being steered by a human operator; (2) information about the AV’s intended next actions; (3) information about the AV’s perception, i.e., pedestrians are shown what the AV has detected in its environment; and (4) precise instructions for the pedestrians, telling them explicitly to walk or stop. In our study, we focused on the categories 2 (intent information) and 3 (awareness information).
Even though conducted studies conclude that any kind of information provided is preferred to no external communication at all, there is no agreement on which type of message fits the needs of pedestrians best [11,17,23,30,31]. Meta analyses [14,15] show that the majority of work on visual eHMIs is dedicated to awareness and intent communication, as these are very similar to significant cues pedestrians obtain from human drivers, such as eye contact or hand signs [28]. Thus, pedestrians receive necessary information (Did the AV recognize me? Does it yield?) to decide whether it is safe to behave in a certain way, which was why we decided to focus on these two types of information. In order to assess how these types of information are seen by the pedestrians themselves, we furthermore examined the factors predictability and comprehensibility of the eHMI in our study design.
Pedestrians’ trust, another crucial variable for eHMI research and the introduction of autonomous traffic, can, however, once fully developed, also turn into overtrust, which characterizes a potential drawback of such artificial cues [4,20]. Holländer et al. [4] defines overtrust as the “false estimation of the risk while interacting with a machine” (p. 212), which can appear as an underestimation of the system’s overall propensity to provide incorrect information in any given situation, leading to potentially dangerous consequences in traffic. Despite the fact that establishing trust in AVs and their external communication measures appears to be the main challenge in the introductory phase of autonomous traffic [32], the development of overtrust remains an important aspect to be considered in eHMI design and execution. For this reason, we decided to explore both sense of safety and trust in the communication as relevant factors.

3. Project Context and Experimental Prototype

3.1. Project Context

As part of the research projects auto.Bus-Seestadt [33] and Drive2TheFuture [1], a novel bus line with two automated shuttles has been operating in Vienna, Austria since June 2019. The aim of the research is to sustainably increase the efficiency and operational safety of automated vehicles by evaluating the operation of automated shuttles in an urban area under real-life conditions, that is, in mixed traffic. The Navya Armi shuttles [33] are equipped with eight LIDAR sensors (two of which are 3D-LIDAR) as well as a GNSS, odometer and an acceleration sensor. In addition, they had cameras installed, which did not influence the operational algorithms, but served for additional experimental purposes, such as a functional display-based awareness and intent communication. The shuttles drove automatically (at an SAE level of 3 [34]), but an operator seated inside intervened in cases of operational or safety issues. The pilot site was embedded in an innovative residential area in the northeast of Vienna, providing an urban environment with a variety of different other road users, yet less complex routes than in the city center. There, the automated shuttles functioned as bus line of the public transport system: they drove according to a timetable and brought passengers to specified stops. Our research took place in the framework of this pilot site, using the two automated shuttles and the operating bus line to assess our functional awareness and intent communication prototype.

3.2. Communicating Awareness and Intent

As a legal necessity for the use in mixed traffic, the automated shuttle (AS), which is shown in Figure 1, was equipped with an interior LCD display for the operator. This display provided continuous information on the current driving mode (automated or manual). In addition, an audio signal was given whenever the shuttle approached an obstacle. The audio signal—the sound of a bell—was similar in its functionality to common parking aids in cars, which made it easily interpretable for other road users. However, unlike parking aids, it did not adapt its frequency to the distance of the obstacle, but it constantly repeated the sound signal approximately once per second as long as the obstacle was detected to be in reach.
The focus of our study was to develop and test an eHMI for pedestrians in a natural mixed traffic environment. We decided to focus on the communication of the AS’s awareness and intent, because they promise to carry the same amount of information as informal communication with human drivers, while also reducing the risk of other, non-participating road users getting confused or misled. In addition, as the test route was located in a low traffic residential area of Vienna, we focused the awareness communication on the three most common types of road users in this area—pedestrians, cars and bikes—and the intent communication on the two most significant actions for pedestrians—braking and starting.

3.3. Design of Visual eHMI Prototypes

The visual eHMI available in the automated shuttle was a 38″ LCD display in the interior of the bus at the upper end of the front windshield (see Figure 1). The screen location had been defined and certified by the bus manufacturer upon delivery of the shuttle, because it was considered an established spot for external communication in passenger busses (e.g., to inform about direction and route number). Furthermore, this location met the important requirement not to hinder the operator’s view to the outside road situation. The creation of the screen designs was based on those three design elements that seemed most promising for the given purpose, based on the reviewed literature [35]: text and icons for both awareness and intent communication and an augmented reality view (AR—the augmented reality (AR) view refers to the technology of “augmenting” the AS’s visual perception of its environment with digital information being superimposed. In this study, the digital information is the AS’s awareness, which is represented by a frame around the perceived object or road user) only for the former. All three of these design elements had shown complementary strengths and weaknesses with regard to cultural dependability, cognitive workload, and the simplification of complex causal relations [35]. Besides, this, we examined the effect of color on the comprehensibility and visibility of the communicated message. In order to facilitate understanding by employing familiar color codes, we used the common traffic light colors red, yellow, and green for the background.
In order to pre-select the representative designs for communicating awareness and intent for the experiment, we conducted an expert-based assessment. Four expert reviewers already familiar with the project evaluated the designs, according to their visibility and comprehensibility in different conditions. In the first part of this assessment, the designs were displayed by the AS located in a covered garage, not moving and viewed from different angles. It was found that the LCD display reproduced colors differently from one viewing angle to another: while the dark orange background was visible as such from the front, it revealed a strong green shimmer when looked at from the left and right and could no longer be distinguished from the dark green background. The same applied to the dark red background, although the shimmer was less pronounced. Therefore, designs with a dark-colored background and white symbols were excluded. The light-colored backgrounds were hardly distinguishable from the white background, but made the black writing less visible, which is why these were also excluded. Based on a consensus of the expert reviewers, the designs with white font on a black background and black font on a white background were retained for further consideration.
Subsequently, these preselected designs were assessed in daylight with and without direct sunlight, while the shuttle was driving on its real road test track. It became clear that the AR view was only visible for the participating colleagues when the bus was very close and driving at an extremely low speed. Furthermore, the consensus of the expert reviewers was that this design required more time to be comprehended than the iconic and textual designs; thus, the designs including an AR view were eliminated. Additionally, the experts reported that the designs with the white background and black icons and letters were more vulnerable to reflections on the windshield and therefore, were less visible. Additionally, participants acknowledged strong preferences towards the iconic awareness representation and textual intent communication, as this combination appeared to be the easiest and fastest to comprehend. Table 1 shows the resulting final awareness and intent communication designs to be used for the experiment.

3.4. Functional backend Implementation of the Awareness and Intent Communication

The sensing capabilities for the awareness and intent communication were functionally implemented, as an additional component to the shuttle’s standard automated driving functions. No systems or APIs of the Navya Armi vehicle itself were used, with the exception of the screen. All required sensors and hardware were added to the standard vehicle setup and solely used for demonstration and study purposes. The sensing component consisted of a multi-camera system fitted to the windshield, generating a continuous 1.3 MP image stream for the object detector. In order to support real-time execution on an embedded device, a single stage detector was selected. This detector was based on RetinaNet [36], which consisted of three independent parts to allow for fast adaptations of the neural network. To detect essential navigation cues and dynamic scene elements on or nearby the road, the following target object classes were taken into consideration: car, truck/bus, pedestrian, biker, traffic light and traffic sign. Two open source datasets were aggregated to train the mode and the target dataset were filtered to balance the classes within the dataset to avoid overfitting. Due to space and power constraints inside the test vehicle, an Nvidia Jetson Xavier module was used, and its TensorRT SDK [37] was used to run RetinaNet on the Deep Learning Accelerator function engine. The cameras were directly connected to the module via a PoE (Power over Ethernet) extension card, in order to achieve optimized image data transmission time. The onboard sensor system also included an IMU (inertial measurement unit) that provided acceleration measurement in the driving direction. A moving-average-filter and a threshold were applied to the signal, to determine vehicle braking and accelerating. The measured latency of this signal was less than 200 ms.
The detection results and acceleration state were subsequently transmitted to the user interface via websockets. On average, the total glass-to-glass latency for the displayed results was 250 ms. A Raspberry PI 4 was responsible for rendering the images shown in Table 1. The detection data, sent via websockets from the Nvidia Jetson, consisted of multiple bounding boxes formatted as a JSON array. The bounding boxes of the detection can be seen in Figure 2, where they are overlaid onto the image used by the detection. As the detection consisted of multiple bounding boxes and categories, and as only one road user could be shown at a time on the awareness display, a ranking was required. Pedestrians were ranked above bicycles and bicycles above cars. Thus, if all three road users were detected, only the detected pedestrian was shown on the awareness display. Other items that the neural network was capable of detecting were not displayed. In order not to highlight every possible detection, a threshold was set to prevent uncertain classifications from being displayed. This supported the display prioritization of close and clearly recognized vehicles over distant pedestrians.
The acceleration data sent to the user interface consisted of braking and acceleration events which were displayed as “start” and “stop” events. As the events were calculated from IMU values, the braking was only shown when the bus decelerated fast enough for the algorithm to detect it as a dedicated braking. To control the eHMI, a web app was used which was connected to the Raspberry PI 4 via Blueooth. It enabled the study conductor to select between the awareness communication display (TCA) and the awareness and intent communication display (TCA-I).

4. Method

4.1. Study Participants

The study was run as a field experiment during three weeks in August 2020. We recruited participants using contact data from the institute’s database, offering EUR 35 as a remuneration. Striving for a balanced distribution of sample characteristics with regard to age, gender and technology openness, we allocated a total of 30 people (16 female, 14 male) aged between 23 and 72 years (M = 42.50, SD = 15.07) to the study. More than two thirds of the participants (21 participants, 70%) ranked themselves as being in the midfield when trying out new technological products and seven participants (23.3%) considered themselves to be under the first. All participants had already heard of automated vehicles. Only one participant lived in the area of the test track and thus, already had in-depth experience with the AS prior to the study.

4.2. Experimental Design

Whereas all participants experienced one way without external communication (Control Condition, CC) and one way with external communication by the automated shuttle, half of them were confronted with test condition one (TCA)—only awareness communication—and the other half with test condition two (TCA-I)—awareness and intent communication. The assignment of participants to the respective test group was determined by the creation of a balanced age and gender ratio, in order to avoid biases and possibly identify gender- or age-related factors that may influence the results. The order of control and test condition was randomized for each participant. Through the choice of the described mixed design, as well as assignment to and order of the conditions, we ascertained the comparability of the conditions, avoiding order effects and biased results due to participants’ characteristics. Detailed information about the allocation of participants to the distinctive groups is provided in Section 5.
We hypothesized that through external communication, the AS behavior would be more comprehensible, thus its actions easier to predict for the participants. Furthermore, we expected that through the increased understanding the participants’ sense of safety, their trust in the new technology would also increase. Additionally, we assumed that the more information participants obtained through the external communication, the stronger the above effects would appear. Therefore, we anticipated that participants who experienced both awareness and intent communication in TCA-I would show a higher increase in the understandability and predictability of the shuttle behavior as well as in their sense of safety and trust, as compared to test conditions in which they were only confronted with awareness communication (in TCA).

4.2.1. Test Track and Procedure

After having been welcomed and introduced to the study and procedure by the instructor, each participant had to take a 500 m walk along the pilot site of the automated shuttles twice—back and forth (see the marked path in Figure 3).
On their way along the test track, participants experienced four situations in which they were instructed to cross the street. Half of these situations took place at crosswalks, one at a blind corner and one on straight track—situations in which pedestrians usually rely on informal communication. On their way back, they experienced similar situations. Each participant experienced the control condition and one of the two test conditions. The conditions changed on each way and the conditions’ order varied from participant to participant. After each condition, participants filled out the questionnaire. The walk was followed by the recorded interview of the participants, in which they were asked to go into more detail about their experiences and decision-making processes. Thus, the study included two forms of data collection: quantitative data acquired from a questionnaire and qualitative data from a semi-structured interview.
At the time of conduction of the study, COVID-19 countermeasures were put in place, in accordance with national legal regulations at that time. The policy set for the study was to keep a minimum distance of 1.5 m between two people and to wear a mask. The interviews were conducted outside on benches around the area, and therefore, in a well-ventilated environment. Participants were informed verbally about these countermeasures and potential contact tracing in case of a later COVID-19 infection. The only physical exchange between participant and facilitator was the consent form signed by each participant. Here, a disinfectant was provided and used after filling out the document.

4.2.2. Questionnaire

The questionnaire, which is shown in Table 2, consisted of five parts: in the first part, participants were asked to provide demographic information, but also assessed their transportation usage and prior experience with automated vehicles. In the second part, participants had to classify the interaction with the automated bus between two contrasting attributes such as complicated or uncomplicated, easy to learn or difficult to learn and clear or confusing, on a seven-point Likert scale. In the third part, participants answered questions concerning their ability to predict and understand the automated bus’s behavior and their sense of safety on a seven-point Likert scale ranging from “never” to “always”. Participants had to fill out part two and three after each condition.
Solely after the test condition, participants had to answer the questionnaire’s fourth part, which was based on Dehn’s SHAPE Automation Trust index (SATI) [38]. The adjusted SATI questions served for assessing the difference of participants’ trust in the two types of external communication.

4.2.3. Semi-Structured Interview

The aim of the interview was to acquire profound insights into the perceptions and decision-making processes of the participants while being confronted with external communication of the AS. Thus, participants were asked whether the display-based communication influenced their behavior and their sense of safety, but also about their comprehension of the AS’s behavior. For each of these questions, they were requested to justify their opinion. Furthermore, participants shared their impression of the content and design of the display-based information. Moreover, participants were asked to evaluate whether the external communication of automated vehicles is necessary and which criteria it must fulfill. Subsequently, audio recordings were transcribed. Afterwards, we performed a qualitative content analysis using the software MAXQDA [39].
In the first phase of the analysis, we deductively developed an encoding system with six main categories(please see Appendix A. Interview Data, Table A1, Table A2, Table A3, Table A4, Table A5 and Table A6)—behavior (A1), sense of safety (A2), comprehensibility and predictability of the bus’s behavior (A3), necessity (A4), attitude (A5), evaluation (A6)—resembling the six interview questions. In the second phase of the analysis, two authors encoded ten interviews independently and developed subcategories inductively, i.e., in the process of encoding, marking exemplary statements for each subcategory. To determine a final encoding system, which is illustrated in Figure 4, subcategories and exemplary statements were jointly revised by the two authors, grouping together, or splitting identified subcategories, and examining the allocation of participants’ statements to these categories. In the third phase of the analysis, each interview was reviewed according to the determined encoding system.

5. Results

In order to address our research questions, we evaluated two different designs of eHMIs—one only with iconic awareness communication (TCA) and another with both iconic awareness communication and textual intent communication (TCA-I) with regard to the factors of trust, sense of safety, comprehensibility, and predictability. In this section, we first describe our findings on each of these four factors. We then describe further impressions that emerged from the detailed qualitative analysis of the interviews and that go beyond the originally addressed main factors in the experiment. This concerns the perceived influence of the eHMI on the behavior of our participants, in order to assess the general efficacy and value of the system from a pedestrian’s point of view. We also provide details on our participants’ opinions on our chosen communication design as well as requirements that should be addressed from their point of view, based on findings that arose from the qualitative examination of the results. Besides these qualitative results, we also include quantitative results from the questionnaire in the examination of the dependent variables, where applicable.
For each category, we first investigate differences between the conditions with (test condition, TC) and without the external display (control condition, CC). We then compare the results between the test condition groups with only awareness information (TCA: only one type of information) and both awareness and intent information (TCA-I: two types of information). Furthermore, Rasouli et al. [19] mentioned age and gender as influencing factors for the behavior of pedestrians and the way they pay attention in traffic, we decided to explore gender and age differences as well. This comparison was possible, as a balanced distribution of male and female participants across test conditions was a main criterion for sample recruitment. The distribution of the experimental between-subject test conditions and personal characteristics is provided in Table 3.

5.1. Sense of Safety and Trust in Communication

5.1.1. Quantitative Results

Participants reported their perceived sense of safety by rating their conformity with two statements (3.I and 3.II) on a seven-point Likert scale on our questionnaire. Participants who experienced TCA showed the same high conformity with the statement “I felt safe” in both control and test condition. These also showed an identical low conformity with the second statement (“I felt insecure when being confronted with the AS”) in both conditions. As shown in Table 4, also, participants who experienced TCA-I stated identical conformities with the two statements in the test and control condition.
Similarly, participants evaluated their trust in the external communication of the autonomous shuttle by rating their conformity with statements 4.I to 4.IV in the questionnaire. The only differences between conditions could be found in ratings of statements 4.I and 4.III: Participants of group TCA showed a slightly higher conformity with the statement 4.II, whereas these also showed a slightly lower conformity with statement 4.IV than group TCA-I. Yet, these differences were not statistically significant (see Table 5).

5.1.2. Qualitative Results

No clear tendency emerged in the answers concerning the effect on the sense of safety: two participants experienced a negative change in their sense of safety, fourteen participants reported to have perceived a positive one and the same amount, fourteen, reported not having experienced a change at all (see Figure 5).
The reason most often identified for the lack of change was that participants already felt safe due to the low speed of the AV and the assumption that it would adhere to the legal rules of conduct in road traffic, thus behaving similarly to a vehicle that is controlled by a human driver. The two participants who experienced a negative influence on their sense of safety ascribed this to a perceived divergence between the communication and the shuttle’s behavior: they referred to situations in which the display showed “bus brakes” in TCA-I or the pictogram of the pedestrian in TCA, but the AS appeared to maintain or increase its speed, which made them less reliant on the communication of the AV as an influencing factor in their reduced sense of safety.
Overall, nearly half of participants stated that external communication led to an increased sense of safety. They explained this positive effect by the improved understanding and anticipation of the shuttle’s behavior. Additionally, several participants stated that the indication on the shuttle’s screen about its awareness of them increased their trust in the appropriate reactions to their behavior. P18 reported that, “[…] it was a good feeling that the shuttle perceived me as an active road user, would take me into account, somehow react to my behavior. Thereby, it also increased my sense of safety.
Comparison between TCA and TCA-I. (see Figure 6) Even though the majority of participants who experienced TCA reported no influence of the communication on their sense of safety, the participants who did so, only reported a positive influence, which was mainly due to the sense of being noticed. Seven of the nine TCA participants who did not experience a change explained that they already had a strong sense of safety from the start of their usage.
More than half of the participants from TCA-I, namely eight of fifteen, reported an influence on their feelings of safety. Five of these eight perceived an increase due to being better able to predict and understand the AS’s behavior through the communication. The other three TCA-I- participants, equally often, namely twice, stated that the lack of comprehensibility of the eHMI and the divergence between the vehicle’s behavior and the display justified their decreased sense of safety.
Comparison between male and female participants. In both male and female participants, the overall ambivalent results are represented: Seven of thirteen male and seven of seventeen female participants perceived an influence on their sense of safety due to the external communication. This influence was perceived to be positive in almost all of these cases, namely by five of seven female and six of seven male participants. Five of these female participants explained their increased sense of safety by being better able to predict the AV’s behavior due to the communication. The reason for the increase most often mentioned by male participants was that they felt noticed by the AV through the communication.
Whereas all seven male participants stating not having experienced a change in their sense of safety justified that by them already feeling very safe from the beginning, four of nine female participants mentioned apart from this reason also that they purposely ignored the communication. These reported to have ignored the eHMI, because either they could not comprehend it or did not see an added value in using it.
Comparison between age groups. AG1 was the only age group in which more participants stated a perceived influence on their sense of safety than participants who stated to not have experienced one. The display-based communication increased the sense of safety in 60% of participants in this age group. In AG2, less than half of the participants, namely four of nine, experienced an influence. Only two of them reported an increase in their sense of safety, which for them was due to their sense of being noticed. In AG3, only one of five participants acknowledged an influence. This participant reported an increase in his sense of safety also due to their sense of being noticed.
In all age groups, the reason most often mentioned for not having experienced an influence on the sense of safety was that the participants already felt safe.

5.2. Comprehensibility and Predictability of the Shuttle’s Behavior

5.2.1. Quantitative Results

Participants reported the perceived predictability of the AS’s behavior by rating their conformity with the statement 2.I, “I was able to predict the AS’s behavior”, on a seven-point Likert scale in the questionnaire. As shown in Table 6, there was no increase in medium conformity with this statement in the test condition groups.
Furthermore participants stated their comprehensibility of the AS’s behavior by rating their conformity with the statements 1.I a–c and 1.II, which are stated in Table 6. Here, there was also no statistically significant difference between the control condition and test conditions to be found.

5.2.2. Qualitative Results

In the interviews, the majority of participants stated that the behavior of the AS became more comprehensible and predictable due to the communication (see Figure 7): “The external communication helps me to decide whether I can go. [The automated shuttle] is definitely better than a normal car that comes along and I don’t know whether it’ll brake for me or not. With the communication, I know that it brakes for me and that I can go” [P03]. Participants explained this by having received more information on the shuttle’s behavior and thus some feedback on their subjective impressions and predictions. Furthermore, participants stated that they felt noticed by the shuttle due to the external communication, which made it easier for them to establish the connection between the displayed information and their behavior. Thus, they were able to better assess the behavior of the shuttle.
Fourteen participants did not recognize a change in the comprehensibility and predictability of the AS’s behavior. For most of them, the shuttle’s behavior was already predictable and comprehensible due to their prior experience in traffic and existing rules of conduct in traffic. Eight of fourteen participants deliberately ignored the information on the display because it was not helpful or even confusing for them.
Regarding comprehensibility, seventeen participants found the external communication to be comprehensible, while twelve participants did not. The most problematic aspect in the light of comprehensibility was the iconic representation of the autonomous shuttle’s awareness. Participants found it particularly difficult to understand the meaning of the “sensor bars” drawn between the bus and the obstacle icon (see Table 1). These were, for example, misinterpreted as interactive distance or speed indicators. In addition to the iconic representation, the connection between the icons and the statements “bus brakes” and “bus starts” in TCA-I was also acknowledged as difficult to understand by six participants.
Comparison between TCA and TCA-I. (see Figure 8) Awareness and intent communication in TCA-I tended to be seen as helpful by the participants who experienced it, whereas this was not the case for the TCA participants who only received information on awareness: only six out of fifteen TCA participants, in contrast to ten out fifteen TCA-I participants, perceived the communication as helpful to understand and predict the behavior of the shuttle. For participants from TCA, both the reception of more information and the sense of being noticed seemed to be equally responsible for an increase in comprehensibility, while participants from TCA-I emphasized the former (more information) of these two reasons.
Five of nine participants in TCA who did not find the communication helpful for predicting the AS’s behavior stated that they purposely ignored the communication due to it not being comprehensible enough or confusing them. This was also the reason most often stated by TCA-I participants, namely by three of five, who did not experience a change in the comprehensibility of the AS’s behavior.
The number of participants from TCA who found the communication to be comprehensible and the ones who did not was balanced; namely, in both cases, seven of fourteen. In contrast, ten of fifteen participants from TCA-I found the communication not comprehensible.
Comparison between male and female participants. In the evaluation of comprehensibility, there are recognizable differences between the gender groups: only two of fifteen female participants found the communication to be comprehensible, as compared to ten of thirteen male participants. On the other hand, regarding predictability, only six out thirteen male participants perceived the communication as helpful for understanding and predicting the behavior of the AS. The reason for the eHMI not increasing the comprehensibility of the shuttle’s behavior most often mentioned by the male participants (five of seven) was that they purposely ignored it, because they did not see an added value in the information provided or because it confused them. By contrast, most of the female participants (ten out seventeen) found the communication helpful. The majority of these, namely eight of ten female participants, justified that by the increase in provided information about the shuttle.
Comparison between age groups. Ten of fifteen participants aged between 20 and 39 years (AG1) experienced a positive effect on their understanding of the AS’s behavior. The majority of them, namely seven, explained that by the increase in information on the shuttle which was available through the eHMI. In AG2, slightly more than half of the participants—five of nine—indicated the communication as helpful for comprehending the AS’s behavior. Three of these five participants stated “more information” as a reason. The biggest contrast persists in AG3: here, only one participant reported a positive effect, which was due to more available information on the shuttle’s behavior. The reason most often stated for the shuttle’s behavior not becoming more comprehensible, namely by three of five AG3 participants, was that they purposely ignored the eHMI.
Nine of fourteen participants in AG1 and five out of nine in AG2 criticized the communication’s comprehensibility. In AG3, half of the participants, namely three, found the communication not to be comprehensible.

5.3. Further Impressions

To better assess the perceived effectiveness of eHMIs in general as well as our specific implementation, we asked our participants about their impressions and reflections on various related topics. By this means, we strived to come towards a more comprehensive understanding of factors that may have influenced their ratings regarding the four dependent variables of sense of safety, trust in communication, predictability and comprehensibility. A further motivation for this further inquiry was to gain knowledge on how to best improve our design. For this purpose, we asked our participants whether they had experienced any change in their behavior due to the eHMI, how they perceived the necessity of eHMIs in general, if (and how) their attitude towards AVs had changed due to the study, and on how the communication design used in the study could be improved.

5.3.1. Perceived Behavior Change

In order to better assess the perceived effectiveness of eHMIs, we asked our participants whether they felt that the external communication had influenced their behavior (see Figure 9). In the interviews, fourteen participants acknowledged a change in their behavior due to the external communication, while sixteen did not. The latter gave four different reasons for the lack of behavior change, of which the by far most frequently mentioned one was that other aspects, such as the speed of the automated shuttle or the distance to it, were more important than the external communication for their behavioral decisions.
Five of the fourteen participants who reported an influence on their behavior identified a negative change in the form of an experienced mental overload or an increased reaction time. Nearly twice as many participants, namely nine, reported a positive influence on their behavior. Almost all of them explained this positive change in a similar manner as P02: “With the communication it was notably easier for me to anticipate how the shuttle would interact and how I could react”.
Comparison between TCA and TCA-I. (see Figure 10) While only three participants from TCA reported to have been influenced in their behavior, ten participants from TCA-I did so. Seven of these TCA-I participants acknowledged a positive influence, such as a decreased reaction time and more adjusted responses to the AS’s behavior. Two of three TCA participants also experienced a positive influence. Ten of twelve TCA participants, who reported no influence on their behavior, justified the lack of influence like P25: “I think I primarily paid attention to the speed of the bus. And if I had the feeling that it was slowing down, I crossed. […]. The screen was just like a nice addition.
Comparison between male and female participants. Only four of thirteen male participants as opposed to nine of seventeen female participants experienced an influence of the communication on their behavior. Yet, if a male participant experienced one, it was solely reported as being positive, i.e., either reaction times were recognizably decreased, or they were able to adjust their behavior successfully to the AS’s actions. Thus, no male participant experienced a negative influence. In contrast, five of nine female participants reporting an influence considered it to be negative. When male participants stated that they did not experience an influence on their behavior, nine of ten explained it by other aspects being more important. The majority of female participants who did not experience an influence, namely four of seven, stated the same reason.
Comparison between age groups. AG1, which entails participants aged between 20 and 39 years, is the only age group in which more participants, namely eight of fifteen, reported an influence on their behavior due to the communication than not. Six of these eight reported a positive influence, which was mainly expressed by a behavior that was better adjusted to the shuttle’s actions.
In AG2, four of nine participants experienced an influence. Similar to AG1, in AG2, the majority of the participants who experienced a change in their behavior, namely three of four, considered it to be positive.
In contrast to AG1 and AG2, in AG3, only one participant reported an influence and considered it to be negative. The other four participants of AG3 who stated they did not experience an influence on their behavior, justified that by other aspects being more important. In AG2 and AG1, “other aspects” were also the most frequently mentioned reason for the lack of an influence.

5.3.2. Necessity and Influence of External Communication in Automated Vehicles

After discussing the perceived behavior change by the tested communication design, we also examined our participants’ perceived need for external communication in automated vehicles in general. Interestingly, the vast majority of participants considered some form of external communication, be it auditory or visual, as necessary (see Figure 11). Most often, namely by seven participants, this necessity was justified by the fact that they felt noticed due to the communication and received the impression that the shuttle reacted to their behavior, leading to an increased sense of safety. P05 described this experience as follows: “Well, this [the display-based communication in the windshield] might even be equivalent to looking a bus driver in the face and he somehow gives the hand signal, you can cross or not.” Further, multiple participants argued for the necessity of communication, that facilitates additional information about the shuttle’s behavior, which can then enable traffic participants to take informed decisions.
Most participants who rated the communication to be helpful but not necessary based this judgement on the potential of an increased subjective sense of safety, but no actual need for it in mixed traffic.
Five participants considered external communication to be unnecessary. They argued that the communication did not provide a substantial increase in information and that other aspects of the traffic flow, such as the distance to or the speed of the vehicles, were more important for the participants’ decision processes.
Concerning the necessity of AV communication for different types of road users, thirteen participants argued against gradations in need while the rest made gradations between pedestrians’, bicyclists’ and car drivers’ need, indicating the biggest need for external communication of AVs on the pedestrians’ side.
In addition, twenty-five of thirty participants identified six requirements that the external communication of AVs has to fulfill in order to meet the road users’ needs: easy and quick comprehensibility, conspicuousness, good recognizability of the display and design, inclusivity via perceptibility through various senses, synchronicity of the communication and the AV’s behavior, uniformity, and the avoidance of disturbing signals.
Comparison between TCA and TCA-I. Results concerning the perceived necessity of external communication are similar in both test condition groups. In both groups, the majority of participants (twelve of fifteen in TCA and thirteen of fifteen in TCA-I) considered the communication to be necessary or at least helpful (see Figure 12). An interesting difference could be found in the evaluation of the necessity of communication for different types of road users: whereas most participants in TCA did not see different needs according to road user types, most of the participants in TCA-I did. Both groups perceived pedestrians as showing the strongest need. In both groups also, the most mentioned criteria external communication has to fulfill were “comprehensibility” and “recognizability/conspicuity”.
Comparison between male and female participants. The vast majority of participants of both genders considered external communication as necessary or at least helpful (fourteen of seventeen female participants and eleven of thirteen male participants). A slight difference can be found in the justifications for the eHMI’s necessity: five of eight female participants who considered the eHMI to be necessary for AVs, explained this by the feeling of being noticed it creates on the side of pedestrians. For four of nine male participants, and with that the prevalent reason, the increase in accessible information on the shuttle was the most important aspect. Another difference could be found in the evaluation of need of communication for different types of road users, as ten of seventeen female and only four of thirteen male participants differentiated in necessity. Here, again, pedestrians were identified in both gender groups as showing the strongest need. Moreover, the criterion most often mentioned in both gender groups was identical, namely the recognizability/conspicuity of the eHMI.
Comparison between age groups. Half of the participants in AG3 saw external communication as necessary or at least helpful. The main reason given was a compensation for the lack of audio information due to the shuttle being an electric vehicle. In age groups 1 and 2, there was only one person each who did not consider external communication to be necessary or at least helpful. In AG2, about 45% of the participants considered external communication to be necessary and in AG1, 79%. Whereas most participants from AG1 explained the perceived necessity with the feeling of being noticed, most participants from AG2 referred to the increase in information about the AS’s behavior. Whereas most participants of AG2 and AG3 clearly identified the biggest need for communication in pedestrians, statements of participants from AG1 were balanced between pedestrians and bicyclists. Furthermore, participants from AG1 emphasized the importance of recognizability and comprehensibility, similar to participants from AG2. In contrast, no participant of AG3 stated a specific criterion the communication has to fulfill.

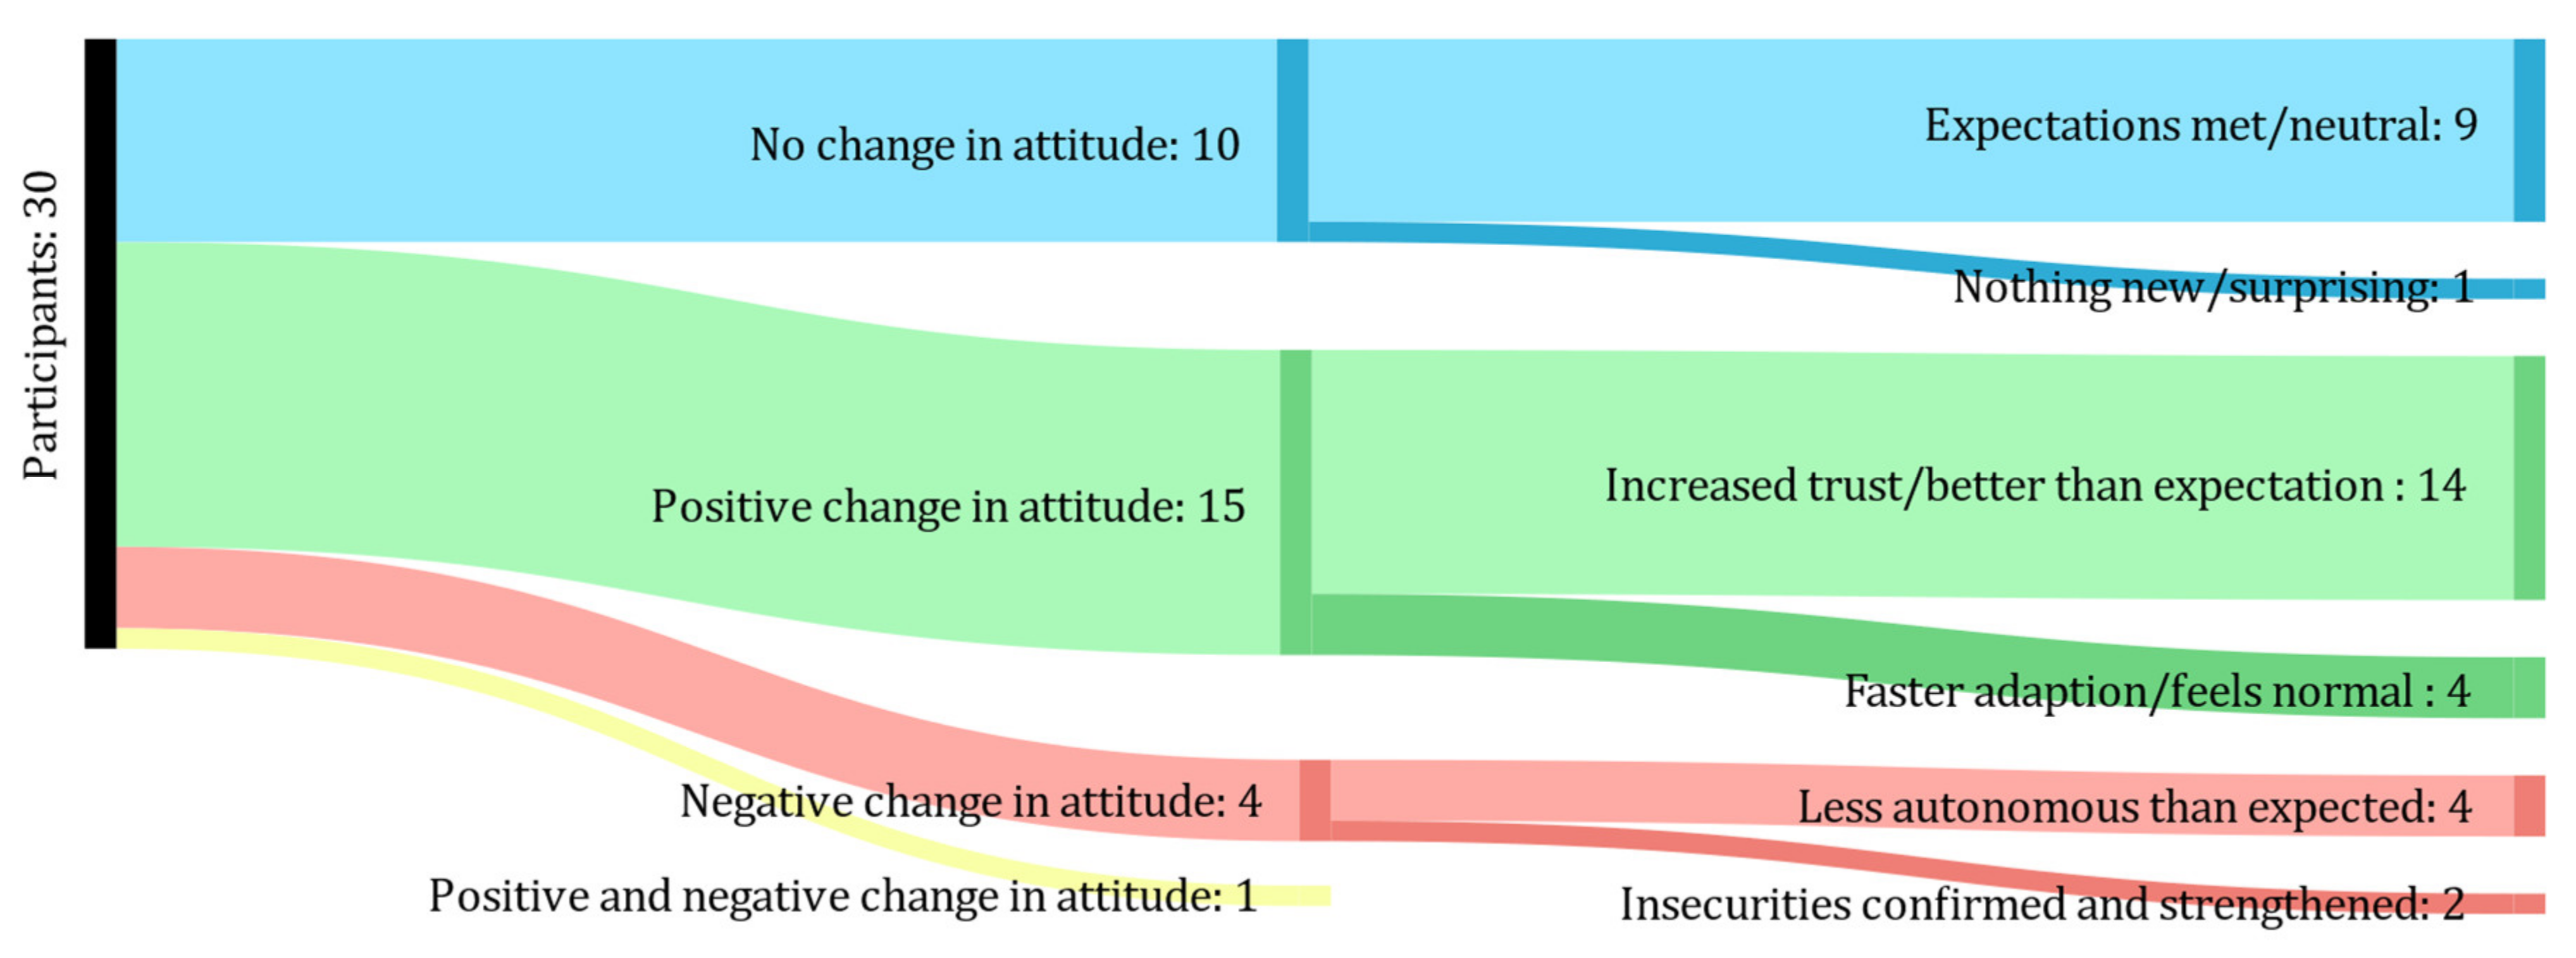
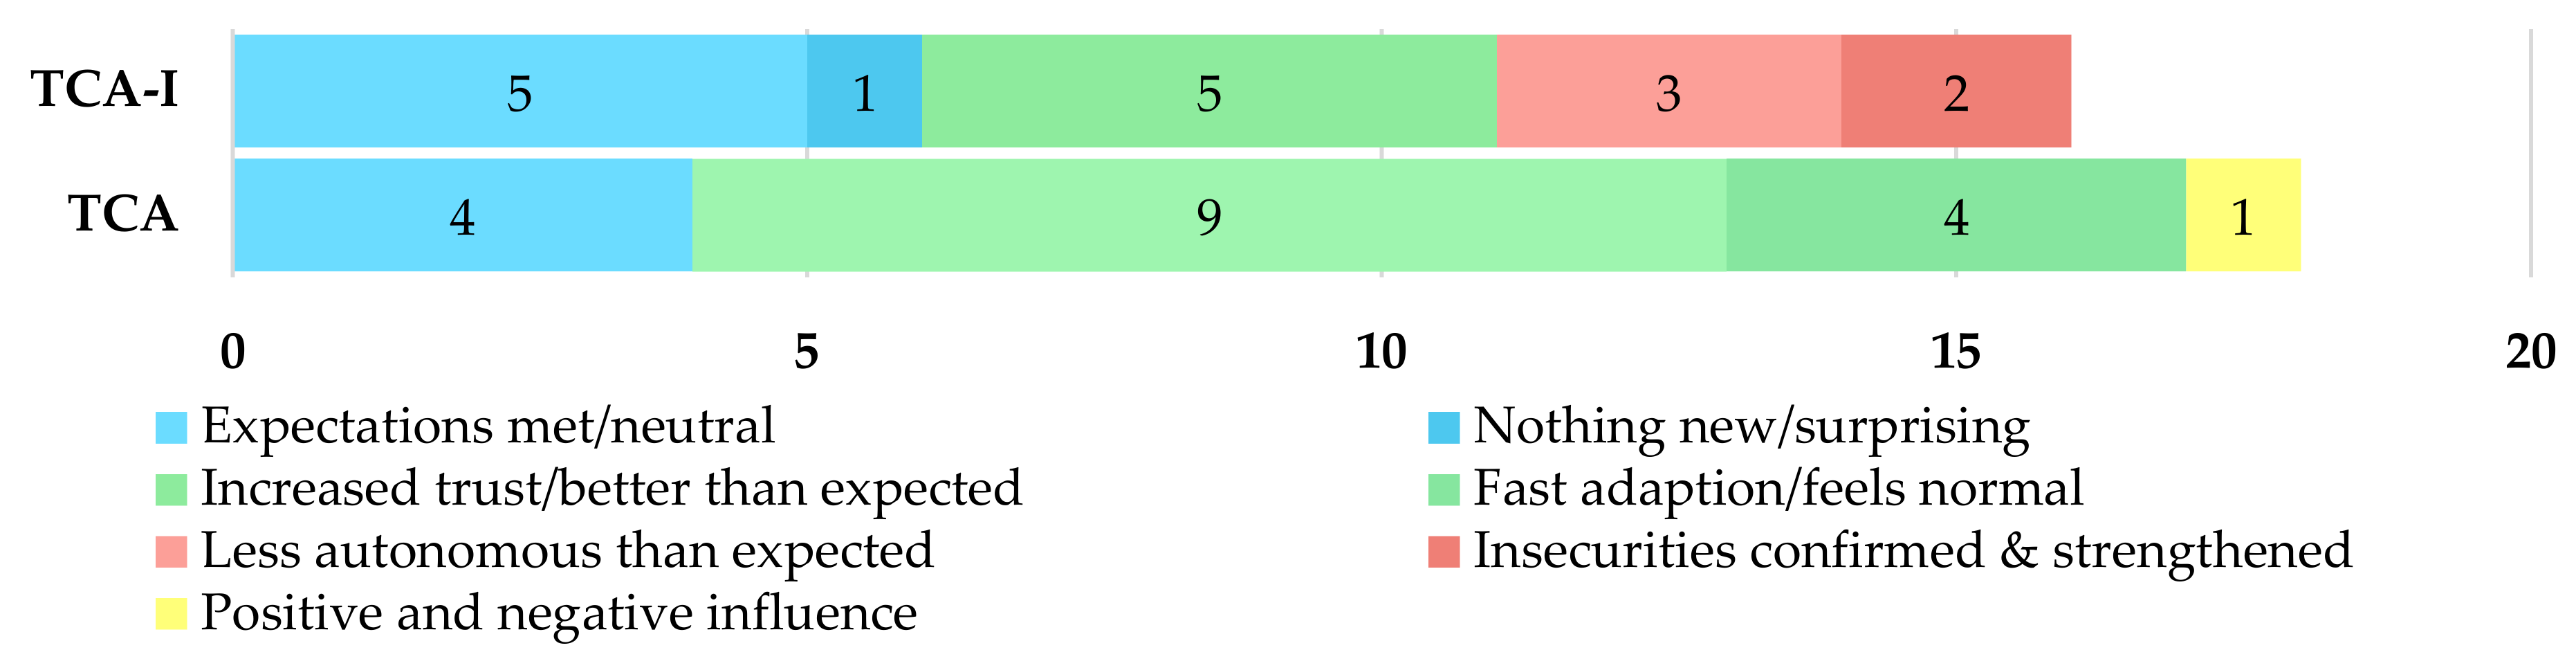
5.3.3. Attitude towards the Automated Shuttle and AVs in General

Another aspect of interest was to examine how the confrontation with the AS during our study had changed perceptions and expectations towards automated shuttle. Half of the participants reported a more positive attitude towards automated shuttles and automated driving after this first exposure with the test vehicle in a mixed traffic situation (see Figure 13). They explained that the slow speed of the AS, as well as its behavior in the traffic flow and its reactions to the other road users’ actions, increased their feelings of safety and confidence and overall exceeded their expectations, as they expected less automated driving. Like P20, who described that “[The automated shuttle] actually felt totally normal”, multiple participants reported that they were surprised at how quickly they got used to the AS in the traffic flow and no longer perceived it as “the other” vehicle. One third of participants reported an unchanged attitude as they were already familiar with the AS from local news or because their expectations concerning the vehicle’s size and explicitly pleasant driving style had been met. Only a few participants reported a more negative perception after personally experiencing the AS, having expected a significantly higher degree of automation and “smarter” behavior, such as less jerky braking and the absence of any human operator.
Comparison between TCA and TCA-I. All ten of fifteen participants from group TCA, who experienced a change in attitude, experienced a positive change (Figure 14). Nine of them acknowledged that the shuttle worked more accurately than they had expected, thus their trust in this technology increased through the experience. Only one participant from TCA observed a partial positive and negative change, as they were disappointed in the shuttle’s level of autonomy but was at the same time surprised about how fast they adapted to the new technology.
In the TCA-I-group answers were more balanced: five of fifteen TCA-I participants experienced a positive change in attitude, four a negative and six of fifteen did not experience a change at all (Figure 14). The reason most often given for the lack of change, namely by five of six TCA-I participants, was that their experience completely met their expectations. In contrast, most participants who acknowledged a negative change in attitude did so because the shuttle was less automated than they expected.
Comparison between male and female participants. Whereas only four of seventeen female participants reported their attitude unchanged, six of thirteen male participants did report it as unchanged. In both groups, the prevalent reason given by the participants was their expectations being met.
Furthermore, ten of twelve female participants, recognizing a change in attitude, stated it to be positive. Most often, the increase in trust through the experience or the eHMI was pointed out as a reason by these female participants. Additionally, the majority of male participants who experienced an attitude change reported it to be positive, namely six of eight. The two male participants who acknowledged a negative change in attitude explained that they were disappointed as the automated shuttle was not as autonomous as expected. The two female participants who also experienced a negative attitude change did so because through the interaction with shuttle, their insecurities were confirmed and strengthened.
Comparison between age groups. The majority of participants in AG2, about 80%, experienced a positive change in their attitude towards AVs as a result of the study. The reason mentioned by all of these seven participants was that the shuttle exceeded their expectations. Only one person in this age group reported that their view had not changed by their experience during the study, and one person reported a negative change.
In AG1, a larger proportion than in AG2 did not experience a change in attitude, namely one third. Here, the reason most often stated was that the participants’ expectations concerning the shuttle’s level of autonomy and driving behavior were met. Nevertheless, slightly more than half of the participants in this age group—eight of fifteen—experienced an exclusively positive change in perspective. Only one of fifteen AG1 participants reported an exclusively negative one.
In AG3, only two of six participants experienced a change of perspective at all. Both participants reported the change to have been exclusively negative, as the shuttle operated less autonomously than they expected.

5.3.4. Content and Visibility

In the last question of the interview, participants were asked to evaluate the communication design. Besides the main aspects mentioned, such as comprehensibility, there were two other aspects repeatedly addressed by participants: content and visibility, each discussed by nine participants.
Regarding visibility, only a few participants reported a positive impression. Seven participants complained about the visibility of the display, stating that visibility was bad due to reflection on the glass and its black and white design, which was not conspicuous enough. Some participants also found the display to be too static, i.e., they did not notice any change to it, so they ignored it due to its apparently low informational content.
As for the displayed information (content) itself, most participants expressed their satisfaction. Four participants criticized that too much was displayed or that they could not interpret the icons, which confused them.
Overall, twelve ideas for improvement were mentioned by the participants, of which two were particularly prominent: participants emphasized potential benefits of using traffic light colors and familiar icons, such as smileys or Ampelmännchen (i.e., figures on the traffic lights at pedestrians crosswalks in Austria) in order to make the information which was displayed easier and faster to comprehend but also more conspicuous.
Comparison between TCA and TCA-I. Participants from both test conditions evaluated the visibility mainly negatively. A slight difference can also be found in the wishes for improvement: the most prevalent ones stated by TCA participants concern color and more displayed information on the AS. TCA-I participants focused their suggestions most often on the improvement of icons. Regarding the amount of content, participants from TCA-I tended to evaluate the content as “too much”, whereas most participants from TCA who considered content evaluated the amount as “enough” or “good”.
Comparison between male and female participants. The visibility of the eHMI was evaluated most often as “not recognizable” by both male and female participants. Furthermore, in both gender groups, the content evaluation is balanced. With regard to the most frequently mentioned improvement wishes, we found further differences in male’s and female’s responses: most female participants stated the need for a more colorful design, whereas male participants concentrated adjustment suggestions on improvements of the iconic representation.
Comparison between age groups. Concerning the evaluation of visibility and content, all three age groups show similar tendencies: Within AG1, four of five participants criticized the visibility, but only one of four the content displayed. In AG2, three of four criticized the visibility and only one of three the content. Two AG3 participants found the content to be explicitly too much. None of the AG3 participants evaluated the eHMI’s visibility.
In AG1, all but one participant made suggestions for improvements, which most frequently reflected the desire for a more colorful display design and improvements of the iconic representation. In AG2, seven participants also expressed wishes for improvement. Here, too, the desire for a more colorful display design was most frequently mentioned. In addition, this age group also wished for more information about the behavior of the AS, such as the display of the driven speed or the destination. In AG3, all participants provided suggestions for improvement, in contrast to the other two age groups. Here, wishes for more information were most common, such as the provision of clearer information on the behavior of the AS, instructions for other road participants and information about the shuttle’s distance.

6. Discussion

In this study, we designed a display-based, functional eHMI to enable an autonomous shuttle to communicate awareness and intent. We tested the visual eHMI with thirty participants aged between 20 and 72 in a field study taking place on a real road with mixed traffic in Vienna, Austria, exposing participants to different interaction situations with the bus. We collected data with a questionnaire during the test and an in-depth interview which took place afterwards. The first aim of this study was to investigate the eHMI’s overall effects on participants, and the second aim was to assess the effects of adding intent communication to mere awareness communication. We examined five dimensions in which the external communication of the autonomous shuttle might have had an impact on the participants: the perceived impact on their general behavior, their subjective sense of safety and comprehensibility of the shuttle’s behavior, their perceived need for external communication, and their attitude towards AVs.
Quantitative analysis of the questionnaire data did not yield significant statistical differences between the control and test conditions. The comparatively high inter-quartile ranges indicate different views among participants. Indeed, the qualitative analysis of the in-depth interviews provided a rich picture of subjective impressions and expectations. We found that it is important to more closely analyze participants’ impressions with regard to whether an influence was experienced and whether this was regarded as positive or negative. We differentiated between influences on the participants’ interaction with the autonomous shuttle, on the participants’ opinion on AVs and their external communication as well as their evaluation of our eHMI design. Furthermore, we investigated how these affected each other. For the encoding of the interview, we deductively determined the six main categories according to the six interview questions. Moreover, we developed inductively, i.e., during the process of encoding, the subcategories, such as the reasons for or shapes of the experienced influences.

6.1. Overall Effects of Visual Communication on Pedestrians in Real-World Mixed Traffic

The interview results relating to our first research question on the effects of visual awareness and intent communication on pedestrians in mixed traffic (RQ 1) are multifaceted: on the one side, only around half of the participants’ interview responses confirmed our hypothesis that the external communication had positive effects. When asked about the comprehensibility of the shuttle’s behavior, sixteen of thirty participants stated an increase due to the eHMI. Fourteen of thirty participants reported to have experienced an increase in their subjective sense of safety and only nine of thirty participants expressed to have recognized a positive impact on their behavior. Furthermore, 50% of participants acknowledged that their attitude towards autonomous vehicles had been changed in a positive way due to our study, which lines up with prior described positive response frequencies. In contrast, 83% of participants, namely twenty-five of thirty, reported a societal need for the external communication of autonomous vehicles by stating that they found the external communication necessary or at least helpful. Two factors seem to have led to the discrepancy between the eHMI’s moderate effects on the participants and the acknowledged strong societal need for the external communication of AVs: our aim to design an intuitively understandable eHMI concept and the participants’ age.
First, as our goal was to design an intuitively understandable eHMI concept to be tested under real-life conditions, we excluded instructions to the participants from the briefing that was given at the beginning of the experiment on how to use and understand what is communicated via the display. We assume that this approach led a third of participants to assess the external communication as “not comprehensible”. Participants who stated to have experienced no or negative effects of the communication on their behavior, sense of safety or comprehensibility of the shuttle’s actions, most often justified it by them purposely ignoring the eHMI due to the perceived lack of visibility and comprehensibility. One clear reason for the critical evaluation of the eHMI’s visibility was the mounting of screens in the shuttle’s interior area, which caused reflections on the windscreen. Here, a trade-off between operators’ safety concerns about externally mounted screens and visibility considerations needs to be made. Building on these observations, we suggest future research to not solely focus on the creation of the eHMI design itself, but also on more visible mounting and implicit training methods to introduce them among the target users.
A second factor contributing to the heterogeneous responses by our participants’ sample was that we aimed for broad distribution across different age groups, namely age group 1 (AG1) between 20 to 39 years; age group 2 (AG2) between 40 to 59 years, and age group 3 (AG3) older than 59 years. The comparison of results between these age groups showed that especially participants between 20 and 39 years were affected in a positive way and tended to consider information provided via the display in their decision-making processes. The majority of these participants reported an increase in their sense of safety and comprehended the shuttle’s actions with the help of the eHMI. Furthermore, they reported a positive impact of the communication on their own behavior. In AG2, a tendency to positive effects of the eHMI is also observable. Yet, a smaller proportion of participants in AG2 than in AG1 reported on positive effects of the eHMI. Specifically, the AG2 participants’ evaluations of the impact on their feelings of safety and comprehensibility emphasized the difference between AG1 and AG2. Five of nine AG2 participants found the shuttle’s behavior to be more comprehensible due to the eHMI. Moreover, only two of nine AG2 participants reported an increase in their sense of safety; the same number stated a decrease.
As opposed to AG1 and AG2, almost none of the participants in AG3 experienced an impact on their behavior, sense of safety or comprehensibility of the shuttle’s behavior due to the external communication. Only one of six AG3 participants acknowledged an increased comprehensibility. Furthermore, the only AG3 participant of six who stated an influence on their sense of safety experienced a negative one. According to the differences in experienced effects on behavior, sense of safety and comprehensibility, and also the evaluation of the societal need for the external communication of autonomous vehicles varied between the age groups: whereas around 90% of AG1 and AG2 participants considered the external communication to be necessary or at least helpful, only 50% of AG3 participants did so. These contrasting results in the age groups could be explained by the differing affinity and reliance on technology among them. Moreover, they imply differing needs between and practices of young and aging eHMI users. In order to develop eHMI design concepts that are suitable for a more age-diverse set of road users, we suggest future research to examine the differences in needs among differently aged road users in depth.
We also observed slight differences in overall effects when we differentiated the results by gender: smaller proportions of male participants (30%–40%) as opposed to the female participants (53%–58%) reported to have experienced an overall influence on their behavior and comprehensibility of the AS’s behavior. Whereas female participants tended to classify the identified influences as negative, male participants had a more positive perspective. Concerning the sense of safety, in both gender groups, around half of the participants acknowledged an influence which the majority categorized as positive. In the evaluation part of the interview, thirteen of fifteen female participants, as opposed to four of fourteen male participants, reported that they did not consider the eHMI to be sufficiently comprehensible. The perceived lack of comprehensibility of the eHMI on the side of the female participants could explain the predominantly negative overall effects. We suggest future research to examine the possible differentiating needs in eHMI design in female and male users more thoroughly.

6.2. Communication of Intent and External Awareness Communication

Our results relating to the added value of extending the communication of the vehicle’s awareness by intent cues (RQ2) suggest that an increase in provided information does not necessarily result in stronger positive effects: the strongest positive impact of intent communication can primarily be observed in the effect on participants’ comprehensibility of the shuttle’s behavior. Awareness and intent communication supported a larger share of participants in the understanding of the shuttle’s behavior than pure awareness communication. Additionally, a larger proportion of participants who had experienced the awareness and intent conditions stated a positive impact of the eHMI on their own behavior. However, adding intent cues to vehicle awareness information was also associated with negative user experience aspects. With regard to participants’ sense of safety and a perceived change in attitude, participants in the awareness and intent test condition (TCA-I) reported a positive sense of safety and a change in attitude less often than those experiencing only awareness information (TCA).
The ambivalent effects of the added intent communication in TCA-I might be related to a potential increase in mental load for the participants. Even though the increase in provided information on the eHMI led to a better understanding of the autonomous shuttle’s behavior for many participants, these in turn may have needed more time and cognitive effort to process the additional information. As this study took place in real traffic, participants were forced to make decisions quickly. We assume that increased cognitive workload in combination with time pressure led to an increased confusion in the participants, thus a decreased reaction time and decreased sense of safety. We suggest that in future research, the added value of intent communication should be further validated. As some participants also suggested the use of familiar icons (such as emotional and anthropomorphic representations shown on signs or traffic lights), future studies on intent communication should ideally also include an experimental condition with precise instructions for pedestrians (another type of displayed communication as per the categorization of Schieben et al. [16] mentioned in the related works section). More attention should also be given to the interrelations of different information types and on how to optimize the interplay of these.

6.3. Design Implications for eHMIs

While not directly addressing our research questions, noteworthy insights on the design of eHMI have been obtained in the qualitative interviews. Many of these findings are in line and support previous work in other application contexts or evaluation settings. For example, more than half of our participants stated that the eHMI had no influence on their behavior, and that they instead tended to rely on other factors such as speed and acceleration of the vehicle to decide. This is in line with findings by, e.g., Mahadevan et al. [17], who also reported that many participants in their study relied strongly on motion cues even when interfaces for intent and awareness communication were present, or Moore et al. [24], who similarly argued that implicit communication is the most important factor that pedestrians rely on with regard to autonomous vehicles. Nonetheless, external communication from the AV was deemed ‘necessary’ by more than half of our participants, signaling the need for optimized eHMIs in AVs.

6.3.1. Ensure Both Legibility and Conspicuousness

During our initial design phase, we had developed a wide variety of different concepts for both awareness communication and intent communication, as described in Section 3.3. These designs also included variants in which color was additionally used (based on the colors of traffic lights to invoke familiarity) to further add information. However, as the display was placed behind the windshield (which led to certain issues with reflections) and the provided LCD screen only had a very limited viewing angle from which the colors remained true and readable, these designs were replaced by a black and white design during the final study.
Unfortunately, due to reflections on the windshield (the study was conducted during summer), several participants still found the visibility of the information to be lacking. Furthermore, due to the monochrome setup and rather static nature of the screen (as the icons no longer changed as soon as an obstacle or a person has been detected), some participants mentioned that the display was not conspicuous enough, and suggested the use of color in order to attract more attention to the display.
Due to organizational and legal constraints for the type and fixture of the eHMI screen, the problems regarding reflections and limited viewing angle (with regard to the correct display of colors) were unfortunately unavoidable during our study. These viewability restrictions could be alleviated by a dedicated display or space outside of the vehicle dedicated to external communication. Nonetheless, these findings highlight that not only legibility but also conspicuousness need to be considered when designing an eHMI, as it is important that pedestrians can quickly understand where they can access information [40] on the AV’s awareness and intent. To channel the attention of the users to the relevant information area of the AV, factors such as color, animations (movement), brightness and similar measures can be used. In addition, this strong context dependency of display legibility highlights the necessity to tailor design recommendations for different “vehicle form factors” beyond shuttles, for example, including also smaller vehicles with different windshield angles and sizes.

6.3.2. Provide Consistency between Communication and Vehicle Behavior

Our findings suggest that the additional provision of more communication features and content towards pedestrians does not automatically improve the users’ trust or sense of safety. In fact, factors such as perceived discrepancies between the communicated intent and the AV’s actual ‘behavior’ may even lead to a reduced sense of safety. Participants mentioned examples where they felt like the AV was maintaining its speed or even accelerating, despite displaying the icon for a detected pedestrian (as in TCA) or both the icon and intent communication (a text saying that the AV is braking, as in TCA-I).
Given the importance of vehicle movement behavior for communicating awareness and intent [41], we suggest that designers should attempt to ensure consistency between the communicated information and the actions of the vehicle. This can be a challenge, as certain information needs to be communicated well in advance in order to give other mixed traffic participants time to react appropriately, while not yet resulting in corrective actions such as braking on the side of the AV.
Adding intermediate states can possibly help bridge the gap between actions such as “accelerating” and “stopping”. A strategy that could be tested as to its suitability to improve intent communication would be to refine the timeline (e.g., only displaying the text “bus brakes” when it is actually braking, and using another phrase such as “bus will brake” or “preparing to brake” while it has not yet initiated the actual braking step). For awareness communication, different ways of communicating these ‘fuzzy’ states could be explored, e.g., by adding a version of the icon with a large question mark on the pedestrian icon or making it flash slowly in case that a pedestrian was already detected (but is still so far away that they do not yet affect the behavior of the vehicle). Still, attention should be paid when new types of states are being added, to avoid overload of the road users due to the added information [15]. These intermediate states should also be easily distinguishable from others to avoid confusion or uncertainty [17], and thus not too many new states should be introduced.

7. Conclusions and Further Work

There is a need for investigations regarding eHMI solutions in AVs conducted under real-life conditions in mixed traffic, as well as for functional HMI concepts in order to ensure a smooth integration of AVs into traffic and further trust in and acceptance of these vehicles by other road users. Within our study, we aimed to contribute solution approaches to both challenges. We developed a display-based, external iconic awareness and textual intent communication concept, implemented it with an automated passenger shuttle and investigated how this functional eHMI affected pedestrians in mixed traffic on a real road in Vienna, Austria. Our results suggest that an AV’s external communication can but does not necessarily increase a vulnerable road user’s sense of safety, reaction time and comprehension of the AV’s behavior. Yet, almost all participants of our study considered the eHMI to be necessary or at least helpful, indicating the importance of tailored eHMIs for the pedestrian experience on roads shared with AVs. Additionally, participants who were exposed to a combination of awareness and intent communication felt a stronger influence on their overall behavior, but also a lower sense of safety, slower reaction times and reduced comprehensibility, as compared to the condition with only intent communication.
To our knowledge, our study was the first one using functional eHMI in real mixed traffic. As is typically the case for such early studies, the study setup imposed several limitations that need to be taken into account for result interpretation and the planning of future research. Firstly, we did not investigate the whole design space, but deliberately focused on visual external communication aimed at a single pedestrian. Even though we consider this limitation as having been unavoidable due to framework conditions given by the project “auto.Bus—Seestadt” and the available autonomous passenger bus model, we encourage future research to further investigate on more inclusive eHMI designs, also considering the needs of visually impaired people and communication between more than two road users. Secondly, we observed that data collected through the questionnaire differed strongly from the answers given in the interviews, which posed a challenge in result interpretation. We assume that the chosen questions were not detailed enough to sufficiently match with the participants’ experience. Additionally, we suspect that the in-depth interview questions encouraged participants to consider their experience in a more reflected manner and were thus more able to classify their impressions and perceptions. For future studies, we recommend the application of a questionnaire that goes beyond standard items such as the SATI, but to use a more extensive, purpose-fit questionnaire. Moreover, we suggest using the completed questionnaire as a reference during the interviews in order to clarify inconsistencies immediately and to allow for an even richer reflection on their experience. Our findings also show that both age and gender are important factors to consider when designing eHMI concepts and evaluating their impact. We therefore emphasize the importance of considering diversity dimensions and ensuring the inclusiveness of design solutions in future research.

Author Contributions

Conceptualization, J.F., P.F., J.P.; methodology, J.F., P.F., S.S., M.G.; software, M.G., M.Z.; writing—original draft preparation, J.F., P.F., S.S., M.G.; writing—review and editing, L.D., J.P., M.T. All authors have read and agreed to the published version of the manuscript.

Funding

This work is in part supported by the projects “auto.Bus-Seestadt” (FFG No. 860822) as part of the program “Mobilität der Zukunft” by the Austrian Research Promotion Agency FFG. The financial support by the Austrian Ministry for Transport, Innovation and Technology is gratefully acknowledged. Furthermore, we would like to acknowledge the support by the project Drive2TheFuture (funded from the European Commission’s Horizon 2020 research innovation program under grant agreement No. 815001).

Institutional Review Board Statement

The study was conducted according to the guidelines of the Declaration of Helsinki and to Austrian national and European law.

Informed Consent Statement

Informed consent was obtained from all subjects involved in the study. Written informed consent has been obtained from the participants to publish this paper.

Data Availability Statement

Data are available on request due to restrictions (due to restrictions of privacy, as well as consortial restrictions). The data presented in this study are available on request (in a pseudonymized and aggregated form) from the corresponding author.

Conflicts of Interest

The authors declare no conflict of interest.

Appendix A. Interview Data

Table A1. Experienced Behavior Change.
Participants%TCATCA-IfmAG1AG2AG3
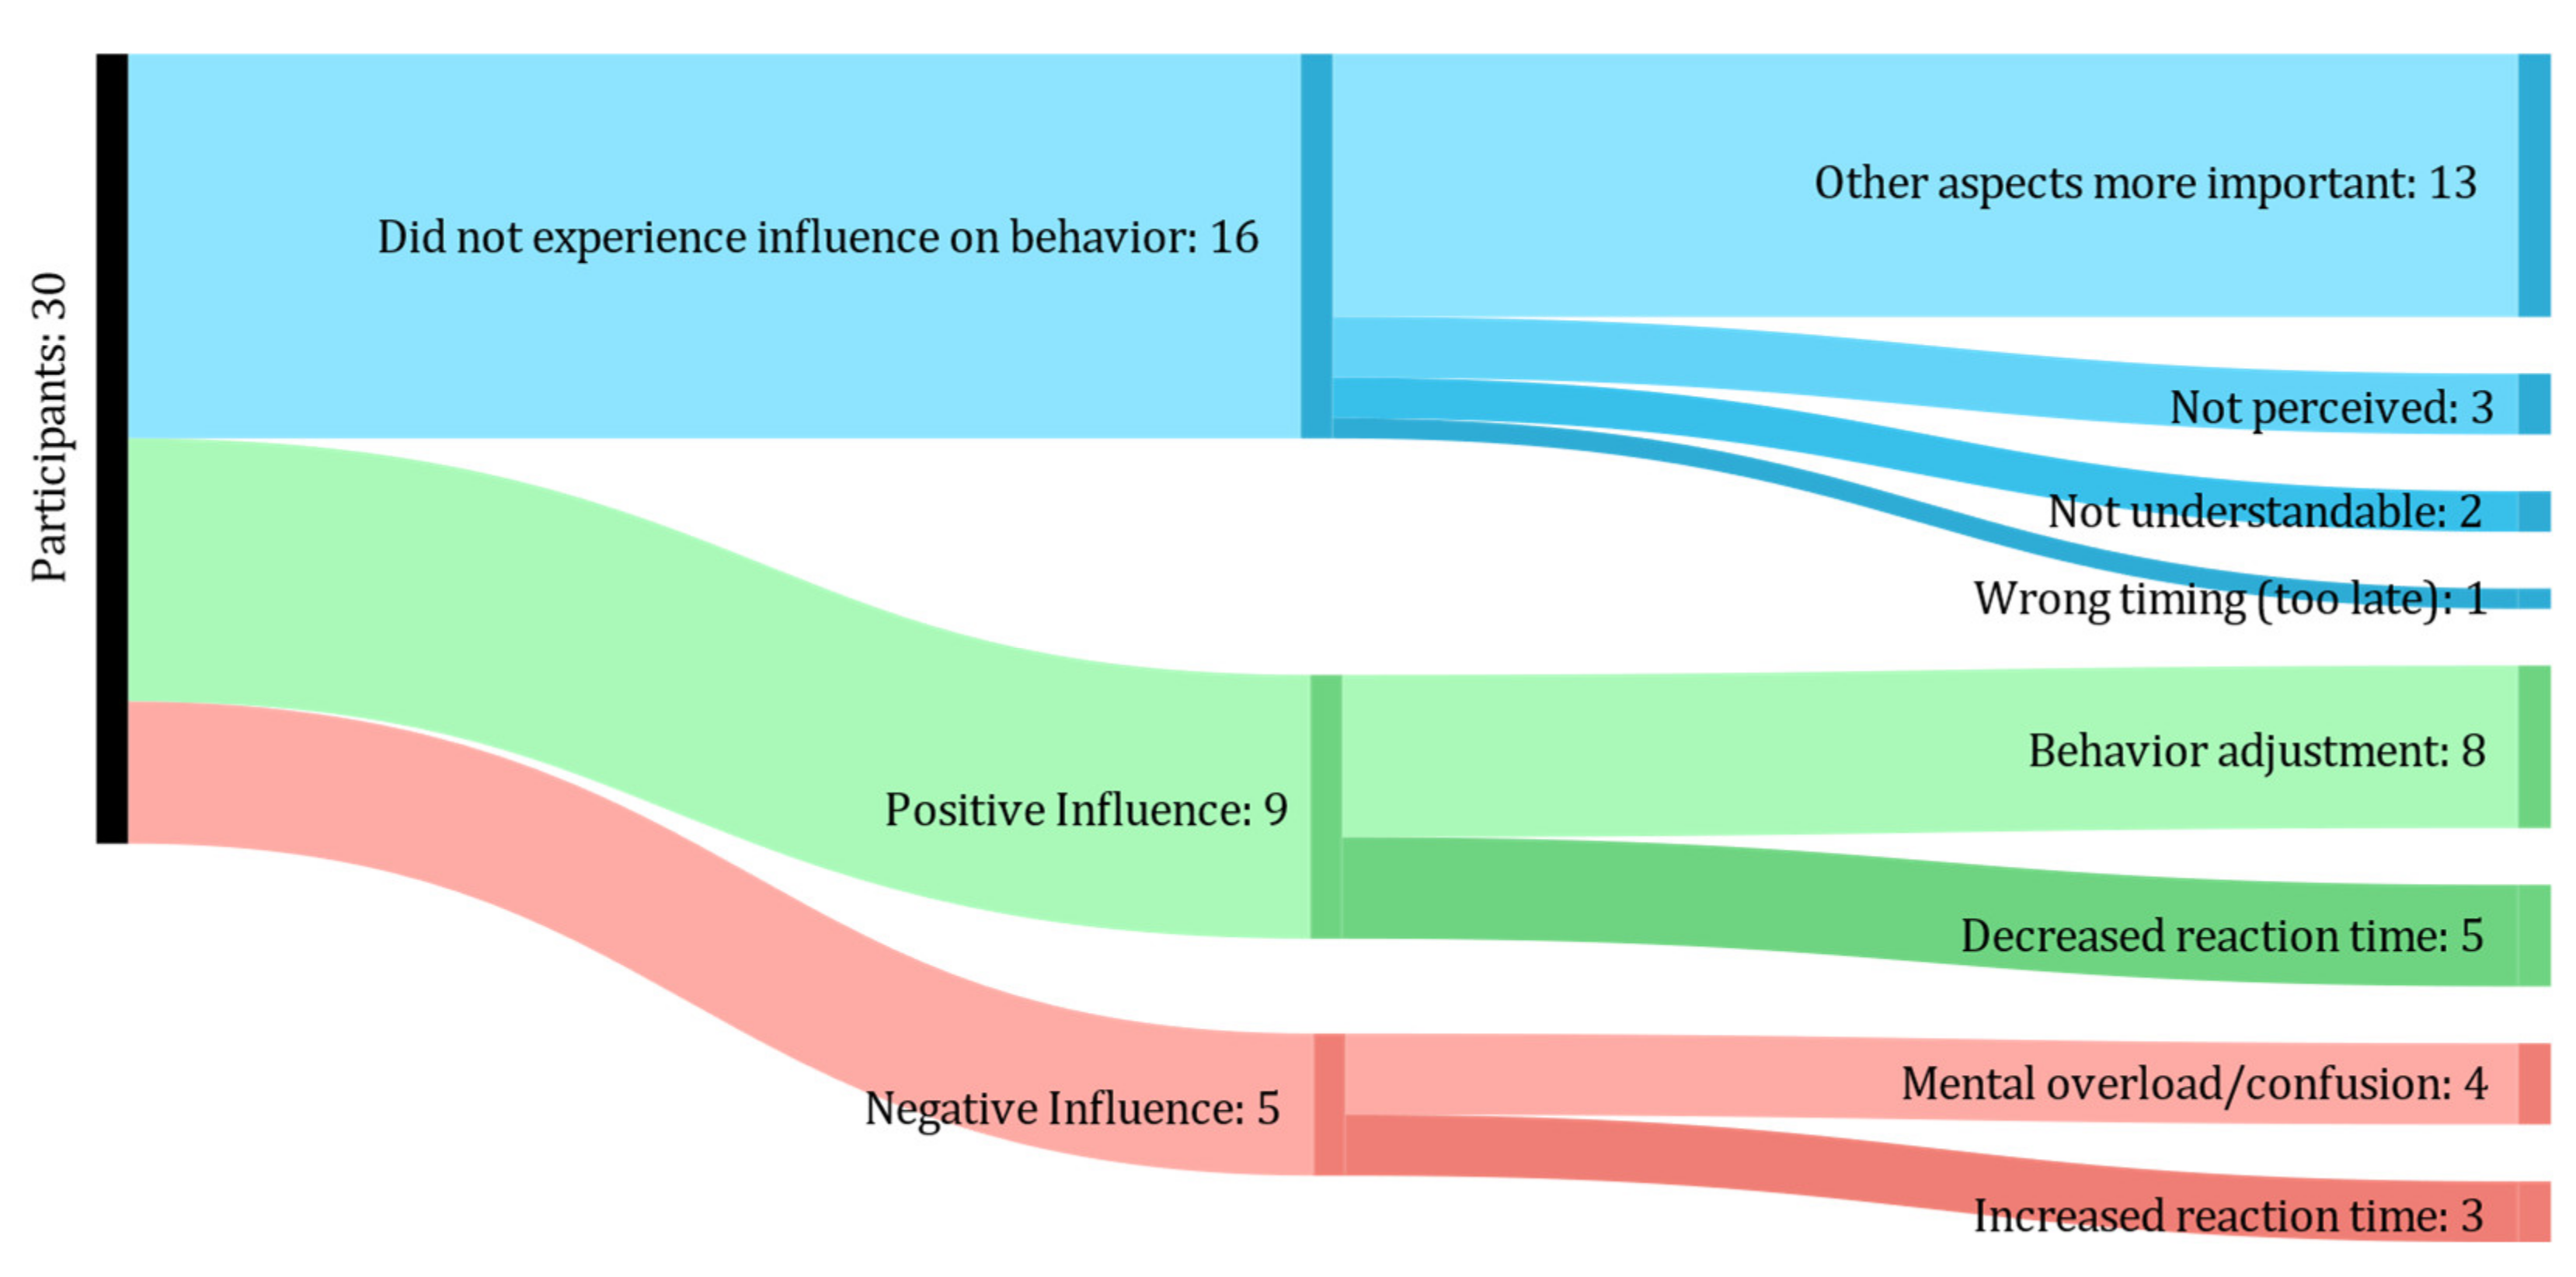
Did not experience influence on behavior1653.33125710755
Other aspects more important1343.3310349643
Not perceived310.002121102
Not understandable26.661111011
Wrong timing (too late)13.331001001
Experienced influence on behavior1446.6631094841
Positive influence:9302754630
Behavior adjustment826.662644530
Decreased reaction time516.661441410
negative influence516.661450311
Mental overload/confusion413.331340211
Increased reaction time310.000330111
Analyzed Interviews30100151517131596
Table A2. Sense of Safety.
Participants % TCATCA-IfmAG1AG2AG3
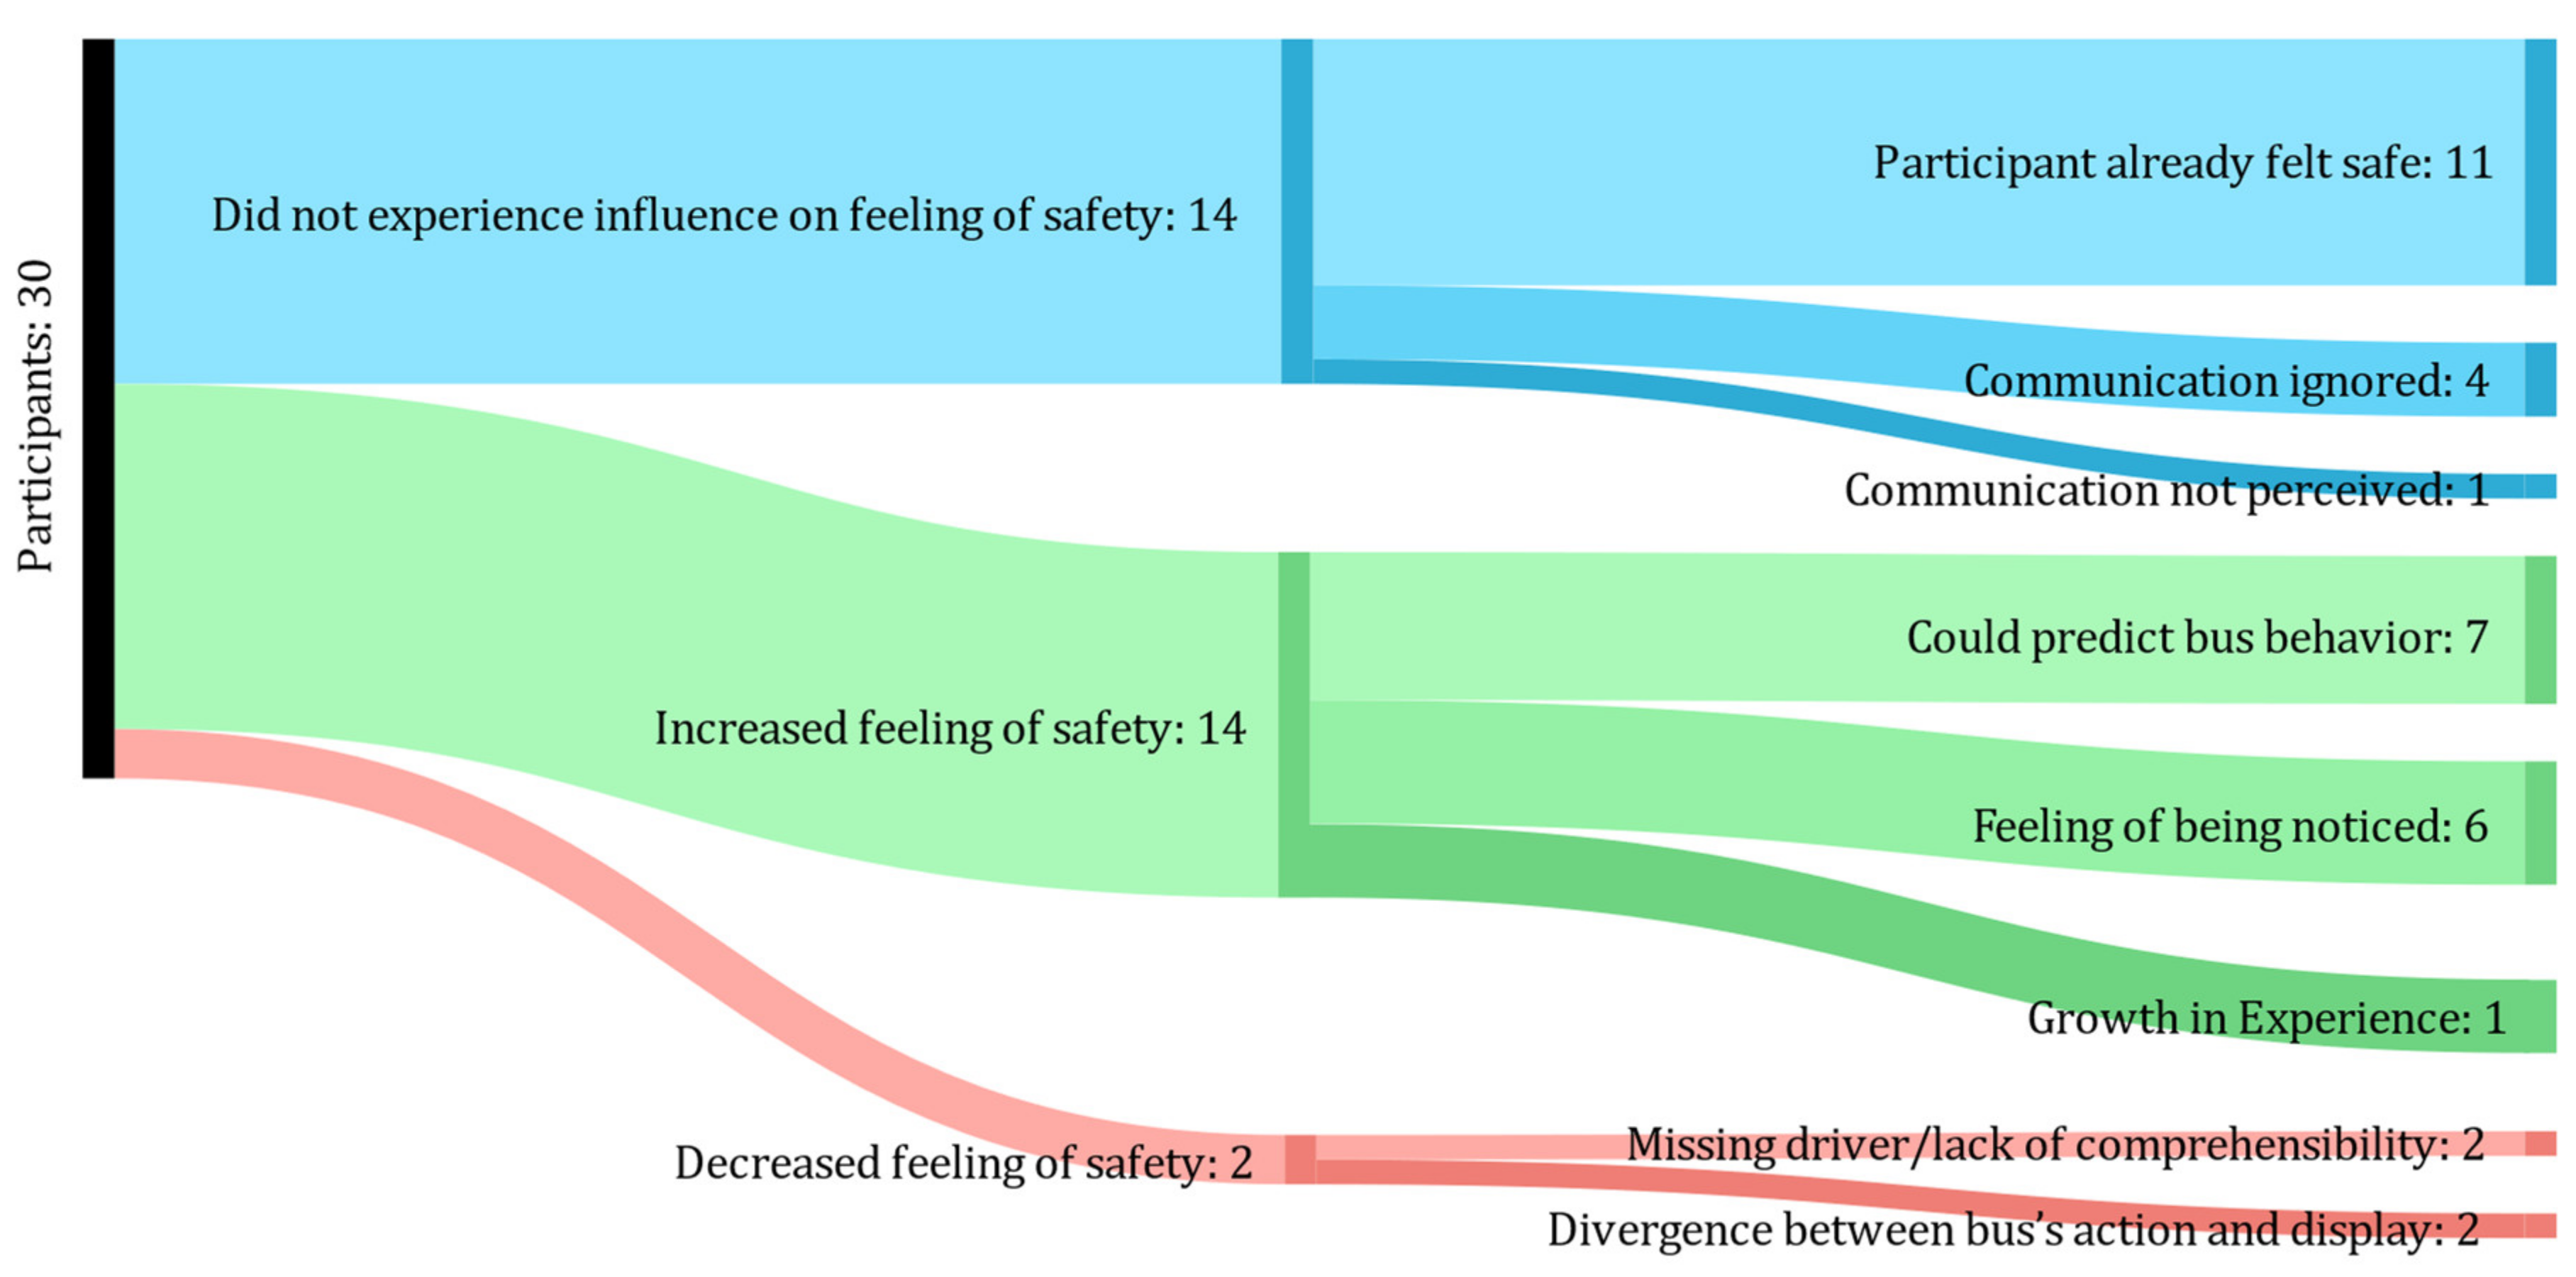
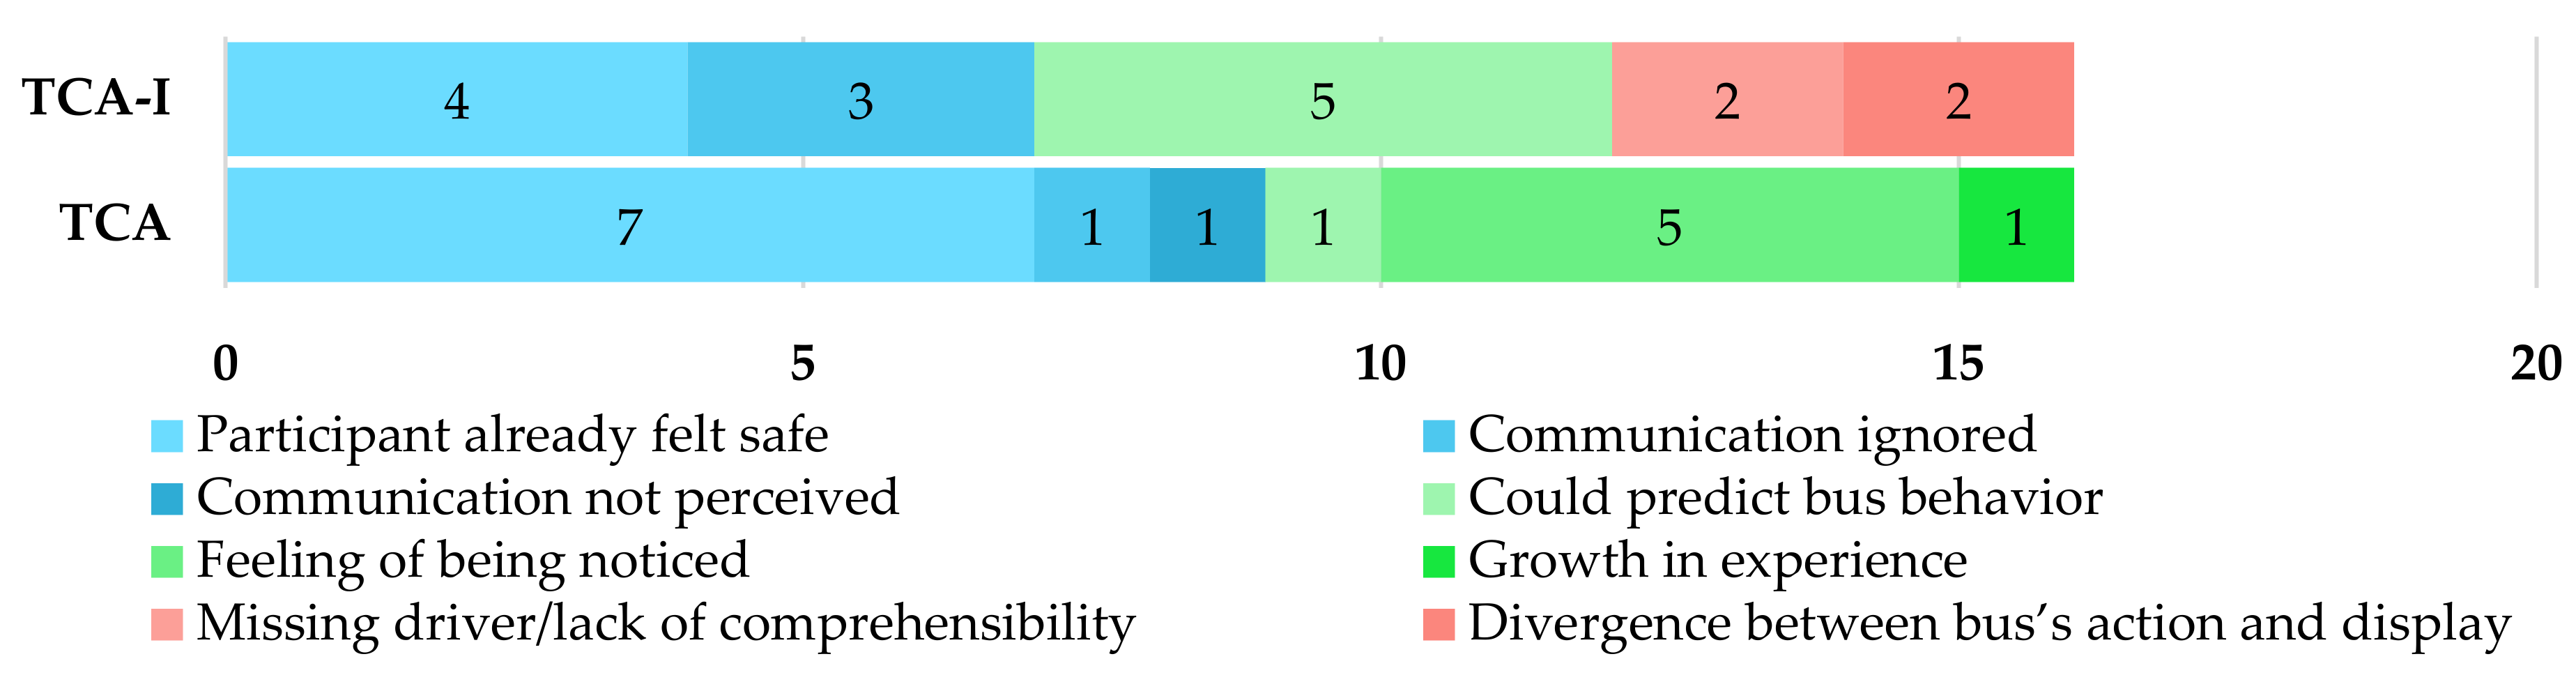
Did not experience influence on feeling of safety1446.669797655
Participant already felt safe 1136.667447443
Communication ignored413.331340112
Communication not perceived13.331010100
Experienced influence on feeling of safety1446.666877941
Increased feeling of safety:12406556821
Could predict bus behavior 723.331561700
Feeling of being noticed 6205015321
Growth in Experience13.331010100
Decreased feeling of safety:3100321120
Missing driver/lack of comprehensibility 26.660220110
Divergence between bus’s action and display 26.660211110
Influence on feeling of safety solely due to audio signal26.671120200
Analyzed Interviews30100151517131596
Table A3. Comprehensibility and Predictability of the Situation.
Participants% TCATCA-IfmAG1AG2AG3
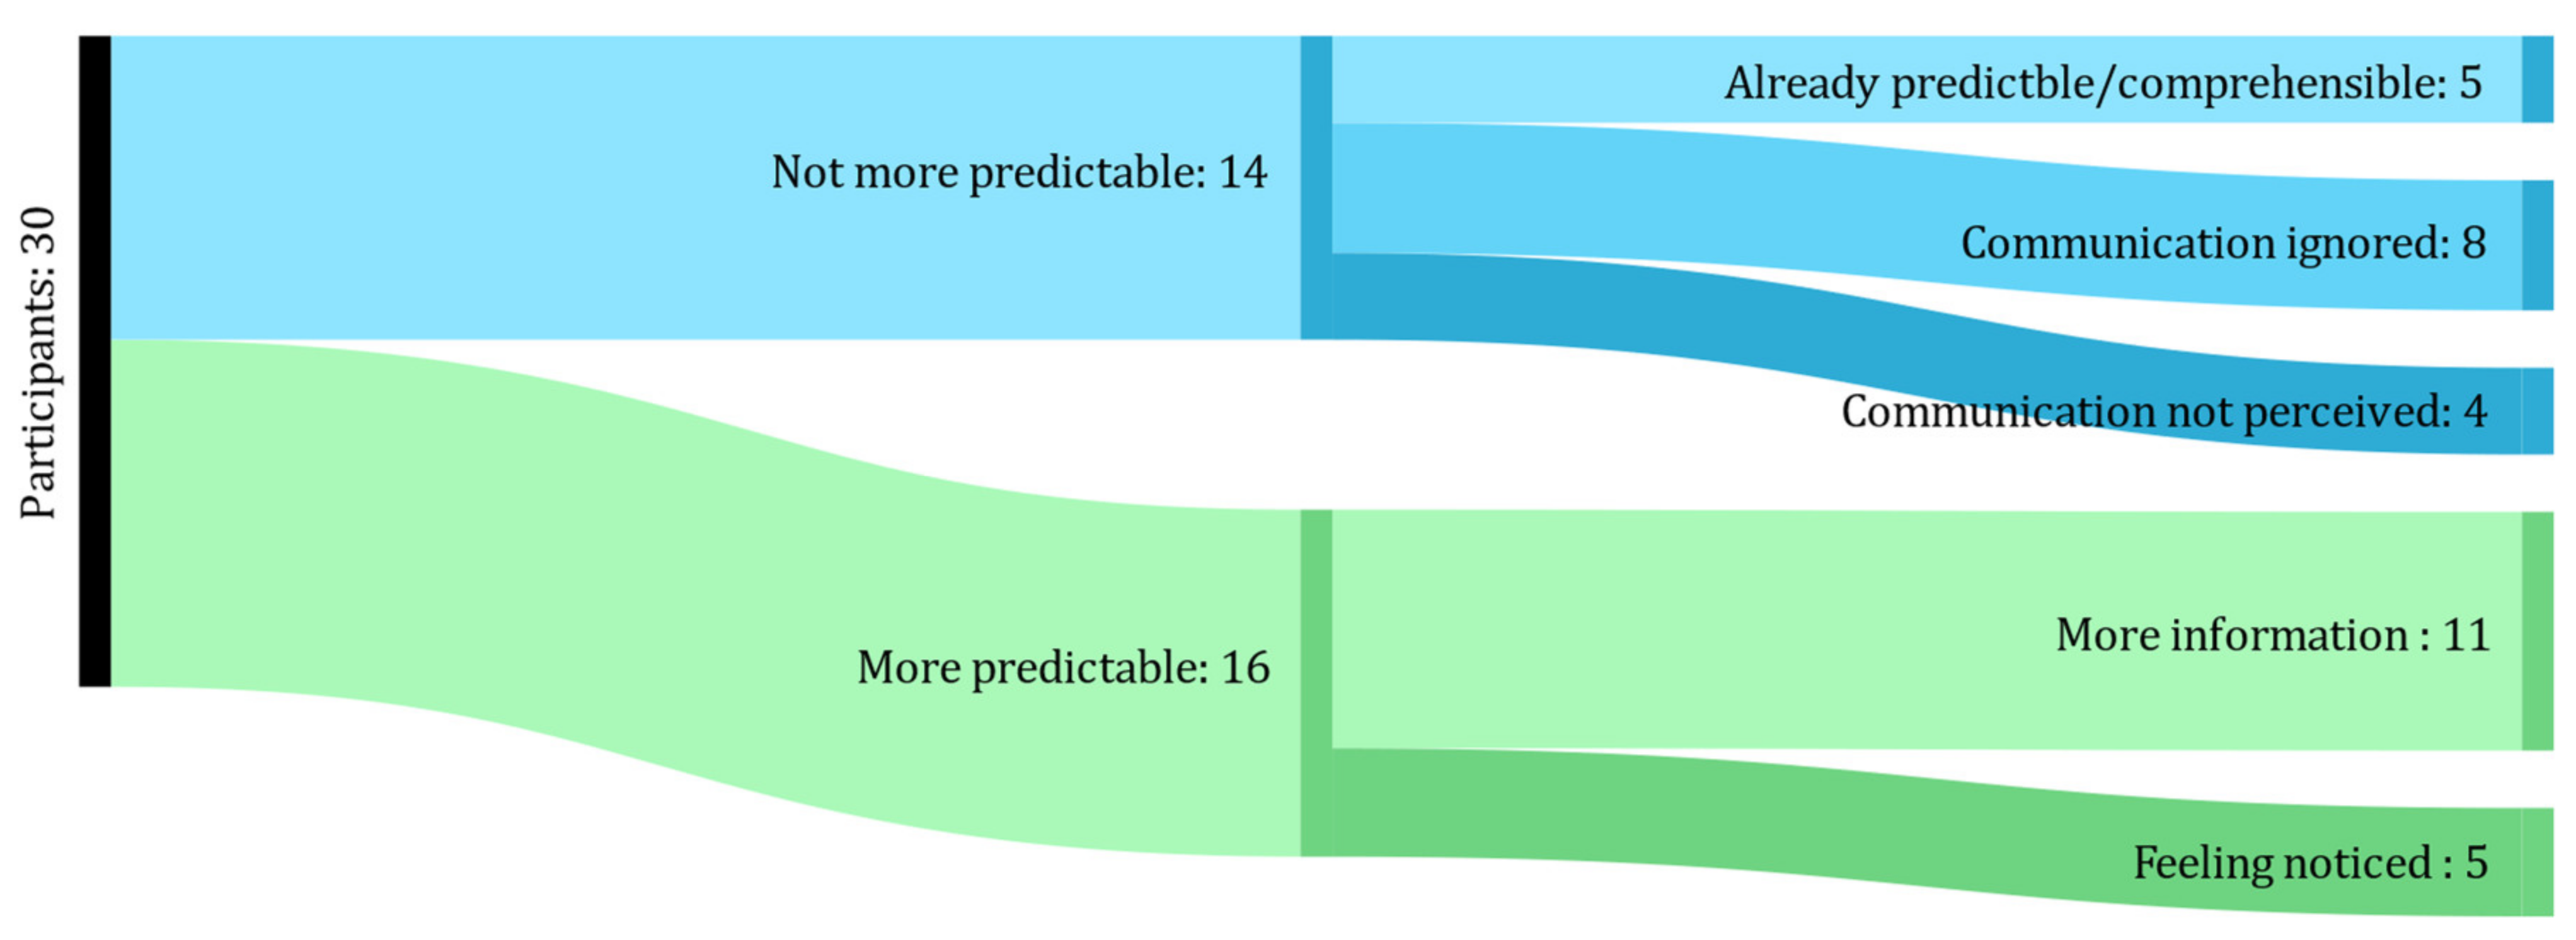
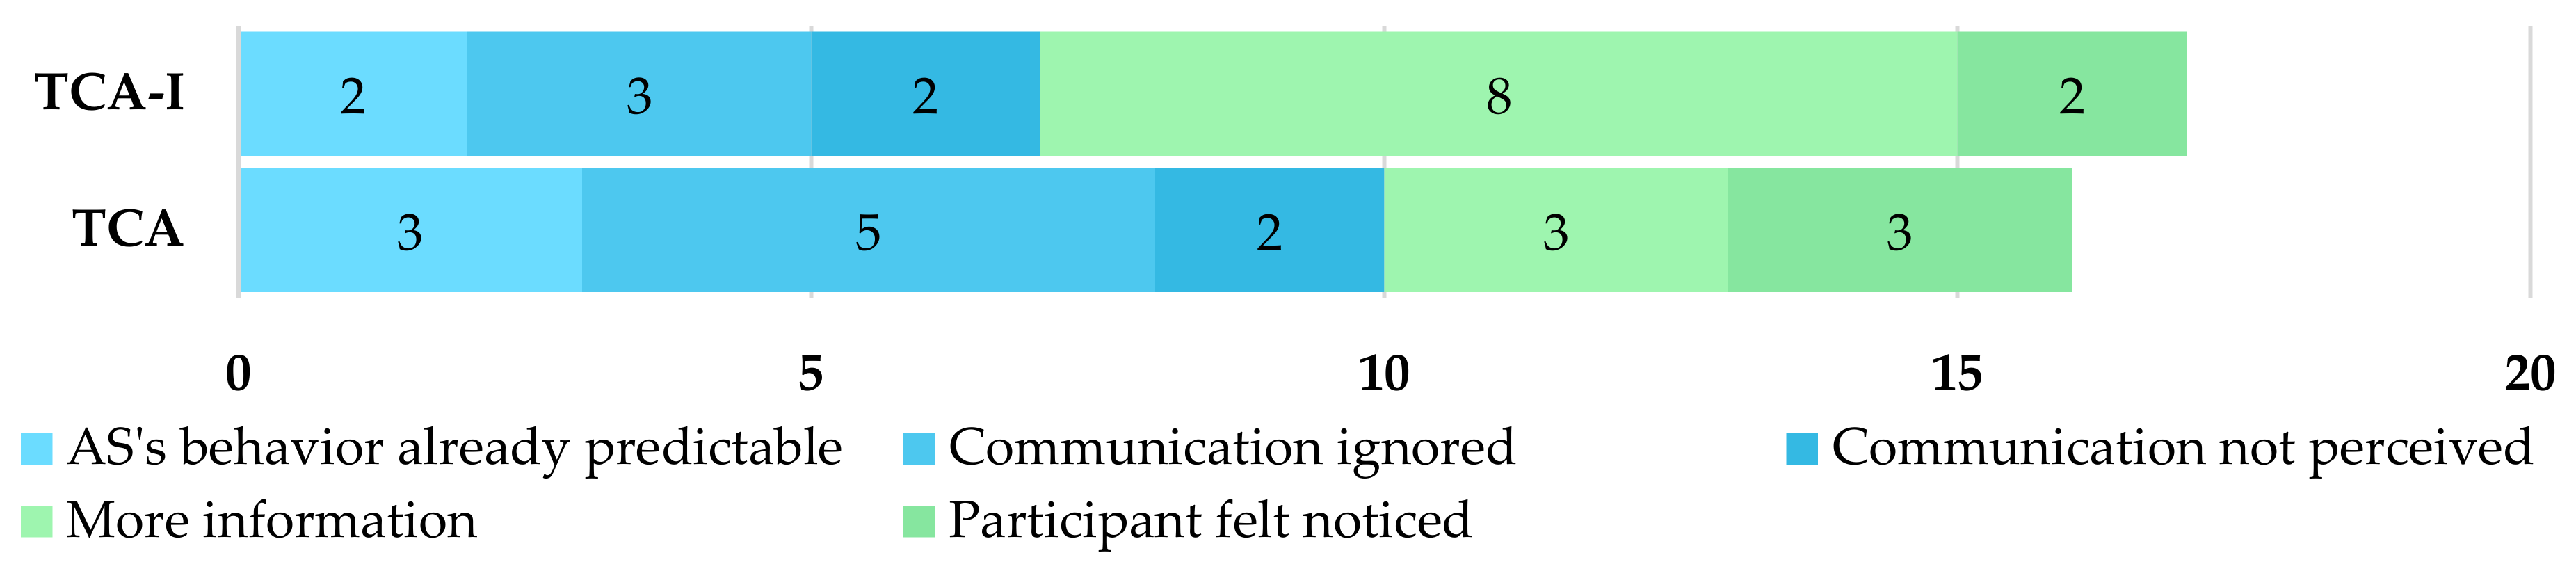
Behavior of auto.Bus is not more comprehensible and predictable1446.669577545
already predictable/comprehensible 516.663232230
Communication ignored826.665335323
Communication not perceived413.332231202
Behavior of auto.Bus is more comprehensible/predictable1653.336101061051
More information1136.663883731
Feeling noticed516.663223320
Analyzed Interviews30100151517131596
Table A4. Perceived Necessity of External Communication in Automated Vehicles.
Participants% TCATCA-IfmAG1AG2AG3
Not necessary at all516.663232113
No increase in information26.662011011
Other aspects more important310.001212003
Helpful, but not necessary826.664453341
Disabled people 13.331001010
In the beginning 26.661111011
Increased safety413.332222310
In exceptional cases13.330110010
If design is improved 13.331010010
Necessary1766.6689891142
Visual and audio 6204233420
Visual only 9303654720
Audio only26.661102002
Reasons
More information 513.332314230
Soundless electronic vehicle 3101203012
In the beginning 26.661111200
Feeling of being noticed 723.335252700
Same necessity for all road user
Different necessity for different
types of road users. Most necessary
for…
Pedestrians
Car drivers
Bicyclists
Car drivers and bicyclists
Pedestrians and bicyclists
Car drivers and pedestrians
Criteria for communication to meet
perceived necessity
none
Recognizability/conspicuity
Comprehensibility
Perceptible via different senses
Uniformity
Reliability
Not disturbing
13

14

6
1
1
3
2
1
20
4
8
7
3
1
1
1
43.33

46.66

20
3.33
3.33
10
6.66
3.33
66.66
13.33
26.66
23.33
10.00
3.33
3.33
3.33
8

6

2
0
1
1
2
0
9
1
4
4
1
0
1
1
5

8

4
1
0
2
0
1
11
3
4
3
2
1
0
0
5

10

4
1
0
3
2
0
11
3
4
3
2
0
1
0
8

4

2
0
1
0
0
1
9
1
4
4
1
1
0
1
7

7

1
1
1
2
2
0
12
3
5
3
2
1
1
1
3

5

3
0
0
1
0
1
7
0
3
4
1
0
0
0
3

2

2
0
0
0
0
0
1
1
0
0
0
0
0
0
Analyzed Interviews30100151517131596
Table A5. Attitude towards the Automated Shuttle and AVs in General.
Participants% TCATCA-IfmAG1AG2AG3
No change in attitude1033.334646514
Expectations met/neutral9304545414
nothing new/surprising13.330101100
Change in attitude2066.661191281082
Positive change in attitude1550105106970
Increased trust/better than expectation1446.669595770
Faster adaption/feels normal413.334031400
Negative change in attitude416.660423212
less autonomous than expected413.330313112
Insecurities confirmed and strengthened26.660220101
Positive and negative influence on attitude13.331001100
Analyzed Interviews30100151517131596
Table A6. Evaluation of the Communication Design and Improvement Wishes.
Participants% TCATCA-IfmAG1AG2AG3
Evaluation of visibility/conspicuity9306363540
Very recognizable26.661120110
Not recognizable723.335243430
Evaluation of content9304545432
Enough/good516.663223320
Too much413.331322112
Evaluation of comprehensibility2996.67141515141496
Comprehensible1756.6675210543
Not comprehensible1240710134953
Icons124059104743
sensor bars6202442330
Other icons516.660541410
Combination icons and words6201560402
Timing/Consequences723.334361322
Relation to participants’ actions723.333470322
No improvement wishes3101203120
Improvement wishes2786.66131316101476
Color12407566651
Information on behavior1136.666583452
Instructions to other road users723.333461412
On Icons124057102831
On display723.333452430
Warning range26.662011110
Warning signal413.333131220
Explanation3100321102
Information on position of other road users26.661111200
Information on distance3102112012
Acoustical signal26.660211002
Autonomous car sign26.660211011
Analyzed Interviews30100151517131596

References

  1. Drive 2 the Future. Available online: https://www.drive2thefuture.eu/ (accessed on 20 December 2020).
  2. Sucha, M.; Dostal, D.; Risser, R. Pedestrian-Driver Communication and Decision Strategies at Marked Crossings. Accid. Anal. Prev. 2017, 102, 41–50. [Google Scholar] [CrossRef] [Green Version]
  3. Vinkhuyzen, E.; Cefkin, M. Developing Socially Acceptable Autonomous Vehicles. In Ethnographic Praxis in Industry Conference Proceedings; Wiley: Hoboken, NJ, USA, 2016; Volume 2016, pp. 522–534. [Google Scholar] [CrossRef]
  4. Holländer, K.; Wintersberger, P.; Butz, A. Overtrust in External Cues of Automated Vehicles: An Experimental Investigation. In Proceedings of the 11th International Conference on Automotive User Interfaces and Interactive Vehicular Applications, Utrecht, The Netherlands, 21–25 September 2019; Association for Computing Machinery: New York, NY, USA, 2019; pp. 211–221. [Google Scholar]
  5. Ekman, F.; Johansson, M.; Sochor, J. Creating Appropriate Trust in Automated Vehicle Systems: A Framework for HMI Design. IEEE Trans. Hum. Mach. Syst. 2018, 48, 95–101. [Google Scholar] [CrossRef]
  6. Lee, J.D.; See, K.A. Trust in Automation: Designing for Appropriate Reliance. Hum. Factors 2004, 46, 50–80. [Google Scholar] [CrossRef]
  7. Rehrl, K.; Zankl, C. Digibus©: Results from the First Self-Driving Shuttle Trial on a Public Road in Austria. Eur. Transp. Res. Rev. 2018, 10, 51. [Google Scholar] [CrossRef]
  8. Distler, V.; Lallemand, C.; Bellet, T. Acceptability and Acceptance of Autonomous Mobility on Demand: The Impact of an Immersive Experience. In Proceedings of the CHI 2018—Extended Abstracts of the 2018 CHI Conference on Human Factors in Computing Systems: Engage with CHI, Montreal, QC, Canada, 20 April 2018; Association for Computing Machinery: New York, NY, USA, 2018; p. 612. [Google Scholar]
  9. Zwicker, L.; Petzoldt, T.; Schade, J.; Schaarschmidt, E. Kommunikation zwischen automatisierten Kraftfahrzeugen und anderen Verkehrsteilnehmern—Was brauchen wir überhaupt. In Hands off, Human Factors Off?—Welche Rolle Spielen Human Factors in der Fahrzeugautomation? Bruder, R., Winner, H., Eds.; Universitäts- und Landesbibliothek Darmstadt: Darmstadt, Germany, 2019; pp. 47–57. [Google Scholar]
  10. Löcken, A.; Golling, C.; Riener, A. How Should Automated Vehicles Interact with Pedestrians? A Comparative Analysis of Interaction Concepts in Virtual Reality. In Proceedings of the 11th International Conference on Automotive User Interfaces and Interactive Vehicular Applications, Utrecht, The Netherlands, 21–25 September 2019; Association for Computing Machinery: New York, NY, USA, 2019; pp. 262–274. [Google Scholar]
  11. Faas, S.M.; Mathis, L.-A.; Baumann, M. External HMI for Self-Driving Vehicles: Which Information Shall Be Displayed? Transp. Res. Part F Traff. Psychol. Behav. 2020, 68, 171–186. [Google Scholar] [CrossRef]
  12. Clamann, M.; Aubert, M.; Cummings, M.L. Evaluation of Vehicle-to-Pedestrian Communication Displays for Autonomous Vehicles. In Proceedings of the Transportation Research Board 96th Annual Meeting, Washington, DC, USA, 8–12 January 2017. [Google Scholar]
  13. Li, Y.; Dikmen, M.; Hussein, T.G.; Wang, Y.; Burns, C. To Cross or Not to Cross: Urgency-Based External Warning Displays on Autonomous Vehicles to Improve Pedestrian Crossing Safety. In Proceedings of the 10th International Conference on Automotive User Interfaces and Interactive Vehicular Applications, Toronto, ON, Canada, 23–25 September 2018; Association for Computing Machinery: New York, NY, USA, 2018; pp. 188–197. [Google Scholar]
  14. Colley, M.; Rukzio, E. A Design Space for External Communication of Autonomous Vehicles. In Proceedings of the 12th International Conference on Automotive User Interfaces and Interactive Vehicular Applications, Washington, DC, USA, 21–22 September 2020; Association for Computing Machinery: New York, NY, USA, 2020; pp. 212–222. [Google Scholar]
  15. Dey, D.; Habibovic, A.; Löcken, A.; Wintersberger, P.; Pfleging, B.; Riener, A.; Martens, M.; Terken, J. Taming the EHMI Jungle: A Classification Taxonomy to Guide, Compare, and Assess the Design Principles of Automated Vehicles’ External Human-Machine Interfaces. Transp. Res. Interdiscip. Perspect. 2020, 7, 100174. [Google Scholar] [CrossRef]
  16. Schieben, A.; Wilbrink, M.; Kettwich, C.; Madigan, R.; Louw, T.; Merat, N. Designing the Interaction of Automated Vehicles with Other Traffic Participants: Design Considerations Based on Human Needs and Expectations. Cogn. Technol. Work 2019, 21, 69–85. [Google Scholar] [CrossRef] [Green Version]
  17. Mahadevan, K.; Somanath, S.; Sharlin, E. Communicating Awareness and Intent in Autonomous Vehicle-Pedestrian Interaction. In Proceedings of the 2018 CHI Conference on Human Factors in Computing Systems, Montreal, QC, Canada, 23–26 April 2018; Association for Computing Machinery: New York, NY, USA, 2018; pp. 1–12, ISBN 978-1-4503-5620-6. [Google Scholar]
  18. Owensby, C.; Tomitsch, M.; Parker, C. A Framework for Designing Interactions between Pedestrians and Driverless Cars: Insights from a Ride-Sharing Design Study. In Proceedings of the 30th Australian Conference on Computer-Human Interaction, New York, NY, USA, 4 December 2018; Association for Computing Machinery: New York, NY, USA, 2018; pp. 359–363. [Google Scholar]
  19. Rasouli, A.; Kotseruba, I.; Tsotsos, J.K. Understanding Pedestrian Behavior in Complex Traffic Scenes. IEEE Trans. Intell. Veh. 2018, 3, 61–70. [Google Scholar] [CrossRef]
  20. Kaleefathullah, A.A.; Merat, N.; Lee, Y.M.; Eisma, Y.B.; Madigan, R.; Garcia, J.; de Winter, J. External Human–Machine Interfaces Can Be Misleading: An Examination of Trust Development and Misuse in a CAVE-Based Pedestrian Simulation Environment. Hum. Factors 2020, 0018720820970751. [Google Scholar] [CrossRef]
  21. Kooijman, L.; Happee, R.; de Winter, J.C.F. How Do EHMIs Affect Pedestrians’ Crossing Behavior? A Study Using a Head-Mounted Display Combined with a Motion Suit. Information 2019, 10, 386. [Google Scholar] [CrossRef] [Green Version]
  22. Nuñez Velasco, J.P.; Farah, H.; van Arem, B.; Hagenzieker, M.P. Studying Pedestrians’ Crossing Behavior When Interacting with Automated Vehicles Using Virtual Reality. Transp. Res. Part F Traff. Psychol. Behav. 2019, 66, 1–14. [Google Scholar] [CrossRef] [Green Version]
  23. De Clercq, K.; Dietrich, A.; Núñez Velasco, J.P.; de Winter, J.; Happee, R. External Human-Machine Interfaces on Automated Vehicles: Effects on Pedestrian Crossing Decisions. Hum. Factors 2019, 61, 1353–1370. [Google Scholar] [CrossRef] [Green Version]
  24. Moore, D.; Currano, R.; Strack, G.E.; Sirkin, D. The Case for Implicit External Human-Machine Interfaces for Autonomous Vehicles. In Proceedings of the 11th International Conference on Automotive User Interfaces and Interactive Vehicular Applications, Utrecht, The Netherlands, 21–25 September 2019; Association for Computing Machinery: New York, NY, USA, 2019; pp. 295–307. [Google Scholar]
  25. Rodríguez Palmeiro, A.; van der Kint, S.; Vissers, L.; Farah, H.; de Winter, J.C.F.; Hagenzieker, M. Interaction between Pedestrians and Automated Vehicles: A Wizard of Oz Experiment. Transp. Res. Part F Traff. Psychol. Behav. 2018, 58, 1005–1020. [Google Scholar] [CrossRef] [Green Version]
  26. Dey, D.; Terken, J. Pedestrian Interaction with Vehicles: Roles of Explicit and Implicit Communication. In Proceedings of the 9th International Conference on Automotive User Interfaces and Interactive Vehicular Applications, New York, NY, USA, 24 September 2017; Association for Computing Machinery: New York, NY, USA, 2017; pp. 109–113. [Google Scholar]
  27. Deb, S.; Strawderman, L.J.; Carruth, D.W. Investigating Pedestrian Suggestions for External Features on Fully Autonomous Vehicles: A Virtual Reality Experiment. Transp. Res. Part F Traff. Psychol. Behav. 2018, 59, 135–149. [Google Scholar] [CrossRef]
  28. Mahadevan, K.; Sanoubari, E.; Somanath, S.; Young, J.E.; Sharlin, E. AV-Pedestrian Interaction Design Using a Pedestrian Mixed Traffic Simulator. In Proceedings of the 2019 on Designing Interactive Systems Conference, New York, NY, USA, 18 June 2019; Association for Computing Machinery: New York, NY, USA, 2019; pp. 475–486. [Google Scholar]
  29. Colley, M.; Walch, M.; Gugenheimer, J.; Askari, A.; Rukzio, E. Towards Inclusive External Communication of Autonomous Vehicles for Pedestrians with Vision Impairments. In Proceedings of the 2020 CHI Conference on Human Factors in Computing Systems, New York, NY, USA, 21 April 2020; Association for Computing Machinery: New York, NY, USA, 2020; pp. 1–14. [Google Scholar]
  30. Ackermann, C.; Beggiato, M.; Schubert, S.; Krems, J.F. An Experimental Study to Investigate Design and Assessment Criteria: What Is Important for Communication between Pedestrians and Automated Vehicles? Appl. Ergon. 2019, 75, 272–282. [Google Scholar] [CrossRef]
  31. Merat, N.; Louw, T.; Madigan, R.; Wilbrink, M.; Schieben, A. What Externally Presented Information Do VRUs Require When Interacting with Fully Automated Road Transport Systems in Shared Space? Accid. Anal. Prev. 2018, 118, 244–252. [Google Scholar] [CrossRef]
  32. Lee, J.D.; Kolodge, K. Understanding Attitudes Towards Self-Driving Vehicles: Quantitative Analysis of Qualitative Data. Proc. Hum. Factors Ergon. Soc. Annu. Meet. 2018, 62, 1399–1403. [Google Scholar] [CrossRef]
  33. Wiener Linien. Passenger Information. Available online: https%3A%2F%2Fwww.wienerlinien.at%2Feportal3%2Findex.jsp (accessed on 30 January 2021).
  34. SAE On-Road Automated Vehicle Standards Committee. Taxonomy and Definitions for Terms Related to Driving Automation Systems for On-Road Motor Vehicles; SAE International: Warrendale, PA, USA, 2018. [Google Scholar]
  35. Fröhlich, P.; Schatz, R.; Buchta, M.; Schrammel, J.; Suette, S.; Tscheligi, M. “What’s the Robo-Driver up to?” Requirements for Screen-Based Awareness and Intent Communication in Autonomous Buses. i-com 2019, 18, 151–165. [Google Scholar] [CrossRef] [Green Version]
  36. Lin, T.-Y.; Goyal, P.; Girshick, R.; He, K.; Dollár, P. Focal Loss for Dense Object Detection. arXiv 2018, arXiv:1708.02002. Available online: https://openaccess.thecvf.com/content_ICCV_2017/papers/Lin_Focal_Loss_for_ICCV_2017_paper.pdf (accessed on 16 February 2021).
  37. NVIDIA. TensorRT. Available online: https://developer.nvidia.com/tensorrt (accessed on 8 December 2020).
  38. Dehn, D.M. Assessing the Impact of Automation on the Air Traffic Controller: The SHAPE Questionnaires. Air Traff. Control Q. 2008, 16, 127–146. [Google Scholar] [CrossRef]
  39. MAXQDA. All-In-One Qualitative & Mixed Methods Data Analysis Tool. Available online: https://www.maxqda.com/ (accessed on 10 January 2021).
  40. Rettenmaier, M.; Schulze, J.; Bengler, K. How Much Space Is Required? Effect of Distance, Content, and Color on External Human–Machine Interface Size. Information 2020, 11, 346. [Google Scholar] [CrossRef]
  41. Risto, M.; Emmenegger, C.; Vinkhuyzen, E.; Cefkin, M.; Hollan, J. Human-Vehicle Interfaces: The Power of Vehicle Movement Gestures in Human Road User Coordination. In Proceedings of the 2017 Driving Assessment Conference, Manchester, VT, USA, 28 June 2017; pp. 186–192. [Google Scholar]
Figure 1. Automated shuttle (AS) that was used in this study.
Mti 05 00051 g001
Figure 2. Overlay of the bounding boxes onto the image of the road. Pedestrians indicated by yellow, cars by green and bicycles by blue bounding boxes.
Mti 05 00051 g002
Figure 3. Test track along the pilot site of the autonomous shuttles in Vienna.
Mti 05 00051 g003
Figure 4. Final encoding system used for the qualitative content analysis of the interviews.
Mti 05 00051 g004
Figure 5. Frequencies of participants’ answers to interview question 2: did the external communication influence your sense of safety? Why (not)?
Mti 05 00051 g005
Figure 6. Sense of safety: distribution of results according to test condition. (Interview question 2).
Mti 05 00051 g006
Figure 7. Frequencies of participants’ answers to interview question 3: did the external increase the comprehensibility or predictability of the AS’s behavior? Why [not]?
Mti 05 00051 g007
Figure 8. Comprehensibility and predictability: distribution of results according to test condition. (Interview question 3).
Mti 05 00051 g008
Figure 9. Frequencies of participants’ answers to interview question 1: did the external communication of the AS influence your behavior? How? Why [not]?
Mti 05 00051 g009
Figure 10. Experienced behavior change: distribution of results according to test condition. (Interview question 1).
Mti 05 00051 g010
Figure 11. Frequencies of participants’ answers to interview question 4: would you consider external communication as being necessary in automated vehicles? Why [not]? What criteria does external communication have to fulfill in order to meet the stated need?
Mti 05 00051 g011
Figure 12. Perceived necessity of AV’s eHMI: distribution of results according to test condition. (Interview question 4).
Mti 05 00051 g012
Figure 13. Frequencies of participants’ answers to interview question 5: “did your attitude towards the AS or automated vehicles generally change due to this experience? Why [not]? How?”.
Mti 05 00051 g013
Figure 14. Attitude towards the AS and AVs in general: Distribution of results according to test condition. (Interview question 5).
Mti 05 00051 g014
Table 1. Final external communication designs after expert pre-study.
Iconic Awareness Communication (TCA)Iconic Awareness and Textual Intent Communication (“Bus Starts”, TCA-I)Iconic Awareness and Textual Intent Communication (“Bus Brakes”, TCA-I)
Mti 05 00051 i001 Mti 05 00051 i002 Mti 05 00051 i003
Table 2. Dependent variables and their operationalization in the questionnaire.
Dependent Variable Statement Answer Options
1. comprehensibility of the AS’s behaviorI. The interaction with the automated bus was…
II. I have been able to understand the bus’s behavior.
Mti 05 00051 i004
Mti 05 00051 i005
Mti 05 00051 i006
Mti 05 00051 i007
2. predictability of the AS’s behaviorI. I have been able to predict the bus’s behavior. Mti 05 00051 i008
3. sense of safetyI. I felt safe.
II. I felt insecure when being confronted with the AS.
Mti 05 00051 i009
4. trust in communicationI. The AS’s communication was useful.
II. The AS’s communication was reliable.
III. The AS’s communication worked accurately and robustly.
IV. The AS’s communication was understandable.
Mti 05 00051 i010
Table 3. Sample distribution with regard to experimental conditions, gender and age groups.
Sample Distribution According to…Number of ParticipantsTCATCA-I
Test conditionTCA:only iconic awareness communication 1515-
TCA-I:both iconic awareness communication and textual intent communication 15-15
Genderm:male participants1486
f:female participants 1679
Age groupAG1:between 20 and 39 years old1587
AG2:between 40 and 59 years old954
AG3:older than 59 years624
Table 4. Summary of pairwise comparisons for Wilcoxon signed rank test and Wilcoxon rank-sum test of statements concerning the participants’ sense of safety.
CCTCATCA-ITCA Compared to CCTCA-I Compared to CCTCA Compared to TCA-I
StatementMdnIQRMdnIQRMdnIQRVpVpWp
3.I I felt safe. 61616190.762.50.201050.74
3.II I felt insecure when being confronted with the AS.1212.512.5141120.791060.79
Table 5. Summary of pairwise comparison for Wilcoxon rank-sum test of statements concerning an evaluation of the participant’s trust in the communication design.
TCATCA-ITCA Compared to TCA-I
StatementMdnIQRMdnIQRWp
4.I The AS’s communication was useful.5441.5115.50.92
4.II The AS’s communication was reliable. 53531090.90
4.III The AS’s communication worked accurately and robustly.52.561.5840.21
4.IV The AS’s communication was understandable. 5452.5105.50.78
Table 6. Summary of pairwise comparisons for Wilcoxon signed rank test and Wilcoxon rank-sum test of statements concerning perceived predictability and comprehensibility of the AS’s behavior.
CCTCATCA-ITCA Compared to CCTCA-I Compared to CCTCA Compared to TCA-I
StatementMdnIQRMdnIQRMdnIQRVpVpWp
1.I The interaction with the AS was …
(a) Intuitively learnable/difficult to learn1101115115.50.8695.50.45
(b) complicated/uncomplicated616161150.37150.71107.70.83
(c) unambiguous/confusing121212120.41290.75104.50.74
1.II I’ve been able to understand the AS’s behavior.52505242.50.5480.67990.57
2.I I’ve been able to predict the AS’s behavior.614142340.44150.931250.61
Publisher’s Note: MDPI stays neutral with regard to jurisdictional claims in published maps and institutional affiliations.

