Spatio-Temporal Patterns of Dengue Incidence in Medan City, North Sumatera, Indonesia

 ,
, 
 ,
,
Abstract
:1. Introduction
2. Materials and Methods
2.1. Study Design
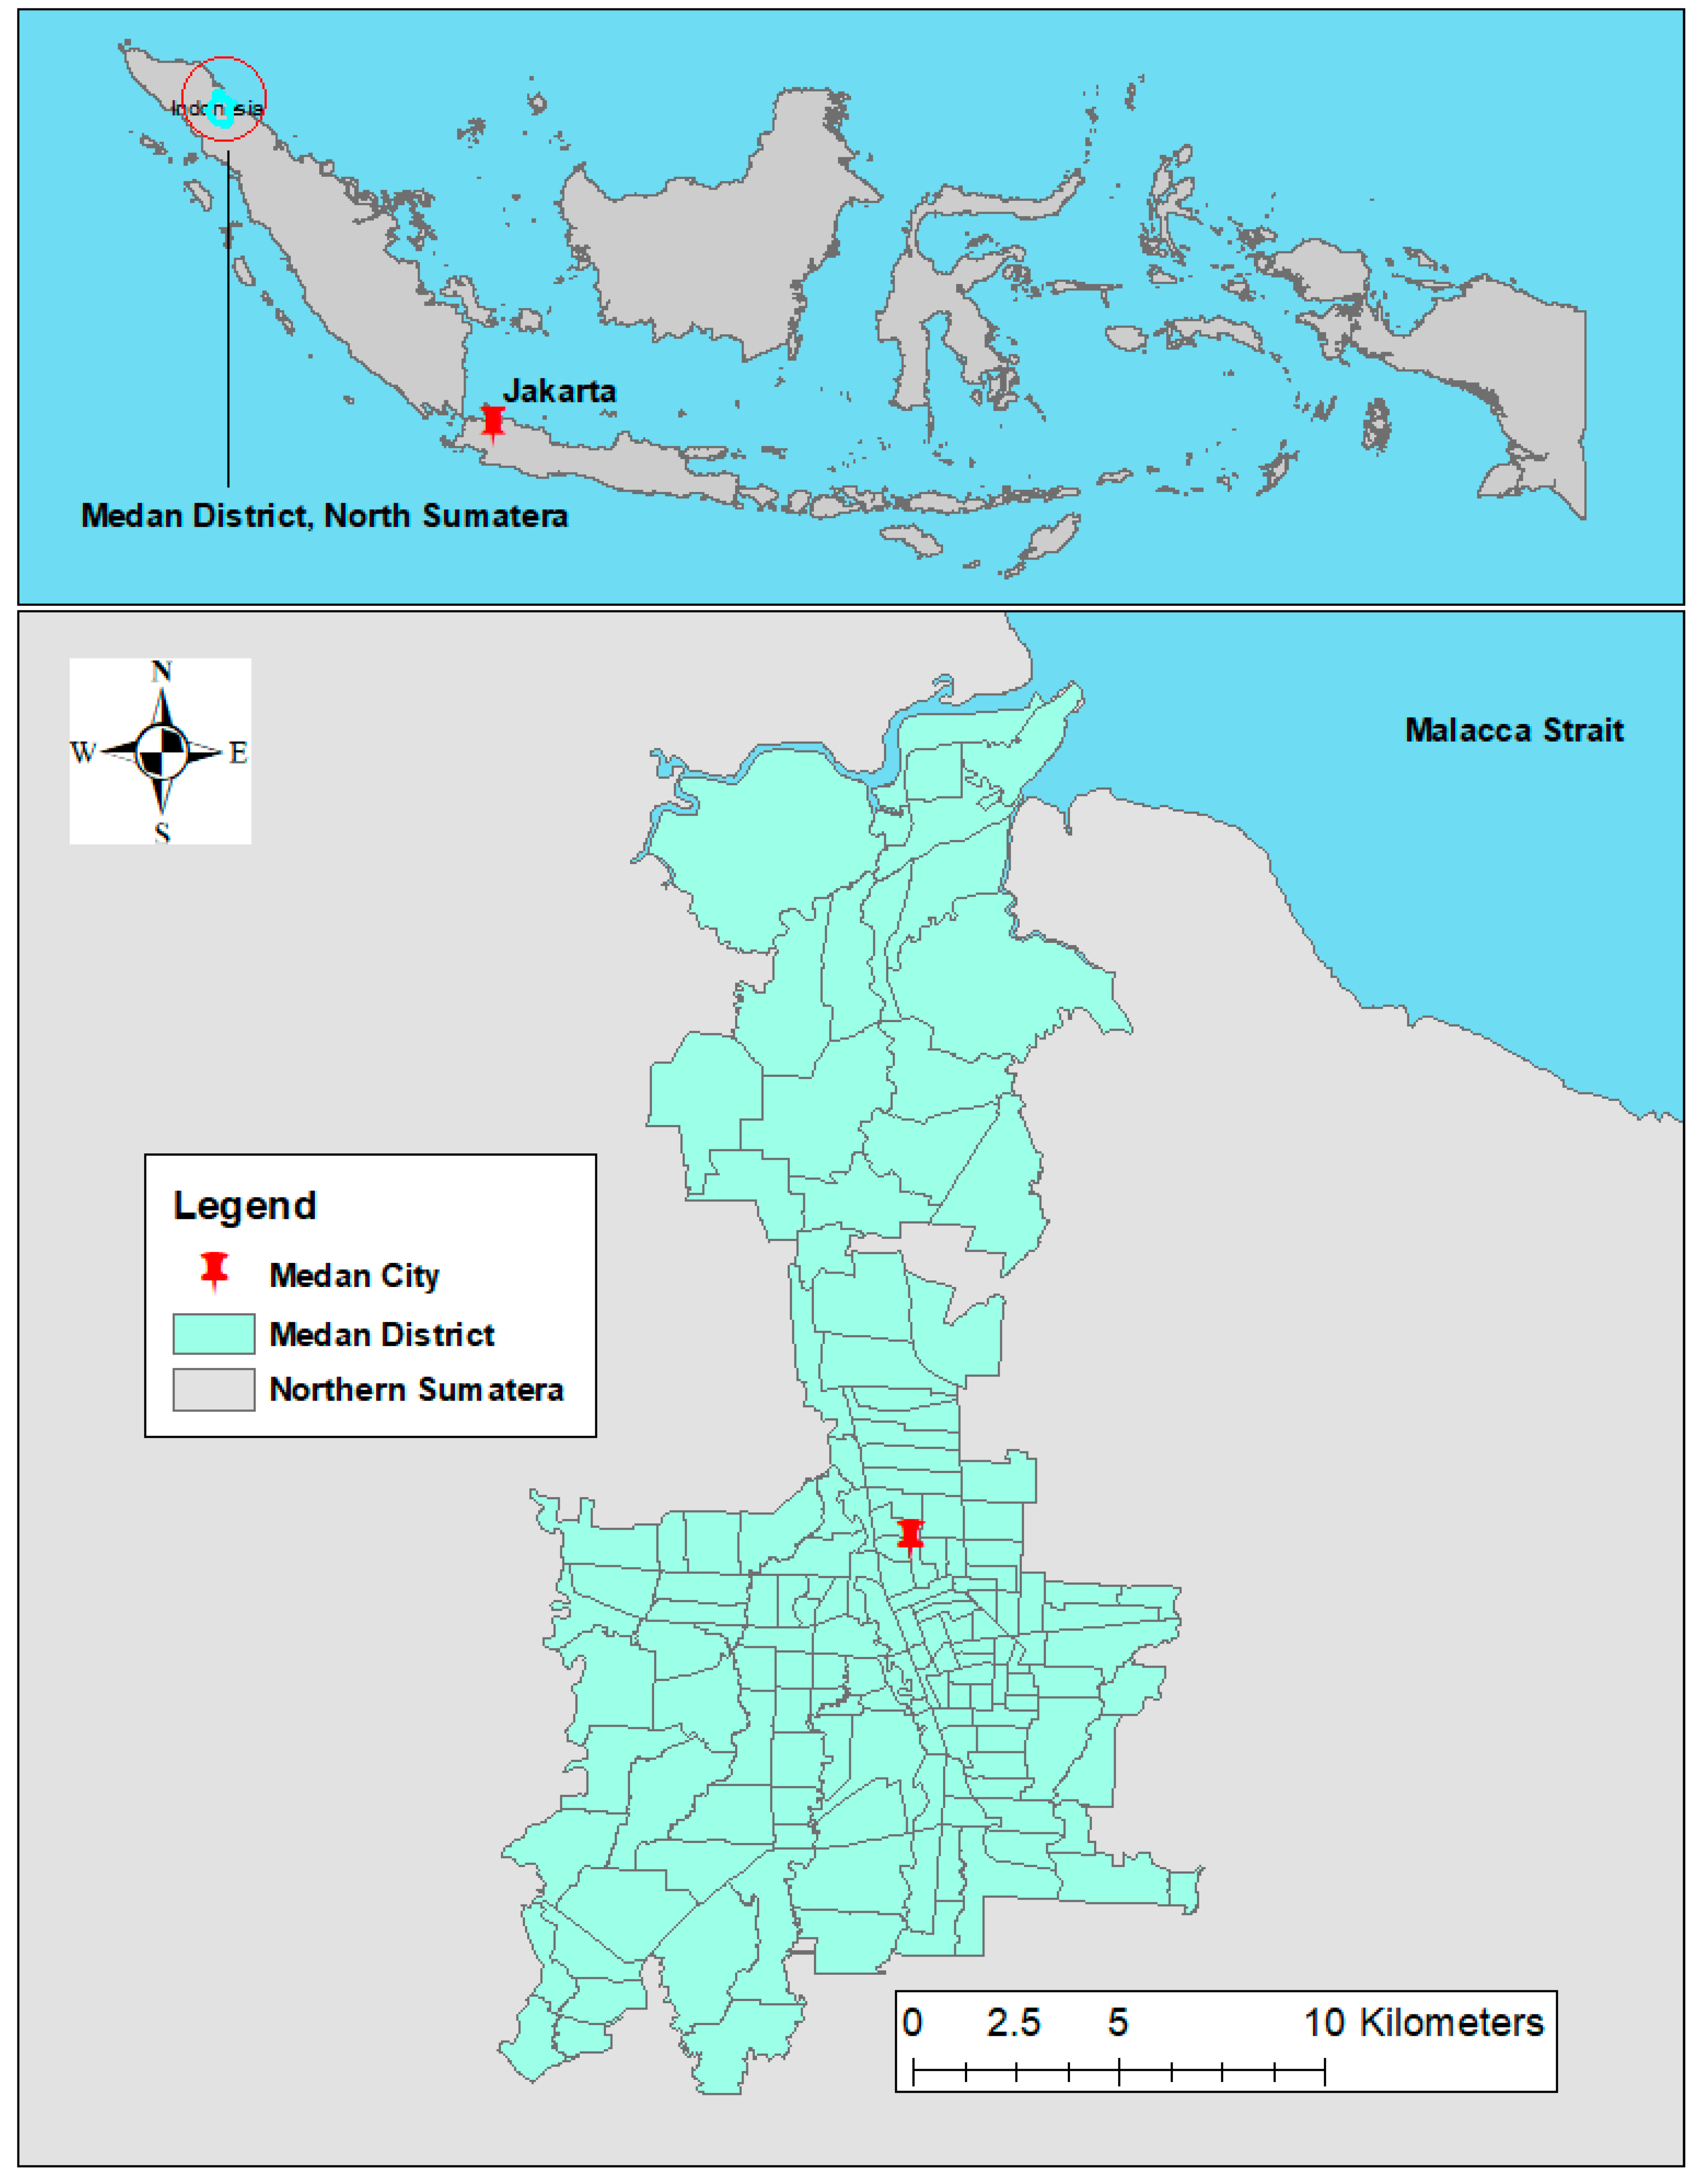
2.2. Study Setting
2.3. Data Source
2.4. Geographical Distribution of Dengue Incidence
2.5. Temporal Trends of Dengue
2.6. Spatio-Temporal Analysis
2.7. Hotspot Analysis
2.8. Ethical Consideration
3. Result
3.1. Dengue Incidence
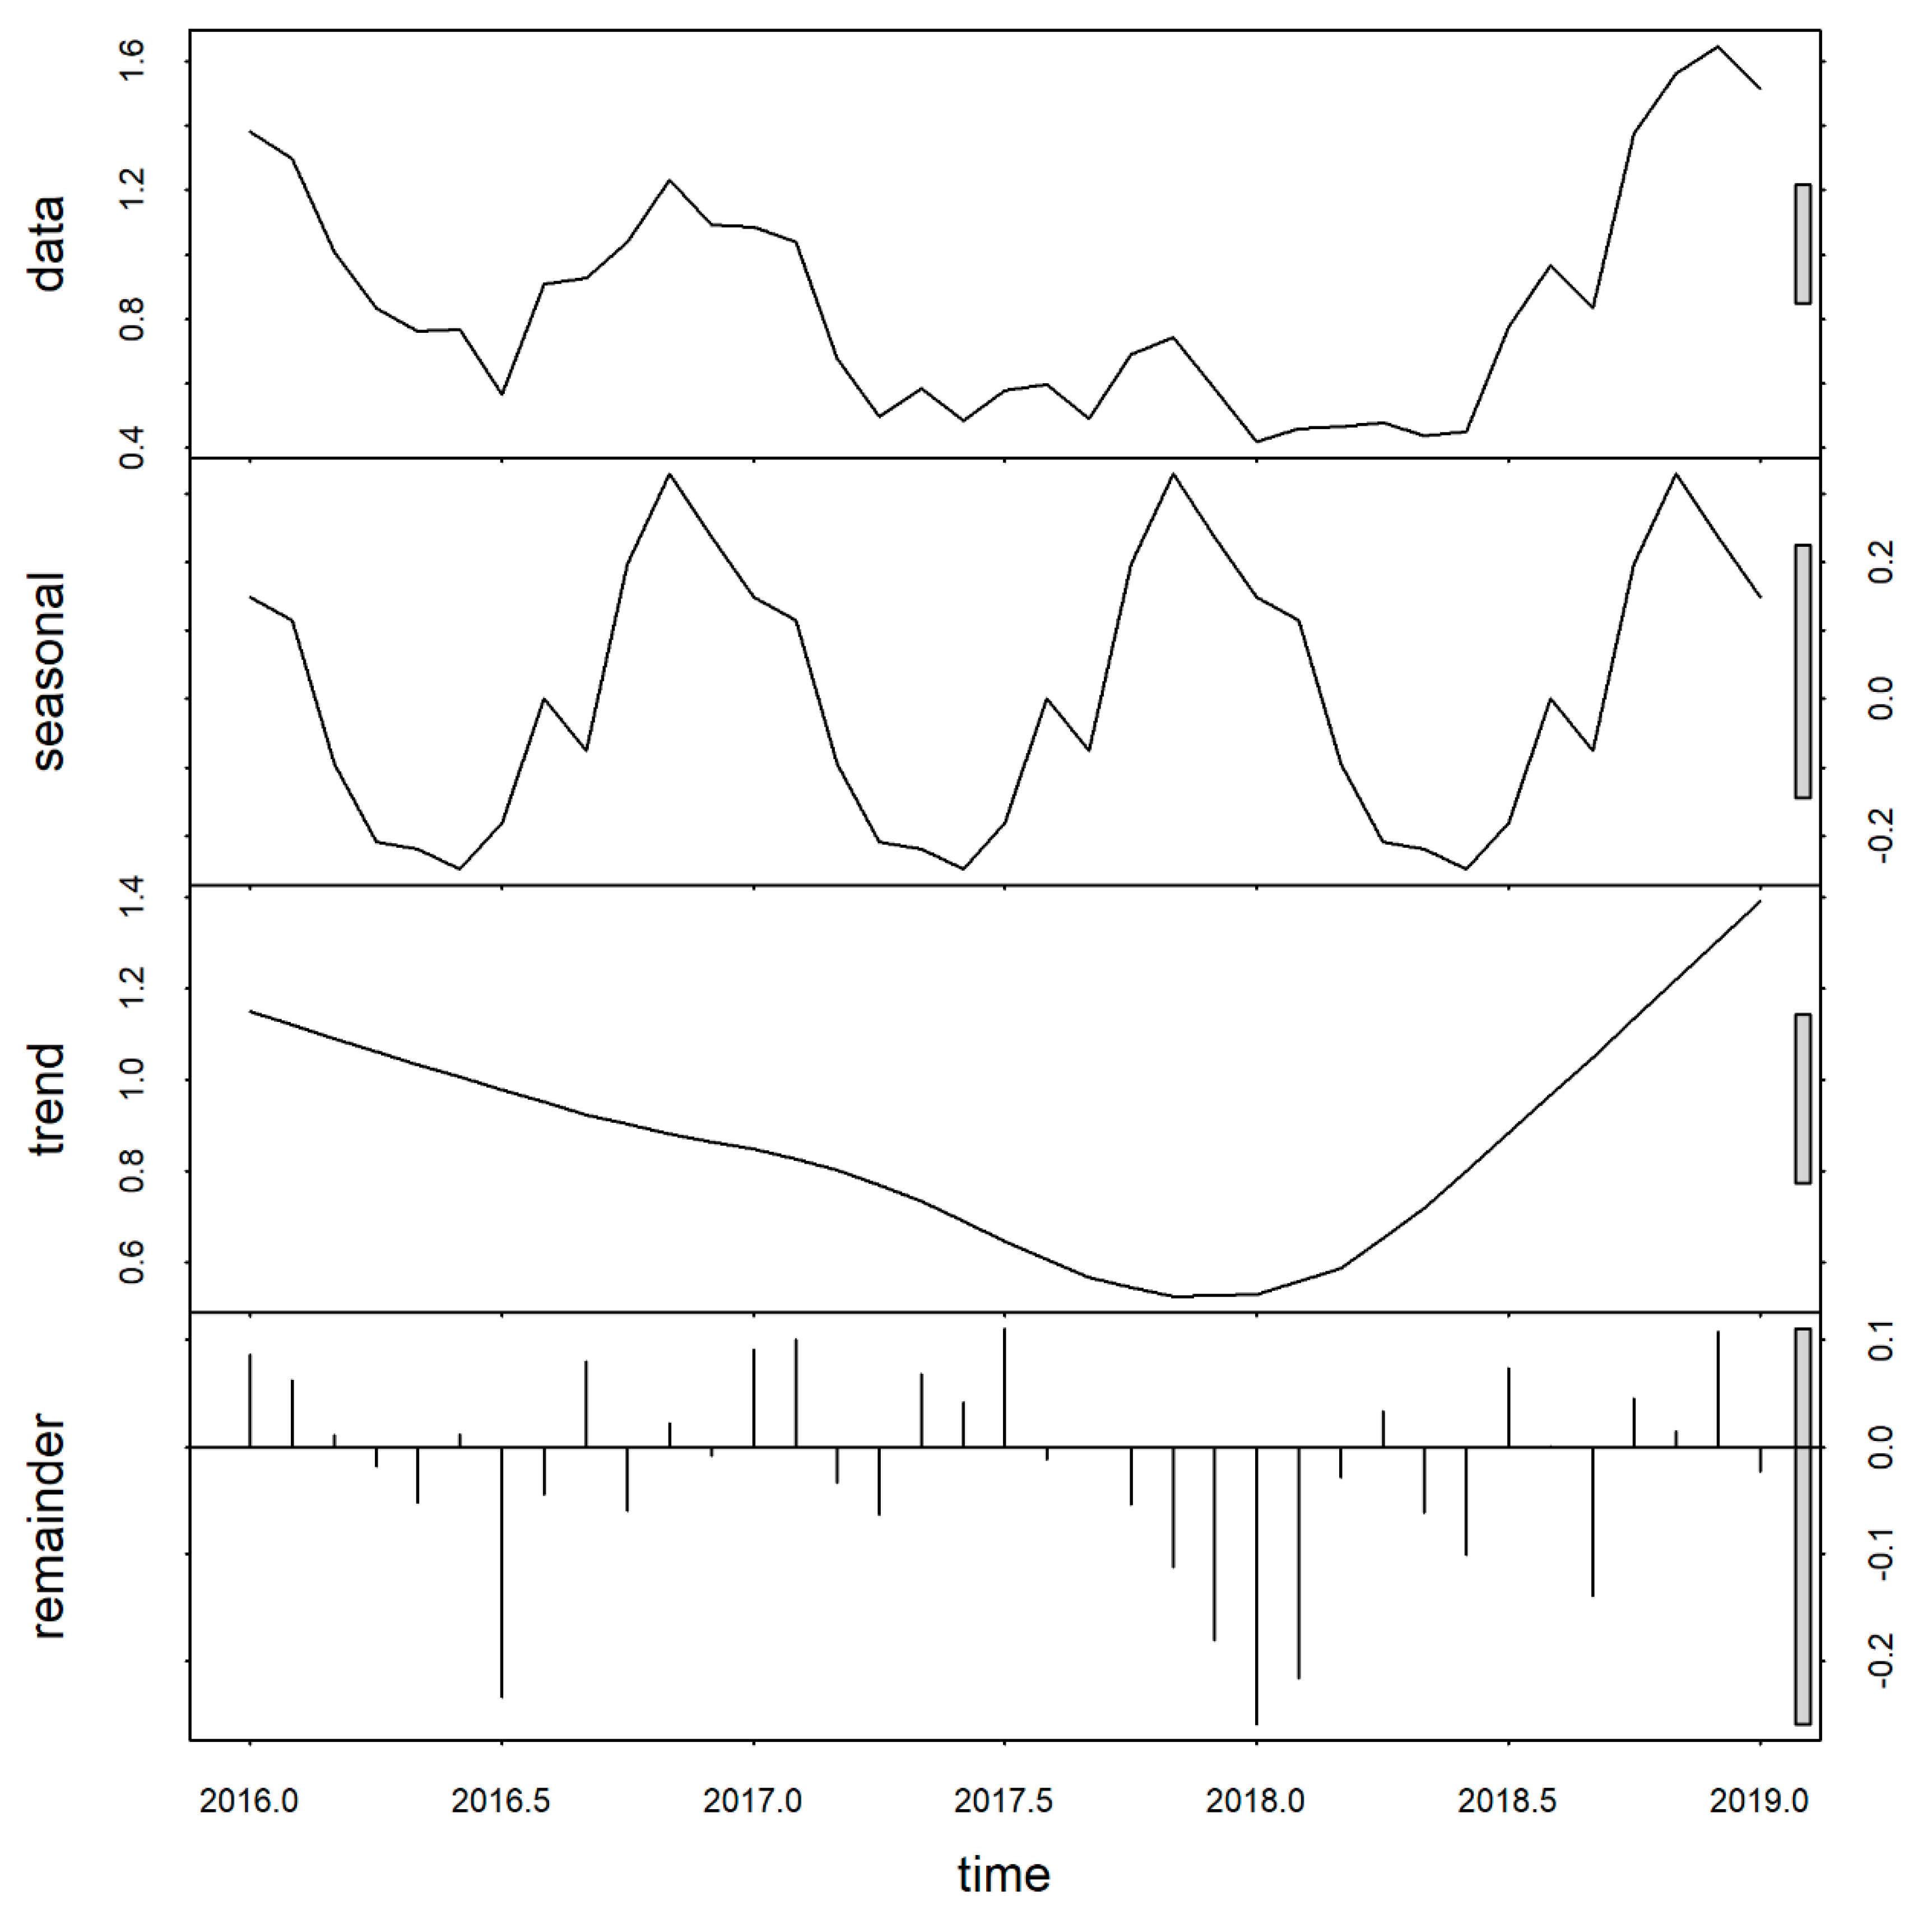
3.2. Temporal Trends and Seasonality
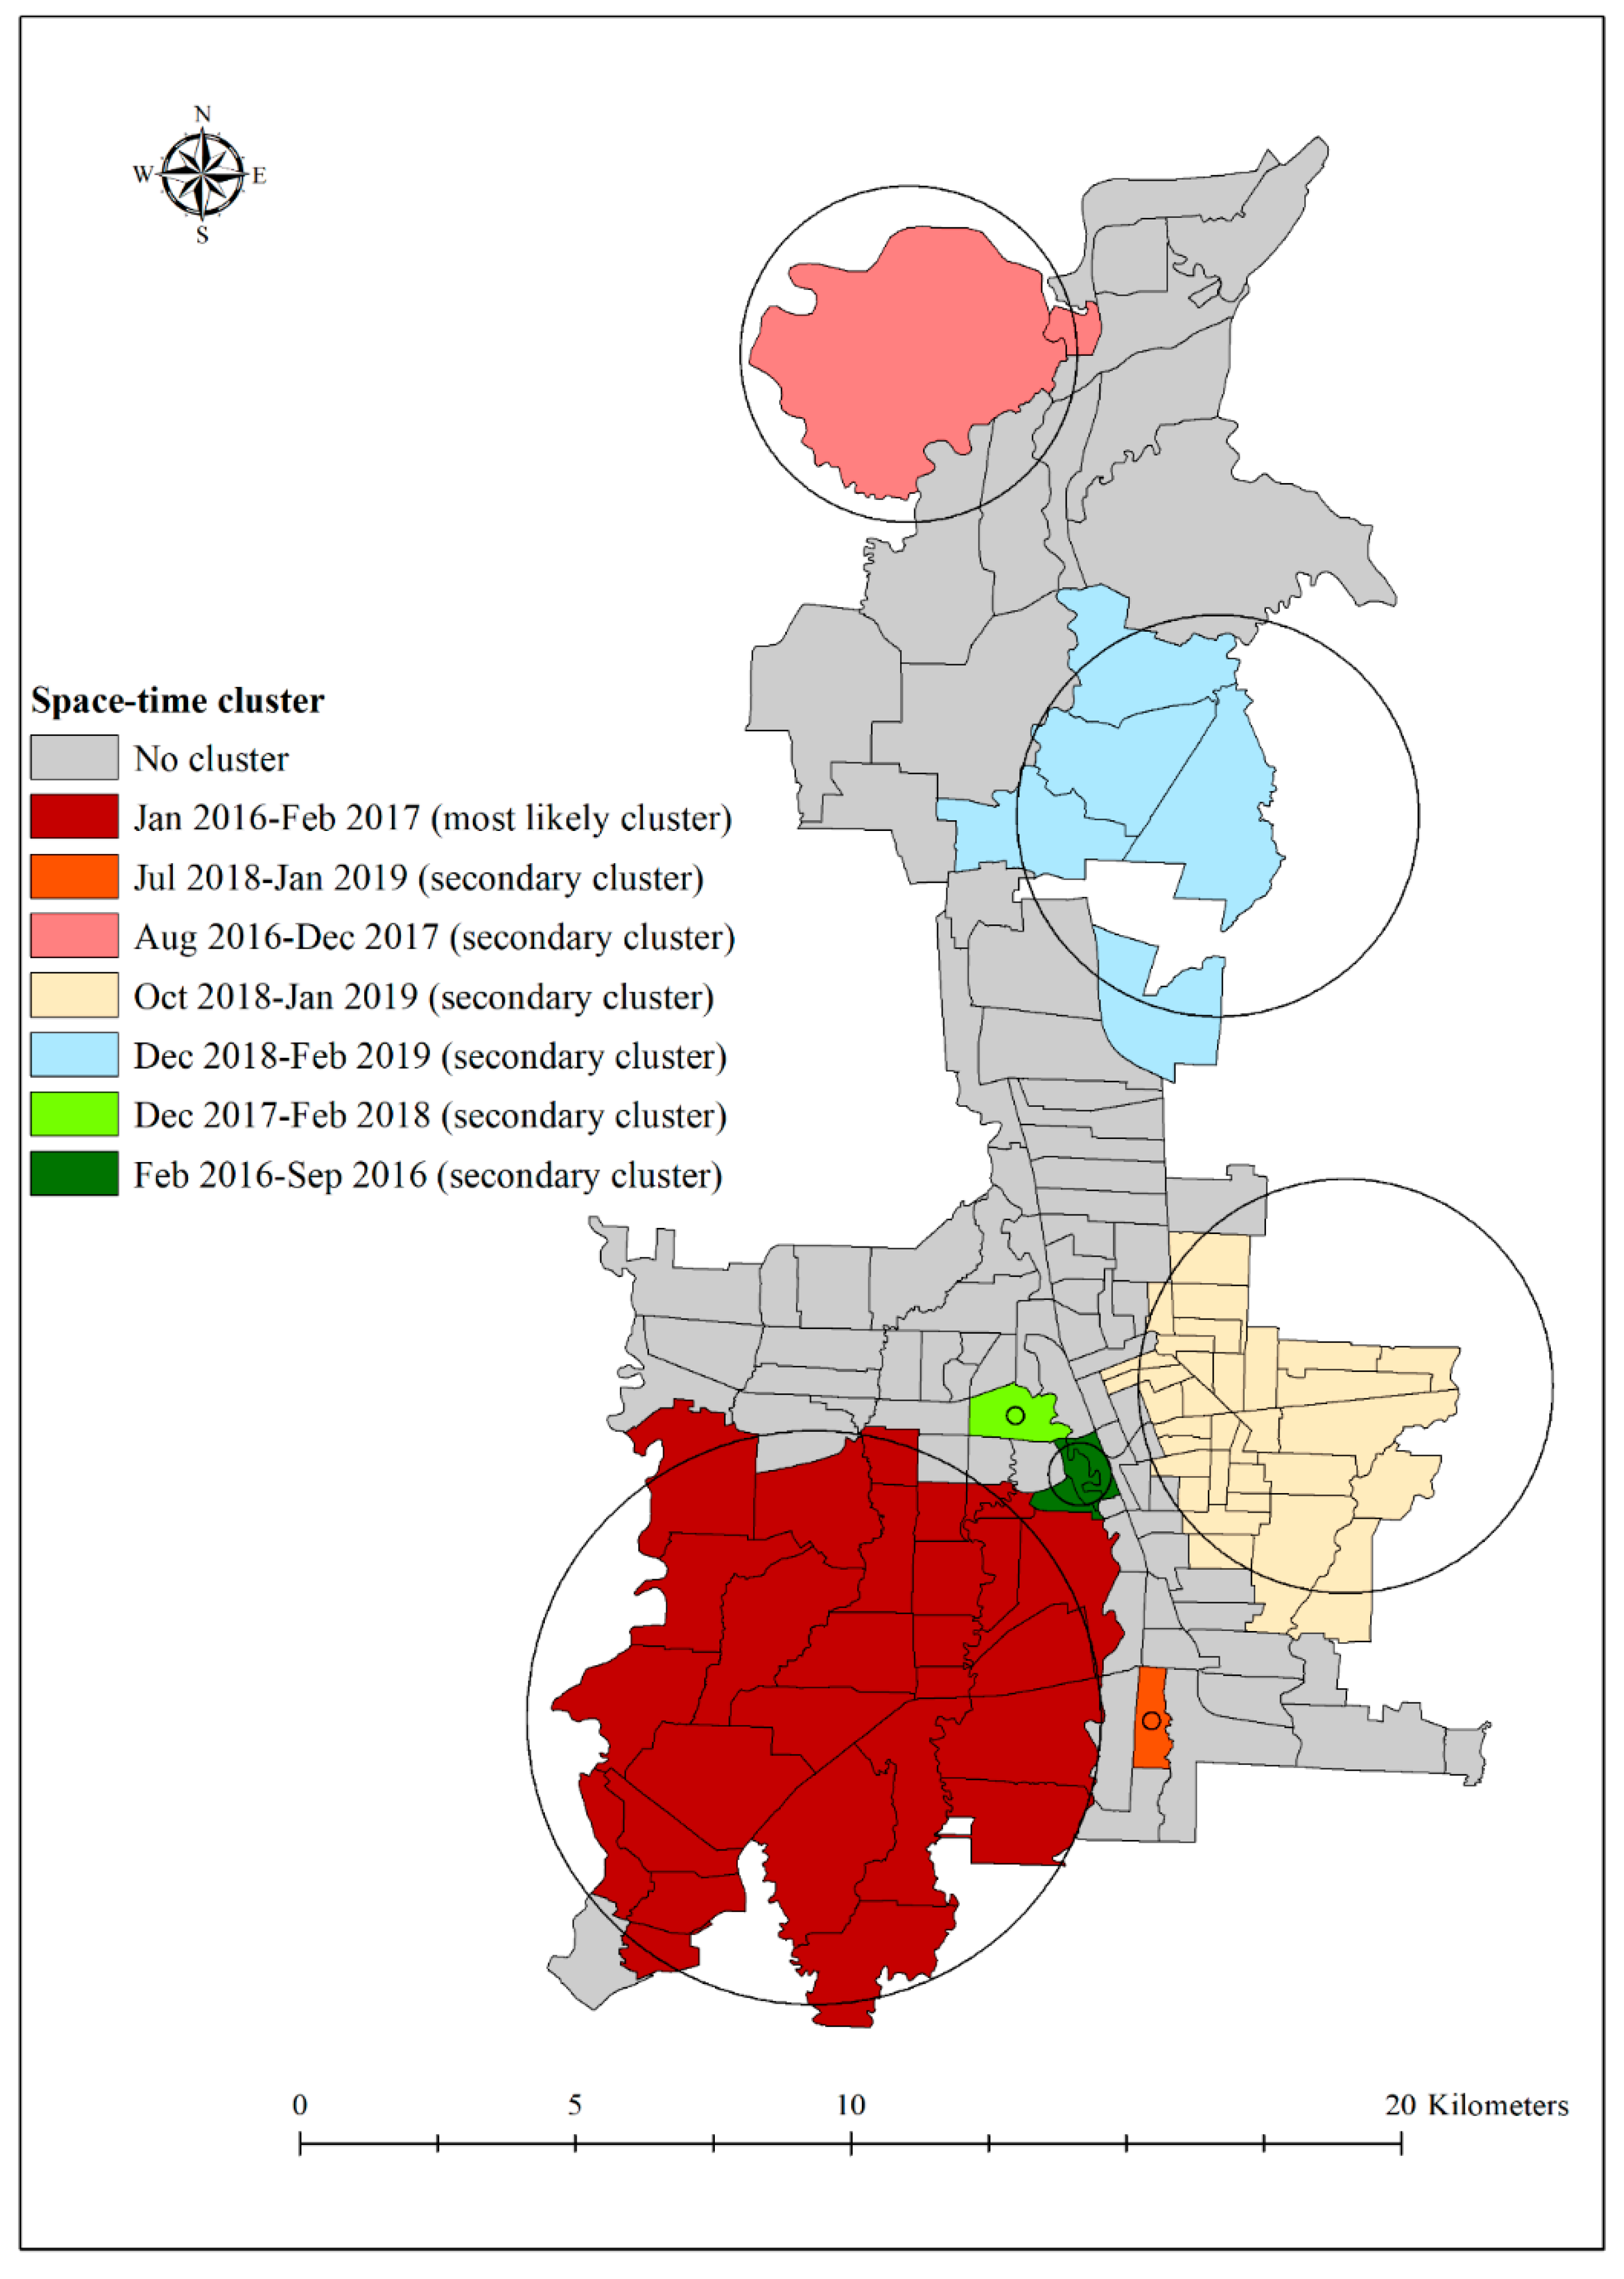
3.3. Space-Time Clusters
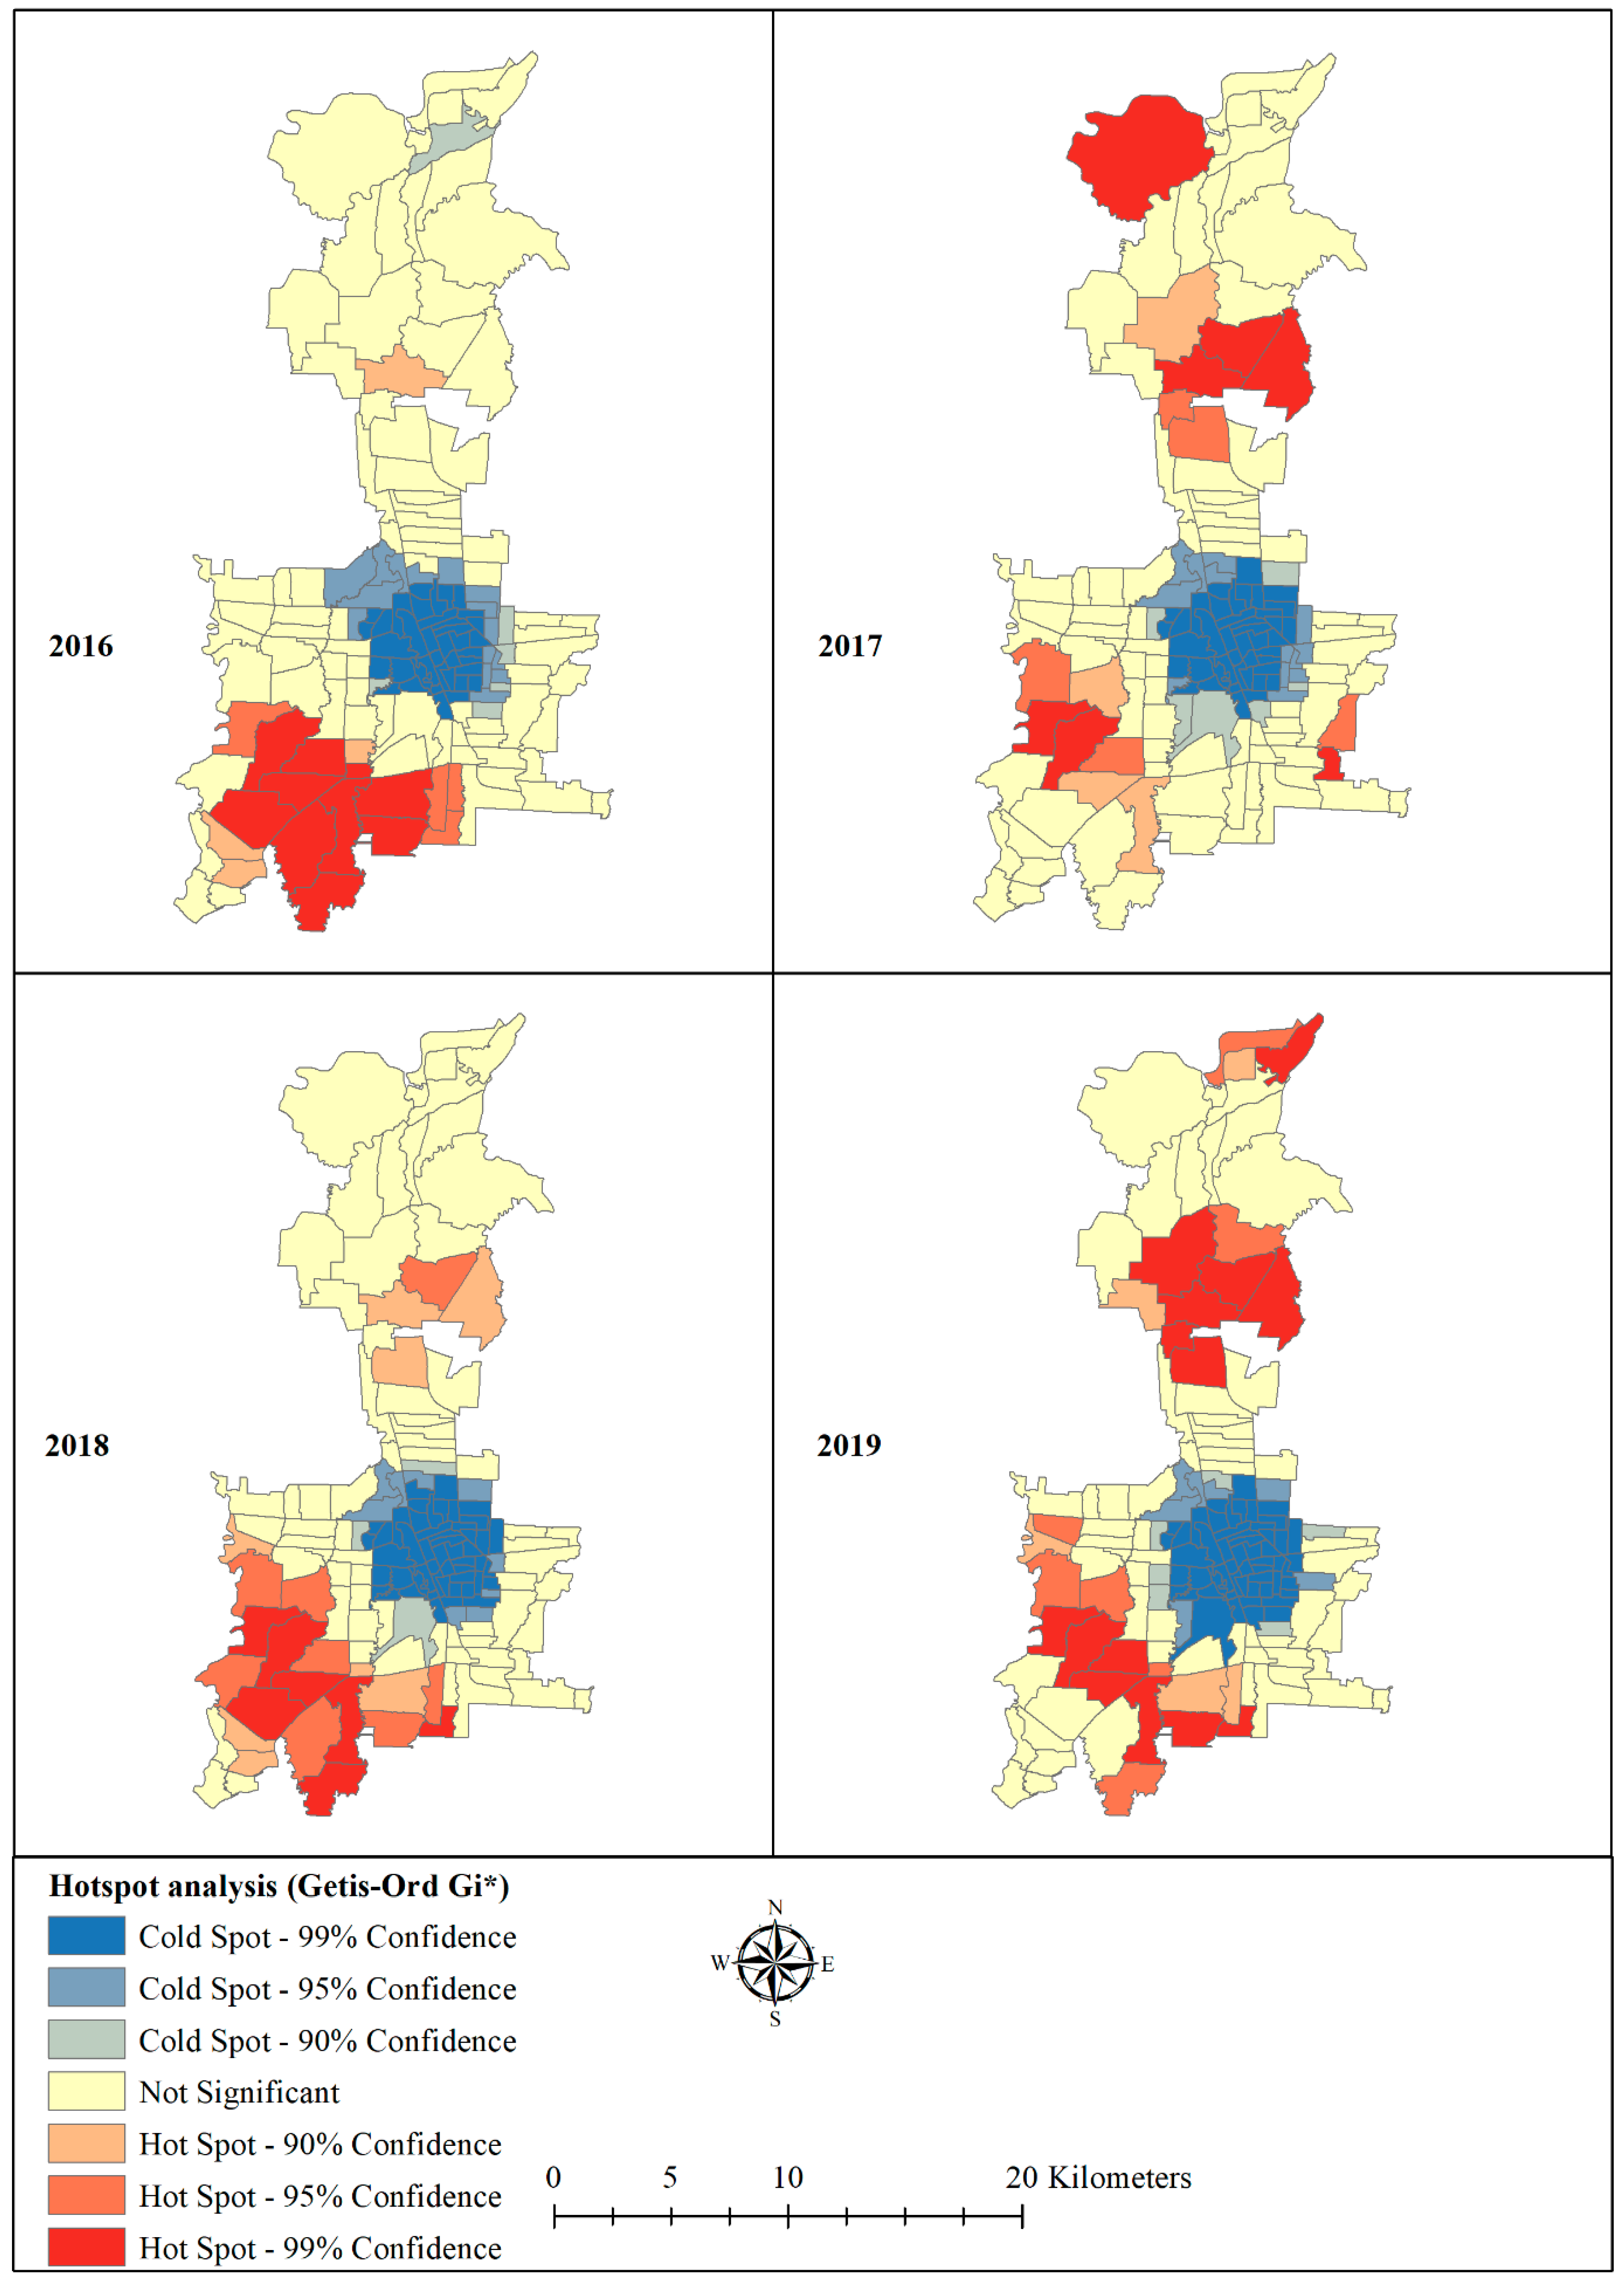
3.4. Hotspot and Coldspots
4. Discussion
5. Conclusions
Supplementary Materials
Author Contributions
Funding
Institutional Review Board Statement
Informed Consent Statement
Data Availability Statement
Acknowledgments
Conflicts of Interest
References
- WHO. Glocal Strategy for Dengue Prevention and Control; World Health Organization: Geneva, Switzerland, 2012. [Google Scholar]
- WHO. Dengue and Severe Dengue; World Health Organization: Geneva, Switzerland, 2017. [Google Scholar]
- Tsheten, T.; Mclure, A.; Clements, A.C.A.; Gray, D.J.; Wangdi, T.; Wangchuk, S.; Wangdi, K. Epidemiological Analysis of the 2019 Dengue Epidemic in Bhutan. Int. J. Environ. Res. Public Health 2021, 18, 354. [Google Scholar] [CrossRef] [PubMed]
- Powers, A.M. How Chikungunya Virus Virology Affects Its Epidemiology and Transmission: Implications for Influencing Pub-lic Health. J. Infect. Dis. 2016, 214 (Suppl 5), S449–S452. [Google Scholar] [CrossRef] [Green Version]
- WHO. Comprehensive Guidelines for Prevention and Control of Dengue and Dengue Haemorrhagic Fever; World Health Organization Regional Officer for South East Asia: New Delhi, India, 2011; p. 212. [Google Scholar]
- Dash, A.P.; Bhatia, R.; Sunyoto, T.; Mourya, D.T. Emerging and re-emerging arboviral diseases in Southeast Asia. J. Vector Borne Dis. 2013, 50, 77. [Google Scholar]
- WHO. Chikungunya 2018. Available online: http://www.who.int/ith/diseases/chikungunya/en/ (accessed on 10 May 2018).
- Jupp, P.G.; McIntosh, B.M. Aedes furcifer and other mosquitoes as vectors of chikungunya virus at Mica, northeastern Transvaal, South Africa. J. Am. Mosq. Control. Assoc. 1990, 6, 415–420. [Google Scholar]
- Masyeni, S.; Yohan, B.; Sasmono, R.T. Concurrent infections of dengue virus serotypes in Bali, Indonesia. BMC Res. Notes 2019, 12, 129. [Google Scholar] [CrossRef]
- Dewi, B.E.; Nainggolan, L.; Sudiro, T.M.; Chenderawasi, S.; Goentoro, P.L.; Sjatha, F. Circulation of Various Dengue Serotypes in a Community-Based Study in Jakarta, Indonesia. Jpn. J. Infect. Dis. 2021, 74, 17–22. [Google Scholar] [CrossRef]
- MOH. Dengue Fever Situation in Indonesia; Ministry of Health: Jakarta, Indonesia, 2016. [Google Scholar]
- Sudjana, P. Early Diagnosis for Dengue Haemorraghic Fever in Adults. Bull. Jendela Epidemiol. 2010, 2, 48. [Google Scholar]
- Megawati, D.; Masyeni, S.; Yohan, B.; Lestarini, A.; Hayati, R.F.; Meutiawati, F.; Suryana, K.; Widarsa, T.; Budiyasa, D.G.; Budiyasa, N.; et al. Dengue in Bali: Clinical characteristics and genetic diversity of circulating dengue viruses. PLoS Negl. Trop. Dis. 2017, 11, e0005483. [Google Scholar] [CrossRef]
- Maula, A.W.; Fuad, A.; Utarini, A. Ten-years trend of dengue research in Indonesia and South-east Asian countries: A bibliometric analysis. Glob. Heal. Action 2018, 11, 1504398. [Google Scholar] [CrossRef] [PubMed]
- MOH. Indonesia Health Profile 2015; Ministry of Health Data and Information Centre: Jakarta, Indonesia, 2016. [Google Scholar]
- Utama, I.M.S.; Lukman, N.; Sukmawati, D.D.; Alisjahbana, B.; Alam, A.; Murniati, D.; Utama, I.M.G.D.L.; Puspitasari, D.; Kosasih, H.; Laksono, I.; et al. Dengue viral infection in Indonesia: Epidemiology, diagnostic challenges, and mutations from an observational cohort study. PLoS Negl. Trop. Dis. 2019, 13, e0007785. [Google Scholar] [CrossRef] [PubMed] [Green Version]
- Astuti, E.P.; Dhewantara, P.W.; Prasetyowati, H.; Ipa, M.; Herawati, C.; Hendrayana, K. Paediatric dengue infection in Cirebon, Indonesia: A temporal and spatial analysis of notified dengue incidence to inform surveillance. Parasites Vectors 2019, 12, 1–12. [Google Scholar] [CrossRef] [PubMed]
- Dhewantara, P.W.; Ruliansyah, A.; Fuadiyah, M.E.; Astuti, E.P.; Widawati, M. Space-time scan statistics of 2007–2013 dengue incidence in Cimahi City, Indonesia. Geospat. Heal. 2015, 10, 373. [Google Scholar] [CrossRef] [Green Version]
- O’Driscoll, M.; Imai, N.; Ferguson, N.M.; Hadinegoro, S.R.; Satari, H.I.; Tam, C.C.; Dorigatti, I. Spatiotemporal variability in dengue transmis-sion intensity in Jakarta, Indonesia. PLoS Negl. Trop. Dis. 2020, 14, e0008102. [Google Scholar] [CrossRef] [PubMed]
- Husnina, Z.; Clements, A.C.A.; Wangdi, K. Forest cover and climate as potential drivers for dengue fever in Sumatra and Kali-mantan 2006–2016: A spatiotemporal analysis. Trop. Med. Int. Heal. 2019, 24, 888–898. [Google Scholar]
- Siregar, F.A.; Makmur, T. Time Series Analysis of Dengue Hemorrhagic Fever Cases and Climate: A Model for Dengue Prediction; IOP Publishing: Bristol, UK, 2019; Volume 1235. [Google Scholar]
- Setiati, T.E.; Wagenaar, J.F.P.; de Kruif, M.D.; Mairuhu, A.T.A.; van Grop, E.C.M.; Soemantri, A. Changing Epidemiology of Dengue Haemorrhagic Fever in Indonesia. Dengue Bull. 2006, 30, 1–4. [Google Scholar]
- Gubler, D.J.; Suharyono, W.; Lubis, I.; Eram, S.; Sulianti, S.J. Epidemic dengue hemorrhagic fever in rural Indonesia. I. Viro-logical and epidemiological studies. Am. J. Trop. Med. Hyg. 1979, 28, 701–710. [Google Scholar] [CrossRef] [PubMed]
- Santhi, H.; Marsaulina, I. Knowledge, Attitudes, Income and Implementation Regarding the Dengue Fever Prevention Pro-gram in Medan, Indonesia. Br. Int. Exact Sci. J. 2020, 2, 77–83. [Google Scholar]
- Adrizain, R.; Setiabudi, D.; Chairulfatah, A. Hospital-based Surveillance: Accuracy, Adequacy, and Timeliness of Dengue Case Report in Bandung, West Java, Indonesia of 2015. J. Glob. Infect. Dis. 2018, 10, 201–205. [Google Scholar] [CrossRef]
- MOH. Dengue Treatment Guideline; Ministry of Health: Jakarta, Indoensia, 2017. [Google Scholar]
- HDX. The Humanitarian Data Exchange 2020. Available online: https://data.humdata.org/dataset/indonesia-administrative-boundary-polygons-lines-and-places-levels-0-4b (accessed on 19 February 2020).
- Wangdi, K.; Canavati, S.E.; Ngo, T.D.; Tran, L.K.; Nguyen, T.M.; Tran, D.T.; Martin, N.J.; Clements, A.C.A. Analysis of clinical malaria disease patterns and trends in Vietnam 2009–2015. Malar. J. 2018, 17, 1–15. [Google Scholar] [CrossRef] [Green Version]
- Cleveland, R.B.; Cleveland, W.S.; McRae, J.E.; Terpenning, I. STL: A seasonal-trend decomposition. J. Off. Stat. 1990, 6, 3–73. [Google Scholar]
- Wangdi, K.; Clements, A.C.A.; Du, T.; Nery, S.V. Spatial and temporal patterns of dengue infections in Timor-Leste, 2005–2013. Parasites Vectors 2018, 11, 1–9. [Google Scholar] [CrossRef] [Green Version]
- Wangdi, K.; Xu, Z.; Suwannatrai, A.T.; Kurscheid, J.; Lal, A.; Namgay, R.; Glass, K.; Gray, D.J.; Clements, A.C.A. A spatio-temporal analysis to identify the drivers of malaria transmission in Bhutan. Sci. Rep. 2020, 10, 1–10. [Google Scholar] [CrossRef]
- R Core Team. R: A Language and Environment for Statistical Computing; R Foundation for Statistical Computing: Vienna, Austria, 2019. [Google Scholar]
- Banu, S.; Hu, W.; Hurst, C.; Guo, Y.; Islam, M.Z.; Tong, S. Space-time clusters of dengue fever in Bangladesh. Trop. Med. Int. Heal. 2012, 17, 1086–1091. [Google Scholar] [CrossRef] [Green Version]
- Romero, C.M.; da Silva, F.E.R.; Estofolete, C.F.; Martiniano, D.A.; Tukasan, C.; Bertoque, A.C.; Muniz, V.D.; Nogueira, M.L.; da Silva, N.S. Spatiotemporal-based clusters as a method for dengue surveillance. Rev. Panam. Salud. Publica 2017, 41, e162. [Google Scholar]
- Kulldorff, M.; Athas, W.F.; Feurer, E.J.; A Miller, B.; Key, C.R. Evaluating cluster alarms: A space-time scan statistic and brain cancer in Los Alamos, New Mexico. Am. J. Public Heal. 1998, 88, 1377–1380. [Google Scholar] [CrossRef] [Green Version]
- Kulldorff, M. A spatial scan statistic. Commun. Stat. Theory Methods 1997, 26, 1481–1496. [Google Scholar] [CrossRef]
- Anselin, L.; Getis, A. Spatial statistical analysis and geographic information systems. Ann. Reg. Sci. 1992, 26, 19–33. [Google Scholar] [CrossRef]
- Anselin, L. Local Indicators of Spatial Association-LISA. Geogr. Anal. 1995, 27, 93–115. [Google Scholar] [CrossRef]
- Moran, P.A.P. Notes on continuous stochastic phenomena. Biometrika 1950, 37, 17–23. [Google Scholar] [CrossRef] [PubMed]
- Ord, J.K.; Getis, A. Local Spatial Autocorrelation Statistics: Distributional Issues and an Application. Geogr. Anal. 1995, 27, 286–306. [Google Scholar] [CrossRef]
- Parra-Amaya, M.E.; Puerta-Yepes, M.E.; Lizarralde-Bejarano, D.P.; Arboleda-Sánchez, S. Early Detection for Dengue Using Local Indicator of Spatial Association (LISA) Analysis. Diseases 2016, 4, 16. [Google Scholar] [CrossRef] [Green Version]
- Zulu, L.C.; Kalipeni, E.; Johannes, E. Analyzing spatial clustering and the spatiotemporal nature and trends of HIV/AIDS preva-lence using GIS: The case of Malawi, 1994–2010. BMC Infect. Dis. 2014, 14, 285. [Google Scholar] [CrossRef] [PubMed] [Green Version]
- Huy, B.V.; Hoa, L.N.M.; Thuy, D.T.; van Kinh, N.; Ngan, T.T.D.; van Duyet, L.; Hung, N.T.; Minh, N.N.Q.; Truong, N.T.; Chau, N.V.V. Epidemiological and Clinical Features of Dengue Infection in Adults in the 2017 Outbreak in Vietnam. BioMed Res. Int. 2019, 2019, 1–6. [Google Scholar] [CrossRef] [Green Version]
- Gupta, B.P.; Tuladhar, R.; Kurmi, R.; Das Manandhar, K. Dengue periodic outbreaks and epidemiological trends in Nepal. Ann. Clin. Microbiol. Antimicrob. 2018, 17, 1–6. [Google Scholar] [CrossRef] [PubMed] [Green Version]
- Rahman, M.; Sharma, A.; Patgiri, S.; Hussain, E.; Borah, A.K.; Saikia, L. Serotyping of Dengue Viruses Circulating During 2014–2015 in Assam, India. Indian J. Med. Microbiol. 2018, 36, 429–431. [Google Scholar] [CrossRef] [PubMed]
- World Health Organization. Dengue Guidelines for Diagnosis, Treatment, Prevention and Control: New Edition; World Health Organization: Geneva, Switzerland, 2009. [Google Scholar]
- Reich, N.G.; Shrestha, S.; King, A.A.; Rohani, P.; Lessler, J.; Kalayanarooj, S.; Yoon, I.-K.; Gibbons, R.V.; Burke, D.S.; Cummings, D.A.T. Interactions between serotypes of dengue highlight epidemiological impact of cross-immunity. J. R. Soc. Interface 2013, 10, 20130414. [Google Scholar] [CrossRef] [PubMed]
- Khan, E.; Hasan, R.; Mehraj, J.; Mahmood, J.M.A.S. Genetic Diversity of Dengue Virus and Associated Clinical Severity During Periodic Epidemics in South East Asia. Curr. Top. Trop. Med. 2012, 91–108. [Google Scholar]
- Tosepu, R.; Tantrakarnapa, K.; Nakhapakorn, K.; Worakhunpiset, S. Climate variability and dengue hemorrhagic fever in South-east Sulawesi Province, Indonesia. Environ. Sci. Pollut. Res. Int. 2018, 25, 14944–14952. [Google Scholar] [CrossRef]
- Sarumpaet, S.; Zaluchu, F.; Syarifah, S. Comparing Community Socio-Demographic Profiles towards Dengue in Two Selected Areas in Medan, North Sumatra, Indonesia. In Proceedings of the 1st Public Health International Conference (PHICo 2016), Medan, Indonesia, 2 December 2016. [Google Scholar]
- Panggabean, M.; Siahaan, L.; Panggabean, Y.C. Relationship between Community Knowledge by the Existence of Mosqui-Toes as a Vector of Disease in the Bagan Deli Village, Medan Belawan District, Medan City. IOP Conf. Ser. Earth Environ. Sci. 2019, 305, 012028. [Google Scholar] [CrossRef]
- Panggabean, M.; Siahaan, L.; Panggabean, Y.C. Relationship of presence larvaes aedes aegypti in the water containers with dengue hemorrhagic fever in the Sei Kera Hilir 1 village sub-district Medan Perjuangan Medan city. J. Phys. Conf. Ser. 2019, 1317, 012104. [Google Scholar] [CrossRef]
- Chipwaza, B.; Mugasa, J.P.; Selemani, M.; Amuri, M.; Mosha, F.; Ngatunga, S.D.; Gwakisa, P.S. Dengue and Chikungunya Fever among Viral Diseases in Outpatient Febrile Children in Kilosa District Hospital, Tanzania. PLoS Negl. Trop. Dis. 2014, 8, e3335. [Google Scholar] [CrossRef] [PubMed] [Green Version]
- Saxena, R.; Nagpal, B.; Das, M.; Srivastava, A.; Gupta, S.K.; Kumar, A.; Jeyaseelan, A.; Baraik, V.K. A spatial statistical approach to analyze malaria situation at micro level for priority control in Ranchi district, Jharkhand. Indian J. Med. Res. 2012, 136, 776–782. [Google Scholar] [PubMed]


| Parameters | 2016 | 2017 | 2018 | 2019 | |||||
|---|---|---|---|---|---|---|---|---|---|
| Age (years) | n | % | n | % | n | % | n | % | |
| Under-14 | 840 | 47.09 | 623 | 51.32 | 726 | 48.72 | 482 | 45.13 | |
| Above-14 | 944 | 52.91 | 591 | 48.68 | 764 | 51.28 | 586 | 54.87 | |
| Sex | |||||||||
| Male | 947 | 53.08 | 631 | 51.98 | 769 | 51.61 | 579 | 54.21 | |
| Female | 837 | 46.92 | 583 | 48.02 | 721 | 48.39 | 489 | 45.79 | |
| Season | |||||||||
| Wet (Nov–May) | 1,149 | 64.41 | 786 | 64.74 | 825 | 55.37 | 700 | 65.54 | |
| Dry (Jun–Oct) | 635 | 35.59 | 428 | 35.26 | 665 | 44.63 | 368 | 34.46 | |
| Total | 1784 | 100.00 | 1214 | 100.00 | 1490 | 100.00 | 1068 | 100.00 | |
| Cluster Period | Villages (Number) | Radius (km) | Observed Cases | Expected Cases | RR | LLR | p Value |
|---|---|---|---|---|---|---|---|
| Jan 2016–Feb 2017 | 28 | 5.2 | 716 | 314 | 2.47 | 203.484 | <0.0001 |
| Jul 2018–Jan 2019 | 1 | 0 | 44 | 4 | 11.53 | 67.232 | <0.0001 |
| Aug 2016–Dec 2017 | 2 | 3.05 | 89 | 24 | 3.71 | 51.229 | <0.0001 |
| Oct 2018–Jan 2019 | 32 | 3.75 | 187 | 91 | 2.09 | 39.475 | <0.0001 |
| Dec 2018–Feb 2019 | 5 | 3.64 | 65 | 21 | 3.1 | 29.282 | <0.0001 |
| Dec 2017–Feb 2018 | 1 | 0 | 14 | 2 | 9.62 | 19.135 | <0.0001 |
| Feb 2016–Sep 2016 | 3 | 0.57 | 24 | 5 | 4.92 | 19.065 | <0.0001 |
Publisher’s Note: MDPI stays neutral with regard to jurisdictional claims in published maps and institutional affiliations. |
© 2021 by the authors. Licensee MDPI, Basel, Switzerland. This article is an open access article distributed under the terms and conditions of the Creative Commons Attribution (CC BY) license (http://creativecommons.org/licenses/by/4.0/).
Share and Cite
Pasaribu, A.P.; Tsheten, T.; Yamin, M.; Maryani, Y.; Fahmi, F.; Clements, A.C.A.; Gray, D.J.; Wangdi, K. Spatio-Temporal Patterns of Dengue Incidence in Medan City, North Sumatera, Indonesia. Trop. Med. Infect. Dis. 2021, 6, 30. https://0-doi-org.brum.beds.ac.uk/10.3390/tropicalmed6010030
Pasaribu AP, Tsheten T, Yamin M, Maryani Y, Fahmi F, Clements ACA, Gray DJ, Wangdi K. Spatio-Temporal Patterns of Dengue Incidence in Medan City, North Sumatera, Indonesia. Tropical Medicine and Infectious Disease. 2021; 6(1):30. https://0-doi-org.brum.beds.ac.uk/10.3390/tropicalmed6010030
Chicago/Turabian StylePasaribu, Ayodhia Pitaloka, Tsheten Tsheten, Muhammad Yamin, Yulia Maryani, Fahmi Fahmi, Archie C. A. Clements, Darren J. Gray, and Kinley Wangdi. 2021. "Spatio-Temporal Patterns of Dengue Incidence in Medan City, North Sumatera, Indonesia" Tropical Medicine and Infectious Disease 6, no. 1: 30. https://0-doi-org.brum.beds.ac.uk/10.3390/tropicalmed6010030