Article

Aerodynamic and Aeroelastic Effects of Design-Based Geometry Variations on a Low-Pressure Compressor

1
Institute of Jet Propulsion and Turbomachinery, TU Braunschweig, 38108 Braunschweig, Germany
2
Institute of Turbomachinery and Fluid Dynamics, Leibniz University Hannover, 30823 Garbsen, Germany
*
Author to whom correspondence should be addressed.
Current address: MTU Maintenance Hannover GmbH, Muenchner Strasse 31, 30855 Langenhagen, Germany.
Int. J. Turbomach. Propuls. Power 2020, 5(4), 26; https://doi.org/10.3390/ijtpp5040026
Submission received: 22 July 2020 / Revised: 16 September 2020 / Accepted: 21 September 2020 / Published: 24 September 2020

Abstract

:
In modern aircraft engines, the low-pressure compressor (LPC) is subjected to a flow characterized by strong wakes and secondary flows from the upstream fan. This concerns ultra-high bypass ratio (UHBR) turbofan engines, in particular. This paper presents the aerodynamic and aeroelastic sensitivities of parametric variations on the LPC, driven by the design considerations in the upstream fan. The goal of this investigation was to determine the influence of design-based geometry parameter variations on the LPC performance under realistic inlet flow distributions and the presence of an s-duct. Aerodynamic simulations are conducted at the design and off-design operating points with the fan outflow as the inlet boundary conditions. Based on the aerodynamic results, time-linearized unsteady simulations are conducted to evaluate the vibration amplitude at the resonance operating points. First, the bypass ratio is varied by reducing the channel height of the LPC. The LPC efficiency decreases by up to 1.7 % due to the increase in blockage of the core flow. The forced response amplitude of the rotor decreases with increasing bypass ratio due to increased aerodynamic damping. Secondly, the fan cavity leakage flow is considered as it directly affects the near hub fan flow and thus the inflow of the LPC. This results in an increased total-pressure loss for the s-duct due to mixing losses. The additional mixing redistributes the flow at the s-duct exit leading to a total-pressure loss reduction of 4.3 % in the first rotor at design point. This effect is altered at off-design conditions. The vibration amplitude at low speed resonance points is increased by 19 % for the first torsion and 26 % for second bending. Thirdly, sweep and lean are applied to the inlet guide vane (IGV) upstream of the LPC. Despite the s-duct and the variable inlet guide vane (VIGV) affecting the flow, the three-dimensional blade design achieves aerodynamic and aeroelastic improvements of rotor 1 at off-design. The total-pressure loss reduces by up to 18 % and the resonance amplitude more than 10 % . Only negligible improvements for rotor 1 are present at the design point. In a fourth step, the influence of axial gap size between the stator and the rotor rows in the LPC is examined in the range of small variations which shows no distinct aerodynamic and aeroelastic sensitivities. This finding not only supports previous studies, but it also suggests a correlation between mode shapes and locally increased excitaion with increasing axial gap size. As a result, potential design improvements in future fan-compressor design are suggested.

1. Introduction

1.1. Engine Performance and Aerodynamics

Current aircraft engine design trends pursue the concept of geared turbofan engines with an ultra-high bypass ratio (UHBR). The increasing bypass ratio is beneficial for propulsion efficiency, leading to a reduction of specific fuel consumption. In order to provide the power for driving the increased bypass mass flow, the low-pressure compressor (LPC) must generate a higher overall total-pressure ratio, while the necessary increase in fan cross-section requires a low hub-to-tip ratio of the fan stage. However, lowering the fan hub radius changes the near-hub flow and thus also the inlet flow of the LPC. The lowered hub radius leads to a decreasing hub circumferential speed and an increase in required flow turning. Due to the compromise between high pressure ratio and reasonable flow turning, the near-hub region is more aerodynamically and structurally loaded. This high loading results in dominant secondary flows, a strong fan wake, and increasing total-pressure losses at the inlet of the core engine [1]. The resulting inhomogeneous inflow has proven to be a significant factor for the aerodynamic and aeroelastic loading of the first LPC stages. Due to the increased loading at the near-hub region of the fan stage, the inhomogeneous inflow and, thus the loading of the downstream LPC, will be altered.
A cycle analysis by Zamboni and Xu [2] showed that near-hub stagnation pressure losses will have a greater impact on the core performance with increasing bypass ratio. The increasing bypass ratio causes the fan wake interaction with the downstream splitter and the core inlet guide vane (IGV) to change. Thereby, boundary layer thickness at hub and splitter might increase due to incidence changes, resulting in higher blockage [3]. As shown by Eggers and Friedrichs [4], with a higher hub-to-tip ratio of the core section, the relative proportion of boundary layer and corner vortex along the span is increased. This causes increased total-pressure losses within the core flow. These effects are likely to become more significant at off-design [5]. The influence of the 3D secondary flow phenomena and the increased blockage on the LPC performance due to increasing bypass ratio (BPR) has not yet been studied.
Additionally, the unavoidable flow through the rotor cavity behind the fan trailing edge generates a radial momentum, which interacts with the fan wake near the hub. As a result, a new boundary layer with an additional circumferential component is formed by the cavity flow below the large secondary flow structures at the stator hub [6]. This results in a spatially complex, non-circumferentially symmetrical flow structure near the hub, characterized by secondary flows, overturning, and cavity leakage flows. Zamboni and Xu [2] have conducted extensive research on fan root aerodynamics and have shown that the leakage flow causes large corner separations at the IGV and an increasing stagnation pressure loss at the core inlet. The effect of the changed core inlet on the downstream LPC is yet to be investigated.
Many design options have been studied to control secondary flow effects, as well as to deal with inhomogeneous inflow and the related total-pressure losses. The aerodynamic potential of sweep and lean to influence the secondary flow was shown in literature before [7,8,9,10]. Thus, positive angles of sweep and lean lead to an advantageous control of the secondary flows. Motivated by that benefit, improvements in the radial loading distribution and in the three-dimensional development of the boundary layer near the wall were investigated [11]. The sweep effect induces an additional counter rotating passage vortex forcing an axial load redistribution. The cross-flow and corner vortex can be controlled, reducing the total-pressure losses over a wide operating range [12]. The lean effect leads to a radial load redistribution with reduced suction side diffusion. This lowers the intensity of the corner vortex and the total-pressure losses decrease [13]. It has not been studied yet, to what extent the three-dimensional blade design of an IGV affects the downstream LPC of an UHBR engine.
The size of the rotor–stator axial gap is another way of influencing the aerodynamic and aeroelastic loading of the LPC. While small gaps lead to stronger rotor–stator interactions, larger axial gaps result in significant endwall losses. Van Zante et al. [14] showed that viscous mixing losses are reduced due to wake stretching, which indicates a reduction in loss when axial gaps are reduced. This effect was confirmed by several studies [15,16,17]. However, shorter axial gaps will tend to increase the extent of turbulence and near wall losses due to earlier transition [18,19,20]. A decreased axial gap also excites forced response [21]. A coupled sensitivity study of aerodynamic and aeroelastic effects due to axial gap variations is not present in open literature.

1.2. Forced Response Analysis

Forced response of turbomachinery blades must be addressed for the stable and long-life operation of aircraft engines. The acceptability of resonance operation is highly based on previous experimental data. Therefore, a quantitative evaluation of forced response is necessary when a design of aircraft engines or a shift in operating points are expected. Due to the constant demand for higher efficiencies, the internal aerodynamics of the engine changes and thus also the aeroelastic load on the blades. This unsteady loading on blades can be influenced by far upstream and downstream flow field as well as adjacent blade rows. The front stages of LPC are under the influence of distorted fan outlet flow, fan cavity flow, and the s-duct. This makes them more susceptible to vibrations due to their large height-to-area ratio.
Kielb and Chiang [22] presented the summary of previous forced response research, and addressed the needs for further improvements. Since the 1980s, forced response analysis tools are being developed. Due to an increase in computational power, full 3D unsteady Navier–Stokes solvers are commonly used in the recent design process of compressors and turbines. In addition to those efforts to develop fast and accurate tools to predict forced response, many studies have been conducted to validate the prediction tools. Aschenbruck and Seume [23] presented the experimental verification of regeneration-induced forced response in a turbine. Bittner et al. [24] showed experimental validation of the forced response analysis using a time-linearized method in a high speed compressor. In addition, the efforts have been made to evaluate the sensitivity of modal parameters on the behavior of the forced response. Jöcker and Franson [25] presented the mode shape sensitivity to forced response of a turbine. The influence of reduced frequency and mass ratio on compressor flutter was presented by May [26]. These investigations mainly focus on the influence of the modal characteristics of the rotor blade itself or the variations of the direct upstream of the investigated rotor row. Forced response of front LPC considering the upstream inhomogeneous fan flow and variations in indirect flow field has not yet been investigated.
Many numerical and experimental studies assess the influence of axial distance between blade rows on forced response. The majority of previous research shows that forced response decreases exponentially with increasing axial gap. However, Chen et al. [27] numerically varied axial distance and found that there is an optimal distance at which the excitation force in the turbine is minimized. This supports the earlier explanation from Korakianitis [28] that the unsteady force does not always decrease with increasing axial gap because of the complex combined effect of wakes and potential fields of the upstream blades. With larger gap variation, Marn et al. [29] could experimentally show that forced response vibration is suppressed with increasing axial gap in a turbine. However, the mechanism of locally increased excitation with increasing axial gap has not yet been clearly explained.

1.3. Main Objectives

In this paper, the authors introduce a new approach to investigate the coupled aerodynamic and aeroelastic effects based on specifically selected parameter variations. It concerns the three-stage LPC, designed for a UHBR fan of a bypass ratio of 17. In order to evaluate the main mechanisms by which the incoming fan wake and the secondary flow impact the LPC, parameters are varied. The investigated parameters are (1) the bypass ratio of the fan, (2) leakage flows from the fan rotor cavity, (3) the three-dimensional blade design of the inlet guide vane (IGV) of the LPC, and (4) the axial blade spacing between the stators and rotors of the LPC. The numerical investigations are carried out with a model of a UHBR fan stage and an accordingly designed LPC. The results are analyzed to provide a guideline on how to account for the coupled aerodynamic and aeroelastic effects in future compressor designs of UHBR aircraft engines.

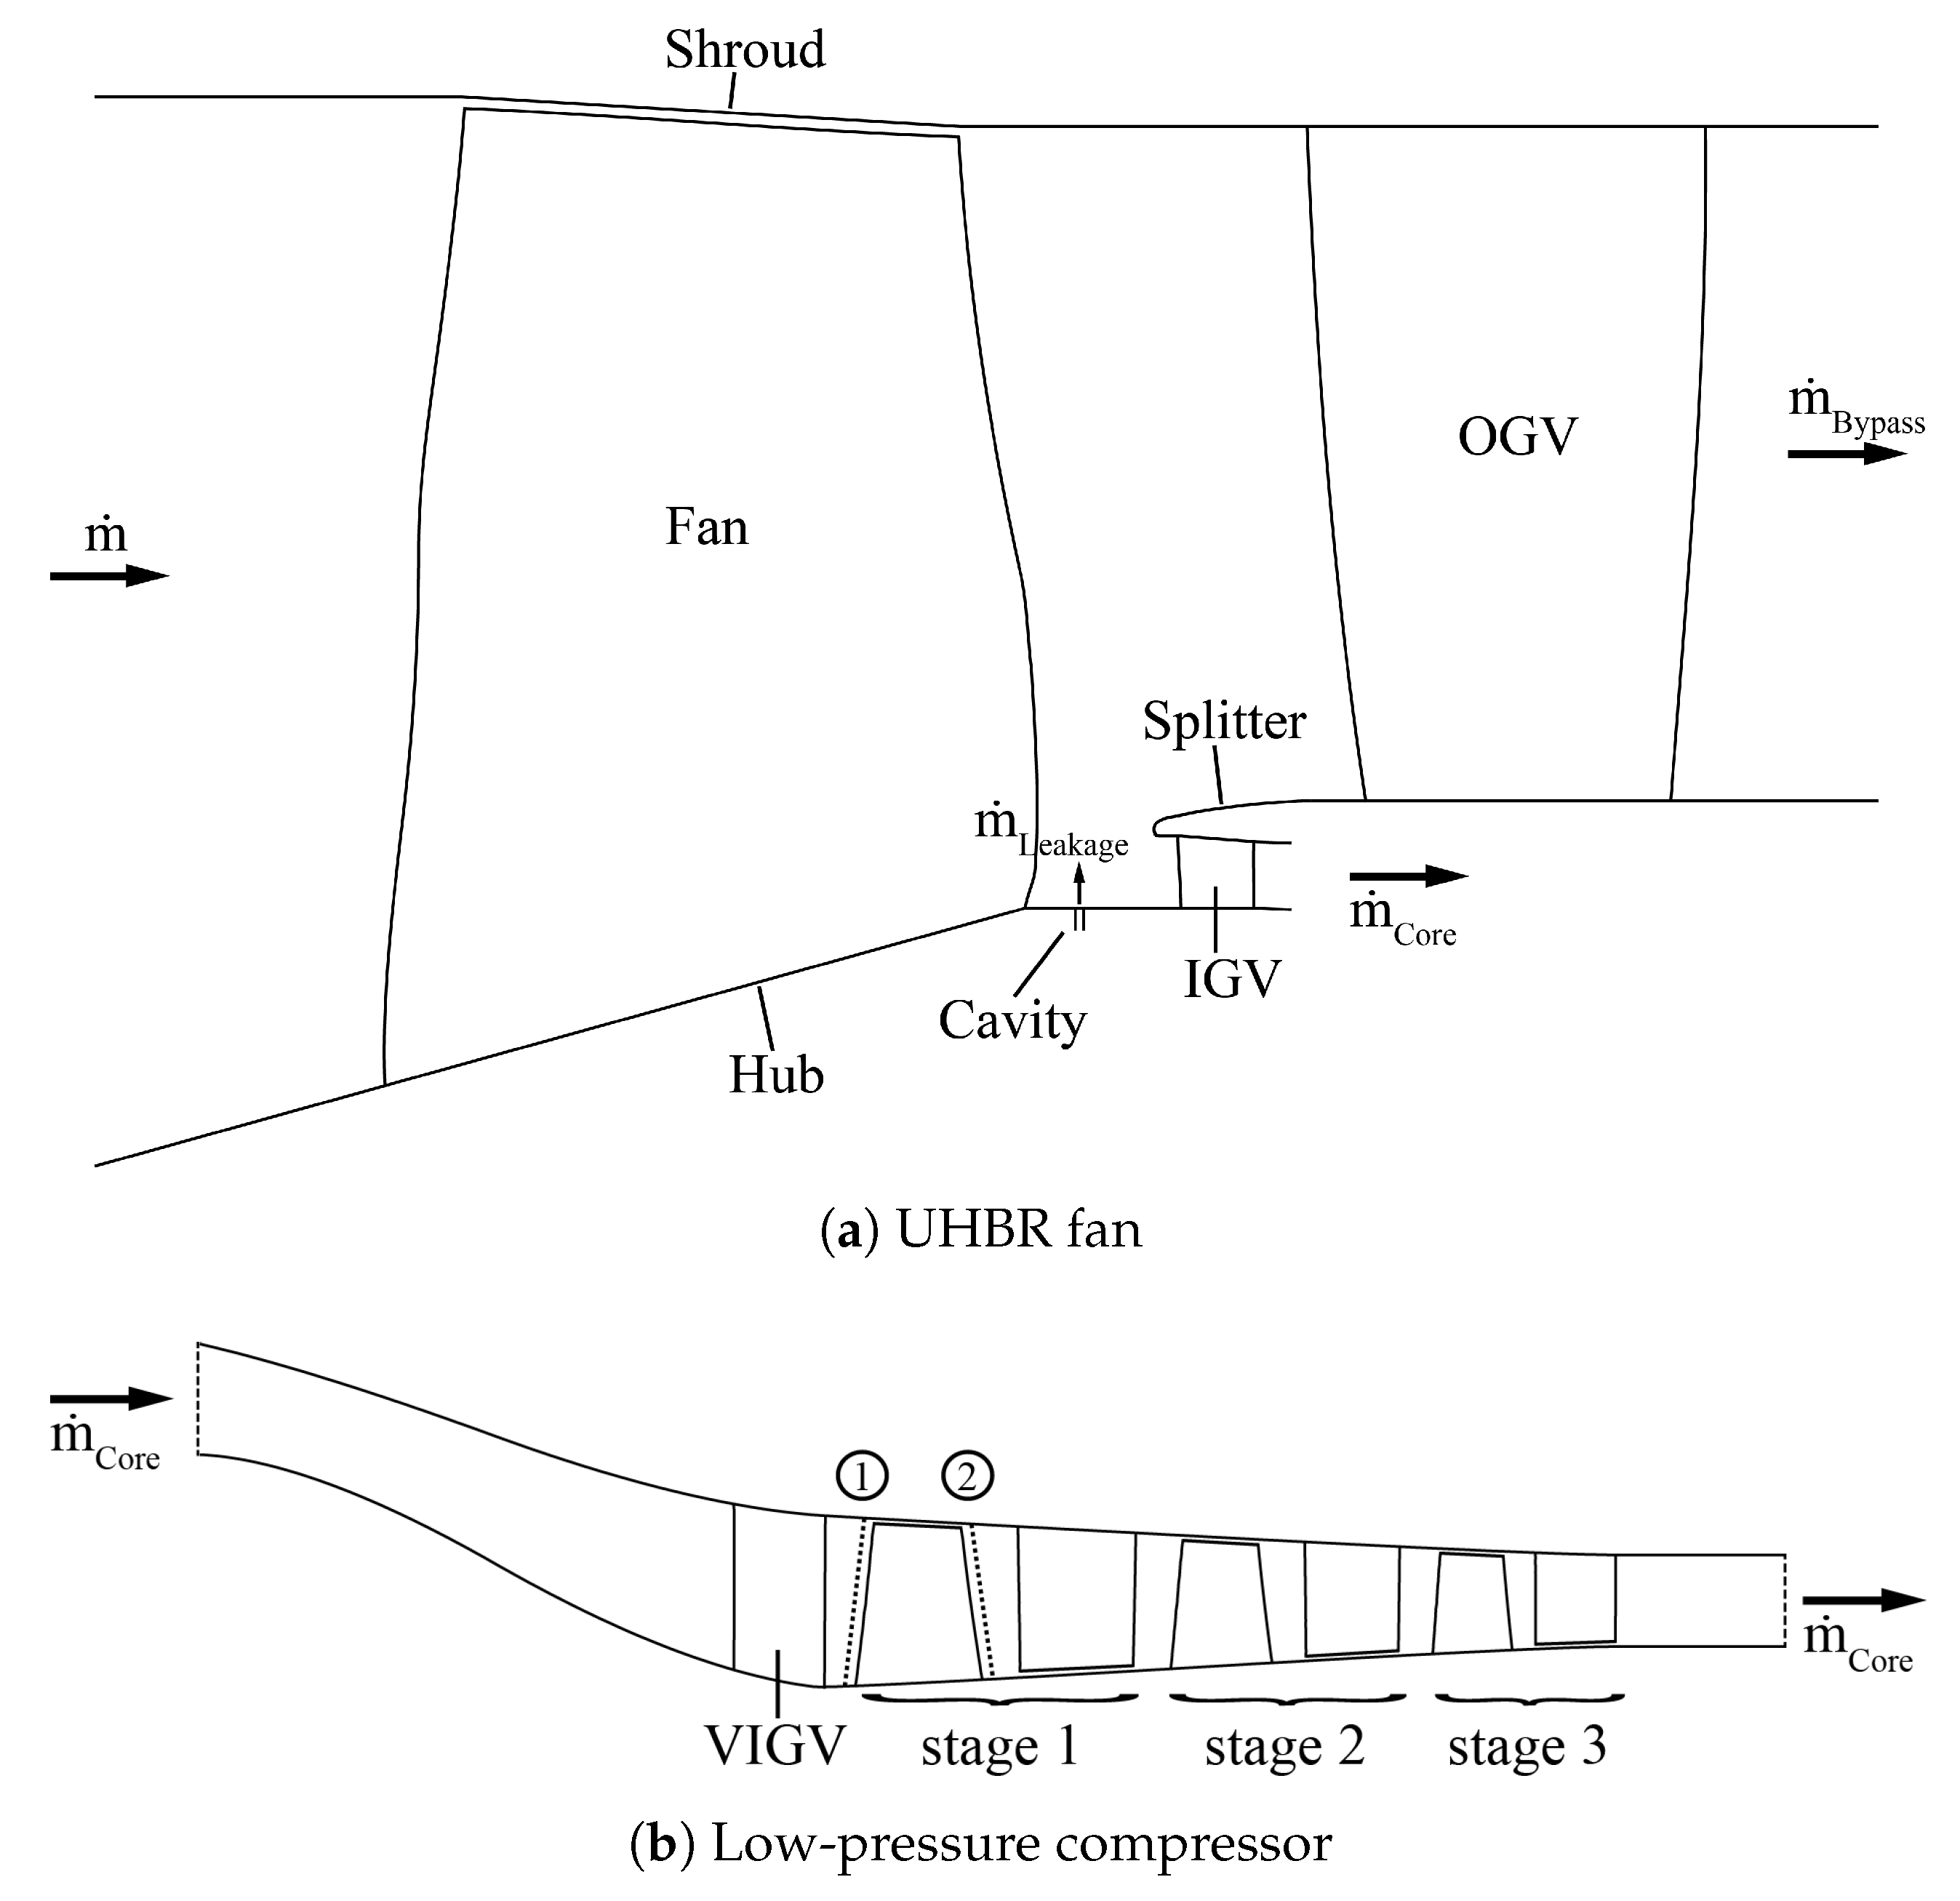
2. Fan Configuration and Low-Pressure Compressor

The reference configuration for an UHBR geared turbofan and the corresponding three-stage LPC were designed at top of climb (TOC) operating conditions with a bypass ratio of 17. Figure 1 shows the two reference configurations in the meridional view.
Separate configurations are available to reduce the model size for parameter variations of the LPC and thus reduce the numerical computational effort. The configurations are coupled via thermodynamic relations and the selected gear ratio of 3. The overall UHBR turbofan engine design was evaluated according to the current state of the art [30]. The preliminary LPC design is based on the fan design developed by Giesecke [30] with the usage of in-house software tools. The analytical calculation of the design values at each row interface is based on an isentropic radial equilibrium. The contours of the hub and the shroud, as well as the splitter geometry are defined via B-splines in order to be able to realize a flexible geometry variation. In total, the LPC configuration consists of 58 variable inlet guide vanes (VIGV) followed by three stages with 31, 40, and 44 rotor blades and 52, 59, and 81 stator vanes. At design point, the LPC is operated with a flow coefficient of Φ = 0.4279 and a work coefficient of Ψ = 0.7953 resulting in a mass flow of 11.52 kg/s. To obtain a preliminary assessment of the near-hub flow at different bypass ratios without redesigning the fan and LPC configuration, a simplified approach was used. For that purpose, the splitter in the UHBR fan configuration and the shroud in the LPC was lowered at radial height according to Equations (1) and (2).
r S h r o u d , B P R = m ˙ B P R ρ B P R · v B P R · π + r H u b 2
Δ r = r r e f r S h r o u d , B P R
Due to the compressibility of the fluid, the correct radial offset Δ r for the desired bypass ratio requires an iterative process. The overall thermodynamic engine and LPC design were retained. Therefore, the rotational speed remains constant for all bypass ratios. As the radial offset was observed to have no significant impact on the flow field in [4], the blades have not been redesigned. In total, three different bypass ratios (17, 20, and 25) for the LPC are studied in this paper using the respective IGV wake flow from Eggers and Friedrichs [4] as inflow condition. Figure 2 depicts the method used and the three bypass ratios for the LPC in meridional view.
The influence of the fan rotor cavity leakage is investigated for commonly encountered leakage mass flows of 1%, 1.5%, and 2% relative to the core mass flow according to [2]. A simplified cavity geometry is used to add the leakage flow as depicted in Figure 1.The leakage mass flow is defined by a mass flow value and a static temperature. The static temperature was chosen to be 280 K for every leakage mass flow based on preliminary studies and literature [2]. The model implementation is realized as an additional volume source term. A circumferential momentum is enforced on the flow by defining the fan facing cavity wall as a rotating wall, while the IGV facing wall is stationary. The resulting flow field is used as an inlet condition for the LPC. The effects of the leakage mass flow are examined for the reference bypass ratio. All blade profiles are defined by a parabolic camber line according to Schlichting [31] with superimposed cubic thickness distribution according to Wennerstrom [32]. Variations of sweep and lean are applied to the IGV to study the extent on flow control for the UHBR configurations. Thereby, positive sweep and lean are imprinted on both the hub and the tip of the blade. The reference IGV and a bowed IGV are displayed side by side in Figure 3 with the additional definitions for positive sweep and lean according to Denton and Xu [33].
By specifying an angle at hub and tip, a circular curve is defined, on the basis of which a corresponding translation in axial direction of the profile section is performed. Different combinations of sweep and lean are simulated to assess the potential of 3D blade design in UHBR configurations. After a preliminary study of the effect of different sweep and lean combinations on the IGV, the blade designs with the most beneficial aerodynamic impact were chosen (Table 1).
The axial gap size is varied within the LPC and is defined as a percentage of the chord length of the upstream blade. In case of the reference configuration, the axial gap between stator and rotor is 30 % and between rotor and stator 20 % , leading to a similar axial gap between each LPC row. For the parameter study, the respective percentage was varied by ± 10 % . The length of the LPC is adjusted accordingly, keeping the s-duct geometry fixed, as shown in Figure 4.
As the fan configuration was solely used to generate the specific inflow for the LPC parameter studies, the fan will not further be investigated in this paper. Detailed information can be found in the work of Giesecke et al. [34] as well as Eggers and Friedrichs [4].

3. Numerical Setup

The computational mesh was generated with the mesh generator AutoGrid 5 by NUMECA (Brussels, Belgium) for both the fan configuration and the LPC. The blade-to-blade mesh is formed by an O-mesh around the blade surface and four surrounding H-meshes. The average wall distance is in the range of y + = 1 –5. With a grid convergence index (GCI) of about 0.01 % the aerodynamic simulations are considered mesh independent according to Celik et al. [35]. The total LPC model comprised of 6.9 million cells in a single pitch periodic domain as shown in Figure 5.

3.1. Aerodynamic Simulations

All aerodynamic simulations were conducted using the 3D Reynolds-averaged Navier-Stokes (RANS) solver TRACE Version 9.1.519 by the German Aerospace Center (DLR) (Cologne, Germany). TRACE was developed to simulate turbomachinery flows and was validated for several cases [36,37]. For all CFD calculations, the Wilcox k ω model was used [38]. A mixing plane was employed at each row interface. In addition to the parameter study of various axial gap sizes, the simulations were performed at steady state. In order to resolve the rotor–stator interaction for various axial gaps, the harmonic balance method was used [39]. The first three harmonics were calculated two blade rows downstream and one harmonic was calculated one blade row upstream for each row, respectively. It was found that the wall function approach is leading to the same results as the Low-Reynolds wall treatment and the former configuration was therefore used in all simulations of the LPC. Since an aerodynamic evaluation is usually carried out at the design point (DP), the low-pressure compressor is simulated under TOC conditions at a corresponding speed of 9222 rpm. For the inlet boundary condition the flow values ( p t , T t , α , β ) of the fan-wake profile were circumferentially mass-flow averaged, while the outlet boundary condition was set as a circumferential mass-flow averaged static pressure at midspan. Convergence was assumed when the root mean square (RMS) residuals for mass flow and pressure reached a stable level of less than 10 5 and the RMS of the polytropic efficiency was less than 10 4 over the last 2000 iterations.

3.2. Aeroelastic Simulations

The forced response toolchain is depicted in Figure 6. The RANS input data are extracted from the aerodynamic simulations and modal analysis; therefore, unsteady RANS simulations have been subsequently conducted as described below.

3.2.1. Modal Analysis and Campbell Diagram

A modal analysis is conducted as the first step of a forced response simulation with ANSYS Mechanical. The eigenmodes and eigenfrequencies of the blade are obtained, and the Campbell diagram (Figure 7a) is created to identify the corresponding rotational speed where the forced responses are expected. Engine order (EO) 58, which is the number of VIGV located upstream of the rotor row, is selected as the excitation number. The two lowest possible modes are examined because of the most severe vibration. Although the interesting excitation modes in real engine conditions are allocated in higher rotational speed, a physical mechanism of parameter variations can be addressed from the analysis in low modes. This provides a better understanding on forced response at higher modes. As shown in Figure 7a, rotational speeds of 1738 rpm (OP1) and 2804 rpm (OP2) are selected as corresponding to Mode 2 (first torsion) and Mode 3 (second bending), respectively. Mode 1 (first bending) is excluded because of unstable numerical solution. The Campbell diagram is identical for all parametric studies except for the variation of bypass ratio. Due to the shortened blade span for higher bypass ratio, different Campbell diagrams are used. Particularly the Campbell diagram of a bypass ratio of 25 is shown in Figure 7b.

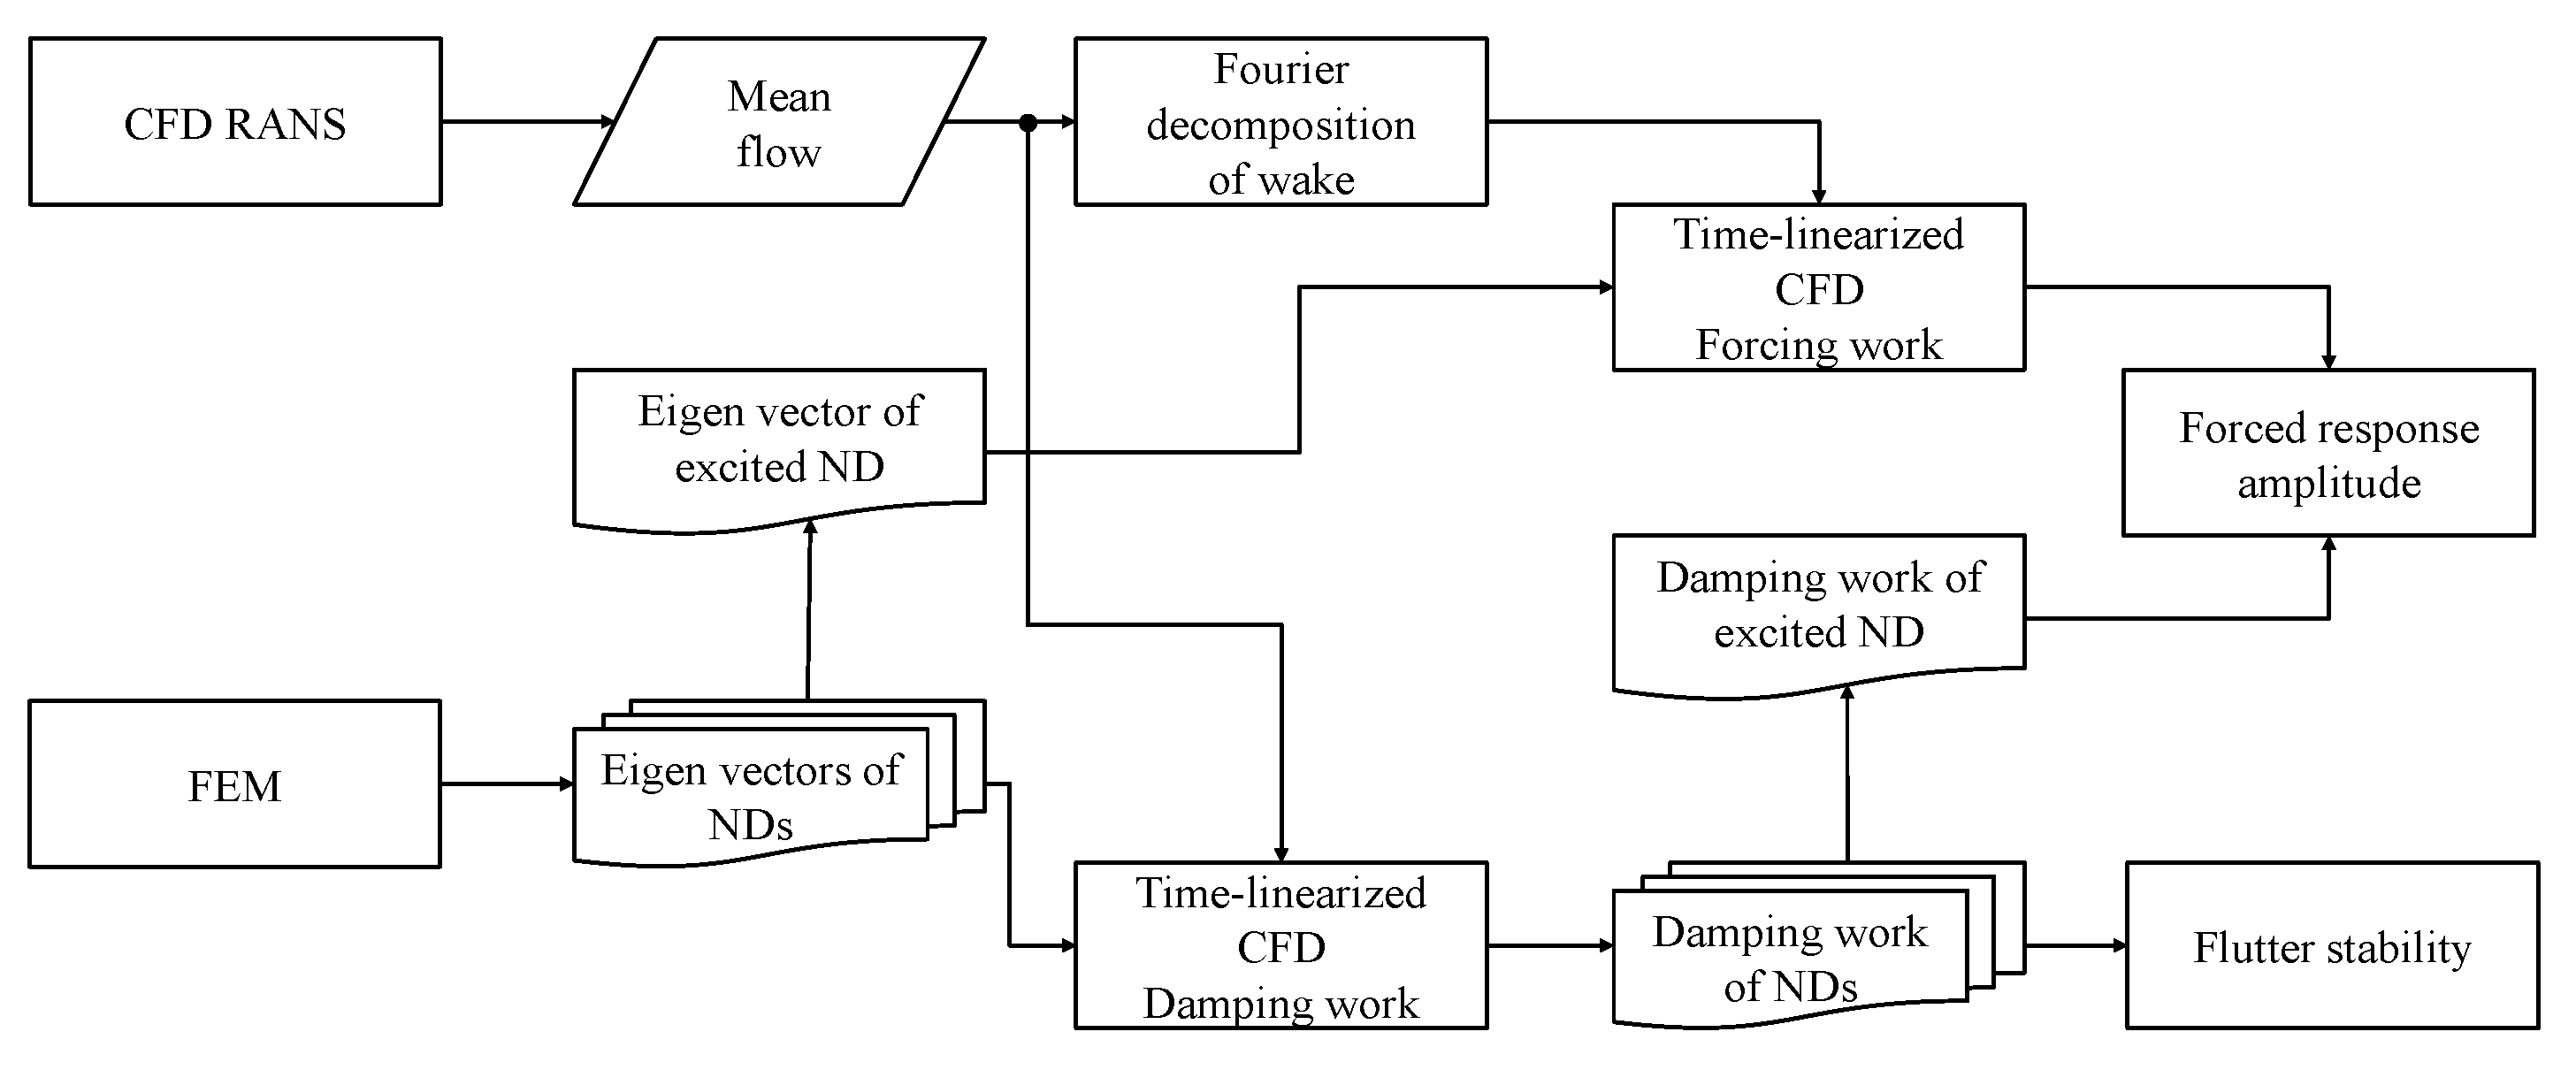
3.2.2. Time-Linearized Aeroelastic Simulation

Kersken et al. [40] introduced the time-linearized TRACE (linTRACE) equipped with a special mapping algorithm of the structural eigenmodes in the flow domain. Blocher and Fernández [41] described a forced response analysis implementing the energy method to estimate vibration amplitude. The linTRACE can be used to simulate modal force and aerodynamic damping (flutter) separately, while the forced response vibration amplitude is calculated later using the energy method (Equation (3)). As the inlet boundary condition of the forced response setup, the Fourier decomposed flow is required to simulate the overall influence of upstream excitation sources including wakes, secondary flows, potential fields, and shocks. Since it only accounts for the external disturbances as the source of the unsteady pressure loading, the blade deflection is not included when the unsteady flow field is calculated in the rotor domain. Later, the forcing work is calculated by multiplying the amplitude of unsteady pressure fluctuation with the eigenvector of the blade and integrated over the blade surface. This is different for the damping evaluation. Since the unsteady flow directly interacts with the blade motion, the flow domain deformation due to the blade vibration is no longer negligible. This deformation is calculated for each time step, and the damping work is simultaneously evaluated with the unsteady pressure and the blade deflection. Schoenenborn and Ashcroft [42] compared time-linearized and time-accurate solvers to investigate compressor forced response with a large variation of mode shapes. The result shows that the time-linearized method only agreed well with the time-accurate method at 50 % of the design rotational speed. Here, the authors adapt the same method as described in previous research [40,41,42] for the parametric study.
X F R = m o d a l f o r c e a e r o d a m p i n g

4. Results and Discussion

In this section, results from both aerodynamic and aeroelastic simulations are presented. The results are compared within each parameter variation.

4.1. General

4.1.1. Aerodynamics

To get a first impression of the potential of the individual parameter variations, the configurations are only analyzed at one specific operation point on the respective speed line. For design speed, the chosen operating point is the aerodynamic design point, while for the rotational speeds of the eigenmodes, the operating point was chosen to be close to the surge line with the last numerically converging point on the speed line. That is because the strongest aeroelastic excitation for flutter is expected at these off-design operational points. The aerodynamic evaluation of the flow variables for rotor 1 is carried out on the corresponding evaluation planes 1 and 2, marked as dashed lines in Figure 1b. When the axial gap size is varied, the distance of the evaluation plane to the leading or trailing edge of the associated blade remains constant at 5% of the chord length. The focus will be on the aerodynamic performance and the aeroelastic excitation behavior of the first rotor row, since this is where the highest sensitivities are expected.

4.1.2. Aeroelasticity

The vibration amplitude of forced response is calculated as the ratio between the modal force and the aero damping. Since the aero damping does not considerably change within parametric studies, only the modal force is compared for the analysis—except in the bypass ratio study. With different bypass ratios, the damping behavior significantly differs since the blade shape is modified. The detailed explanation is provided in the next section.
The reference result is shown in Figure 8 both for Modes 2 and 3. From the left, the unsteady pressure amplitude, the blade deformation, and the resulting forcing work on the surface of the blade are shown. Regardless of the rotational speed, the pressure fluctuation is highest near the leading edge of the suction side and decreasing rapidly as it approaches the trailing edge on both suction and pressure side. This is due to the potential effect and wakes from the upstream VIGV are the strongest at the leading edge of the suction side. The strong unsteady loading is concentrated near the tip and hub. These areas experience a higher incidence angle because of the twisted blade. Additionally, near-wall secondary flows induce pressure fluctuations. Modes 2 and 3 show similar distributions of unsteady pressure, only the magnitude is higher for Mode 3 due to the higher rotational speed than Mode 2. When the eigenmode is mapped, the forcing work distribution is obtained. The leading edge of the blade contributes the most to the overall forcing work of the blade as the strong unsteady pressure stimulates this area. Mode 2 shows a similar distribution of the forcing work with the unsteady pressure amplitude except for a few areas of negative forcing work as depicted by green areas in Figure 8 on the right. This negative excitation is caused by the phase difference of the unsteady pressure and the blade deformation. However, the work distribution is different with the unsteady pressure distribution for Mode 3. For the torsion mode (Mode 2), the leading edge always moves in the same direction over the entire span at the same chordwise position. However, in the case of the second bending mode (Mode 3), the midspan and the tip of the blade move in the opposite direction. As a result, the tip area shows negative work when the rest of the area is excited at the same chordwise position. This difference can be clearly seen on the pressure side.

4.2. Results of Parametric Variations

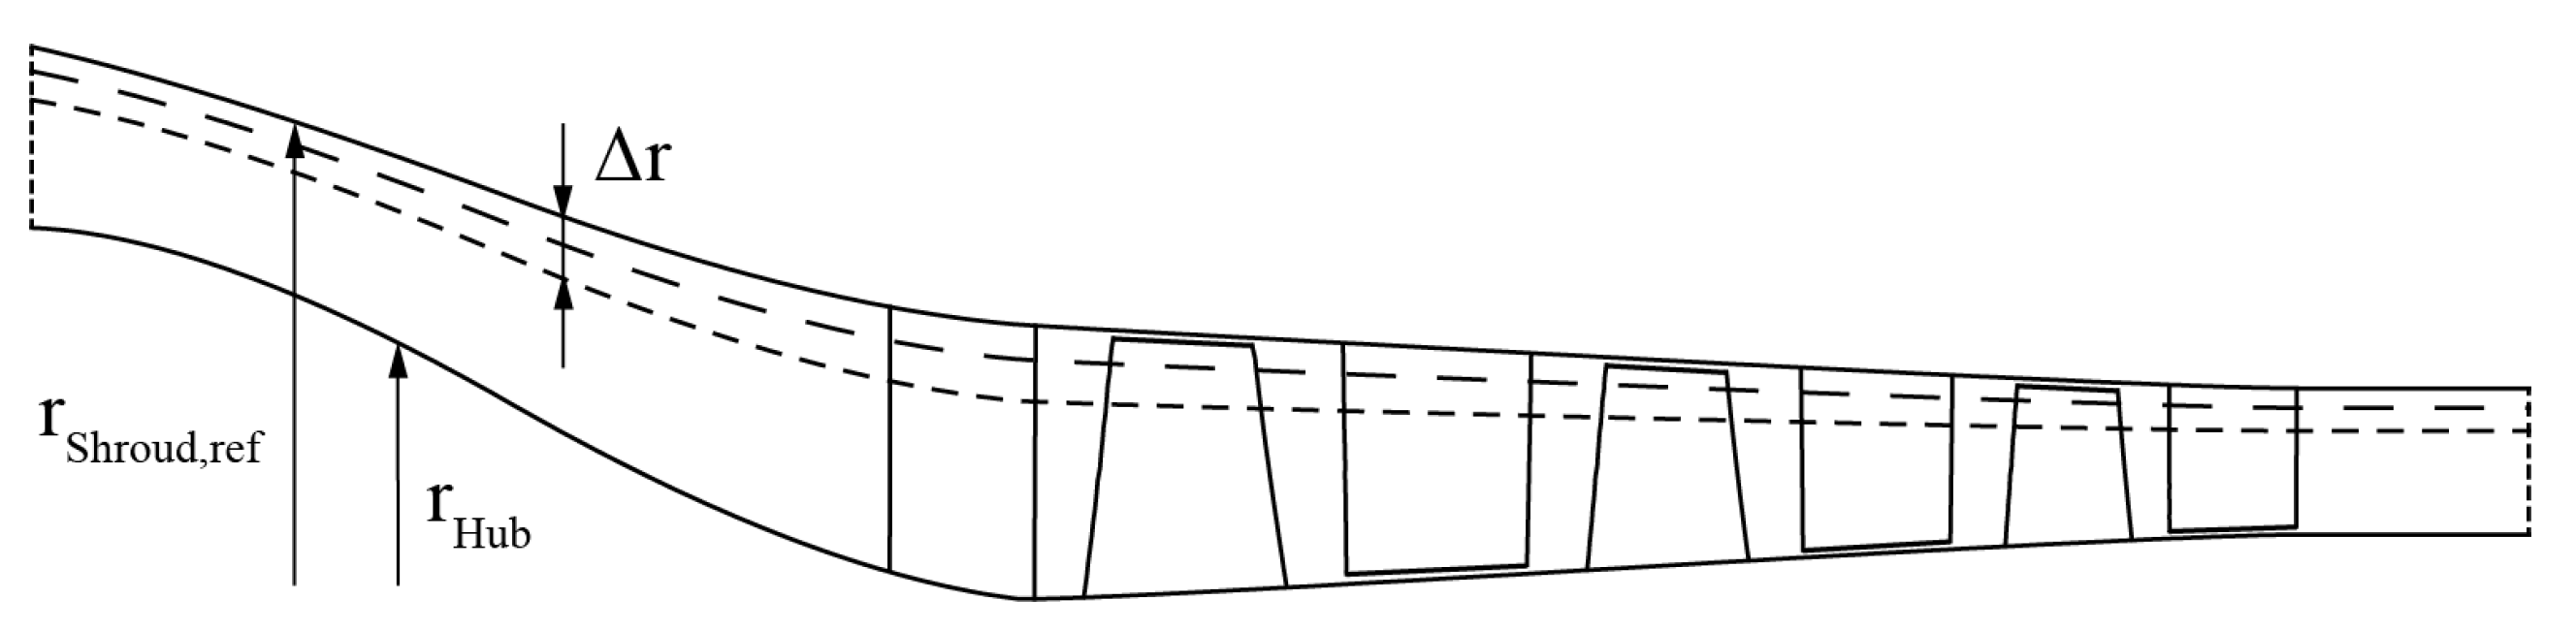
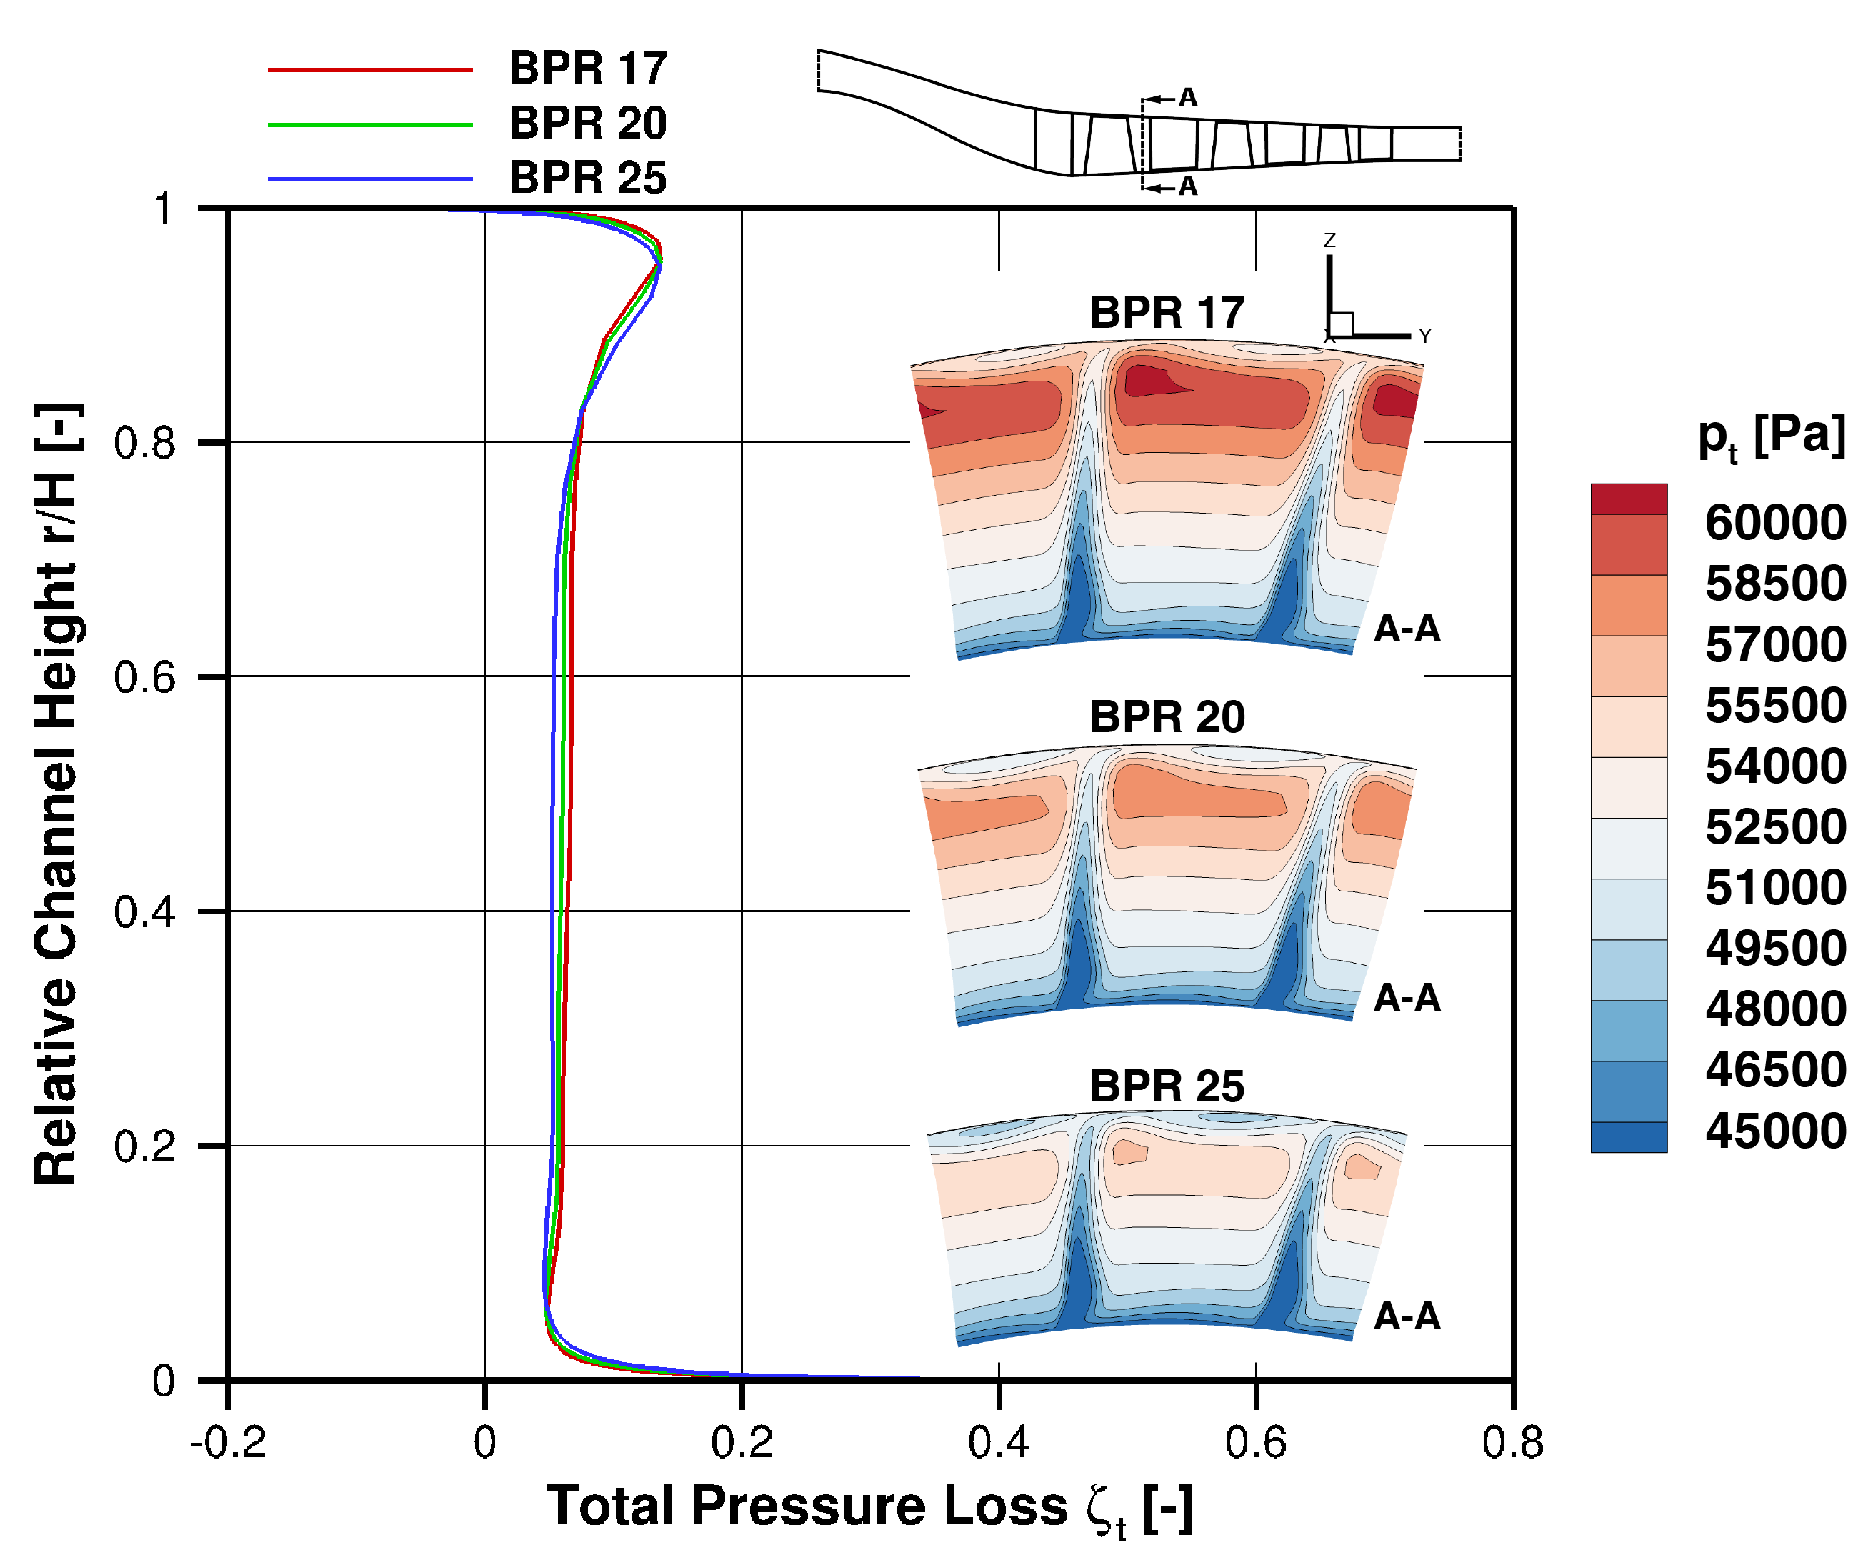
4.2.1. Increased Bypass Ratio

Aerodynamic Results

The increasing bypass ratio leads to a contraction of the annulus cross section. As shown by Eggers and Friedrichs [4], this increases the blockage of the passage as the percentage of boundary layer affected area grows and the secondary flow phenomena becomes more significant. For the three investigated bypass ratio configurations of the low-pressure compressor, the inlet boundary conditions changed in accordance to the flow field extracted from the fan configuration. The LPC was designed for the reference bypass ratio of 17. When the shroud is lowered in radial height, the blades are simply cut at the corresponding span, thus reducing the aspect ratio of rotor 1 from A R = 1.32 for a bypass ratio of 17 to A R = 1.23 for a bypass ratio of 20 and to A R = 1.15 for a bypass ratio of 25. To allow for a better comparison of the configurations, the LPC total-pressure ratio has been kept constant for all three bypass ratios. Nevertheless, the variation in the bypass ratio leads to a change of the LPC operating point. Thus, a changed LPC inflow and a changed s-duct impact result in locally changed flow conditions at the LPC airfoils. In Figure 9, the total-pressure loss coefficient of rotor 1 and the corresponding relative total-pressure wake of the rotor for all three bypass ratios at design speed are depicted. It can be seen that the relative blockage due to gap vortices and corner separations increases in the area close to the wall and thus the total-pressure loss coefficient distribution is radially compressed.
Since the absolute extension of the blocking flow phenomena remains constant, visualized by the total pressure contours, the blockage effect increases with increasing bypass ratio relative to the channel height. The downstream stages of the LPC show the same influence. Overall, the efficiency of the LPC decreases by up to 1.7 % with increasing bypass ratio. This is in accordance to the findings of Zamboni and Xu [2]. If the LPC is operated in off-design at lower speeds, the behavior remains the same and is therefore not depicted here.

Aeroelastic Results

Aerodynamic damping increases with increasing bypass ratio due to the shortened blade as the channel height is reduced. Consequently, the forced response amplitude ( X F R ) decreases with increasing bypass ratio (Table 2). Since the resonant rotational speed is higher for a higher bypass ratio, the excitation force also increases (Figure 10). However, the damping increment is higher and overcomes the increment of the forcing work. This results in a reduced vibration amplitude. This can be seen for both Modes 2 and 3 except for bypass ratio 25 for Mode 3. In this latter case, the forced response amplitude is 2.83 times higher compared to the case of bypass ratio 17. The forced response is expected at the rotational speed of 4592 rpm, which is significantly higher than the other cases. Furthermore, the mode shape is completely different from other bypass ratios as it is shown in Figure 7b. The mode shape is not a spanwise bending mode, but it becomes a chordwise bending mode. The negative forcing near the tip which reduces the overall blade deformation for the spanwise bending does not exist anymore. The leading edge over the whole span is strongly excited since the deflection is aligned with the area of high pressure fluctuation.
To eliminate the effect of increased rotational speeds for higher bypass ratio cases, another set of simulations has been conducted. The rotational speed is now set to 1738 rpm for bypass ratios 17, 20, and 25. In these cases, only unsteady pressures on the blade are compared as is shown in Figure 10. If an arbitrary vibration mode can be identically applied for all bypass ratios, this can be considered to be proportional to the modal force and the resulting vibration amplitude. It shows that the overall unsteady pressure fluctuation decreases with increasing bypass ratio. Especially, the unsteady loading near the tip is decreased since the incidence angle is decreased with the shortened blade. The effect of increased blockage is not significant in forced response compared to the incidence angle variation.

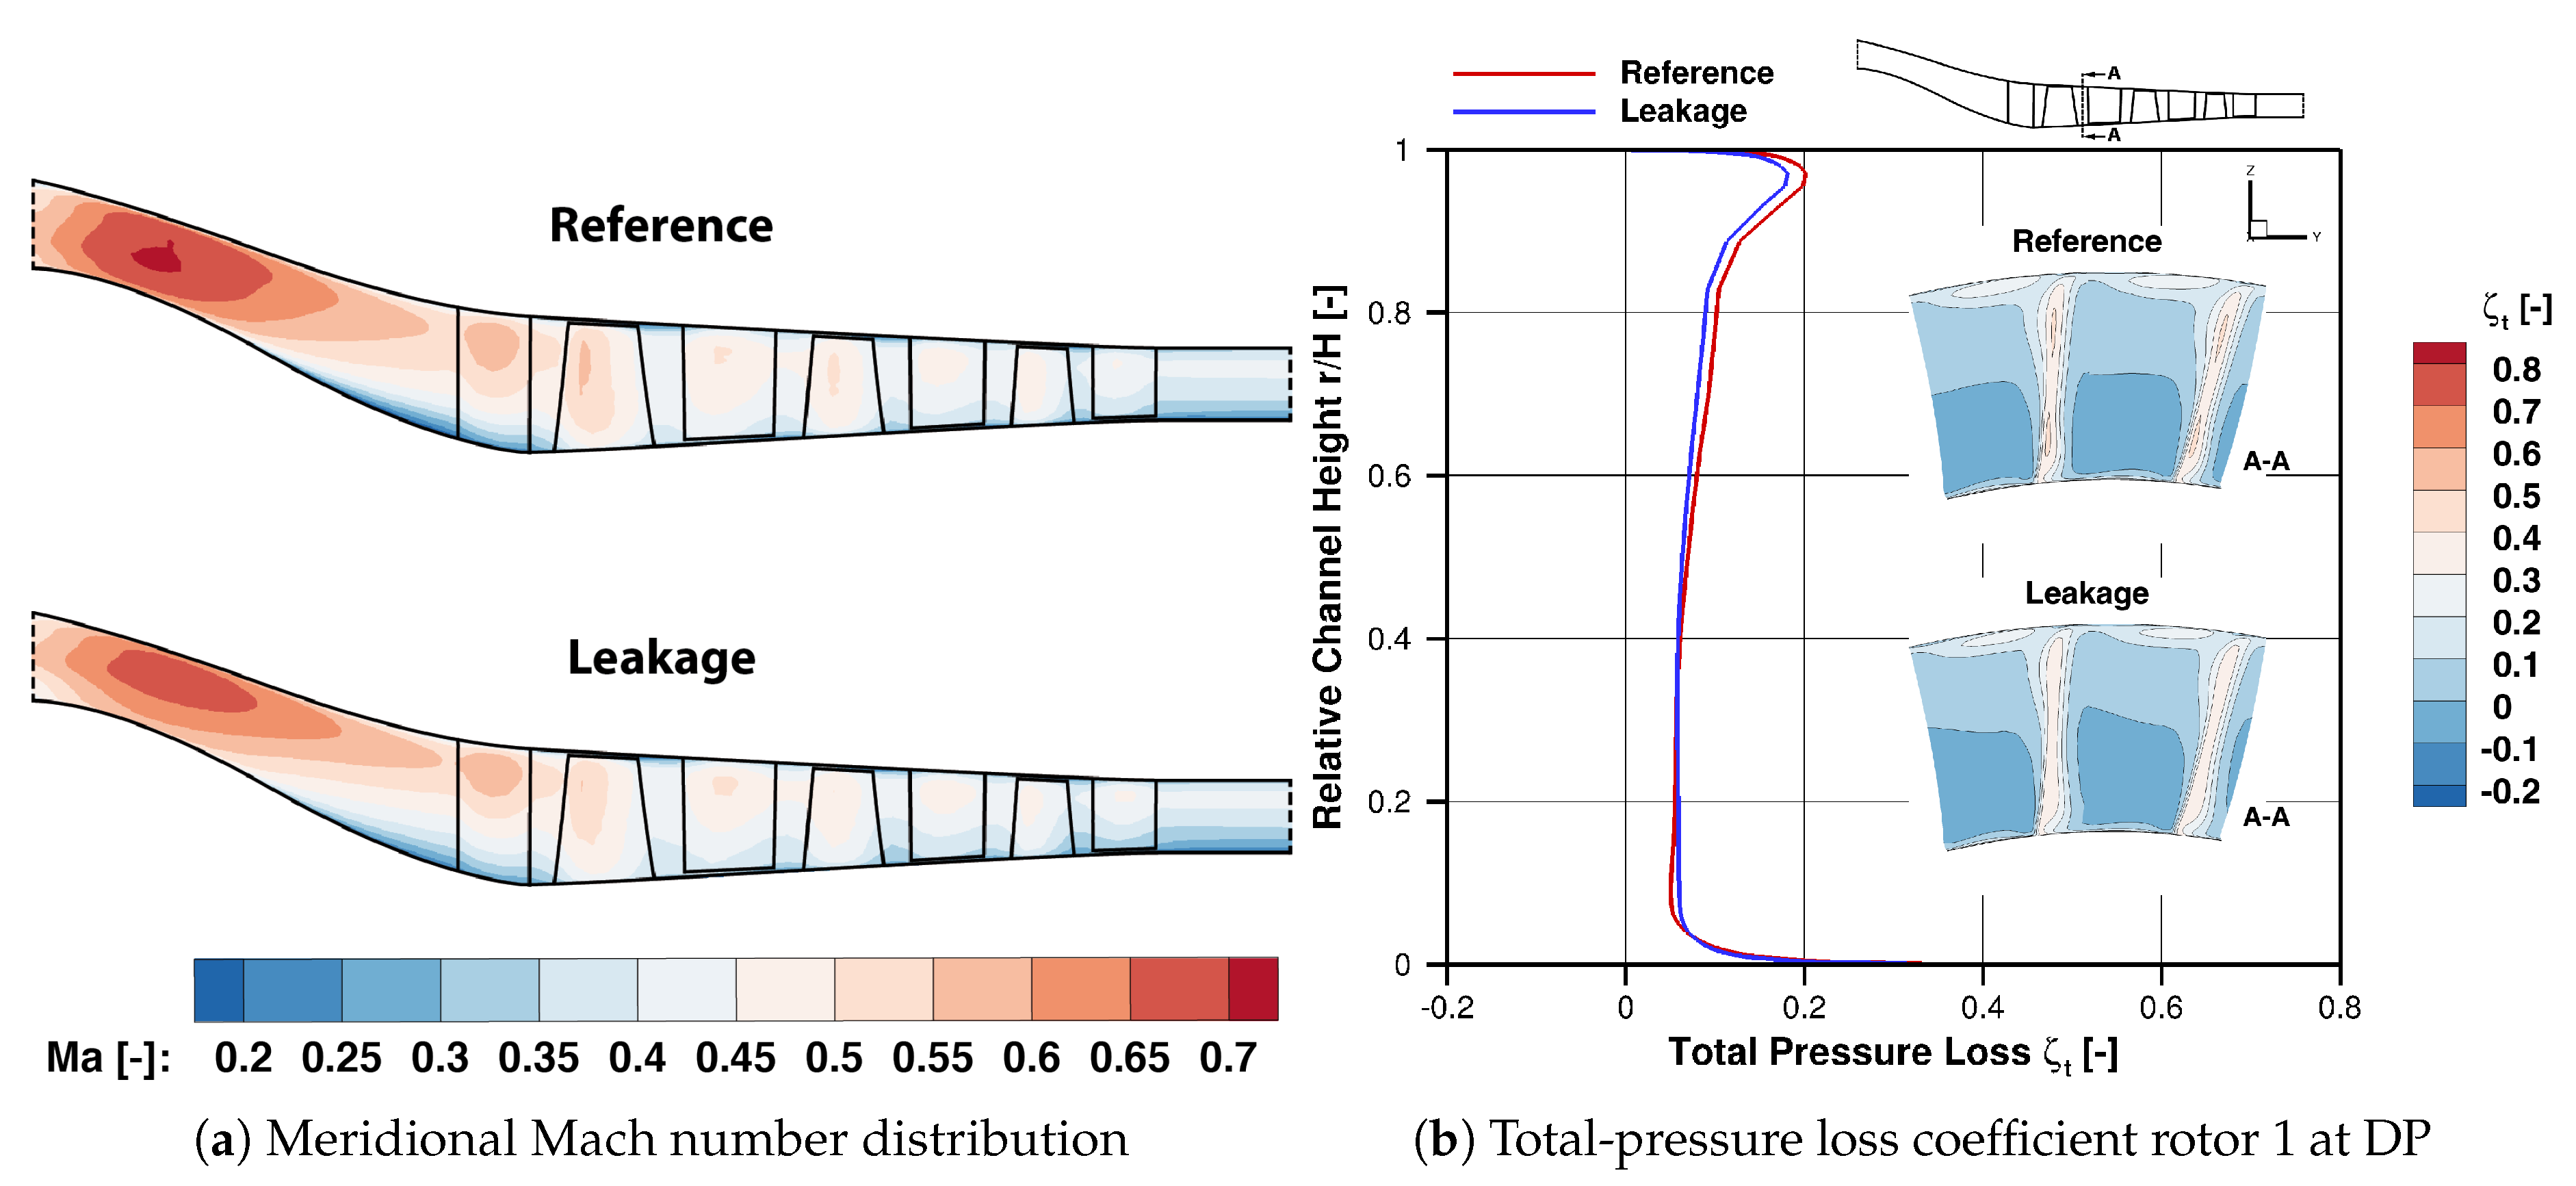
4.2.2. Effect of the Fan Rotor Cavity Flow

Aerodynamic Results

The leakage mass flow from the fan rotor cavity interacts with the near hub flow and induces a separation, which grows with increasing leakage mass flow rate (Figure 11a). As a result, a redistribution of the flow profile in the area close to the hub occurs, keeping the same required core mass flow. Within the IGV passage, a large vortex forms which leads to an increased corner vortex at the trailing edge of the blade (Figure 11b). The total-pressure loss coefficient of the IGV thus increases at design speed by up to 6 % with a leakage mass flow of 2 % in relation to the core mass flow. The bypass is not influenced by the investigated rotor cavity leakage mass flows.
The downstream LPC is subjected to a changed inflow with a significant low momentum flow in the near-hub region. In the simulations, the total-pressure ratio has been kept constant for a better comparison of the configurations. For the sake of simplicity, only the comparison with the 2 % leakage mass flow case will be shown, as it will indicate the largest effect on the LPC. In accordance to the findings of Walker et al. [43], the hub boundary layer at the duct exit is reduced due to the additional mixing of the larger IGV wake, which re-energizes the hub boundary layer. This effect is visualized by the circumstantially mass-flow averaged relative meridional velocity in Figure 12a. The flow redistribution results in an increased spanwise mass-flow averaged total-pressure loss for the s-duct by up to 1.3 % at design speed. Together with a shift in the operating point of the LPC, this results in a reduction of the total-pressure loss of rotor 1 by up to 4.3 % . The flow redistribution provides a less loaded blade tip region and a more highly loaded area below 30 % relative channel height as shown in Figure 12b. The leakage mass-flow effect dissipates downstream and is already negligible after the first rotor blade. However, this flow redistribution is swapped at off-design, so that the blade tip is subjected to higher loads and the total-pressure loss coefficient increases by up to 10 % for Mode 2 rotational speed (Figure 13).

Aeroelastic Results

As it can be expected from the aerodynamic results, the consideration of the leakage mass flow downstream of the fan amplifies the strength of VIGV wake at the upstream of the first rotor. It leads to the increase in forced response amplitude by 19 % for Mode 2 and by 26 % for Mode 3 compared to the reference case. Figure 14 shows (a) the unsteady pressure amplitude, and (b) the forcing work per area on the suction side. The unsteady pressure fluctuation increases with a 2 % leakage mass flow for both modes. As a result, the excitation and vibration amplitude increase.
In particular, the area between the hub and 75 % of the span is highly affected by the fan leakage flow regardless of the rotational speed. This is not limited to the area near the leading edge but can be found over the full chord of the blade. Near the tip, the unsteady pressure is influenced less than throughout the rest of the area. This area of influence is the reason why Mode 3 is more sensitive to the fan cavity flow. Mode 3 has the highest deflection near the midspan while Mode 2 has that at the tip where the unsteady flow is less influenced by the fan cavity flow.

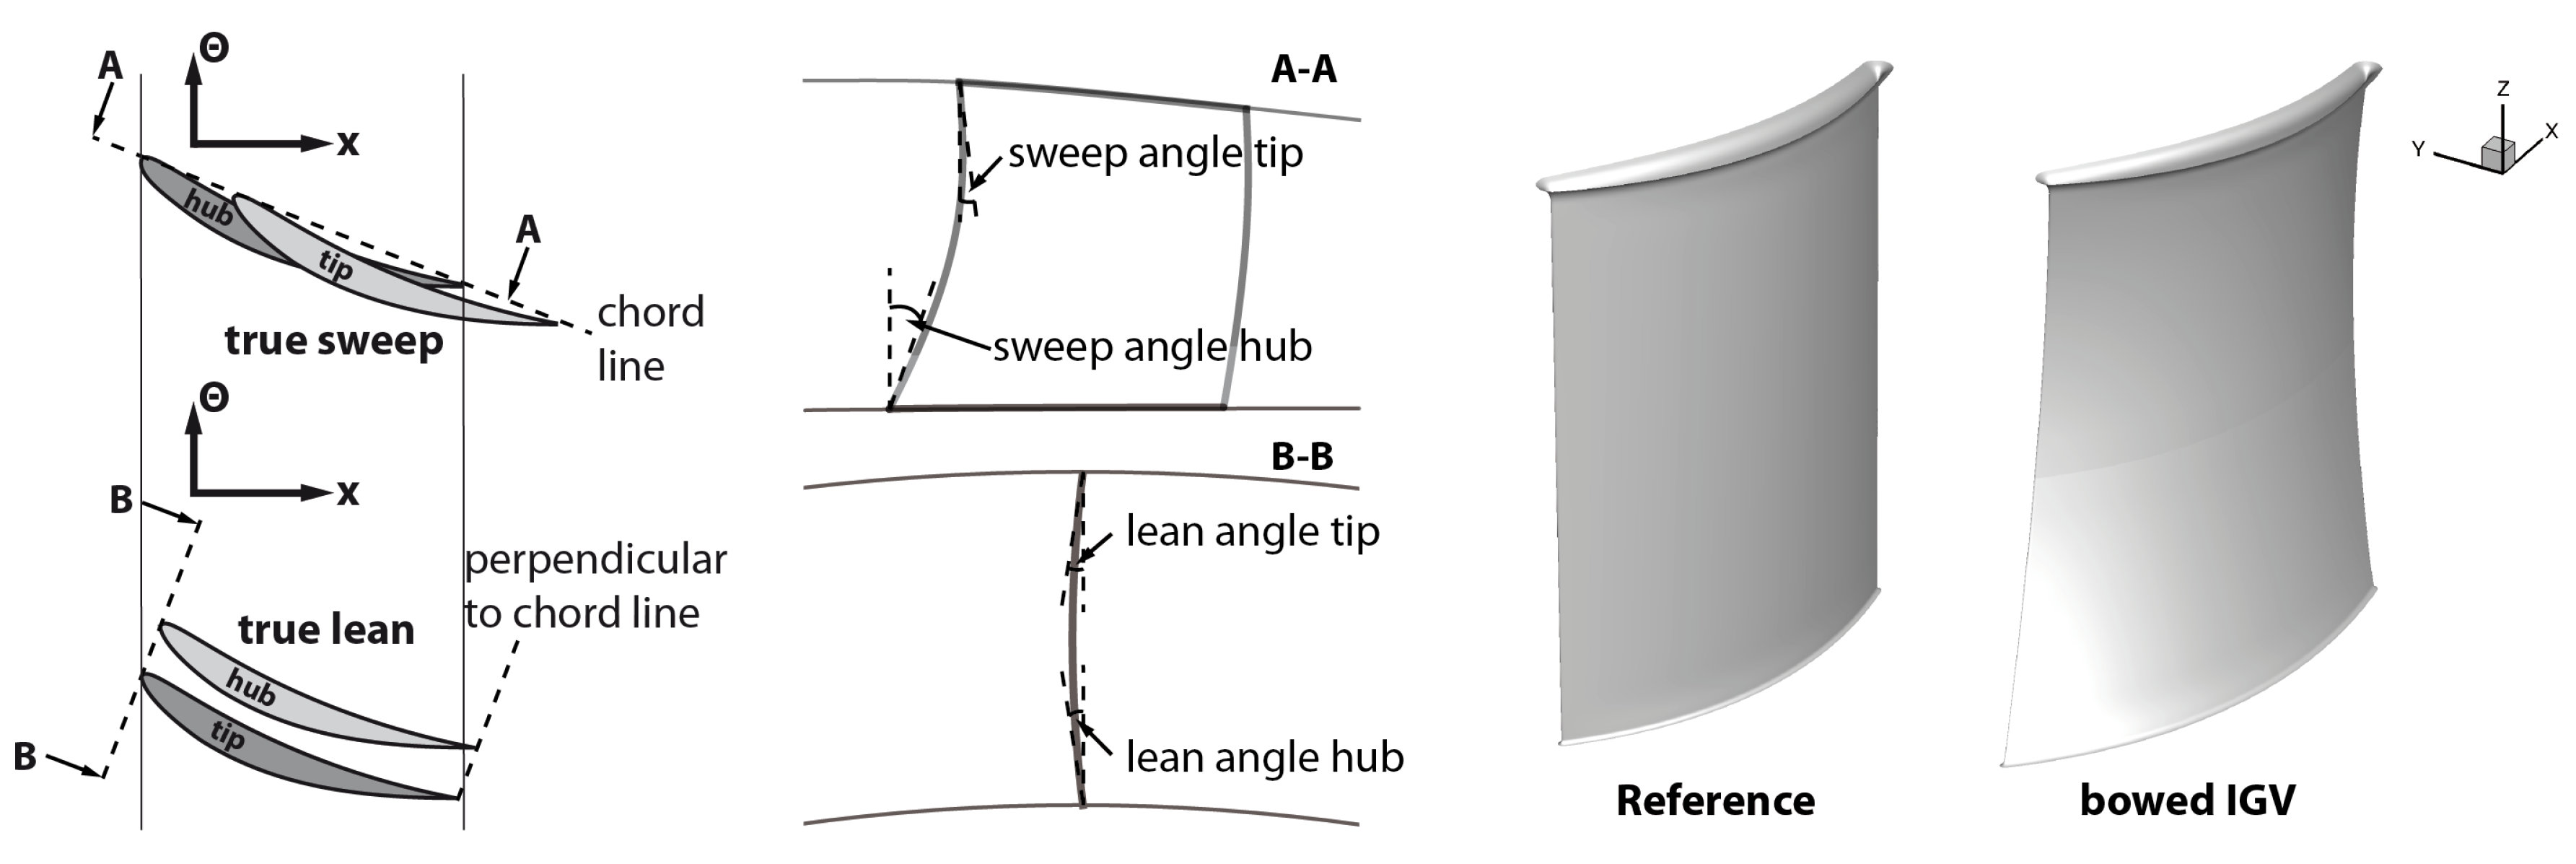
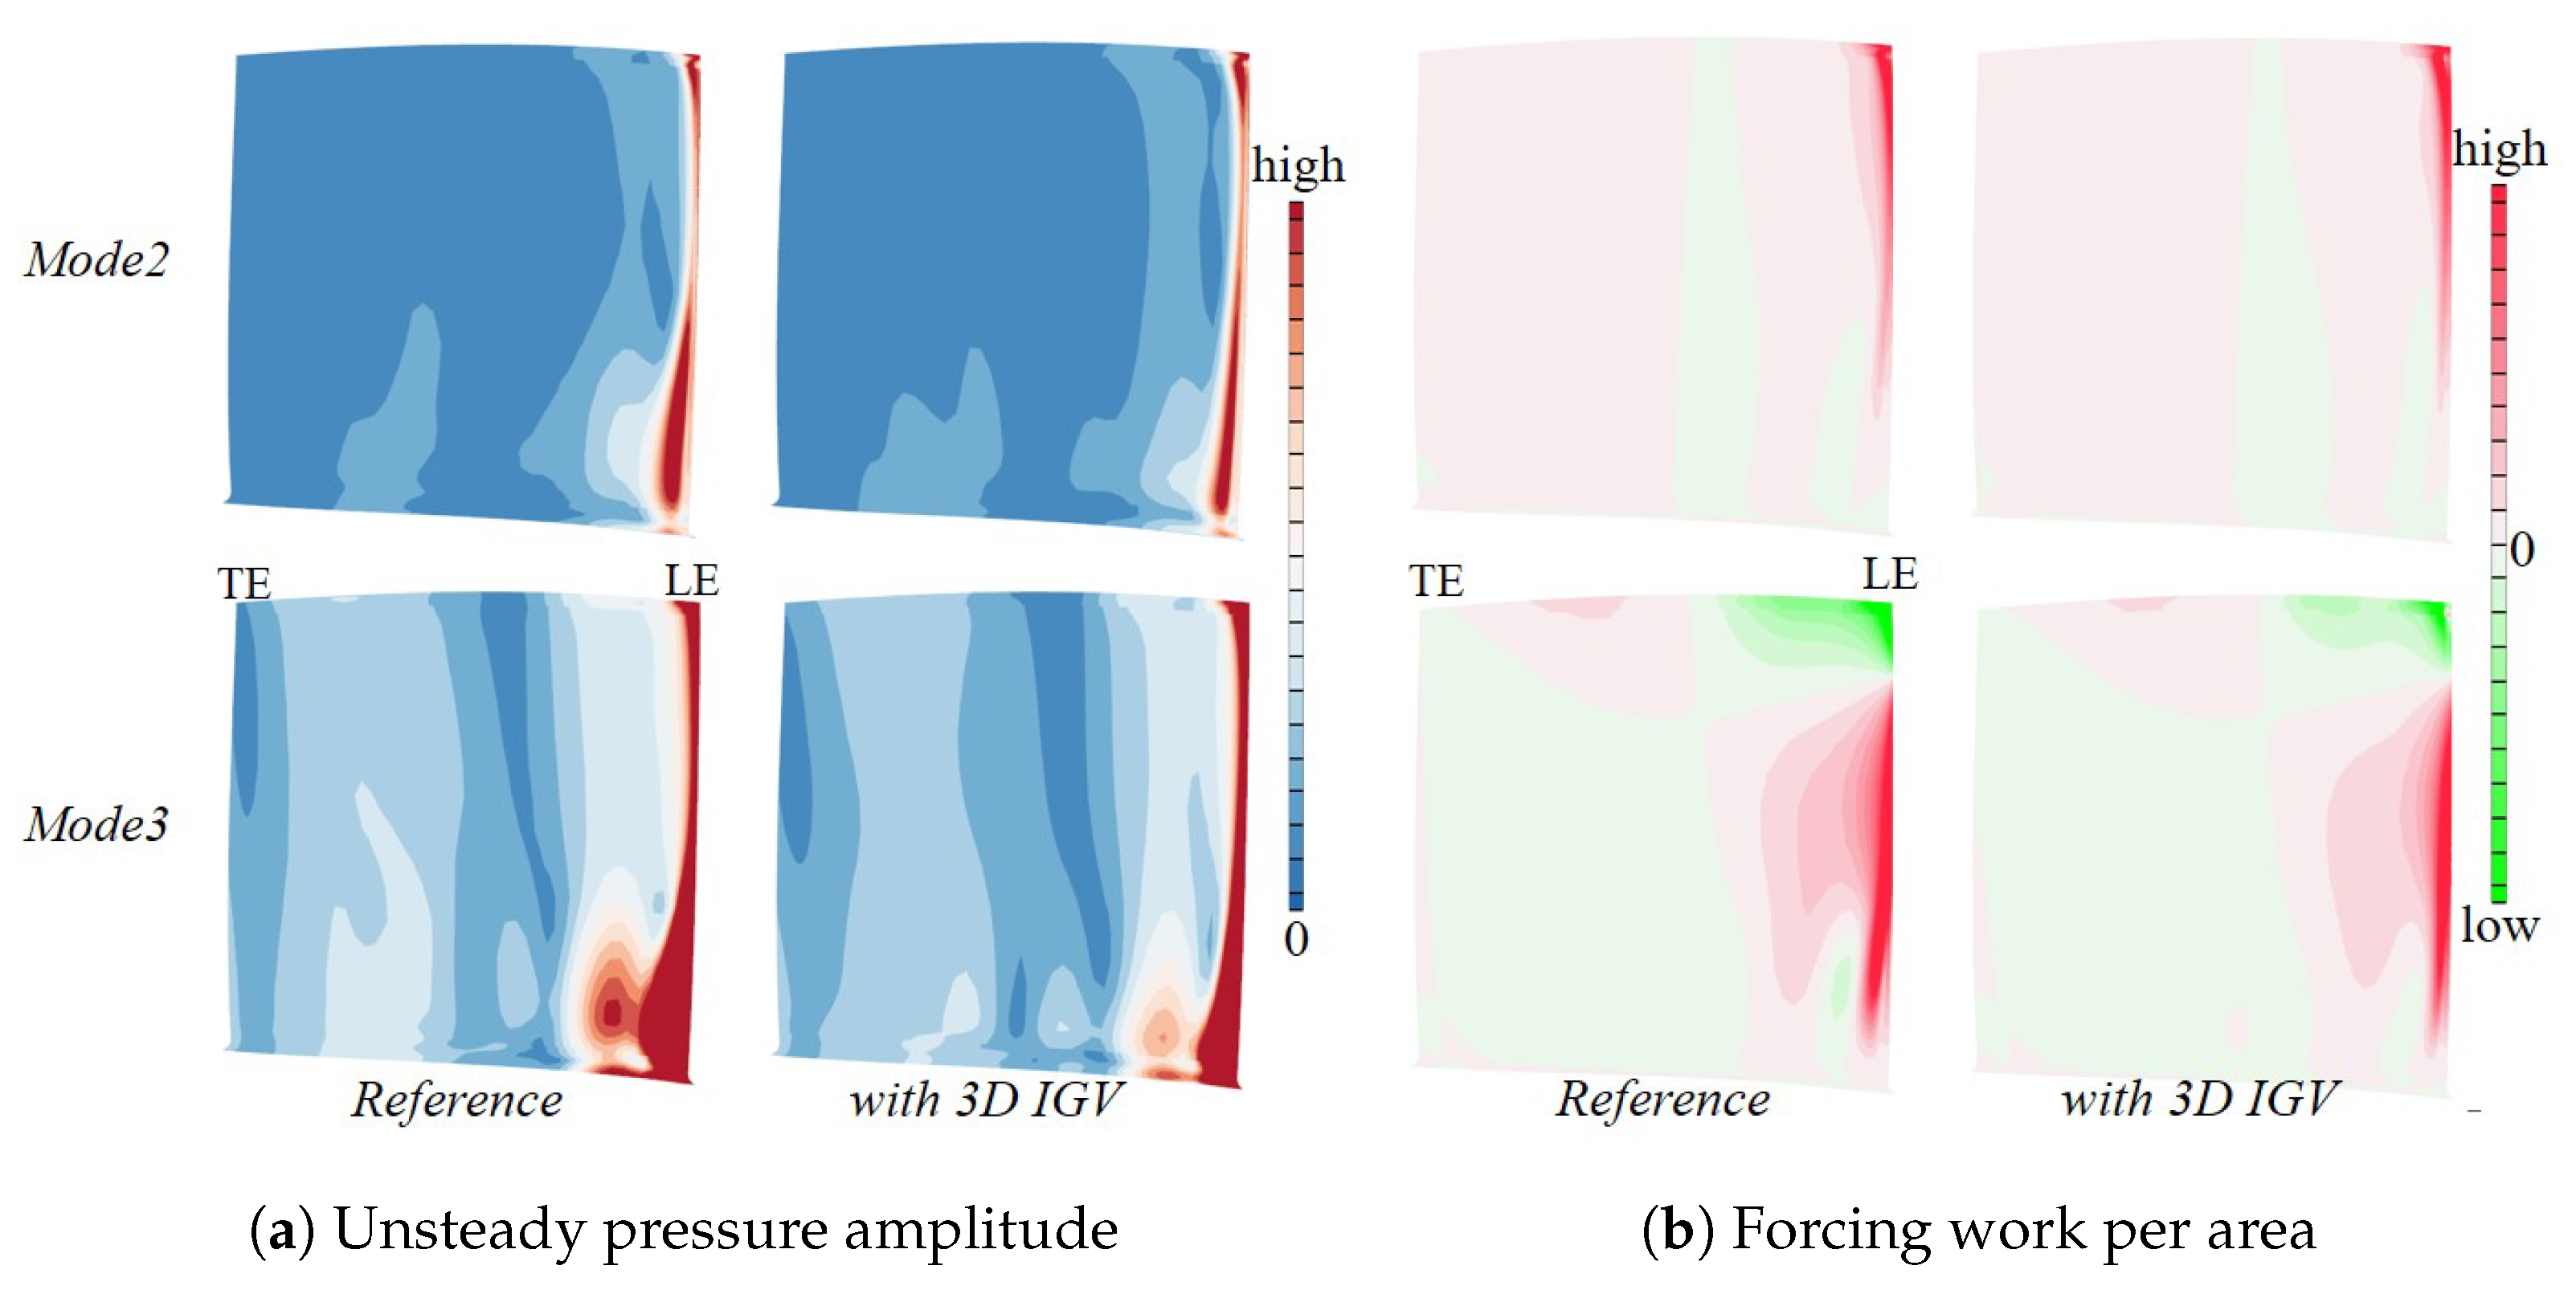
4.2.3. Sweep and Lean of the IGV

Aerodynamic Results

In Figure 15a, the effect of sweep and lean on the spanwise total-pressure loss of the IGV at design speed is shown for the case Bowed 1 from Table 1. The 3D blade design of the IGV contributes to a reduction of aerodynamic losses and increases the flow rate. The successful control of the corner vortex at the IGV trailing edge also allows the operating range to be extended to lower mass flow rates by about m ˙ D P Δ m ˙ S L m ˙ D P = 16.4 % . The other bowed designs show a similar effect and meet the expectations of the literature [7,44,45], which is why the further analysis will be focused on Bowed 1. The influence of sweep and lean of the IGV on the LPC is relatively small at the design point. At the first rotor there is only a total-pressure loss coefficient improvement of 1% relative to the reference as shown by the circumferentially averaged spanwise total-pressure loss distribution and their corresponding contour plots in Figure 15b. The effect of a reduced boundary layer dissipates downstream, and is already negligible after the first rotor blade. The efficiency potentials due to sweep and lean of the IGV on the LPC performance with an increase of 0.07 % are rather small for all cases. The true potential of a swept and leaned IGV on the downstream LPC is shown at off-design, at which the near hub corner vortices become more prominent. Thus, the total-pressure loss coefficient of rotor 1 in Figure 16 decreases by up to 18%. The benefit can be observed in the lower half of rotor 1 span. The reason for this is the relatively high-energy hub flow and the resulting reduced corner separation, as the contour plots in Figure 16 illustrate. The investigations show that the aerodynamic effects of sweep and lean of a blade can be fully transferred to the IGV of a UHBR turbofan. The influence of these effects continues downstream through the s-duct and a second guide vane, leading to a reduction of the total-pressure loss of rotor 1 in an LPC configuration at off-design.

Aeroelastic Results

The aerodynamic improvement of the IGV design in the form of the sweep and lean has a positive effect on the aeroelastic behavior of the first rotor blade of the LPC. More specifically, this leads to a reduction of the vibration amplitude of 13 % and 11 % for Modes 2 and 3, respectively. By weakening the corner vortex at the IGV downstream of the fan, the reduction of the unsteady pressure on the rotor blade can be achieved. Near hub and tip areas are greatly influenced by the sweep and lean of the IGV as is shown in Figure 17. As generally described in Section 4.1, Mode 3 has a negative force near the tip. The stabilized pressure loading decreases not only the positive force, but also the negative force in one blade. This leads to the lower sensitivity on the vibration amplitude in Mode 3 than Mode 2, even the unsteady pressure fluctuation is suppressed more for Mode 3 than for Mode 2 with the 3D blading of the IGV. Previous studies concern parametric variations in adjacent blade rows [23,28]. This study shows that forced response of a target row can be considerably affected by varying aerodynamic design of blades remote from it. This emphasizes the importance of accurate boundary conditions in a forced response simulation of the LPC.

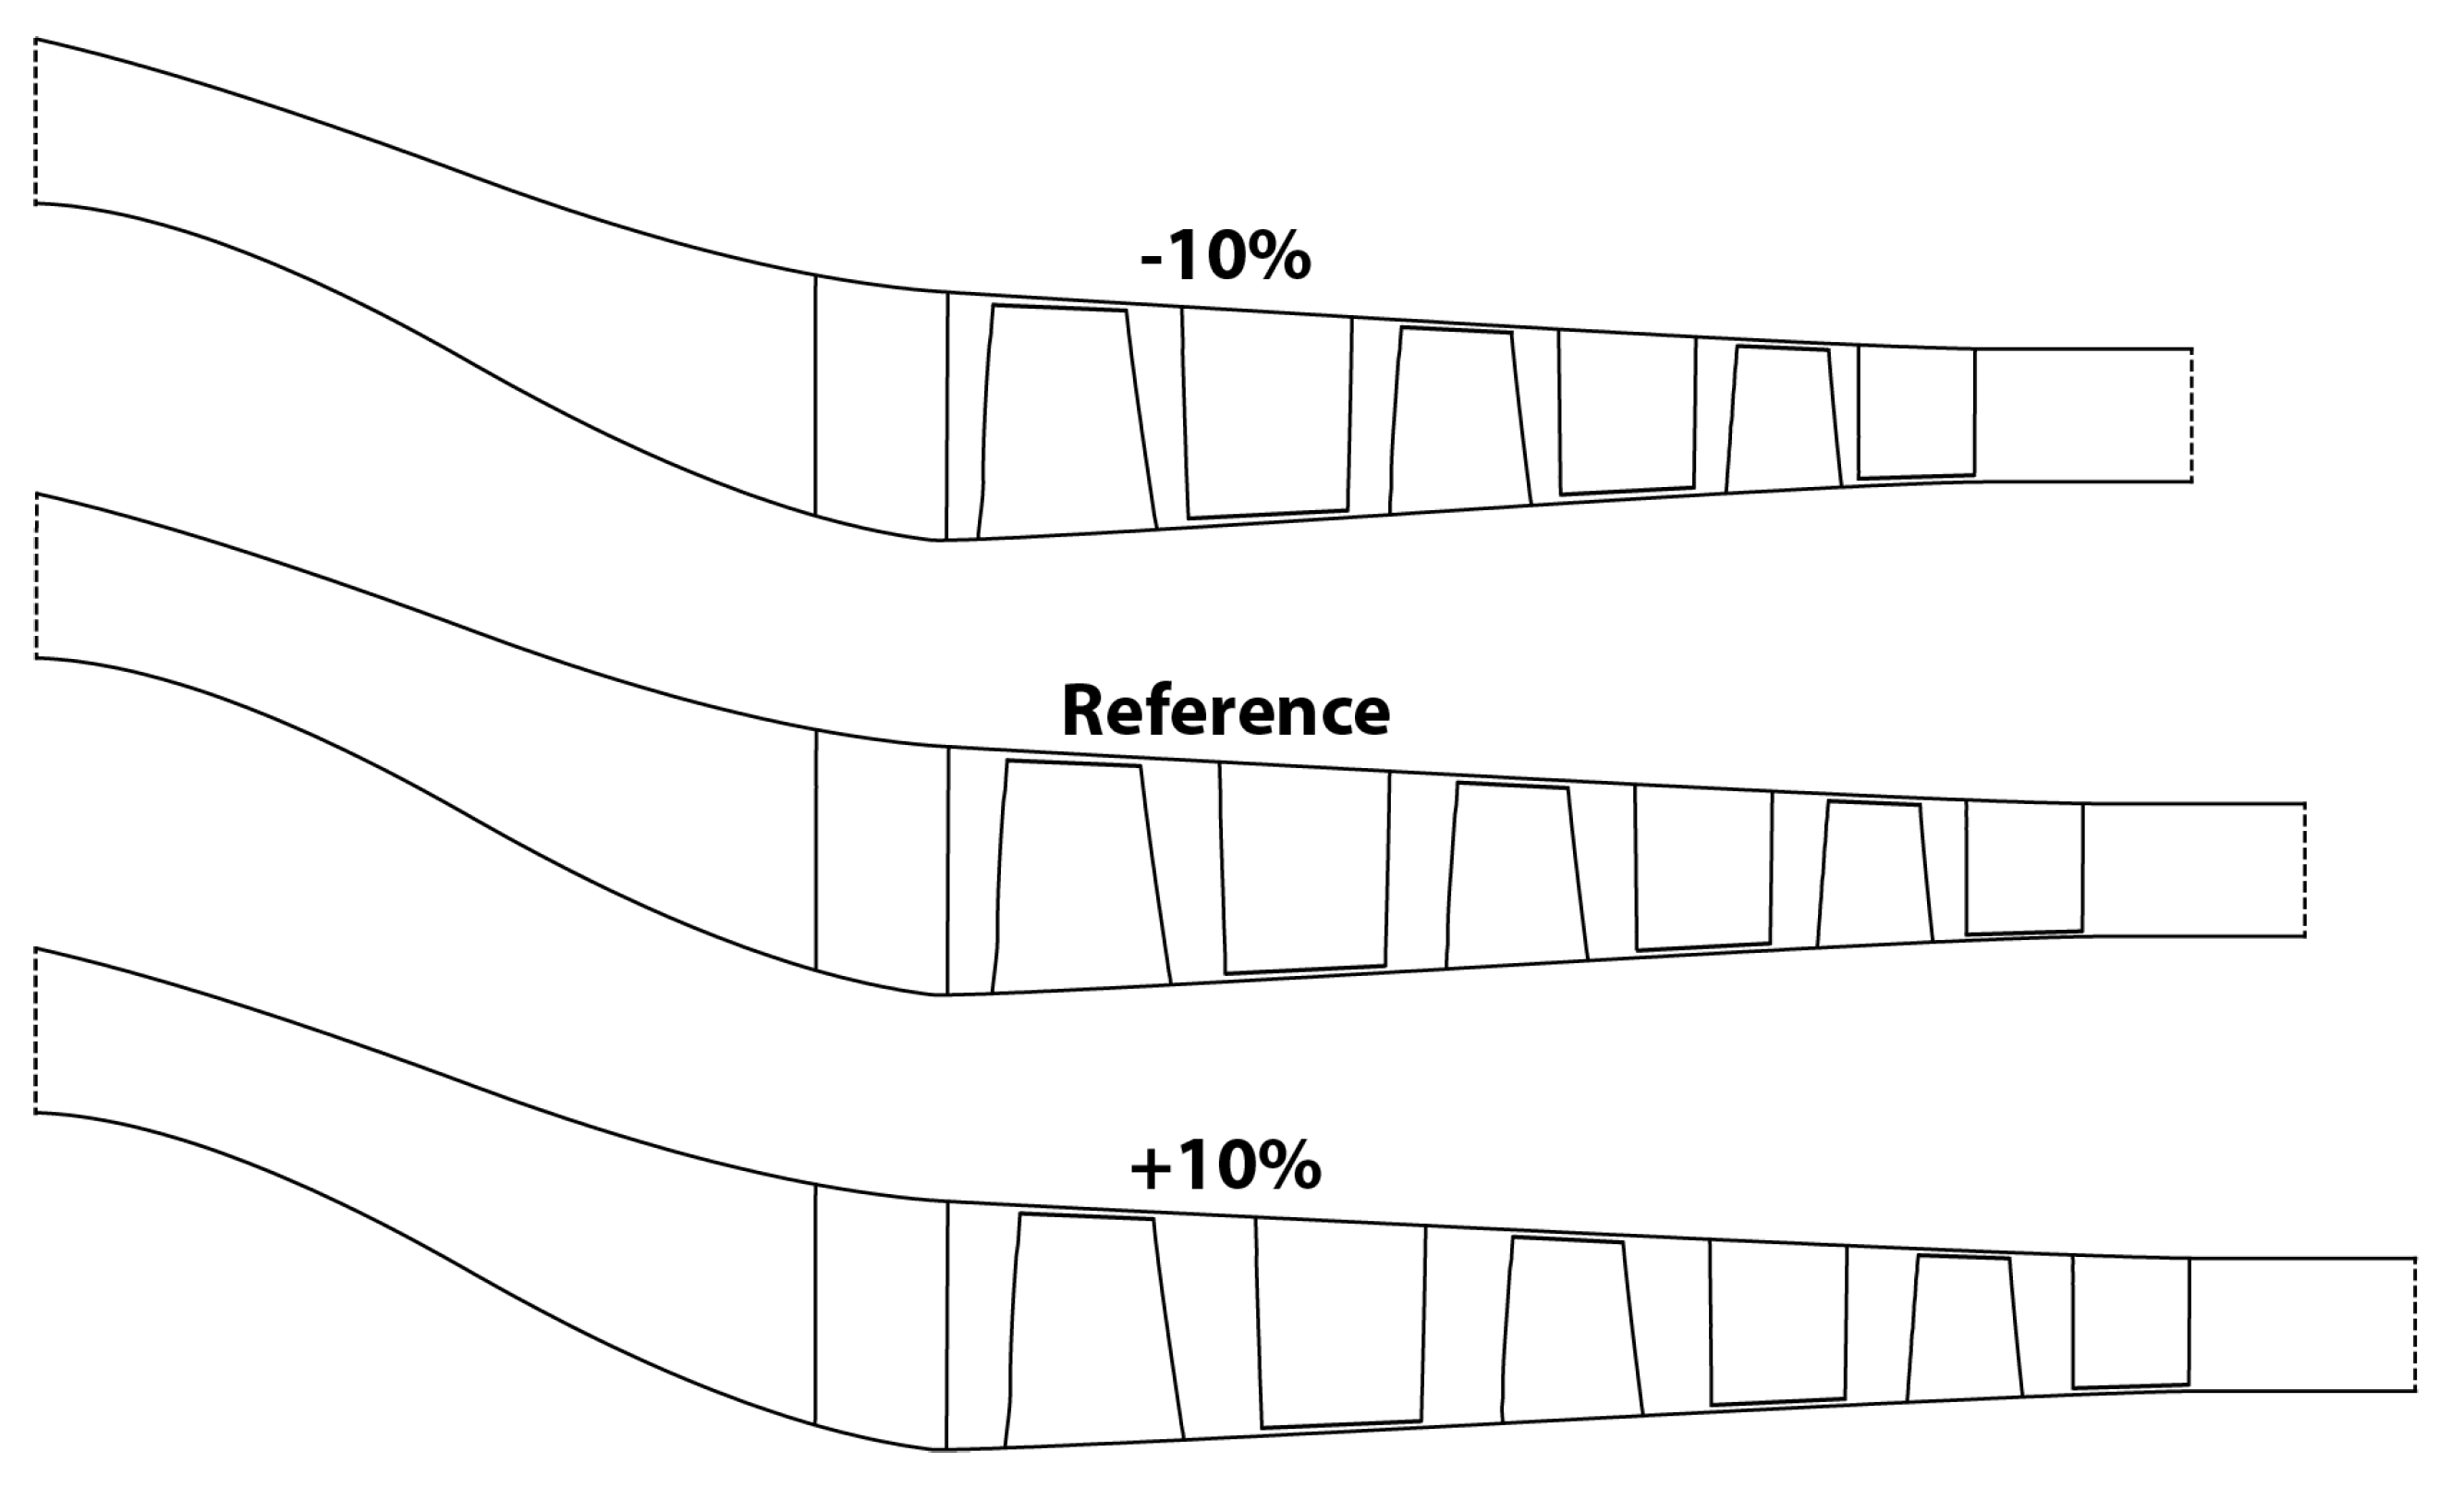
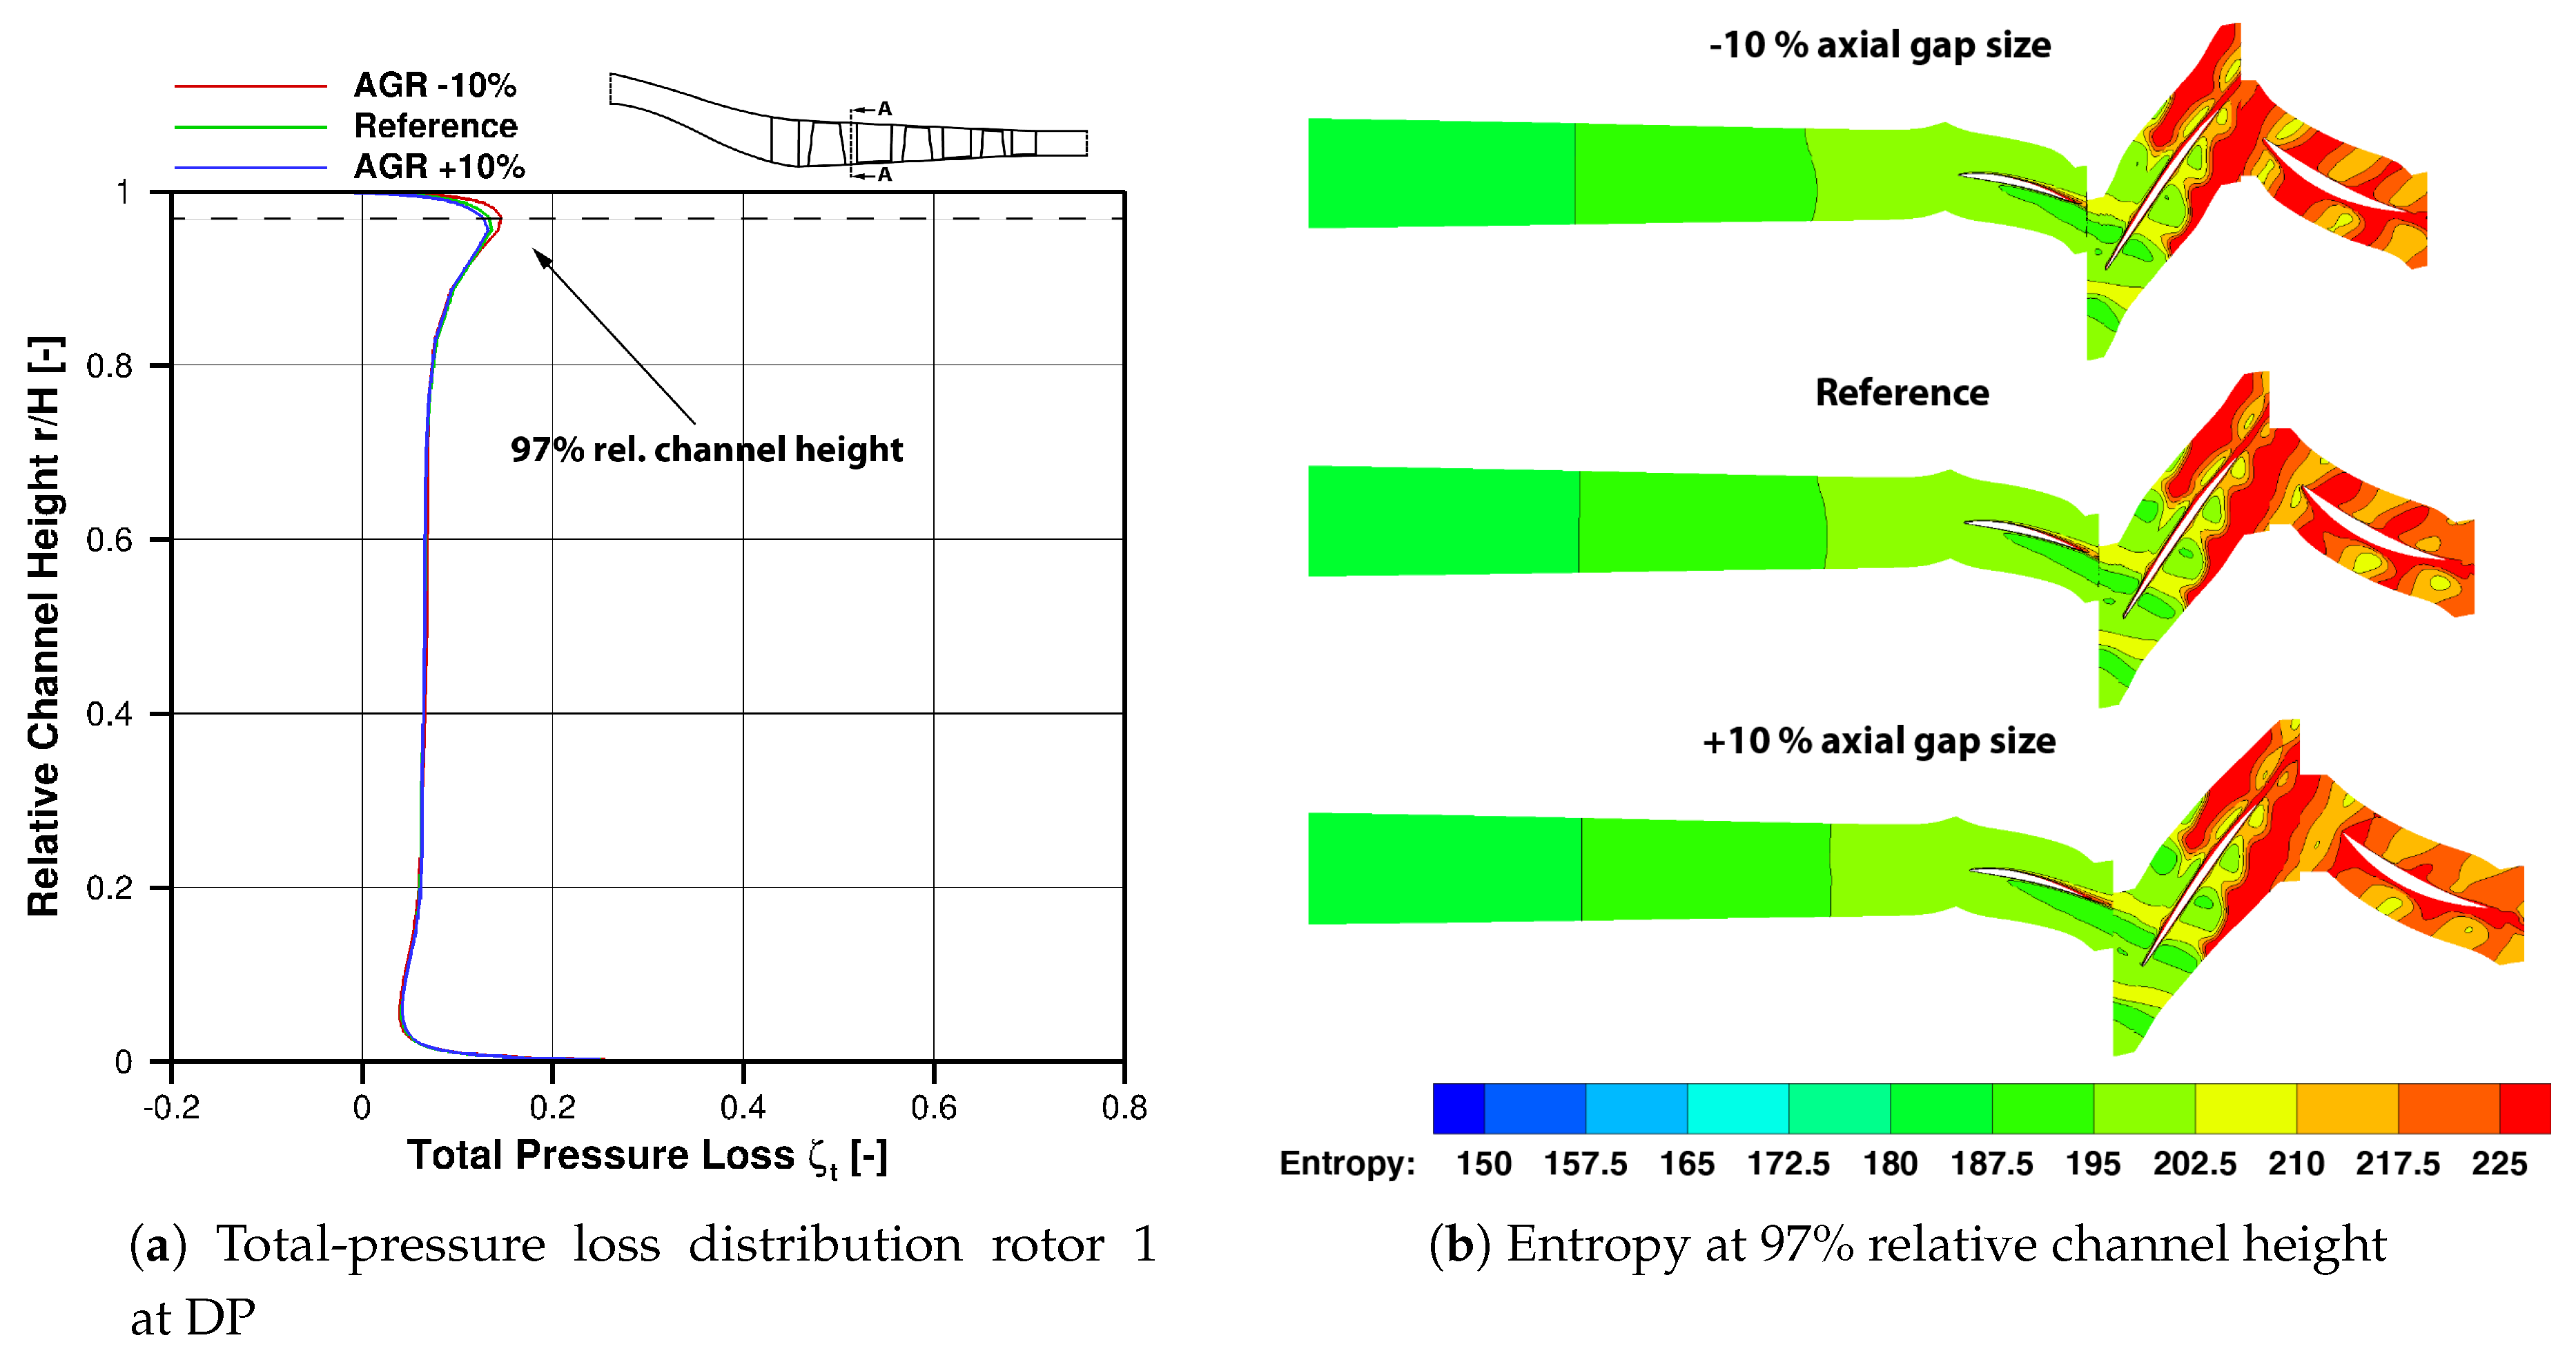
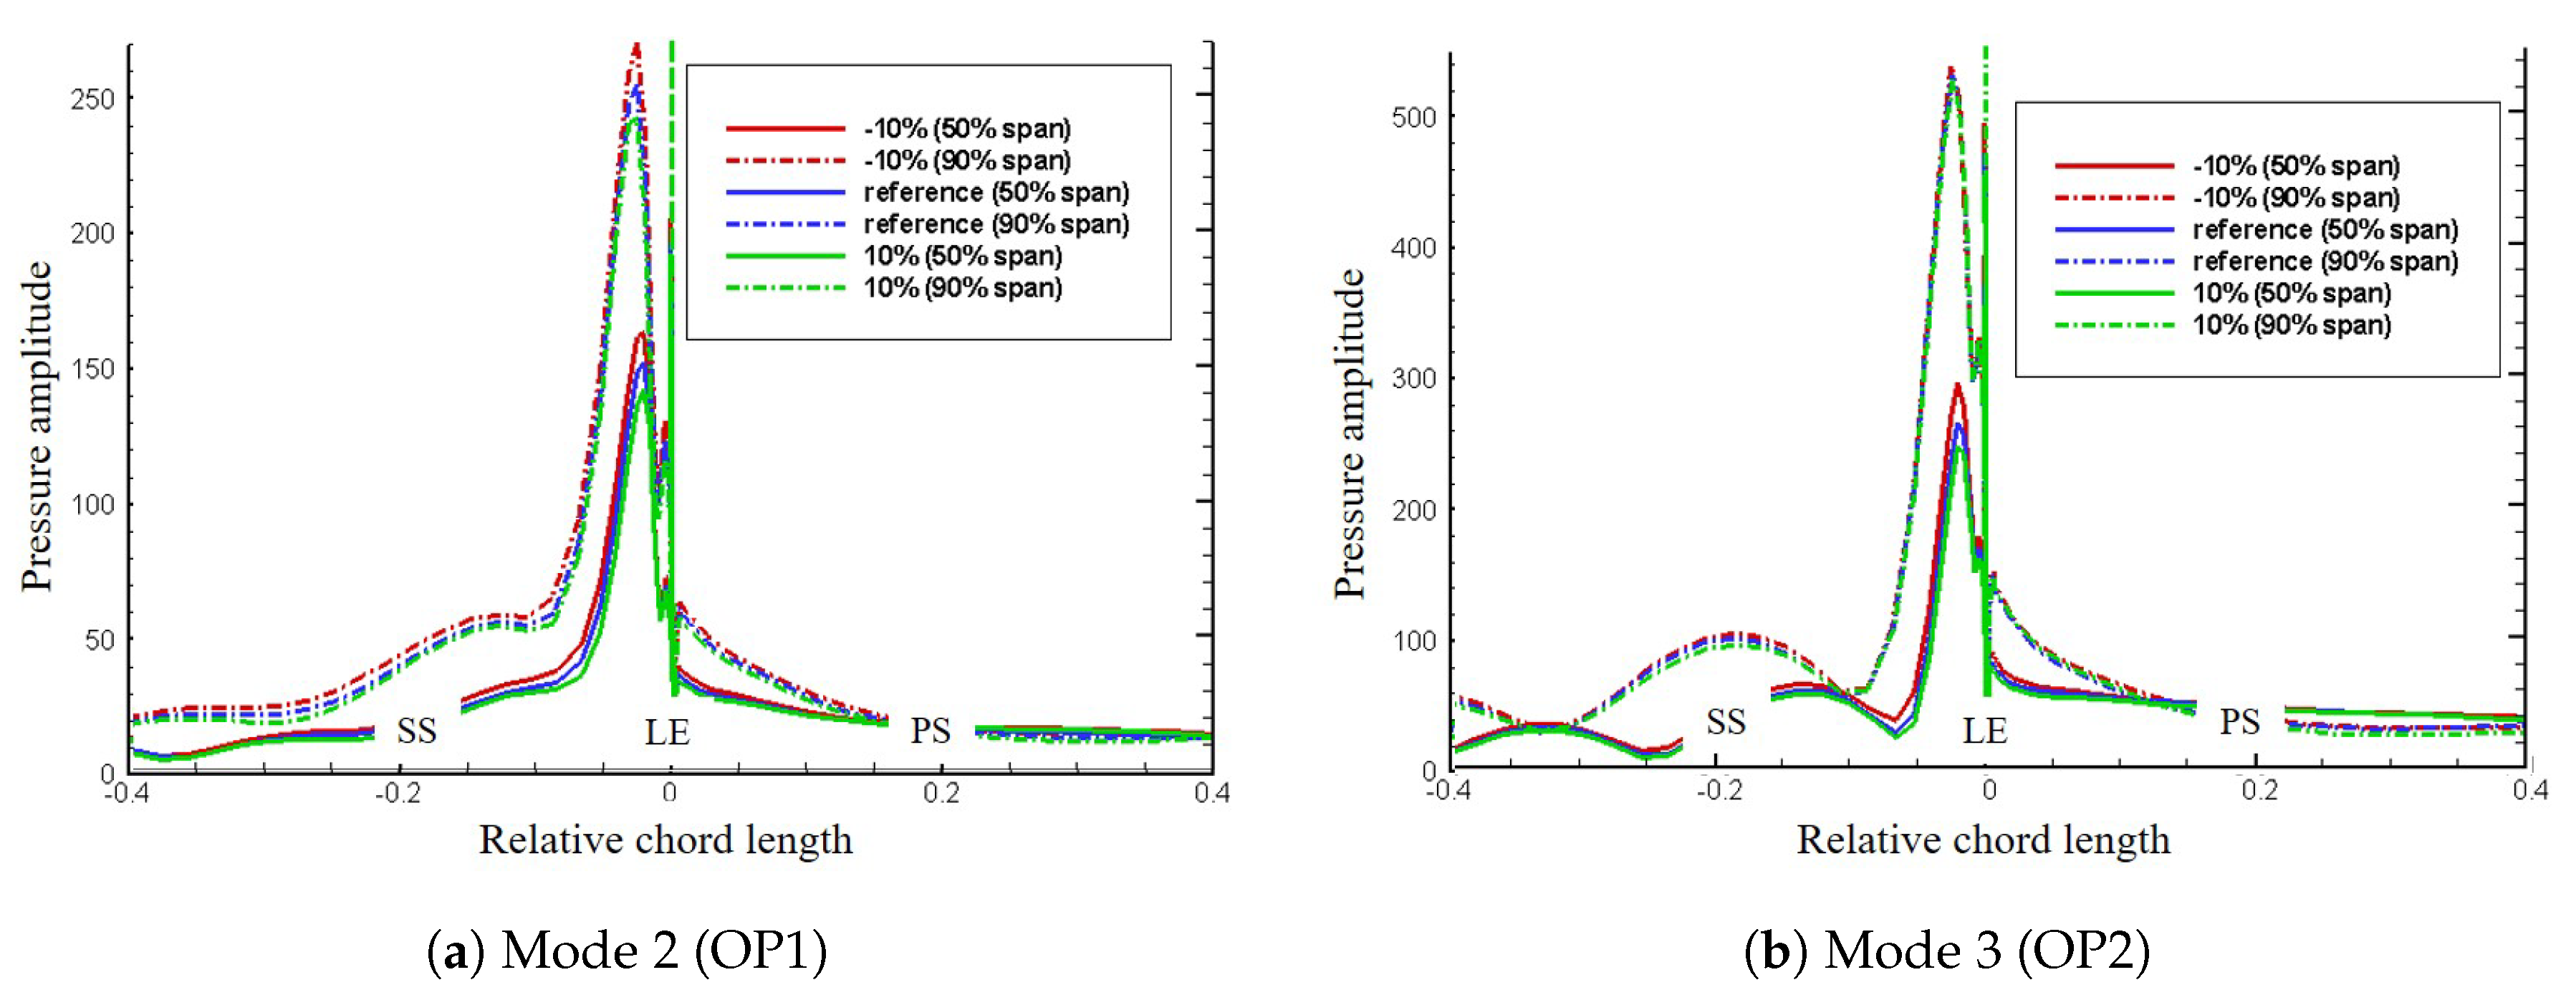
4.2.4. Impact of the Axial Gap Size

Aerodynamic Results

By reducing the axial gap size, two opposing mechanisms occur according to the literature. On one hand, there are reduced viscous effects due to shortened length of the LPC, which leads to reduced mixing losses [16]. On the other hand, negative interaction effects occur which increase the extent of turbulence and near-wall losses due to earlier transition [19].
Figure 18 depicts the radial distribution of total-pressure loss of rotor 1 and the circumferential entropy contour plots of the first three rows at 97% relative channel height at design speed. In Figure 18a, the curves of the three configurations are almost the same. Only in the blade tip area, an increase of the total-pressure loss can be identified with decreasing axial blade spacing. With a change in axial gap size, the wake mixing length gets changed accordingly, leading to a minor impact on the inflow of each row. This effect adds up for each row and in addition to the upstream interaction, the operating point and the radial flow distribution are changed slightly. As the tip region is the most sensitive towards changes of incidence angles due to the high relative velocities and the presence of tip gap vortices, the effect of different axial gap sizes is only evident here. The entropy contour plot in Figure 18b shows this with a higher entropy in the wake of rotor 1, which is carried downstream into the stator. In contrast to that, a reduction of the axial blade distance leads to an increase in the overall polytropic efficiency of the LPC of 0.4% as the mixing loss decreases. The same behavior can also be observed at off-design and is therefore not shown here. This allows a first assessment of the influence of changed axial gap sizes on the LPC of an UHBR turbofan. For a more accurate estimation of the magnitude of the axial gap size influence, additional, highly resolved simulations must be performed.

Aeroelastic Results

The calculated forced response amplitude is not changed when the axial distance between VIGV and the rotor is reduced by 10 % from the reference distance for both modes. This negligible aeroelastic effect of the reduced axial distance is promising for the design improvements of the LPC. With an increase of axial distance by 10 % , however, the effect on the vibration amplitude is not only visible, but it is also different between Modes 2 and 3. The vibration amplitude decreases by 5 % with Mode 2 and increases by 5 % with Mode 3. A great part of previous investigations supports that increasing axial distance is beneficial for aeroelasticity. However, the influence of the axial distance between rotor and stator can vary depending on the operating point and eigenmode of the blade according to [28]. The reason that few previous experimental research could show the suppression of pressure fluctuation by increasing the axial gap is that those studies were conducted with large variations of the gap size to show the clear difference depending on the gap size. When it comes to the small variation as presented here, the influence can be negligible and slightly different compared to the trend in large variations.
The unsteady pressure distribution along the relative chord length is shown in Figure 19. The unsteady pressure distribution is similar between different axial gaps as expected. However the decreasing amplitude with increasing axial gap is still visible. For Mode 2 (first torsion), the unsteady pressure decreases with increasing axial gap both in 50 % and 90 % of the span. Therefore, the overall excitation is expected to be lower with increasing axial gap. The unsteady pressure also decreases with increasing axial gap for Mode 3 (second bending). Since the blade midspan and the tip deflect in the opposite direction, the vibration amplitude can increase or decrease depending on the pressure distribution and the imposed deflection distribution of the eigenmode. Korakianitis [28] calculates unsteady forces on 2D rotor blades. He explains that the locally increased stimulus with increasing axial gap is caused by a combined effect of wakes and potential fields. This investigation shows that the local increase in excitation depends on the mode shape, not the changes in unsteady flow field. Further investigations on higher modes are necessary to confirm this correlation between mode shapes and the increase in vibration amplitude.

5. Conclusions

A series of UHBR-related design modifications of an LPC were studied and their influence on its aerodynamic and aeroelastic behavior are presented in this paper. Even though the general sensitivities to the investigated parameters have been studied in the past, the present application specifically addresses the fan outlet flow and the s-duct influence as they are exacerbated in UHBR engines. The studies comprise aerodynamic simulations of a three stage LPC including the inlet s-duct. They were conducted using a 3D RANS solver and the harmonic balance method to study the rotor–stator interaction. The inlet boundary conditions were extracted from simulations of the fan and provide a realistic inflow. The efficiency and pressure loss of the duct and the LPC were evaluated for the design point and off-design points. The aeroelastic simulations of the first rotor of the LPC were conducted using the time-linearized solver. The forcing work from the upstream VIGV and the damping from the rotor blade itself were calculated. The energy method was adapted to evaluate the vibration amplitude of the blade at two resonant operation points.
The forced response analysis shows that the leading edge of the suction side contributes the most to the overall forcing work on the rotor blade since the strong unsteady pressure induced from upstream VIGV excites this area. The vibration amplitude is especially sensitive to the unsteady pressure amplitude near the blade tip because this area experiences the strongest unsteadiness and a large deflection of the blade. The sensitivity of parameter variations differs depending on the operating points and the mode shape of the blade. The findings from individual parametric studies and corresponding design suggestions are as follows.
  • The increase in the bypass ratio by lowering the compressor channel height increases the blockage of the flow and leads to a decrease in the overall efficiency of up to 1.7 % for the LPC. However, the forced response amplitude is mainly sensitive to the change of the incidence angle while the increased blockage effect is negligible.
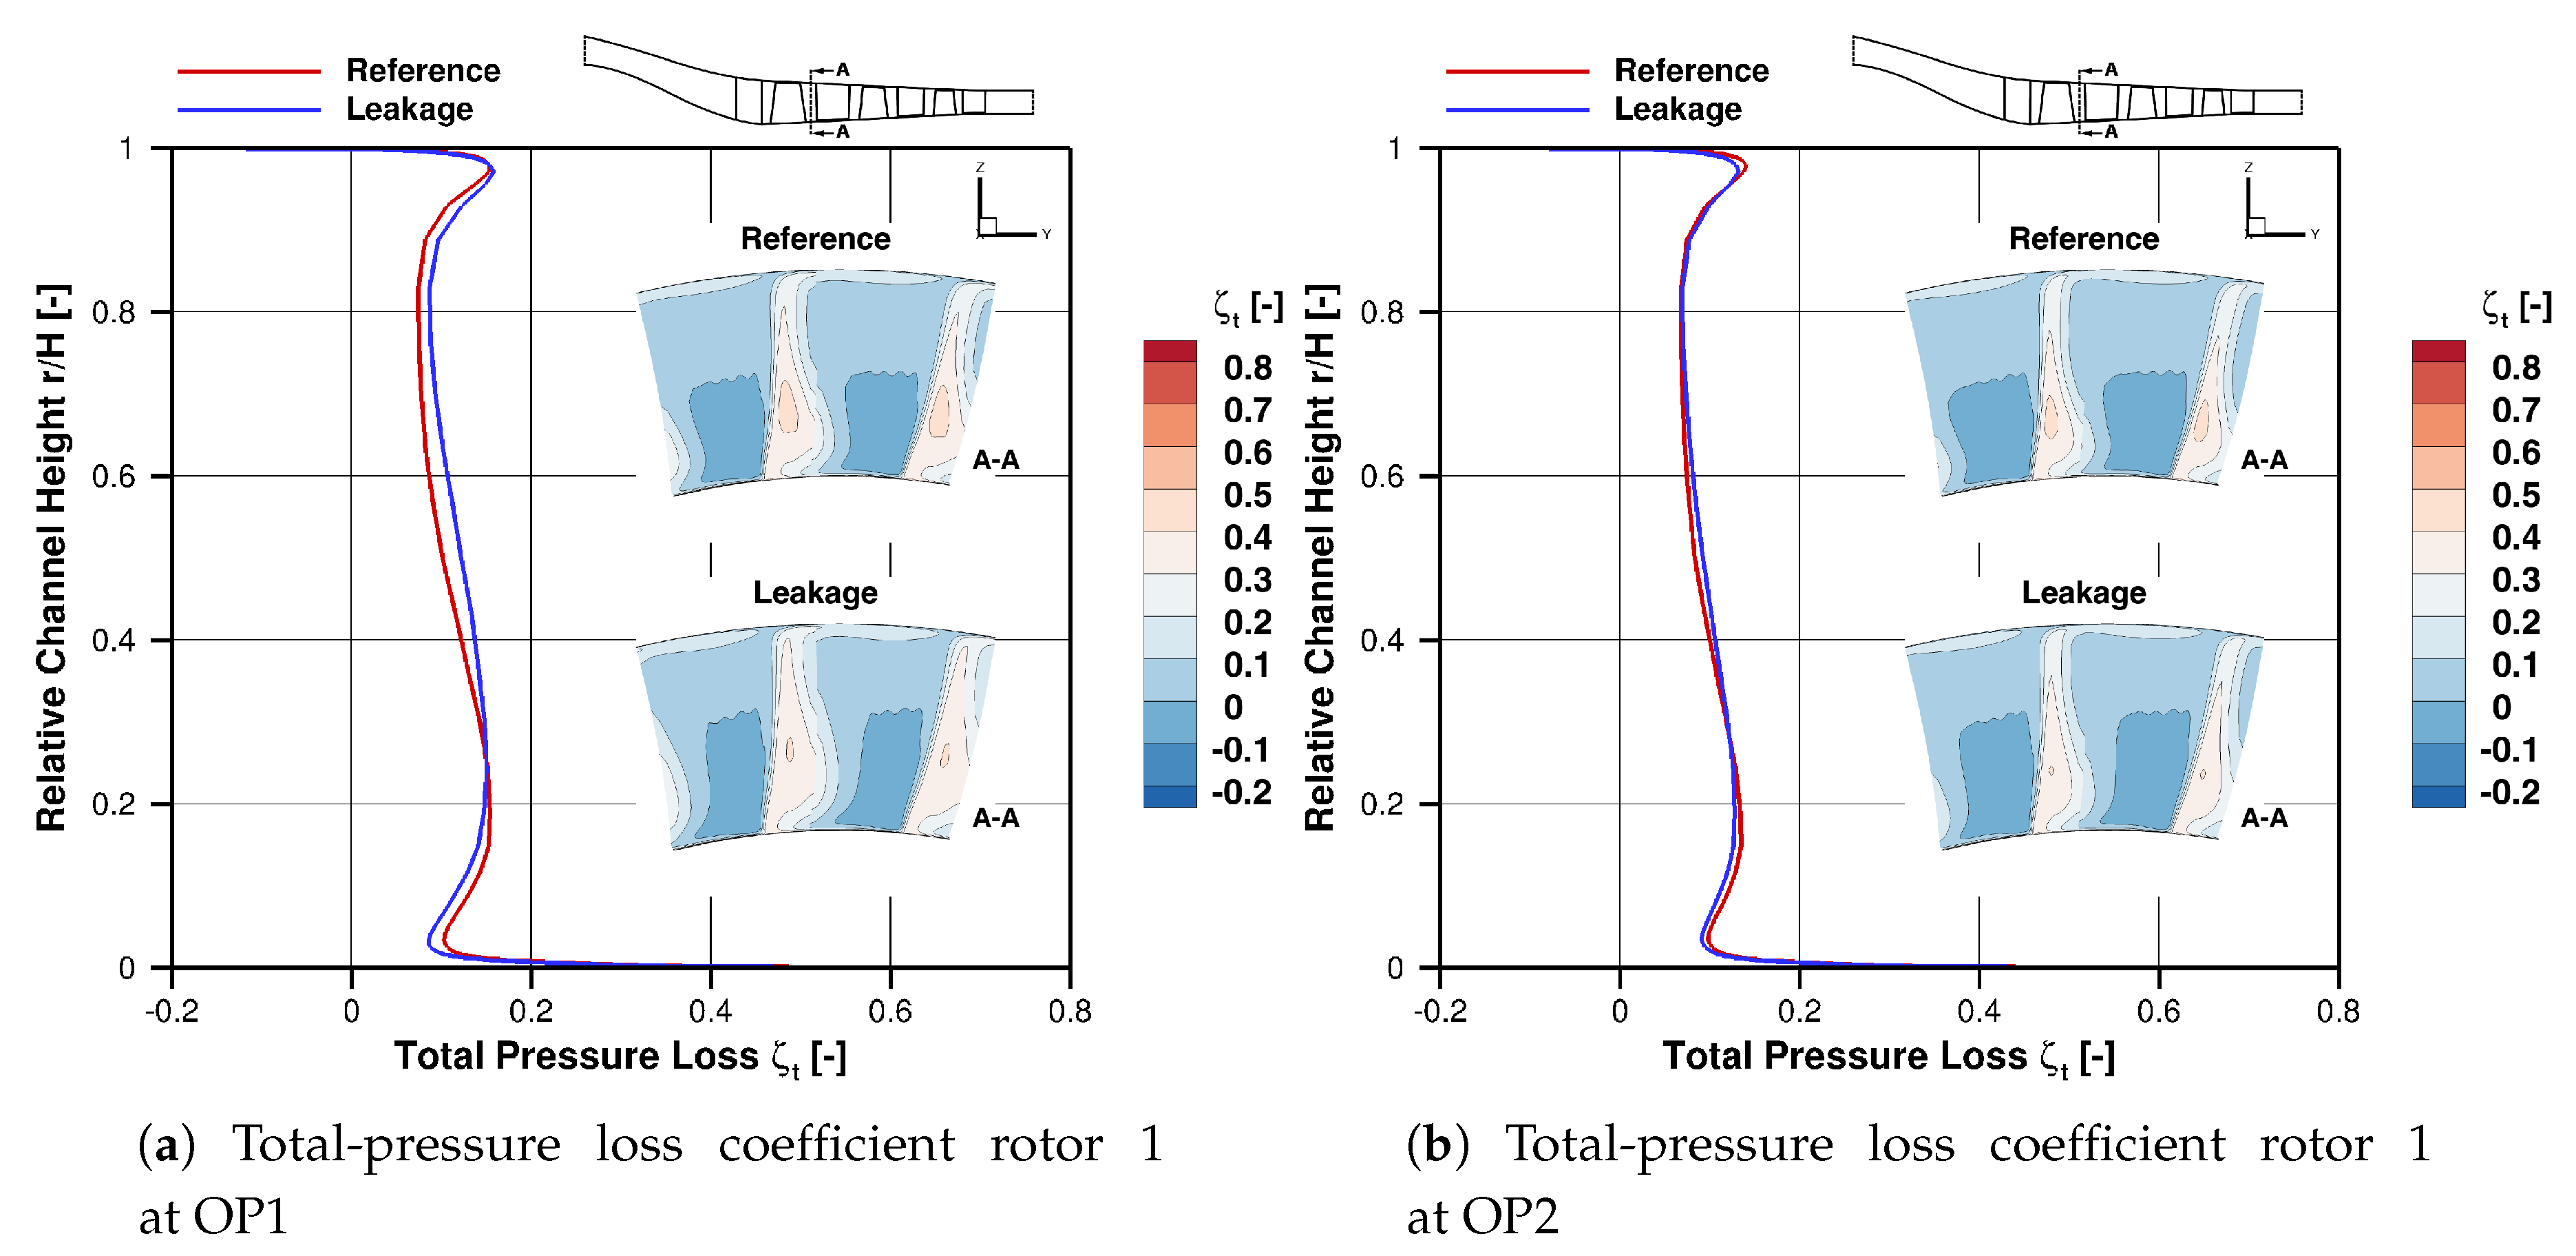
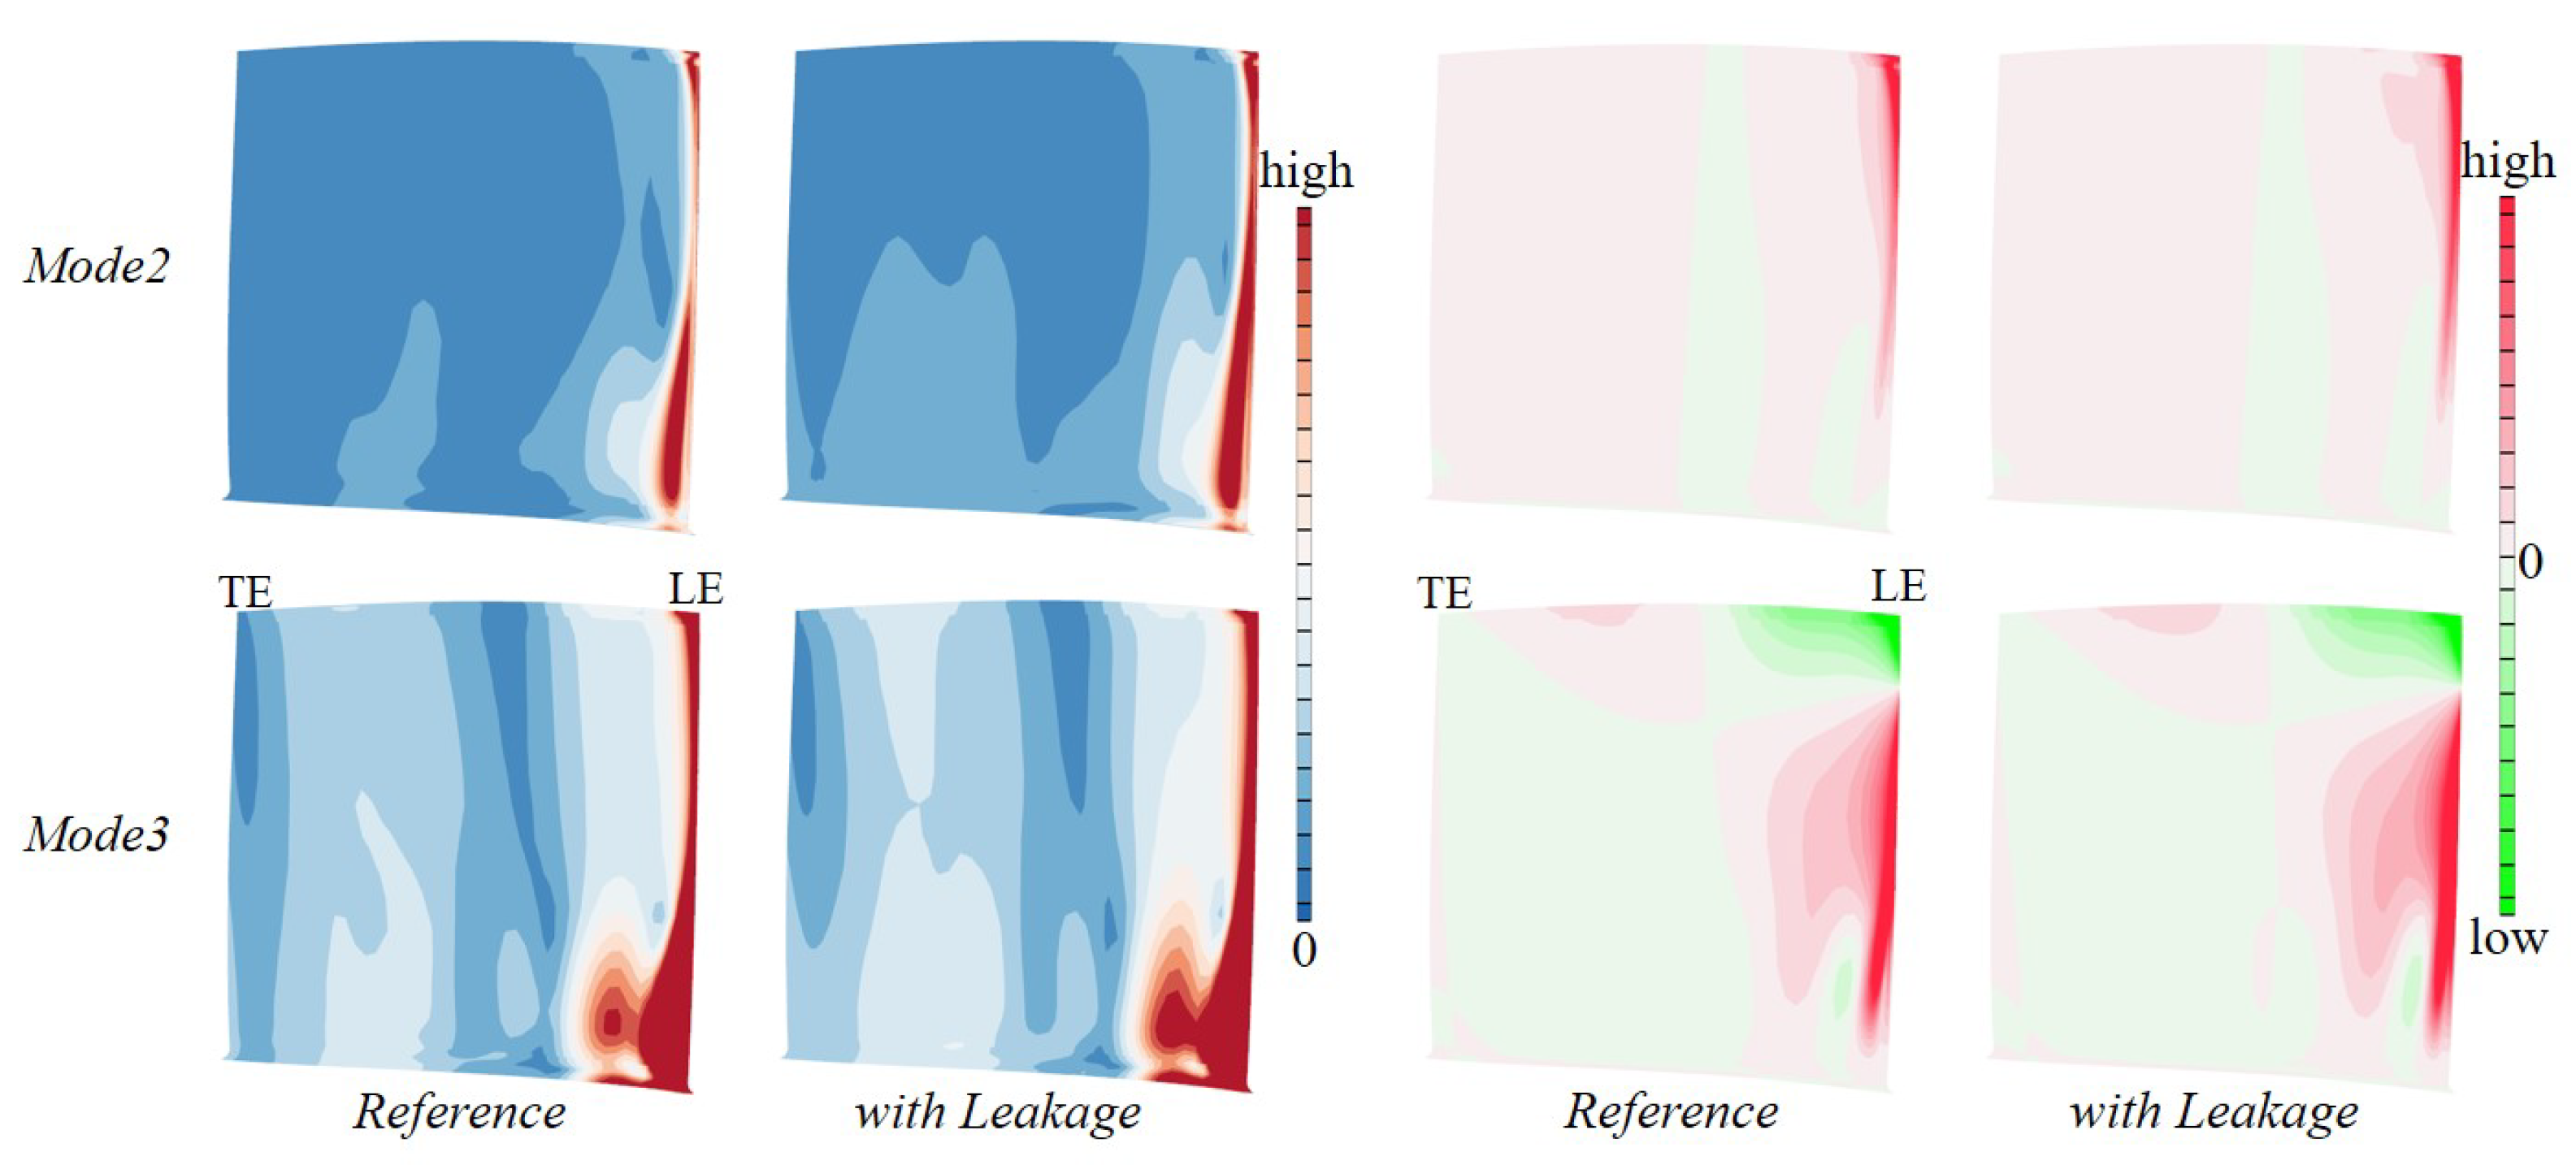
  • The flow from the fan rotor cavity increases the mixing loss in the s-duct ( + 1.3 % ) and redistributes the flow, eventually decreases total-pressure loss of rotor 1 by 4.3 % . This should be taken into account during the design process, because it causes a shift in the operating point. However, the fan leakage flow degrades the aerodynamic performance at off-design, and leads to an increase in vibration amplitude of 19 % for Mode 2 and 26 % for Mode 3. The implementation of an optimized cavity geometry is necessary to minimize the influence of the leakage flow on the core engine flow.
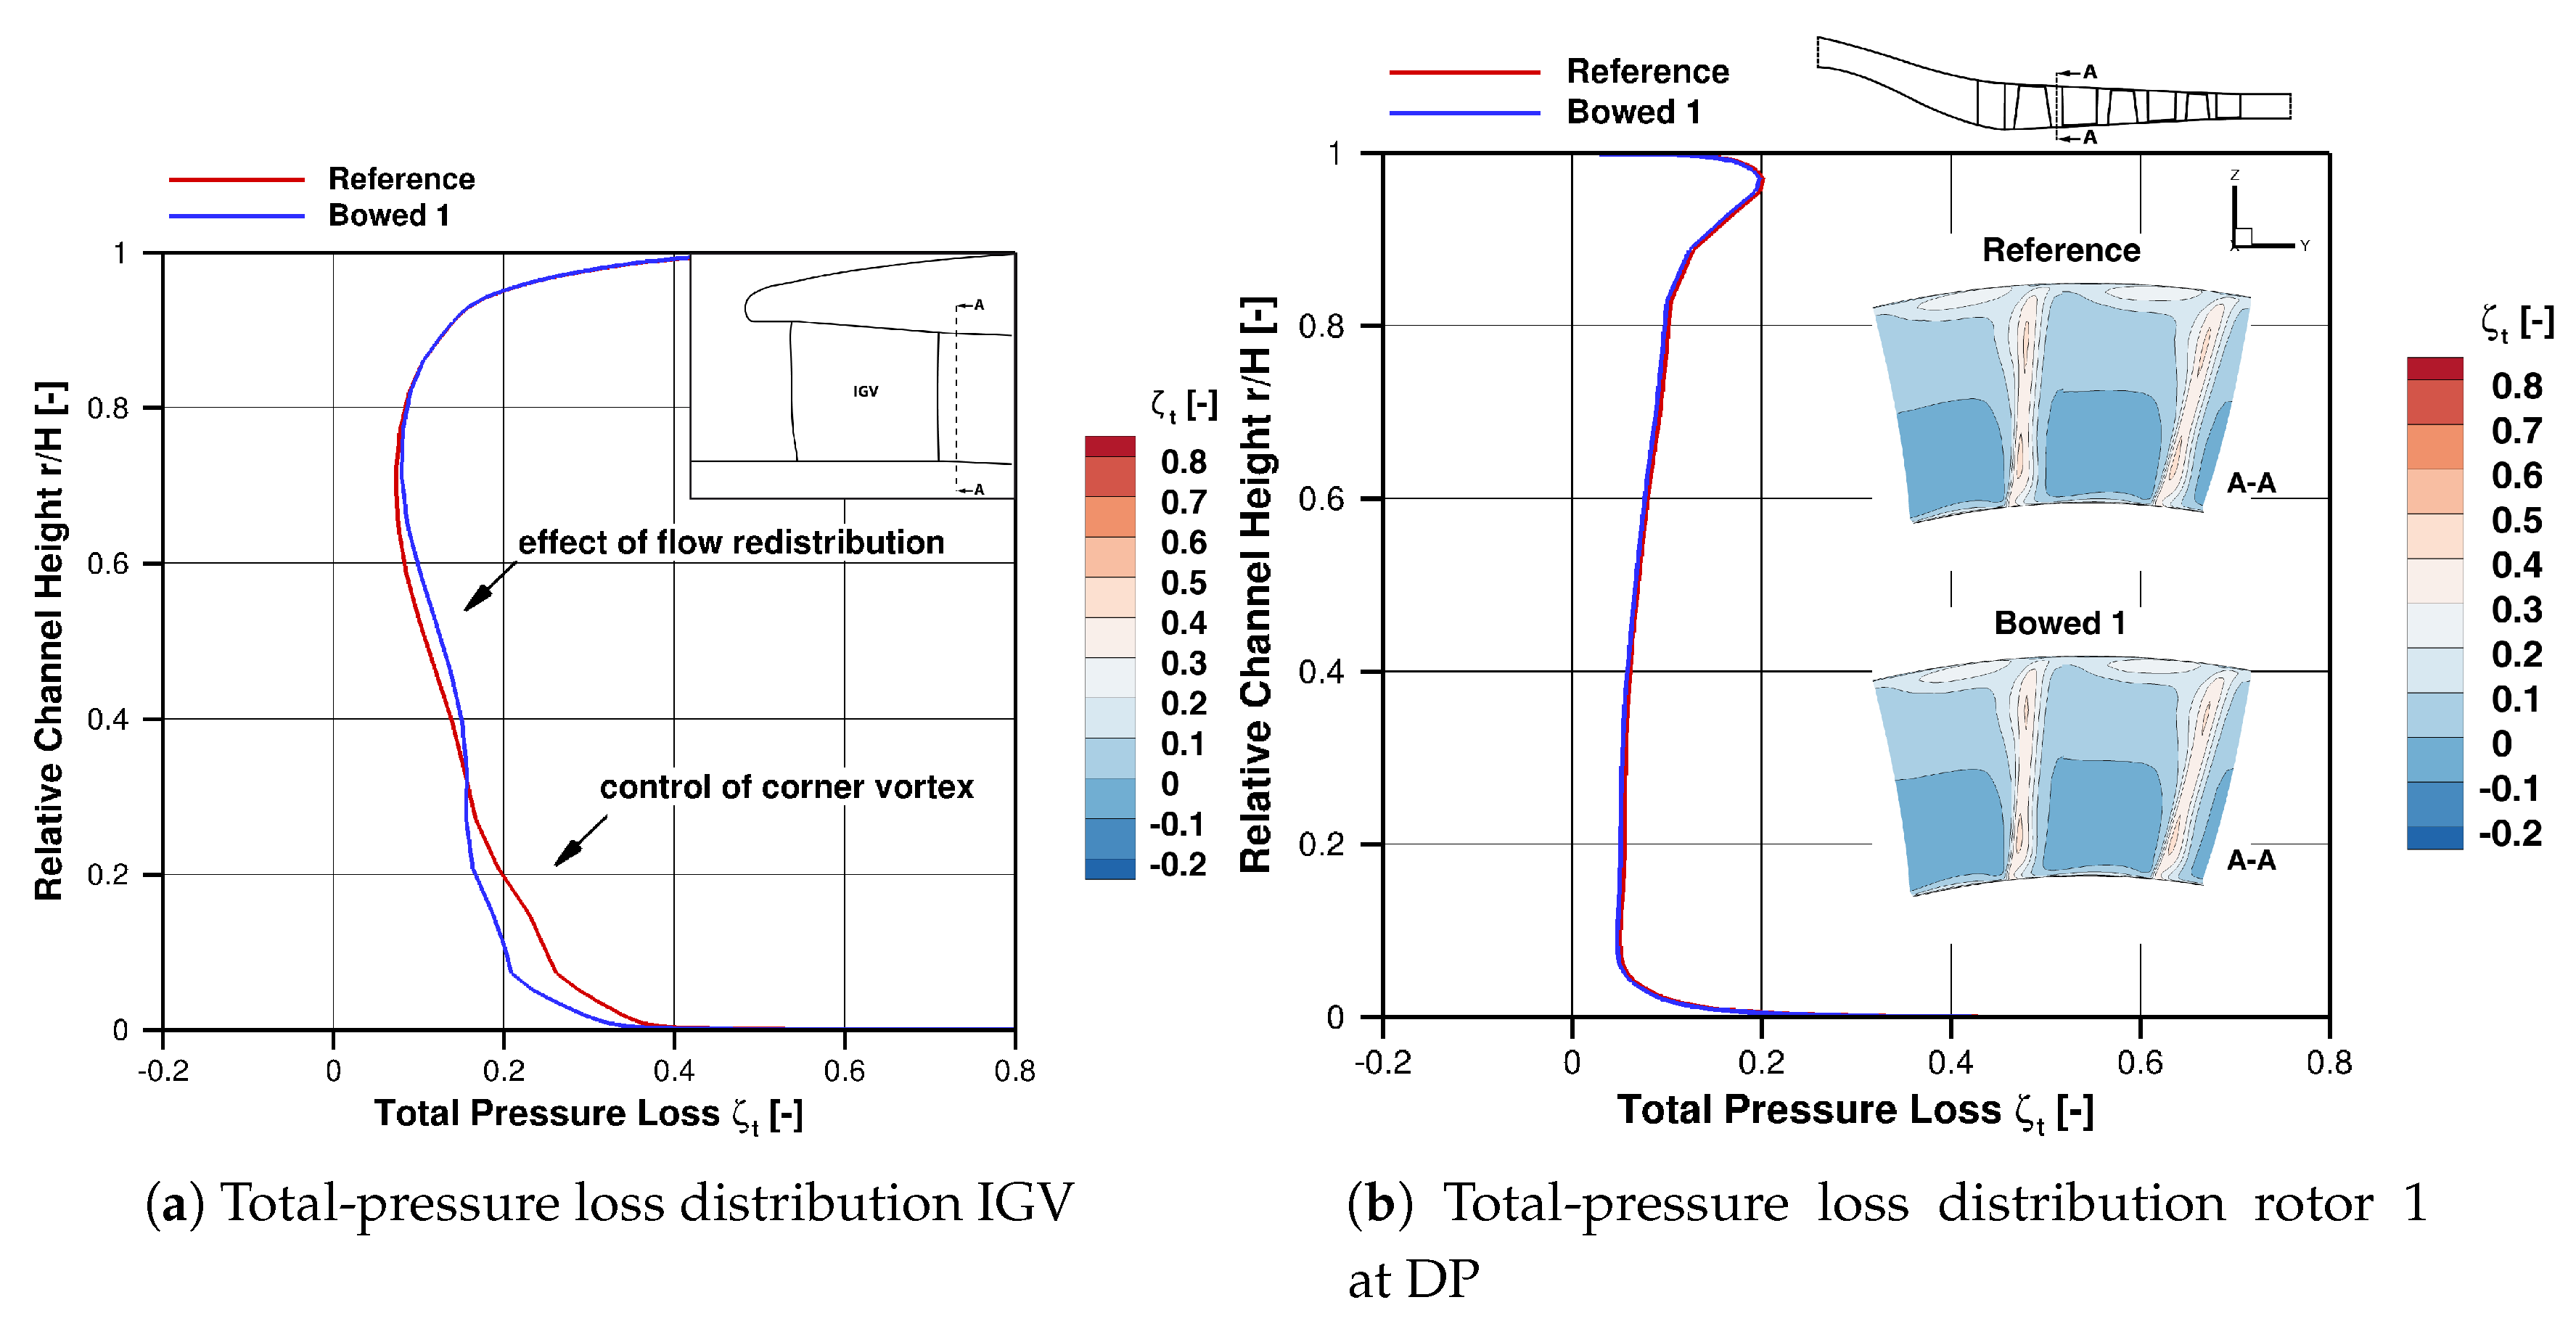
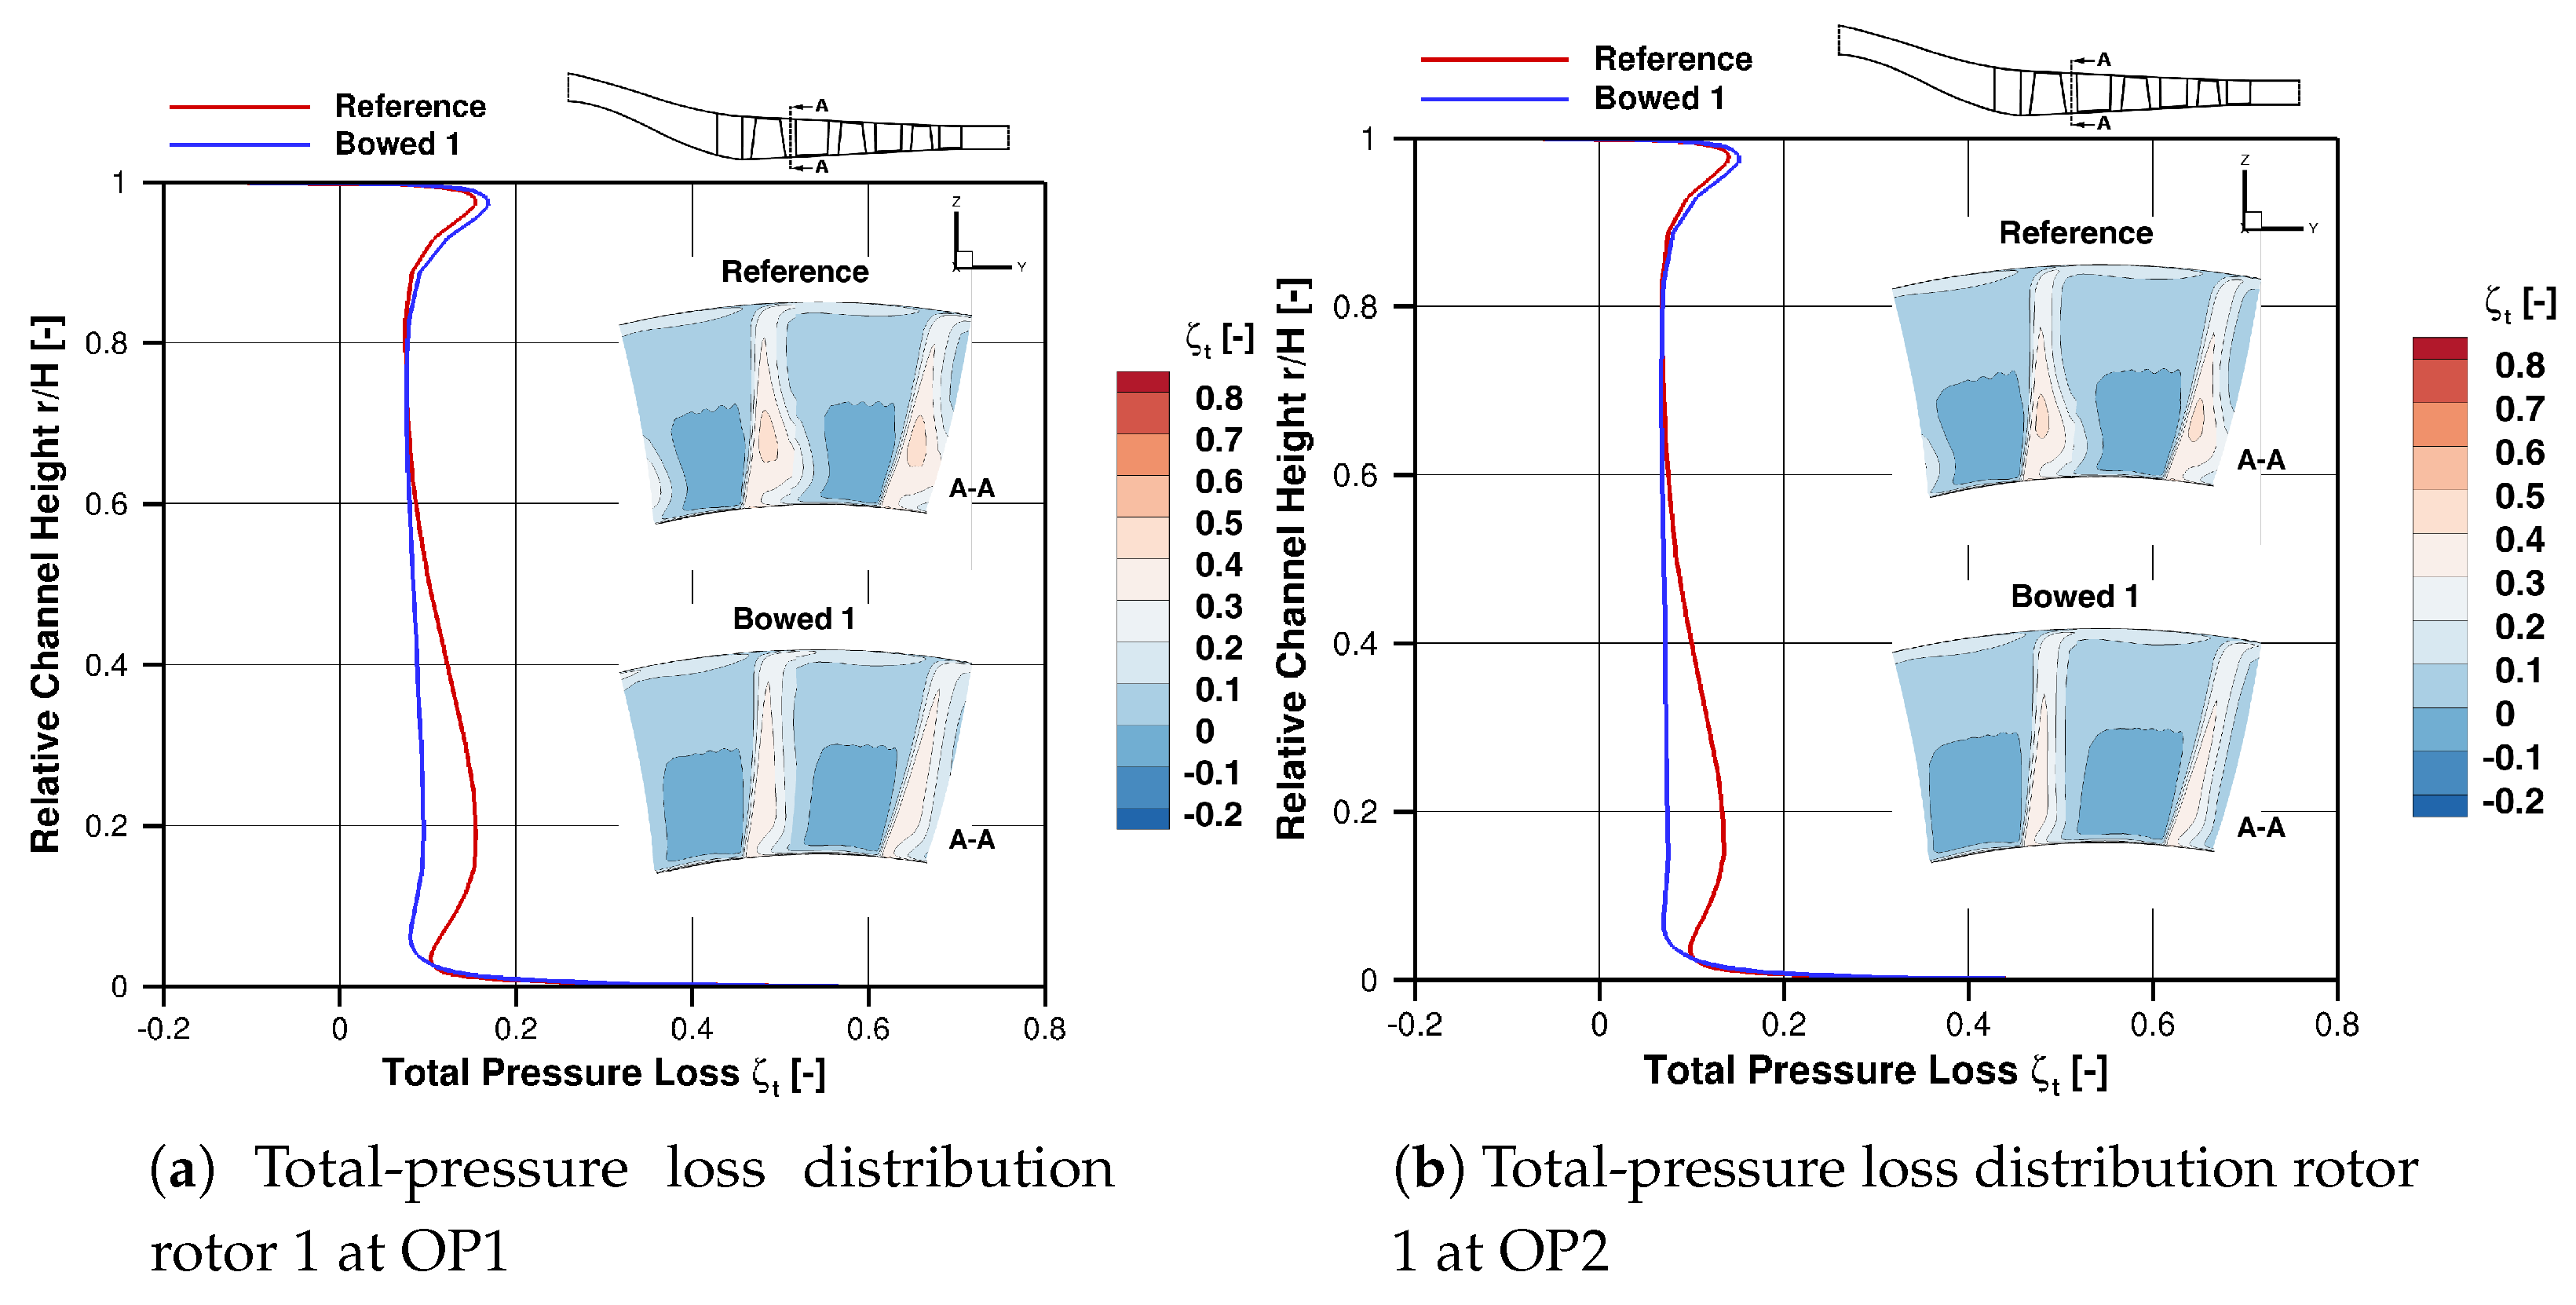
  • The sweep and lean of the IGV downstream of the fan has a negligible effect on the aerodynamic performance of the LPC at the design point but leads to significant improvement of the off-design performance by reducing near hub corner vortices. The total-pressure loss of rotor 1 is reduced by up to 18 % at OP1 compared to the reference case. This achieves a 13 % and 11 % reduction of vibration amplitude for Modes 2 and 3, respectively.
  • Varying the axial gap between blade rows in the LPC within +/− 10 % shows no visible aerodynamic and aeroelastic sensitivity which is promising to reduce the length of the LPC. The vibration amplitude of Mode 3 increases slightly with increasing axial gap because of the bending mode shape. The general correlation should be addressed by further investigations on higher modes.
  • The bypass ratio variation and the fan cavity flow have the greatest importance on forced response within this study since these considerably alter the VIGV wake over the entire span. This also applies to the aerodynamic behavior, as the bypass ratio and the fan cavity leakage directly influence the fan design point. For off-design, the three-dimensional blade design has the greatest impact on the aerodynamic performance.

6. Suggestions of Future Works

The approaches in this paper serve as a first step of the parametric study considering the effects of realistic fan exit flow on the aerodynamic and aeroelastic characteristics of the LPC. Here, further studies are suggested.
  • Whereas RANS simulations have been used for the aerodynamic analysis in the present paper, URANS methods should be applied in the future. The sensitivities might be more accurately evaluated using URANS.
  • For the forced response evaluation, the harmonic balance method could be adapted instead of time-linearized RANS to determine the influence of other harmonics.
  • The range of parameter variations could be extended for a more comprehensive sensitivity study.
  • To adjust for the changing blade loading at higher bypass ratios, the LPC blades should be redesigned.
  • The forced response of higher eigenmodes, especially those expected near the design speed of the LPC, should be investigated in order to further improve the design validation.

Author Contributions

Conceptualization, methodology, formal analysis, T.E. and S.B.; investigation, writing, and visualization, T.E. and H.R.K.; supervision and funding acquisition, J.F. and J.R.S. All authors have read and agreed to the published version of the manuscript.

Funding

This research was funded by the German Reseearch Foundataion (Deutsche Forschungsgemeinschaft, DFG, Projektnummer 290312636).

Acknowledgments

The authors gratefully acknowledge the funding provided by the German Research Foundation (Deutsche Forschungsgemeinschaft, DFG, Projektnummer 290312636), and the German Aerospace Center (Deutsches Zentrum für Luft- und Raumfahrt, DLR) for providing TRACE.

Conflicts of Interest

The authors declare no conflict of interest.

Abbreviations

The following symbols and abbreviations are used in this manuscript:
1inlet
2outlet
A R aspect ratio A = H ¯ / l a x , h u b
C a x axial velocity
Hchannel height
H e f f specific stagnation enthalpy
l a x axial chord length from meridional view
m ˙ mass flow
M a Mach number
pstatic pressure
p t total pressure
rradius
rreference radius
T t total temperature
Ucircumferential velocity
vabsolute velocity
X F R vibration amplitude of forced response
x , y , z coordinate system
Δ r radius offset
α flow angle
β relative flow angle
η p o l y polytropic efficiency
κ isentropic exponent
ρ density
Φ flow coefficient Φ = C a x / U
Ψ work coefficient Ψ = 2 H e f f / U 2
Θ circumferential direction
ζ t total-pressure loss coefficient
BPRbypass ratio
CFDcomputational fluid dynamics
DPdesign point
EOengine order
GCIgrid convergence index
IGVinlet guide vane
LEleading edge
LPClow-pressure compressor
OGVoutlet guide vane
PSpuction side
SSsuction side
TEtrailing edge
TOCtop of climb
UHBRultra-high bypass ratio
VIGVvariable inlet guide vane

References

  1. Horlock, J.H.; Lakshminarayana, B. Secondary Flows: Theory, Experiment, and Application in Turbomachinery Aerodynamics. Annu. Rev. Fluid Mech. 1973, 5, 247–280. [Google Scholar] [CrossRef]
  2. Zamboni, G.; Xu, L. Fan Root Aerodynamics for Large Bypass Gas Turbine Engines: Influence on the Engine Performance and 3D Design. J. Turbomach. 2012, 134, 061017. [Google Scholar] [CrossRef]
  3. Dawes, W.N. Multi-Blade Row Navier-Stokes Simulations of Fan-Bypass Configurations. In Proceedings of the ASME 1991 International Gas Turbine and Aeroengine Congress and Exposition, Orlando, FL, USA, 3–6 June 1991; American Society of Mechanical Engineers: New York, NY, USA, 1991. [Google Scholar] [CrossRef] [Green Version]
  4. Eggers, T.; Friedrichs, J. Effects of Increasing Bypass Ratio of UHBR Fans on Near Hub Flow. J. Glob. Power Propuls. Soc. 2019. [Google Scholar] [CrossRef]
  5. Goyal, R.K.; Dawes, W.N. A Comparison of the Measured and Predicted Flow Field in a Modern Fan-Bypass Configuration. J. Turbomach. 1993, 115, 273. [Google Scholar] [CrossRef]
  6. Wellborn, S.R.; Okiishi, T.H. The Influence of Shrouded Stator Cavity Flows on Multistage Compressor Performance. J. Turbomach. 1999, 121, 486. [Google Scholar] [CrossRef]
  7. Gallimore, S.J.; Bolger, J.J.; Cumpsty, N.A.; Taylor, M.J.; Wright, P.I.; Place, J.M.M. The Use of Sweep and Dihedral in Multistage Axial Flow Compressor Blading—Part I: University Research and Methods Development. J. Turbomach. 2002, 124, 521. [Google Scholar] [CrossRef]
  8. Kaplan, B.; Nicke, E.; Voss, C. Design of a Highly Efficient Low-Noise Fan for Ultra-High Bypass Engines. In Proceedings of the ASME Turbo Expo 2006, Barcelona, Spain, 8–11 May 2006; ASME: New York, NY, USA, 2006; pp. 185–194. [Google Scholar] [CrossRef] [Green Version]
  9. Lewis, R.I.; Hill, J.M. The Influence of Sweep and Dihedral in Turbomachinery Blade Rows. J. Mech. Eng. Sci. 2006, 13, 266–285. [Google Scholar] [CrossRef]
  10. Smith, L.H.; Yeh, H. Sweep and Dihedral Effects in Axial-Flow Turbomachinery. J. Basic Eng. 1963, 85, 401. [Google Scholar] [CrossRef]
  11. Gümmer, V.; Goller, M.; Swoboda, M. Numerical Investigation of End Wall Boundary Layer Removal on Highly Loaded Axial Compressor Blade Rows. J. Turbomach. 2008, 130, 011015. [Google Scholar] [CrossRef]
  12. Place, J.M.M. Three-Dimensional flow in Core Compressors. Ph.D. Thesis, University of Cambridge, Cambridge, UK, 1997. [Google Scholar]
  13. Friedrichs, J.; Baumgarten, S.; Kosyna, G.; Stark, U. Effect of Stator Design on Stator Boundary Layer Flow in a Highly Loaded Single-Stage Axial-Flow Low-Speed Compressor. J. Turbomach. 2001, 123, 483. [Google Scholar] [CrossRef]
  14. van Zante, D.E.; Adamczyk, J.J.; Strazisar, A.J.; Okiishi, T.H. Wake Recovery Performance Benefit in a High-Speed Axial Compressor. J. Turbomach. 2002, 124, 275. [Google Scholar] [CrossRef]
  15. Wo, A.M.; Chung, M.H.; Chang, S.J.; Lee, S.F. Wake Vorticity Decay and Blade Response in an Axial Compressor With Varying Axial Gap. In Proceedings of the ASME 1999 International Gas Turbine and Aeroengine Congress and Exhibition, Indianapolis, IN, USA, 7–10 June 1999; American Society of Mechanical Engineers: New York, NY, USA, 1999. [Google Scholar] [CrossRef] [Green Version]
  16. Smith, L.H. Wake Dispersion in Turbomachines. J. Basic Eng. 1966, 88, 688. [Google Scholar] [CrossRef]
  17. Hah, C. Impact of Wake Dispersion on Axial Compressor Performance. In Proceedings of the ASME Turbo Expo: Turbine Technical Conference and Exposition—2017, Charlotte, NC, USA, 26–30 June 2017; The American Society of Mechanical Engineers: New York, NY, USA, 2017. [Google Scholar] [CrossRef]
  18. Przytarski, P.J.; Wheeler, A.P.S. The Effect of Rotor-Stator Gap on Repeating-Stage Compressor Loss. In Proceedings of the ASME Turbo Expo 2019: Turbomachinery Technical Conference and Exposition, Phoenix, AZ, USA, 17–21 June 2019. [Google Scholar]
  19. Gorrell, S.E.; Okiishi, T.H.; Copenhaver, W.W. Stator-Rotor Interactions in a Transonic Compressor— Part 1: Effect of Blade-Row Spacing on Performance. J. Turbomach. 2003, 125, 328. [Google Scholar] [CrossRef]
  20. Gorrell, S.E.; Okiishi, T.H.; Copenhaver, W.W. Stator-Rotor Interactions in a Transonic Compressor—Part 2: Description of a Loss-Producing Mechanism. J. Turbomach. 2003, 125, 336. [Google Scholar] [CrossRef]
  21. Zachcial, A.; Nürnberger, D. A Numerical Study on the Influence of Vane-Blade Spacing on a Compressor Stage at Sub- and Transonic Operating Conditions. In Proceedings of the ASME Turbo Expo 2003, Atlanta, GA, USA, 16–19 June 2003; American Society of Mechanical Engineers: New York, NY, USA, 2003; pp. 807–818. [Google Scholar] [CrossRef]
  22. Kielb, R.; Chiang, H.W. Recent advancements in turbomachinery forced response analyses. In Proceedings of the 30th Aerospace Sciences Meeting and Exhibit, Reno, NV, USA, 6–9 January 1992; American Institute of Aeronautics and Astronautics: Reston, VA, USA, 1992. [Google Scholar] [CrossRef]
  23. Aschenbruck, J.; Seume, J.R. Experimentally Verified Study of Regeneration-Induced Forced Response in Axial Turbines. J. Turbomach. 2015, 137, 031006. [Google Scholar] [CrossRef]
  24. Bittner, S.L.; Keller, C.; Meinzer, C.E.; Seume, J.R. Experimental Validation of a Forced Response Analysis Using a Time-Linearized Method. In Proceedings of the 2018 AIAA/ASCE/AHS/ASC Structures Structural Dynamics and Materials Conference, Kissimmee, FL, USA, 8–12 January 2018; American Institute of Aeronautics and Astronautics: Reston, FL, USA, 2018. [Google Scholar] [CrossRef]
  25. Jöcker, M.; Fransson, T.H. Mode Shape Sensitivity of the High Pressure Turbine Rotor Excitation Due to Upstream Stators. In Proceedings of the Turbo Expo 2002, Volume 4: Parts A and B, Amsterdam, The Netherlands, 3–6 June 2002; pp. 1047–1056. [Google Scholar] [CrossRef]
  26. May, M. Sensitivity Analysis With Respect to Flutter-Free Design of Compressor Blades. In Proceedings of the ASME Turbo Expo 2010, Volume 6: Structures and Dynamics, Parts A and B, Glasgow, UK, 14–18 June 2010; pp. 1263–1275. [Google Scholar] [CrossRef]
  27. Chen, T.; Rogerson, J.; Patel, K. Effects of Both Axial Gap and Blade Count Ratio on the Forced Response of a Steam Turbine Stage. In Proceedings of the Volume 5B: Oil and Gas Applications; Steam Turbines, San Antonio, TX, USA, 3–7 June 2013; American Society of Mechanical Engineers: New York, NY, USA, 2013. [Google Scholar] [CrossRef]
  28. Korakianitis, T. On the Prediction of Unsteady Forces on Gas Turbine Blades: Part 2—Analysis of the Results. J. Turbomach. 1992, 114, 123–131. [Google Scholar] [CrossRef]
  29. Marn, A.; Schönleitner, F.; Mayr, M.; Selic, T.; Heitmeir, F. On the Effect of Axial Spacing Between Rotor and Stator Onto the Blade Vibrations of a Low Pressure Turbine Stage at Engine Relevant Operating Conditions. In Proceedings of the Volume 7B: Structures and Dynamics, Seoul, Korea, 13–17 June 2016; American Society of Mechanical Engineers: New York, NY, USA, 2016. [Google Scholar] [CrossRef]
  30. Giesecke, D.; Friedrichs, J.; Stark, U. Preliminary Aerodynamic Design of a Fan Stage for an Ultra High Bypass Ratio Engine. In Proceedings of the 23rd ISABE Conference, Manchester, UK, 3–8 September 2017. [Google Scholar]
  31. Schlichting, H.; Truckenbrodt, E. Aerodynamik des Flugzeuges: Erster Band: Grundlagen aus der Strömungstechnik Aerodynamik des Tragflügels (Teil I), 3rd ed.; Springer eBook Collection; Springer: Berlin/Heidelberg, Germany, 2001. [Google Scholar] [CrossRef]
  32. Wennerstrom, A.J. On the Treatment of Body Forces in the Radial Equilibrium Equation of Turbomachinery; USAF Aerospace Research Laboratories: Dayton, OH, USA, 1975; pp. 352–368. [Google Scholar]
  33. Denton, J.D.; Xu, L. The Effects of Lean and Sweep on Transonic Fan Performance. In Proceedings of the ASME Turbo Expo 2002, Amsterdam, The Netherlands, 3–6 June 2002; American Society of Mechanical Engineers: New York, NY, USA, 2002; pp. 23–32. [Google Scholar] [CrossRef] [Green Version]
  34. Giesecke, D.; Lehmler, M.; Friedrichs, J.; Blinstrub, J.; Bertsch, L.; Heinze, W. Evaluation of ultra-high bypass ratio engines for an over-wing aircraft configuration. J. Glob. Power Propuls. Soc. 2018, 2, 8SHP7K. [Google Scholar] [CrossRef]
  35. Celik, I.B.; Ghia, U.; Roache, P.J.; Freitas, C.J.; Coleman, H.; Raad, P.E. Procedure for Estimation and Reporting of Uncertainty Due to Discretization in CFD Applications. J. Fluids Eng. 2008, 130, 078001. [Google Scholar] [CrossRef] [Green Version]
  36. Nürnberger, D.; Eulitz, F.; Schmitt, S.; Zachcial, A. Recent Progress in the Numerical Simulation of Unsteady Viscous Multistage Turbomachinery Flow ISABE 2001–1081. In Proceedings of the 15th International Symposium on Air Breathing Engines, Bangalore, India, 3–7 September 2001. [Google Scholar]
  37. Schönweitz, D.; Becker, R.; Ebel, P.B.; Schnell, R.; Schroll, M. Aerodynamic Performance Characteristics of the Installed V2527 Fan at Ground Operation. In Proceedings of the 54th AIAA Aerospace Sciences Meeting 2016, San Diego, CA, USA, 4–8 January 2016; Curran Associates Inc.: Red Hook, NY, USA, 2016. [Google Scholar] [CrossRef]
  38. Wilcox, D.C. Reassessment of the scale-determining equation for advanced turbulence models. AIAA J. 1988, 26, 1299–1310. [Google Scholar] [CrossRef]
  39. Hall, K.; Thomas, J.; Ekici, K.; Voytovich, D. Frequency Domain Techniques for Complex and Nonlinear Flows in Turbomachinery. In Proceedings of the 3rd AIAA Fluid Dynamics Conference and Exhibit, Orlando, FL, USA, 23–26 June 2003. [Google Scholar] [CrossRef]
  40. Kersken, H.P.; Frey, C.; Voigt, C.; Ashcroft, G. Time-Linearized and Time-Accurate 3D RANS Methods for Aeroelastic Analysis in Turbomachinery. J. Turbomach. 2012, 134. [Google Scholar] [CrossRef]
  41. Blocher, M.; Gómez Fernández, I.E. Time-Linearized Forced Response Analysis of a Counter Rotating Fan: Part I—Theoretical Concept of a Fully Time-Linear Forced Response Analysis. In Proceedings of the Volume 7B: Structures and Dynamics, Düsseldorf, Germany, 16–20 June 2014; American Society of Mechanical Engineers: New York, NY, USA, 2014. [Google Scholar] [CrossRef]
  42. Schoenenborn, H.; Ashcroft, G. Comparison of Non-Linear and Linearized CFD Analysis of the Stator-Rotor Interaction of a Compressor Stage. In Proceedings of the Volume 7B: Structures and Dynamics, Düsseldorf, Germany, 16–20 June 2014; American Society of Mechanical Engineers: New York, NY, USA, 2014. [Google Scholar] [CrossRef]
  43. Walker, A.D.; Mariah, I.; Tsakmakidou, D.; Vadhvana, H.; Hal, C. The influence of fan root flow on the aerodynamics of a low-pressure compressor transition duct. In Proceedings of the ASME Turbo Expo 2019: Turbomachinery Technical Conference and Exposition, Volume 2B: Turbomachinery, Phoenix, AZ, USA, 17–21 June 2019. [Google Scholar]
  44. Gümmer, V.; Wenger, U.; Kau, H.P. Using Sweep and Dihedral to Control Three-Dimensional Flow in Transonic Stators of Axial Compressors. J. Turbomach. 2001, 123, 40–48. [Google Scholar] [CrossRef]
  45. Wadia, A.R.; Szucs, P.N.; Gundy-Burlet, K.L. Design and Testing of Swept and Leaned Outlet Guide Vanes to Reduce Stator-Strut-Splitter Aerodynamic Flow Interactions (98-GT-70). J. Turbomach. 1999, 121, 416–427. [Google Scholar] [CrossRef]
Figure 1. Reference configurations in the meridional view.
Ijtpp 05 00026 g001
Figure 2. Low-pressure compressor (LPC) for three different BPRs (17, 20, 25).
Ijtpp 05 00026 g002
Figure 3. Sweep and lean of the inlet guide vane (IGV).
Ijtpp 05 00026 g003
Figure 4. LPC with different axial gap sizes.
Ijtpp 05 00026 g004
Figure 5. Mesh LPC configuration.
Ijtpp 05 00026 g005
Figure 6. Forced response toolchain [24].
Ijtpp 05 00026 g006
Figure 7. Campbell diagram of rotor 1 with eigenmodes—Modes 2 and 3.
Ijtpp 05 00026 g007
Figure 8. Distribution of unsteady pressure amplitude, eigenmode, and forcing work per area.
Ijtpp 05 00026 g008
Figure 9. Effect of bypass variations on rotor 1 at design point (DP).
Ijtpp 05 00026 g009
Figure 10. Unsteady pressure amplitude on the suction side with different bypass ratios.
Ijtpp 05 00026 g010
Figure 11. Effect of leakage mass flow on the IGV.
Ijtpp 05 00026 g011
Figure 12. Effect of fan rotor cavity flows.
Ijtpp 05 00026 g012
Figure 13. Effect of fan rotor cavity flows on rotor 1 at off-design.
Ijtpp 05 00026 g013
Figure 14. Distribution of the unsteady pressure and the forcing work on the suction side, comparison between the reference and the leakage case.
Ijtpp 05 00026 g014
Figure 15. Effect of sweep and lean.
Ijtpp 05 00026 g015
Figure 16. Effect of sweep and lean on rotor 1 at off-design.
Ijtpp 05 00026 g016
Figure 17. Distribution of pressure and work on the suction side. Comparison between the reference and the 3D blading of IGV.
Ijtpp 05 00026 g017
Figure 18. Effect of axial blade distance.
Ijtpp 05 00026 g018
Figure 19. Distribution of the unsteady pressure in relative chord length with different axial gap variation.
Ijtpp 05 00026 g019
Table 1. IGV designs.
DesignSweep Angle [ ]Lean Angle [ ]
HubTipHubTip
Reference0000
Bowed 130101010
Bowed 230101515
Bowed 330102020
Bowed 440151515
Bowed 550201515
Table 2. Comparison of forced response amplitude with modal force and aero damping.
Mode 2Modal Force [N]Aero Damping [N/m] X FR [m]Relative X FR
Bypass ratio 17 0.1088 803 1.354 × 10 4 1
Bypass ratio 20 0.1359 1061 1.281 × 10 4 0.95
Bypass ratio 25 0.1941 1907 1.018 × 10 4 0.75
Mode 3Modal Force [N]Aero Damping [N/m] X FR [m]Relative X F
Bypass ratio 17 0.1335 2041 6.629 × 10 5 1
Bypass ratio 20 0.1331 2816 4.727 × 10 5 0.71
Bypass ratio 25 0.4775 2583 1.849 × 10 4 2.83

