
Experimental Investigation of Centrifugal Flow in Rotor–Stator Cavities at High Reynolds Numbers >108 †


Abstract
:1. Introduction
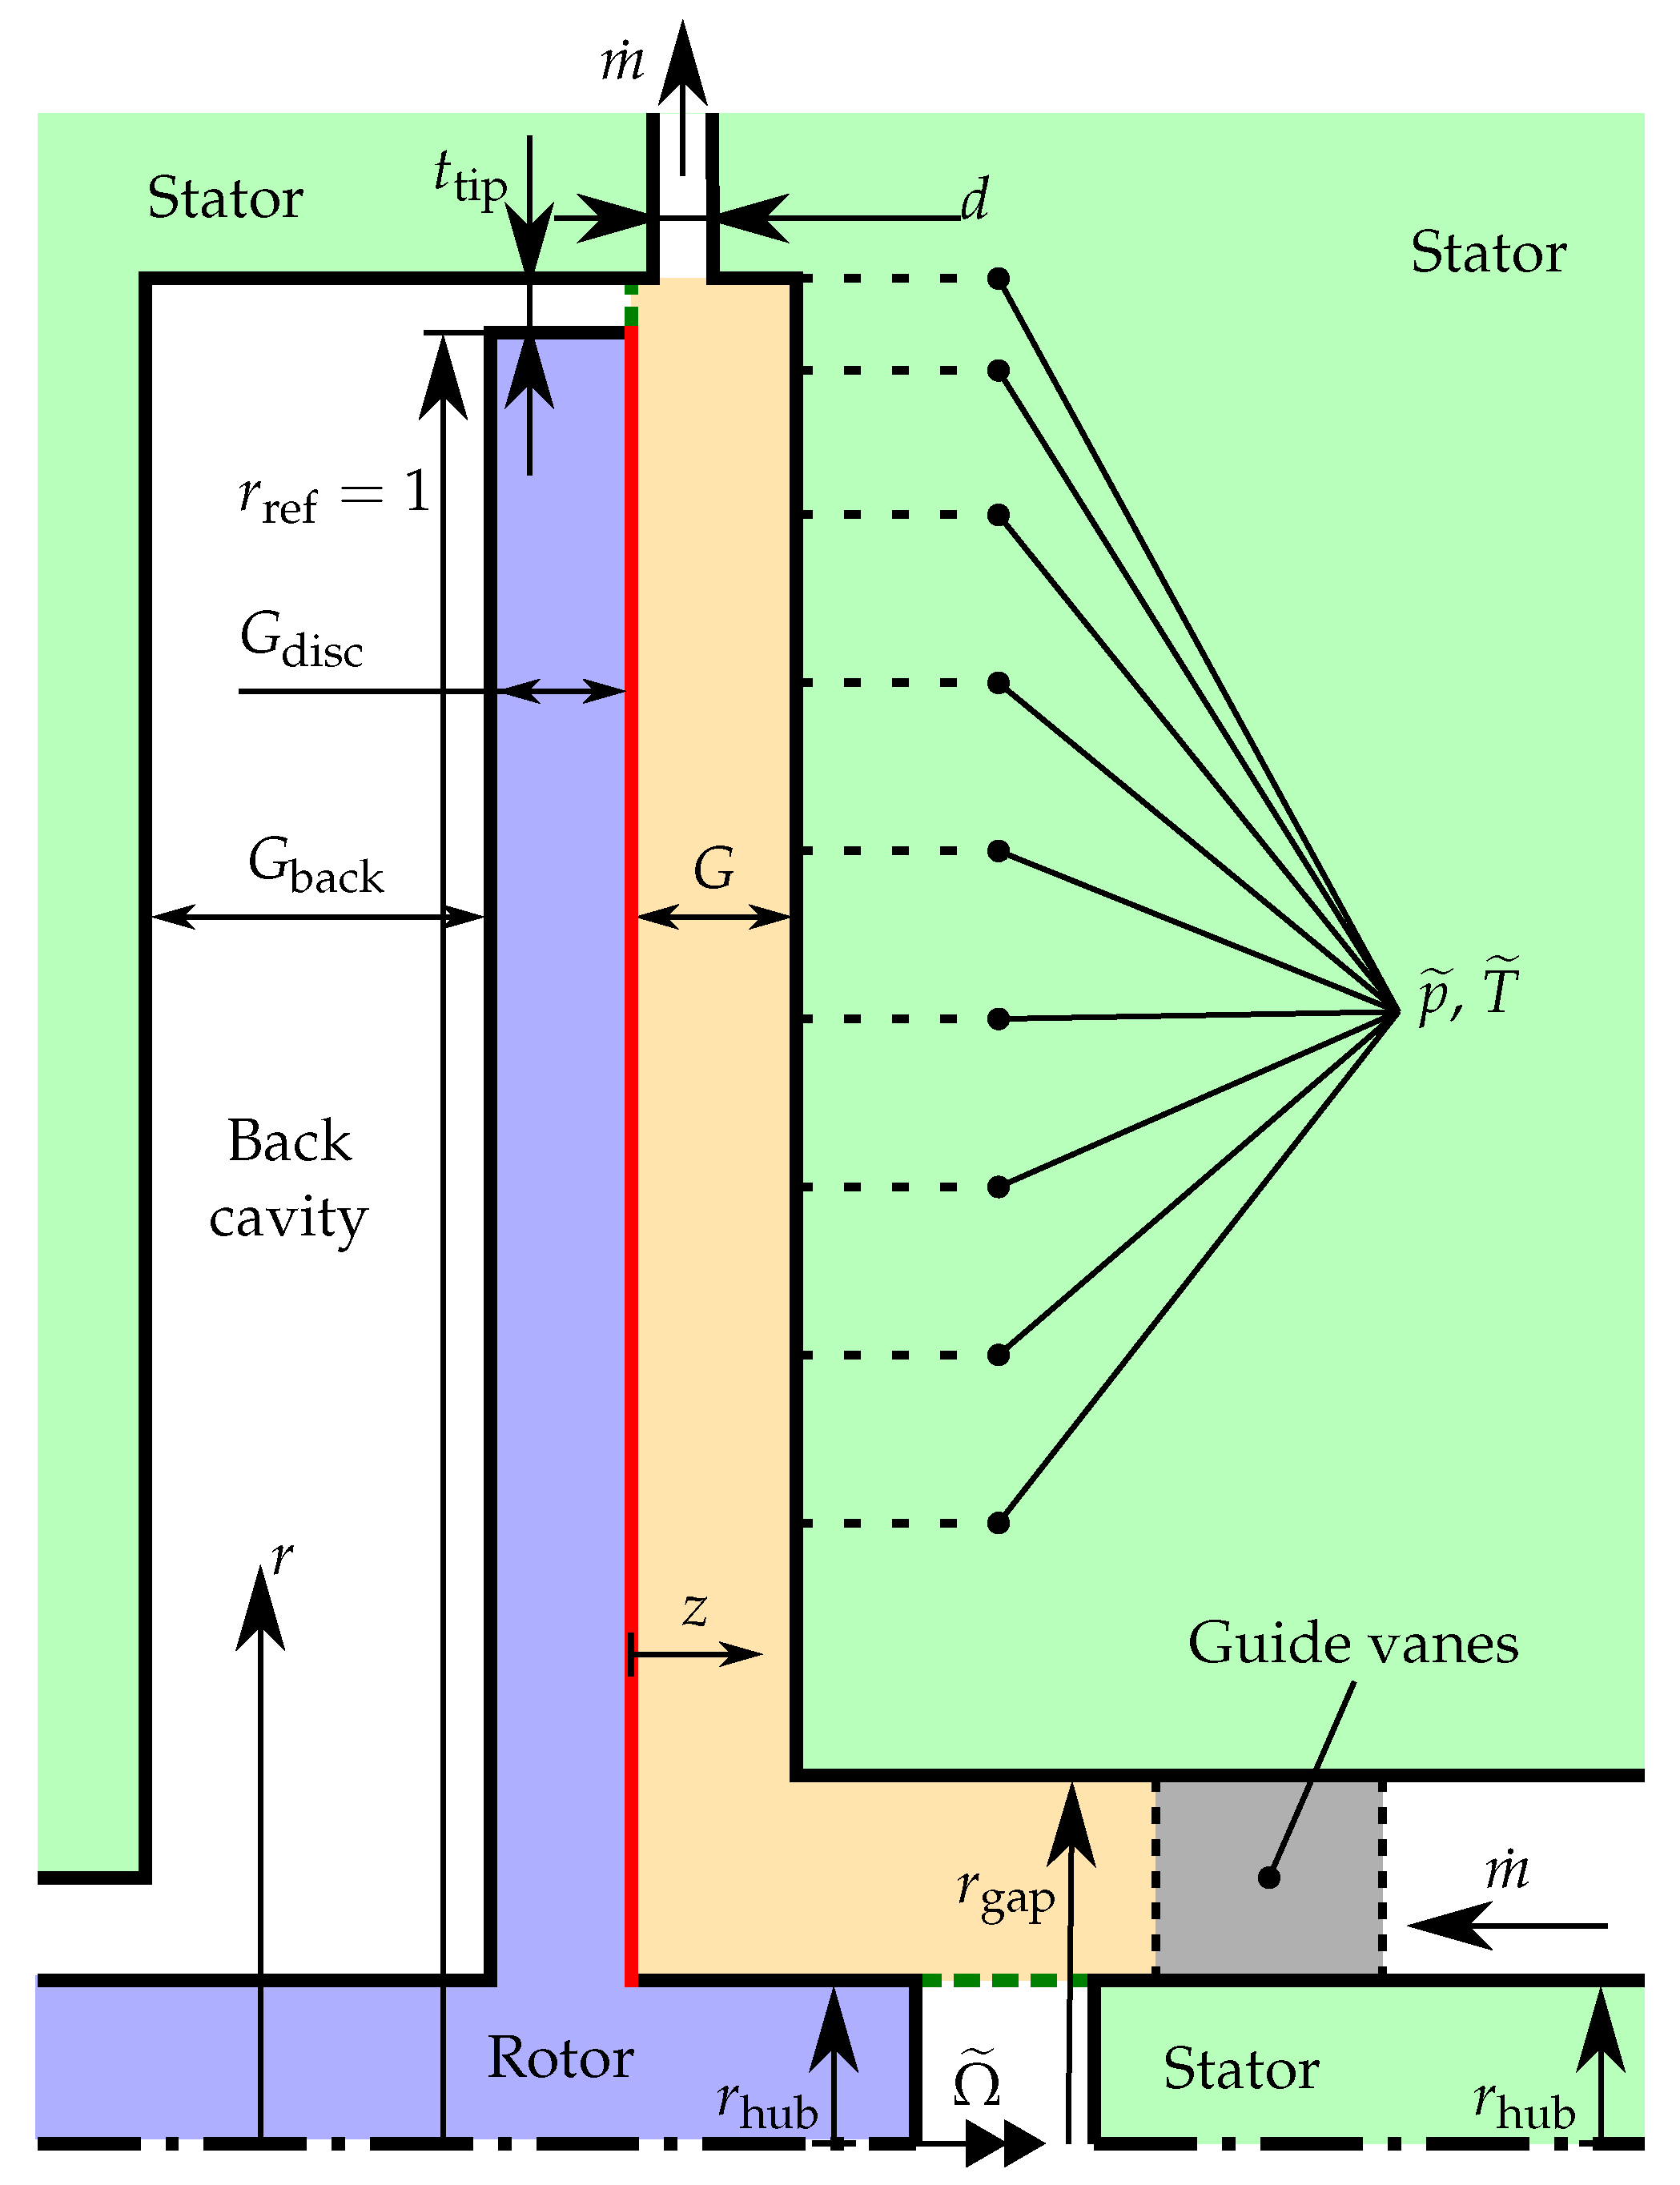
2. Test Rig
3. CFD Setup
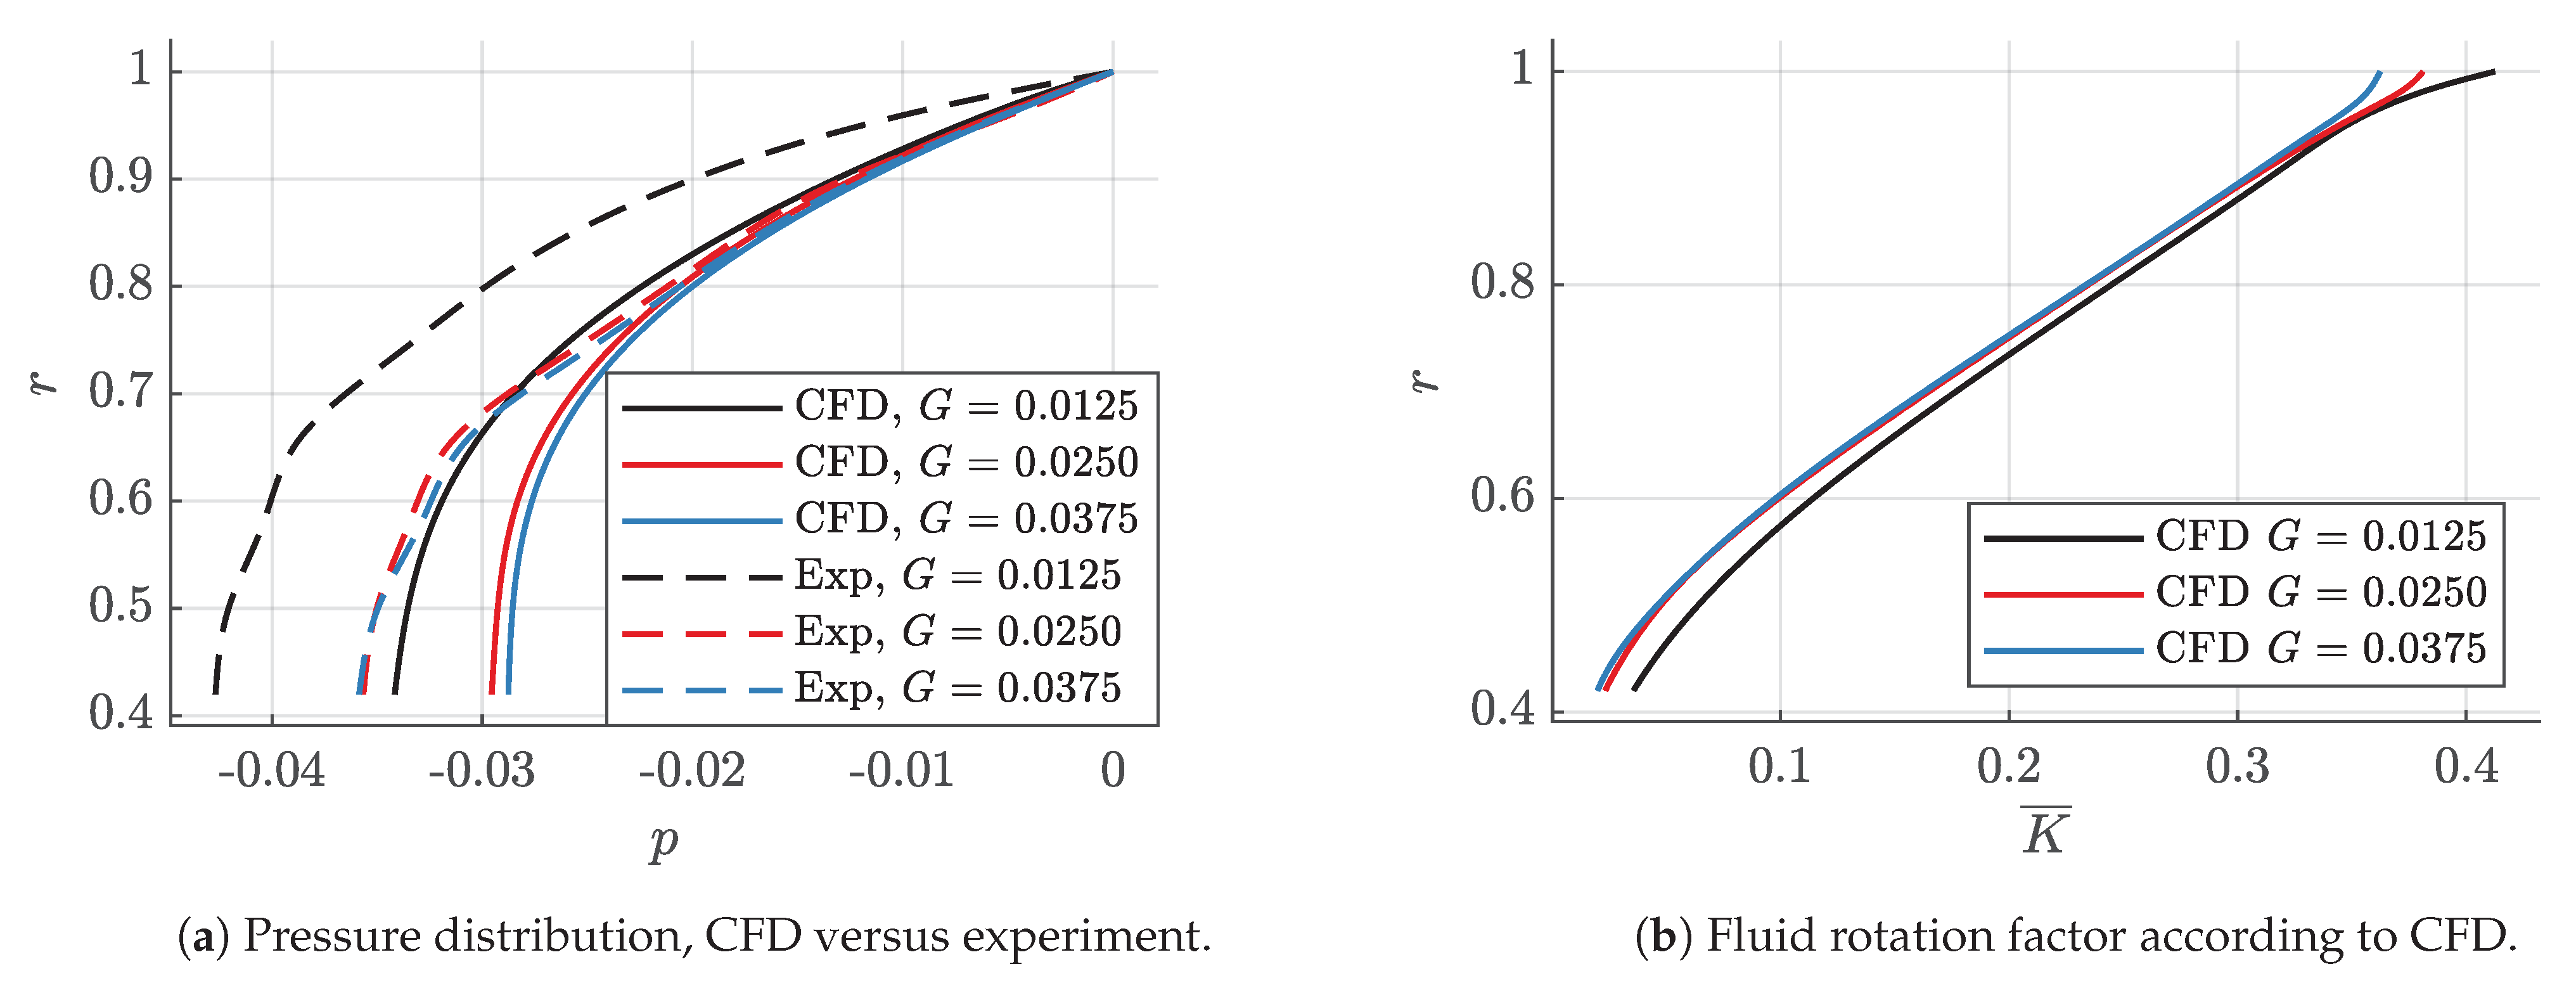
4. Fluid Rotation Factor
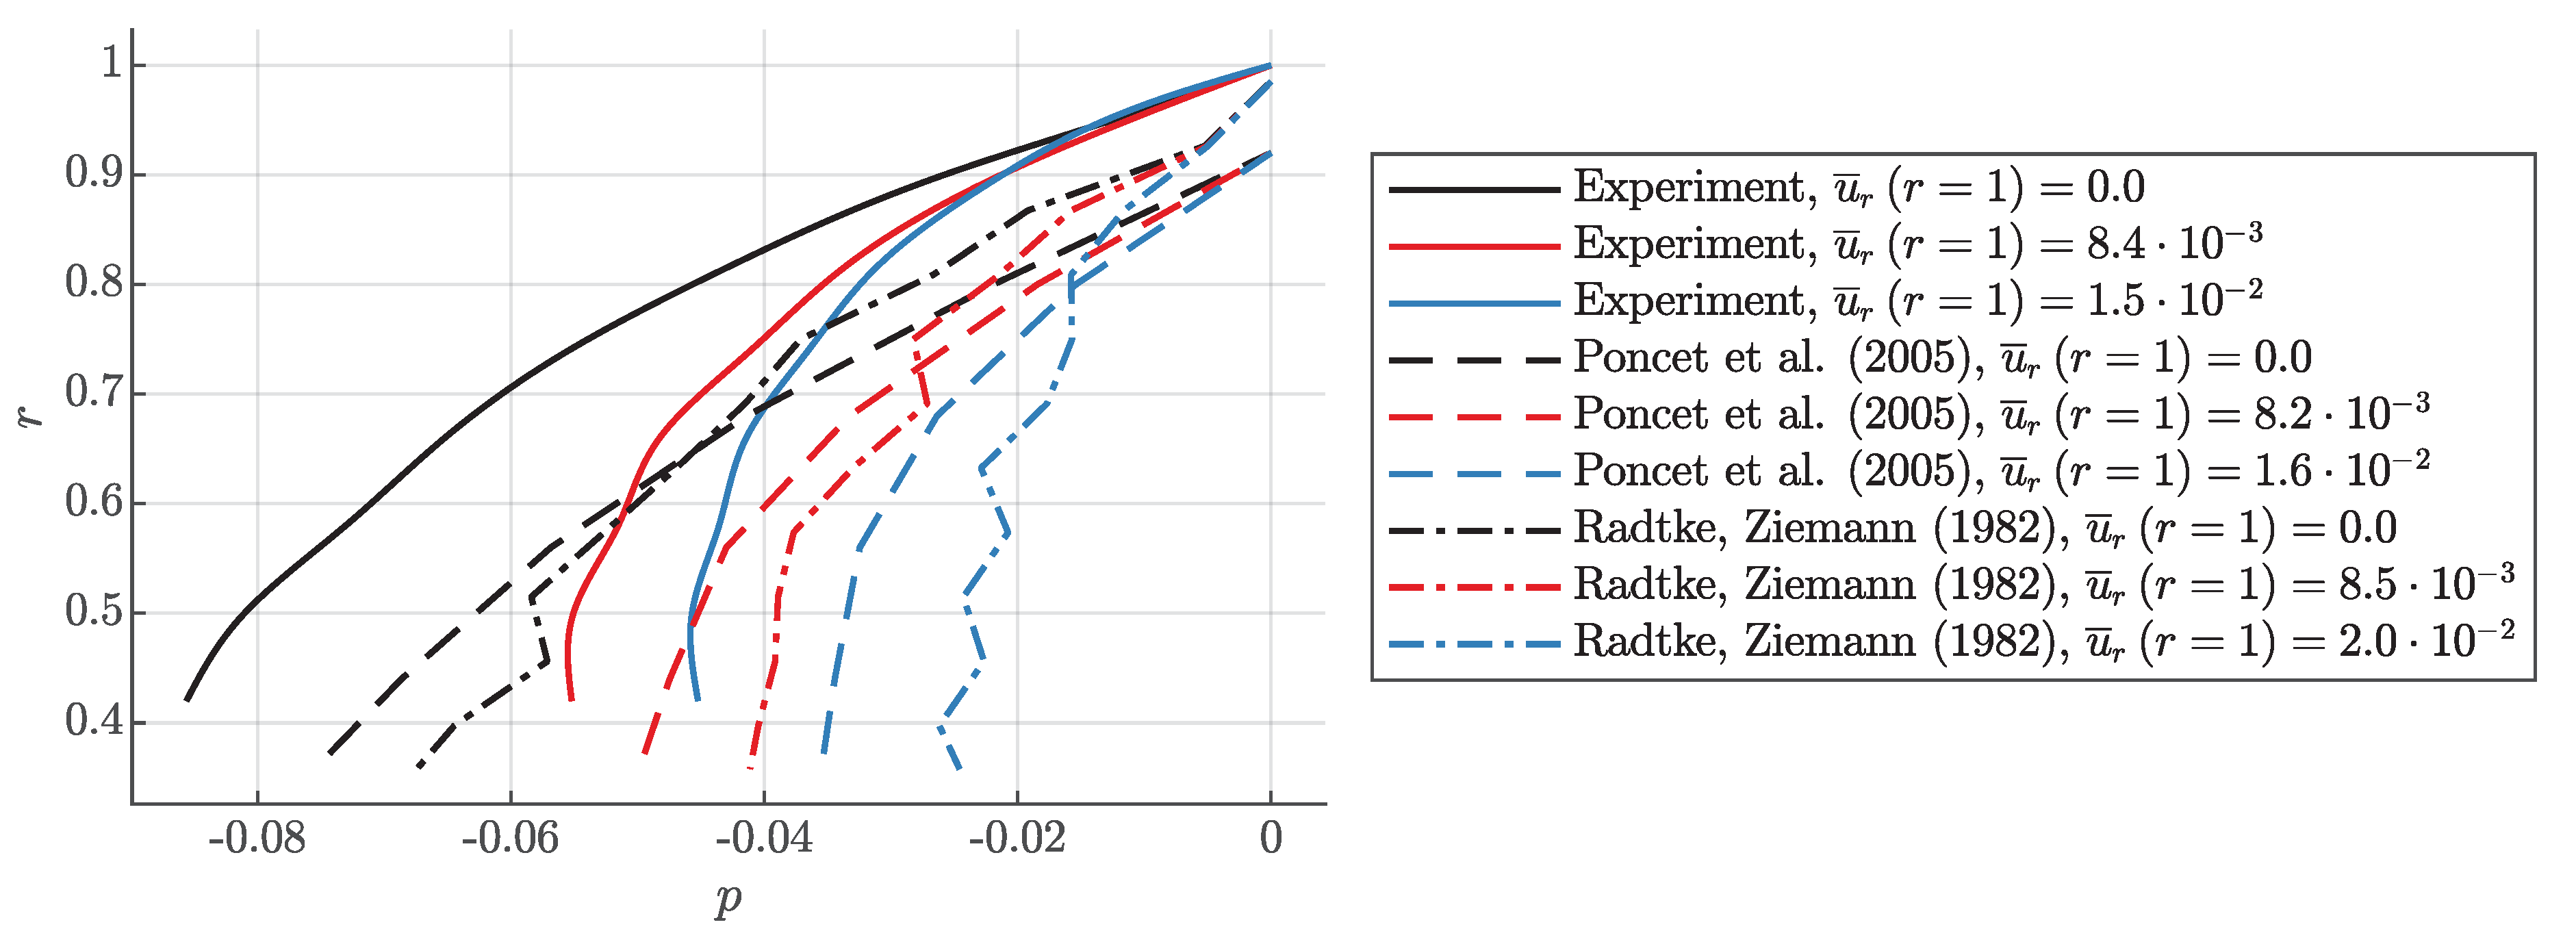
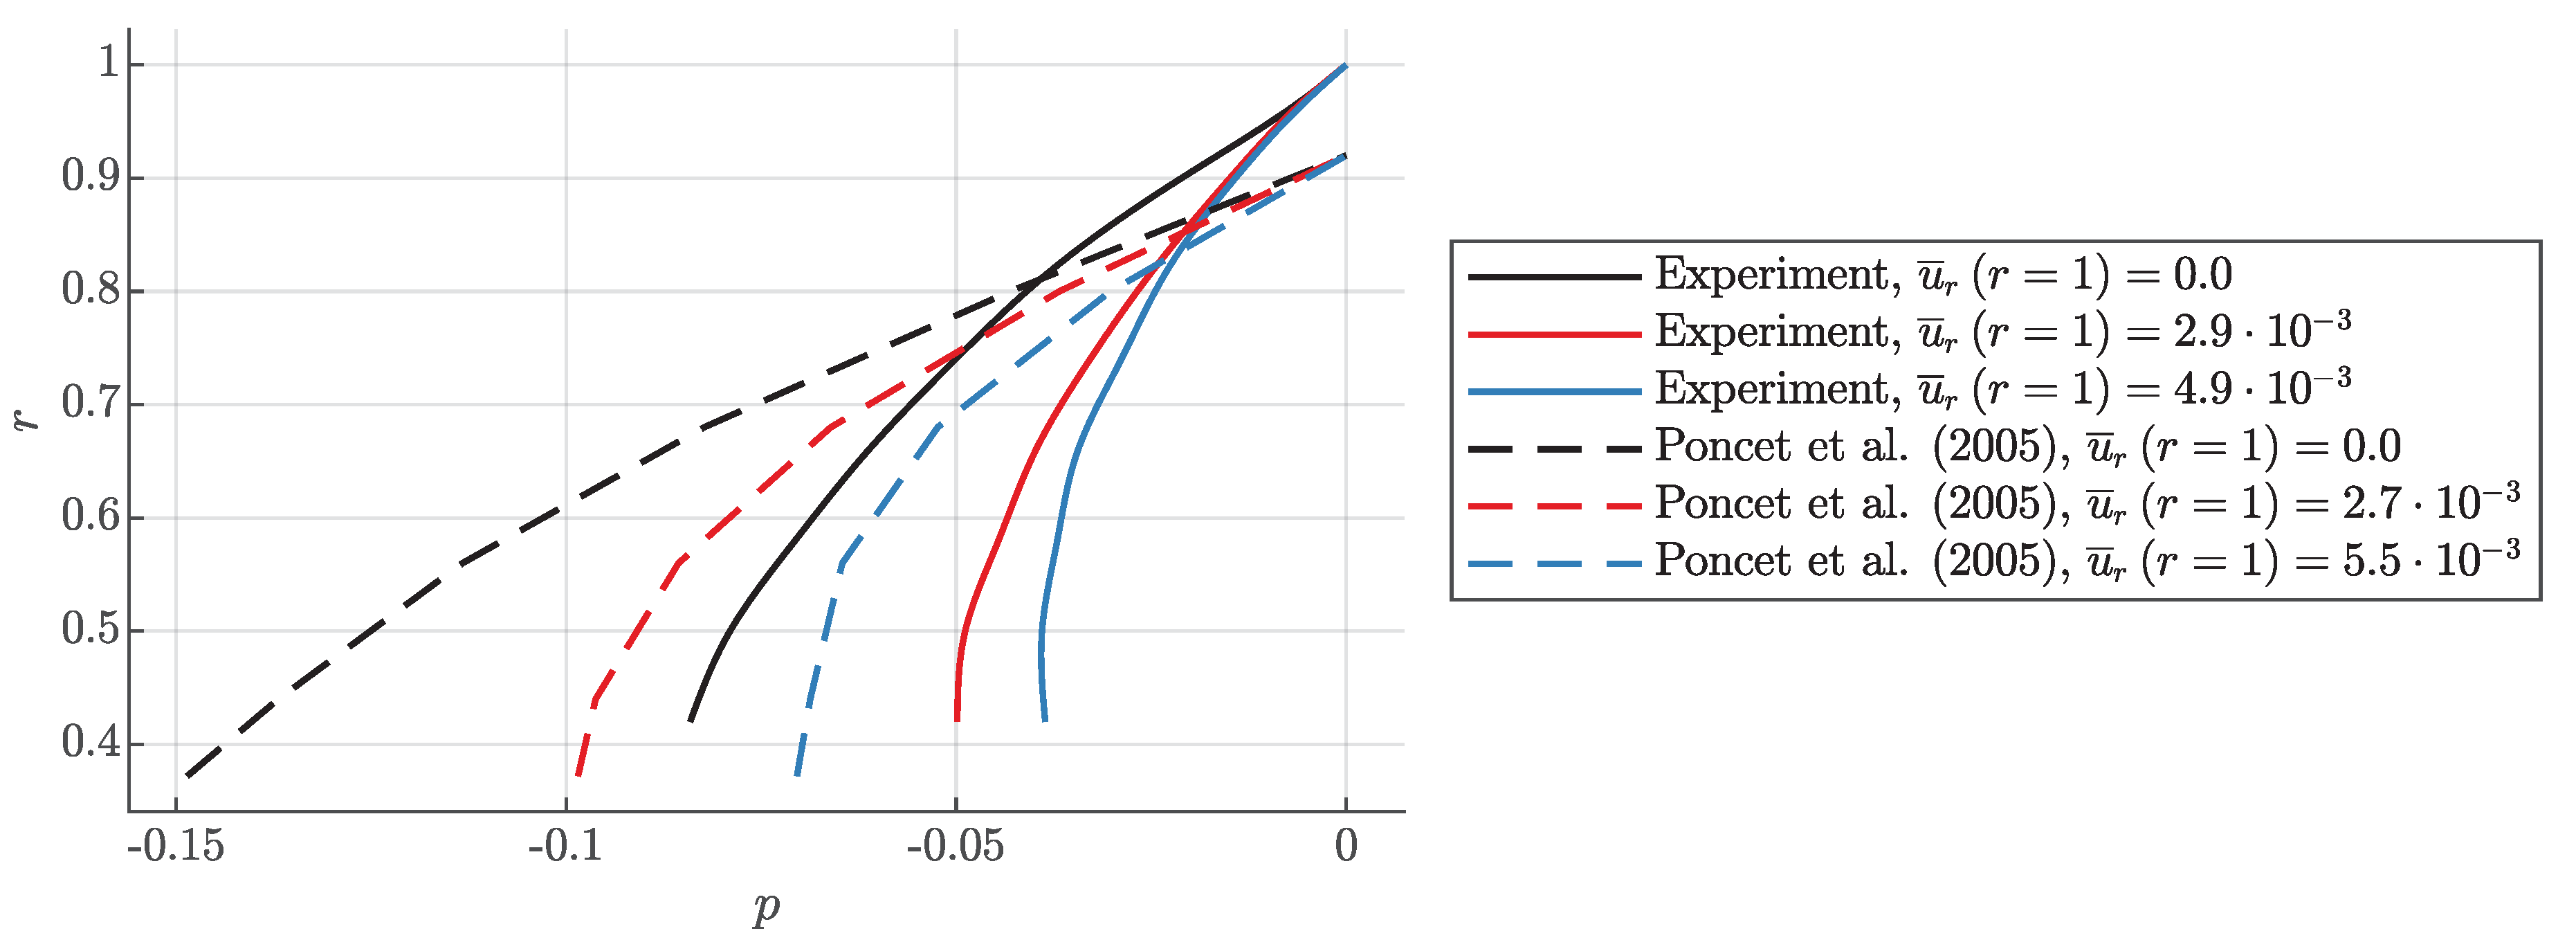
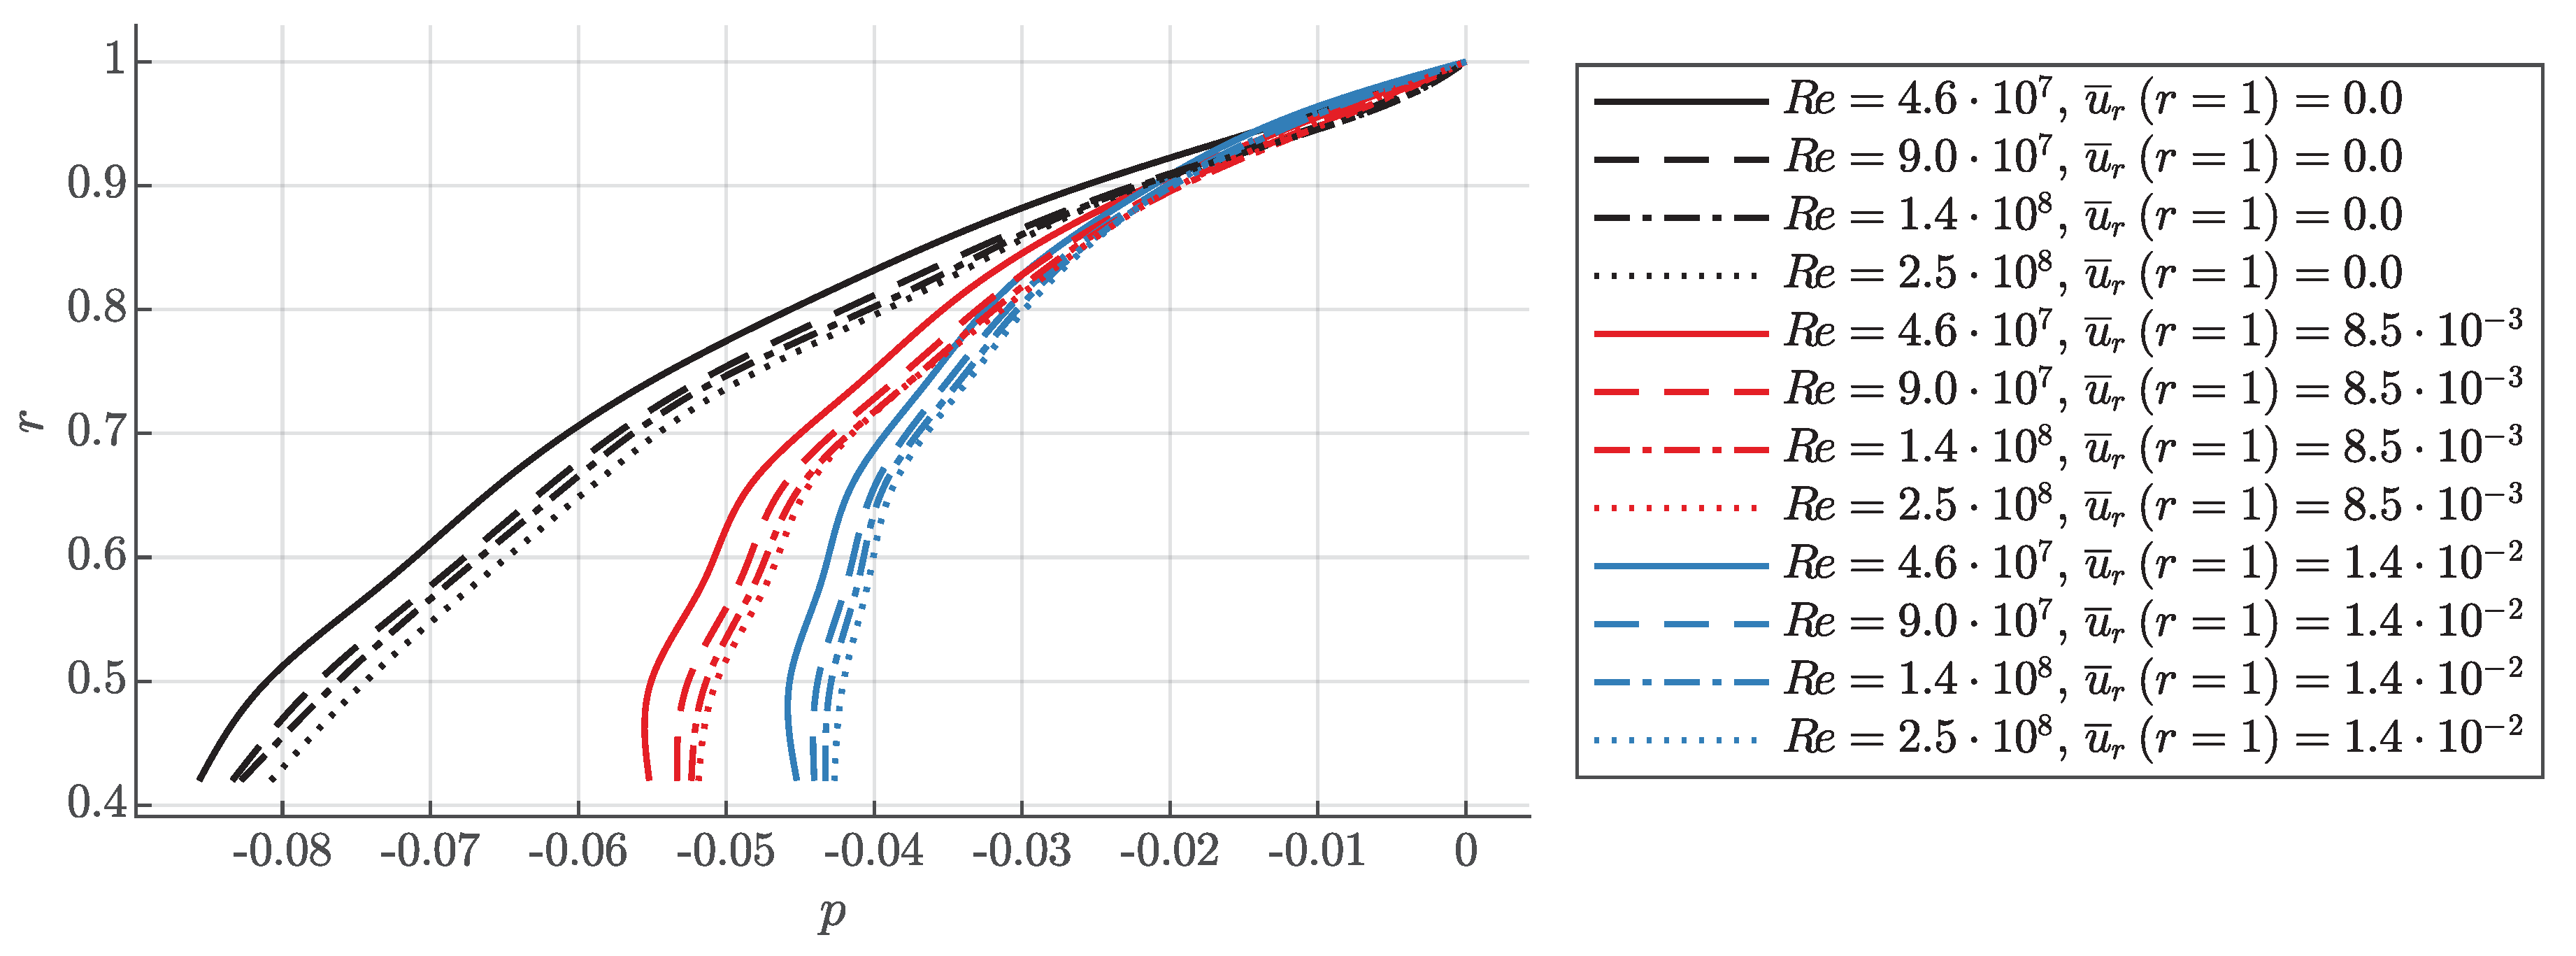
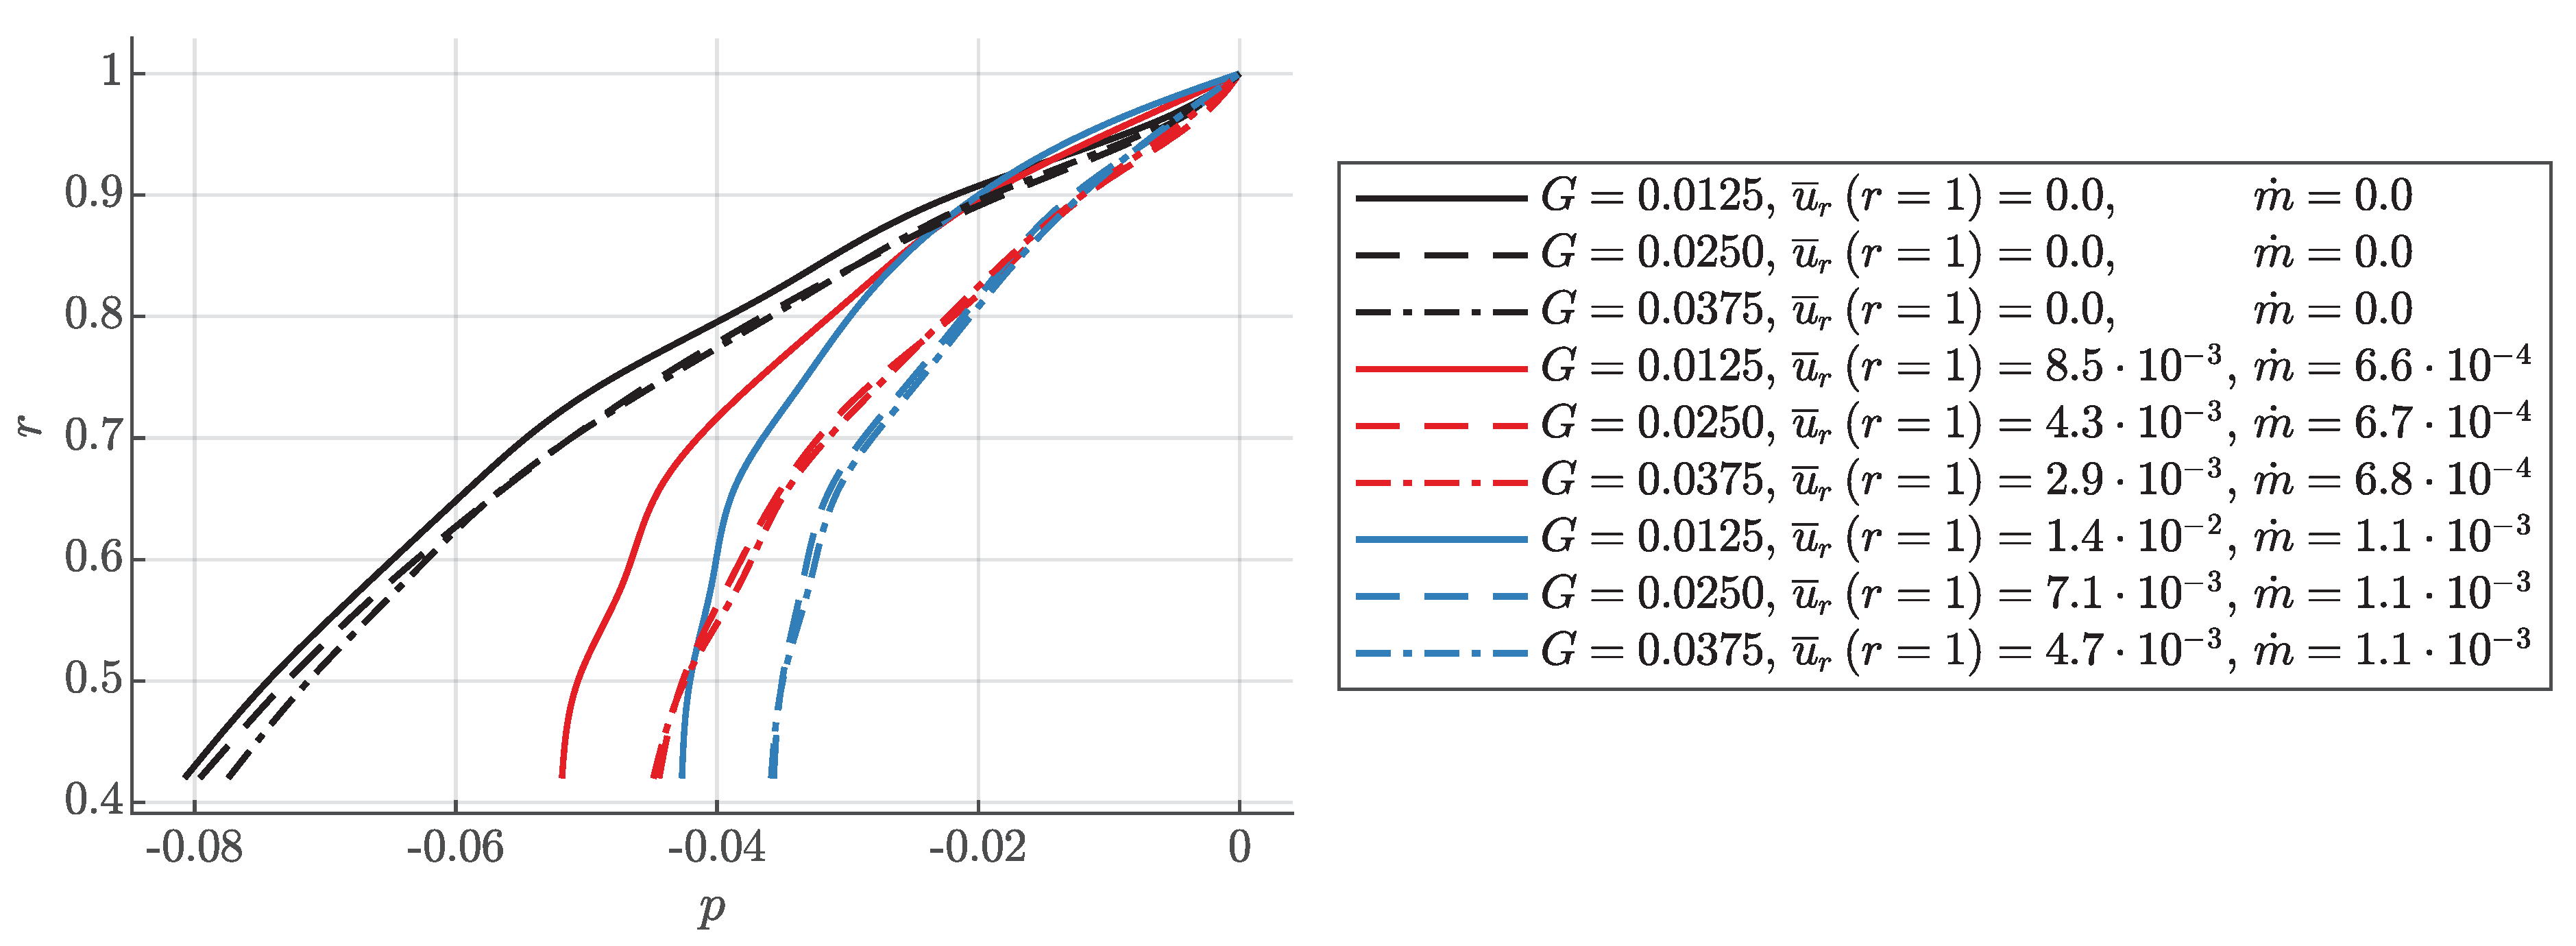
5. Pressure Distribution
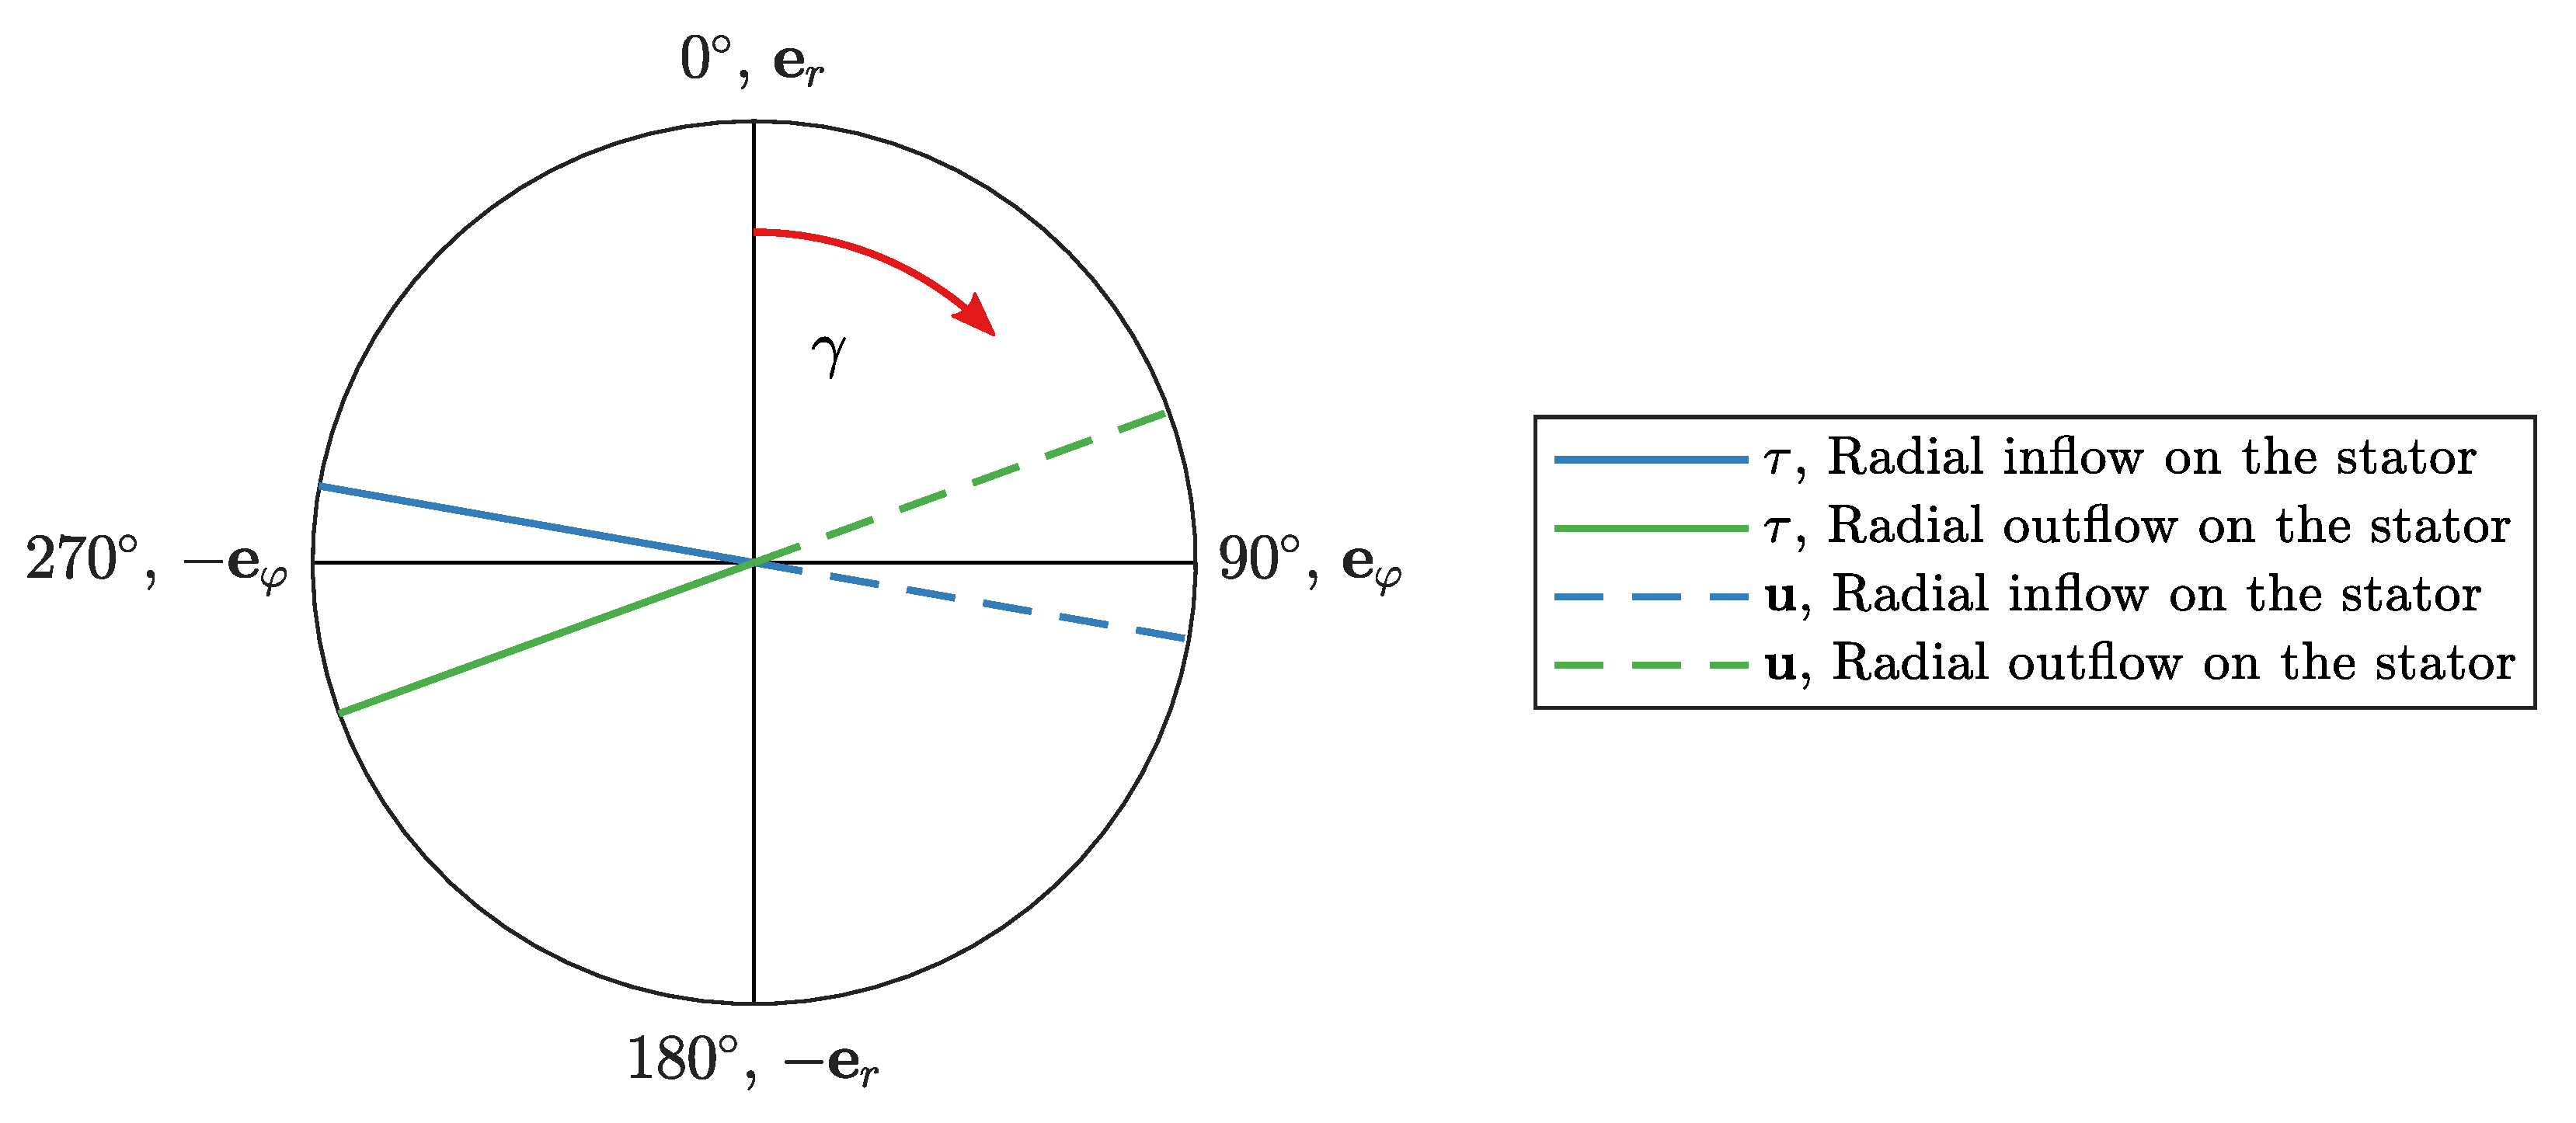
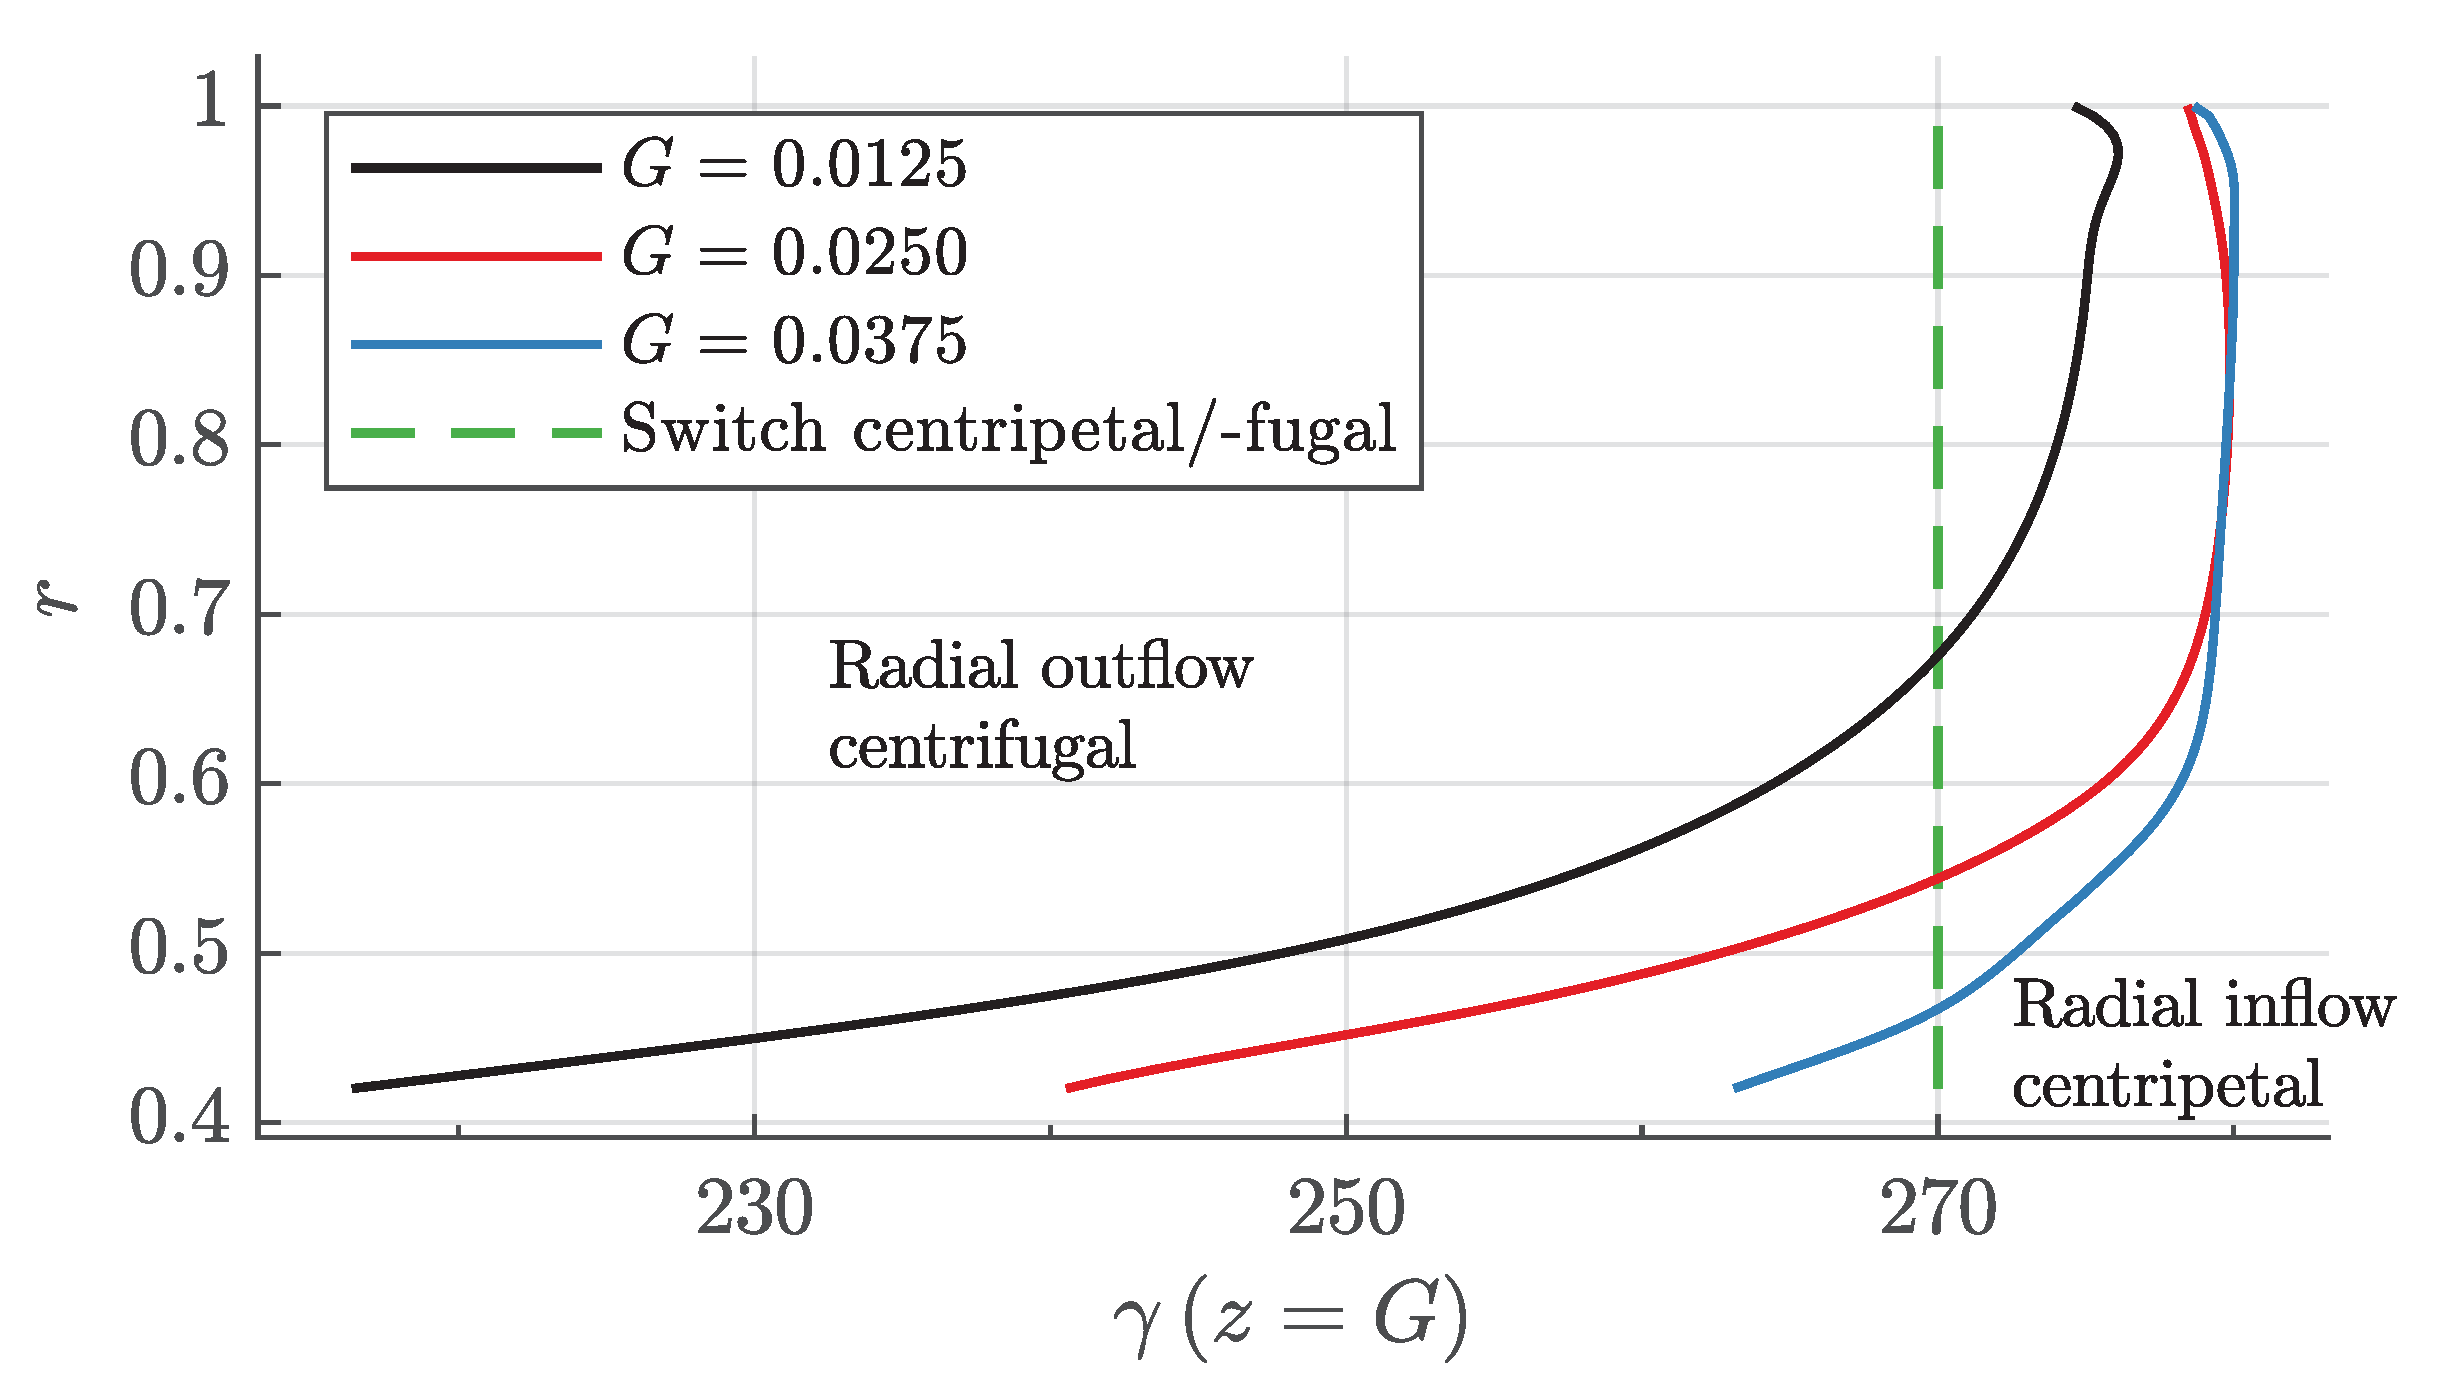
6. Flow Structure
7. Conclusions
Author Contributions
Funding
Institutional Review Board Statement
Informed Consent Statement
Data Availability Statement
Conflicts of Interest
Nomenclature
| CFD | Computational fluid dynamics | Radial distance between disc and casing | |
| d | Width of outlet at the shroud | T | Temperature |
| Unit vector | u | Velocity | |
| G | Cavity width | Dimensionless wall distance | |
| i | An index | z | Axial coordinate |
| K | Fluid rotation factor | Wall shear stress angle | |
| l | Length | Kinematic viscosity | |
| Mass flow rate of through-flow | Density | ||
| p | Pressure | Stress tensor components | |
| r | Radius | Angular coordinate | |
| Reynolds number | Angular rotor velocity |
References
- Daily, J.W.; Nece, R.E. Chamber Dimension Effects on Induced Flow and Frictional Resistance of Enclosed Rotating Disks. J. Basic Eng. 1960, 82, 217–230. [Google Scholar] [CrossRef]
- Daily, J.W.; Ernst, W.D.; Asbedian, V.V. Enclosed Rotating Disks with Superposed Throughflow: Mean Steady and Periodic Unsteady Characteristics of Induced Flow; Hydrodynamics Laboratory Reports; Department of Civil Engineering, Massachusetts Institute of Technology: Cambridge, MA, USA, 1964; Volume 64. [Google Scholar]
- Radtke, F.; Ziemann, M. Scheibenreibung-Vorhaben Nr. 213-Experimentelle und Theoretische Untersuchungen des Reibungseinflusses an Rotierenden Scheiben-Abschlussbericht; Technical Report; Institut für Dampf- und Gasturbinen, Rheinisch-Westfälische Technische Hochschule Aachen: Aachen, Germany, 1982. [Google Scholar]
- Poncet, S.; Schiestel, R.; Chauve, M.P. Centrifugal Flow in a Rotor-Stator Cavity. J. Fluids Eng. 2005, 127, 787–794. [Google Scholar] [CrossRef]
- Schröder, T.R.; Dohmen, H.J.; Brillert, D.; Benra, F.K. Impact of Leakage Inlet Swirl Angle in a Rotor–Stator Cavity on Flow Pattern, Radial Pressure Distribution and Frictional Torque in a Wide Circumferential Reynolds Number Range. Int. J. Turbomach. Propuls. Power 2020, 5, 7. [Google Scholar] [CrossRef]
- Span, R.; Wagner, W. A New Equation of State for Carbon Dioxide Covering the Fluid Region from the Triple Point Temperature to 1100 K at Pressures up to 800 MPa. J. Phys. Chem. Ref. Data 1996, 25, 1509–1596. [Google Scholar] [CrossRef] [Green Version]
- Elena, L.; Schiestel, R. Turbulence modeling of rotating confined flows. Int. J. Heat Fluid Flow 1996, 17, 283–289. [Google Scholar] [CrossRef]
- ANSYS, Inc. CFX 19.2 Theory Guide; ANSYS, Inc.: Canonsburg, PA, USA, 2018. [Google Scholar]


Publisher’s Note: MDPI stays neutral with regard to jurisdictional claims in published maps and institutional affiliations. |
© 2021 by the authors. Licensee MDPI, Basel, Switzerland. This article is an open access article distributed under the terms and conditions of the Creative Commons Attribution (CC BY-NC-ND) license (https://creativecommons.org/licenses/by-nc-nd/4.0/).
Share and Cite
Schröder, T.R.; Schuster, S.; Brillert, D. Experimental Investigation of Centrifugal Flow in Rotor–Stator Cavities at High Reynolds Numbers >108. Int. J. Turbomach. Propuls. Power 2021, 6, 13. https://0-doi-org.brum.beds.ac.uk/10.3390/ijtpp6020013
Schröder TR, Schuster S, Brillert D. Experimental Investigation of Centrifugal Flow in Rotor–Stator Cavities at High Reynolds Numbers >108. International Journal of Turbomachinery, Propulsion and Power. 2021; 6(2):13. https://0-doi-org.brum.beds.ac.uk/10.3390/ijtpp6020013
Chicago/Turabian StyleSchröder, Tilman Raphael, Sebastian Schuster, and Dieter Brillert. 2021. "Experimental Investigation of Centrifugal Flow in Rotor–Stator Cavities at High Reynolds Numbers >108" International Journal of Turbomachinery, Propulsion and Power 6, no. 2: 13. https://0-doi-org.brum.beds.ac.uk/10.3390/ijtpp6020013