Loss Characterization of a Conventional Variable Inlet Guide Vane †


1
Institute of Jet Propulsion, Bundeswehr University Munich, 85577 Neubiberg, Germany
2
MAN Energy Solutions SE, 13507 Berlin, Germany
*
Author to whom correspondence should be addressed.
†
This paper is an extended version of our contribution to the 14th European Turbomachinery Conference, Gdansk, Poland, 12–16 April 2021.
Int. J. Turbomach. Propuls. Power 2021, 6(3), 30; https://0-doi-org.brum.beds.ac.uk/10.3390/ijtpp6030030
Submission received: 25 May 2021
/
Revised: 28 June 2021
/
Accepted: 14 July 2021
/
Published: 26 July 2021
Abstract
:Variable inlet guide vanes (VIGVs) are most commonly used as the major control unit of integrally geared centrifugal compressors (IGCCs). In order to enhance the efficient operating range of the compressor, the loss mechanisms and utilization limits of state-of-the-art VIGVs need to be better understood. Field measurements in the wake of a typical, commercially used configuration were therefore conducted at the VIGV test facility of the Bundeswehr University Munich. The investigations were carried out at application oriented subsonic flow conditions and stagger angles from 50 to 90 covering the full low-loss operating range, including the limits of efficient operation. For a precise local loss characterization, an inflow correlation was developed and applied to consider total pressure inhomogeneities caused by the radial inflow velocity profile and minor circumferential velocity deviations. Contrary to previous research efforts, not only the profile losses, but also the secondary flow losses induced by the open blade tips and wall-blade interactions were resolved in full detail. For this reason, a more precise and comprehensive loss assessment of realistic VIGV cascades is acquired.
1. Introduction
Based on the international efforts to reduce greenhouse gas emissions, the electricity supply is progressively governed by intermittent renewable resources like solar and wind energy. One concept to cope with the rise of supply fluctuations is the demand side management (DSM). The power consumption is thereby established alongside the power supply to balance the electricity market as outlined by Gellings [1]. Particularly for energy intensive industries, this concept becomes interesting, as it is able to access the wholesale electricity markets. In such a way, price peaks can be avoided by market oriented production rates. A flexible electricity consumer could furthermore capitalize by providing a balancing reserve to the transition system operator as described by Häfner [2]. For this reason, most diverse industrial sectors intensify their efforts towards more flexible production rates. Examples are outlined by Sauer et al. [3]. One particularly promising electricity consumer, however, are IGCCs, which are widely used in facilities of the process industry, the petrochemistry or air separation units, see Beaty et al. [4].
Generally, IGCCs feature up to ten stages. Each stage is driven via one bull gear, which in turn is most commonly propelled by a synchronous motor at 50 or 60 Hz grid frequency. Hence, the load shift crucial for the DSM is usually carried out by variable inlet guide vanes (VIGVs) generating varied relative impeller inlet velocities. Details regarding the pre-swirl operation are well described by Stark and Böhle [5] and Mohseni et al. [6]. Once the generated swirl or flow deflection at the VIGV exceeds a critical value, however, open flow separation and increasing secondary flow effects cause a rapid drop of the vane performance. Rising costs based on such decreased compressor efficiency will then certainly negate the incentives of the DSM. For this reason, a widened operational range of the VIGV becomes particularly worthwhile. Previous research efforts on an enhanced efficient operating range already focused on promising blade concepts like split blades or S-cambered profiles. The experimental investigations, however, were performed solely on either linear cascade measurements carried out by Stark and Böhle [5], Bross and Stark [7] and Händel et al. [8], or full compressor stage tests conducted by Kassens and Rautenberg [9] and Mohseni et al. [6], for instance. Highly resolved data in the wake of an isolated, annular VIGV was still pending. In the context of this work, an in-depth experimental investigation of a customary, annular VIGV was therefore performed across the total efficient operating range and its operating limits.
2. Experimental Setup
2.1. VIGV Test Facility
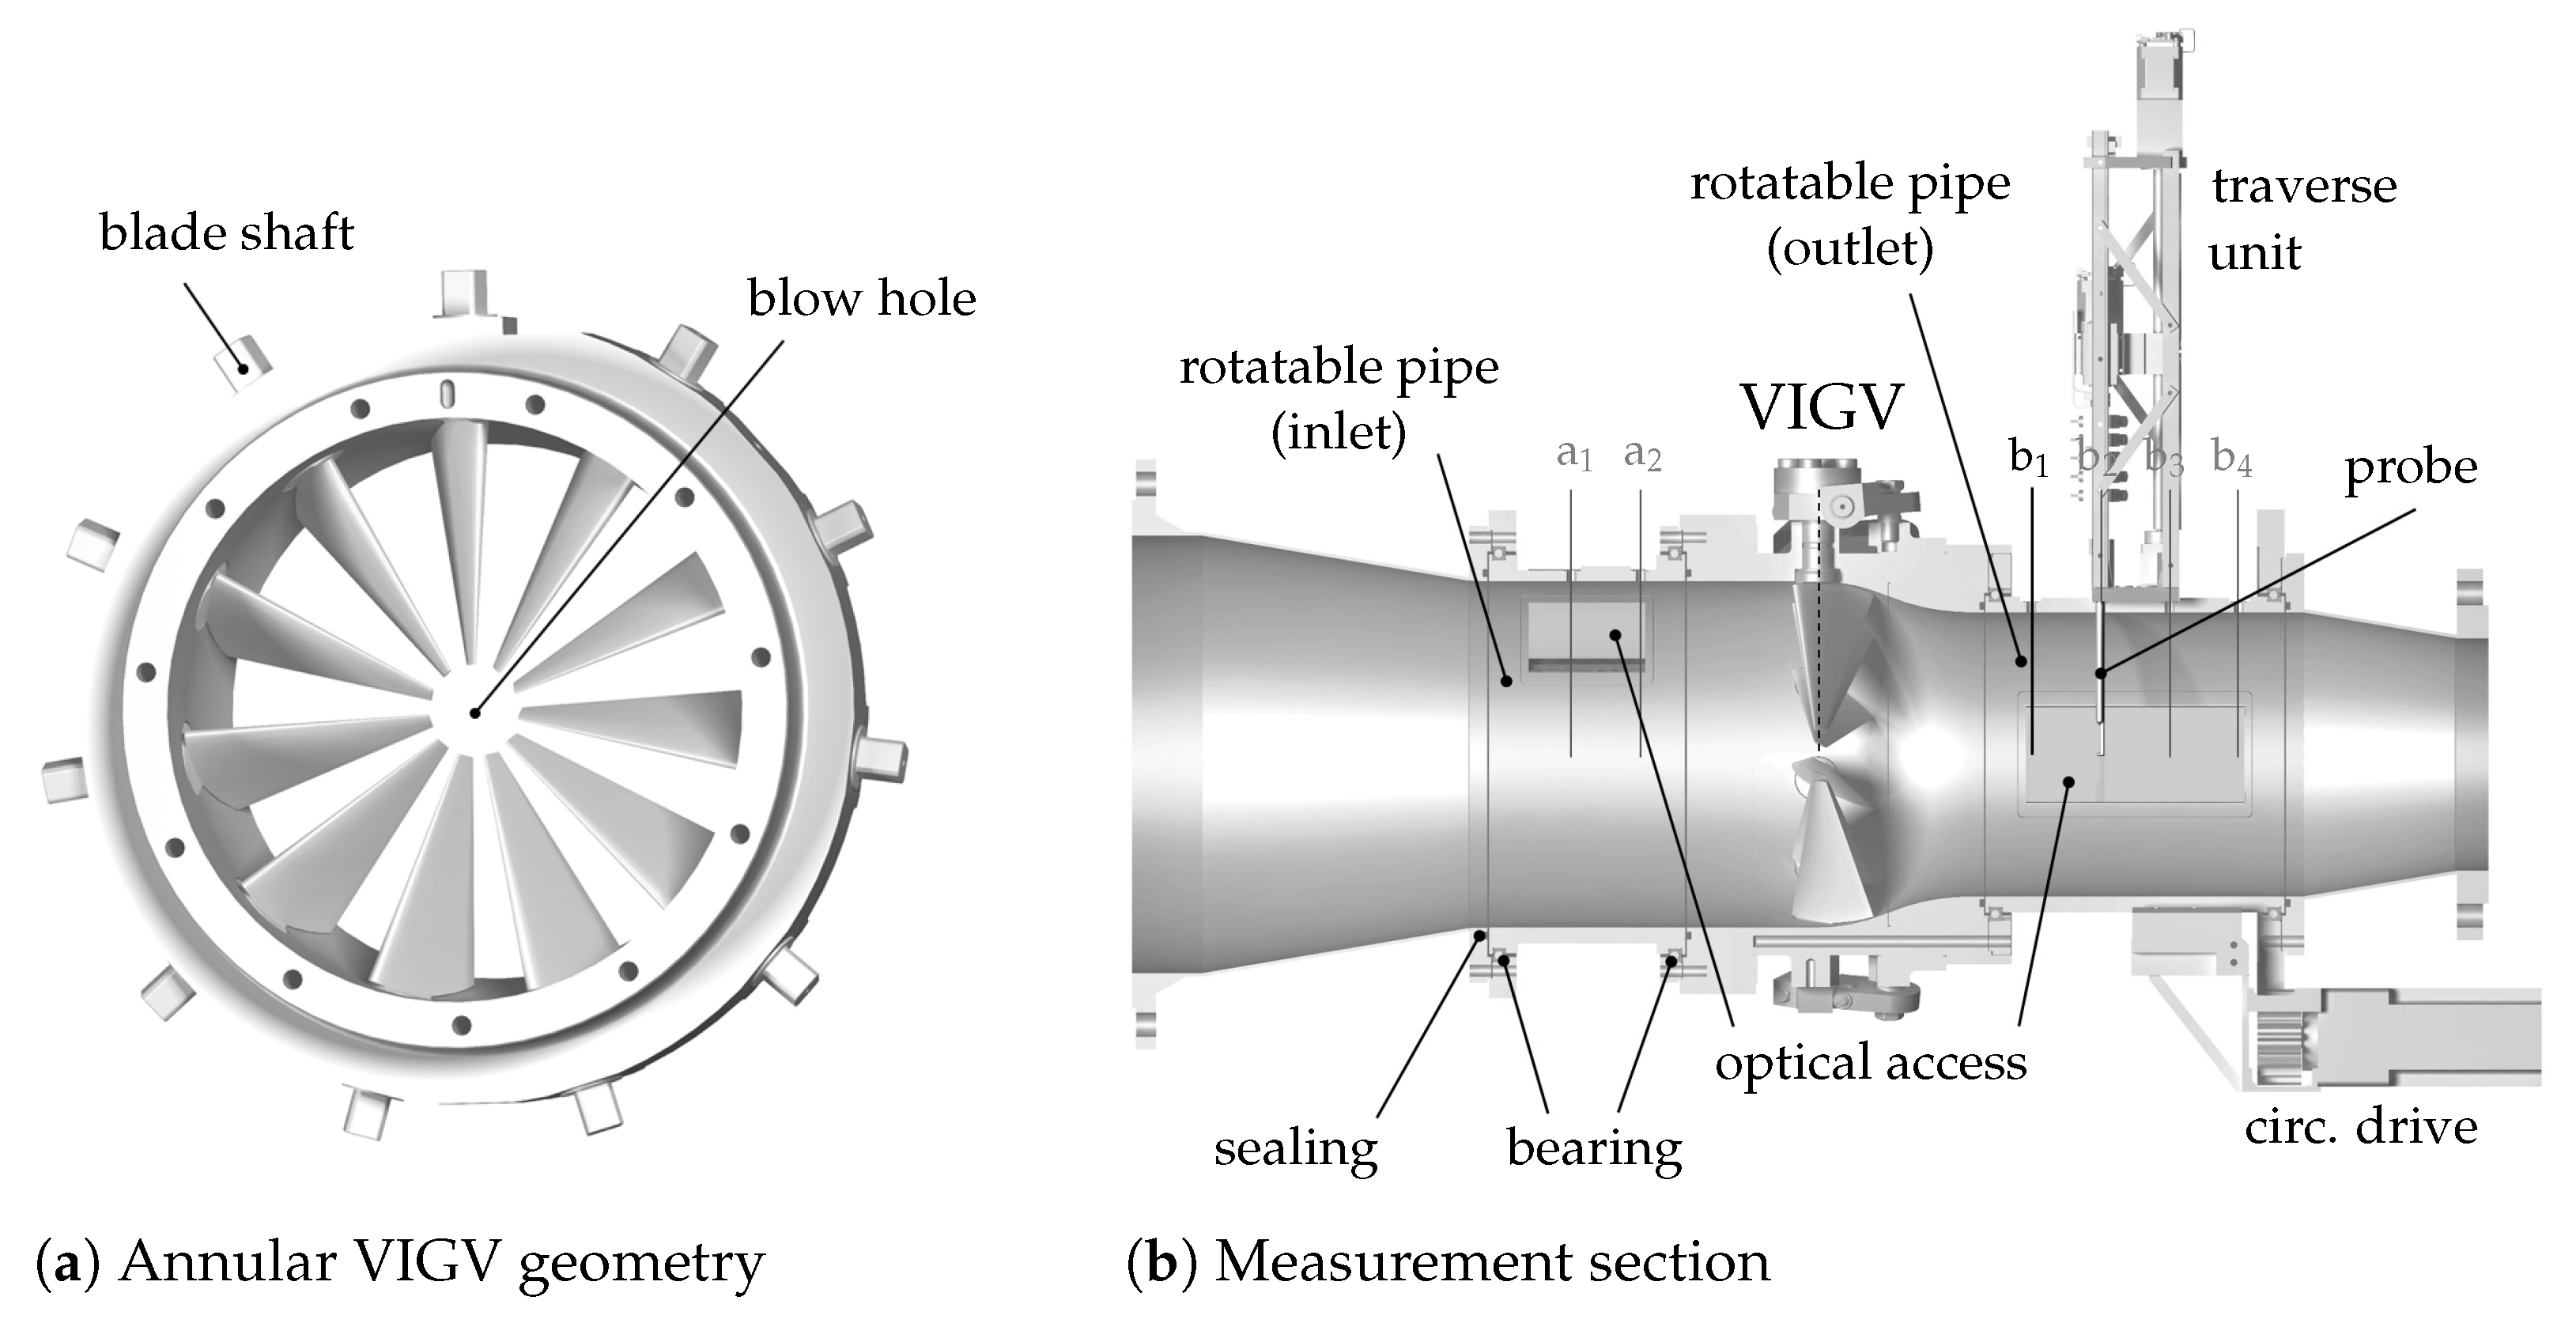
The present characterization of the VIGV performance was conducted at the VIGV test facility of the Institute of Jet Propulsion at the Bundeswehr University Munich. Unlike the previous investigations on linear cascades, the annular measurement section depicted in Figure 1b provides the formation of a complete flow pattern, including secondary flow effects caused by open blade tips or wall-blade interactions. The relevant flow characteristics from the casing to the center are therefore reproduced and quantifiable by five-hole probe measurements. These can either be performed in the two upstream cross sections or the four cross sections in the wake of the VIGV. The investigations were performed at one application oriented, stationary operating point of = 0.125 and = 1.16 × 10. Both Mach and Reynolds numbers refer to integral, inlet flow conditions and the inlet diameter D of the VIGV. Variations of the operating point were maintained below ±0.2%.
2.2. VIGV Cascade
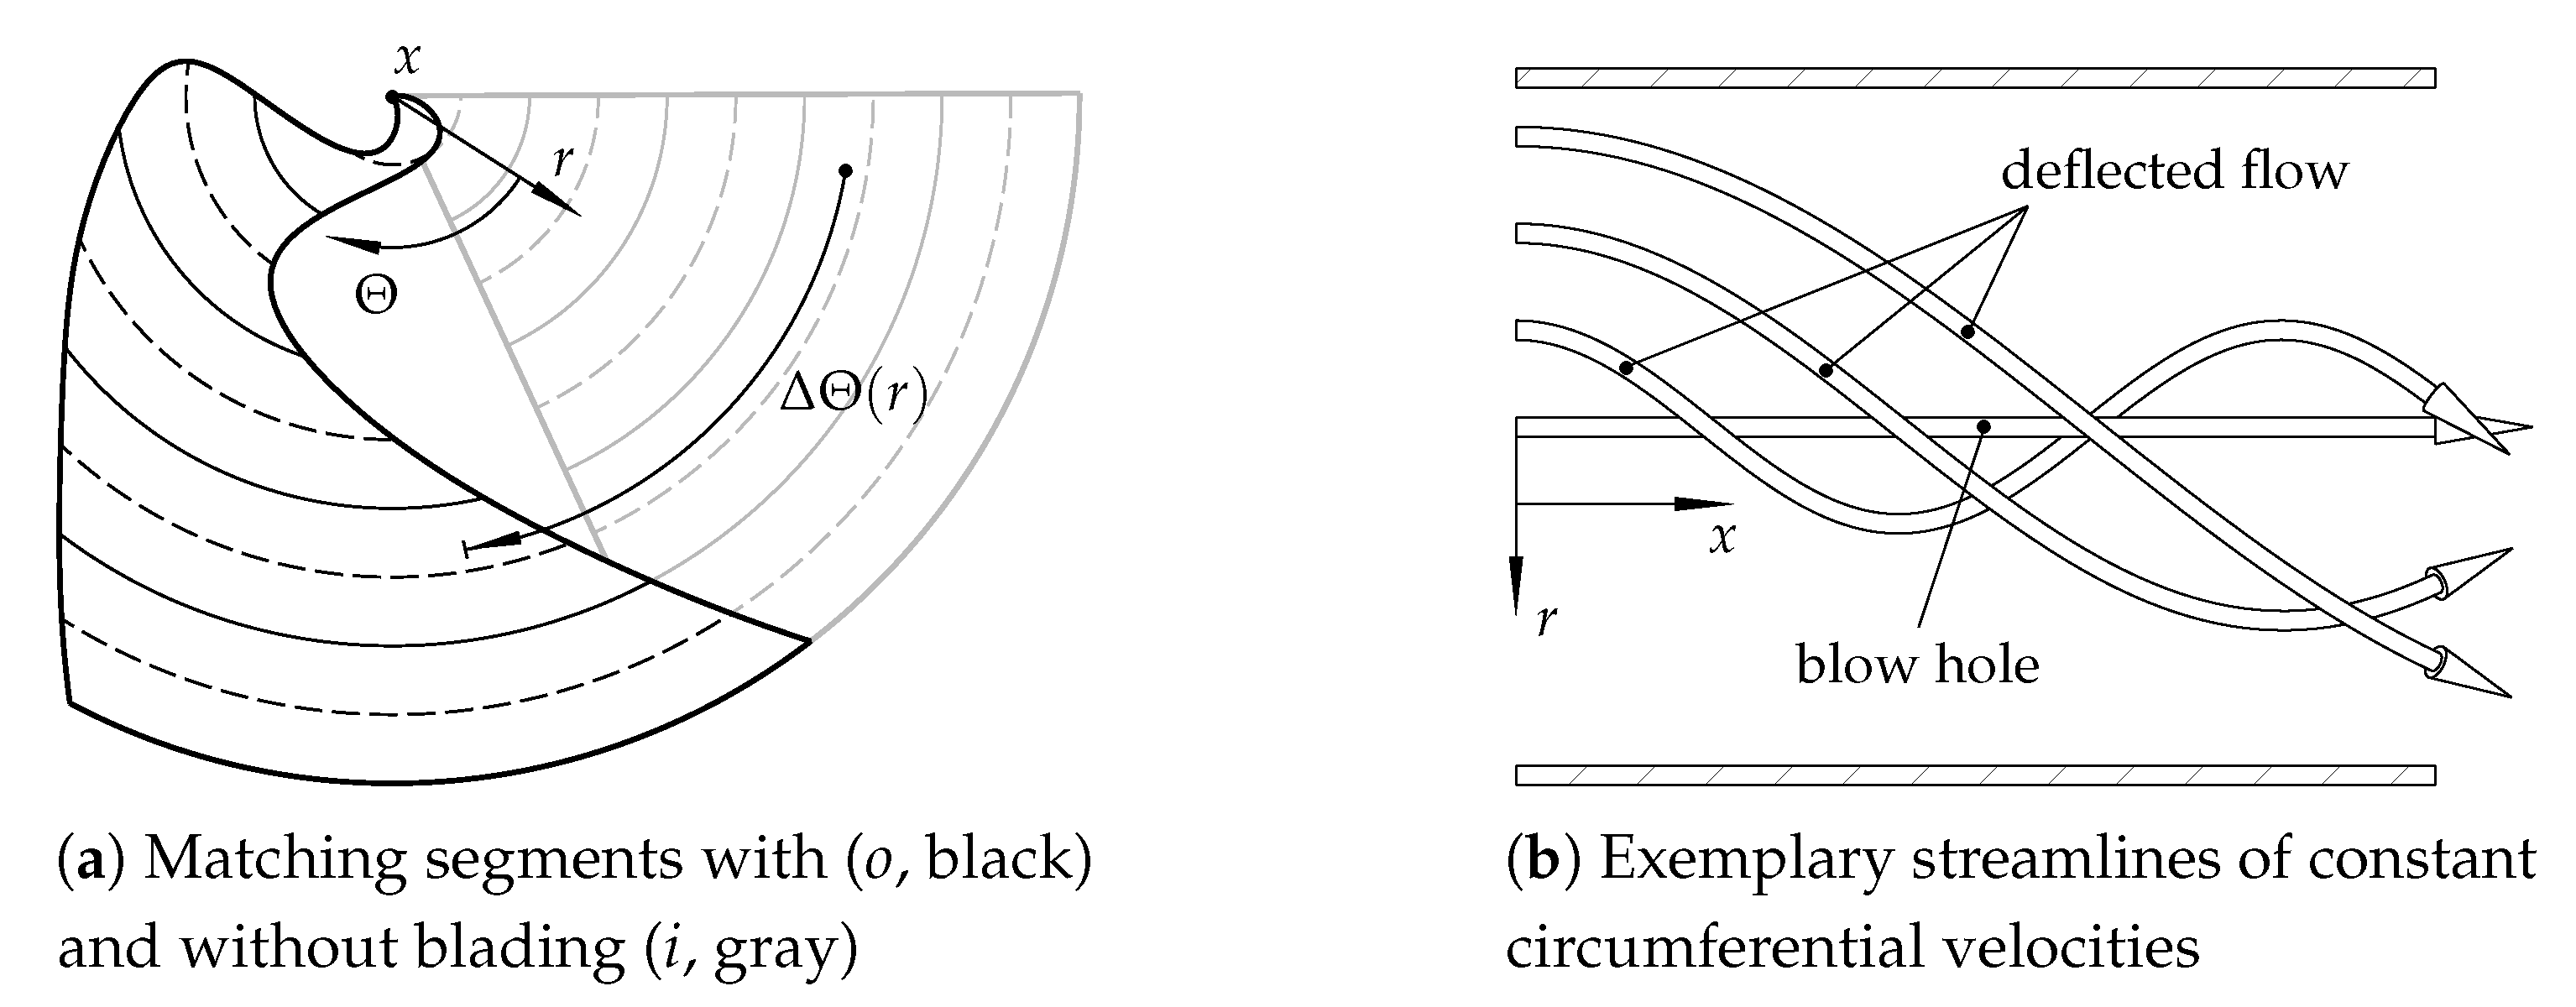
A state-of-the-art VIGV cascade provided by MAN Energy Solutions SE served as the test specimen for the following experimental study. An illustration of the vane is found in Figure 1a. It features three major characteristics: Eleven sharply tapered, symmetric blades enabling stagger angles down to = 0, see Figure 2, linked blade shafts for joint stagger angle variations, and open blade-tips with the associated blow hole in the center region of the annular cascade. The blade geometry corresponds to the V410 profile investigated by Händel et al. [10,11] in various linear cascade measurements. The turning of the blades is maintained at minimal clearance losses between the blade hub and the casing by a spherically shaped cascade duct as illustrated by Figure 3a and Coppinger and Swain [12].
Generally, the linearly increasing chord length along the radius has a significant effect on the local Reynolds number . Although the incoming velocity profile counteracts the effect of increasing chord lengths with the radius, the general trend towards larger local Reynolds numbers closer to the casing is not reversed for wide parts of the blade height as shown in Figure 3b.
2.3. Measurement Techniques and Operation
The wake field measurements presented in the following were conducted by a cranked five-hole probe in measurement plane 0.61 times the cascade inlet diameter D downstream of the blade axis, which is also illustrated in Figure 1b. Due to the inevitable, radial penetration of the probe into the measurement plane, a short headed elbow probe with a spherical probe head of 3 mm was utilized. The automated positioning of the probe within the measurement section is performed by a traversing unit controlled by stepper motors. It features a rotatable pipe segment and a radial drive unit. The positioning uncertainty is considered below ±0.1 mm and ±0.1. Furthermore, circumferential incidence angles off the calibration range can be avoided by pivoting the probe into the flow. More detailed in-depth specifications of the utilized probe, the traversing unit, and the general test facility are provided by Frank et al. [13].
The differential pressures of the conducted measurements were recorded by a Netscanner 98 RK. Depending on the VIGV stagger angle and the expected pressure levels, the utilized pressure transducers varied from 10 WC to 5 PSI modules. Considering each measurement as fully independent, the uncertainty provided in the following plots is based on the Gauss’ law of error propagation and includes both the calibration and sensor uncertainties.
The field measurements were performed at the stagger angles 50 90 in increments of 10. This covers the full low-loss operating range of the VIGV down to = 60 as assessed by Händel et al. [8] plus one additional stagger angle at 50 off these bounds. The largely symmetric flow character and rampant measurement expenses in mind, the measurements were limited to a circular sector of two pitches only. The spatial resolution of each stagger angle setup was furthermore customized to ensure a sufficient resolution at reasonable costs. Each individual grid features between 1050 and 1250 measurement points at up to 39 radial positions.
2.4. Loss Characterization and Flow Deflection
To assess the performance of the VIGV, the generated total pressure loss and the achieved flow deflection is decisive. Due to negligible lateral velocity components in the inflow, the latter is provided solely by five-hole probe measurements in the wake field whereas requires a reasonable reference unaffected by the VIGV. This obstacle will be addressed in the following subsection. In order to parameterize the issue, the local total pressure loss is nevertheless provided by the local pressure loss coefficient
In contrast to the local probe measurements, the dynamic pressure at the VIGV inlet represents an integral variable based on the integral total mass flow.
By means of the highly resolved flow field, the local information of and provides the foundation for the evaluation of the local primary and secondary flow phenomena. For an overall quantification of the vane performance, data reduction becomes indispensable. Mass averaged mean values (marked by the subscript and r) are therefore used in the following.
2.5. Inflow Correlation of the Total Pressure Loss
In order to measure the total pressure to determine , the application of a sole, representative Pitot probe upstream the test specimen is common practice in wind tunnel testing. This represents an adequate method in homogeneous total pressure fields without local gradients. In the present case, however, extensive boundary layer effects and local inflow inhomogeneities are present. The undisturbed total pressure field is therefore hardly detectable by one fixed Pitot probe only. For this reason, the correlation
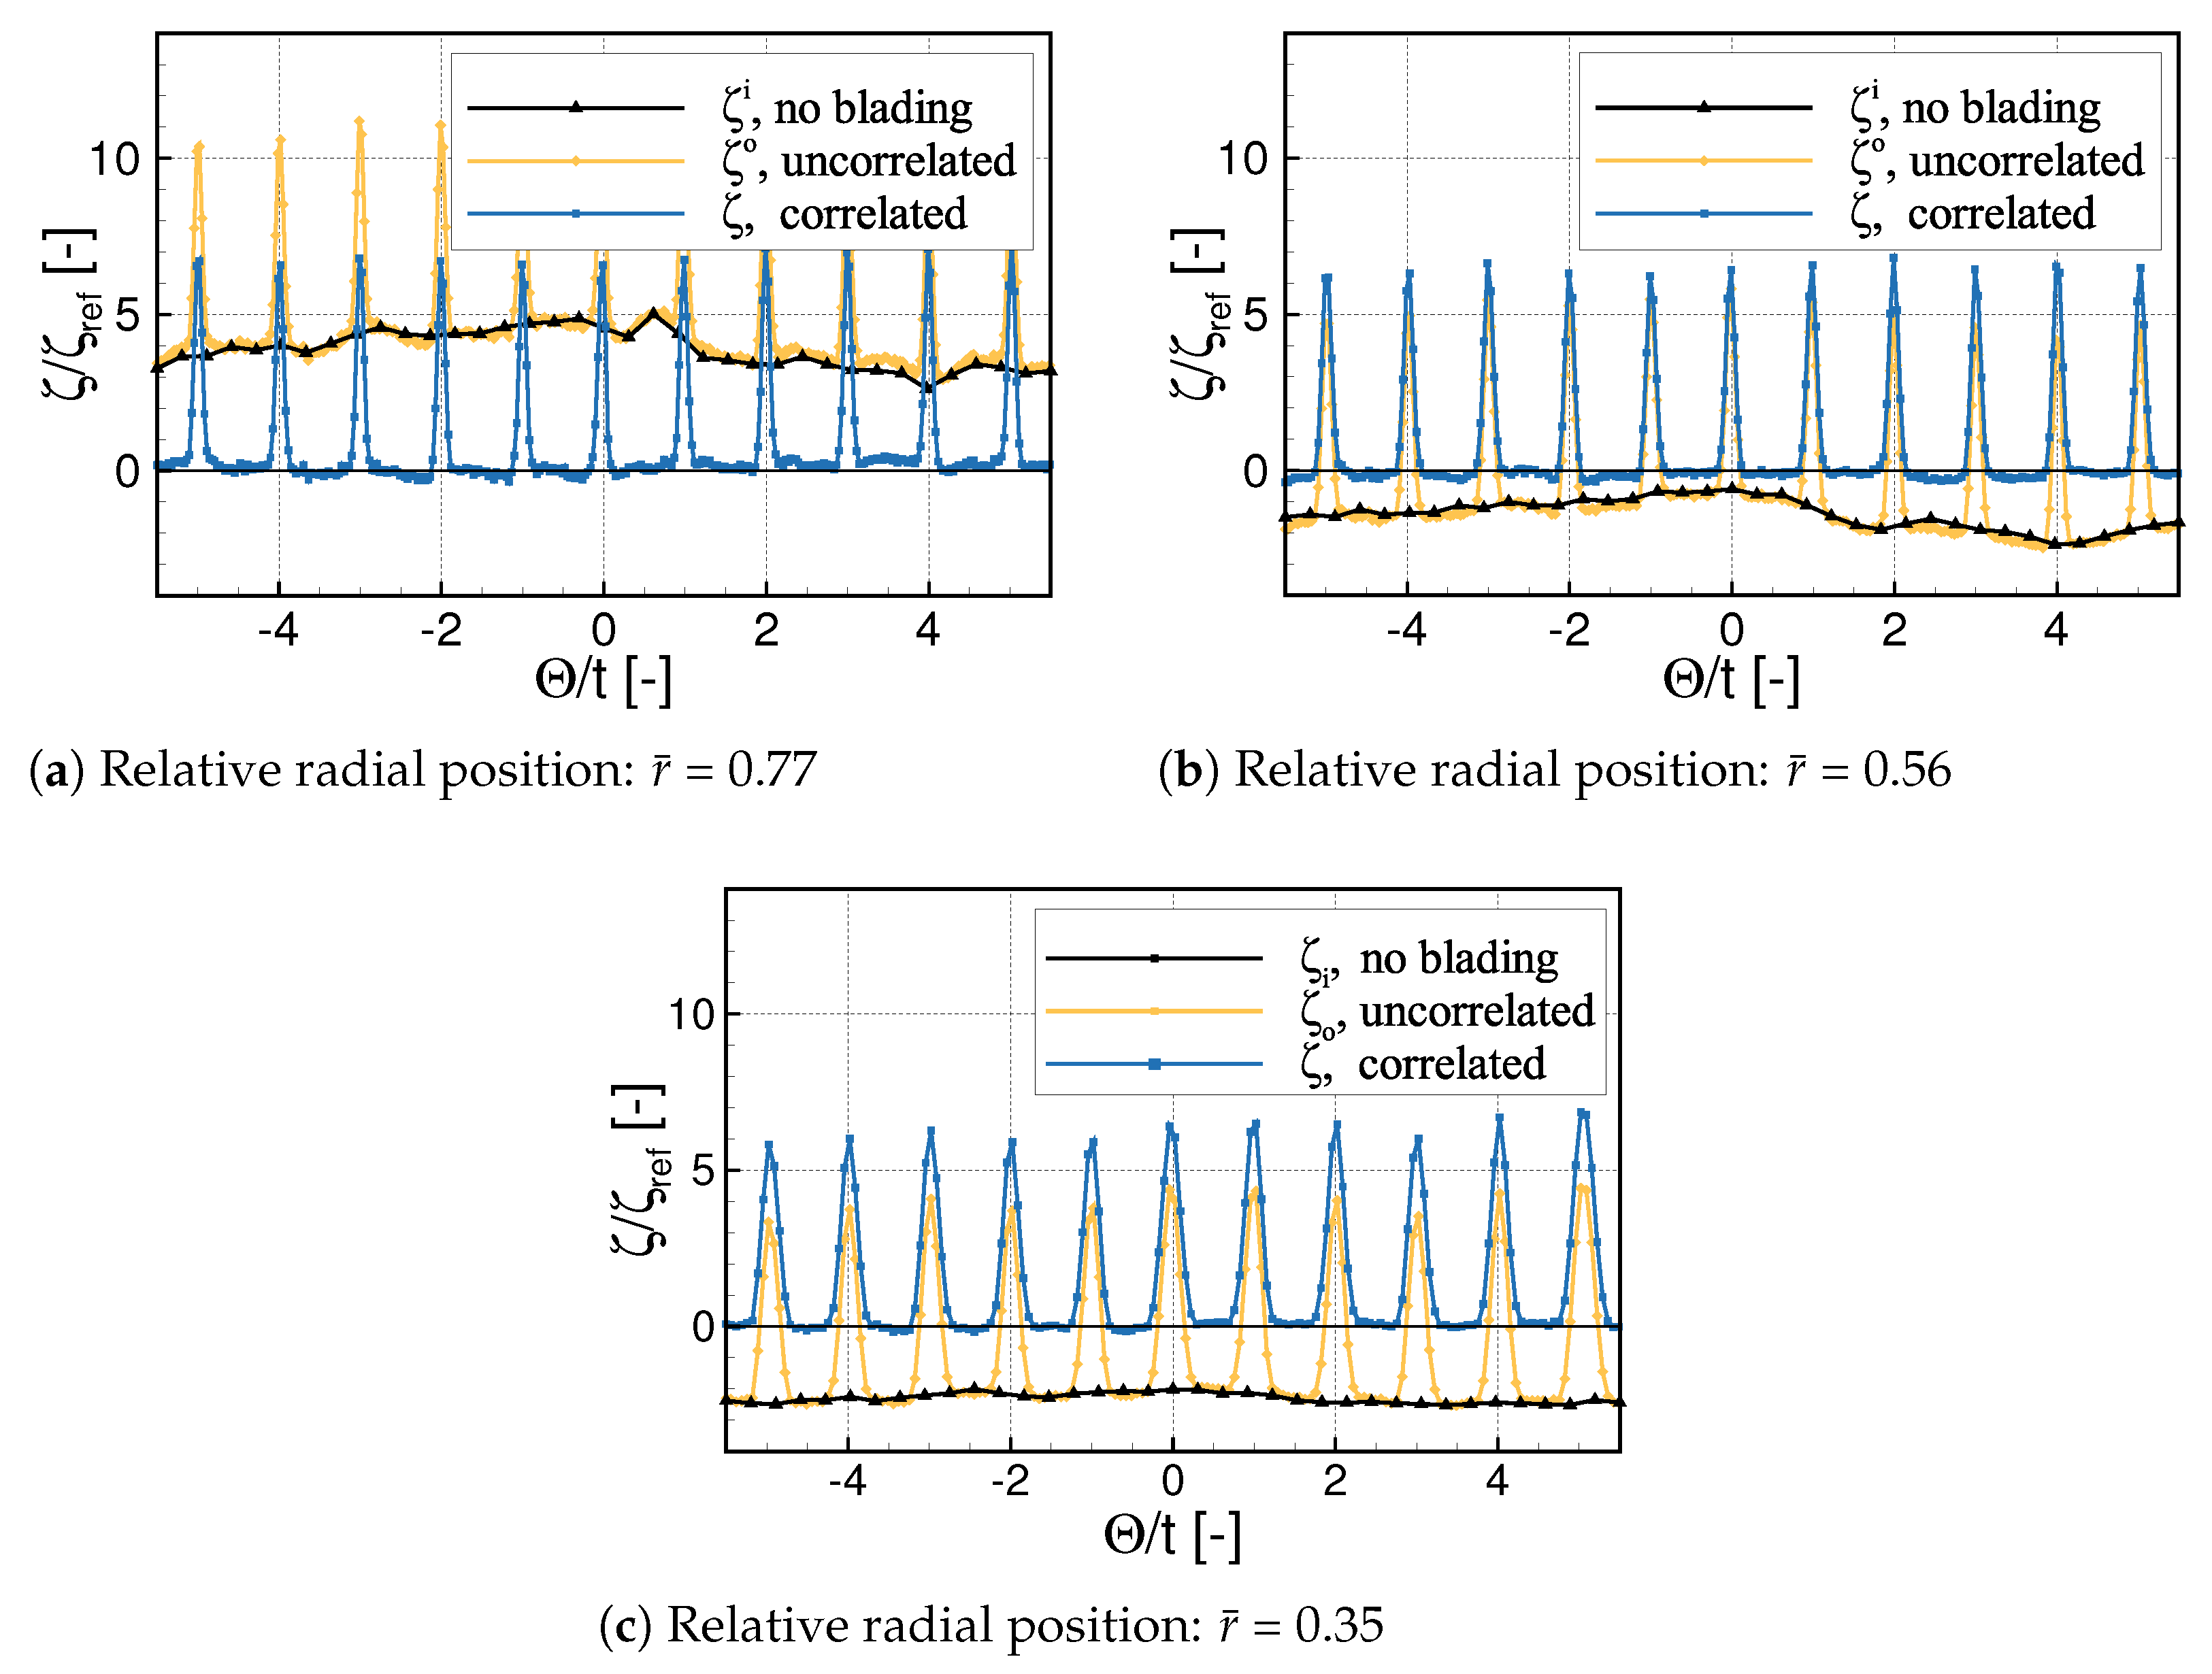
between the two independent measurements i and o was performed. Both and still refer to one local Pitot reference . Assuming only minor variations of the operating point, the influence of the term in Equation (2) and the Pitot probe measurement vanishes. Although i and o were both recorded downstream the VIGV, the guide vane was not equipped with blades in the case of i. Thus, the measurement of does include the inflow inhomogeneities and the influence of the narrowing contour of the VIGV, but not the loss induced by the blades. To still perform a meaningful correlation, the locations of the measurement points i and o need to match one streamline. A previous approach by Frank et al. [13] already considered the dominating radial gradients along the radius assuming a negligible flow deflection over the local radius relative to the pipe radius (). Subordinate circumferential total pressure gradients of the incoming flow field were neglected, though. The necessity, however, to correlate circumferential deviations is highlighted by two exemplary 360-traverses at = 90 in Figure 4a,b. Not only the general offset from zero caused by significant boundary layer effects, but also considerable circumferential variations of the incoming flow, which partly exceed a delta of = 2.5%, are thus excellently eliminated. Striving for a complete approach, which includes the circumferential discontinuities, the generated, local angular flow deflection between the VIGV blades and the measurement plane as depicted in Figure 5 must therefore be considered. Due to a negligible flow deflection at = 90, this has not been an issue at the previously illustrated cases in Figure 4, yet. With decreasing stagger angles, the flow field is, however, largely distorted from the VIGV inlet to the measurement plane. At comparable circumferential velocities generated by the straight VIGV blades, the distortion is mainly caused by the inverse proportionality of the angular velocity and the radius . Therefore, the angular velocity and the covered angular flow deflection increase rapidly towards the center as highlighted in Figure 5b. The flow in the blow hole region in turn is not disturbed by the vane, which causes an additional sheer layer downstream the blade tips.
To emulate the angular flow deflection of the streamlines of i and o, a trigonometric approach based on the measured, circumferential flow angle and the axial distance x between the VIGV and the measurement plane was chosen as a first approximation
Mindful of the gross assumption of a constant circumferential flow angle along x, a correction factor is introduced to obtain a more reliable correlation. An illustration of the approach is provided in Figure 6. Downstream the blade at central height, where the flow is highly dominated by profile losses, the determination of is performed by a matching of the actual and the trigonometrically predicted blade position identified by the blade wake. Close to the casing at large radii, however, secondary losses increasingly dominate the profile losses previously used as a marker. Thus, has to be assumed constant in this region. The thereby caused error remains minor as the angular velocity gradients are relatively small, and is still much smaller than the pitch t. Towards decreasing radii and small stagger angles of the guide vane, potentially exceeds the magnitude of t due to the significantly increased covered angle . This obstacle to reliably determine at small radii is caught by a radial cross-comparison. Significant radial gradients of from one radial position to the next would be nonphysical and are thus disallowed. The success of the streamline correlation is demonstrated by the physically meaningful contour plots in Figure 7. Since the underlying data interpolation of the following plots is based on the same algorithm as the introduced correlation, the reliability of the approach is graphically ensured. In the pipe center governed by the blade tip vortex, a precise local correlation becomes increasingly difficult, though. As flow inhomogeneities are weak in the core region, see Figure 4c, an extensive angular correlation is dispensable in this particular region, anyway. Naturally, the described procedure must be performed individually for each setting of the guide vane and each operating point.
3. Results and Discussion
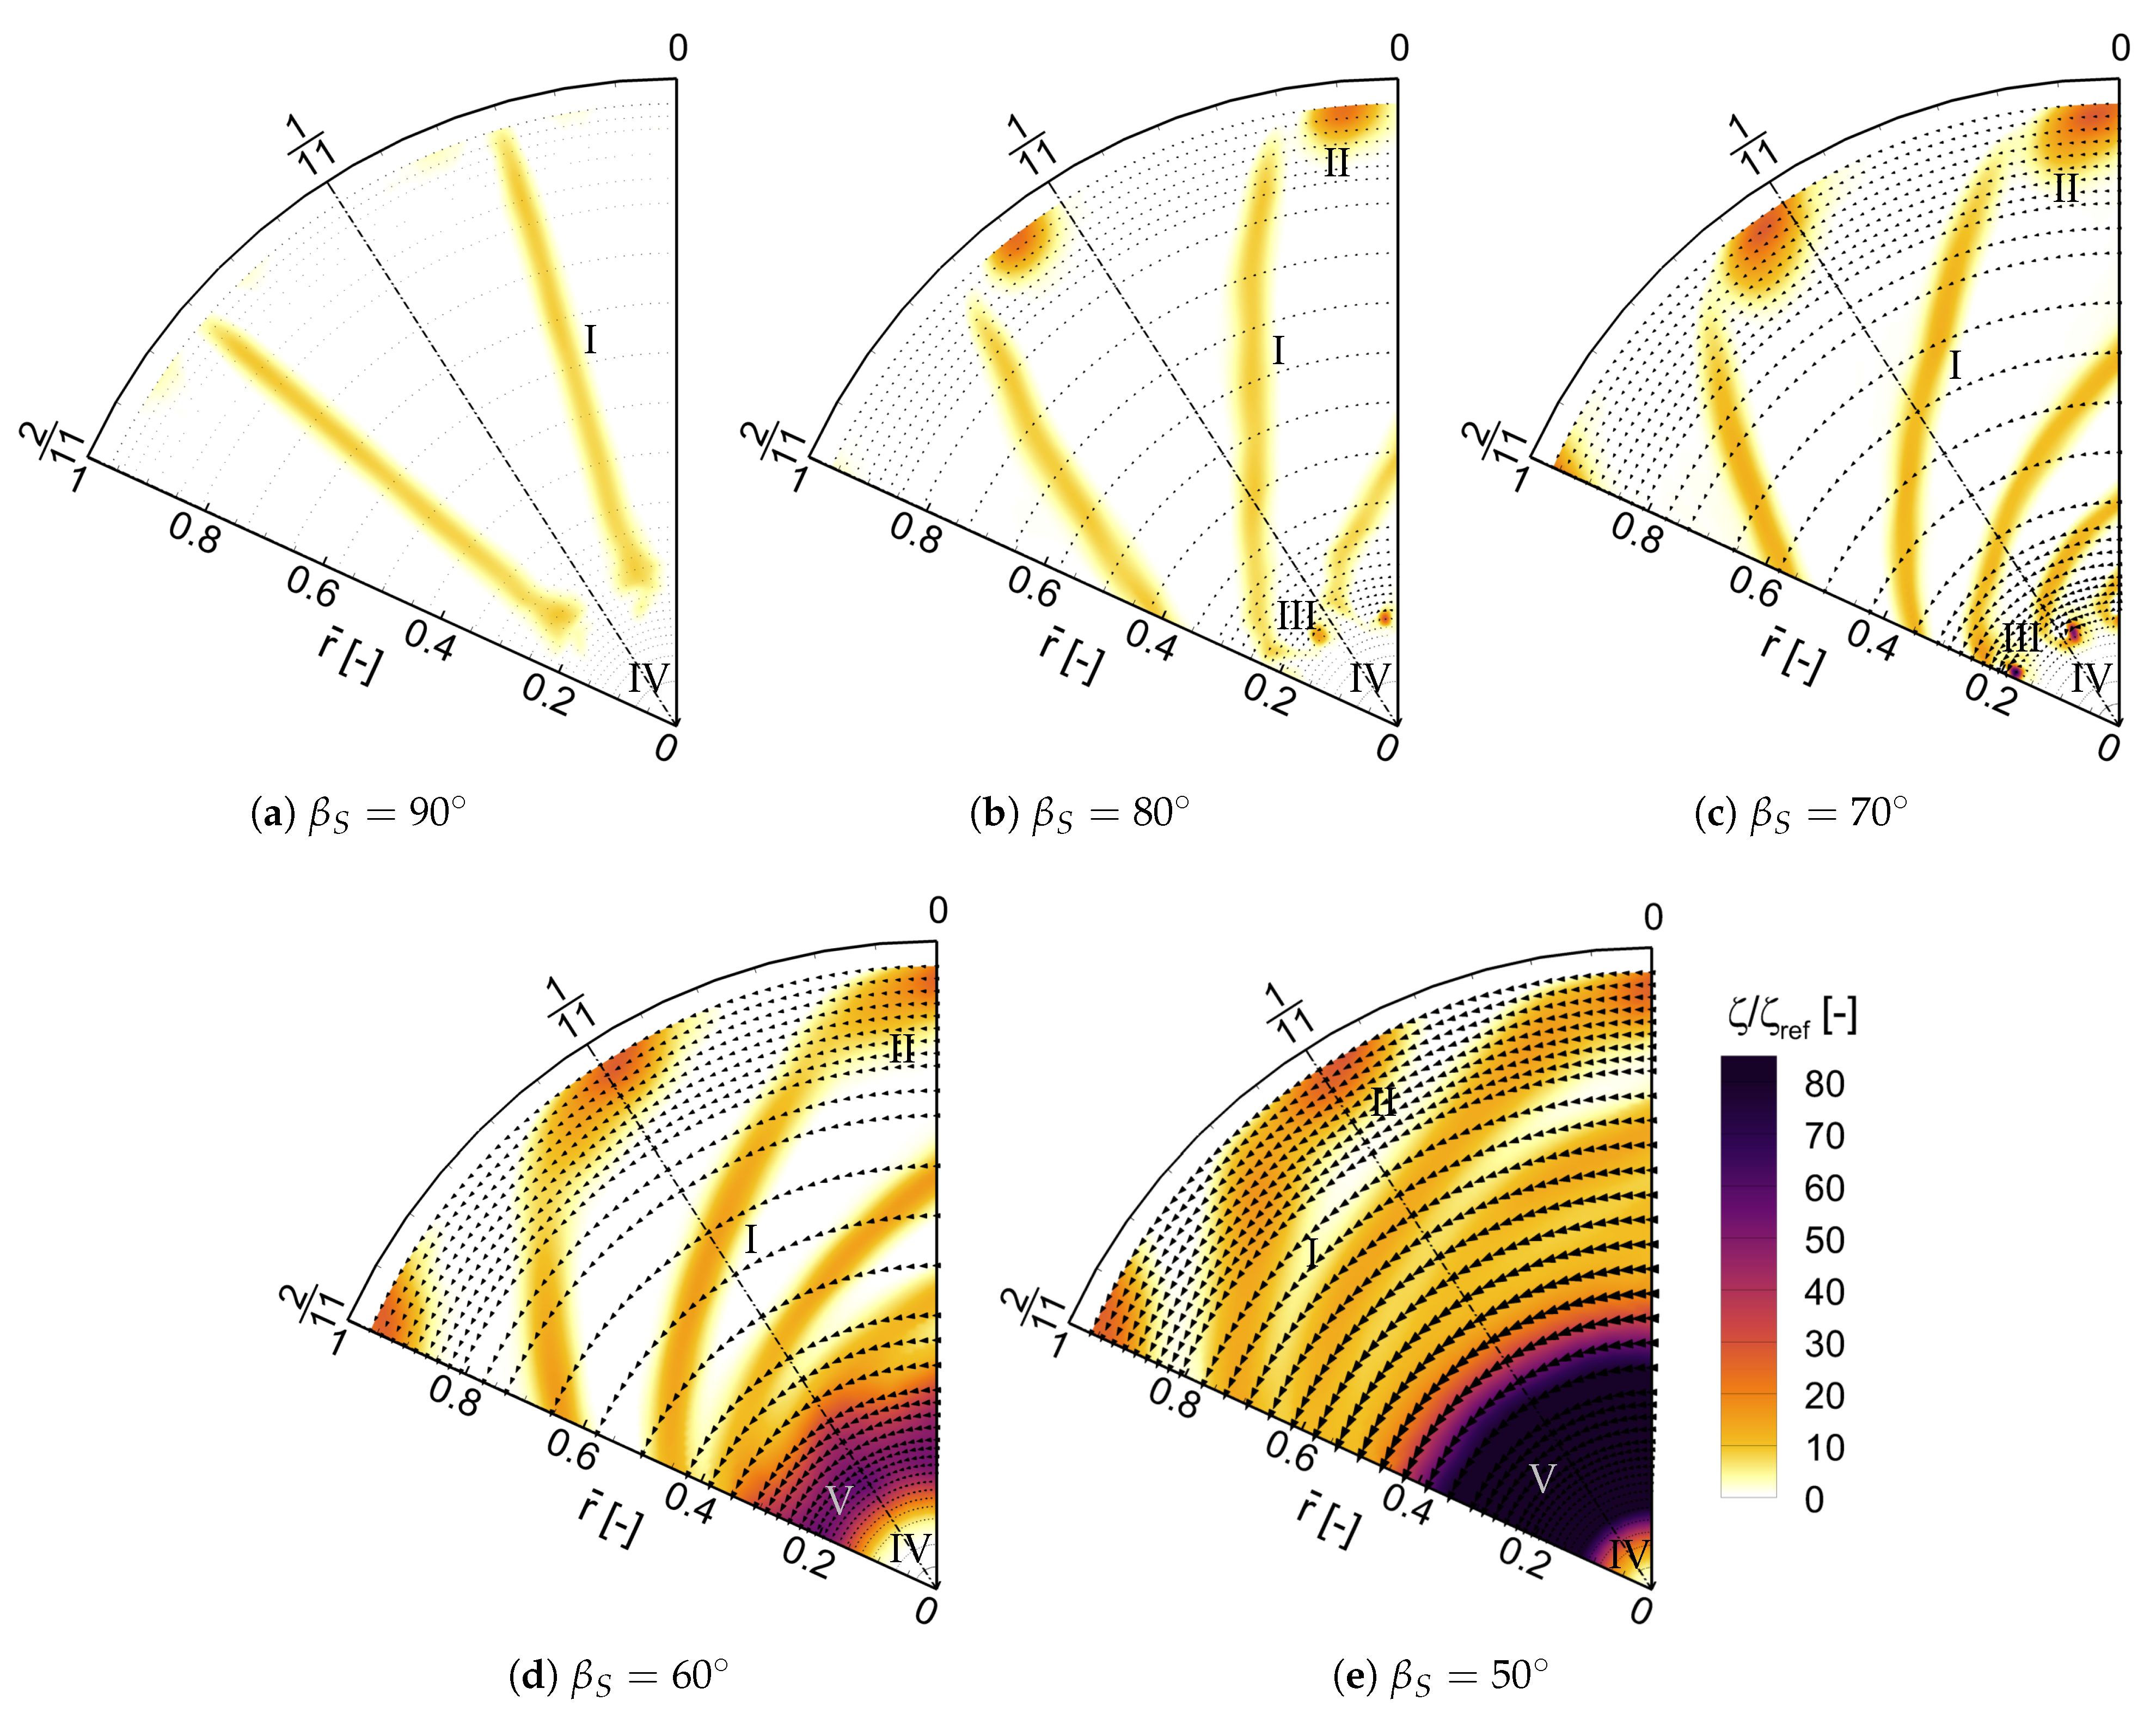
The spatially resolved distributions of at the five investigated stagger angles are provided in Figure 7. Each measurement position is marked by a velocity vector. Despite gross differences in the loss distribution and rates, the contour plots reveal common characteristics and underlying trends towards decreased stagger angles. At = 90, the loss is mainly dominated by profile losses (I) reaching as an elongated loss field from near the casing to downstream the bounds of the blow hole at the blade tips (IV). At decreasing stagger angles, this region is progressively stretched in the circumferential direction, resulting in an exit of one blade wake at the one side of the investigated circular sector and an entering of another wake from the other side. At 70, an accelerated growth of the profile losses, as well as a broadening of the wakes, is observed. This characteristic is traced back to higher losses and wider wakes generated at larger flow deflections, as it was already observed in linear cascade measurements of the same profile by Händel et al. [10]. To a certain extent, the broadening of the wakes is also considered to be driven by an increased mixing of the flow based on the elongated streamlines between the VIGV and the measurement plane with higher swirl, see Amecke [14].
Besides the analysis of the primary profile losses, it has been the main objective to trace and to quantify the secondary flow losses inevitably generated by the open blade-tips (III) and the finite casing dimensions (II). Wall-blade flow interactions at radii are well-known in turbomachinery flow. Sieverding [15] and Denton [16], for instance, provide an in-depth review about the findings of the previous decades. Most commonly the effects are classified into passage, horse shoe, and corner vortices. Even if the loss region caused by the blade-wall interaction is clearly identified by the undertaken measurements, the subdivision of the different vortex structures is not feasible due to the high mixing length between the cascade and the measurement plane of at least 1.5 times . A steady increase of the blade-wall induced losses is nevertheless apparent with smaller stagger angles.
Unlike secondary flow losses at the endwall, the blade tip loss is a rather exceptional phenomenon in turbomachinery applications as the development of blade tip vortices is usually hindered by the hub. The observed effects, however, compare well to the widely known wing tip vortex at airfoil structures as described by Green [17], for instance. The development of the loss at the blade tip is prefigured as a diminutive loss region at = 90 and 0.2 in Figure 7a. With decreased stagger angles by 10 and 20, the loss region grows progressively in size and intensity. From = 60 on, the locally bounded loss is merged in a large ring-shaped loss region (V), which considerably intensifies at = 50. In the previous linear cascade measurements of Händel et al. [10], the development of an open separation bubble was detected at 100 k and 60. These conditions match the flow conditions at the noticed ring-shaped area of high loss very well. Thus, rather the development of an open separation than a disproportionate rise of the blade tip losses is suspected as the source for the rapidly growing losses in this particular region.
Further measurements have been recorded in the cross section , 1.01D downstream the VIGV. As expected by the increased axial distance x, the wake fields are further distorted, loss peaks flattened, and the region affected by loss is widened. For this reason, the hereby presented measurements in were considered to be more revealing in this context.
3.1. Performance along the Radius
Subsequent to the previous qualitative discussion, the mass averaged mean values and are illustrated in Figure 8 to enable a quantitative assessment of the losses along the radius. The blade tip position at = 0.2 is marked by a solid, vertical line.
Each of the previously defined regions of loss dominated by either profile, wall-blade interaction or blade tip losses is still well distinguished in Figure 8a,b. Successively rising and widening losses induced by the wall-blade interactions are found between = 0.8 and 1, whereas the losses enforced by the blade tip vortex are located in the region around the blade tips at = 0.2. From 60, the losses, especially in the latter region downstream of the blade tips at the comparable low local Reynolds numbers , drastically increase. As already discussed, this severe rise is traced back to open flow separation effects. In the area of moderate profile losses at mid blade height around = 0.6 between the latterly discussed loss region of the blade tip vortex or open flow separation effects and the deploying wall-blade interactions, a stable decrease of the losses with higher radii or larger local is observed throughout all stagger angles, interrupted only by the highly mixed flow field at = 50. This effect is in good accordance with the observations of a decreasing profile loss with higher made by Händel et al. [10].
The obtained circumferential flow deflection depicted in Figure 8c naturally starts at zero in the pipe center, increases downstream the blade tip region until a flow deflection of approximately 90 is reached, and slowly decreases in the following again. Radial velocity components, in contrast, remain nearly negligible as already indicated in Figure 7. At = 50 and 0.39 0.66 an exceptional overturning of of up to 6 compared to the set blade angle is noticed. A comparable local overturning of the circumferential velocity was already observed by Kassens and Rautenberg [9] at a similar VIGV cascade geometry in a centrifugal compressor stage and stagger angles of 60 and 30. The authors ascribe this effect to the converging pipe geometry leading to a fluid transport towards smaller radii and thus an acceleration of the angular velocity. Chen et al. [18], in contrast, trace the overturning observed by Kassens and Rautenberg [9] from the vortex structure enforced by the VIGV to the development of a Rankine vortex. The outer region of the Rankine vortex is governed by a potential vortex, which represents the analytical solution of a vortex field in total pressure equilibrium without radial velocity components. The outer flow field is therefore postulated to evolve into a potential vortex whereby a local rise of the tangential velocity is explained. Neither of the two publications considers the possible influence of a solid open flow separation, however. Händel’s [19] linear cascade tests at identical profile geometries revealed a strong tendency towards flow overturning due to an open flow separation at = 50. In this respect, a deploying open flow separation represents a highly plausible explanation for the observed flow overturning.
3.2. Overall Losses
For a global assessment of the VIGV performance at varied stagger angles, Figure 9a features the mass averaged total pressure loss coefficient versus the flow deflection . It was expected from Figure 8a that the loss remains similar at = 90 and 80 and rises only moderately at = 70. A further decrease of the stagger angles increases the loss more dramatically. This trend was especially indicated by the significant losses in the blade tip region of Figure 8b. A progressive shortfall of compared to the blade angle 90 is moreover observed in Figure 9a. The discrepancy is partly due to the observed underturning at the blades and to the natural lack of deflection in the blow hole. At = 50, this deficit is partly counteracted by the previously described overturning at parts of the blade height.
To finally evaluate the efficiency of the achieved flow deflection, the total pressure loss coefficient per generated flow deflection is illustrated in Figure 9b. Due to the singularity at = 0, the field measurement at = 90 is thereby not considered. At = 80 and 70, the index reveals moderate, relative losses in each case. At further decreased stagger angles, a progressive rise is observed. In alignment with the previous recommendation of Händel et al. [10], the utilization of the VIGV cascade is not recommended at stagger angles below 60 to maintain an adequate vane and compressor efficiency.
4. Conclusions and Outlook
The objective of the present work is the evaluation of the losses generated by a state-of-the-art VIGV at varied stagger angles. Due to the annular geometry of the test section, both profile and secondary flow effects induced by wall-blade interactions and open blade tips were reproduced and metrologically recorded.
In order to deliver reliable data, an advanced correlation of the pressure loss measured in the wake to in the unaffected flow field has been introduced. Compared to a previous approach, not only radial gradients of caused by the wall boundary layer, but also circumferential deviations reaching up to at least = 2.5%, are thereby eliminated.
Based on the findings of the wake fields exceeding the total working range of the investigated VIGV, two suggestions are made in the following to minimize dominant loss regions and to ultimately increase the efficient operating range of the vane and the associated compressor:
- From = 60 on, an increasing region of notable losses was observed downstream the region of the blade tips. Previous linear cascade measurements at an identical profile geometry by Händel et al. [10] already proved the tendency of the profile towards an open flow separation at the referred stagger angle and comparable local Reynolds numbers. Therefore, the reconsideration of the current blade design is recommended to ensure attached flow at further decreased stagger angles. Especially split blade geometries as investigated in linear cascade measurements by Bross and Stark [7] and Händel et al. [8] show promise to extend the efficient operational range of the annular VIGV.
- Moreover, the blocking of the center by a hub is suggested. Low local Reynolds numbers are hence prevented by accelerated flow conditions and the elimination of short chord lengths in the core region. Thus, lower profile losses as they were observed along higher , a certain shift of the devastating open flow separation towards lower stagger angles , and the suppression of the blade-tip vortex are expected. Instead of the blade tip losses, blade-hub flow interactions and tip gap effects will induce new losses. It is to be investigated if the expected benefits prevail with the induced hub-blade and tip clearance losses.
Author Contributions
Conceptualization, R.G.F., C.W. and R.N.; methodology, software and validation, R.G.F.; formal analysis, R.G.F. and R.N.; investigation, R.G.F.; resources, R.N. and C.W.; data curation, R.G.F. and R.N.; writing—original draft preparation, R.G.F.; review and editing, R.G.F. and R.N.; visualization, R.G.F.; supervision, C.W. and R.N.; project administration, R.N.; funding acquisition, C.W. and R.N. All authors have read and agreed to the published version of the manuscript.
Funding
This research was funded by the German Federal Ministry of Education and Research (Kopernikus project—SynErgie). The test specimen was kindly provided by the MAN Energy Solutions SE.
Institutional Review Board Statement
Not applicable.
Informed Consent Statement
Not applicable.
Data Availability Statement
The non-dimensionalized data presented in this study is available on request from the corresponding author.
Acknowledgments
The authors gratefully acknowledge the financial support of the Kopernikus project SynErgie by the German Federal Ministry of Education and Research (BMBF) and the project supervision by the project management organization Projektträger Jülich (PtJ).
Conflicts of Interest
The authors declare no conflict of interest. The funders had no role in the design of the study; in the collection, analyses, or interpretation of data; in the writing of the manuscript; or in the decision to publish the results.
Abbreviations
| Symbols | |
| Measurement plane i [-] | |
| c | Chord length [m] |
| Mach number [-] | |
| p | Pressure [Pa] |
| q | Dynamic pressure [Pa] |
| r | Radial axis [m] |
| r relative to local pipe radius [-] | |
| Integral Reynolds number [-] | |
| Local Reynolds number [-] | |
| t | Pitch [] |
| x | Pipe center line axis [m] |
| Stagger angle [] | |
| Circumferential flow deflection [] | |
| Pipe circumferential axis [] | |
| Angular flow deflection [] | |
| Total pressure loss coefficient [-] | |
| Sub-/Superscripts | |
| 1, 2 | Without or with effect of VIGV |
| D | Inlet diameter of VIGV |
| i | Measurement without blading |
| o | Wake measurement incl. blading |
| Offset | |
| Integral reference at | |
| t | Total value |
| Mass averaged over , r | |
| Acronyms | |
| DMS | Demand side management |
| VIGV | Variable inlet guide vane |
| IGCC | Integrally geared centrifugal compressor |
References
- Gellings, C.W. The Concept of Demand-Side Management for Electric Utilities. Proc. IEEE 1985, 73, 1468–1470. [Google Scholar] [CrossRef]
- Häfner, L. Demand Side Management: Entscheidungsunterstützungssysteme für die flexible Beschaffung von Energie unter integrierten Chancen- und Risikoaspekten. HMD. Theor. Und Prax. Der Wirtsch. 2018, 55, 627–645. [Google Scholar] [CrossRef]
- Sauer, A.; Abele, E.; Buhl, H.U. Energieflexibilität in der Deutschen Industrie; Frauenhofer Verlag: Stuttgart, Germany, 2019; ISBN 978-3-8396-1479-2. [Google Scholar]
- Beaty, P.J.; Eisele, K.; Maceyka, T.D.; Schwarz, C. Integrally Geared API 617 Process Gas Compressors; Texas A&M University, Turbomachinery Laboratories: College Station, TX, USA, 2000; pp. 239–246. [Google Scholar] [CrossRef]
- Stark, U.; Böhle, M. Theoretische und experimentelle Untersuchungen an ungestaffelten Gittern aus Profilen mit mechanischen Klappen. Forsch. Im Ingenieurwesen 1990, 56, 169–182. [Google Scholar] [CrossRef]
- Mohseni, A.; Goldhahn, E.; Van den Braembussche, R.A.; Seume, J.R. Novel IGV Designs for Centrifugal Compressors and Their Interaction with the Impeller. ASME J. Turbomach. 2012, 134, 021006. [Google Scholar] [CrossRef]
- Bross, S.; Stark, U. Entwicklung neuer Schaufelgitter aus Profilen variabler Geometrie zum Einsatz in Leiträdern drallgerelgeter Turbomaschinen-Teil I. Forsch. Im Ingenieurwesen 1994, 60, 120–132. [Google Scholar] [CrossRef]
- Händel, D.; Niehuis, R.; Klausmann, J. Aerodynamic Investigation of an Advanced VIGV Design of Adjustable Geometry for Very High Flow Turning; ASME Turbo Expo: Montreal, QC, Canada, 2015. [Google Scholar] [CrossRef]
- Kassens, I.; Rautenberg, M. Flow Measurements Behind the Inlet Guide Vane of a Centrifugal Compressor; ASME Turbo Expo: Stockholm, Sweden, 1998. [Google Scholar] [CrossRef] [Green Version]
- Händel, D.; Niehuis, R.; Rockstroh, U. Aerodynamic Investigation of a Variable Inlet Guide Vane with Symmetric Profile; ASME Turbo Expo: Düsseldorf, Germany, 2014. [Google Scholar] [CrossRef]
- Händel, D.; Rockstroh, U.; Niehuis, R. Experimental Investigation of Transition and Seperation Phenomena on an Inlet Guide Vane with Symmetric Profile at Different Stagger Angles and Reynolds Numbers. In Proceedings of the International Symposium on Transport Phenomena and Dynamics of Rotating Machinery, Honolulu, HI, USA, 24–28 February 2014. FR305. [Google Scholar]
- Coppinger, M.; Swain, E. Performance Prediction of an Industrial Centrifugal Compressor Inlet Guide Vane System. Proc. Inst. Mech. Eng. 2000, 214. [Google Scholar] [CrossRef]
- Frank, R.; Wacker, C.; Niehuis, R. A New Test Facility for Advanced Testing of Variable Inlet Guide Vanes; MTT Measuring Techniques in Turbomachinery; 2020, MTT2520A18. Available online: https://www.meastechturbo.com/paper-archives/mtt2520-santorini-2020 (accessed on 16 July 2021).
- Amecke, J. Auswertung von Nachlaufmessungen an Ebenen Schaufelgittern; Messbericht 67 A 49; AVA Göttingen: Gottingen, Germany, 1967. [Google Scholar]
- Sieverding, C.H. Recent Progress in Understanding of Basic Aspects of Secondary Flows in Turbine Blade Passages. ASME J. Eng. Gas Turbines Power 1985, 107. [Google Scholar] [CrossRef]
- Denton, J.D. Loss Mechanisms in Turbomachinery. ASME J. Turbomach. 1993, 115, 621–656. [Google Scholar] [CrossRef]
- Green, S.I. Wing Tip Vortices. In Fluid Mechanics and Its Applications; Springer: Dordrecht, The Netherlands, 1995; Volume 30. [Google Scholar]
- Chen, Y.N.; Hagelstein, D.; Kassens, I.; Hasermann, H.; Haupt, U.; Rautenberg, M. Overshoot of the Rankine Vortex Formed in the Flow Field Behind the Inlet Guide Vane of Centrifugal Compressors; ASME Turbo Expo: Indianapolis, IN, USA, 1999. [Google Scholar] [CrossRef] [Green Version]
- Händel, D. Experimentelle Untersuchung und Weiterentwicklung eines Variablen Eintrittsleitapparates für die Vordrallregelung in Turbomaschinen; Verlag Dr. Hut: Munich, Germany, 2018; ISBN 978-38439-3874-7. [Google Scholar]
Figure 1.
Design of the VIGV and the measurement section.

Figure 2.
Scheme of the cascade in a plane of constant radius.

Figure 3.
Influence of the tapered blade design and inflow velocity distribution on .

Figure 4.
Inflow correlation at = 90 over 360 at selected radii.

Figure 5.
Stretching of the flow field at .

Figure 6.
Approach of the circumferential correlation at the radius r.

Figure 7.
Wake field measurements from to [I: profile losses, II: wall-blade interaction losses, III: blade tip losses, IV: blow hole flow, V: suspected open flow separation].
Figure 7.
Wake field measurements from to [I: profile losses, II: wall-blade interaction losses, III: blade tip losses, IV: blow hole flow, V: suspected open flow separation].

Figure 8.
Radial loss and deflection assessment.

Figure 9.
Overall loss assignment.

Publisher’s Note: MDPI stays neutral with regard to jurisdictional claims in published maps and institutional affiliations. |
© 2021 by the authors. Licensee MDPI, Basel, Switzerland. This article is an open access article distributed under the terms and conditions of the Creative Commons Attribution (CC BY-NC-ND) license (https://creativecommons.org/licenses/by-nc-nd/4.0/).
Share and Cite
MDPI and ACS Style
Frank, R.G.; Wacker, C.; Niehuis, R. Loss Characterization of a Conventional Variable Inlet Guide Vane. Int. J. Turbomach. Propuls. Power 2021, 6, 30. https://0-doi-org.brum.beds.ac.uk/10.3390/ijtpp6030030
AMA Style
Frank RG, Wacker C, Niehuis R. Loss Characterization of a Conventional Variable Inlet Guide Vane. International Journal of Turbomachinery, Propulsion and Power. 2021; 6(3):30. https://0-doi-org.brum.beds.ac.uk/10.3390/ijtpp6030030
Chicago/Turabian StyleFrank, Roman G., Christian Wacker, and Reinhard Niehuis. 2021. "Loss Characterization of a Conventional Variable Inlet Guide Vane" International Journal of Turbomachinery, Propulsion and Power 6, no. 3: 30. https://0-doi-org.brum.beds.ac.uk/10.3390/ijtpp6030030