Article

Experimental Study on Flow Behavior of Unshrouded Impeller Centrifugal Pumps under Inlet Air Entrainment Condition

1
National Research Center of Pumps, Jiangsu University, Zhenjiang 212013, China
2
LMFL, FRE CNRS 3723, Arts et Métiers Paris Tech, 59046 Lille, France
3
Changsha Dewater Machanical Technology Co., Ltd., Changsha 410100, China
*
Author to whom correspondence should be addressed.
Int. J. Turbomach. Propuls. Power 2021, 6(3), 31; https://0-doi-org.brum.beds.ac.uk/10.3390/ijtpp6030031
Submission received: 9 May 2021 / Revised: 22 July 2021 / Accepted: 26 July 2021 / Published: 28 July 2021

Abstract

:
Results on overall pump head and efficiency performance, pressure pulsation and high speed camera visualization of flow patterns behavior are presented for different inlet air-water void fractions at a given rotational speed. With the increase of inlet void fractions and decrease of the flow rates, the size of bubbles increase and tend to agglomerate in specific impeller passage locations along the blade chord. The starting point of pump breakdown is related to a strong inward reverse flow occurring in a specific location near the shroud gap of the impeller and volute tongue region. Using a constant air void fraction value of 2%, pressure pulsation frequency results are analyzed in relation with local flow mixture patterns and flow rate modification.

1. Introduction

Centrifugal pumps, as one of the core components of fluid transfer, are widely used in various sectors such as nuclear power, petrochemistry and oil extraction. In engineering practice of above field, it is sometimes often impossible to avoid air entrainment into the fluid delivery system. Air entrainment as well as internal vapor generation by cavitation is known as being detrimental and critical to the operation of centrifugal pumps, since decrease the pump performance and take negative influences on the plant system [1,2]. Several studies have been made, investigating the theoretical pump performance and the flow behavior of centrifugal pumps under gas-liquid two-phase flow conditions [3,4,5,6]. Due to the rapid development of new measurement and Computational Fluid Dynamics (CFD) technologies, pump performance deterioration caused by air entrainment problem has been better understood [7,8,9,10,11]. However, investigation on unsteady flow-induced characteristics of the centrifugal pump under air entrainment conditions hasn’t been treated with enough attention. Experimental flow visualization studies have been conducted in Jiangsu University together with pump performance analysis for centrifugal pumps under inlet air- water two-phase flow [12]. It was found that a particular two-phase flow pattern observed near the shroud gap between the impeller and volute tongue area is closely related to the starting point of the pump break down point. Consequently, the present paper intends to reveal the unsteady flow-induced characteristics of centrifugal pumps under inlet air entrainment condition by combining pump performance tests, inner flow visualization and pressure pulsation measurements.

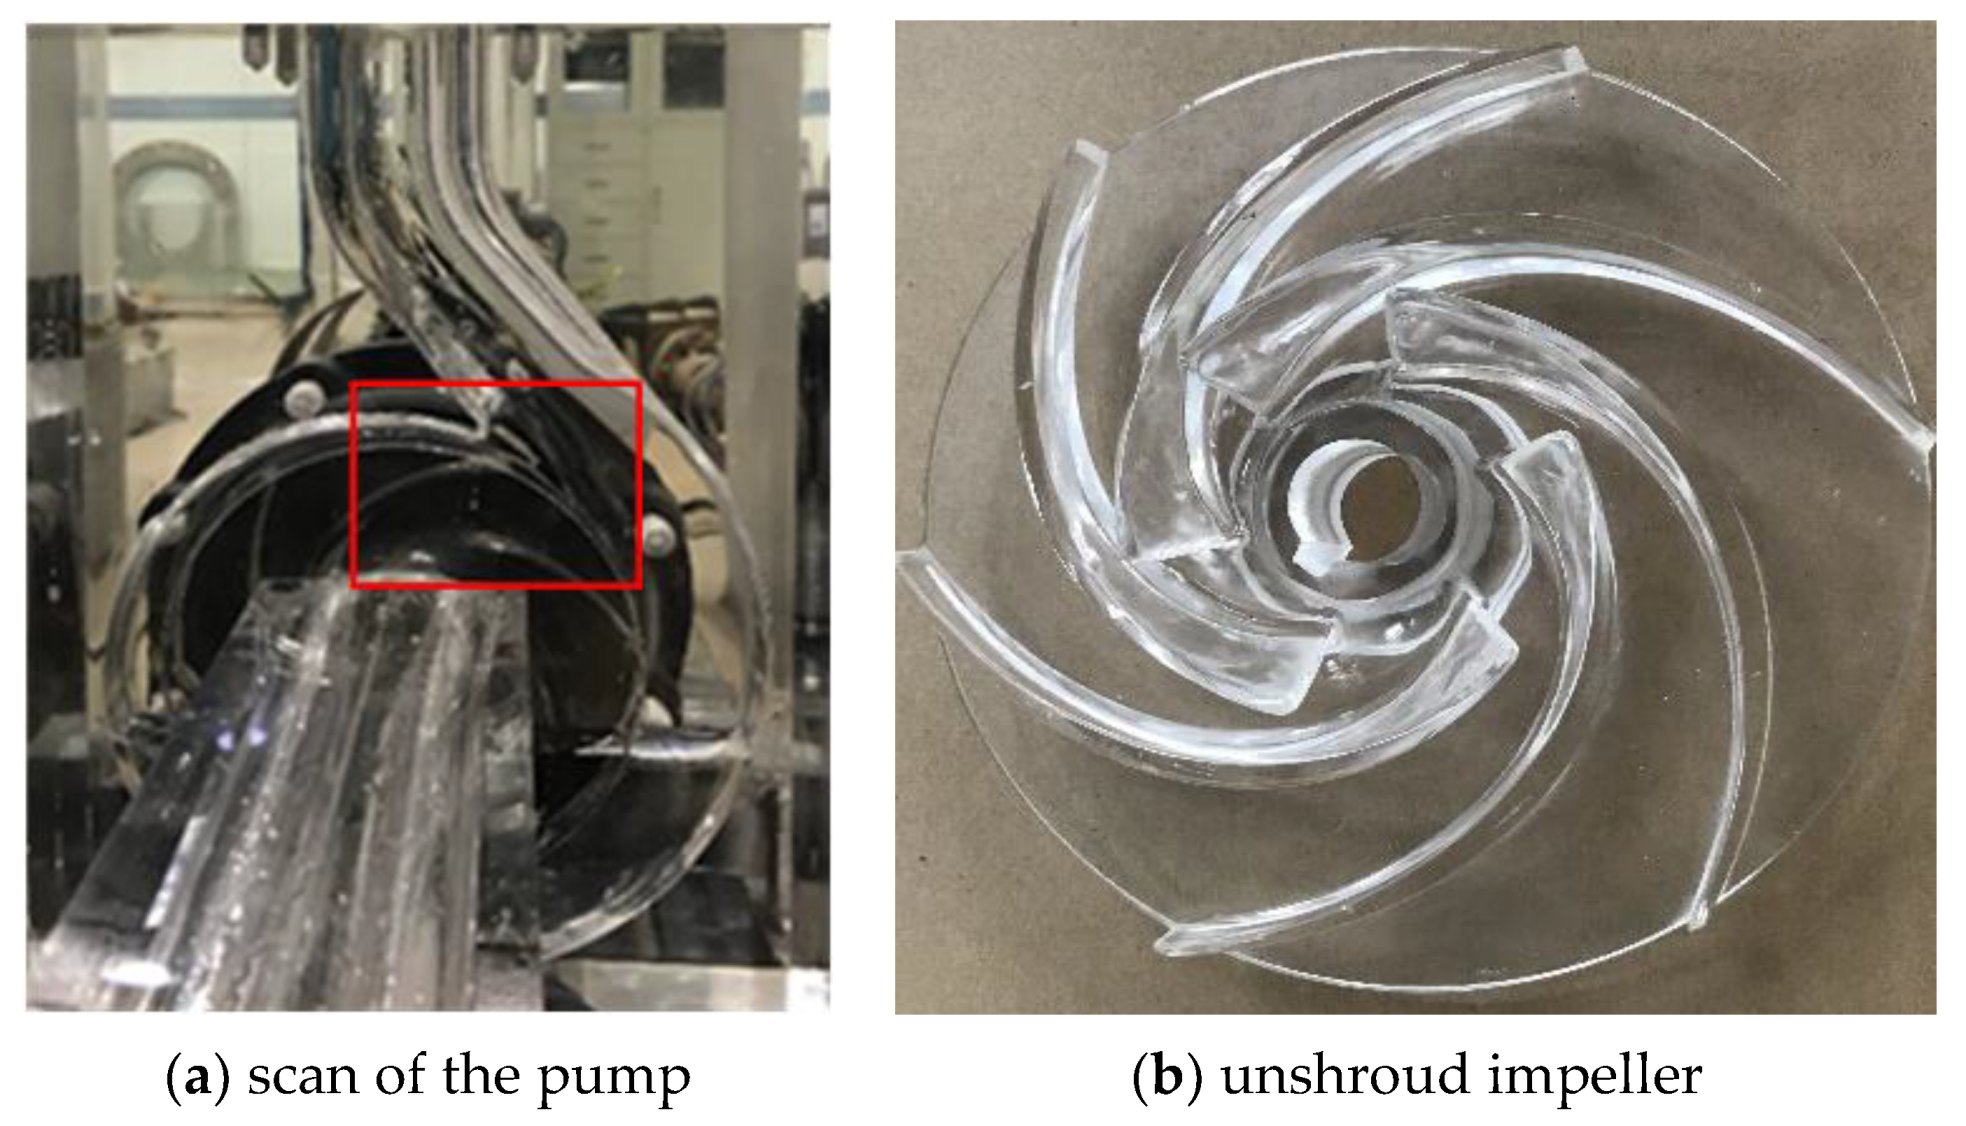
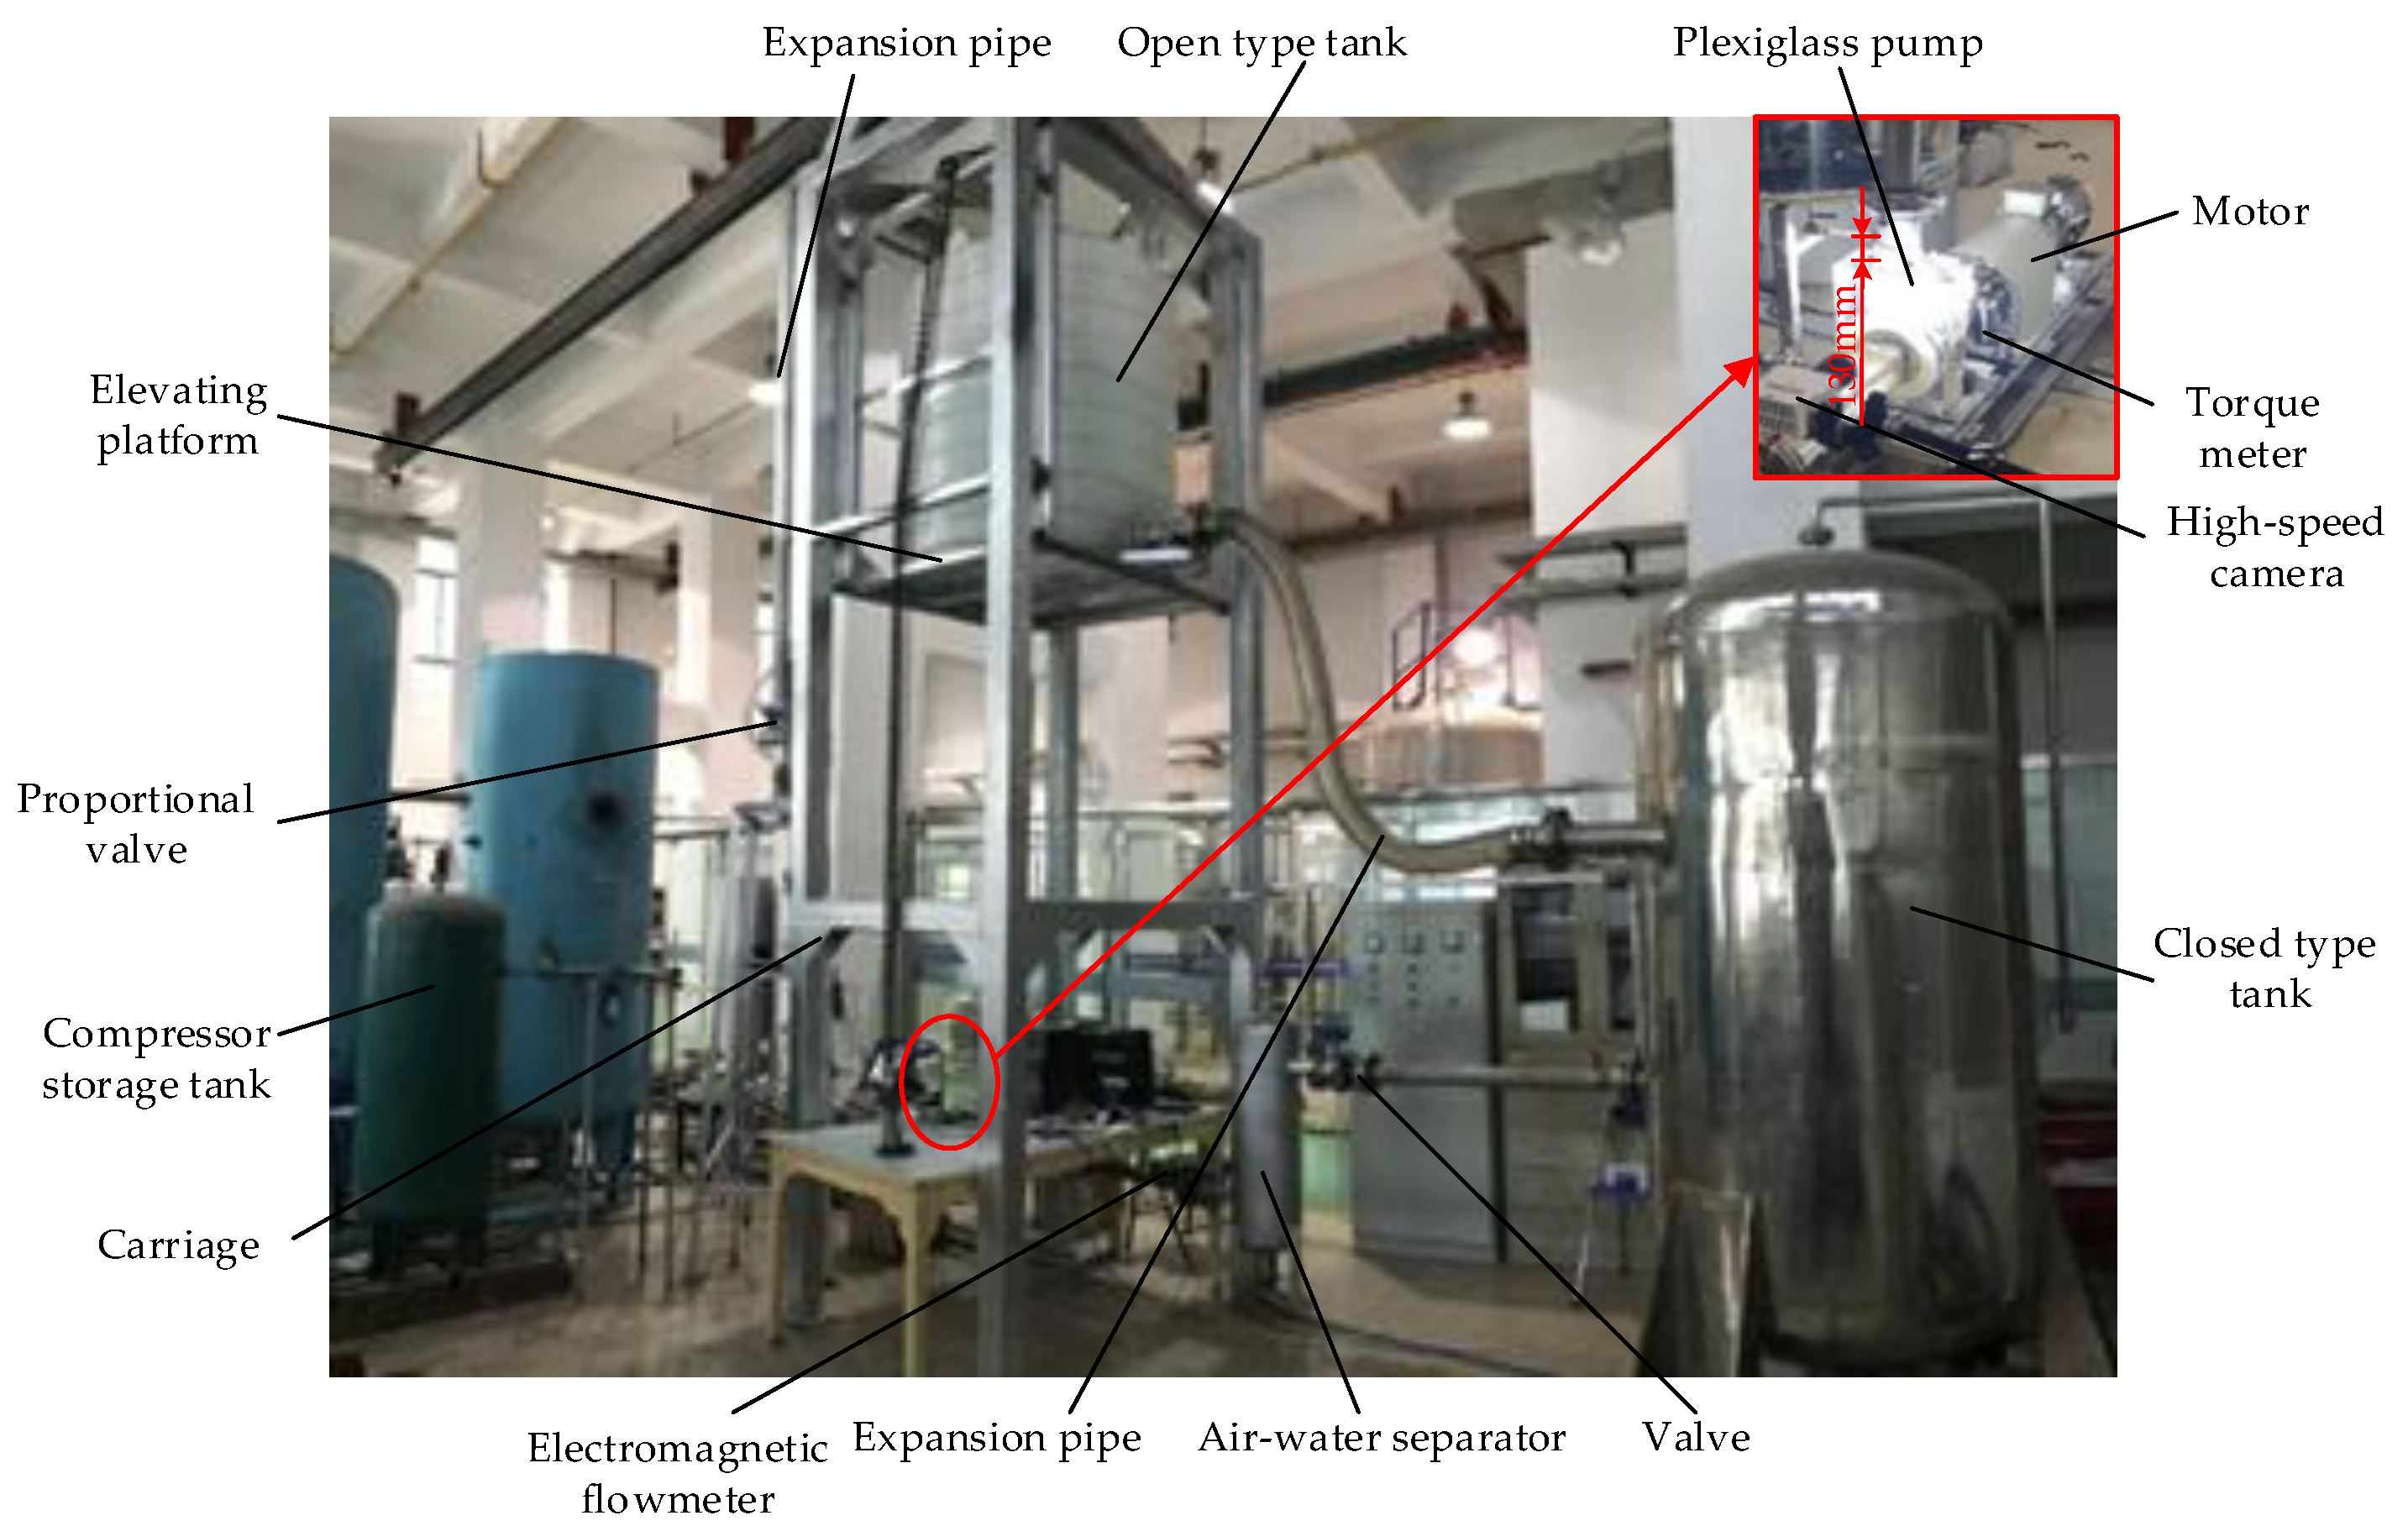
2. Experimental Set-Up

The pump model used for the present investigation has a transparent plexiglass impeller with a semi-open unshroud three-dimensional blade and a rectangular section volute, as shown in Figure 1. Pump main geometrical parameters are given in Table 1. Rotational speed has been reduced to 1000 rpm (compared with the normal shroud impeller one of 2900 rpm) to avoid impeller failure due to plexiglass. An open-type test loop, shown in Figure 2, is built to assess the experiment. Ambient atmospheric pressure is close to 101,325 Pa (water level reaches 2 m inside the inlet tank) and temperature is about 298.15 K. Pump performance, such as head and global efficiency values, were obtained in accordance with ISO 9906:2012 [13]. Stable air mass flow rate is measured and controlled by a micro-electro-mechanical flow sensor system (Bürkert 8107) at ambient atmospheric conditions, while the flow rate of pure water is measured using an electromagnetic flow meter placed upstream the injection device (mixer). More details can be found in Si et al. [12]. For low inlet water flow rates, slug flow mixture configuration can be observed inside the horizontal inlet pipe, but after entering the impeller, bubbles are gradually broken up under the rotating action of the impeller leading edge, achieving a quasi-homogeneous air-water mixing.

3. Experimental Uncertainties

Overall performance uncertainty is within ±2% for the water flow rate (device measuring range: 0–50 m3/h) and ±3.5% for head increase, including device accuracies.
For unsteady pressure measurements, the following parameters are used.
U = X S 2 + Δ i n s 2
U r = U X ¯ × 100 %
where Xs is the standard deviation, Δ i n s is the sensor error, set at 300 Pa, U is the total uncertainty and X   ¯ is the average value.
According to the basic working conditions of this test measurement, the relative uncertainty of each measurement result is shown in Table 2. The relative uncertainty of the test results of the present centrifugal pump are all within 5%.

4. Results and Discussion

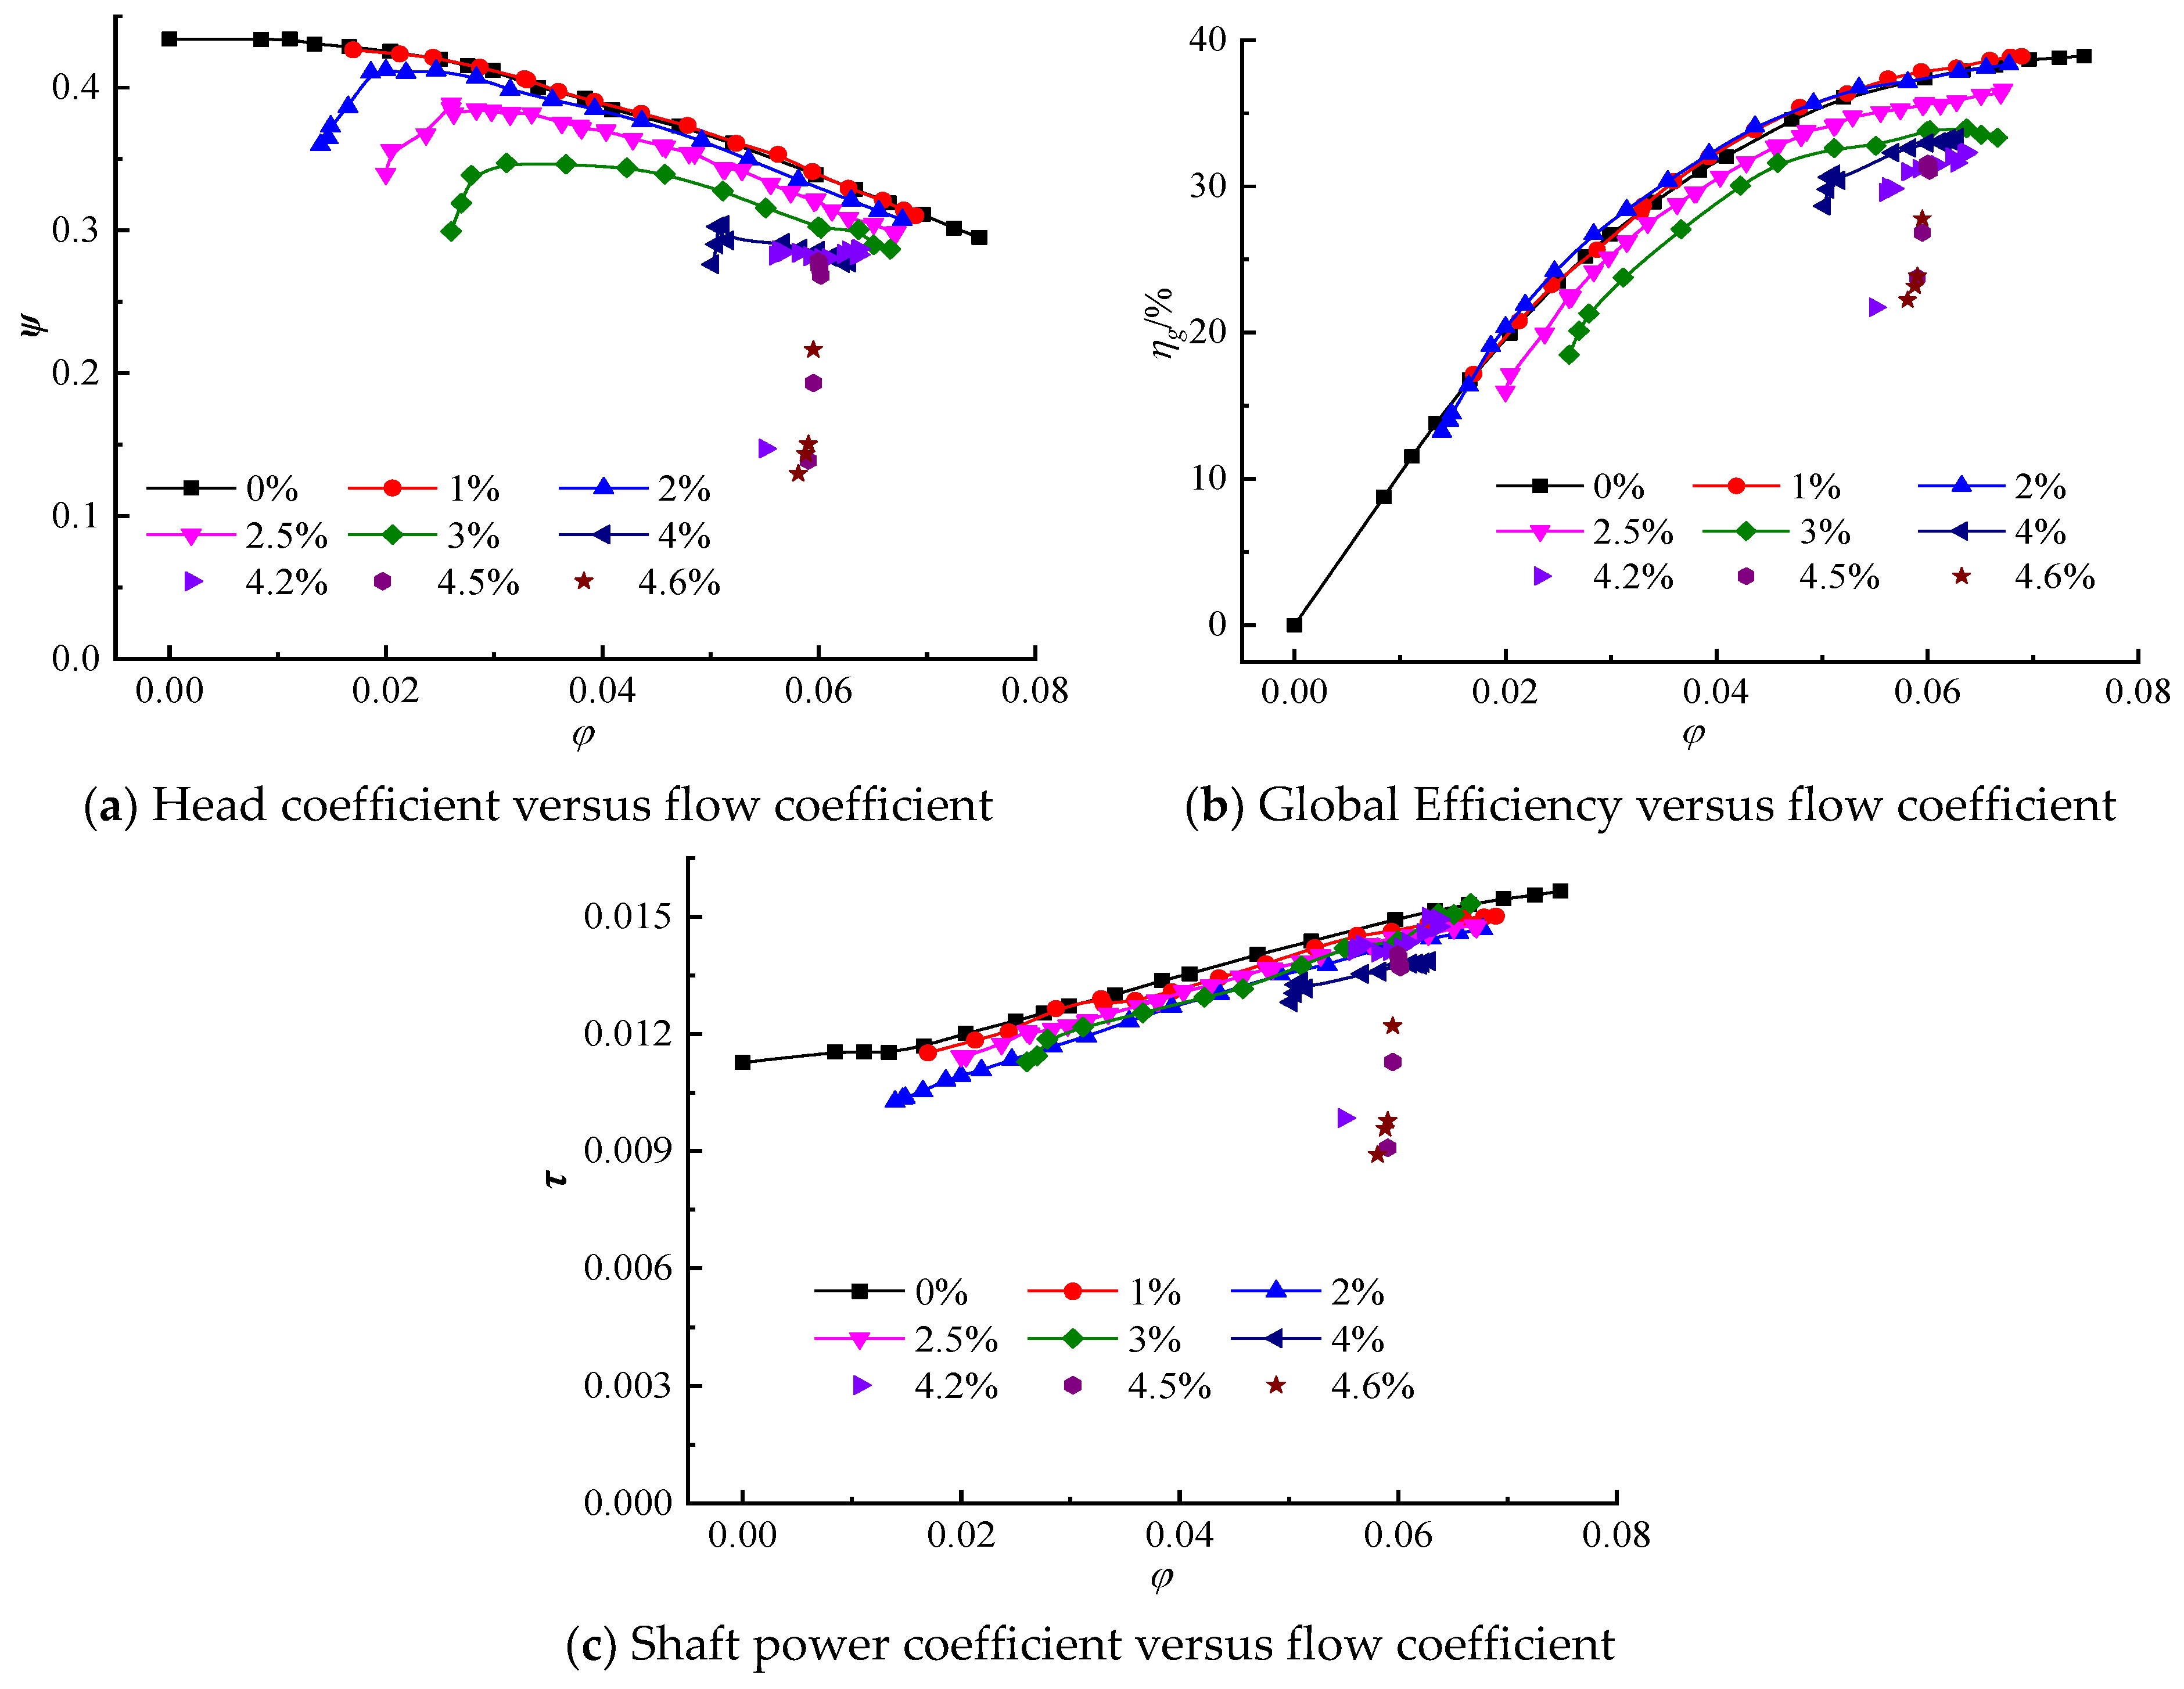
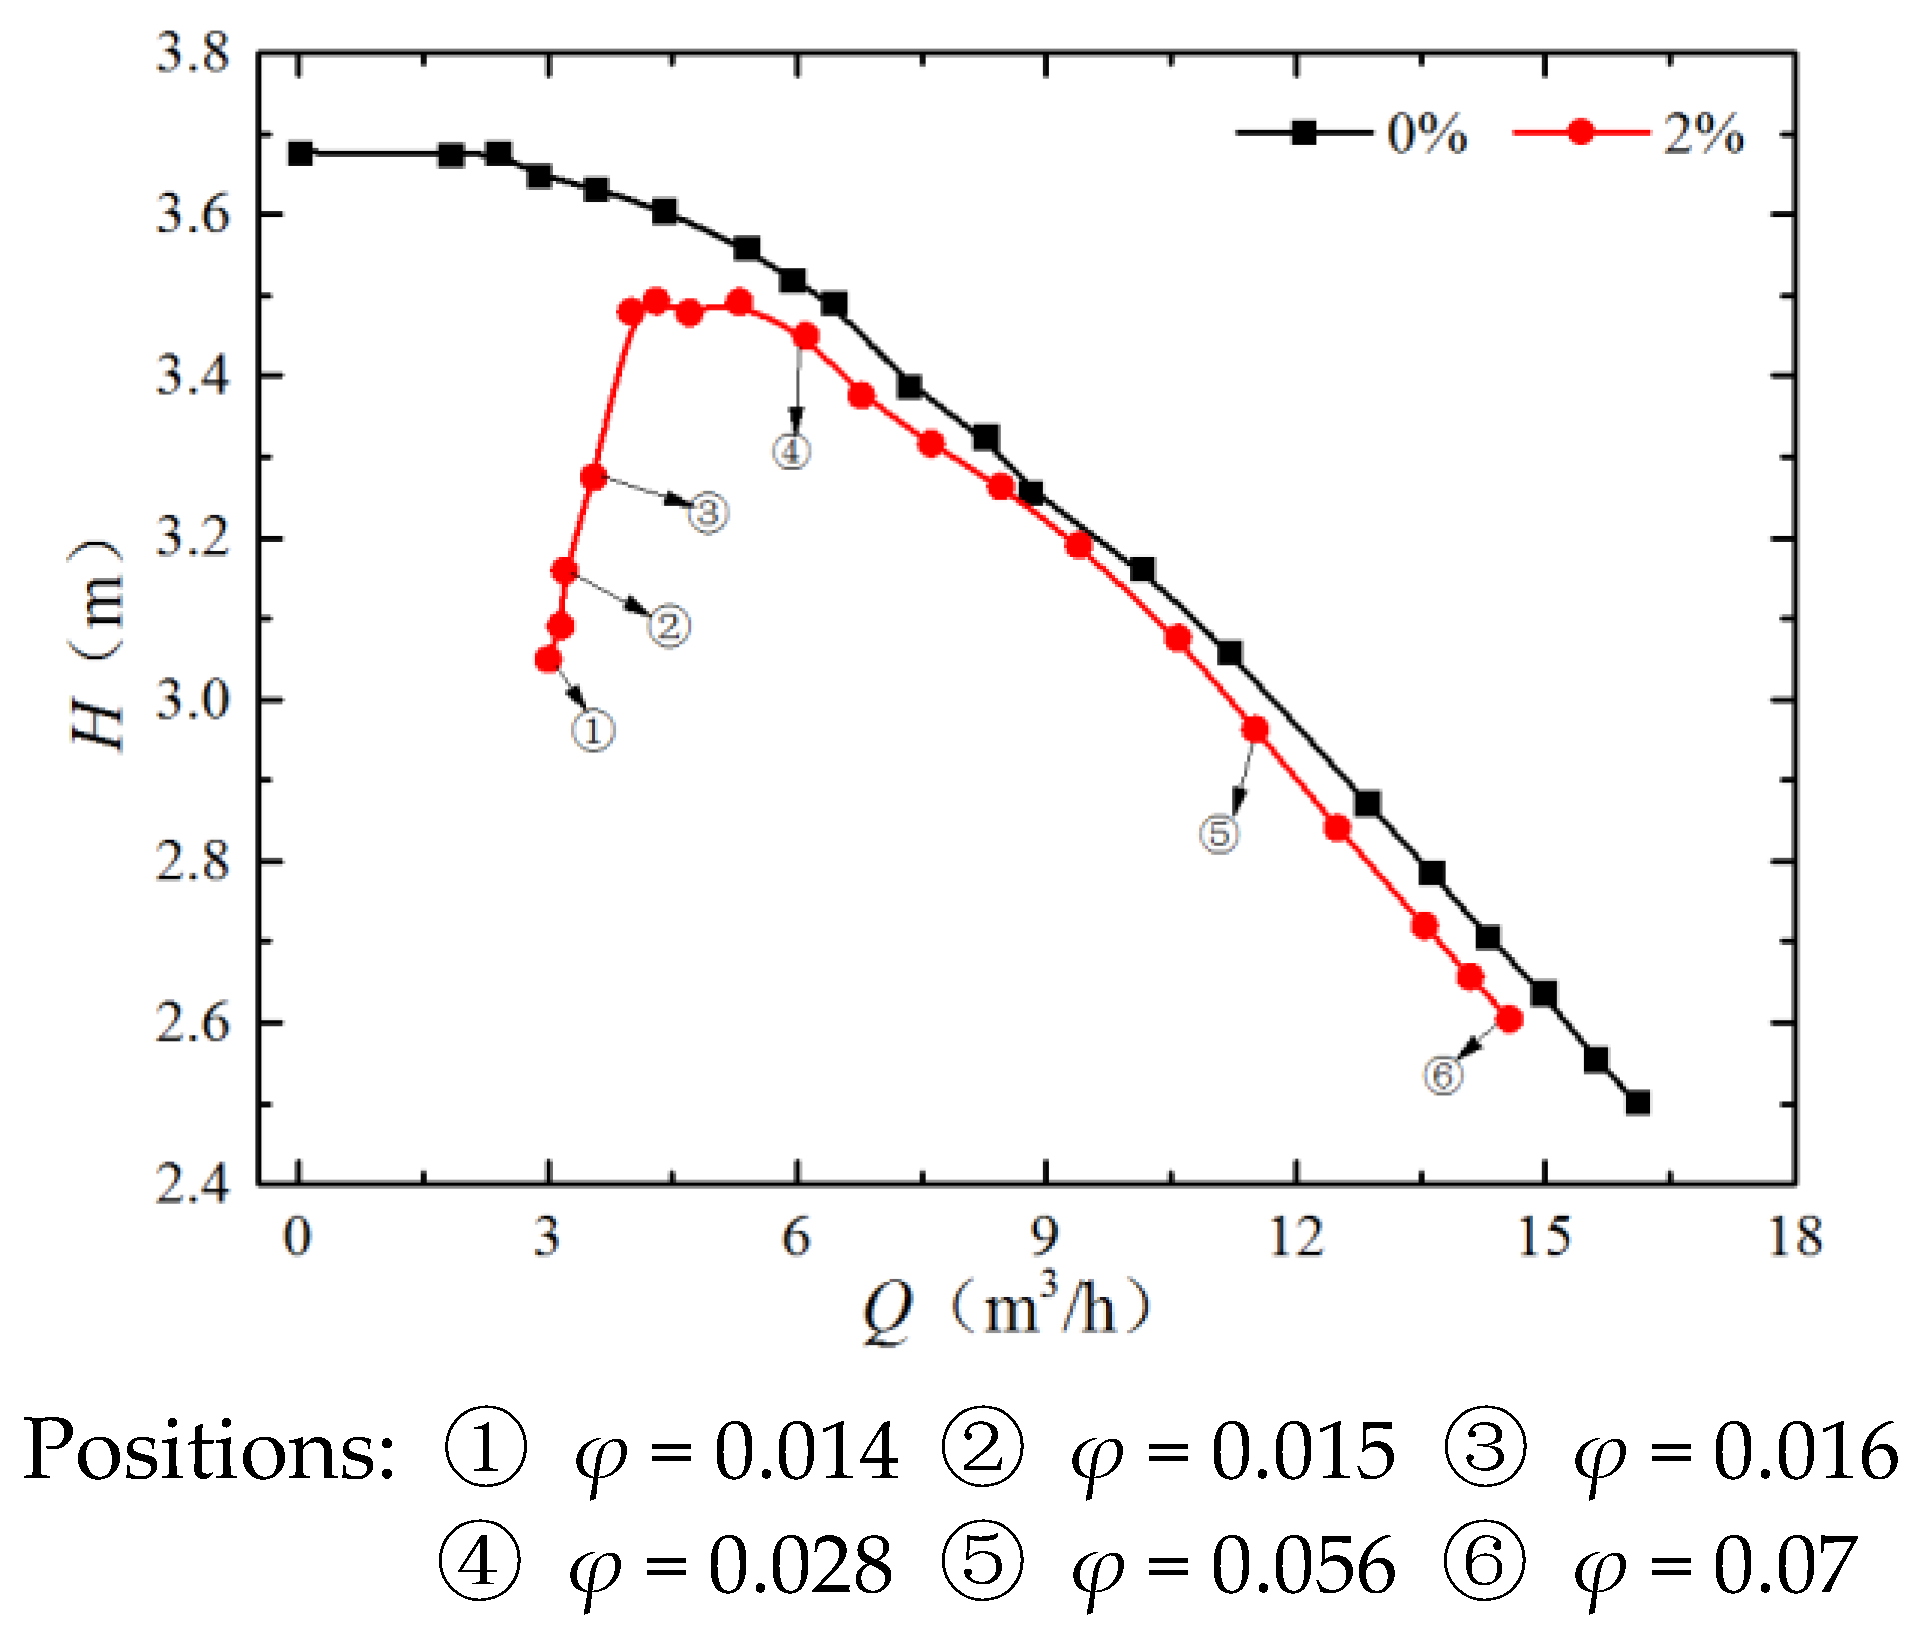
4.1. Pump Performance

Figure 3 shows all performance curves of the pump model with different inlet air void fraction at 1000 rpm, respectively, head coefficient (Figure 3a), global efficiency (Figure 3b) and shaft power coefficient (Figure 3c). The maximum flow coefficient that can be reached is below the nominal value of 0.1, due to large loop loss that limits the maximum flow coefficient to 0.08.
Maximum efficiency value is small compared with existing pumps having the same specific speed and specific radius. This pump model is derived from a shrouded pump made of stainless steel which reaches a global efficiency of 0.70. To perform visualizations, it has been manufactured using plexiglass with an unshrouded version. Tip clearance gap has been found bigger than expected; this gap is about 0.8 to 1 mm so that the gap ratio related to the outlet blade width is about 8%. In addition, the gap cannot be easily controlled during operation. It is believed that its value may increase due to plexiglass deformation due to rotation and pressure effects and consequently affects the efficiency.
As for any pump design, the water flow range of the pump decreases as the inlet volume of air increases. The maximum air void fraction value the pump can work before shut-down is 4.6% for the present rotational speed, the corresponding water volume flow rate being equal to 13.0 m3/h. The pump performance is almost unaffected compared with pure water when the inlet air void fraction is 1%, which means the pump is not sensitive to such gas content for a wide range of water flow rate. When the inlet air void fraction reaches 2%, the pump performance drops sharply at small flow coefficient (φ < 0.02), while the performance curve remains parallel to the pure water condition for higher flow coefficients. For inlet void fraction values higher than 2%, the pump model becomes more sensitive to the incoming air-water mixture; the higher the void fraction, the more pronounced pump degradation becomes. Under high flow coefficient values, the pump performance drops sharply and the flow coefficient drops down up to φ = 0.06. Compared with the pure water condition, when operating in the range of 4.2–4.6% inlet air void fraction, the head will decrease by 30–53%, global efficiency will decrease by 26–50%. It is found that the pump cannot work normally for long time when operating at this critical unstable air content range and that flow passage can be rapidly blocked. The head coefficient delivered by the pump suddenly drops and exhibits a vertical line.

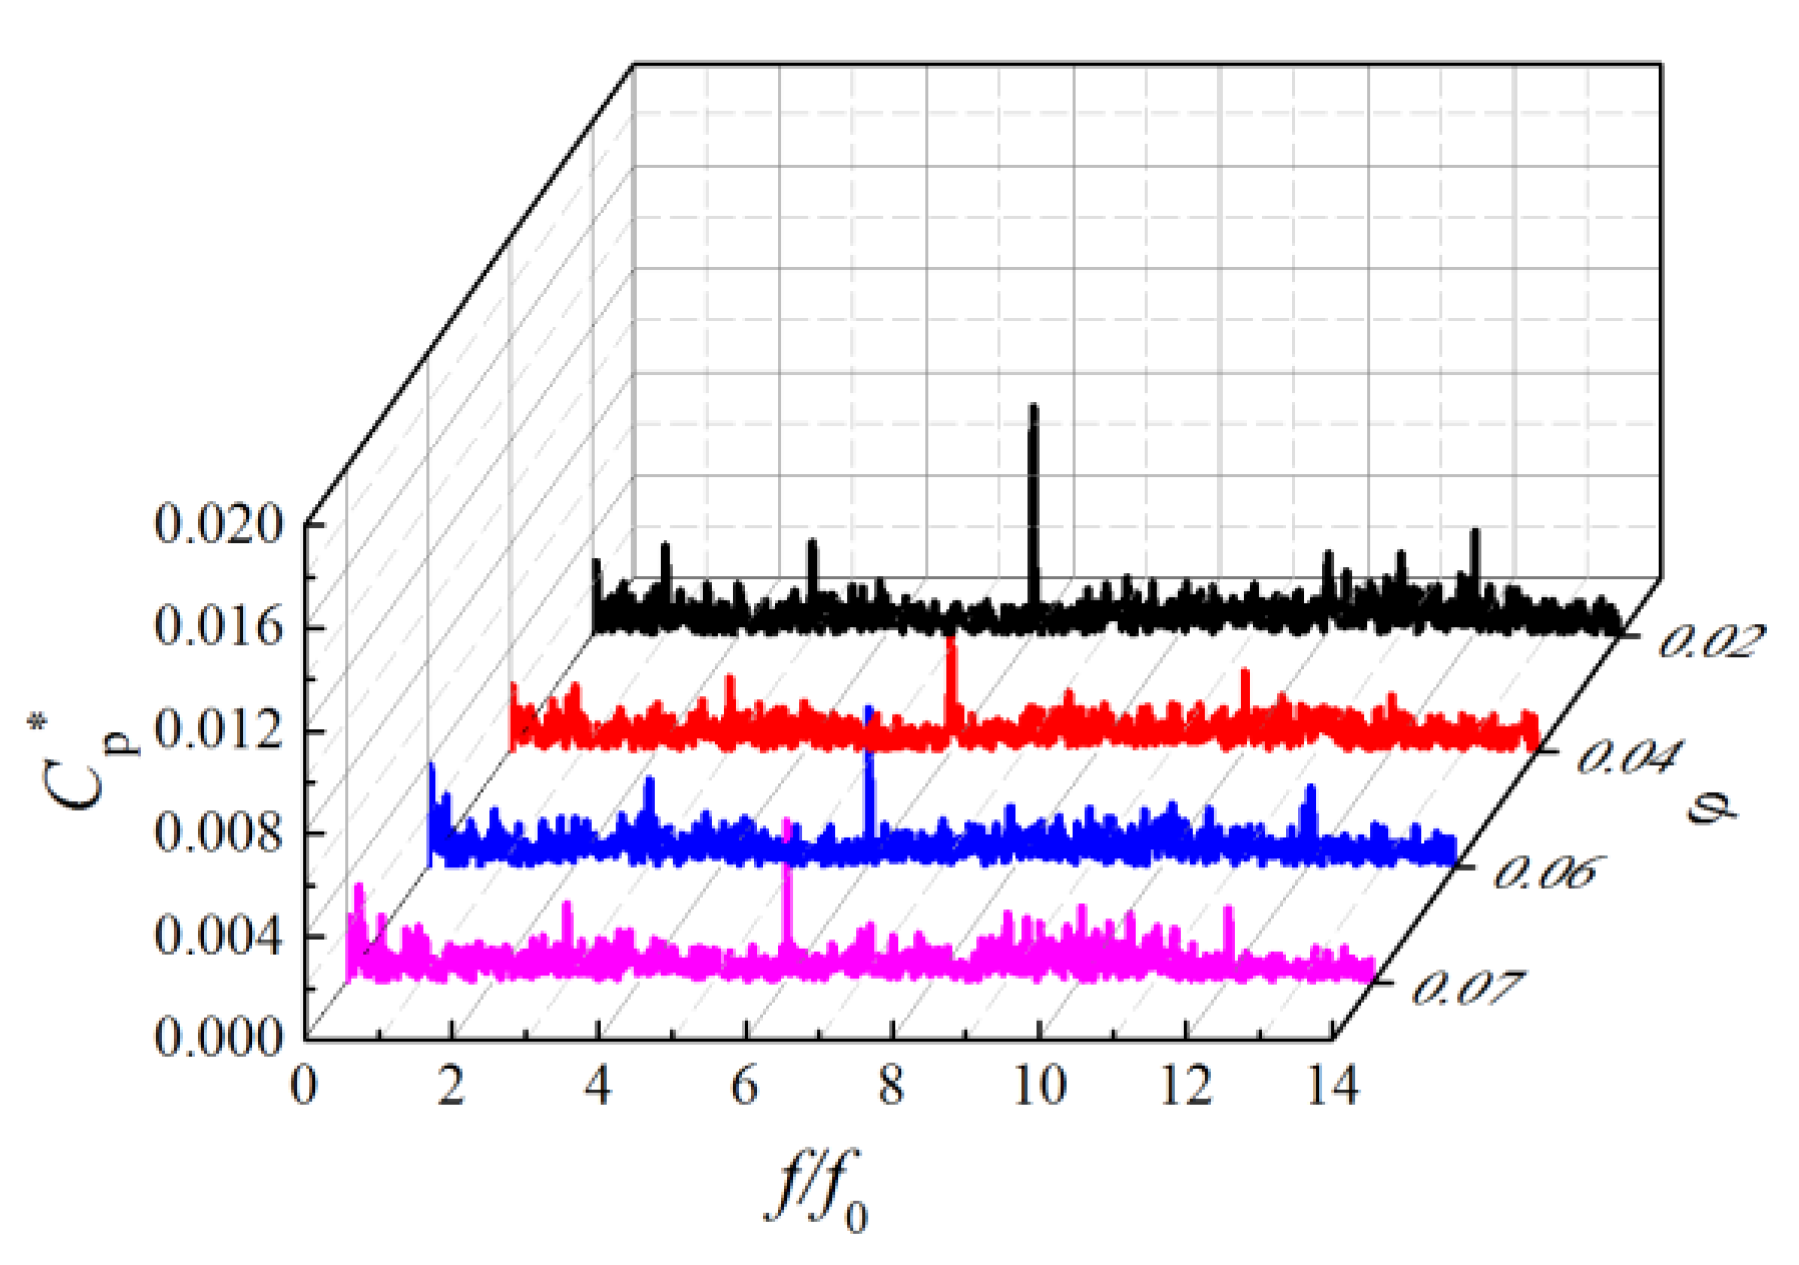
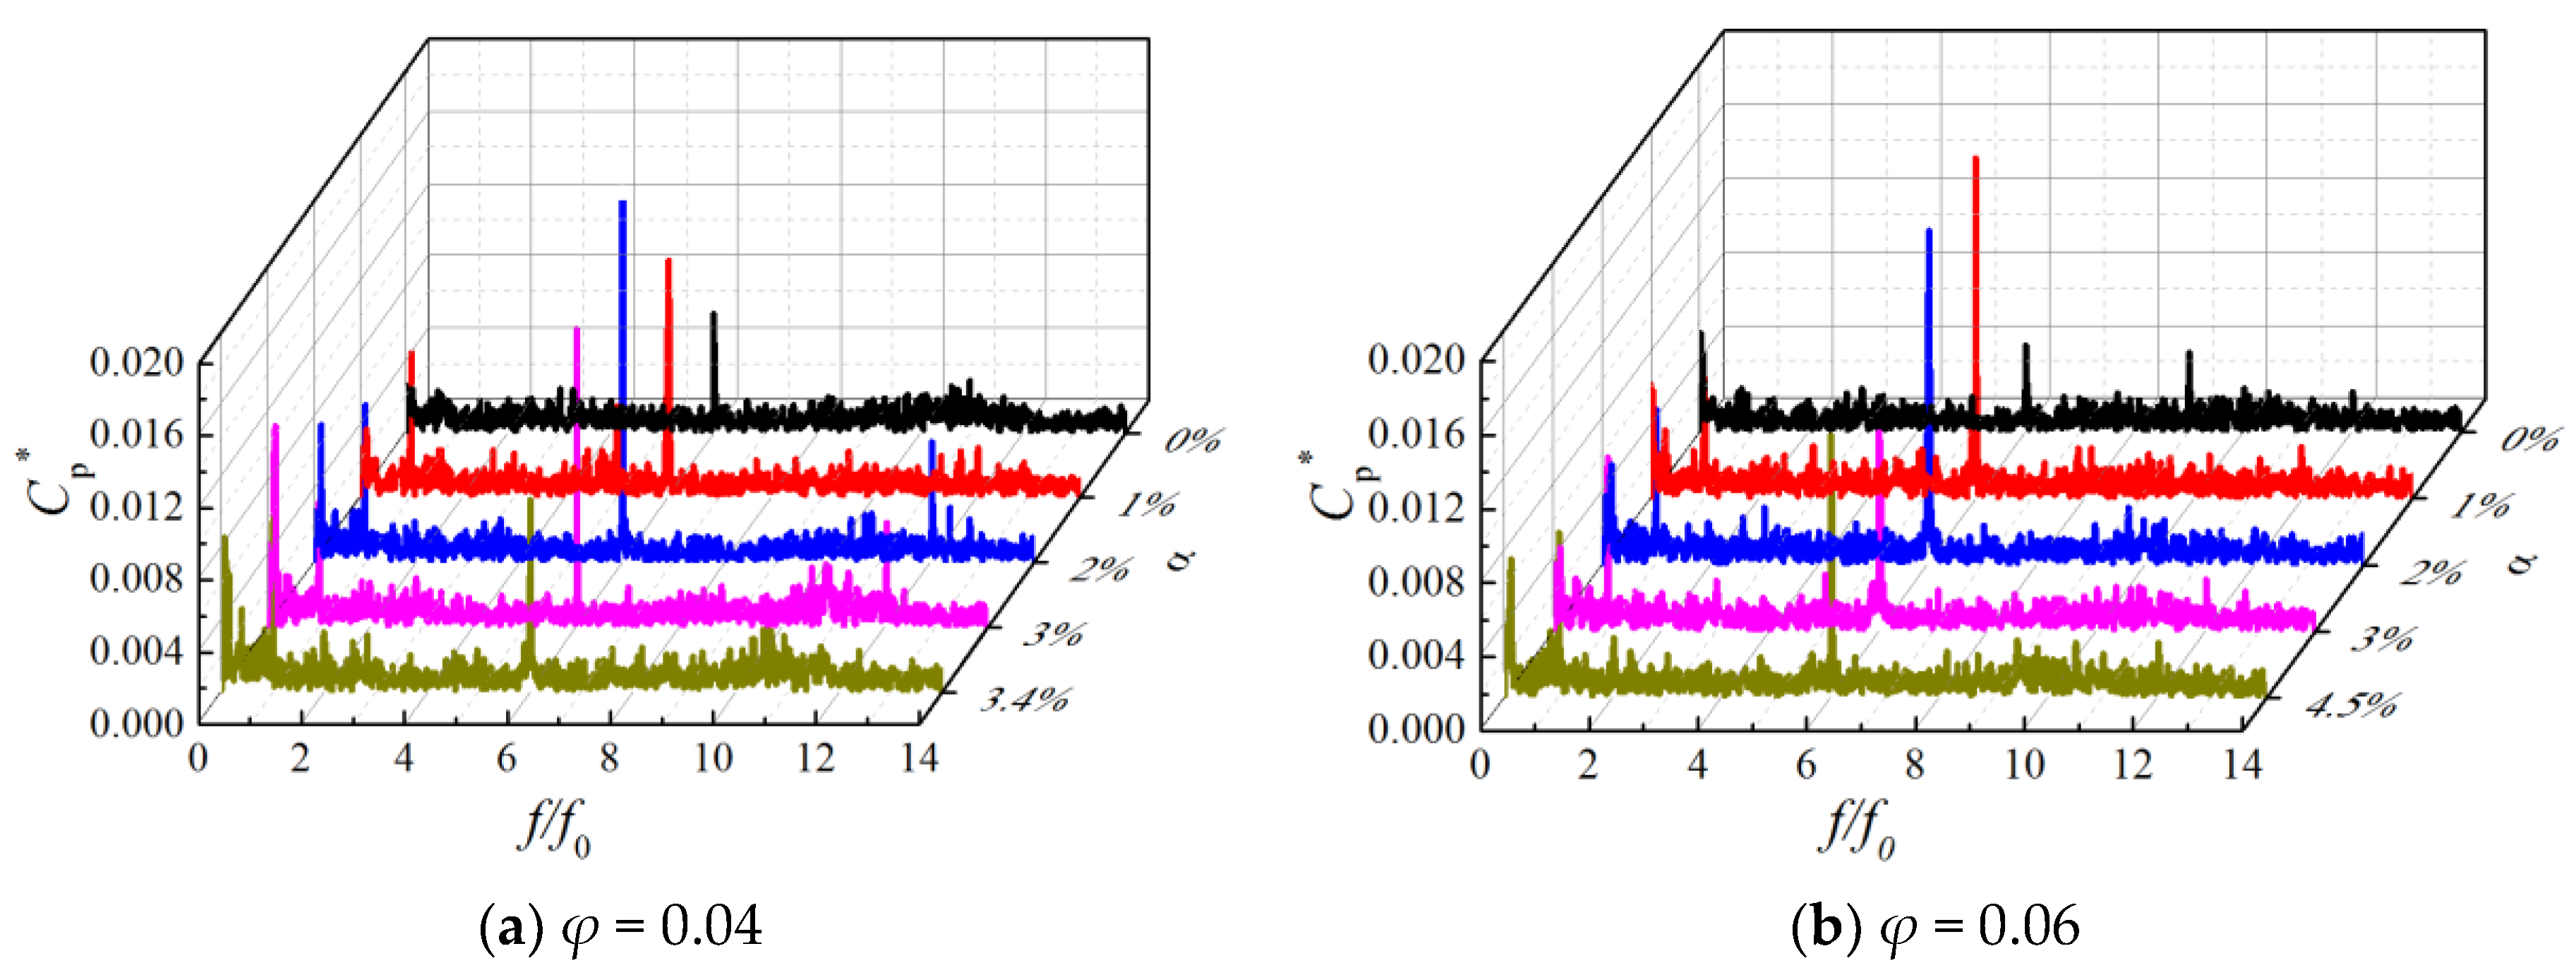
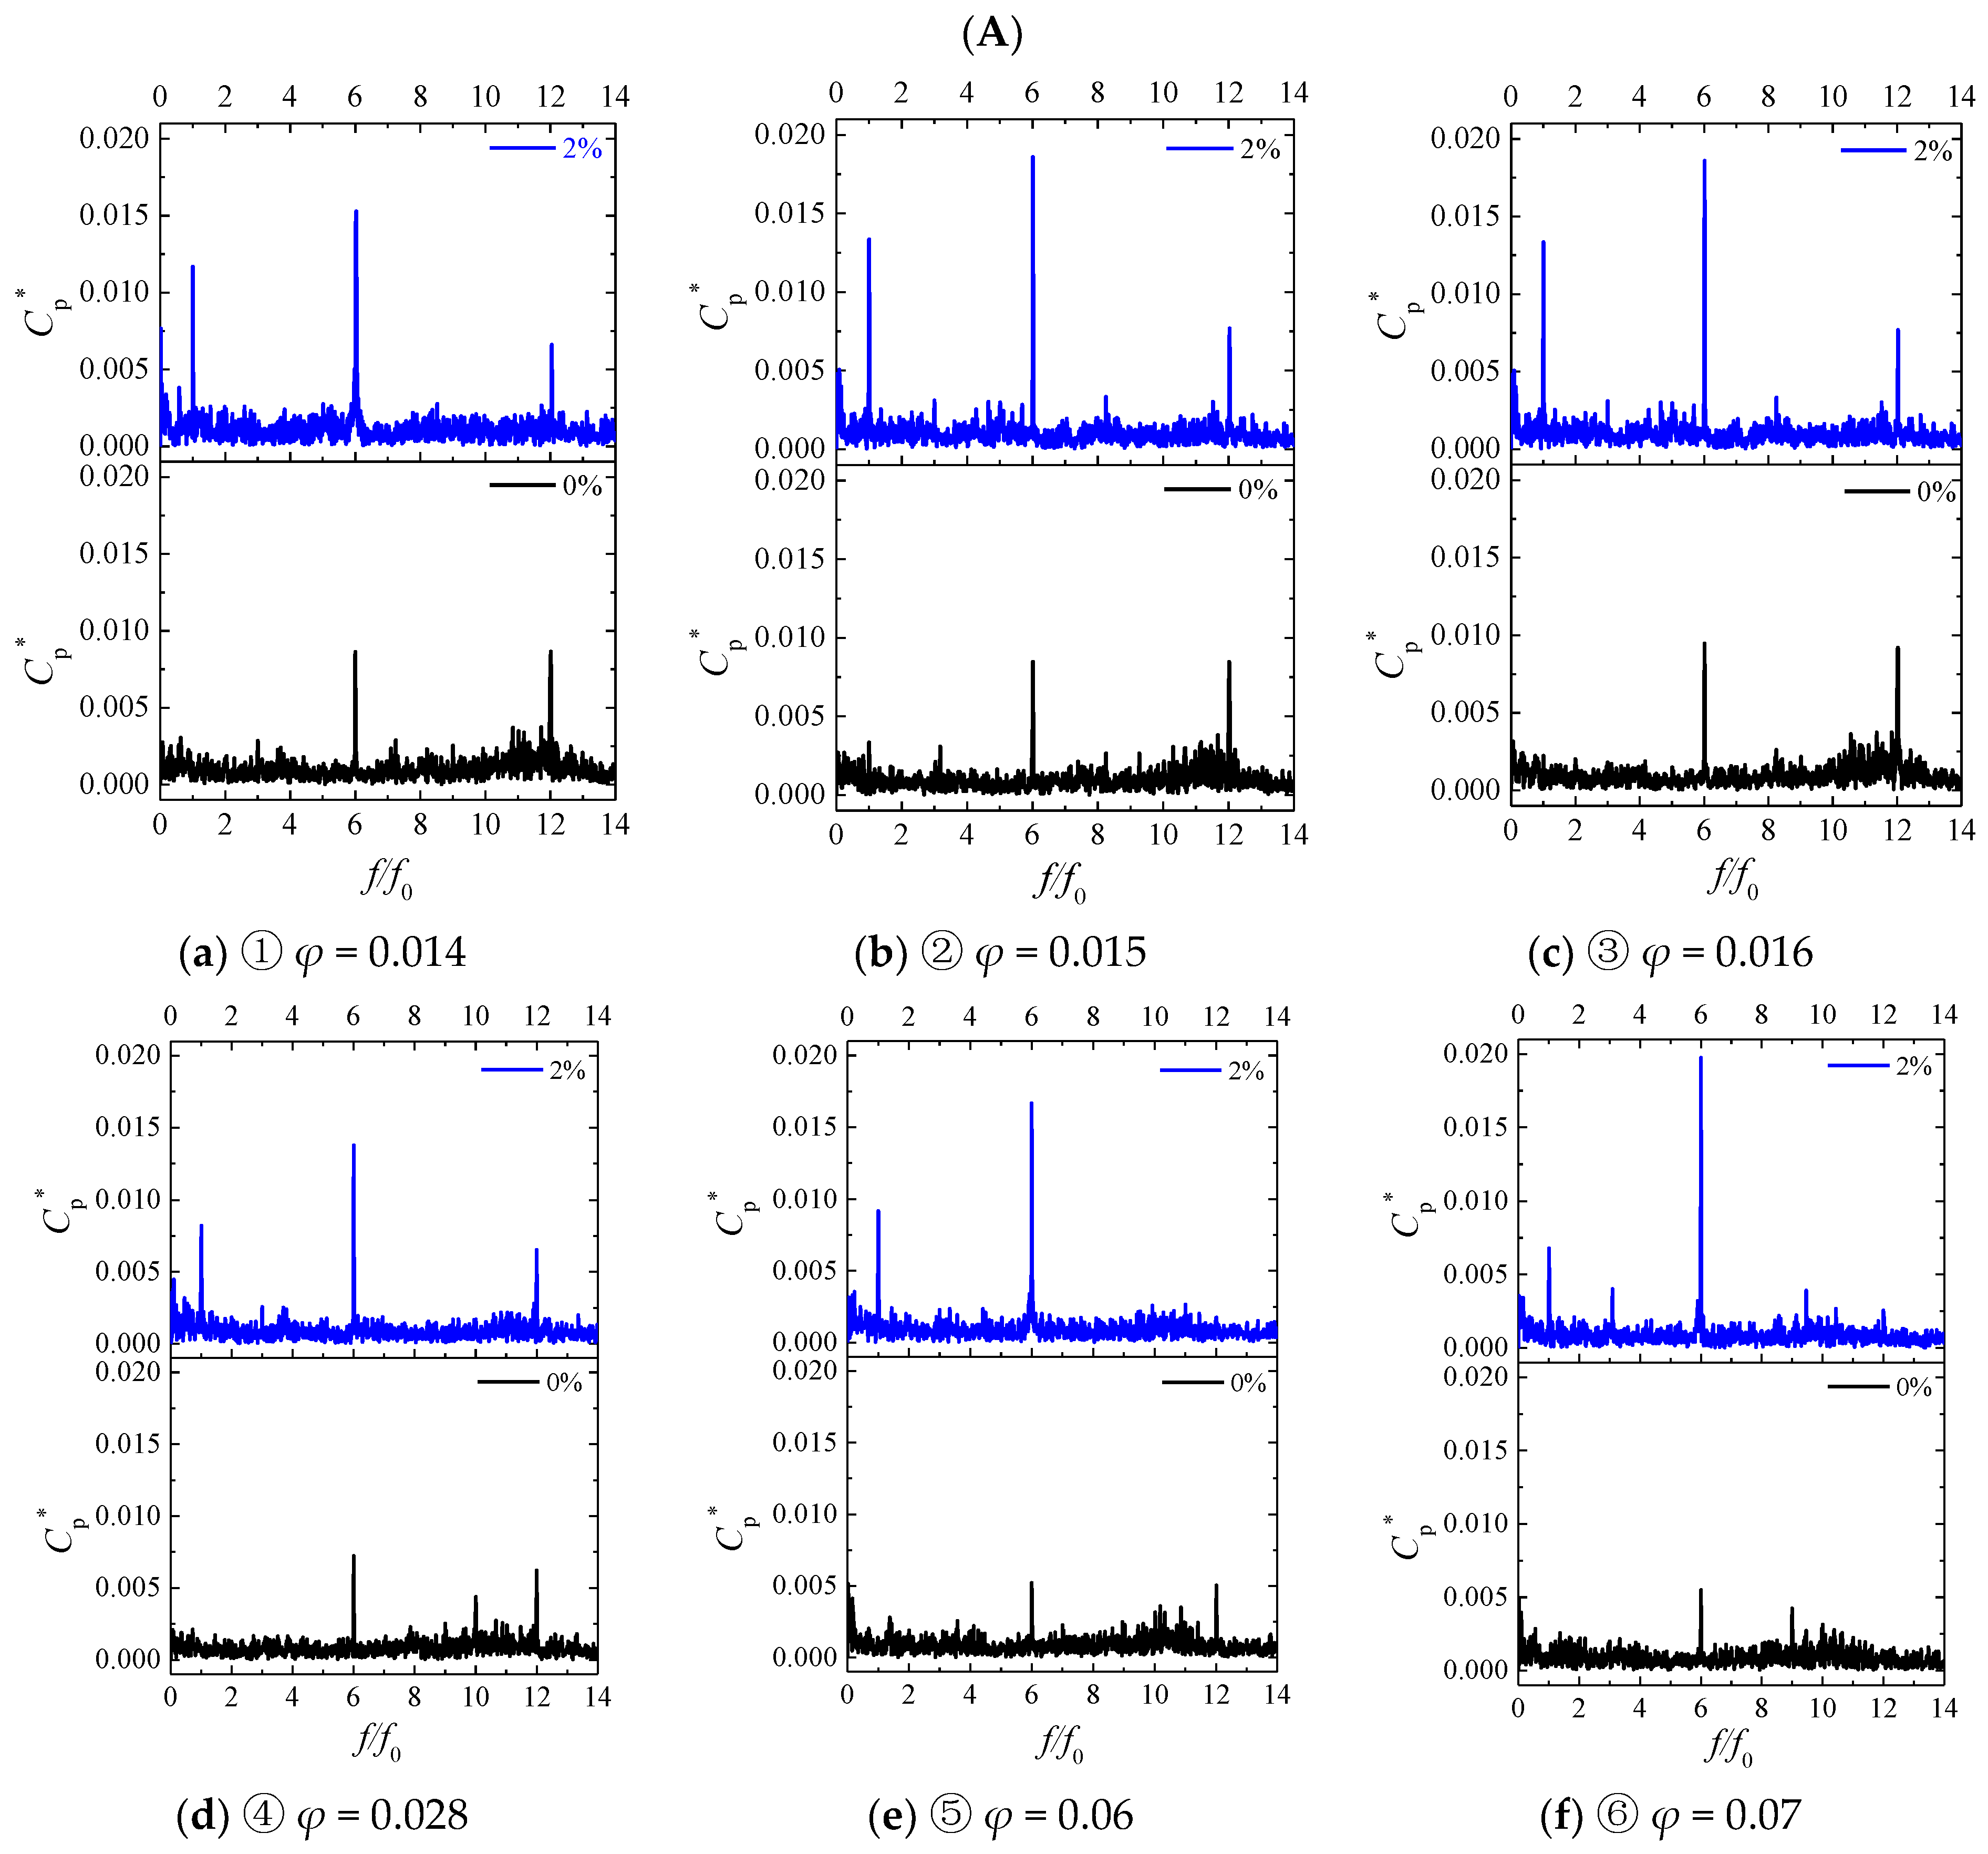
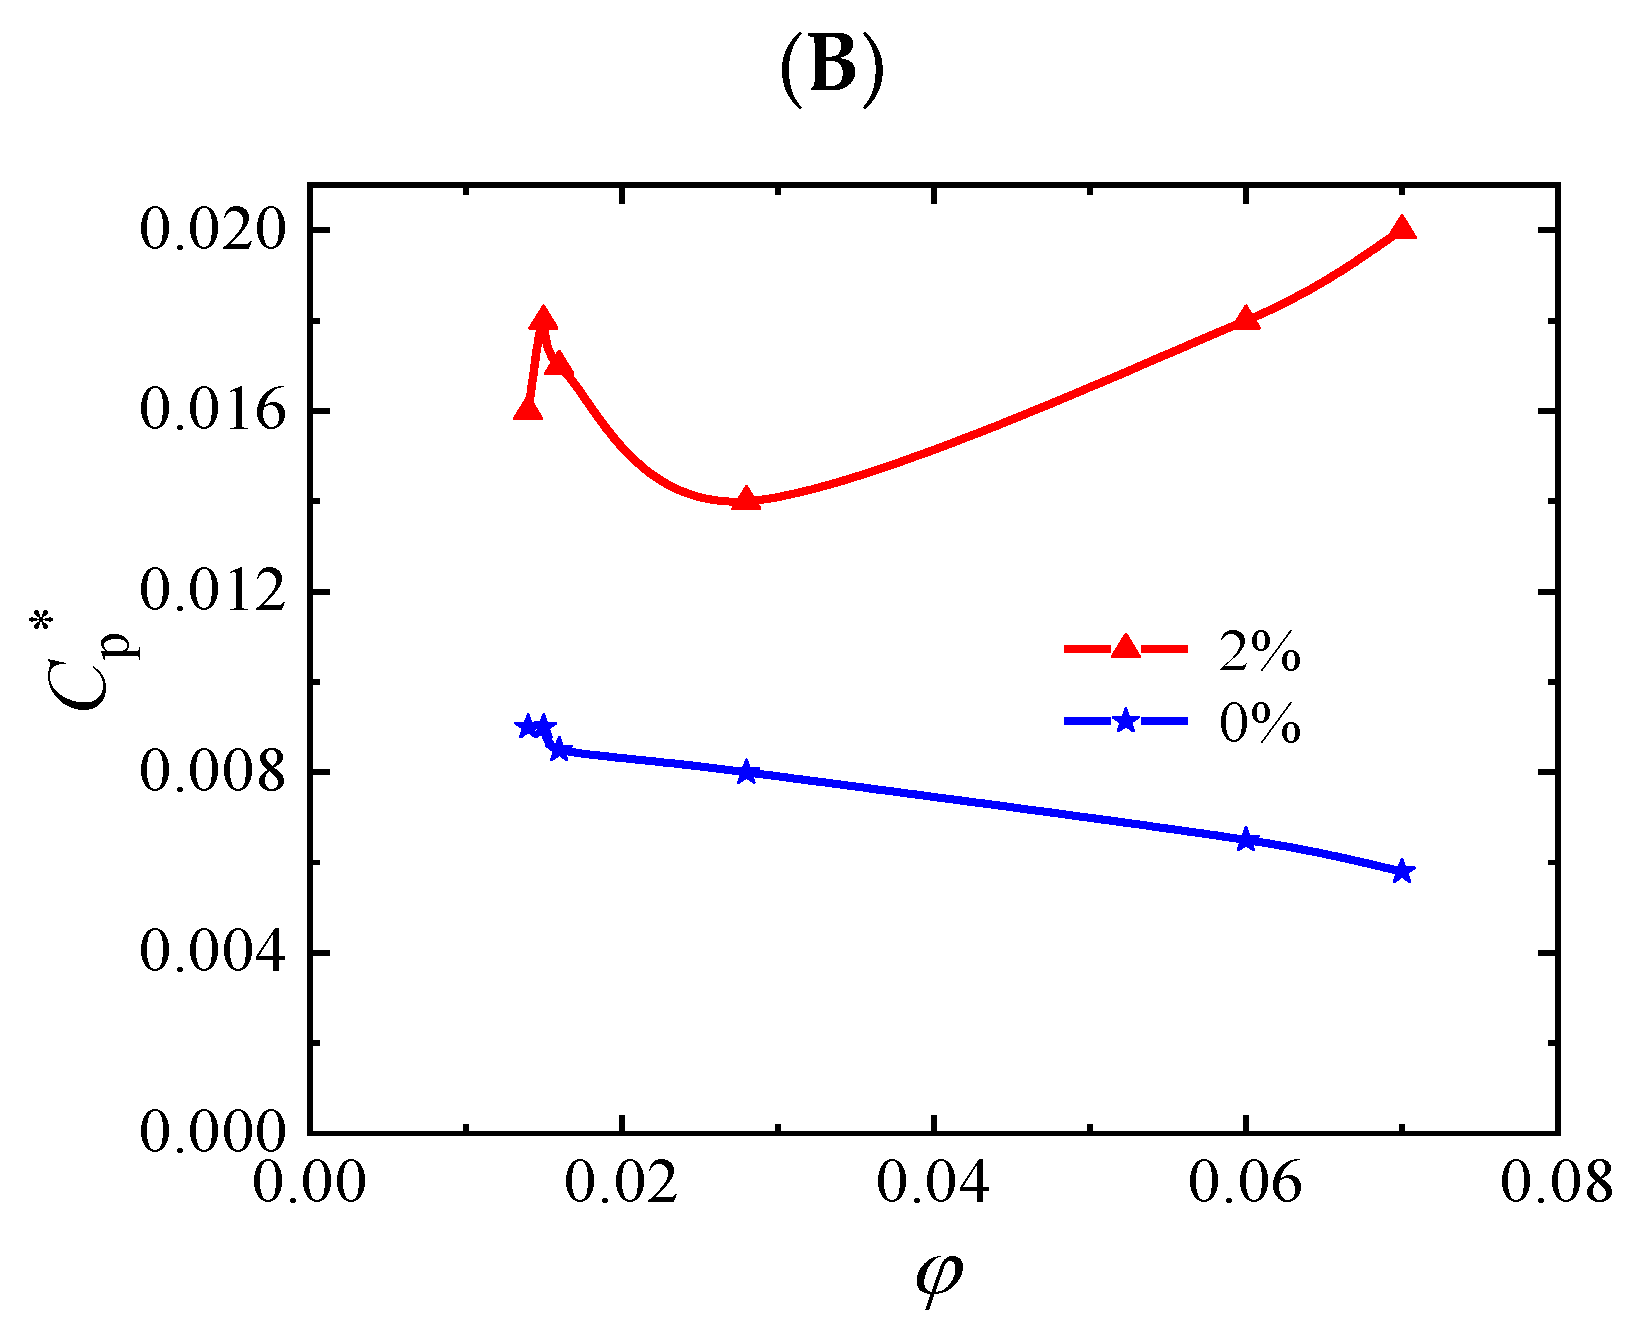
4.2. Pressure Fluctuation

The rotation frequency (shaft frequency) is f0 = 16.67 Hz, and the blade passing frequency is f = 6 f0 = 100.02 Hz. The outlet monitoring point is located twice downstream the outlet pipe diameter of the volute outlet flange corresponding to a distance of 130 mm as shown in Figure 2. Transient pressure sensors (Shuang-Qiao company, Suzhou, China CYG1102F type, with a manufacturer measuring range of 0–200 KPa and an accuracy class of 0.15%) mounted perpendicular to the outlet pipe are used to obtain the pressure pulsations with 20,000 Hz sampling. Figure 4 shows the pressure pulsation of the outlet monitoring point under pure water conditions. As expected, the main frequency of pressure pulsation under different flow rates corresponds to the blade passing frequency. The value of the pulsation increases when the flow rate decreases, which is also expected as off design conditions always increase flow instabilities inside the impeller due to increasing positive incidence and stronger interactions from volute tongue.
In Figure 5, pressure pulsation frequency charts are compared for two selected flow rates under different inlet void fractions. These two flow rates have been chosen because they correspond to the usual head curve variation with a negative slope. The main frequency of pressure pulsation corresponds to the blade passing frequency for both flow coefficients. The amplitude of pressure pulsation at the blade passing frequency shows a tendency to first increase and then decrease for increasing values of inlet void fraction. Moreover, the pressure pulsation amplitude at the blade passing frequency decreases significantly when the inlet air void fraction reaches the critical unstable air content rate.
As far as the pressure pulsations are concerned, the inlet void fraction of 2% corresponds to the maximum value of the outlet pressure fluctuations.
Figure 6 presents the comparative performance curve for two different inlet air void fractions, respectively, 0% and 2%. To facilitate the study, the area corresponding to a negative slope zone is defined as Area I, and the area corresponding to a positive slope zone, is defined as Area II. Comparisons are processed among six flow rates with two different inlet void fractions of 0% and 2%, as shown in Figure 7A. It shows that the change of pressure pulsation amplitude is intrinsically related to the head curve modification.
It can be seen that the main frequency of pressure pulsation for all working condition is the blade passing frequency with its first harmonic. The amplitude of the pressure pulsation at blade passing frequency increases gradually in area I and area II as the flow rate decreases for a given value of the inlet void fraction of 2%, but it decreases from area I (flow coefficient ③) to area II (flow coefficient ④) when the head slope trend is opposite. This can be seen on Figure 7B, where maximum pressure pulsation is plotted versus flow coefficients at BPF. Compared with pure water condition, it will produce larger pulsation amplitude at shaft passing frequency and shaft frequency increasing amplitude for 2% void fraction. At flow coefficient values corresponding to flow coefficient ①, ② and ③, amplitudes are larger than that the ones that correspond to flow coefficient ④, ⑤ and ⑥, mainly because the mean fluid velocity slows down and the local gas content will gradually block parts of the impeller flow channel in a non-periodic pattern. Location of each position in Figure 7A are corresponding to those in Figure 6.

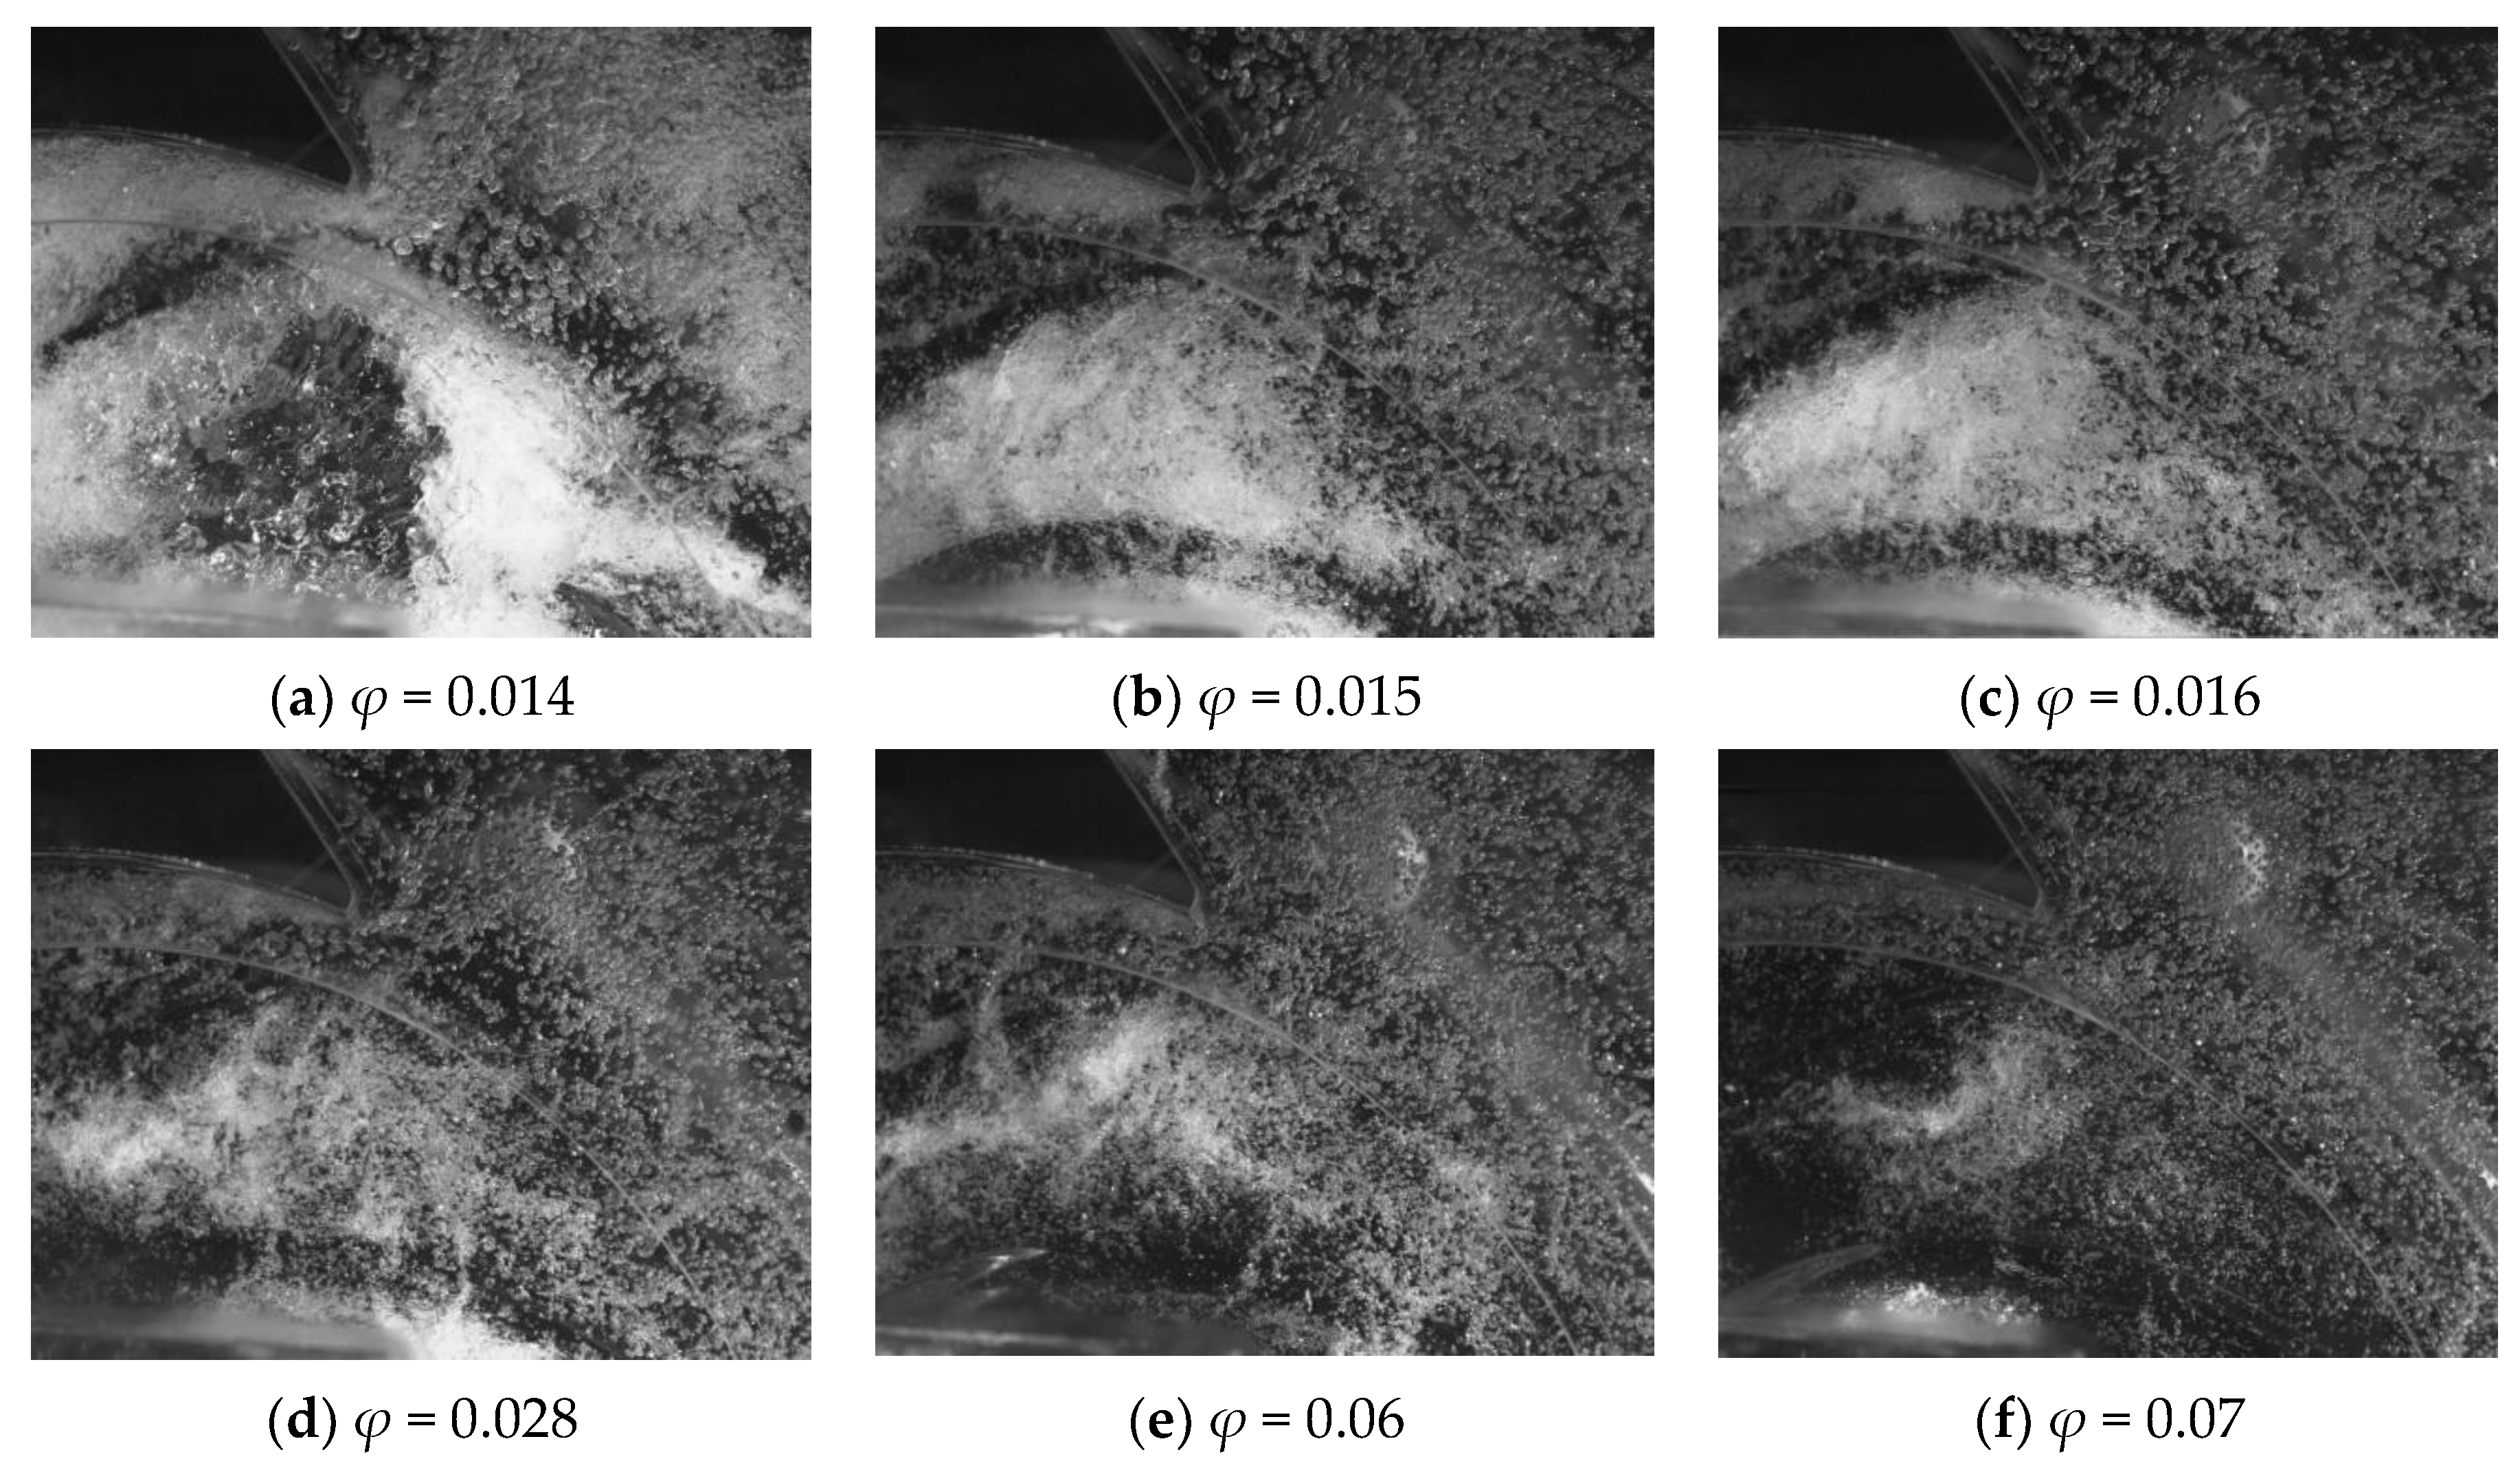
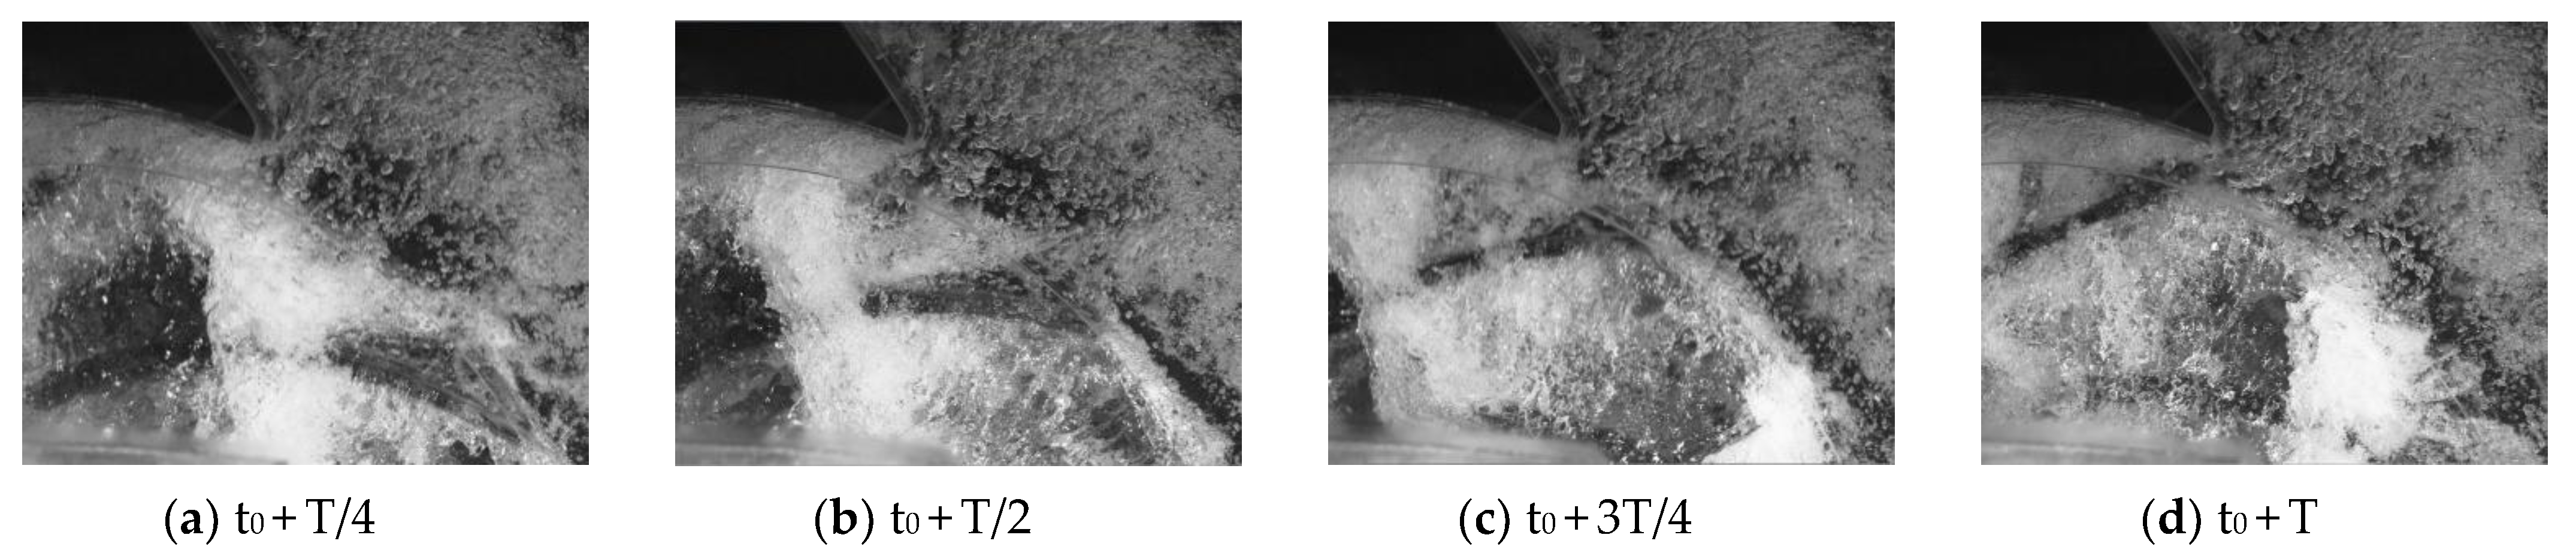
4.3. Flow Visualization Inside the Impeller and Volute Channel

A high-speed camera typed Phantom 710S (Vision Research, Wayne, NJ, USA) is used for the two-phase flow visualization. The shooting frame rate is 8000 fps, the corresponding image resolution is 1024 × 800 and the exposure duration is 30 μs. The selected shooting area is shown in the red rectangular box of Figure 1a. The camera points at the middle of the picture, perpendicular to the camera lens axis to minimize the arc and angle errors. In addition, due to the high frame rate during shooting, supplemental light processing is managed on the scene. The speed of the centrifugal pump is adjusted to 1000 rpm and the high-speed camera is triggered accordingly.
Figure 8 show the visualization test results of the air-liquid two-phase distribution inside the pump, respectively, for six decreasing flow rates with 2% inlet air void fraction and for a given impeller passage location close to the volute tongue. Each corresponding flow coefficient value is reported on Figure 6. From the instantaneous pictures extracted from video, the air-liquid two-phase flow patterns inside the pump impeller at low flow rate mainly corresponds to the so-called gas-pocket flow regime and segregated flow regime. It gradually changes to agglomerated bubble flow regime and bubbly flow regime for increasing flow rates.
Instantaneous flow pattern suddenly changed between Figure 8c,d, which corresponds to the pump performance slope modification that occurs for φ = 0.022 between positions ③ and ④ in Figure 6, and possibly corresponding to unstable flow condition inside the pump. It was previously experimentally observed that, when approaching a value of the flow coefficient φ = 0.014 (corresponding to a water flow rate of 3 m3/h), for increasing values of α, the pump could no longer provide sufficient head and shut down after a few seconds of operation.
For bubble-flow type conditions, bubbles generally collect near the blade suction surface and then extend inside the blade passage when being transported toward the impeller outlet. In the selected area close to the volute tongue, part of the air bubble area locks in a stagnant position and another one is pushed back into the impeller blade passage. These could cause the unsteady pump operation, corresponding to lower frequency pulsations in the frequency domain, especially as the amplitude of the shaft frequency becomes larger.
Figure 9 presents the instantaneous flow path of air-liquid two-phase flow at φ = 0.014 for α = 2%. The global time value T corresponds to 0.06 s. Figure 8a corresponds to Figure 9d for which leakage flow pattern due to the shroud gap cannot be detected. With the addition of Figure 9a–c, strong reverse flow can be observed within the impeller shroud gap when a blade passes close to the volute tongue. Due to the rotation of the impeller, the gas-pocket flow, segregated flow and the water structures were simultaneously transported in the tangential direction as well as in the inward radial direction due to the strong reverse flow occurring in the shroud gap area. Therefore, three-dimensional separated flow vortices were watched at the pump inlet position. This locally special two-phase flow pattern migration is believed to be related to the starting point of pump surge shut-off and never being pointed out before. However, it is difficult to relate this strong reverse flow only to the two-phase pattern evolution. Additional flow visualization should be performed in pure water for the same flow rate obtained close to the shut-off conditions to confirm that such behavior mainly corresponds to the consequence of two-phase flow conditions.
Finally, an important point is that homogeneous bubbly flow regime can be found inside the volute regardless to the flow rate. It is so considered that, inside the volute, pressure loss coefficient may not increase compared with pure water condition.

5. Conclusions

A flow visualization technique was used in relation with pump performance and pressure pulsation in a semi-open unshrouded transparent centrifugal impeller pump model under different air-entrainment. The main conclusions are as follows:
(1)
Two-phase flow pump performance degradations have been experimentally obtained for a given rotational speed of 1000 rpm and several inlet void fractions up to 4.6%.
(2)
For an inlet void fraction of 2%, the pump outlet pressure pulsation reaches its maximum value, which is found to be the first critical point for pump performance modification in relation with pressure pulsation amplitude evolutions.
(3)
Results from visualization have shown that local void fraction increases as the bubble sizes increase when decreasing flow rates. Air bubbles tend to agglomerate near the impeller suction side shroud at mid-chord and close to the pressure side close to the impeller outlet plane. The starting point of pump break down is related to a strong inward reverse flow occurring in a specific location near the shroud gap of the impeller and volute tongue region. However, it is still one question that if this phenomenon related to the low flow rate value only for pure water.
(4)
Additional visualization should however be performed in the whole pump area, including inlet tube flow patterns, close to the performance head curve slope modification just before pump break down starting point.

Author Contributions

Investigation-writing-review and editing, M.L. and Q.S.; data curation, M.F. and Q.C.; methodology-funding acquisition, S.Y.; validation, P.W. and Z.L.; formal analysis, G.B. All authors have read and agreed to the published version of the manuscript.

Funding

This research was funded by National Key R&D Program of China (2020YFC1512403), National Natural Foundation of China (51976079, 51779107) and Postdoctoral Science Foundation of China (2019M661745).

Institutional Review Board Statement

Not applicable.

Informed Consent Statement

Not applicable.

Data Availability Statement

Not applicable.

Acknowledgments

The authors gratefully acknowledge the financial support of the National Key R&D Program of China, National Natural Foundation of China and Postdoctoral Science Foundation of China. We are also grateful to Giorgio Pavesi from the University of Padua for his comments on the revision of this paper.

Conflicts of Interest

The authors declare no conflict of interest.

Nomenclature

ACross-sectional area
CpPressure pulsation coefficient: C p = p p ¯ / 0.5 ρ u 2 2
Cp*Amplitude of Cp after Fast Fourier analysis
HPump head
PShaft power
pStatic pressure
QVolume flow rate
RRadius
uImpeller rotational speed: u = ω·R
ΩSpecific speed: Ω = ω·Q0.5/(g·H)0.75
ΛSpecific radius: Λ = R·(g·H)0.25/Q0.5
αInlet air void fraction: α = Qair/(Qair + Qwater)
βBlade angle (from tangential direction)
ηgGlobal efficiency: η =ρgQwaterH/P
ηintInternal efficiency
φFlow coefficient: φ = Qwater/(2π·R2·b2·u2)
ψHead coefficient: ψ = gH/(u2)2
ρDensity of mixed fluid: ρ = ρwater × (1 − α) + ρair × α
ψt,intInternal head coefficient: ψt = ψ/ηint
ωAngular velocity
τShaft power coefficient: τ = P/ρA2(u2)3
1Impeller inlet
2Impeller outlet
tImpeller inlet tip

References

  1. Schäfer, T.; Neumann, M.; Bieberle, A.; Hampel, U. Uwe Hampel. Experimental investigations on a common centrifugal pump operating under gas entrainment conditions. Nucl. Eng. Des. 2017, 316, 1–8. [Google Scholar] [CrossRef]
  2. Li, X.; Jiang, Z.; Zhu, Z.; Si, Q.; Li, Y. Entropy generation analysis for the cavitating head-drop characteristic of a centrifugal pump. Proc. Inst. Mech. Eng. Part C J. Mech. Eng. Sci. 2018, 232, 4637–4646. [Google Scholar] [CrossRef]
  3. Minemura, K.; Murakami, M.; Katagiri, H. Characteristics of centrifugal pumps handling air-water mixtures and size of air bubbles in pump impellers. Bull. JSME 1985, 28, 2310–2318. [Google Scholar] [CrossRef]
  4. Clark, A.P. Numerical prediction of bubble flow in a centrifugal pump. Adv. Multiph. Flow 1995, 64, 175–181. [Google Scholar]
  5. Schäfer, T.; Bieberle, A.; Neumann, M.; Hampel, U. Application of gamma-ray computed tomography for the analysis of gas holdup distributions in centrifugal pumps. Flow Meas. Instrum. 2015, 46, 262–267. [Google Scholar] [CrossRef]
  6. Jiang, Q.; Heng, Y.; Liu, X.; Zhang, W.; Bois, G.; Si, Q. A review on design considerations of centrifugal pump capability for handling inlet gas-liquid two-phase flows. Energies 2019, 12, 1078. [Google Scholar] [CrossRef] [Green Version]
  7. Si, Q.; Cui, Q.; Zhang, K.; Yuan, J.; Bois, G. Investigation on centrifugal pump performance degradation under air-water inlet two-phase flow conditions. La Houille Blanche 2018, 3, 41–48. [Google Scholar] [CrossRef] [Green Version]
  8. Müller, T. Numerical 3D RANS simulation of gas-liquid flow in a centrifugal pump with an euler-euler two-phase model and a dispersed phase distribution. In Proceedings of the 11th European Conference on Turbomachinery Fluid dynamics & Thermodynamics, ETC11, ETC2015-076, Madrid, Spain, 23–27 March 2015. [Google Scholar]
  9. Si, Q.R.; Bois, G.; Zhang, K.Y.; Yuan, J.P. Air-water two-phase flow experimental and numerical analysis in a centrifugal pump. In Proceedings of the 12th European Conference on Turbomachinery Fluid dynamics and Thermodynamics, ETC12, Paper ID: ETC2017-54, Stockholm, Sweden, 3–7 April 2017. [Google Scholar]
  10. Stel, H.; Ofuchi, E.; Sabino, R.; Ancajima, F.; Bertoldi, D.; Marcelino, N.; Morales, R. Investigation of the motion of bubbles in a centrifugal pump impeller. J. Fluids Eng. 2019, 141, 031203. [Google Scholar] [CrossRef]
  11. Si, Q.; Bois, G.; Liao, M.; Zhang, H.; Cui, Q.; Yuan, S. A comparative study on centrifugal pump designs and two-phase flow characteristic under inlet gas entrainment conditions. Energies 2020, 13, 65. [Google Scholar] [CrossRef] [Green Version]
  12. Si, Q.; Zhang, H.; Bois, G.; Zhang, J.; Cui, Q.; Yuan, S. Experimental investigations on the inner flow behavior of the centrifugal pumps under inlet air- water two-phase conditions. Energies 2019, 12, 4377. [Google Scholar] [CrossRef] [Green Version]
  13. ISO 9906: 2012. Rotodynamic Pumps-Hydraulic Performance Acceptance Tests—Grades 1, 2 and 3. Available online: https://max.book118.com/html/2017/0914/133901920.shtm (accessed on 31 May 2012).
Figure 1. Plexiglass pump model.
Ijtpp 06 00031 g001
Figure 2. Test rig.
Figure 2. Test rig.
Ijtpp 06 00031 g002
Figure 3. Pump performance curves. (values in % correspond to different inlet void fraction α) ((a,b) are adapted from ref. [11]).
Ijtpp 06 00031 g003
Figure 4. Frequency domain of pressure fluctuation for different flow rates and α = 0.
Ijtpp 06 00031 g004
Figure 5. Frequency domain diagram of outlet pressure fluctuations for several inlet air void fractions and two different flow coefficients.
Ijtpp 06 00031 g005
Figure 6. Pump performance head coefficient versus flow coefficient for α = 0% and 2%.
Ijtpp 06 00031 g006
Figure 7. (A). Frequency domain charts of pressure fluctuation at α = 0% and 2%. (B). Maximum Cp values at BPF for several flow coefficients.
Ijtpp 06 00031 g007aIjtpp 06 00031 g007b
Figure 8. Flow behavior at different flowrate for α = 2% for a fixed rotor-stator position.
Ijtpp 06 00031 g008
Figure 9. Flow tracing at φ = 0.014 for α = 2% at different timestep.
Ijtpp 06 00031 g009
Table 1. Pump geometry.
ParameterValueParameterValue
Rotating speed, n(rpm)1000Inlet diameter, D1/mm74
Design Head, H/m4Outlet diameter, D2/mm174
Design flow rate, Qd/m3 h−117.25Outlet tube diameter, DO/mm65
Design flow coefficient0.1Impeller blade inlet angle, β128
number of blades, Z6Impeller blade outlet angle, β230
Specific speed, Ω0.484Outlet blade width, b2/mm12
Specific radius3.141————
Table 2. Average relative uncertainties Ur for different inlet void fractions.
n/(rpm)Q/Qdα = 0%α = 1%α = 2%α = 3%α = 4%
10000.33.16
0.483.353.823.423.65
0.753.764.384.203.944.19
0.873.87
Publisher’s Note: MDPI stays neutral with regard to jurisdictional claims in published maps and institutional affiliations.

