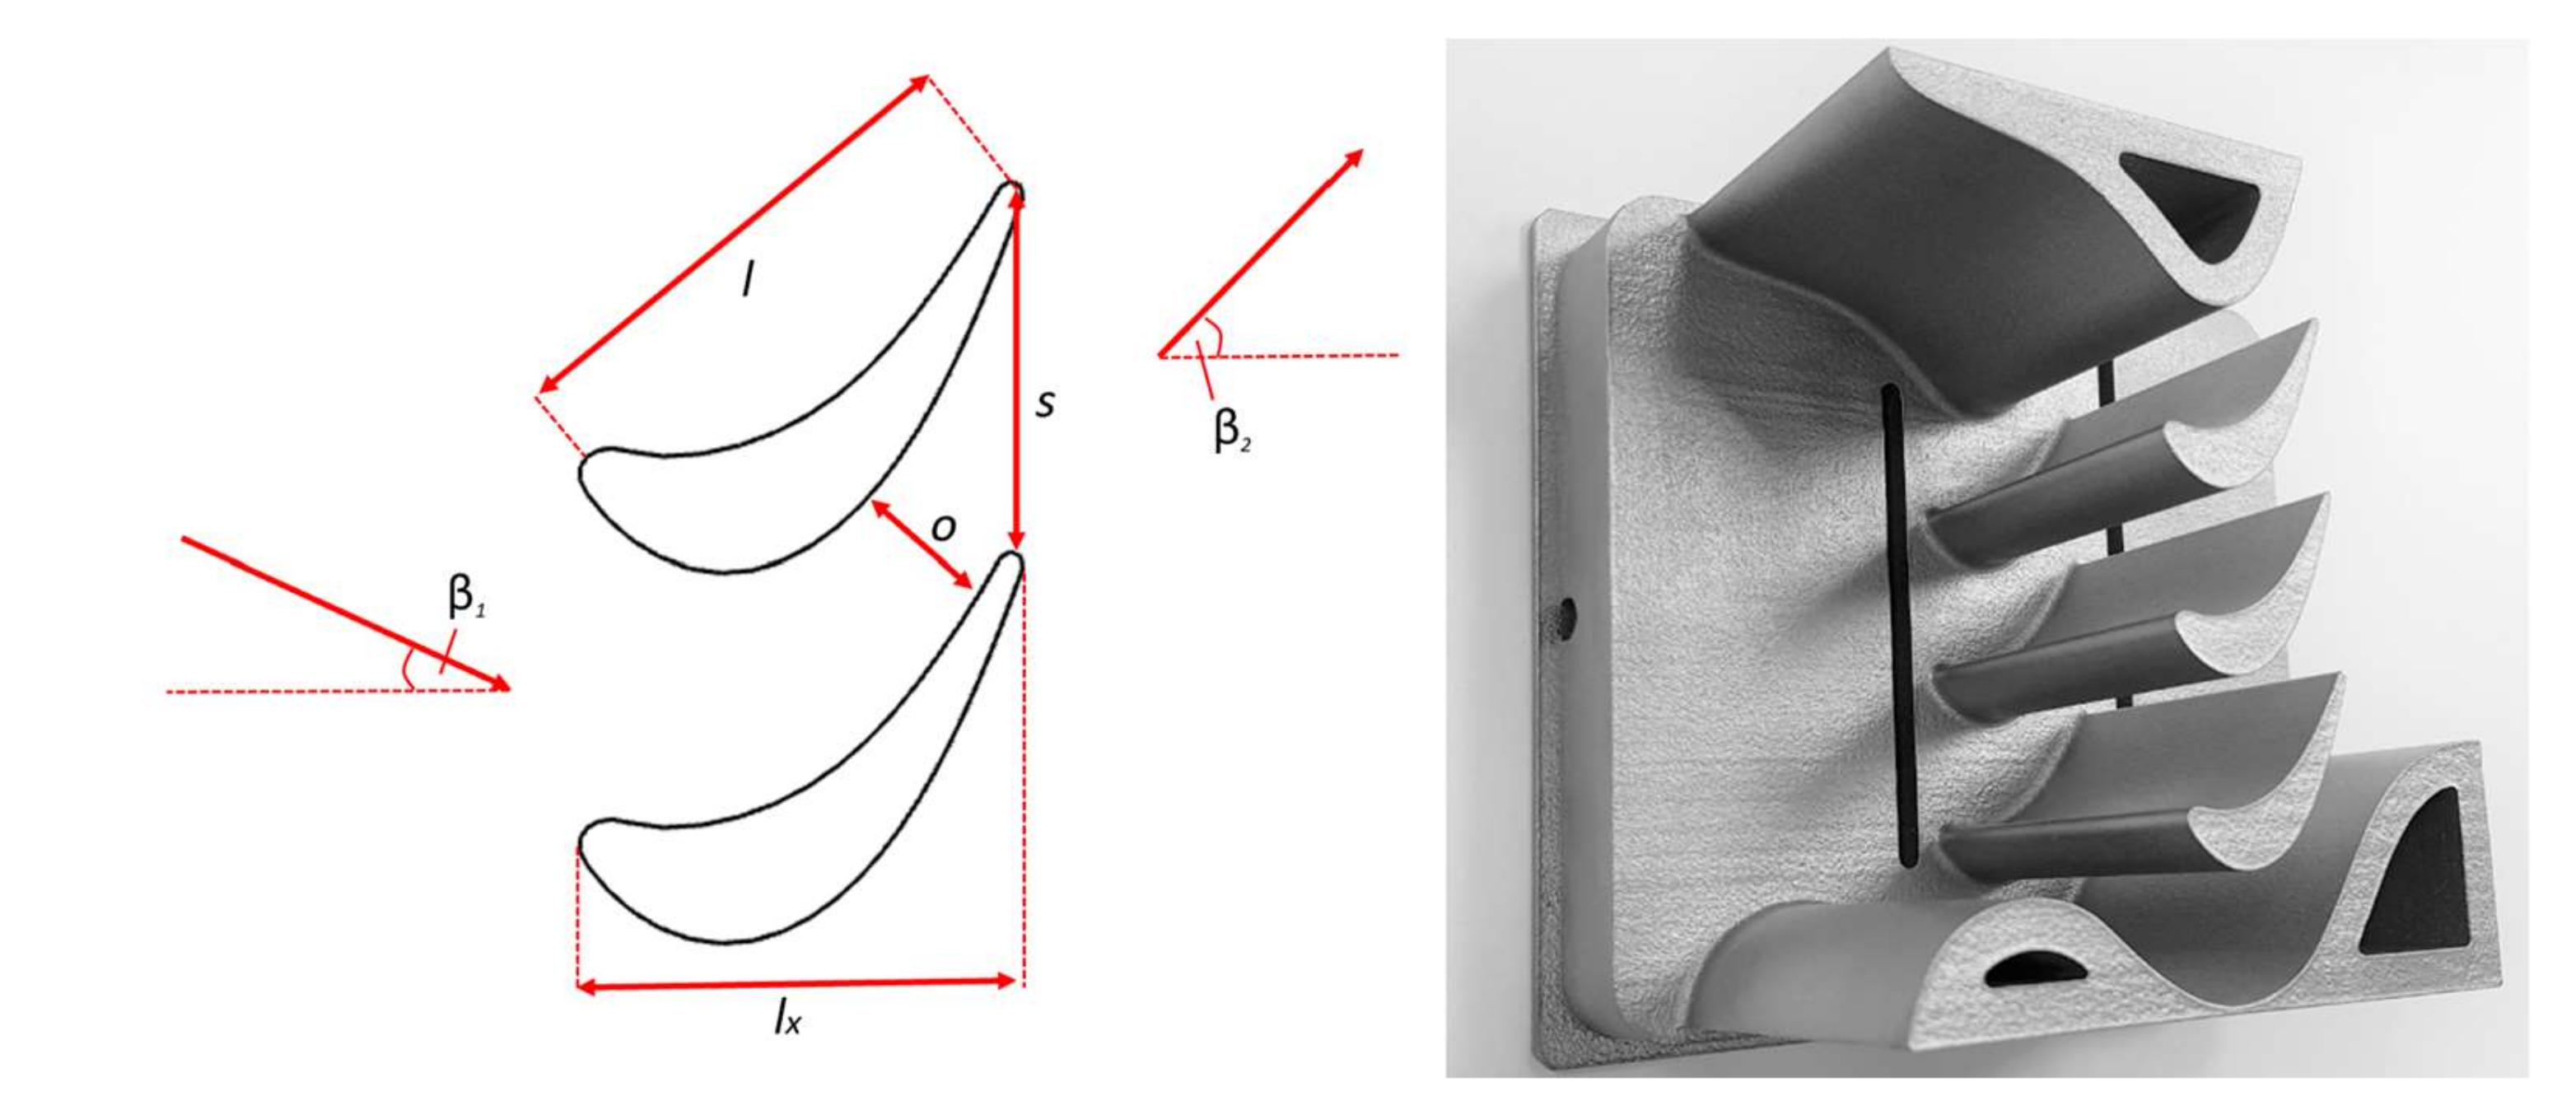
Based on this airfoil, a linear cascade,
Figure 1, was designed to fit the test section of the employed closed-loop organic vapor wind tunnel (see section “Description of Test Facility”).
Table 1 shows all determined dimensions of the blade profile. The cross-section of the test section was 100 mm × 50 mm. The test section height
H = 50 mm of the airfoils corresponded to the transonic wind tunnel facility of VKI Rhode-St. Genese (Kiock et al. [
9]) and was found to be appropriate for investigating profile loss. However, the present test section permitted only an axial inflow and an axial outflow. The maximum channel height was 100 mm, which was much smaller than at the VKI transonic wind tunnel facility. Since an airfoil with a significant deflection was employed; these severe design constraints led to a cascade configuration with only three entirely free-standing airfoils (and additional guiding profiles at the cascade’s boundaries see
Figure 2 and
Figure 3). The cascade’s final design, including its guiding profile and its outflow region, was defined after a numerical optimization procedure, employing compressible CFD analyses using a perfect gas model for air. During numerical optimization, the main objective was to meet the flow’s salient features through the central test blade passage.
2.1. Roughness and Blade Manufacturing
The quality of a surface is defined as the height of the peaks, the roughness structure, and its waviness. A single roughness parameter was usually prescribed in traditional workshop practice, including the roughness height Rt, defined as the largest height of the roughness peaks or the center-line-average CLA value. In the German industry standard DIN4767, the relationship was quoted for traditionally mechanically manufactured surfaces. Today, the arithmetic mean deviation of the assessed surface, Ra, or the average value over the assessment length, Rz, using the maximum peak to valley height, or the maximum profile peak height, Rp, are frequently used in the turbomachine industry.
The impact of roughness on the flow is a complicated topic because flow roughness and manufacturing roughness are not the same. If the viscous sublayer fully envelops peaks, there is no influence on the skin friction, and the surface is hydraulically smooth. If the peaks reach out of the viscous sublayer, shearing stress typically increases and additional loss occurs. A common approach is using an equivalent sand grain roughness
ks [
5]. A milled surface with roughness
Rt behaves like a surface with sand grains of size
ks = Rt/2.56 for a flow perpendicular to the milling grooves. On the other hand, it was also observed that a surface with sharp regular steps of height
Rt could be hydraulically much rougher than a sand grain surface with the same peak level. Here, a relation
ks = Rt/0.08
= 12.5
·Rt was experimentally observed [
5]. For blades, it is frequently quoted (Scholz [
5], Bammert and Sandstede [
6]) that the admissible sand grain roughness
ks,adm normalized by the chord length
l is a function of the Reynolds number
Re = clρ/µ and can be correlated by
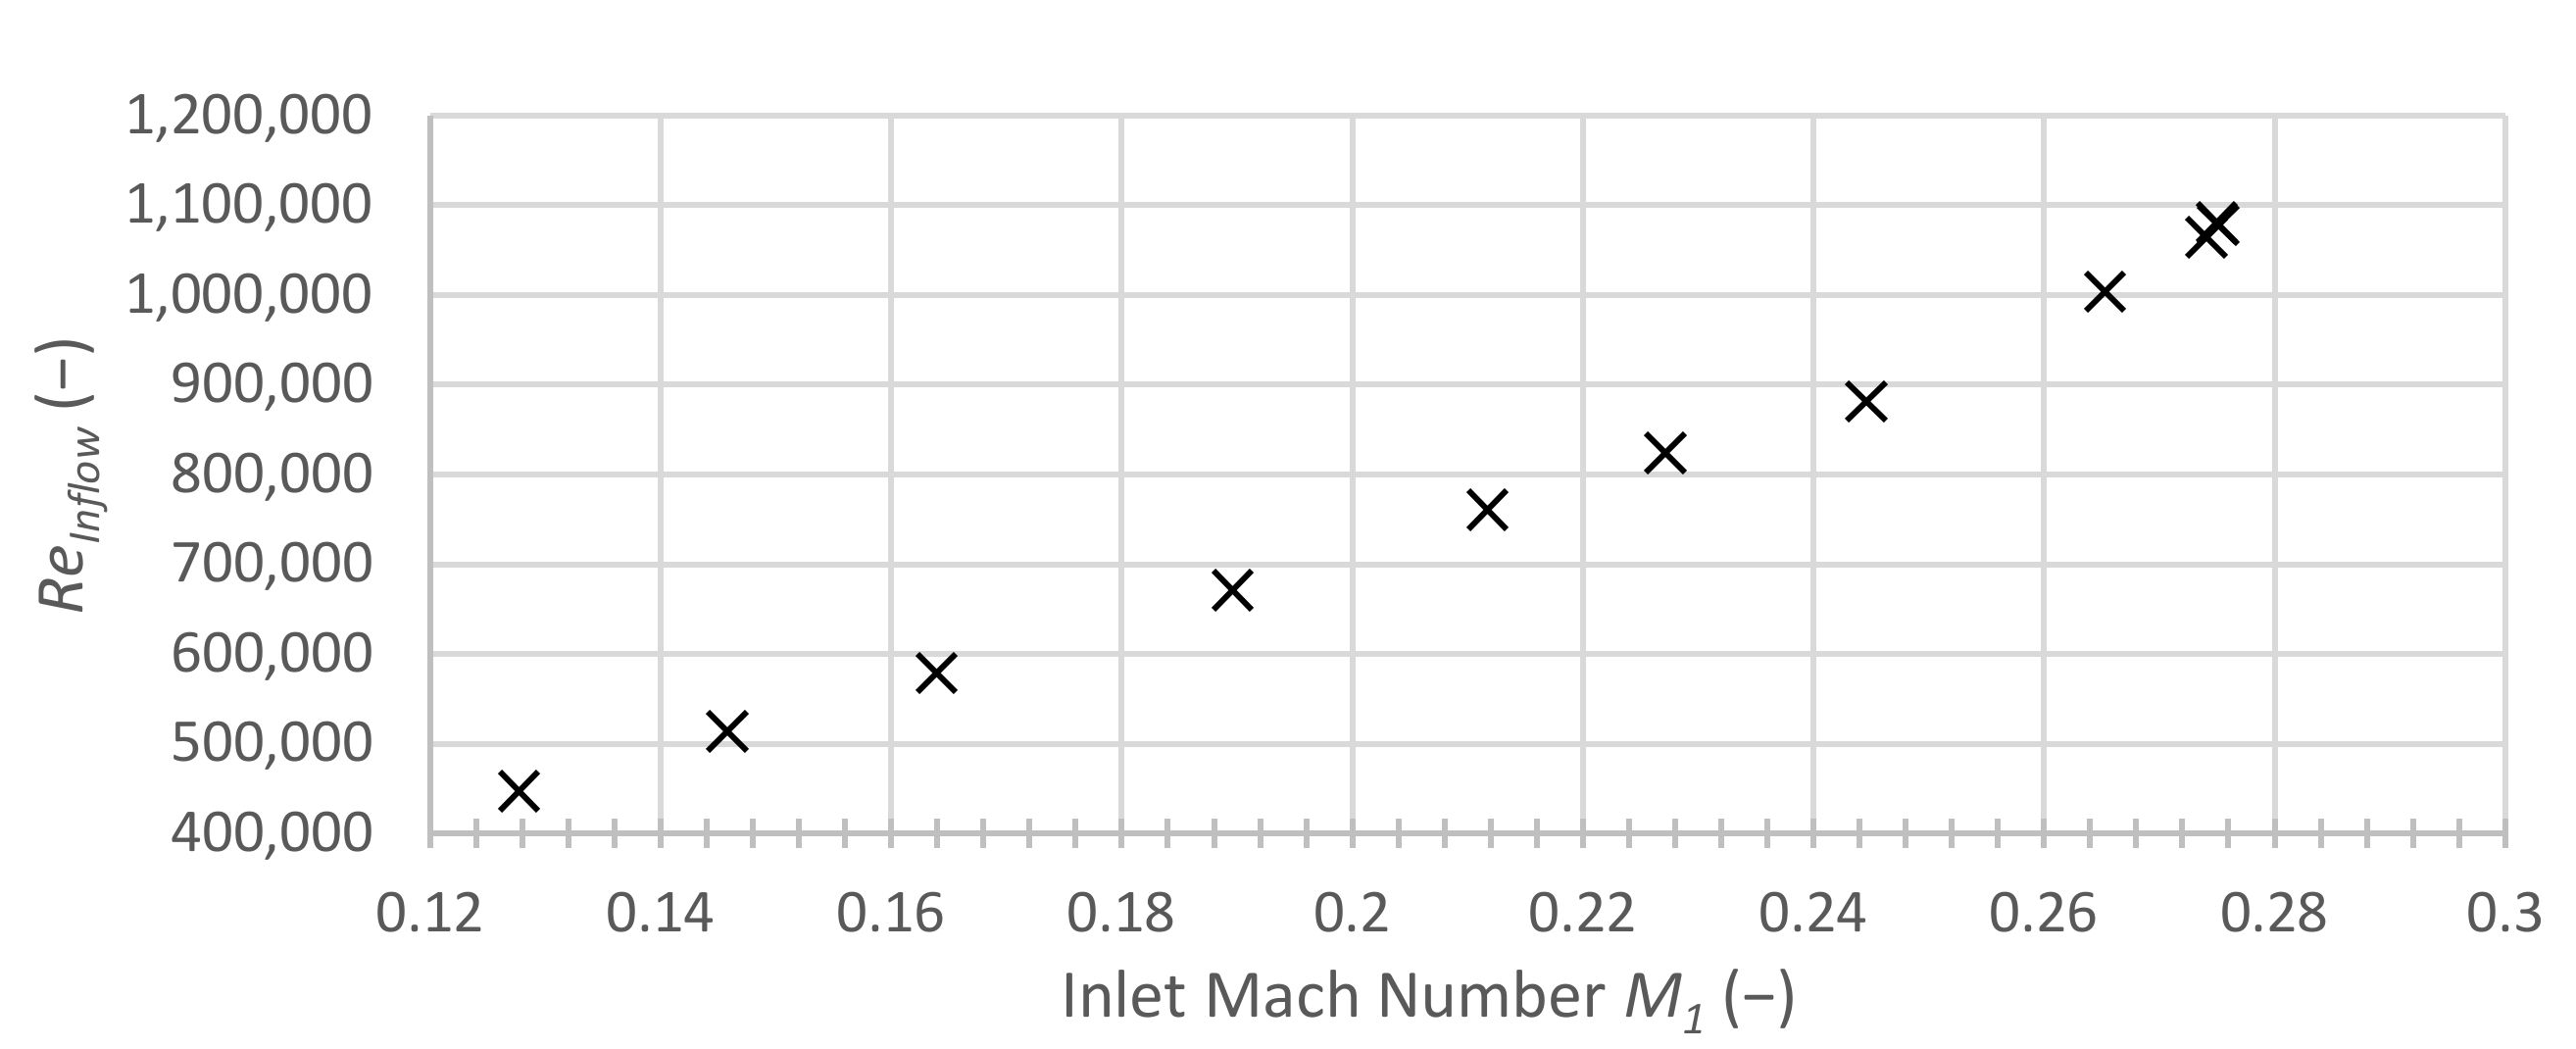
In ORC turbine applications, the Reynolds number
Re can be relatively high due to the substantial density
ρ of organic vapors consisting of complex molecules. Hence, the admissible roughness
ks,adm might be relatively small for ORC turbines, posing considerable manufacturing challenges. Most of our knowledge on roughness on the flow past blades has been collected in light of conventional manufacturing methods. Much less is known regarding the surface quality of additive manufactured blades. Adair et al. [
3] reported surface roughness measurements of electronic beam melting (EBM) blade artifacts in the as-printed and post-electrochemical machining conditions.
They found values of order Ra ≈ 80 µm (Rz ≈ 90 µm) in as-printed condition for the pressure and the suction side of gas turbine blades. After pulsed electrochemical machining (PECM), the roughness values were reduced to levels of Ra ≈ 1.3 µm (Rz ≈ 7.2 µm).
The present cascade was manufactured using the selective laser melting (SLM) method.
Figure 2a shows the printed part when the supplier provided it. The printing direction was normal to the main flow direction and, after printing, the supplier did a first surface treatment. This surface is hence called “original”. After the first set of flow measurements, the printed part’s surface was treated using vibratory finishing. The improvement due to the second finishing process can be seen in
Figure 2.
Figure 2b compares the surfaces of the blades (leading edge region) before and after finishing.
Figure 2c provides some roughness data. The deviation between the roughness levels measured in stream-wise direction and measured in printing direction was noticeable; however, it is not further elaborated in this contribution. The roughness data and relation (1) indicated that both the original and finished parts are rough in aerodynamics: the inflow Reynolds number was of order
Re = 10
6 yielding
ks,adm/l = 10
−4. The admissible roughness,
Rt,adm, would hence be of order 8 µm, which was easily not achieved after the applied standard finishing process, as displayed in
Figure 2c. Thus, a different finishing process would be required to achieve hydraulically smooth blades. In principle, this is possible (see Adair et al. [
3]), but is not covered within the present study.
2.2. Description of the Test Facility
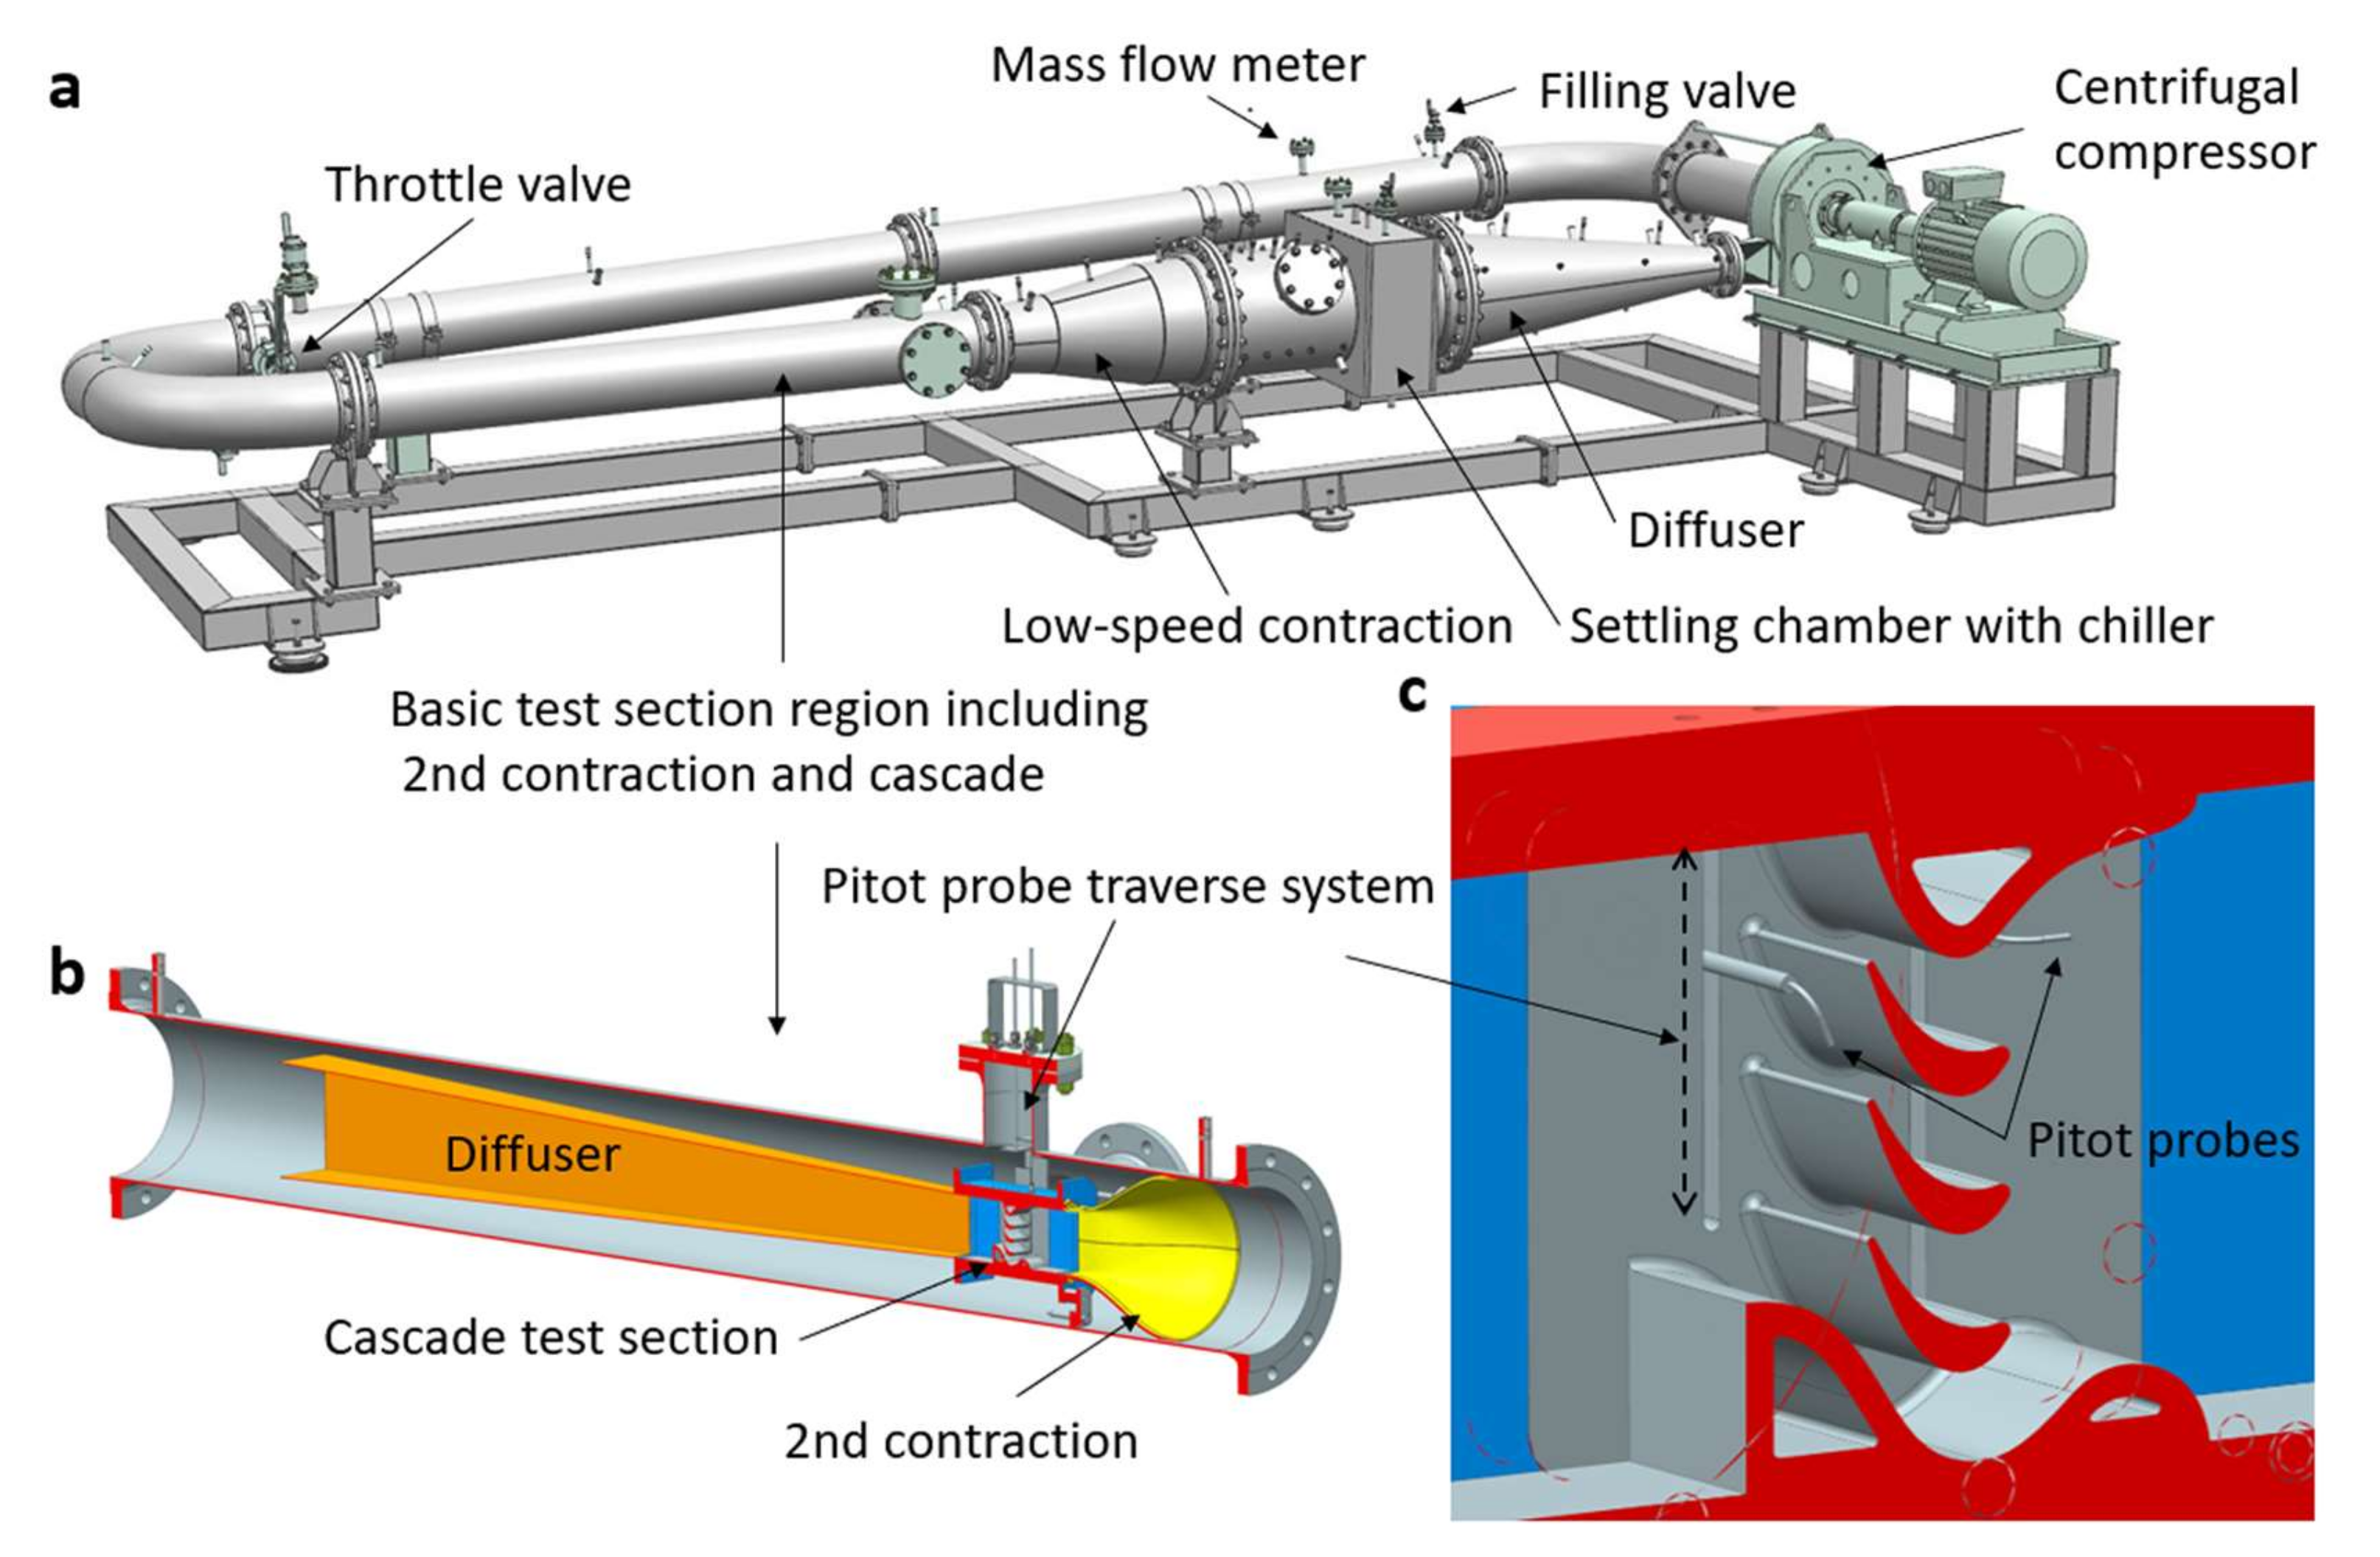
The present experiments were performed in the closed-loop organic vapor wind tunnel (CLOWT) test section using the perfluorinated ketone Novec™ 649 and dry air as working fluids. The wind tunnel test facility CLOWT is shown in
Figure 3. More details on CLOWT and its design features and its control system can be found in previous publications (Reinker et al. [
11,
12]).
After passing the centrifugal compressor, the working fluid was decelerated in the diffuser and entered the settling chamber, where the stagnation pressure
p0 and temperature
T0 were recorded. The mass flow rate
through the wind tunnel was measured utilizing a device in the return of the wind tunnel. The compressor running speed
n controlled the flow rate. The wind tunnel’s temperature level was controlled using an electrical heating system (not shown in
Figure 3) and the coolant mass flow through the chiller. In combination with the inventory forward control (i.e., the amount of working fluid mass in the closed wind tunnel), stable operation conditions were achieved during the tests (for further details see Reinker et al. [
12]). In CLOWT, a two-stage contraction zone accelerates the flow. The first subsonic axisymmetric nozzle (standard diameter DN500 to DN250) offers a moderate contraction ratio of about 3.7. The second nozzle accelerated the fluid up to the desired inflow conditions (see
Figure 3b). In the present study, the second contraction was established by a three-dimensional nozzle based on additive manufacturing.
The second nozzle provided a three-dimensional cross-section change from round to rectangular contraction (standard diameter DN250 to a rectangular cross-section of 50 mm × 100 mm), leading to a total contraction ratio of 39. After passing the two-stage contraction zone, the fluid entered the cascade’s high-speed test section, as shown in
Figure 3b,c. Different inflow turbulence intensities could be achieved through variable screen sets in the settling chamber. Still, during the present study, no additional screen was implemented to provide a moderate inflow turbulence intensity of order
Tu = 0.5% for cascade testing. The turbulence level was experimentally confirmed by hot-wire anemometry, as explained by Reinker and aus der Wiesche [
13]. The inflow turbulence Taylor micro length scale was of order
λ = 4 up to 6 mm.
For the experiments, Novec 649
TM by 3M was used primarily as working fluid. The typical pressure and temperature values at inlet stagnation conditions were 2.5 bar and 97 °C. In addition to the organic vapor, some cascade tests were also performed using dry air at atmospheric conditions (1 bar and 25 °C). In
Table 2, some relevant thermodynamic data are listed for typical process conditions during the present cascade tests. Thermodynamic data of Novec 649 and air were calculated by employing REFPROP and its underlying equation of states (see McLinden et al. [
14]) using actual pressure and temperature measurements. As pointed out by Baumgärtner et al. [
10], the isentropic exponent
κ is expected to be of some relevance for profile loss.
Table 2 shows that the isentropic exponent
κ was significantly lower for Novec 649
TM than for air. Due to the high-density
ρ of Novec 649
TM, high inflow Reynolds numbers
Re1 = c1lρ1/µ1 were achieved for the cascade flow.
The total enthalpy h0 was determined using the wall pressure p0, the (total) temperature T0 was measured at the settling chamber (denoted by subscript 0) and the mass flow rate obtained in the return of the wind tunnel. Since incompressible flow was involved in the settling chamber (with Mach number of order M0 = 10−2), the density ρ0 in the settling chamber was simply calculated using p0 and T0. During steady-state operation, the total enthalpy h0 was assumed to be constant for the contraction and test section; however, a slight temporal drift of system pressure and the temperature was taken into account during the long-term operation of the wind tunnel.
Table 2.
Thermophysical properties of dry air and Novec 649TM at typical pressure and temperature levels (calculated using REFPROP 9.0).
Table 2.
Thermophysical properties of dry air and Novec 649TM at typical pressure and temperature levels (calculated using REFPROP 9.0).
| Fluid | Air | Novec 649 |
|---|
| Pressure level p [MPa] | 0.10 | 0.25 |
| Temperature level T [K] | 298 | 370 |
| Density ρ [kg/m3] | 1.17 | 28.46 |
| Isentropic exponent κ [−] | 1.40 | 1.05 |
| Compressibility factor Z [−] | 1.000 | 0.903 |
| Speed of sound a [m/s] | 346.2 | 90.8 |
| Dynamic viscosity η [Pas] | 1.848 × 10⁻⁵ | 1.389 × 10⁻⁵ |
At the beginning of the high-speed test section, far upstream, the inflow static wall pressure
p1 was obtained through a static pressure tap placed centrally at the entrance of the test section. Further static end-wall pressure taps were located close to the cascade wall downstream (
p1) and upstream of the cascade (
p2) at planes where the total pressures
p01 and
p02 were measured employing traversing Pitot probes, as displayed in
Figure 3c. In addition to the static pressure measurements close to the cascade trailing edge plane, the static pressure
p2 far downstream was measured independently. The employed Pitot probes had a stem diameter of 3 mm, and the probe head diameter was 1 mm. A prior calibration study indicated that the employed Pitot probes were robust against the flow angle within ±10°. Hence, the probes were insensitive to the expected flow angle changes, as in the case of the study of Shelton et al. [
15]. Since the cascade test section’s outflow zone was anything than optimal, as shown in
Figure 2, it was decided to carry out the wake traverse measurements relatively close to the trailing edge plane (at a distance of about 2 mm). Regarding mixing losses, it was not possible to traverse at a downstream plane (
p02) sufficiently far away from the cascade, as recommended by Scholz [
5] and Kiock et al. [
9]. However, that issue was of minor importance for the present purpose (i.e., a comparison of rough and smooth blades).
The accurate determination of pressures for the organic vapor flow requires special attention. In the case of dry air, measurements of static and total pressures can be performed by standard instrumentation using pressure transducers or manometers. In the case of organic vapor flows, condensation issues in pressure lines outside of the hot stream domain can substantially affect the measurements. For scanning the cascade test section pressures (i.e., p1, p2, p01, and p02), a rotatable switching device mounted at a side flange of the test tube was designed and employed for the involved valves. All connecting lines and valves for cascade pressure scanning were mounted inside the hot wind tunnel test tube.
Furthermore, a thermal decoupling device described in detail by Reinker et al. [
16] was employed to avoid condensation issues at the pressure transducer mounted outside. Although previous functionality tests suggested that the leaking effect seemed to be negligible for the rotatable switching device, experiments at higher Mach numbers indicated that some systematic errors occurred during the measurements of the static pressure taps
p2. Therefore, the static pressure
p2* measured independently far downstream of the cascade was employed for data reduction.
2.3. Data Reduction
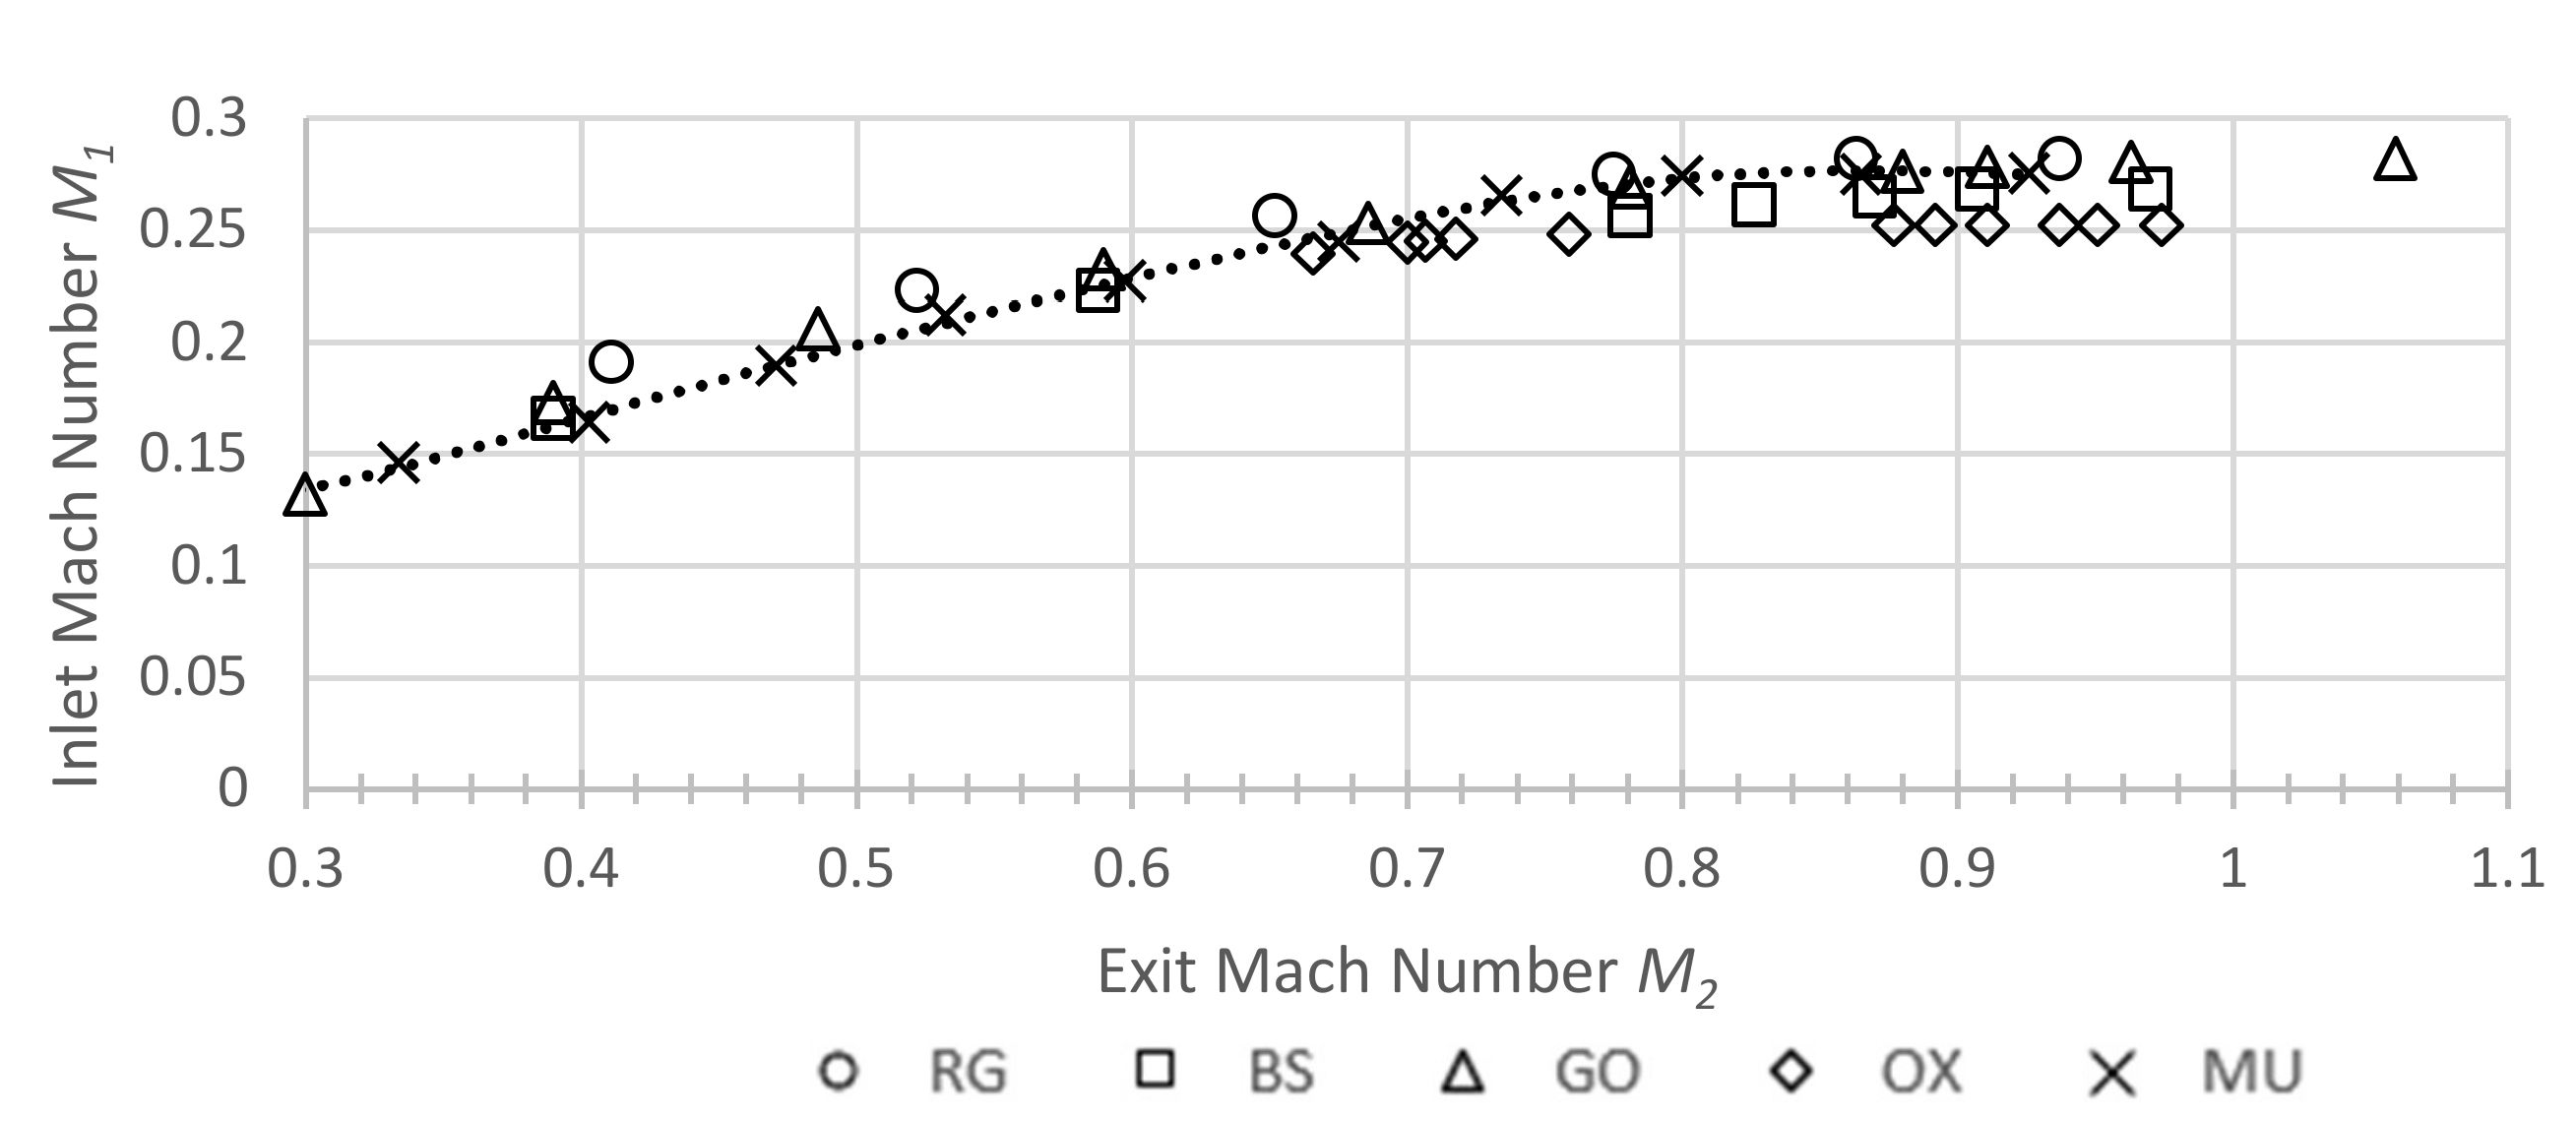
The inflow Mach number
M1 was the primary flow input parameter since the angle of incidence (or inflow angle
β1) was fixed for the present study (see
Figure 1. The inflow Mach number
M1 was calculated through an isentropic relation
M1 =
f(
p01,
p1) for a given stagnation enthalpy
h0 and static pressure
p1. The isentropic relation
f for the inflow Mach number was provided by a separate routine implemented in REFPROP (see McLinden et al. [
14] for details). In non-perfect gas dynamics, the isentropic relations
f are not universal functions as in the case of perfect gas dynamics; instead, they depend on the given initial state
h0 and
p0. Following Shelton et al. [
15], the isentropic exit Mach number M
2is was calculated through an isentropic relation
M2is =
f(
p01,
p2avg) with the inflow total pressure
p01 and the average exit static pressure
p2avg. In the case of a perfect gas, the isentropic relation
f for the exit Mach number can be given as analytical formulas. Substantially more efforts are required for non-perfect gas flows. For the present study, Passmann et al. [
17] proposed a method using REFPROP data of Novec 649. For the total downstream pressure in supersonic flow, a bow shock occurs upstream of a Pitot probe. In supersonic flow, the total pressure
p02m measured by the Pitot probe is related to the actual total pressure
p02 through a normal shock relation. In the case of a perfect gas, the analytical Rayleigh–Pitot equation can be used for calculating the actual exit Mach number
M2 using the static pressure data
p2 and the Pitot probe signal
p02. In supersonic organic vapor flows, it is necessary to solve the coupled set of balance equations (mass, energy, and impulse) numerically for stations upstream and downstream of the normal shock using appropriate equations of states [
17]. Even in the case of high subsonic organic vapor flow, the deviations between a perfect gas expression and a correct thermodynamic treatment of the Pitot probe can be significant [
16]. In the present study, the deviations between the Rayleigh–Pitot Equation (2) and the numerically obtained Mach number
M2 were of order 4 up to 8%.
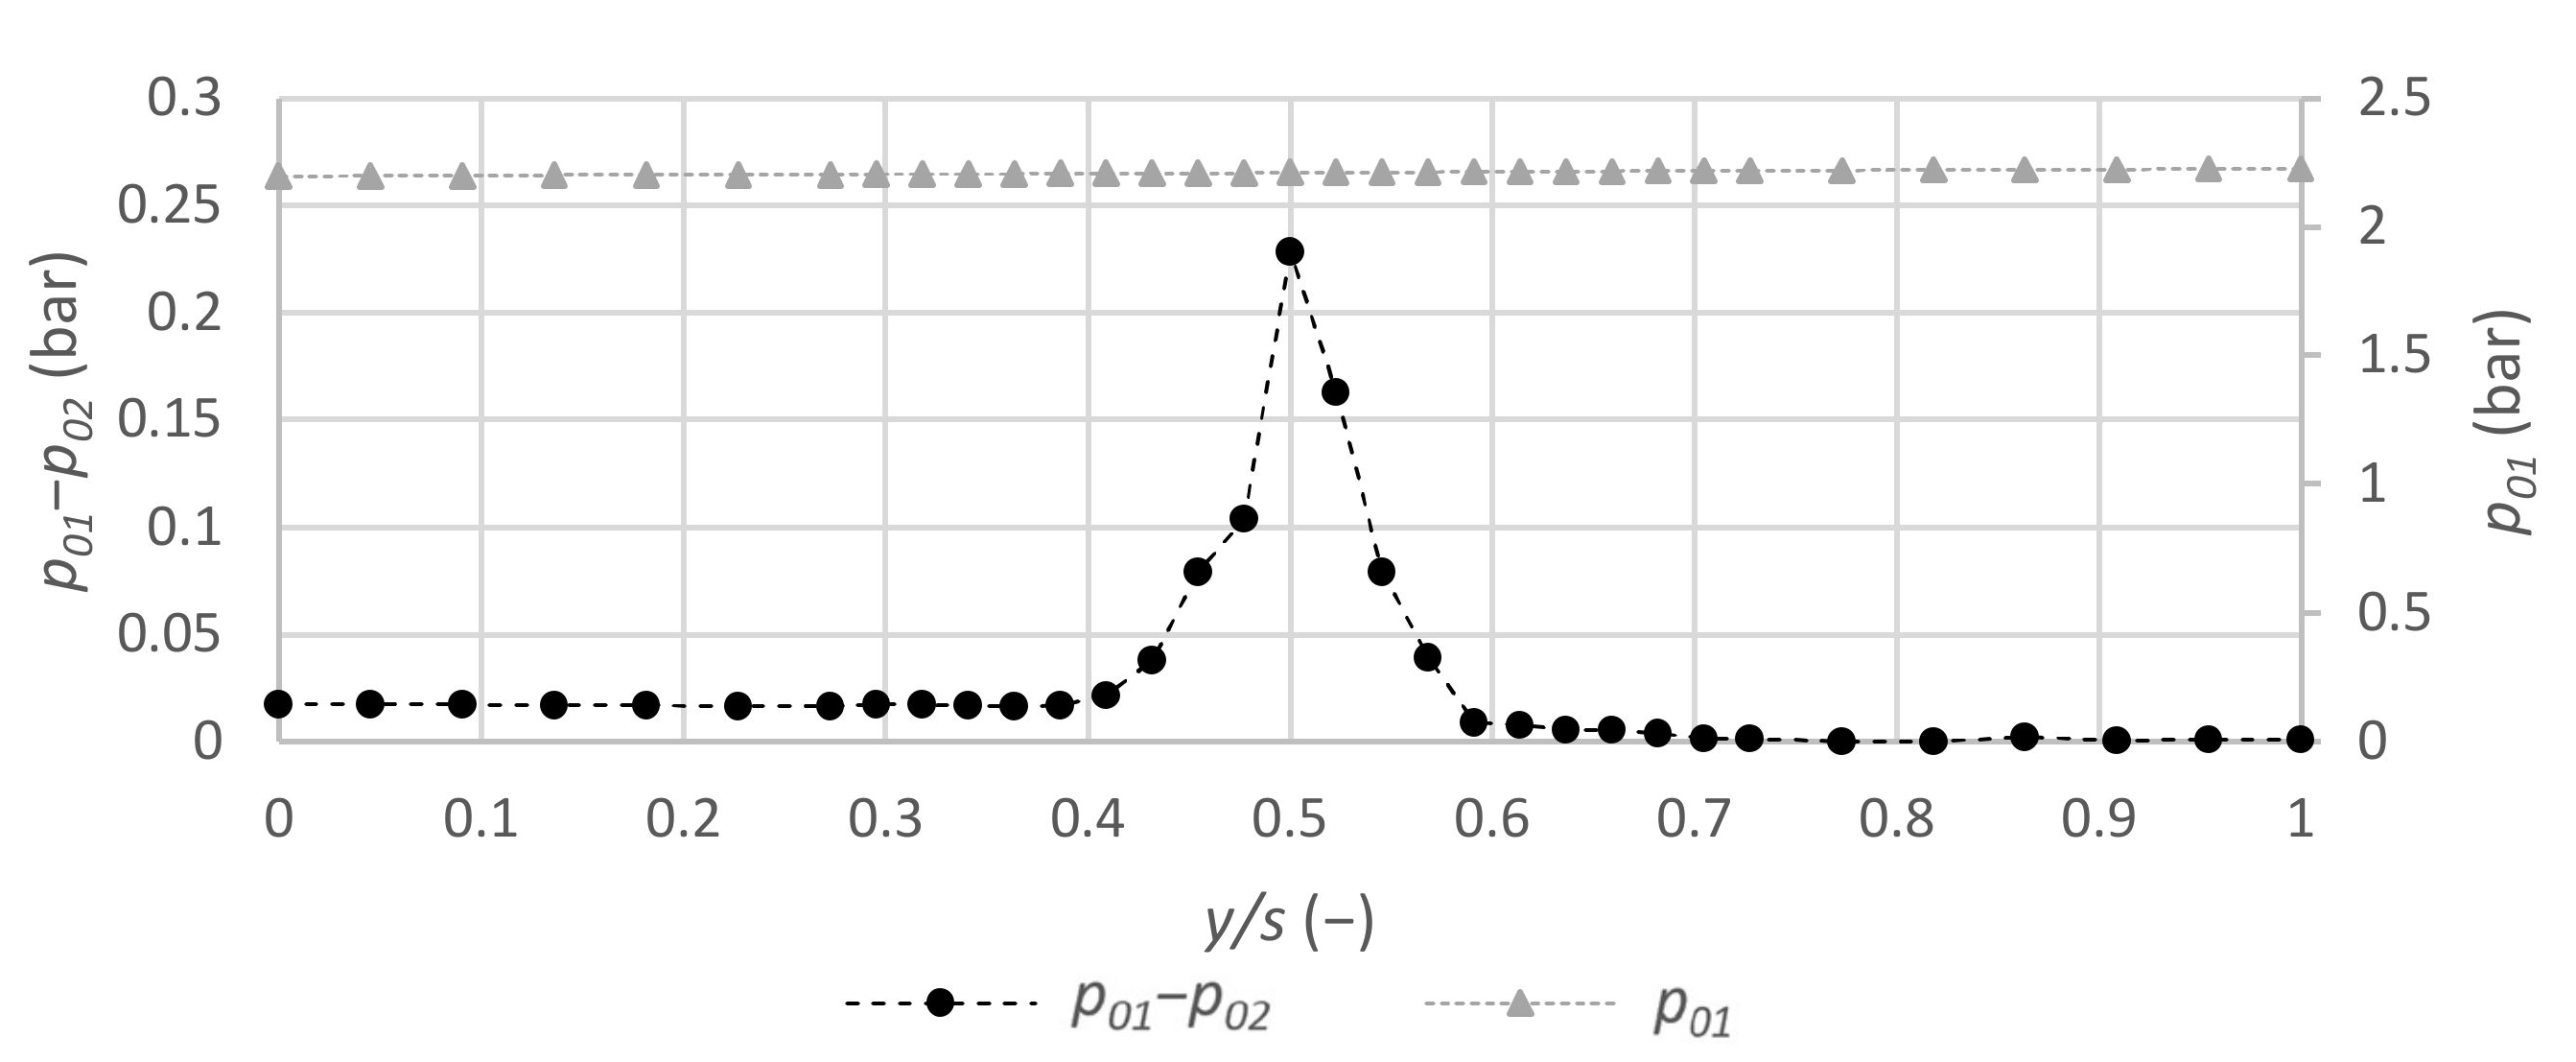
In an ideal cascade experiment,
p01 would not depend on the traverse coordinate
y; however, a weak mal-distribution might occur in actual tests. In the present cascade test section, no noticeable inflow total pressure mal-distribution
p01 was found. An example of upstream total and downstream total pressure distributions for a typical run is shown in
Figure 4. Whereas the inflow total pressure
po1 was nearly constant over the normalized traverse coordinate
y/s, the specific wake flow distribution became visible in the exit total pressure distribution
p02(
y).
A serious question is how to average flow quantities for a given purpose (see, Cumpsty and Horlock [
18] for a discussion of the “correct” averaging procedure). Exit static pressures have to be arithmetically averaged over spacing s to get
p2avg. In the case of total pressures, the so-called mass-weighted average is typically preferred (Dixon and Hall [
19]); however, experimentalists frequently use area-averaged total pressures as well [
18]. The latter approach was chosen in the present treatment, similar to Scholz [
5] or Speidel [
4]. In addition to that averaging issue, different ways for expressing cascade performance and losses are in use. Following Shelton et al. [
15], a total pressure loss coefficient
Y = (
p01 −
p02)
/p01 was defined using averaged total exit pressures
p02 (the inlet total pressure p
01 was practically constant,
Figure 4).
Figure 4.
Examples of total upstream and total downstream pressure difference distributions (Novec 649, M2is = 0.68).
Figure 4.
Examples of total upstream and total downstream pressure difference distributions (Novec 649, M2is = 0.68).
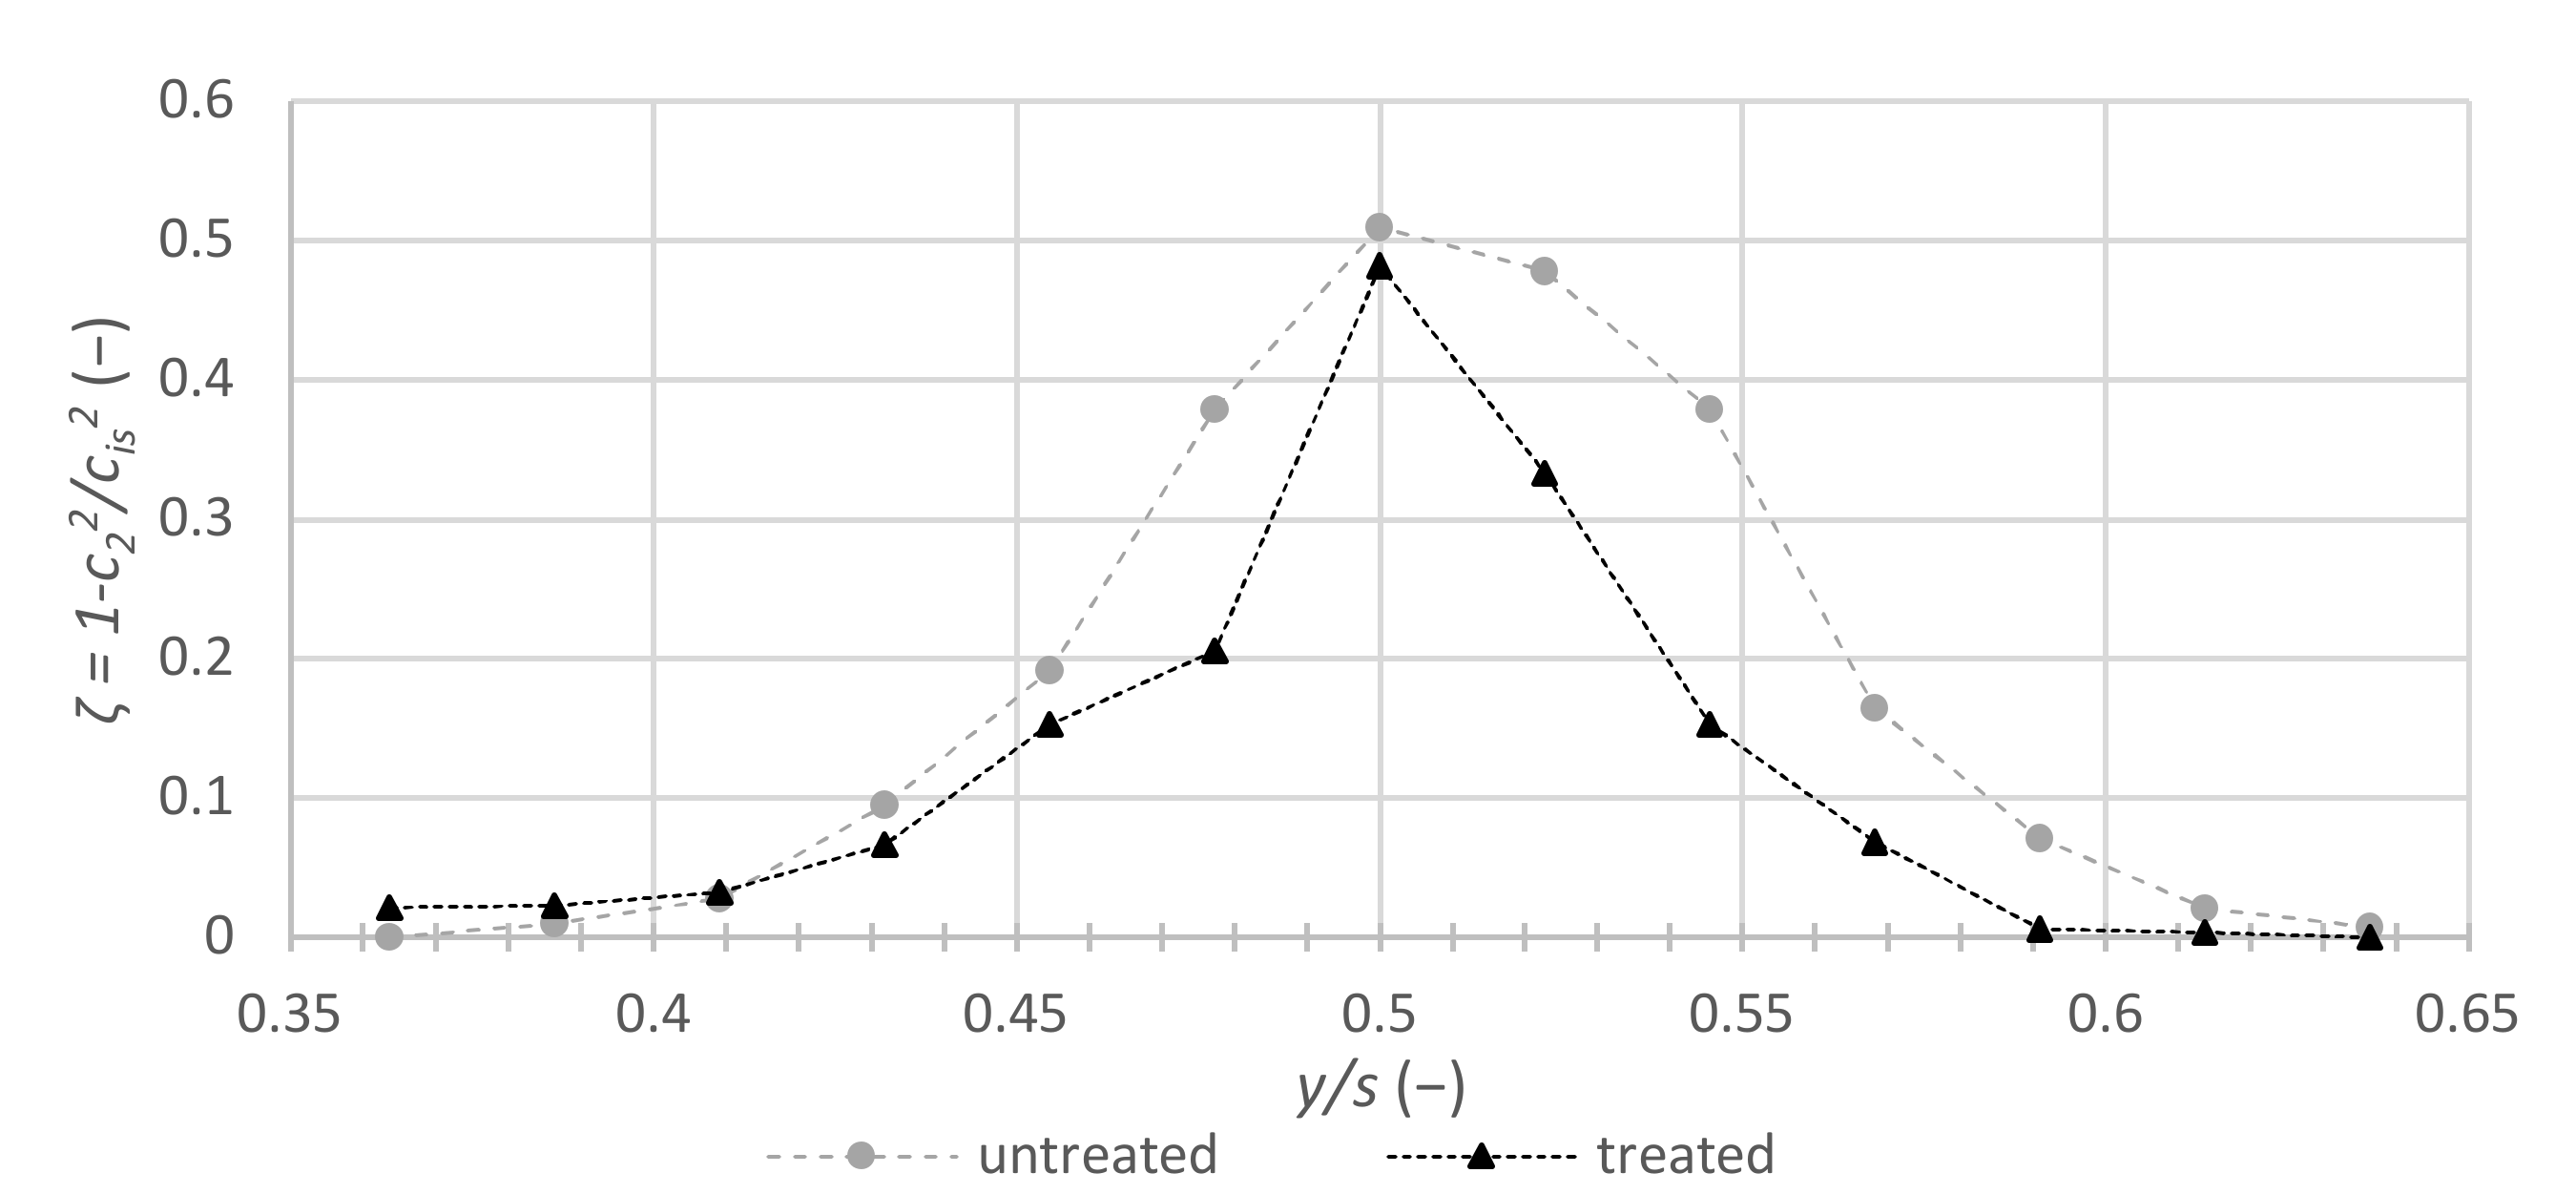
Kiock et al. [
9] preferred an energy loss coefficient
ζ = 1
− c22/c2is2 defined by the actual exit and the isentropic exit velocities
c2 and
c2is, respectively. For the present purpose, the profile loss performance study reported by Kiock et al. [
9] was of significant relevance because this study compared measurements performed independently at four different leading research facilities. Moffat [
20] distinguished between three levels of replication: Nth order, first order, and zeroth order. The Nth order includes variations between different researchers with physically other test facilities. The first order includes variation due to changes in the instrumentation’s calibration and changes in ambient conditions at a particular test facility. In the zeroth-order replication, the process is steady at a specific test facility, and the chief source of error is the inaccuracy of the instrument readings. In validating analytical tools or computational fluid dynamics (CFD) simulation methods, it is desirable to evaluate the magnitudes of the errors occurring in Nth-order replication. It is also useful to know these errors in order to assess non-perfect gas effects on cascade performance for the present study. Kiock et al. [
9] reported significant deviations for the loss results between the four test facilities by considering the same configuration using air. That observation has to be kept in mind when new loss results are presented for an organic vapor.
2.4. Uncertainty Analysis
Experiments with organic vapor flow at elevated pressure and temperature levels require special efforts. The uncertainty of the flow variables can have two uncertainty sources: bias and precision. The total uncertainty of a variable is a combination of both. Although the employed pressure transducers’ uncertainty level was of order 0.1 up to 0.2% (depending on the actual pressure level), a much higher total uncertainty level (of order
Δp/p = 0.5 up to 1.6%) was developed. This substantially higher uncertainty level was mainly given by bias errors caused by condensation in the pressure lines [
16]. In the present case, the condensation issue was the primary source of uncertainty for the pressure measurements. The contribution due to precision was nearly negligible (the precision error was of order 0.01 up to 0.05%). The absolute uncertainty of the temperature measurements (using temperature sensors PT100 1/10 DIN B) was of order
ΔT = 0.1 K (nearly independent on the actual temperature level), yielding to a total relative uncertainty level of
ΔT/T = 0.06 up to 0.1%, including the data logger and precision contributions. The contribution due to precision was only of order 0.01% regarding temperature measurements.
In addition to the above general uncertainty sources for the primary variables pressure and temperature, the thermodynamic properties’ calculation uncertainty due to the selected equation of states and fluid database and the scattering of wind tunnel operation during a measurement run had to be considered for data reduction.
The thermodynamic variables calculation utilized the REFPROP database with the appropriate equation of states for a given fluid [
14]. REFPROP provided information about the uncertainty range of thermodynamic variables, and these uncertainties were treated as bias errors in the uncertainty analysis. For example, REFPROP quoted that the uncertainty in vapor speed of sound was only 0.05%. This value was used as a corresponding bias error contribution to calculate the uncertainty of the Mach number. A substantial level of uncertainty resulted in density calculations. Without considering the systematic error due to the finite accuracy of the thermodynamic equation of states, the total relative uncertainty level for the density was of order
Δρ/ρ = 0.7 up to 2.0% (depending on the pressure and temperature level). Considering the systematic uncertainty due to the thermodynamic equation of states led to
Δρ/ρ = 1.6 up to 3.0%. The uncertainty level of the density affected the total uncertainty of the mass flow rate, and the total relative uncertainty of order
Δm/m = 1.6 up to 4.5% resulted in that quantity. That uncertainty directly affected the Mach and the Reynolds number uncertainty levels for which similar figures were obtained.
The scattering of the wind tunnel operation (i.e., pressure, temperature, and mass flow rate) was within the experimental uncertainty level of the involved instrumentation (see above). The transient temperature drift did not exceed 10−3 K/s.


