Article

Retrofittable Solutions Capability for Gas Turbine Compressors †

1
Department of Industrial Engineering, University of Florence, Via di Santa Marta, 3, 50139 Florence, Italy
2
Ansaldo Energia, Via Nicola Lorenzi, 8, 16152 Genoa, Italy
*
Author to whom correspondence should be addressed.
This paper is an extended version of our paper in Proceedings of the 14th European Turbomachinery Conference, Gdansk, Poland, 12–16 April 2021.
Int. J. Turbomach. Propuls. Power 2022, 7(1), 3; https://0-doi-org.brum.beds.ac.uk/10.3390/ijtpp7010003
Submission received: 15 September 2021 / Revised: 4 January 2022 / Accepted: 7 January 2022 / Published: 11 January 2022

Abstract

:
The increasing introduction of renewable energy capacity has changed the perspective on the operation of conventional power plants, introducing the necessity of reaching extreme off-design conditions. There is a strong interest in the development and optimization of technologies that can be retrofitted to an existing power plant to enhance flexibility as well as increase performance and lower emissions. Under the framework of the European project TURBO-REFLEX, a typical F-class gas turbine compressor designed and manufactured by Ansaldo Energia has been studied. Numerical analyses were performed using the TRAF code, which is a state-of-the-art 3D CFD RANS/URANS flow solver. In order to assess the feasibility of lower minimum environmental load operation, by utilizing a reduction in the compressor outlet mass-flow rate, with a safe stability margin, two different solutions have been analyzed: blow-off extractions and extra-closure of Variable Inlet Guide Vanes. The numerical steady-state results are compared and discussed in relation to an experimental campaign, which was performed by Ansaldo Energia. The purpose is to identify the feasibility of the technologies and implementation opportunity in the existing thermal power plant fleet.

1. Introduction

Renewable energy systems (RES) represent a great revolution for the energy market. Despite their rapid development expected over the next decades, gas-fired power plants are required to maintain a key role in the energy horizon in order to ensure grid stability and peak demand and reach extreme off-design conditions. In fact, RES-based power plants (mainly wind and solar photovoltaic) are realized and convert energy when and where the power source is available, and this is not necessarily matching the community needs.
In order to preserve the grid balance, the existing programmable plants, mainly gas turbine (GT) open and combined cycle, have to modulate their load to compensate the large fluctuations due to the introduction of RES [1], as shown in Figure 1.
Due to their high potential flexibility, GT-based power plants are expected to keep playing a key role in the energy conversion technology framework despite the pushing toward grid decarbonization thanks to the future use of carbon-free fuel such as hydrogen [3].
The increasingly restrictive regulations imposed by the European community have led to strong interest in the development and optimization of technologies that can be retrofitted to an existing combined-cycle power plant to enhance flexibility as well as increase performance and lower emissions (General Electric [4], Alstom Power [5], Ansaldo Energia [6]).
Under the framework of the European project TURBO-REFLEX, some retrofittable solutions have been developed to enhance the minimum environmental load (MEL) capability in axial flow compressors. In fact, the goal is to reduce the MEL in order to have an increased reserve of power to support the stability of the grid.
Possible actions to reduce the MEL of a gas turbine, without detrimental effects on carbon dioxide emissions, include blow-off extraction, the inlet guide vanes (IGV) extra-closure, and inlet bleed heating. The first allows a high mass flow rate to be extracted from the compressor and discharged into the turbine diffuser. The second allows the compressor mass flow rate to decrease, while the load decreases for the same firing temperature. Finally, the third, also called anti-icing, consists in heating the inlet air (e.g., recirculating air from the outlet or using a dedicated heat exchanger). These solutions, which make it possible to significantly reduce the mass flow rate and the power output of the gas turbine, must be carefully analyzed and evaluated in terms of rear stages stability [7,8], ice formation on the first stage blade and vane rows [9,10], unsteadiness, vibrations, and noise emissions, and Heat Recovery Steam Generator (HRSG) temperature limit [11].
This paper aims to evaluate the capability and the robustness of a 3D CFD flow solver to predict the feasibility of lower full-compressor MEL operation by adopting different solutions: blow-off extractions and IGV extra-closure. A typical F-class gas turbine compressor designed and manufactured by Ansaldo Energia has been studied in the framework of the TURBO-REFLEX European project. Numerical analyses were performed using the TRAF code, a state-of-the-art 3D CFD RANS/URANS flow solver [12].
In the first part, numerical steady-state results referring to MEL and other operating conditions with IGV extra-closure will be presented and validated with experimental data available. In the second part, three challenging operating conditions (MEL, MEL with blow-off extraction, MEL with IGV extra-closure and blow-off extraction) have been proposed in order to identify feasibility of the technologies and implementation opportunity in the existing thermal power plant fleet.

2. Computational Framework

In the present work, a state-of-the-art, in-house-developed, RANS/URANS flow solver (TRAF code [12]) has been used. The 3D Reynolds-averaged Navier–Stokes equations are written in conservative form in a curvilinear coordinate system and solved for density, absolute momentum components, and total energy. A second-order Jameson–Schmidt–Turkel (JST) central scheme [13] with scalar artificial dissipation was considered for the discretization of the convective terms, while for the turbulence closure, the high-Reynolds-number formulation of the Wilcox k ω model [14] was selected. The code has been recently validated for the prediction of the characteristics of a multistage axial compressor [15].

2.1. Domain Discretization

The computational domain takes into account the full compressor module composed by 15 stages. Each blade row was discretized using O-type grids with about 1.4 × 10 6 cells per block. The compressor inlet and outlet guide vanes were discretized using H-type meshes with about 1.0 × 10 6 cells per block. The mesh density was selected on the base of a preliminary grid dependency analysis. To guarantee a proper resolution of boundary layers, the y + value of the grid nodes closest to the blade surface is between 1 and 2.
The impact of blade tip clearance modeling was evaluated by comparing two different approaches. The baseline tip model, referred to as “open tip”, was used in a previous study [16]. It exploits a periodic boundary across a non-meshed region over the top of the blade tip to treat the clearance flow as an orifice flow with local interpolation of the conservative variables across the blade tip. In the second model, called “meshed tip”, the blade tip gap region is fully discretized using an O-type mesh (Figure 2a) that matches the external grid in the blade-to-blade plane. The two models adopt the same number of cells in the spanwise direction. The mass flow rate distribution along the entire compressor, with and without the meshed tip rotor, is reported in Figure 2b. The operating condition is the reference one, at the working point, with five mass-flow extractions that are located along the meridional flow-path (indicated as EB in the Figure). It can be easily observed how for the “open tip” model, the outlet mass flow is reduced by 1.8 % , and so it is less conservative as opposed to the “meshed tip” one. For this reason, the new accurate “meshed tip” has been chosen for modeling the compressor rotor blade tip clearance.

2.2. Boundary Conditions

The inlet boundary condition enforces the measured radial distributions of total pressure, total temperature, and flow angles. The inlet turbulence intensity and turbulent length scale are 1.0% and 0.01% of blade height, respectively. At the outlet of the computational domain, the static pressure value has been imposed at the hub, and the radial equilibrium was used to obtain the spanwise distribution.
The compressed fluid is humid air and was modeled as a real gas. In all the presented simulations, mixing planes with non-reflecting boundary conditions (Giles [17,18]) have been adopted to couple consecutive rows. A local matching interface was used between the last stator and the OGV since they share the same blade count [6,19].

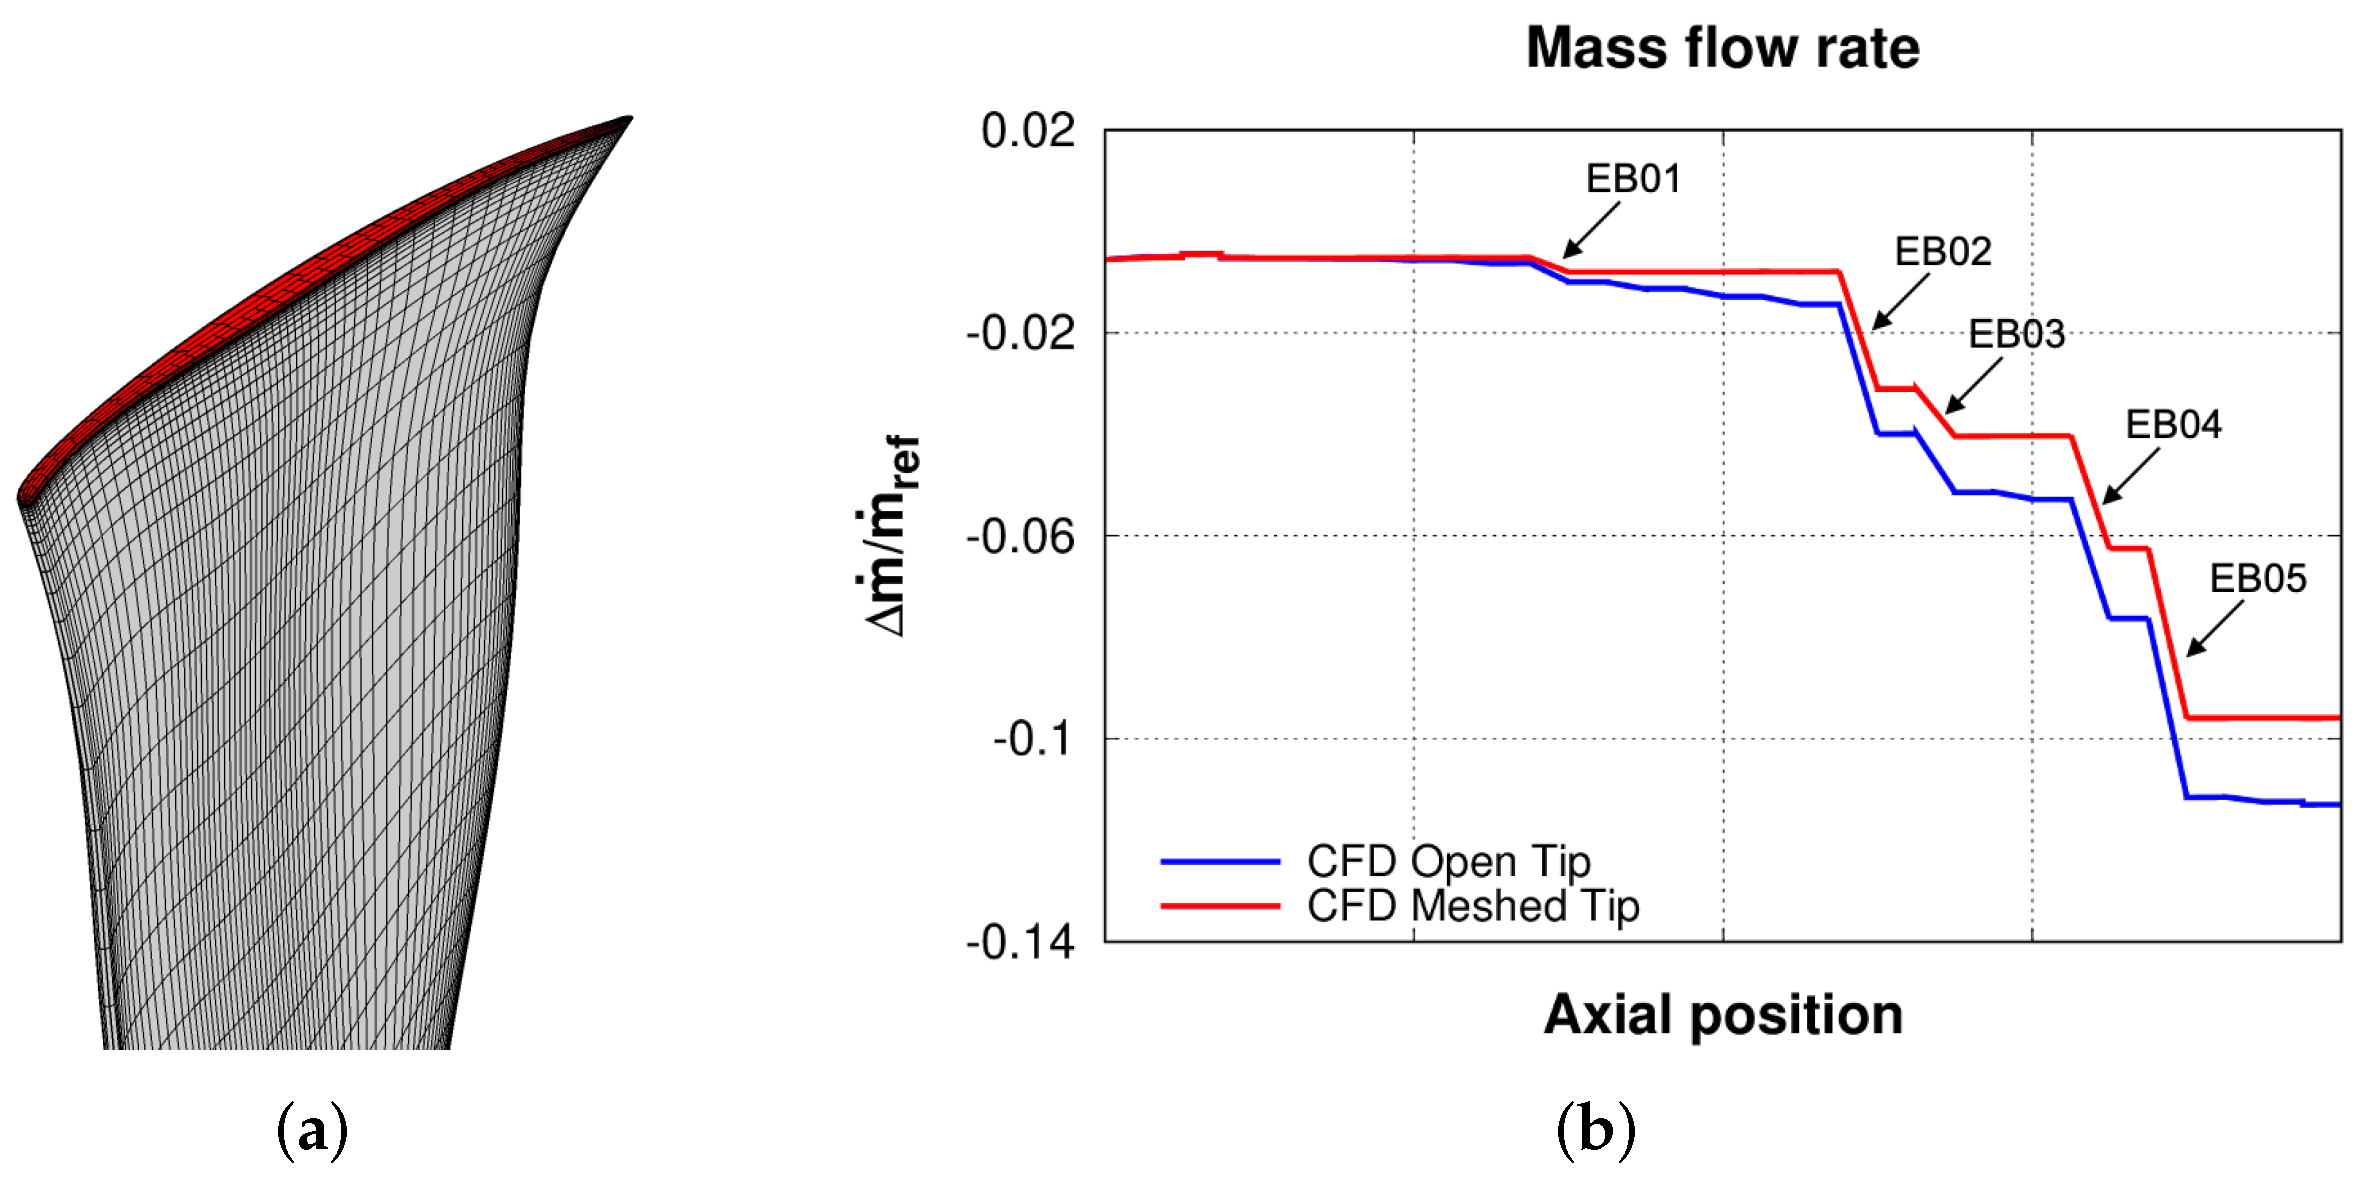
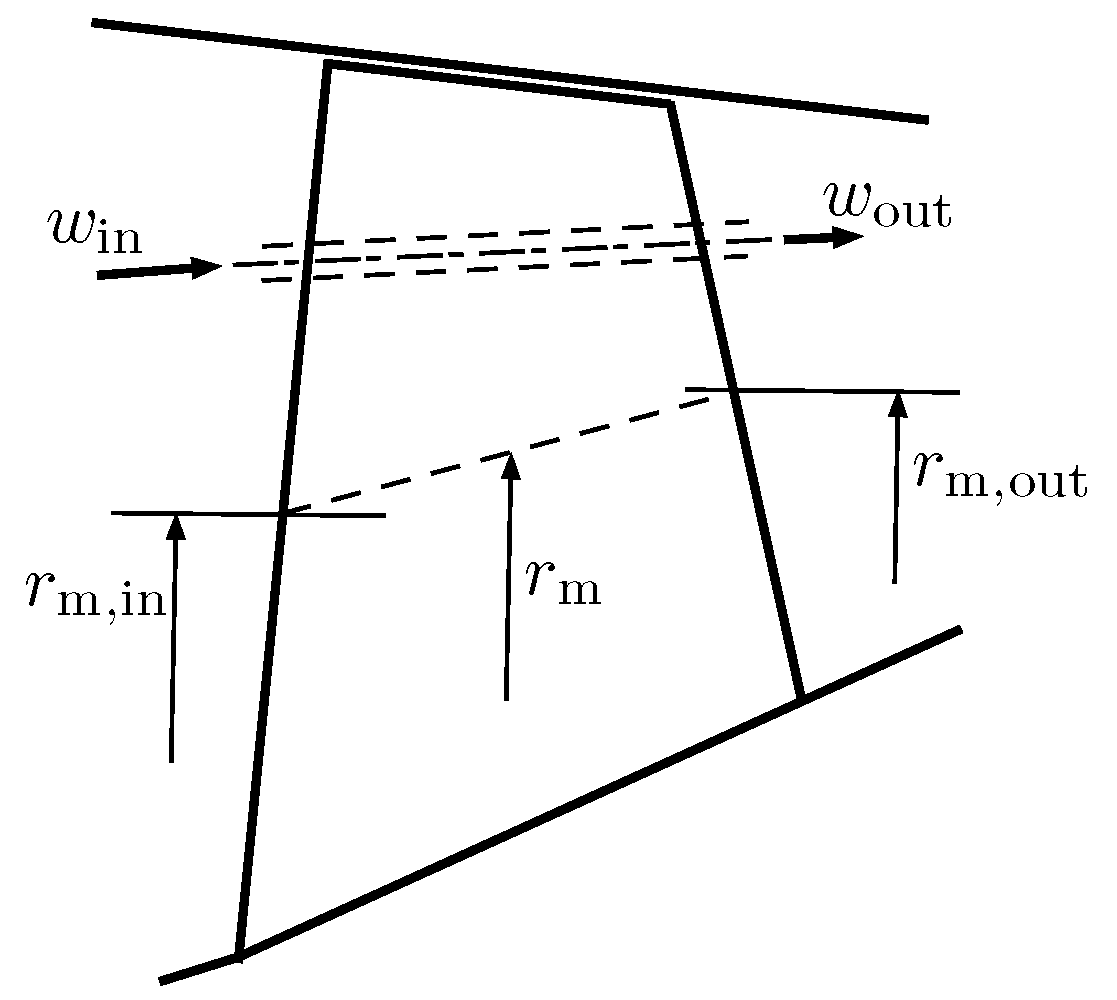
2.3. Mass Extraction Treatment

The mass flow extraction occurs through bleeding slots located in the compressor casing, and the bleed mass flow rate is controlled by blow-off valves. In order to simulate the blow-off, outflow boundary conditions are applied in the tip endwall regions corresponding to the bleeding slots. A constant static pressure is prescribed, and the other flow variables are extrapolated from the interior of the computational domain. The prescribed pressure value is iteratively adjusted to match the desired amount of extracted mass flow rate.

3. Results

An industrial, F-class axial compressor designed, manufactured, and experimentally tested by Ansaldo Energia has been studied in the present work. The configuration corresponds to 15-stages plus IGV and OGV, with five mass-flow extractions located along the meridional flow-path, some positioned on the hub end-wall and others at the casing. All the vanes, excluding IGV and OGV are shrouded. The effects of seal cavity flow on the mainstream have been considered using a simplified one-dimensional correlation-based cavity model [20].
The regulation of the mass flow has been used to modulate the gas turbine power output. To this aim, two different solutions have been investigated: blow-off extraction and IGV extra-closure. The IGV and the first stator blade have a variable stagger configuration. The stagger angle of these two rows can be modified independently. In the computational model, the IGV blade is considered always in contact with the internal/external wall so that clearances effects are not accounted for in the CFD analyses.
In the first part of the work, numerical steady-state results referring to MEL and other operating conditions with IGV extra-closure are discussed and validated with experimental data. In the second part, three challenging operating conditions of MEL with/without blow-off extraction and IGV extra-closure are proposed in order to assess the feasibility of the technological solutions and their possible implementation in the existing combined-cycle power plant fleet.
Each CFD simulation required about nine hours, running on 64-core processor Intel® Xeon® CPU E5-2680 v2 @ 2.80 GHz, to reach the steady state convergence. The RMS residual experiences a drop of four decades in about 5000 multi-grid cycles on two grid levels. For all the calculated operating points, the solution convergence was obtained with approximately the same number of iterations showing a good robustness even in presence of separated flow regions inside the computational domain.

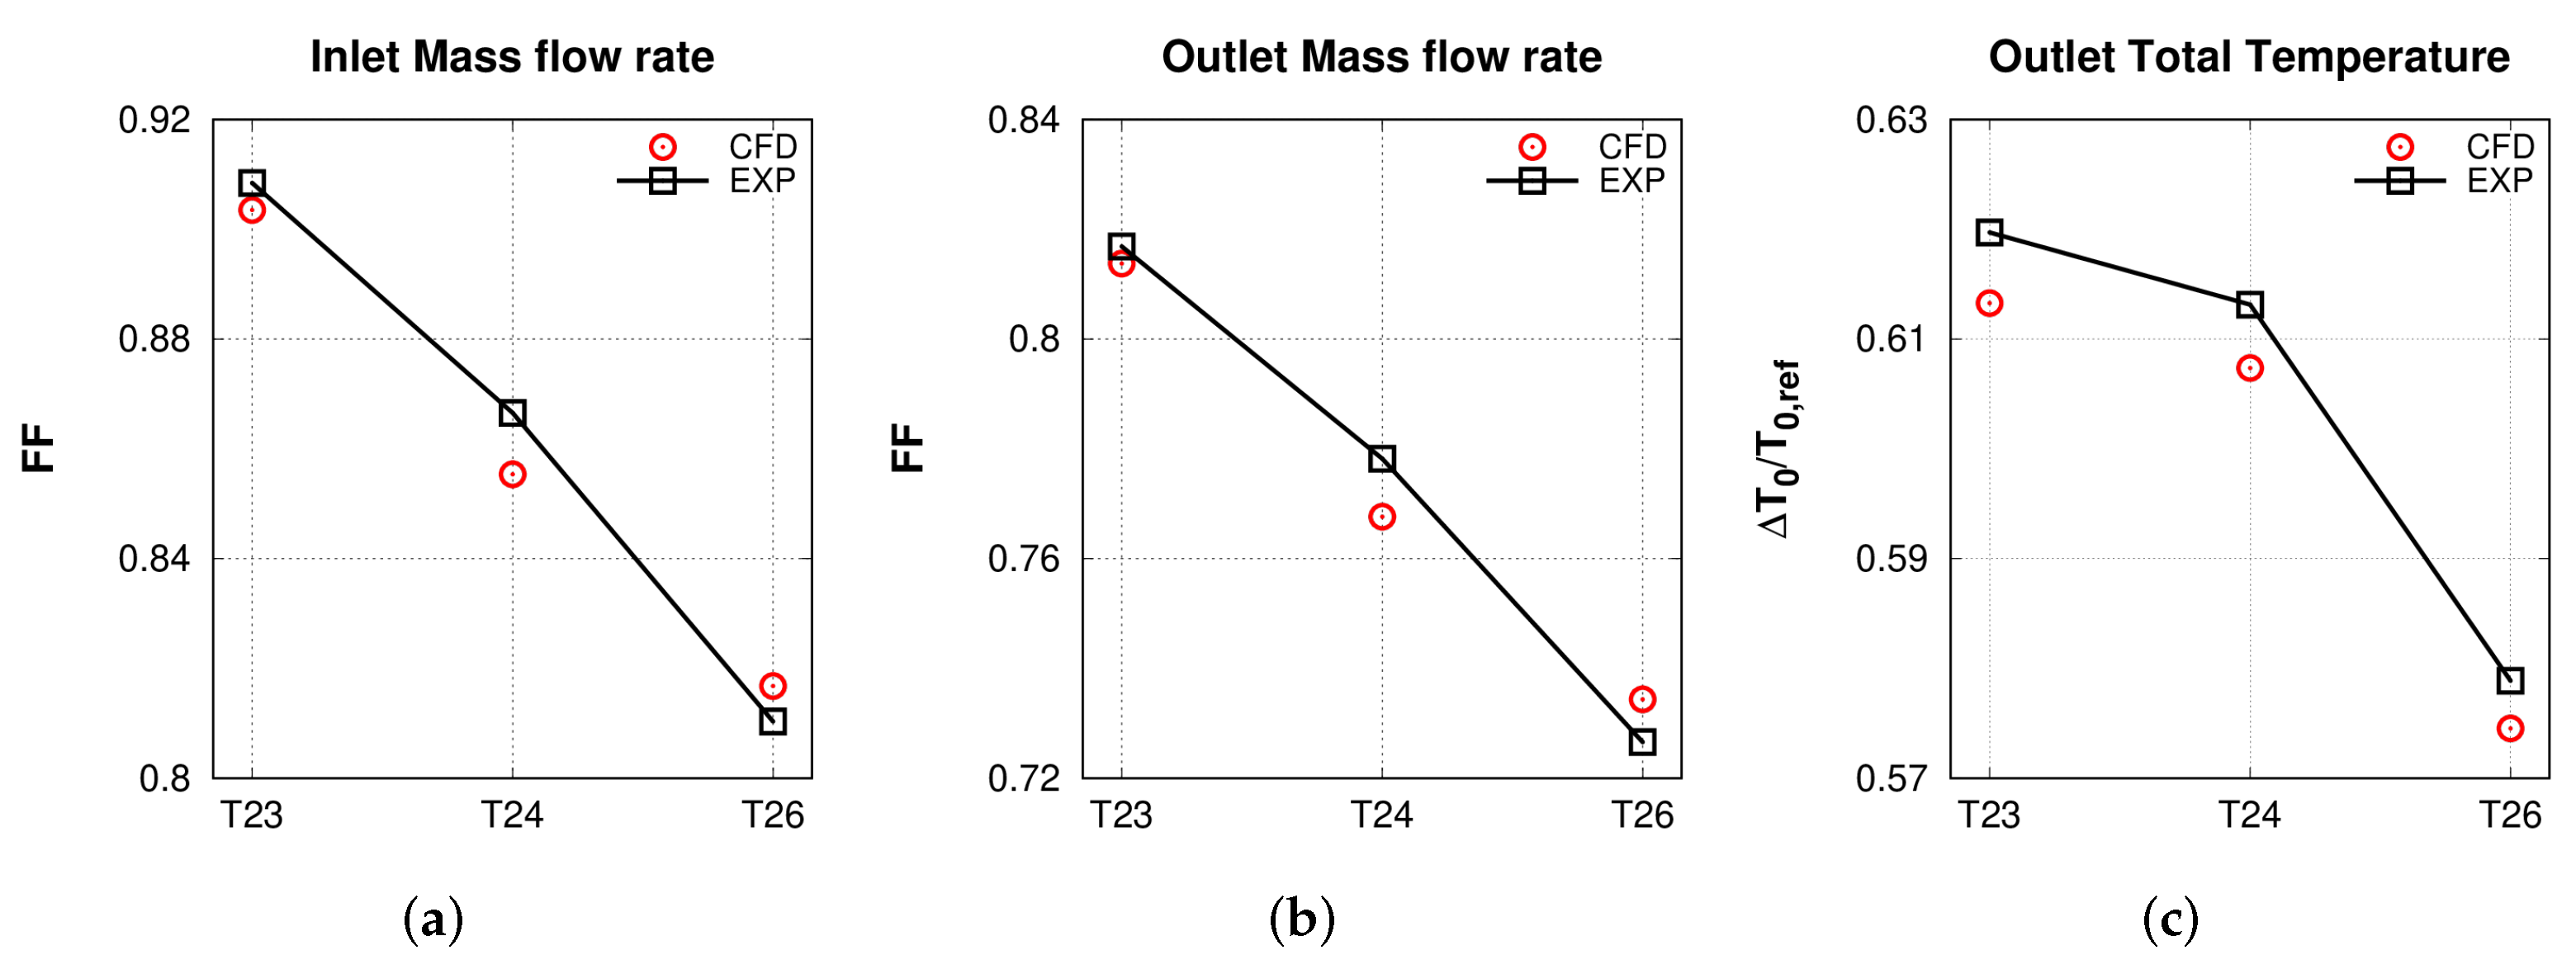
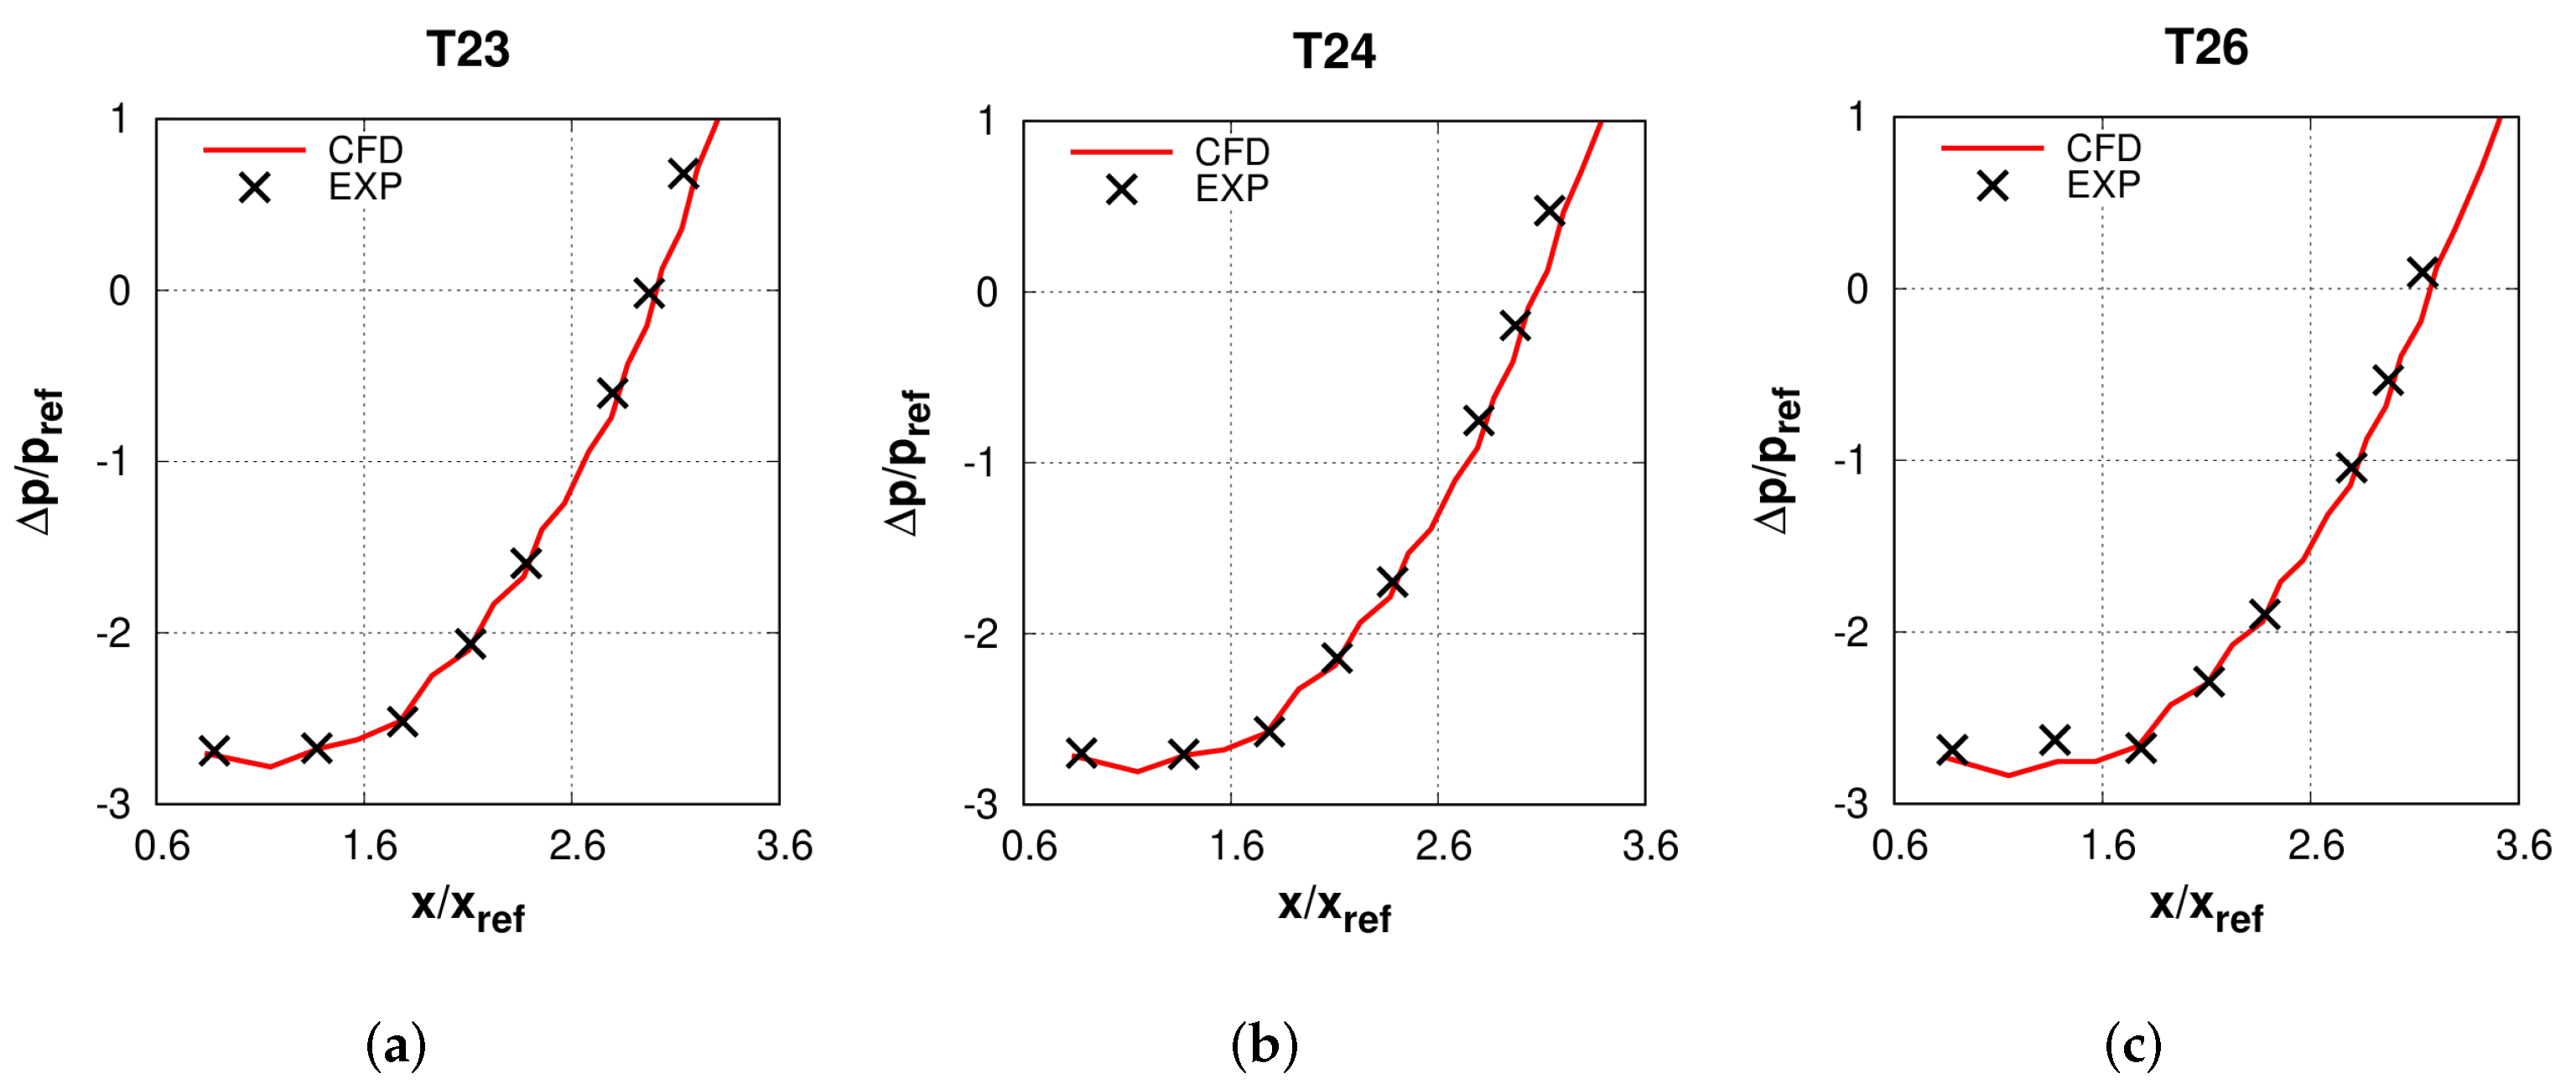
3.1. Comparison with Measurements

The first part of the work is devoted to investigating the compressor operation in the off-design condition, referred to as MEL with IGV extra-closure. This strategy can significantly reduce the mass flow elaborated and the power output of the gas turbine; however, a careful analysis of the compressor aerodynamics is required to assure that no stability issues will afflict the operation.
The experimental campaign was carried out by Ansaldo Energia, testing the machine at three different IGV extra-closure configurations, with the current MEL operating condition. An assessment of the CFD results is presented by a detailed comparison with the corresponding experimental data. In particular, the computational model was validated for the T23 configuration (representing the MEL one) and the T24 and T26 configurations, which have an IGV and first stator blade stagger variation with respect to standard MEL, which can been modified independently. The inlet total temperature for the T23 and T24 configurations is almost identical, while the T26 has a lower inlet value ( Δ T 8 °). In terms of inlet total pressure, the tests with IGV extra-closure have a slightly higher value with respect to the one corresponding to T23 ( Δ p + 0.4 % ).
The numerical results in terms of predicted flow function at compressor inlet and outlet are compared with the experimental data in Figure 3a,b, respectively. The inlet flow function values are scaled as:
F F = F F x F F r e f / F F m e a n , T 23 ,
where x is equal to T23, T24, and T26. The agreement between numerical results and measured data is good. The averaged total temperature at the outlet shown in Figure 3c appears to be slightly underestimated for all the three cases. Consequently, numerical analyses tend to overestimate the total-to-total adiabatic efficiency and to underestimate the compressor’s work input.
Figure 4 shows the static pressure distribution at the casing compared with the values measured by eight pressure taps along the meridional channel, highlighting a good matching with the experimental results for all the operating points. Slight discrepancies can be observed for the last measuring station, located upstream of the rotor row of stage nine.

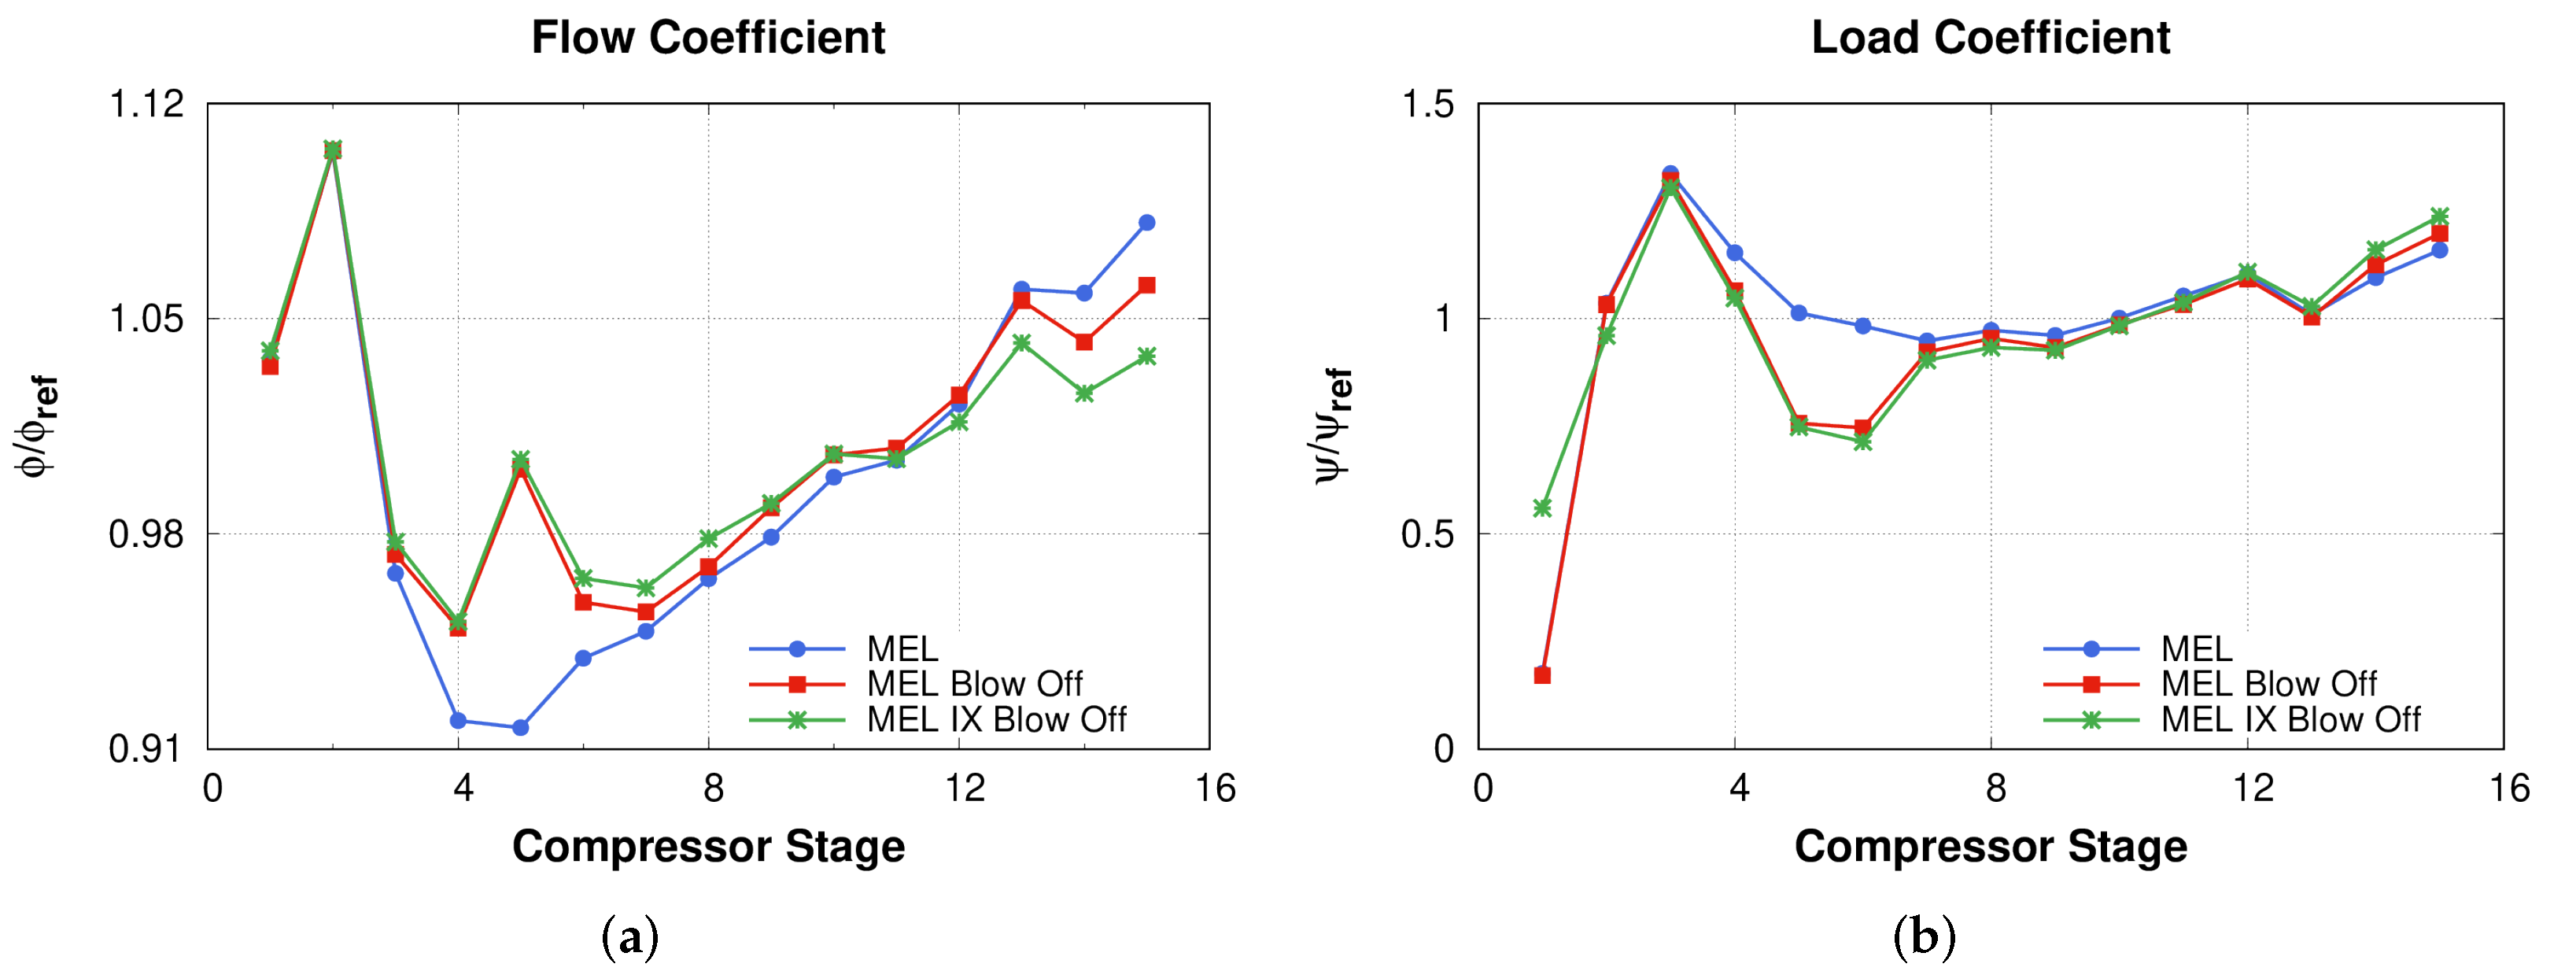
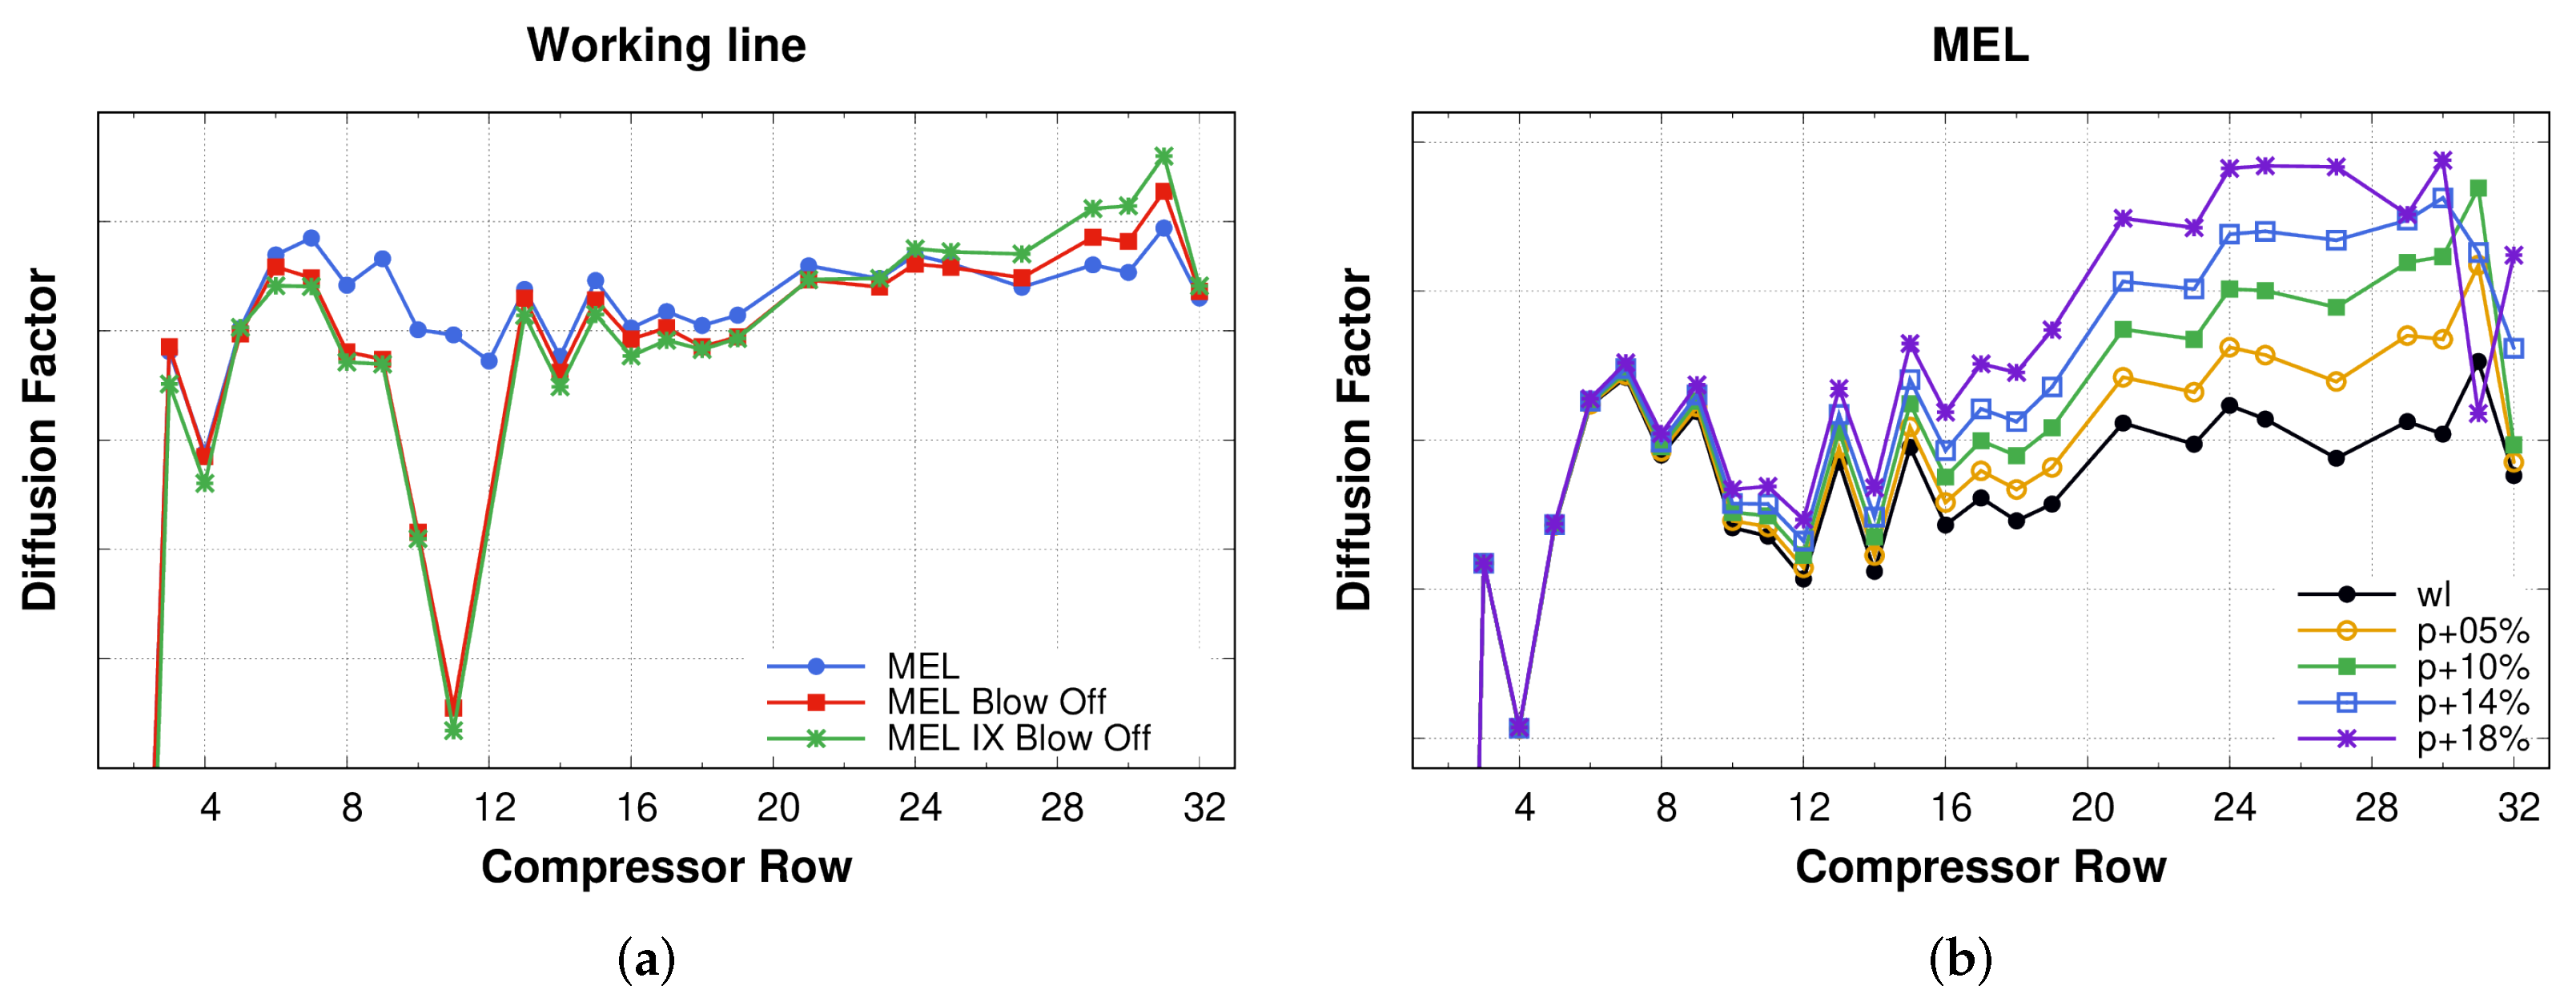
3.2. Minimum Environmental Load Reduction Strategies

The feasibility of viable strategies to further reduce the GT load is investigated using the previously assessed numerical framework.
Axial compressors are always equipped with blow-off valves to bypass part of the compressed air to the turbine exhaust. Usually these valves are used during the startup of the GT to avoid compressor instabilities. In the framework of the Turbo-Reflex project, the possibility of using the BO valves to further reduce the minimum environmental load was investigated. The use of BO valves was additionally combined with IGV extra-closure. With this aim, some operating conditions were analyzed with the same compressor inlet boundary conditions (total temperature, total pressure, and absolute flow angle). The discharge pressure of the compressor was varied in a wide range in order to find the numerical surge margin of the compressor. Three operating conditions have been considered: the reference one, at the minimum environmental load (MEL), the one with an open blow-off valve located before the sixth rotor leading edge (MEL blow-off), and finally the one with an IGV extra-closure, which has a stagger variation with respect to the standard case (MEL IX blow-off). The reduction in the MEL condition by these two different strategies (IGV extra-closure and blow-off valve) will be presented in this section.
Figure 5 shows the total pressure ratio and efficiency characteristics. All values are reported with respect to the working line at the MEL condition. These curves are obtained by progressively increasing the outlet static pressure, starting from the working line condition. The combined opening of the blow-off valves and the extra-closure of the IGV (MEL IX blow-off) reduces the power plant output and penalizes the compressor efficiency. Both strategies reduce the gas turbine pressure ratio with respect to standard MEL, as reported in Figure 5a. In particular, the IGV extra-closure reduces the mass flow with respect to standard MEL. The mass flow reduction led to a lower pressure ratio; then, if flame temperature is fixed, it results in a Turbine Exit Temperature (TET) increase. The blow-off opening more significantly reduces the mass flow in the last stages of the compressor, the combustion chamber, and the turbine. Provided the blow-off mass flow is reinjected into the turbine diffuser, it may greatly reduce the TET.
The main operating differences between the three configurations can be appreciated in terms of stage flow coefficient (Figure 6a) and load coefficient (Figure 6b). For stages 4, 5, and 6, there is a load reduction toward the bleed position, followed by a gradual increase toward the end in which the highest value is reached on the last stage. The evolution of the Lieblein’s diffusion factor value along the compressor shown in Figure 7a was used as a mean to check the impact of the MEL reduction strategies on the compressor’s aerodynamics.
Local values of the Lieblein’s diffusion factor are initially calculated with reference to meridional streamtubes and accounts for radius changes and AVDR, i.e., three-dimensional aspects of the flow in each blade row:
D F = 1 w o u t w i n + Δ ( r w θ ) 2 σ m r m w i n
Equation (1) is applied along streamtubes between the blade leading and trailing edges, with velocities taken as relative to the blade row (see the sketch in Figure 8). The blade row solidity σ m is calculated, with reference to the mean streamtube, i.e., the one that equally divides the mass flow rate along the blade height (Figure 8):
σ m = C m s m , s m = 2 π r m N , r m = r m , i n + r m , o u t 2
where C m is the distance between the blade leading and trailing edges locations. Finally, the local diffusion factors corresponding to the various streamtubes are averaged in order to obtain a single D F value which is taken as representative of the entire blade row.
In this work, D F is used as a metric for the loading limit of each blade row and hence for aerodynamic stability of the compressor. The higher the diffusion factor, the lower the blade row stall margin.
The blow-off is located at rotor 6 or row 12, and the figure shows that as the flow approaches the bleed, the diffusion factor decreases. Overcoming the bleed, the diffusion factor increases sharply until the last stage (stator 15), where it reaches the highest value. When the IGV extra-closure is combined with the BO opening, the diffusion factor increases further in the final stage.
Therefore, with these two strategies (MEL blow-off and MEL IX blow-off), there is a reduction in the load in the first part of the compressor (rows 6–24) and then an increase in the load in the last three stages, as confirmed by Figure 6b.
Figure 7b shows the evolution of the DF at MEL condition, varying the discharge pressure of the compressor in a wide range up to 18% of the working line. In the last stator (vane 15 or row 31), the main differences are concentrated. Up to 10%, the diffusion factor has the highest values for the entire compressor. Then, at 14%, it starts to decrease, and at 18%, there is a drastic drop. In fact, based on CFD stage characteristics (Figure 9a), stage 15 reaches the numerical stability margin at 14% of the discharge pressure.
Figure 9 reports the compressor map for the stages 11–15. The numerical stability limit is identified using the peak stage pressure ratio. The numerical surge margin is defined on the base of the numerical stability limit.
Recirculation regions close to the compressor endwall for the stages from 10 to 15 with OGV are reported in Figure 10. They suggest that if the hub corner separation is assumed to be most relevant source of instability, the stall mechanism does not change for the three operating conditions. Considering the stage 15 characteristic (Figure 9), the numerical stability margin for MEL, IX, and IX blow-off operating conditions, respectively, is progressively reduced. Such observation is in agreement with the stage 15 diffusion factor at the working point (Figure 7a) which for IX and IX with blow-off operating conditions is progressively higher compared to the value assumed in the MEL condition.
The numerical analysis predicts a wide corner separation at the hub of the stator rows, as observed in similar conditions by other authors (Vo, 2008 [21], Lei, 2008 [22]). This flow structure is more visible for the fourteenth stator row and increases its dimension on the CV15 and OGV. Increasing the back-pressure, the hub corner stall increases both in terms of size and spanwise penetration, indicating that the last stages are about to give up [23].

4. Conclusions

In the present work, the capability and robustness of a 3D CFD flow solver to predict the feasibility of lower full-compressor MEL operation have been evaluated. Two different solutions have been analyzed: blow-off extraction and IGV extra-closure.
Numerical steady-state results at three different IGV extra-closure configurations with the current MEL operating conditions have been presented and validated with experimental data. A good accuracy in terms of calculated mass flow rate and total temperature has been achieved by employing a meshed tip gap with respect to an open tip strategy. Even for the most critical condition, the CFD results are perfectly in line with the experimental ones. The significant reduction in mass flow rate and power output gas turbine was well reproduced.
In the second part of the work, three challenging operating conditions have been analyzed: standard MEL, with an open blow-off valve, and an IGV extra-closure. The combined strategies reduce the power plant output. In particular, an additional increase in the diffusion factor and a reduction in the mass flow through the last stages is obtained using the blow-off valve opening. Coupling the BO opening and the IGV extra-closure allows a further reduction in the mass flow rate followed by the diffusion factor augmentation in the rear part of the compressor. The main differences between the considered operating conditions are found to be concentrated in the last stator row. In particular, stage 15 characteristics show that the numerical stability margin for MEL, IX, and IX blow-off operating conditions is progressively reduced. The numerical analysis predicts a wide hub corner separation in CV14, CV15, and OGV that increases in size when increasing the back pressure.
The viability of both technologies in the existing thermal power plant fleet has been verified. By opening blow-off valves or extra-closing the IGV, the gas turbine is able to operate with less mass flow at constant flame temperature and therefore produce less power and burn less fuel than in the standard case.
It is believed that the proposed numerical framework and setup is feasible and is able to provide reliable performance figures in the analysis of industrial compressors operating in strong off-design conditions.

Author Contributions

Conceptualization, P.A., M.B., S.G.M., methodology, R.P., M.M., M.R., software, M.R., R.P., M.M., validation, M.R., M.M., R.P., S.G.M., M.B., formal analysis, R.P., M.M., investigation, M.R., S.G.M., M.B., writing—original draft preparation, M.R., R.P., M.M., writing—review and editing, R.P., M.M., visualization, M.R., supervision, P.A., S.G.M., R.P., M.M., project administration, P.A., M.B., S.G.M., M.M., R.P. All authors have read and agreed to the published version of the manuscript.

Funding

This research was funded by European Union’s Horizon 2020 research and innovation programme under grant agreement No. 764545.

Data Availability Statement

Not applicable.

Acknowledgments

We would like to thank our fellow partners in European Union’s H2020 programme TURBO-REFLEX for permitting the publication of our results in this paper.

Conflicts of Interest

The authors declare no conflict of interest.

Abbreviations

The following abbreviations are used in this manuscript:
BOBlow-off
IGVInlet guide vane
IXIGV extra-closure
MELMinimum environmental load
OGVOutlet guide vane
RESRenewable energy systems
TETTotal exit temperature
Nomenclature
A V D R Axial velocity by density ratio, A V D R = ( ρ c x ) o u t ( ρ c x ) i n
cAbsolute velocity
CBlade chord
D F Diffusion factor (Lieblein), D F = 1 w o u t w i n + Δ ( r w θ ) 2 σ m r m w i n
F F Inlet flow function, F F = m ˙ T 0 p 0
hSpecific enthalpy
m ˙ Mass flow rate
NNumber of blades
pPressure
rRadius
sBlade row tangential spacing
uPeripheral velocity, u = Ω r
TAbsolute temperature
xAxial coordinate
wRelative velocity
WCompressor power input
β Pressure ratio
η Isentropic efficiency
ϕ Flow coefficient, ϕ = c x u
ψ Load coefficient, ψ = Δ h 0 u 2
σ Blade row mean solidity, σ = C m s m
Subscripts
0Total quantity
inInlet
mMean
outOutlet
refReference
ttTotal-to-total
xAxial
ρ Density
θ Tangential

References

  1. Ruchti, C.; Olia, H.; Franitza, K.; Ehrsam, A.; Bauver, W. Combined Cycle Power Plants as Ideal Solution to Balance Grid Fluctuations—Fast Start-Up Capabilities. In Proceedings of the 43th Colloquium of Power Plant Technology., Dresden, Germany, 18–19 September 2011. [Google Scholar]
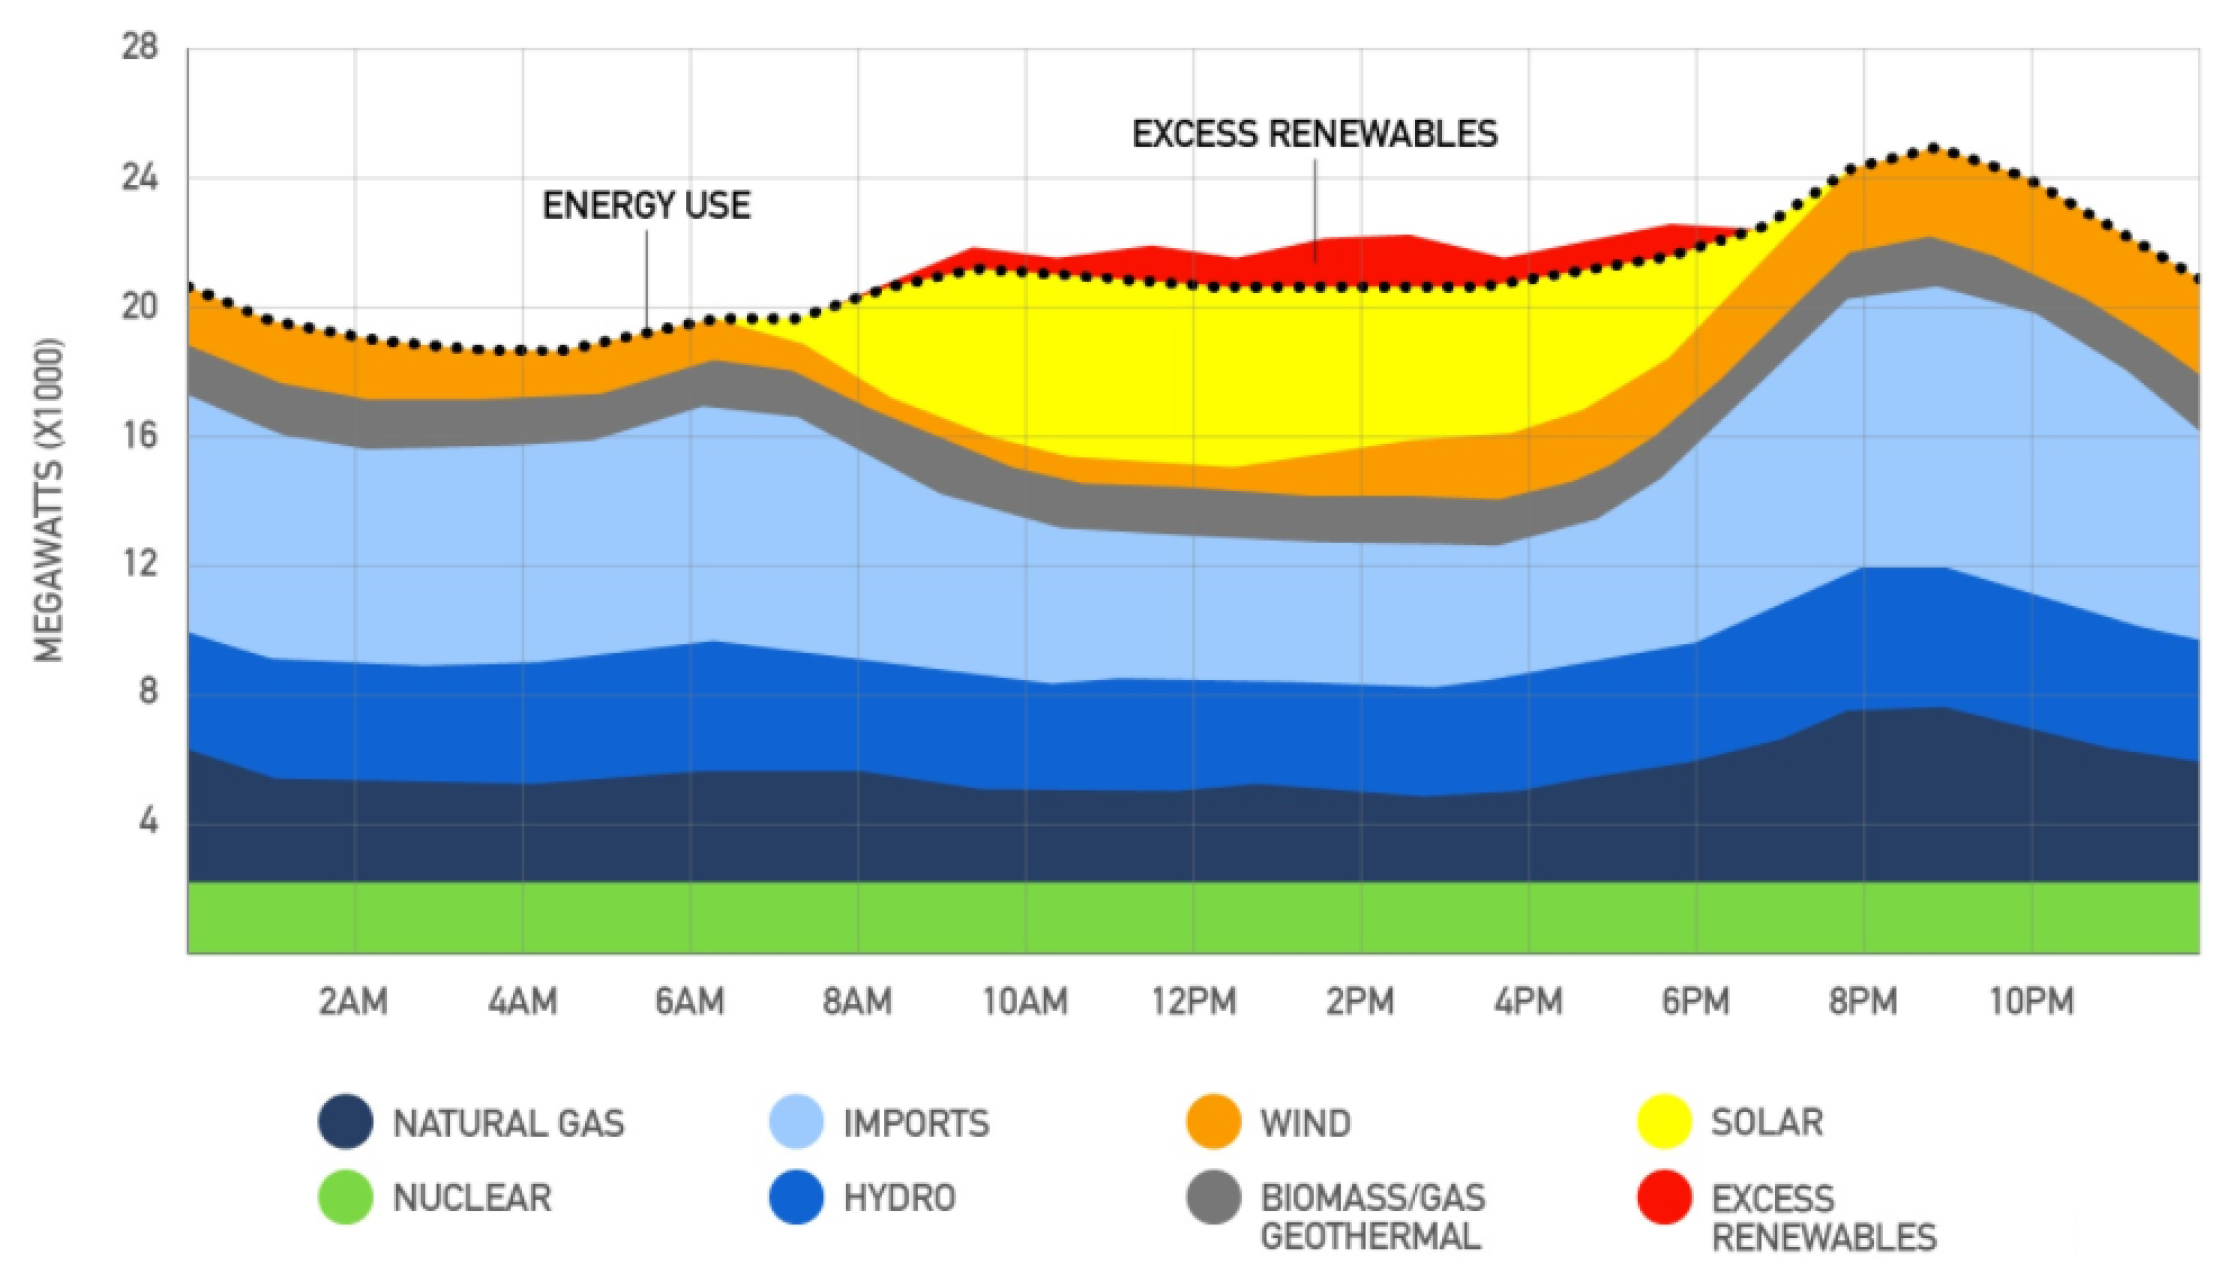
  2. Hailye/KQED, T. California ISO. Available online: https://www.kqed.org/science/610026/what-will-california-do-with-too-much-solar (accessed on 15 September 2021).
  3. Chiesa, P.; Lozza, G.; Mazzocchi, L. Using Hydrogen as Gas Turbine Fuel. J. Eng. Gas Turbines Power 2005, 127, 73–80. [Google Scholar] [CrossRef] [Green Version]
  4. Magni, F.; Grimm, F.; Sorato, S.; Micheli, M. GT13E2 Low Part Load Operation: Extended Flexibility Down to 30% Load. In Turbo Expo: Power for Land, Sea, and Air; Volume 3: Coal, Biomass and Alternative Fuels; Cycle Innovations; Electric Power; Industrial and Cogeneration; Organic Rankine Cycle Power Systems; ASME: New York, NY, USA, 2016. [Google Scholar] [CrossRef]
  5. Therkorn, D.; Gassner, M.; Lonneux, V.; Zhang, M.; Bernero, S. CCPP Operational Flexibility Extension Below 30% Load Using Reheat Burner Switch-Off Concept. In Turbo Expo: Power for Land, Sea, and Air; Volume 3: Coal, Biomass and Alternative Fuels; Cycle Innovations; Electric Power; Industrial and Cogeneration; ASME: New York, NY, USA, 2015. [Google Scholar] [CrossRef]
  6. Cioffi, M.; Piola, S.; Puppo, E.; Silingardi, A.; Bonzani, F. Minimum Environmental Load Reduction in Heavy Duty Gas Turbine by Bleeding Lines. In Turbo Expo: Power for Land, Sea, and Air; Volume 3A: Coal, Biomass and Alternative Fuels; Cycle Innovations; Electric Power; Industrial and Cogeneration; ASME: New York, NY, USA, 2014. [Google Scholar] [CrossRef]
  7. Cozzi, L.; Rubechini, F.; Marconcini, M.; Arnone, A.; Astrua, P.; Schneider, A.; Silingardi, A. Facing the Challenges in CFD Modelling of Multistage Axial Compressors. In Turbo Expo: Power for Land, Sea, and Air; Volume 2B: Turbomachinery; ASME: New York, NY, USA, 2017. [Google Scholar] [CrossRef]
  8. Cozzi, L.; Rubechini, F.; Giovannini, M.; Marconcini, M.; Arnone, A.; Schneider, A.; Astrua, P. Capturing Radial Mixing in Axial Compressors With Computational Fluid Dynamics. J. Turbomach. 2019, 141, 031012. [Google Scholar] [CrossRef]
  9. Diakunchak, I.S. Performance deterioration in industrial gas turbines. J. Eng. Gas Turbines Power 1992, 114, 161–168. [Google Scholar] [CrossRef]
  10. Ojo, C.O.; Schwille, C.; Nemet, A.; Zierer, T.; Nicklas, M. Optimization of Anti-Icing Limits for Alstom Gas Turbines Based on Theory of Ice Formation. In Turbo Expo: Power for Land, Sea, and Air; Volume 1: Aircraft Engine; Ceramics; Coal, Biomass and Alternative Fuels; Controls, Diagnostics and Instrumentation; Education; Electric Power; Awards and Honors; ASME: New York, NY, USA, 2009; pp. 871–879. [Google Scholar] [CrossRef]
  11. Mendoza, E.; Lin, T.; Jiang, X. Reduction of Gas Turbine Exhaust Temperature Limit due to HRSG Limitations by Change on Control Curve to Optimize Plant Operation and Performance. In Turbo Expo: Power for Land, Sea, and Air; Volume 3: Coal, Biomass and Alternative Fuels; Cycle Innovations; Electric Power; Industrial and Cogeneration; ASME: New York, NY, USA, 2015. [Google Scholar] [CrossRef]
  12. Arnone, A. Viscous Analysis of Three-Dimensional Rotor Flow Using a Multigrid Method. J. Turbomach. 1994, 116, 435–445. [Google Scholar] [CrossRef]
  13. Jameson, A.; Schmidt, W.; Turkel, E. Numerical Solutions of the Euler Equations by Finite Volume Methods Using Runge–Kutta Time–Stepping Schemes. In Proceedings of the 14th Fluid and Plasma Dynamics Conference, Palo Alto, CA, USA, 23–25 June 1981. AIAA Paper 81–1259. [Google Scholar]
  14. Wilcox, D.C. Multiscale Model for Turbulent Flows. AIAA J. 1988, 26, 1311–1320. [Google Scholar] [CrossRef]
  15. Burberi, C.; Michelassi, V.; Scotti del Greco, A.; Lorusso, S.; Tapinassi, L.; Marconcini, M.; Pacciani, R. Validation of steady and unsteady CFD strategies in the design of axial compressors for gas turbine engines. Aerosp. Sci. Technol. 2020, 107, 106307. [Google Scholar] [CrossRef]
  16. Mosele, S.G.; Garbarino, T.; Schneider, A.; Cozzi, L.; Arnone, A.; Goinis, G.; Hedkvist, S. Compressor Retrofittable Solutions in Heavy-Duty Gas Turbines for Minimum Environmental Load Reduction. E3S Web Conf. 2019, 13, 01012. [Google Scholar] [CrossRef] [Green Version]
  17. Giles, M.B. Non-Reflecting Boundary Conditions for the Euler Equations; Technical Report; CFDL Report 88-1; MIT Dept. of Aero. and Astro.: Boston, MA, USA, 1988. [Google Scholar]
  18. Giles, M.B. UNSFLO: A Numerical Method for Unsteady Inviscid Flow in Turbomachinery; Technical Report; GTL 195; MIT Dept. of Aero. and Astro.: Boston, MA, USA, 1988. [Google Scholar]
  19. Cioffi, M.; Puppo, E.; Silingardi, A. Fanno Design of Blow-Off Lines in Heavy Duty Gas Turbine. In Turbo Expo: Power for Land, Sea, and Air; Volume 4: Ceramics; Concentrating Solar Power Plants; Controls, Diagnostics and Instrumentation; Education; Electric Power; Fans and Blowers ASME: New York, NY, USA, 2013. [Google Scholar] [CrossRef]
  20. Rubechini, F.; Marconcini, M.; Arnone, A.; Cecchi, S.; Daccà, F. Some Aspects of CFD Modeling in the Analysis of a Low-Pressure Steam Turbine. In Turbo Expo: Power for Land, Sea, and Air; Paper No. GT2007-27235; ASME: New York, NY, USA, 2007. [Google Scholar]
  21. Vo, H.D.; Tan, C.S.; Greitzer, E.M. Criteria for Spike Initiated Rotating Stall. J. Turbomach. 2008, 130, 011023. [Google Scholar] [CrossRef]
  22. Lei, V.M.; Spakovszky, Z.S.; Greitzer, E.M. A Criterion for Axial Compressor Hub-Corner Stall. J. Turbomach. 2008, 130, 031006. [Google Scholar] [CrossRef] [Green Version]
  23. Schneider, A.; Silingardi, A.; Astrua, P.; Puppo, E.; Depalo, S. Rotor tip stall from a designer’s perspective. In Proceedings of the 12th European Turbomach Conference, Stockholm, Sweden, 3–7 April 2017. Paper ETC2017-343. [Google Scholar]
Figure 1. Generic daily power mix using programmable and renewable energy systems [2].
Ijtpp 07 00003 g001
Figure 2. View of the rotor tip gap grid block (a) and mass flow rate distribution for the compressor, with and without the meshed tip rotor (b) (the axial position of the exit bleeds (EB) is indicated).
Ijtpp 07 00003 g002
Figure 3. Compressor inlet (a) and outlet (b) mass flow rate, and outlet total temperature (c).
Ijtpp 07 00003 g003
Figure 4. Compressor pressure at casing for the operating points experimentally tested: (a) T23 (MEL), (b) T24, (c) T26.
Ijtpp 07 00003 g004
Figure 5. Overall pressure ratio (a) and efficiency (b).
Ijtpp 07 00003 g005
Figure 6. Stage flow coefficient (a) and load coefficient (b).
Ijtpp 07 00003 g006
Figure 7. Diffusion factor comparison between analyzed MEL configurations (a) and part-load standard MEL operating condition (b).
Ijtpp 07 00003 g007
Figure 8. Meridional sketch for diffusion factor definition.
Ijtpp 07 00003 g008
Figure 9. Compressor stages map for (a) MEL, (b) MEL+Blow-Off, (c) MEL+Blow-Off+IGV Extra Closure.
Ijtpp 07 00003 g009
Figure 10. View of stages 10 to 15 + OGV; recirculating flow regions are highlighted by iso-surface of zero axial velocity (flow goes from right to left).
Ijtpp 07 00003 g010
Publisher’s Note: MDPI stays neutral with regard to jurisdictional claims in published maps and institutional affiliations.

