Trapped Acoustic Modes in an Axial Multi-Stage Compressor Leading to Non-Synchronous Blade Vibrations †

 , ,
, ,
Abstract
:1. Introduction
- Blade vibrations caused by convective phenomena: This type of ‘NSV’ is typically driven by small-scale aerodynamic disturbances that are convected around the circumference and may adapt their phase to blade vibration [8]. Before the establishment of blade vibrations, it was observed that these aerodynamic disturbances were already present with a random azimuthal distribution and a characteristic circumferential phase velocity. Once ‘NSV’ is established, this characteristic phase velocity is slightly altered to enable the coincidence of the aerodynamic disturbances with the coherent blade eigenmode. Generally, phenomena of this kind occur in modern transonic compressor rotors under highly throttled conditions close to the stall boundary.
- Acoustic resonance: In this specific case, several spinning modes of zeroth radial order can originate and propagate only in one axial direction due to the change of acoustic propagation conditions upstream and downstream of a blade row [8,9,10,11,12]. This change of acoustic propagation conditions enables only a series of resonant modes with a certain circumferential wave number and circumferential phase velocity [13]. Unstable aerodynamic flow structures can phase-lock to the acoustic mode, and thus serve as a periodic energy source. If it coincides with a structural mode, it may cause damaging effects. In this particular case, it is important to note that a backward traveling acoustic mode originating in a downstream stage of the compressor can be coincident with a specific structural mode of an upstream rotor. This type of phenomena can occur far from the stability limit of the compressor.
2. Fundamentals
3. Test Case and Experimental Results
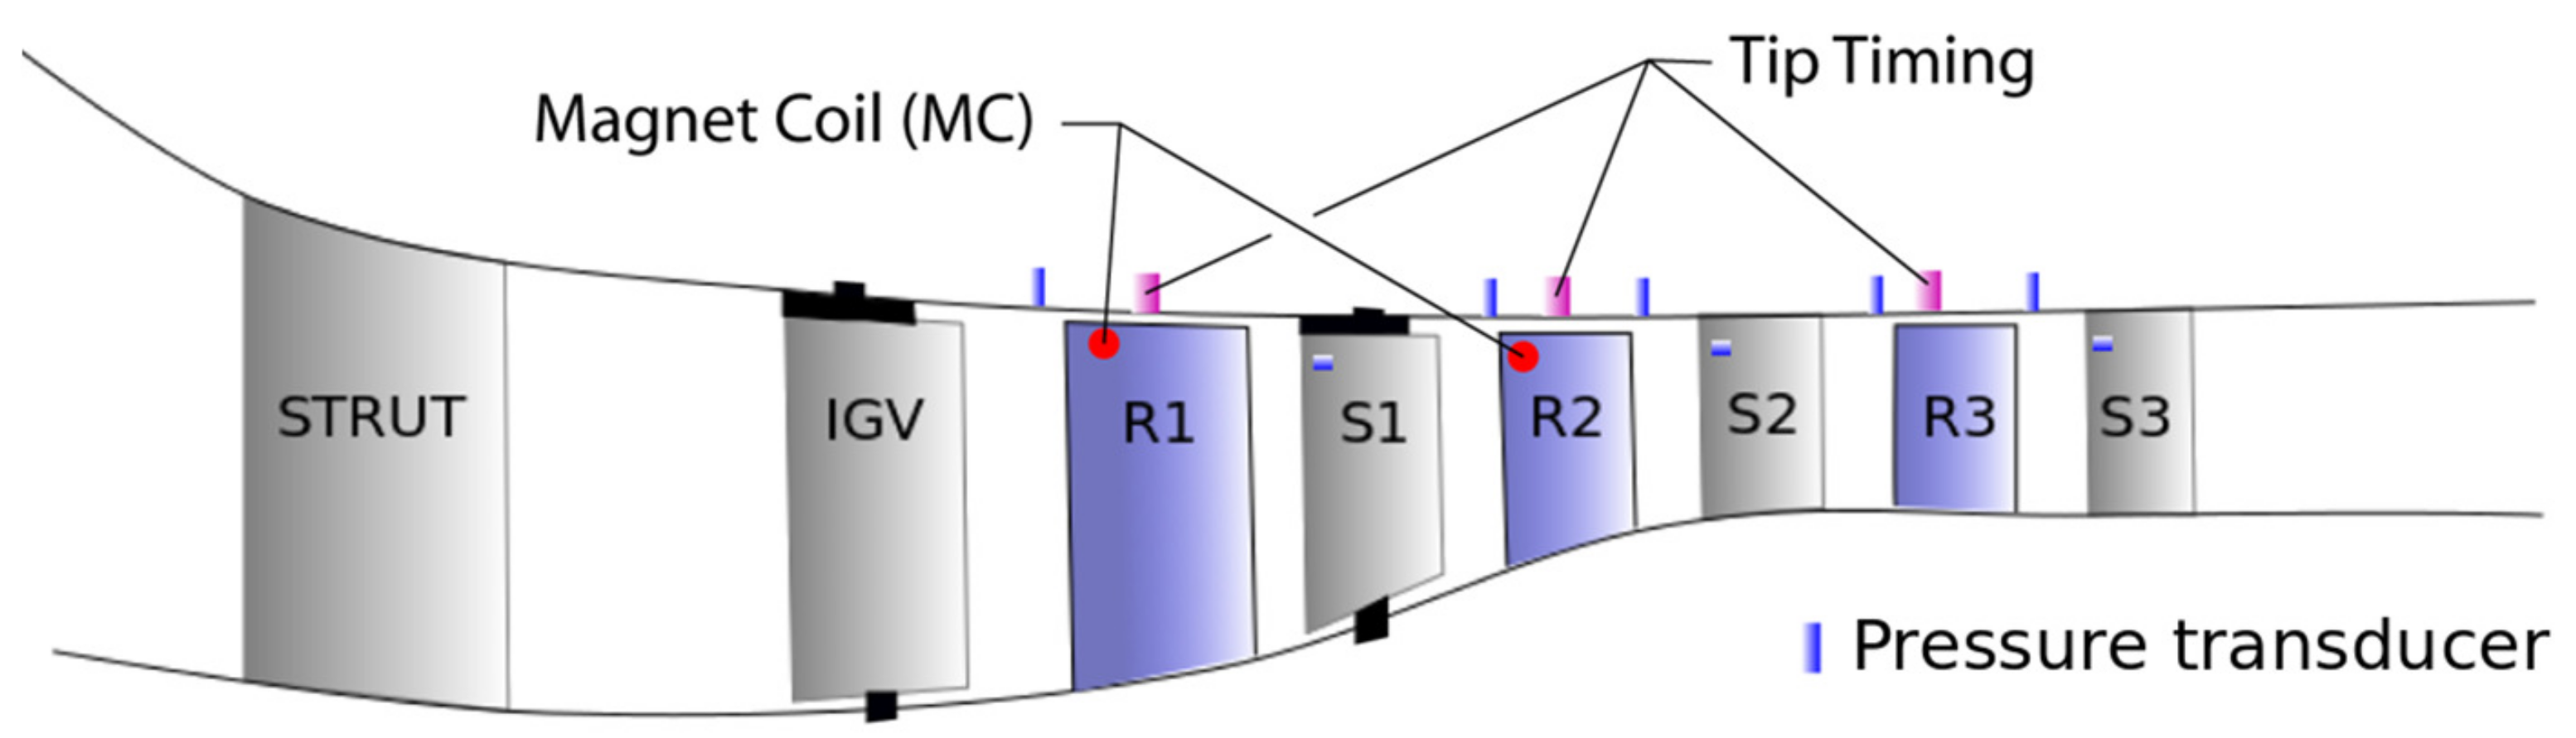
3.1. Experimental Setup
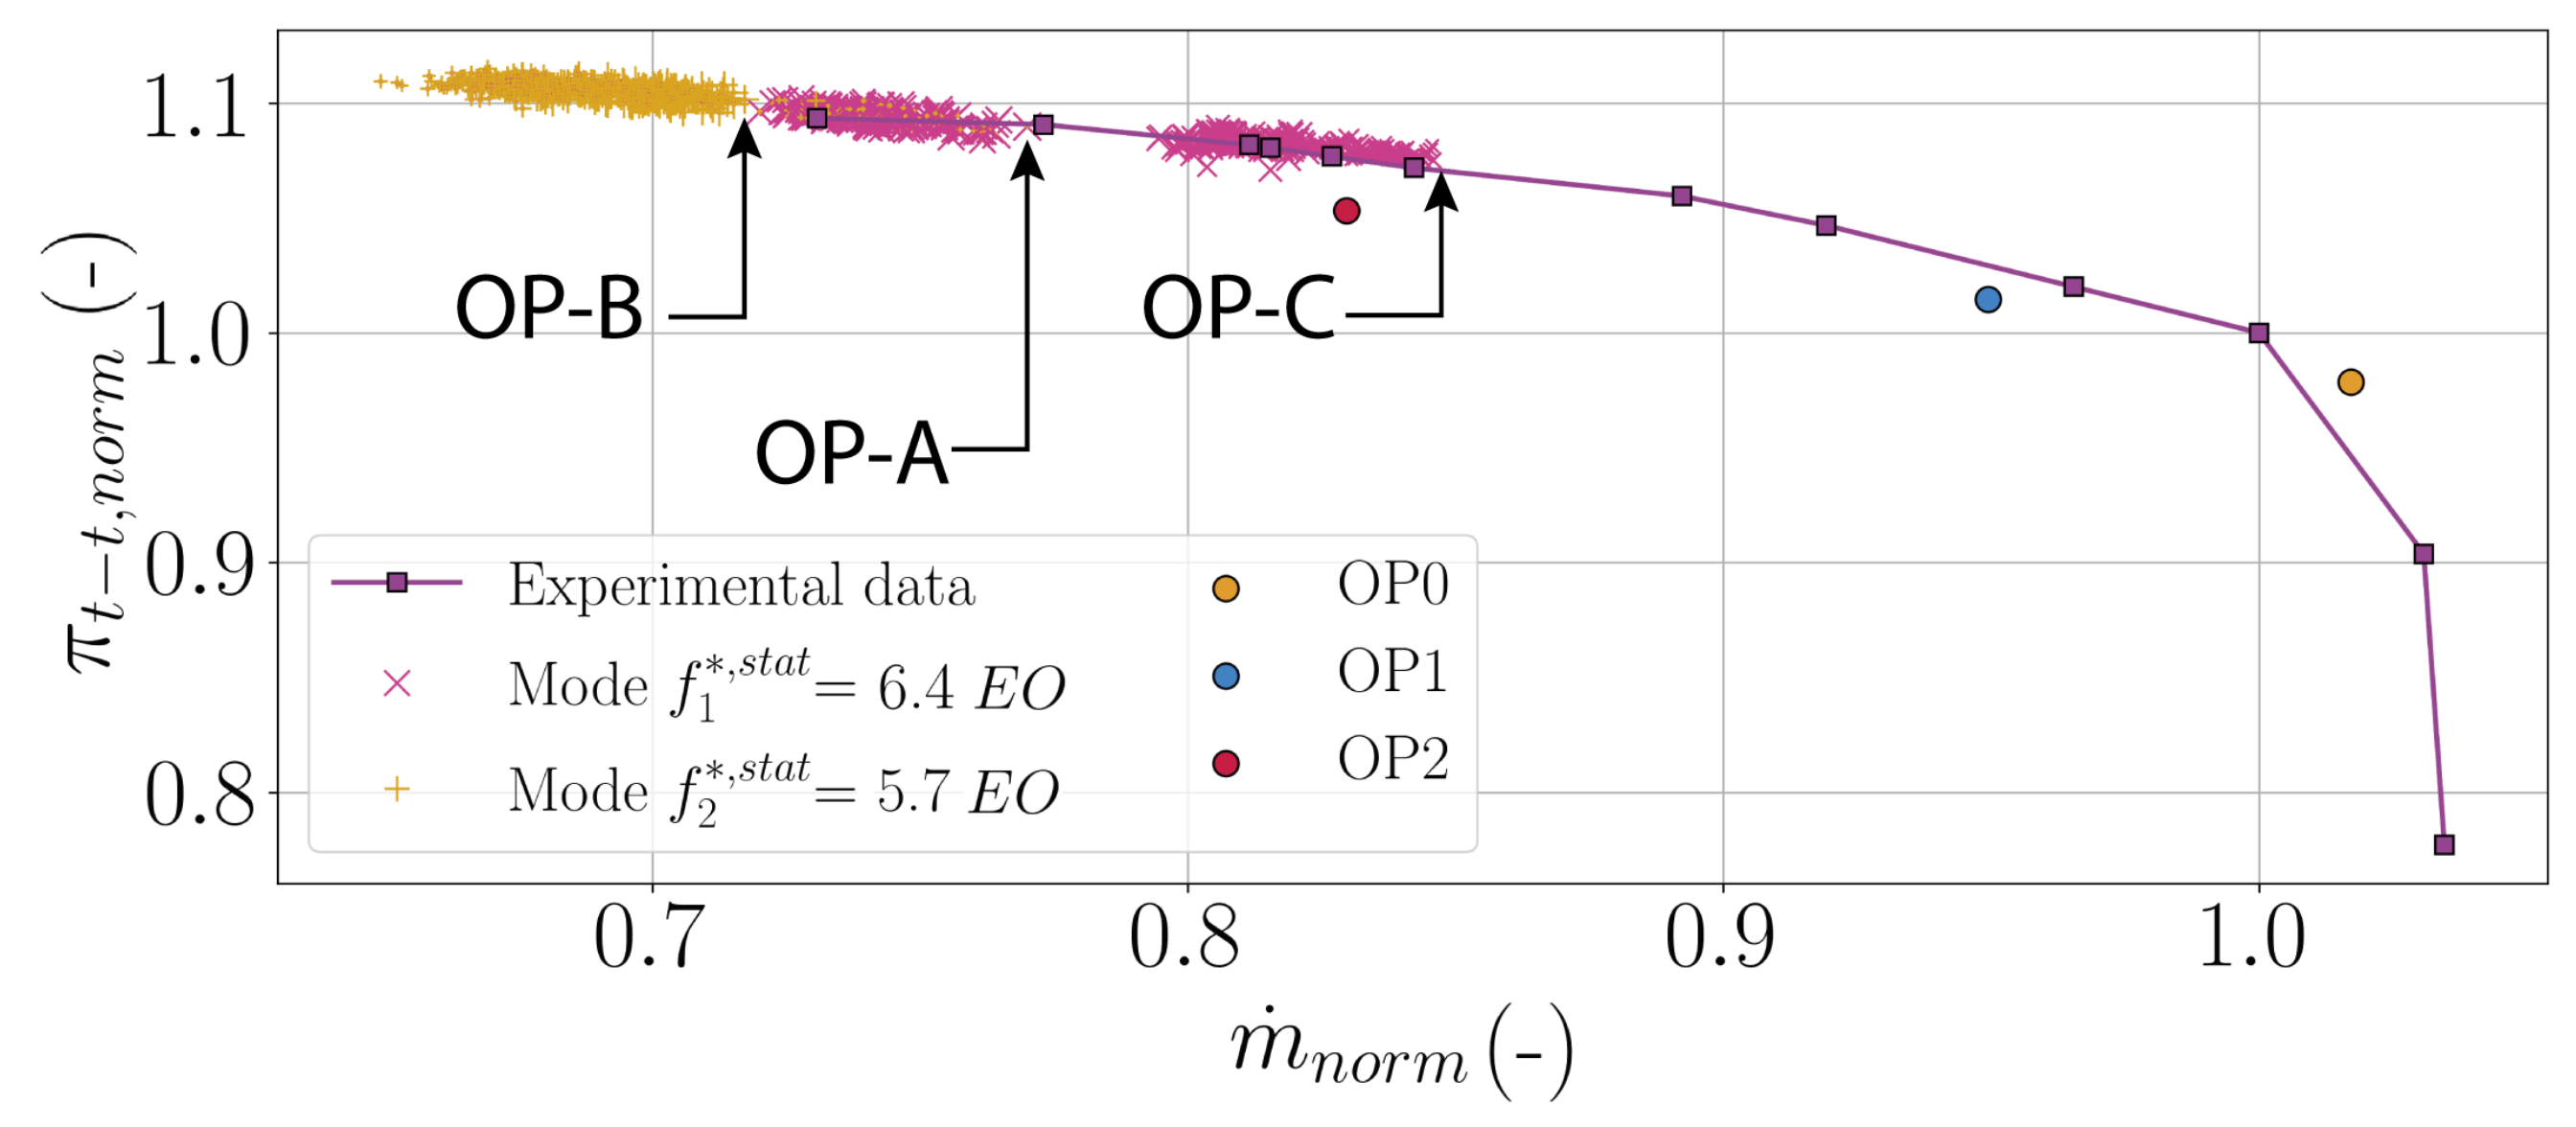
3.2. Experimental Compressor Characteristic
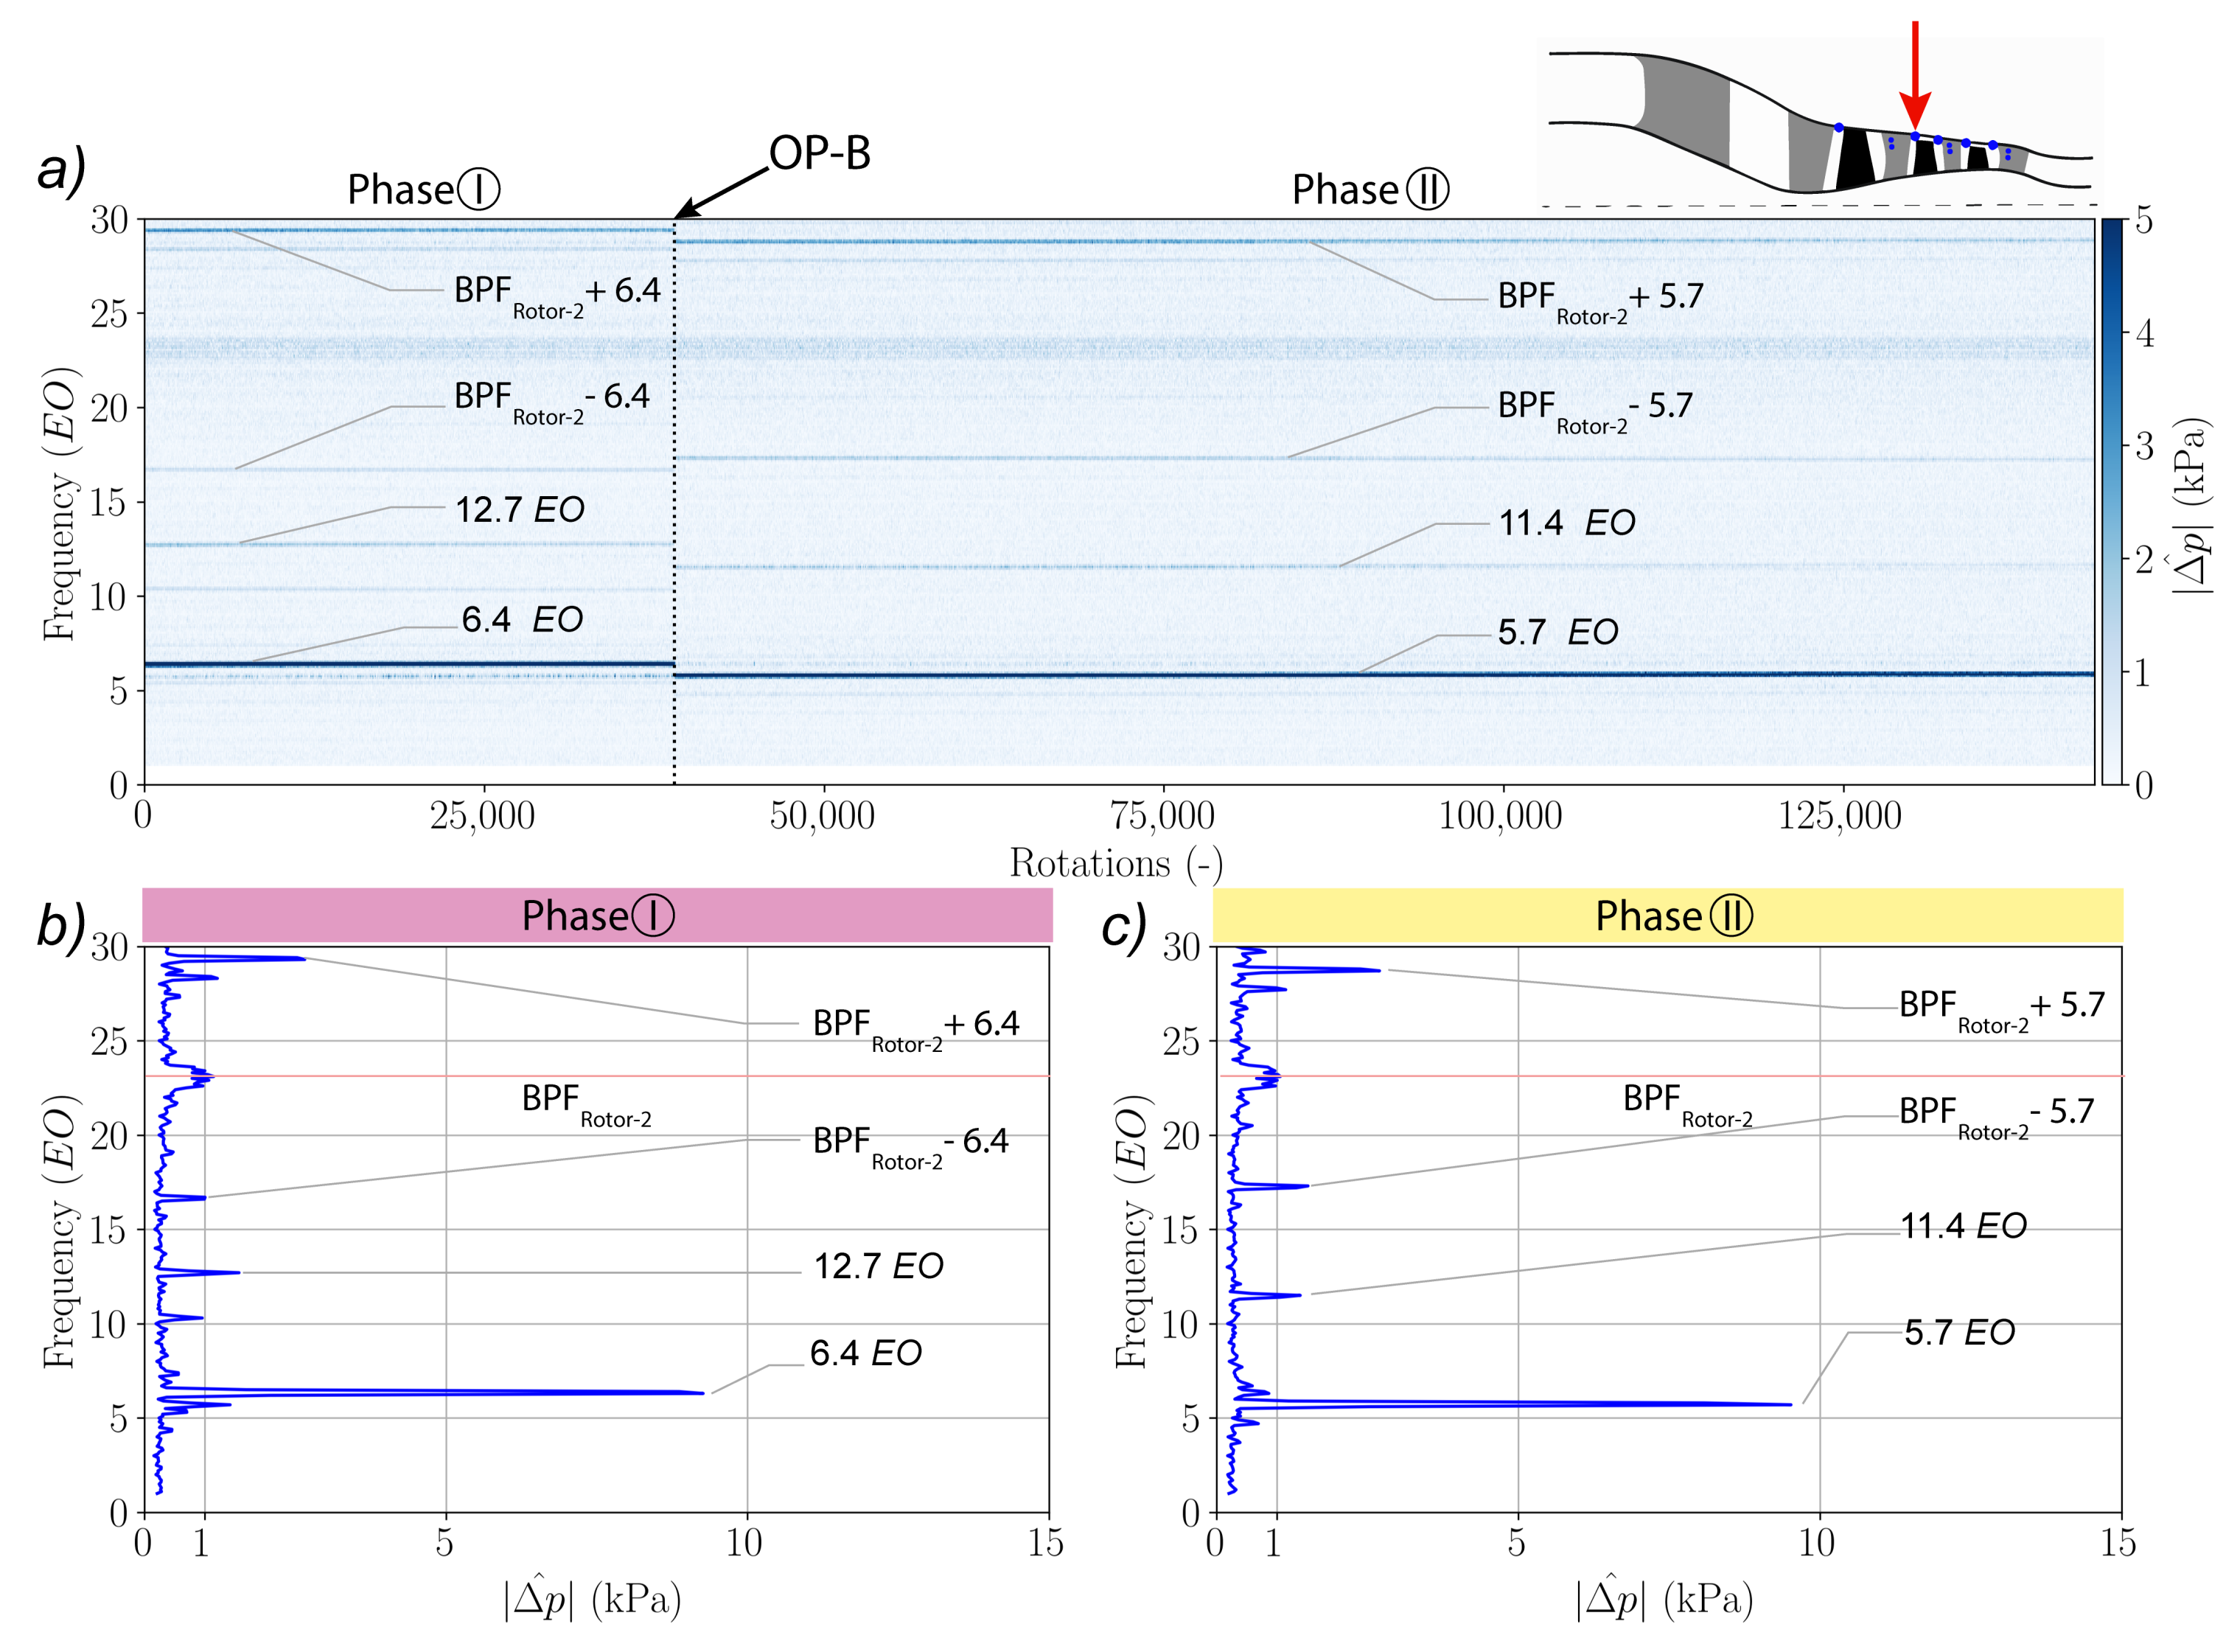
3.3. Transient Test from OP-A to Stability Limit
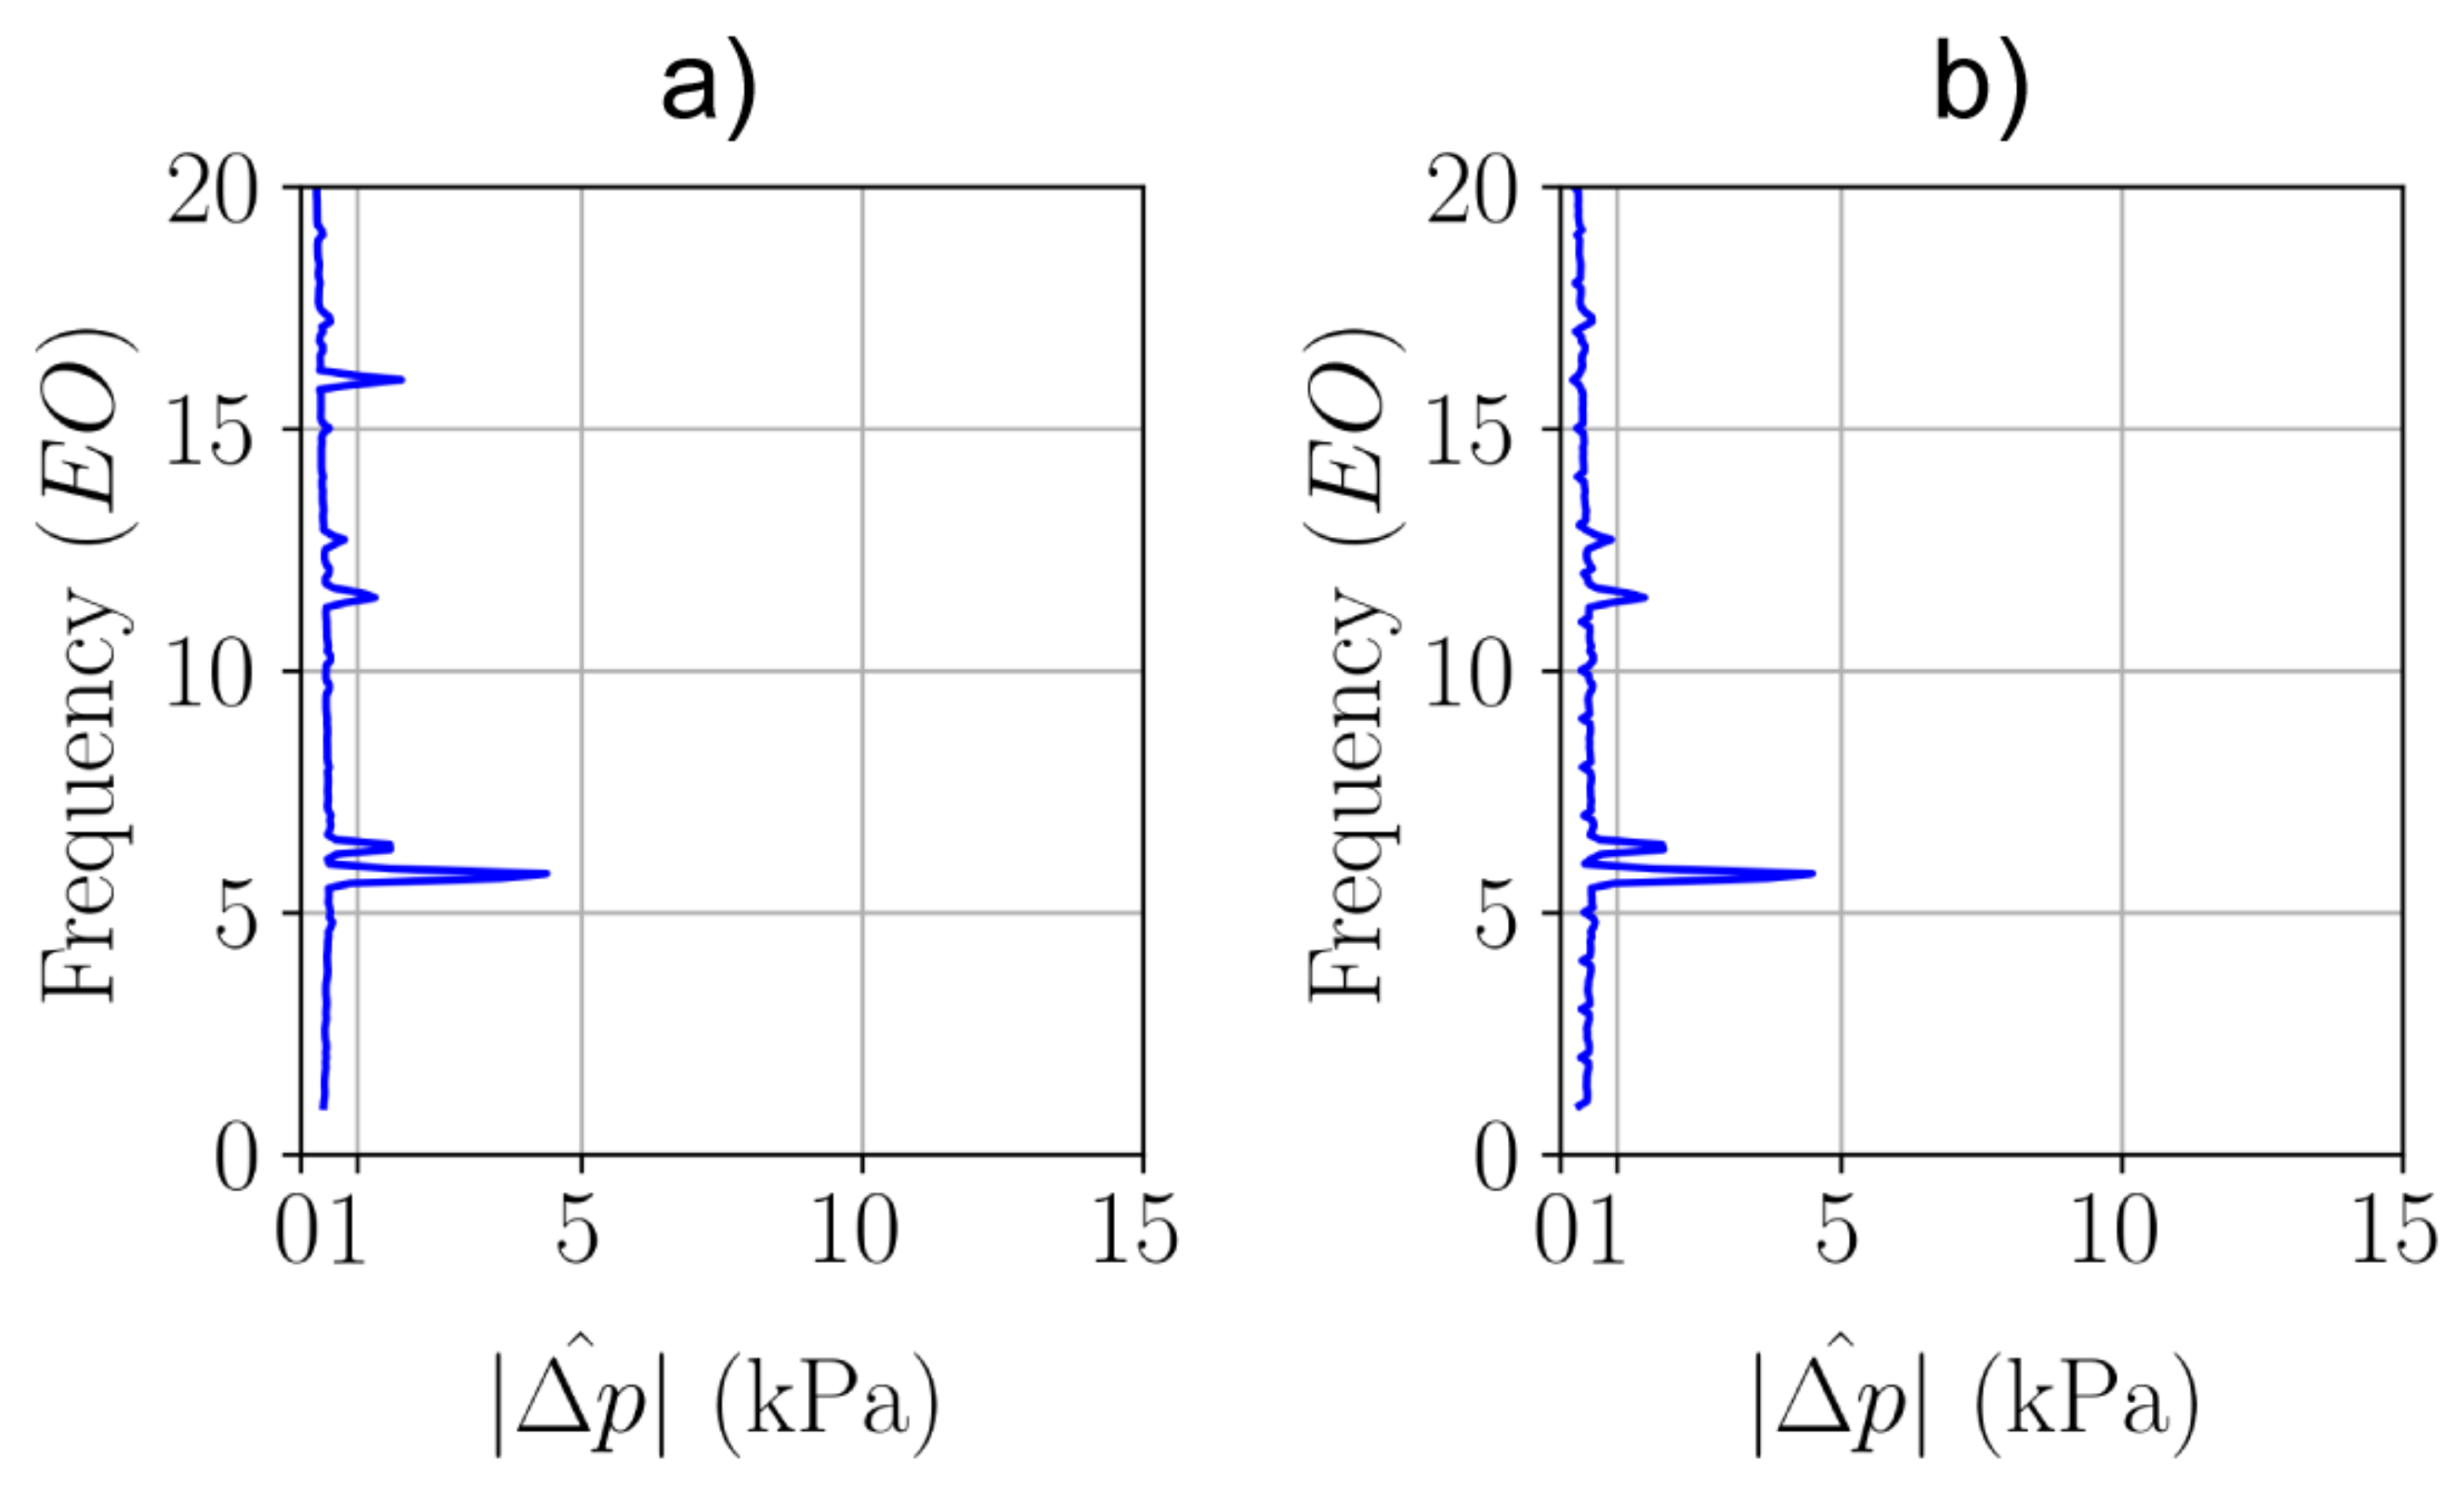
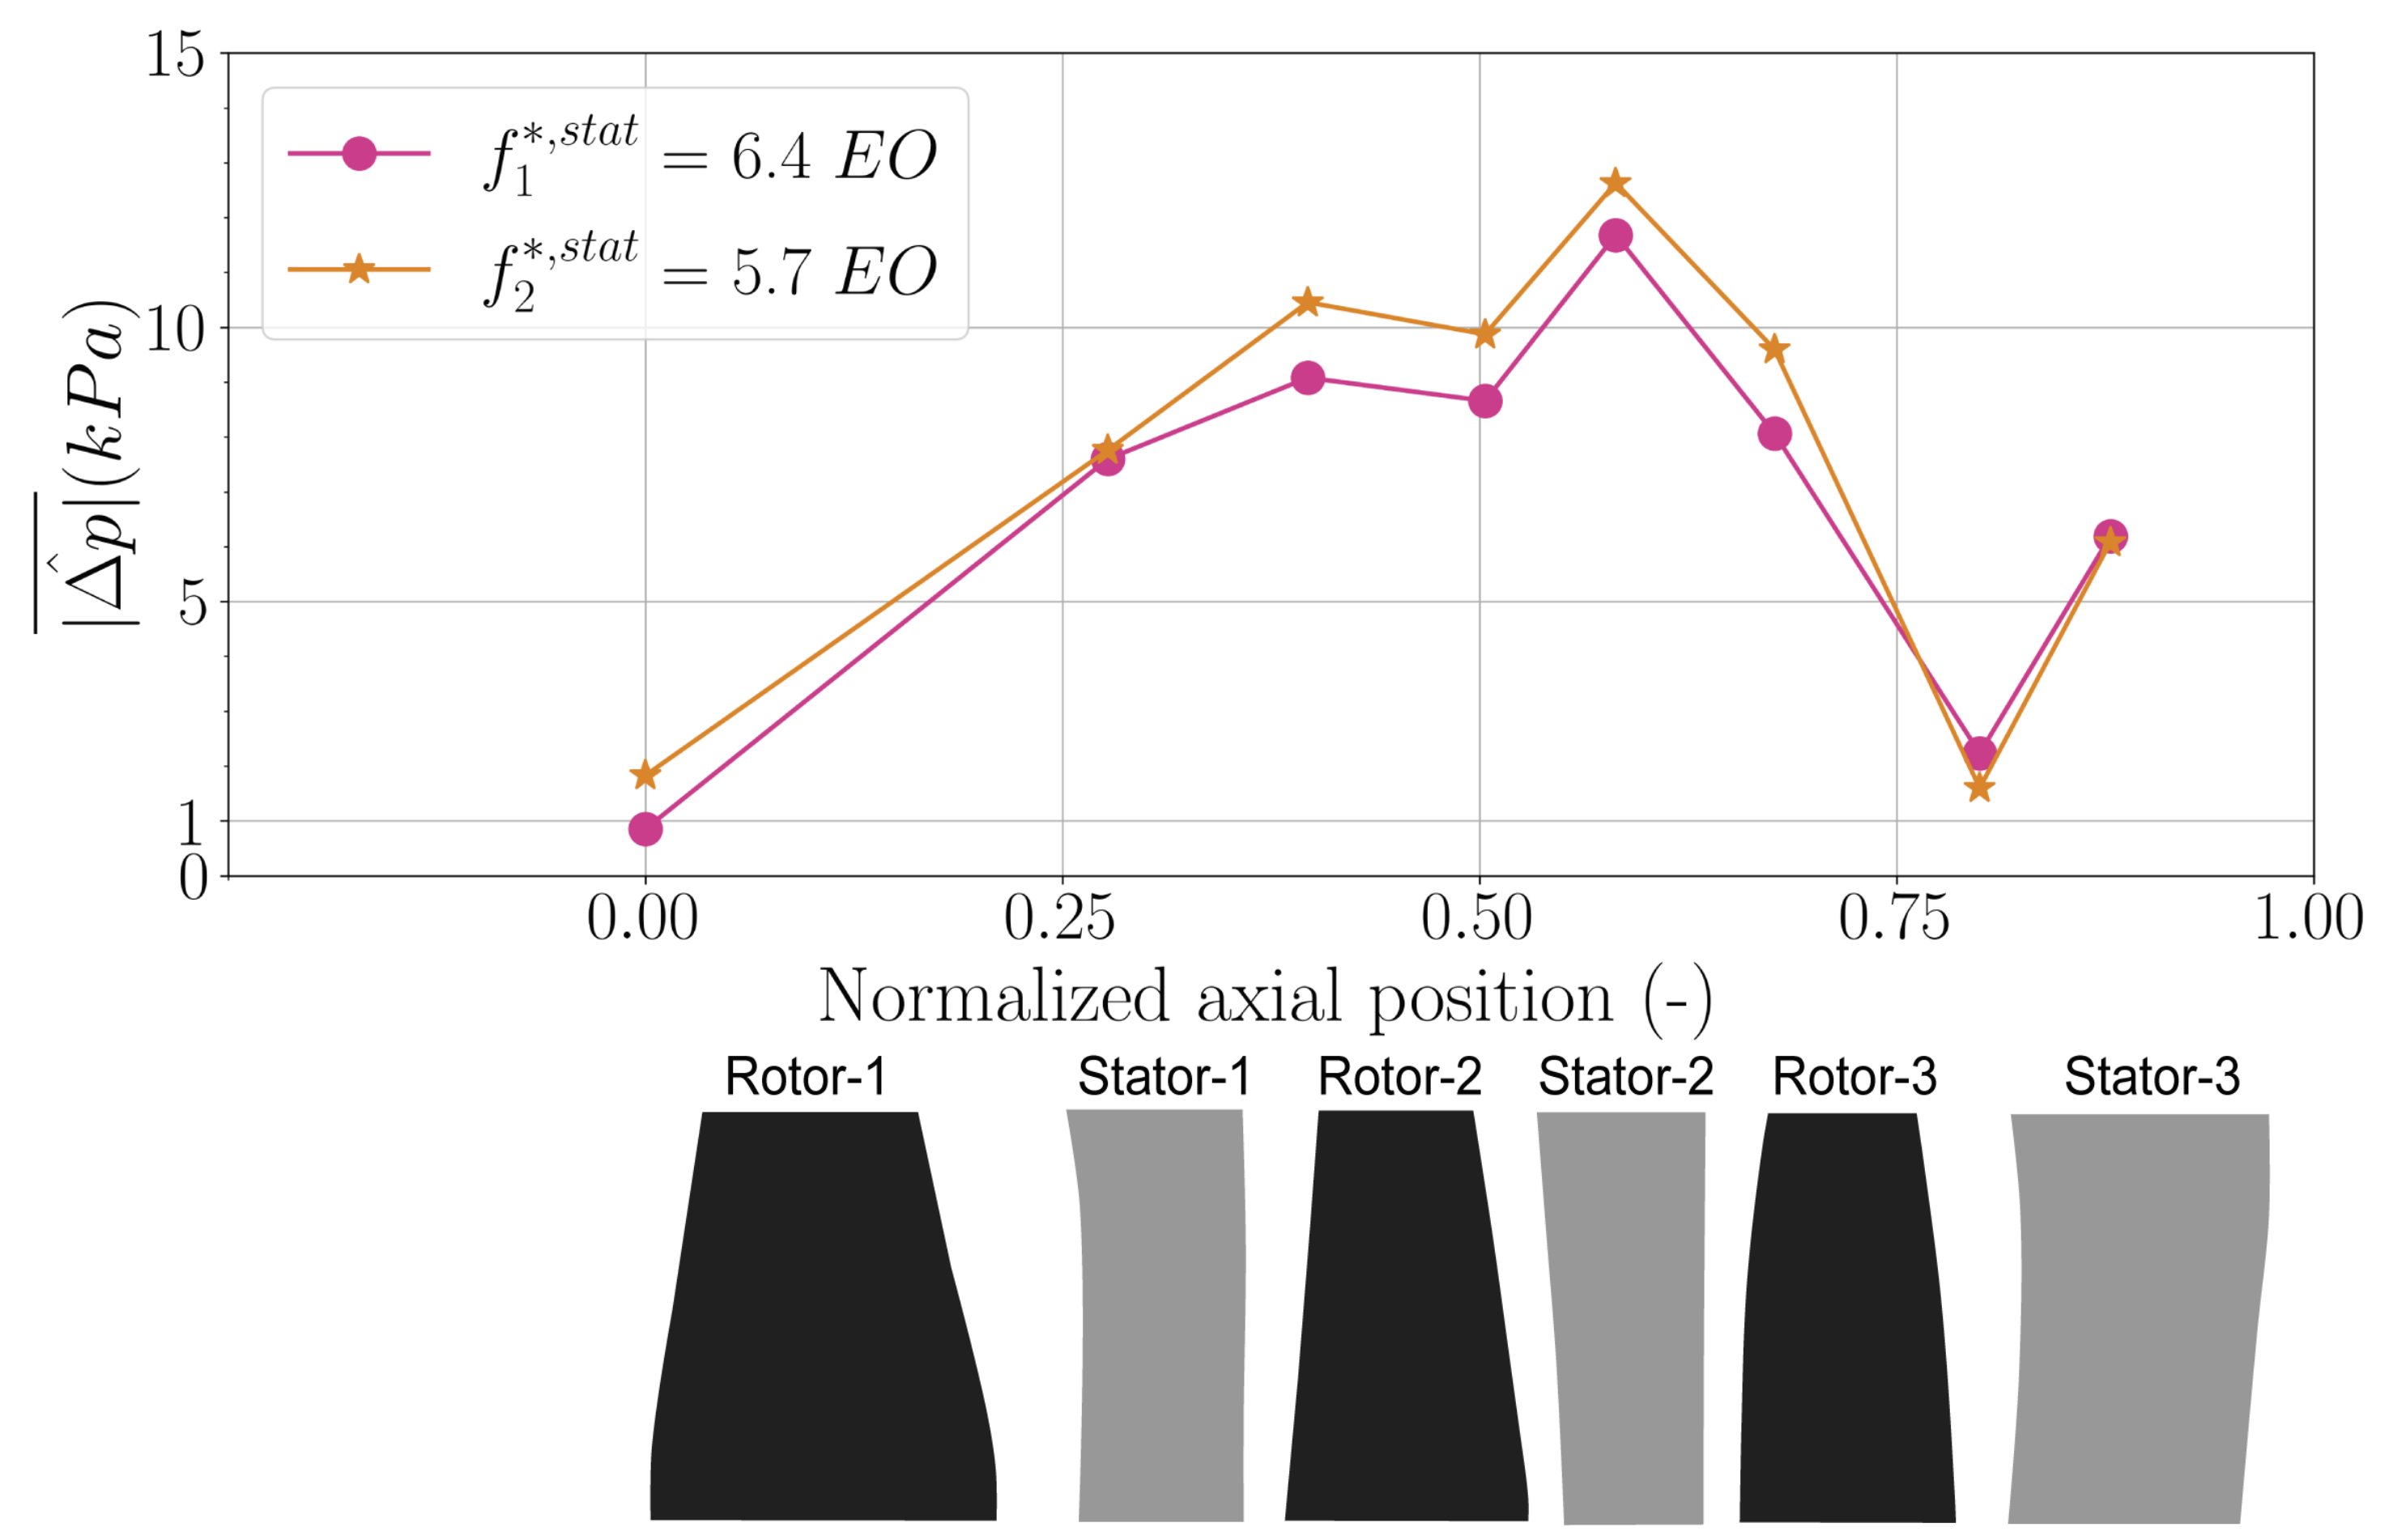
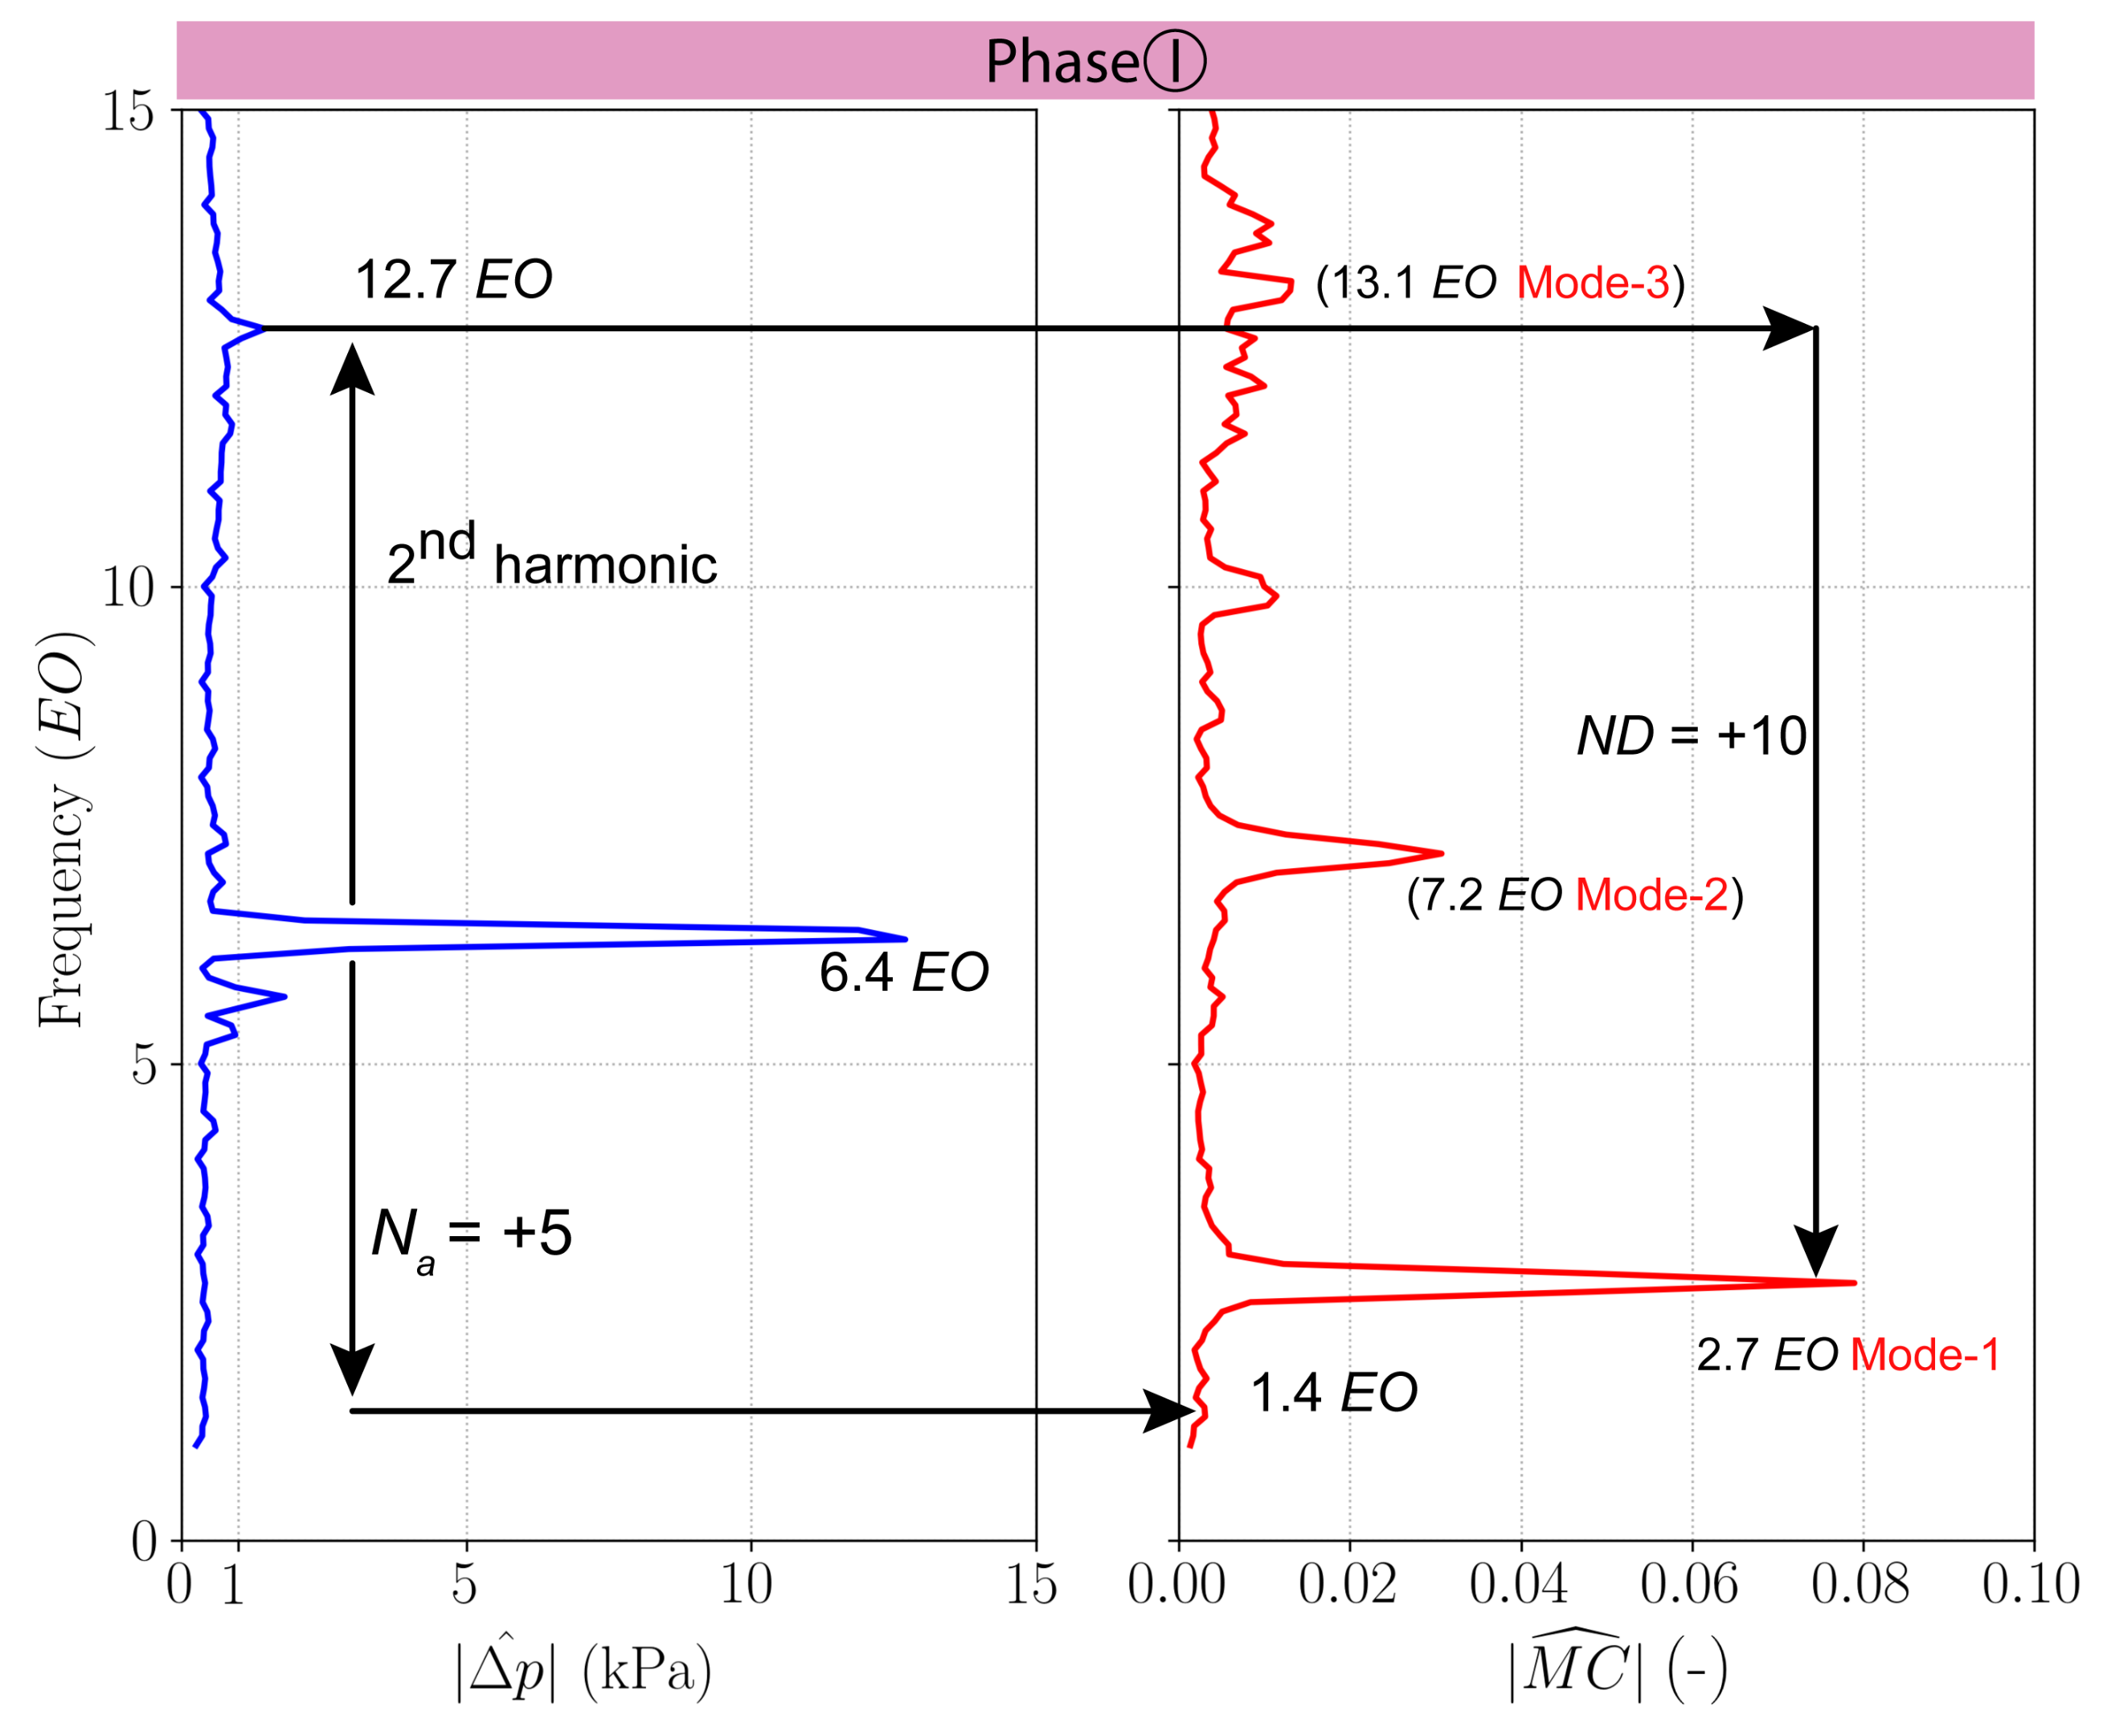
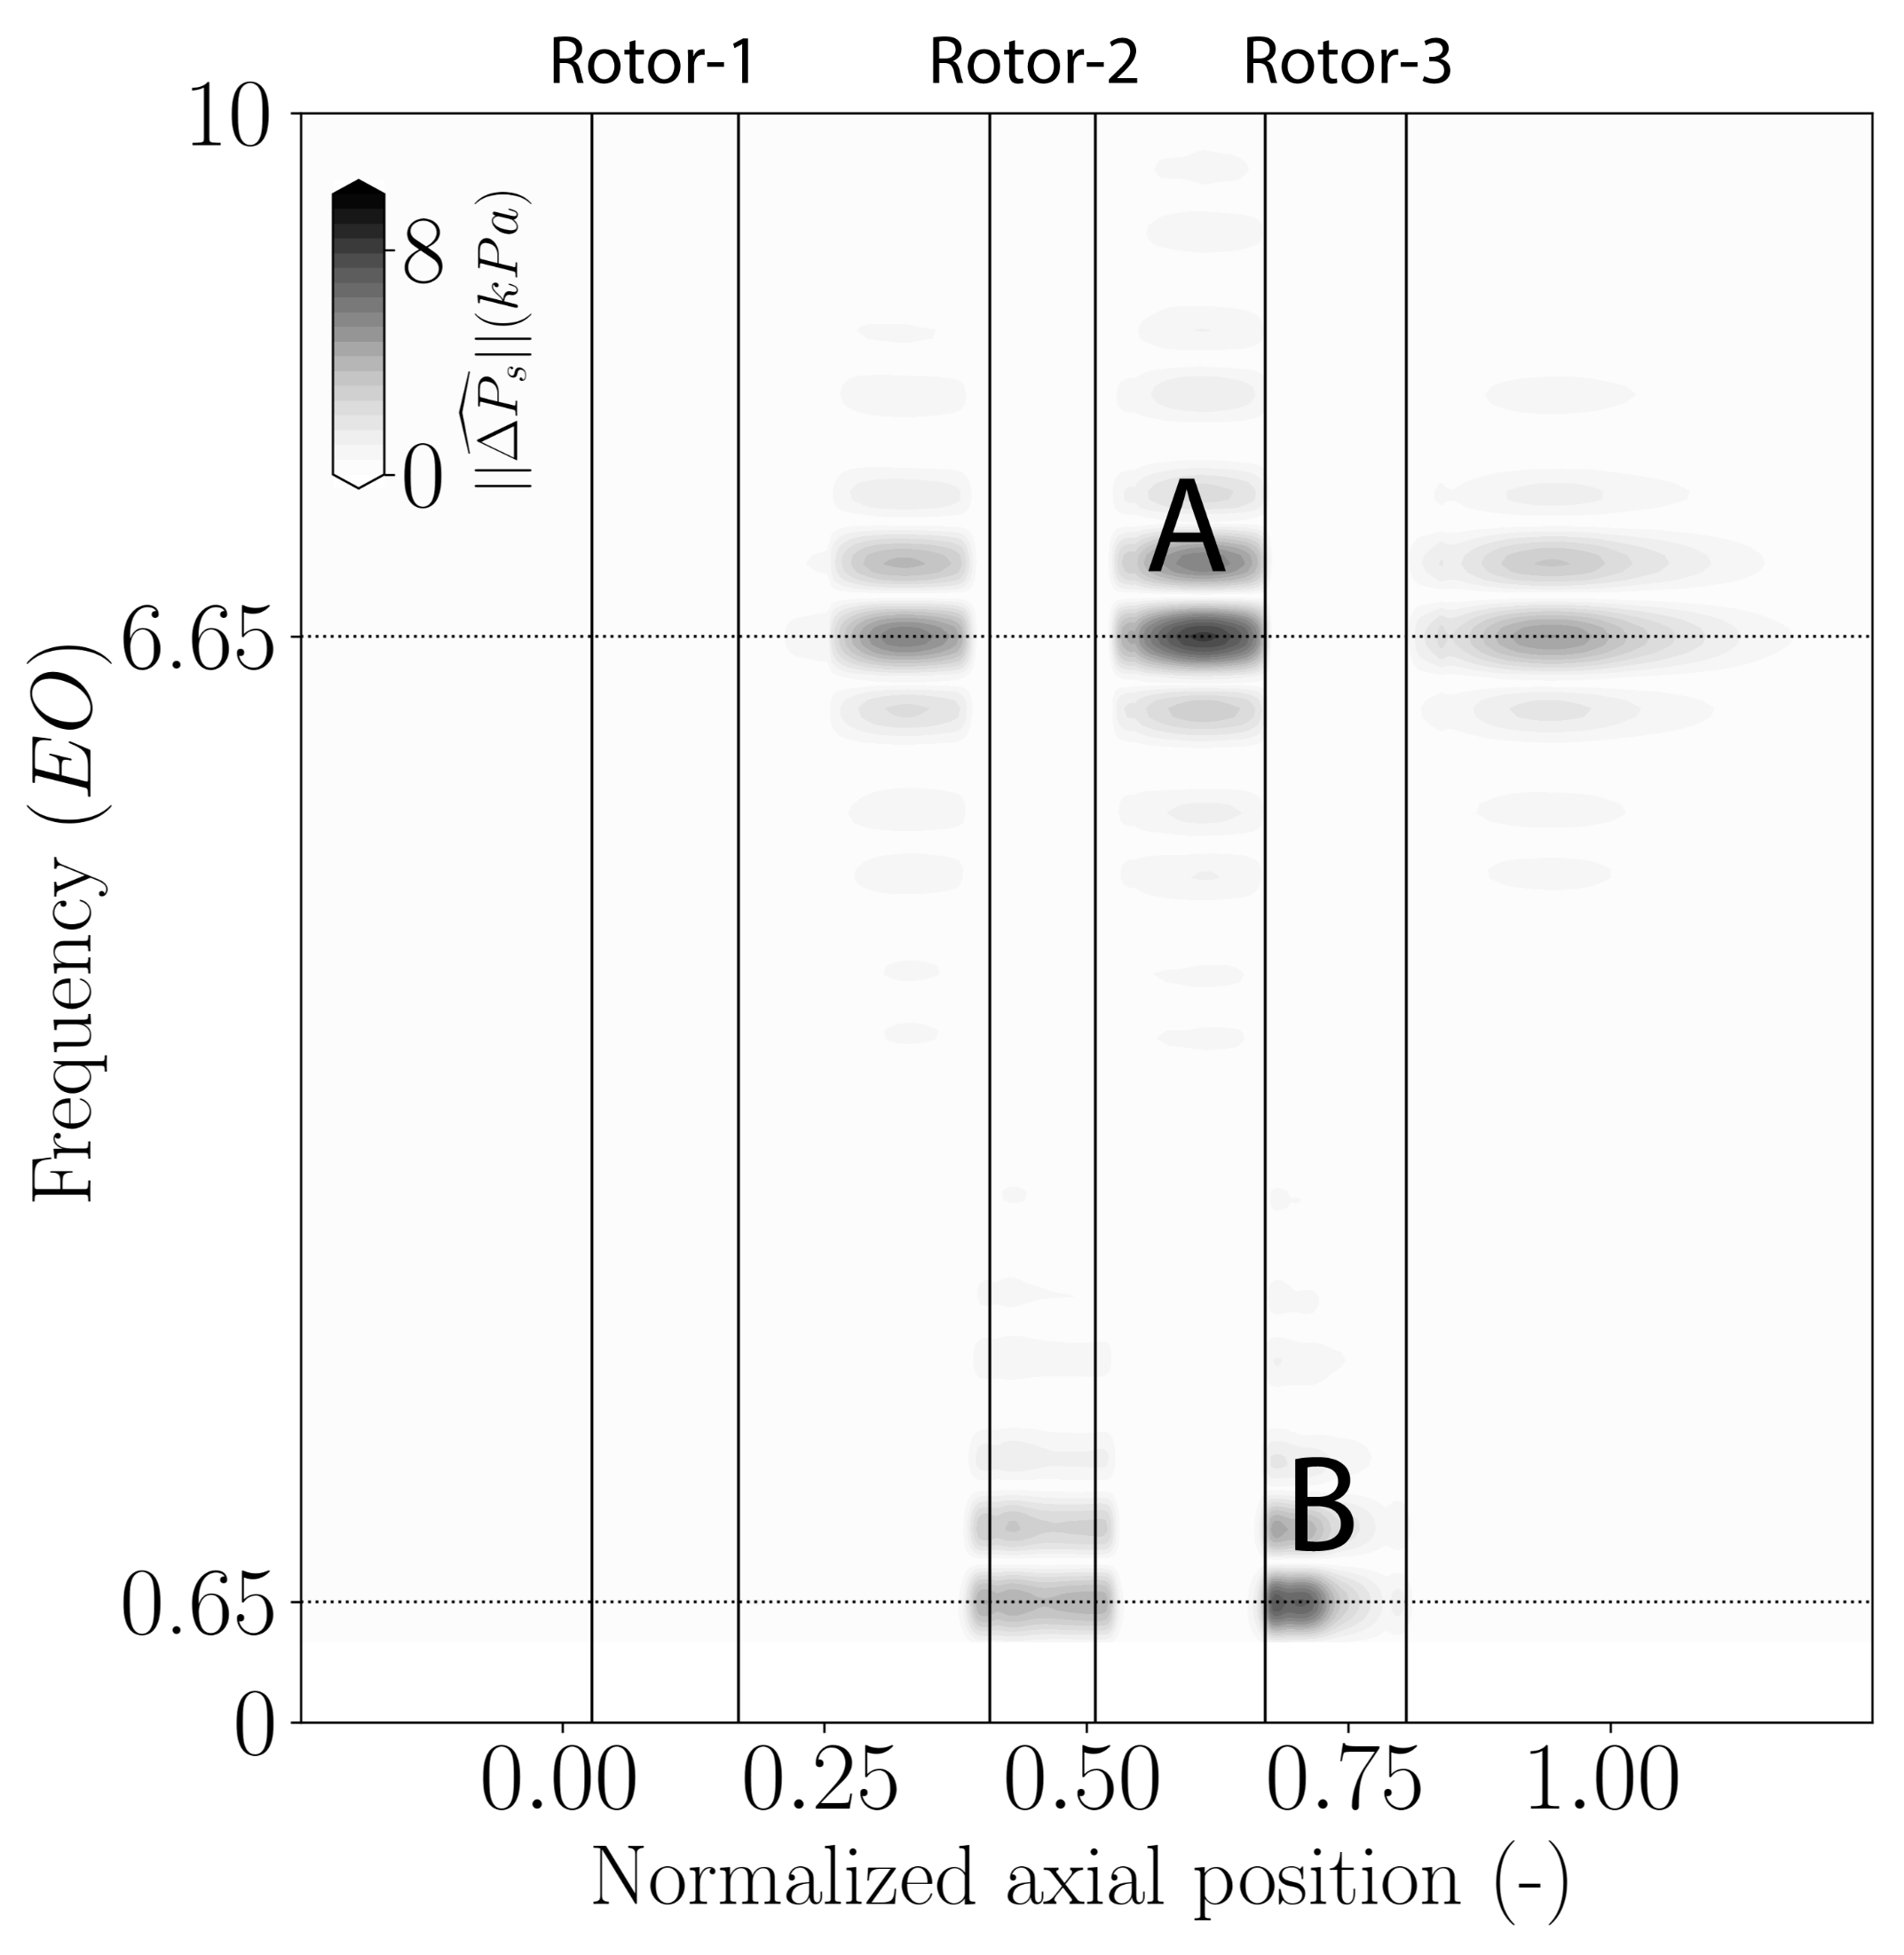
- A non-synchronous pressure frequency at ;
- Its 2nd harmonic at ;
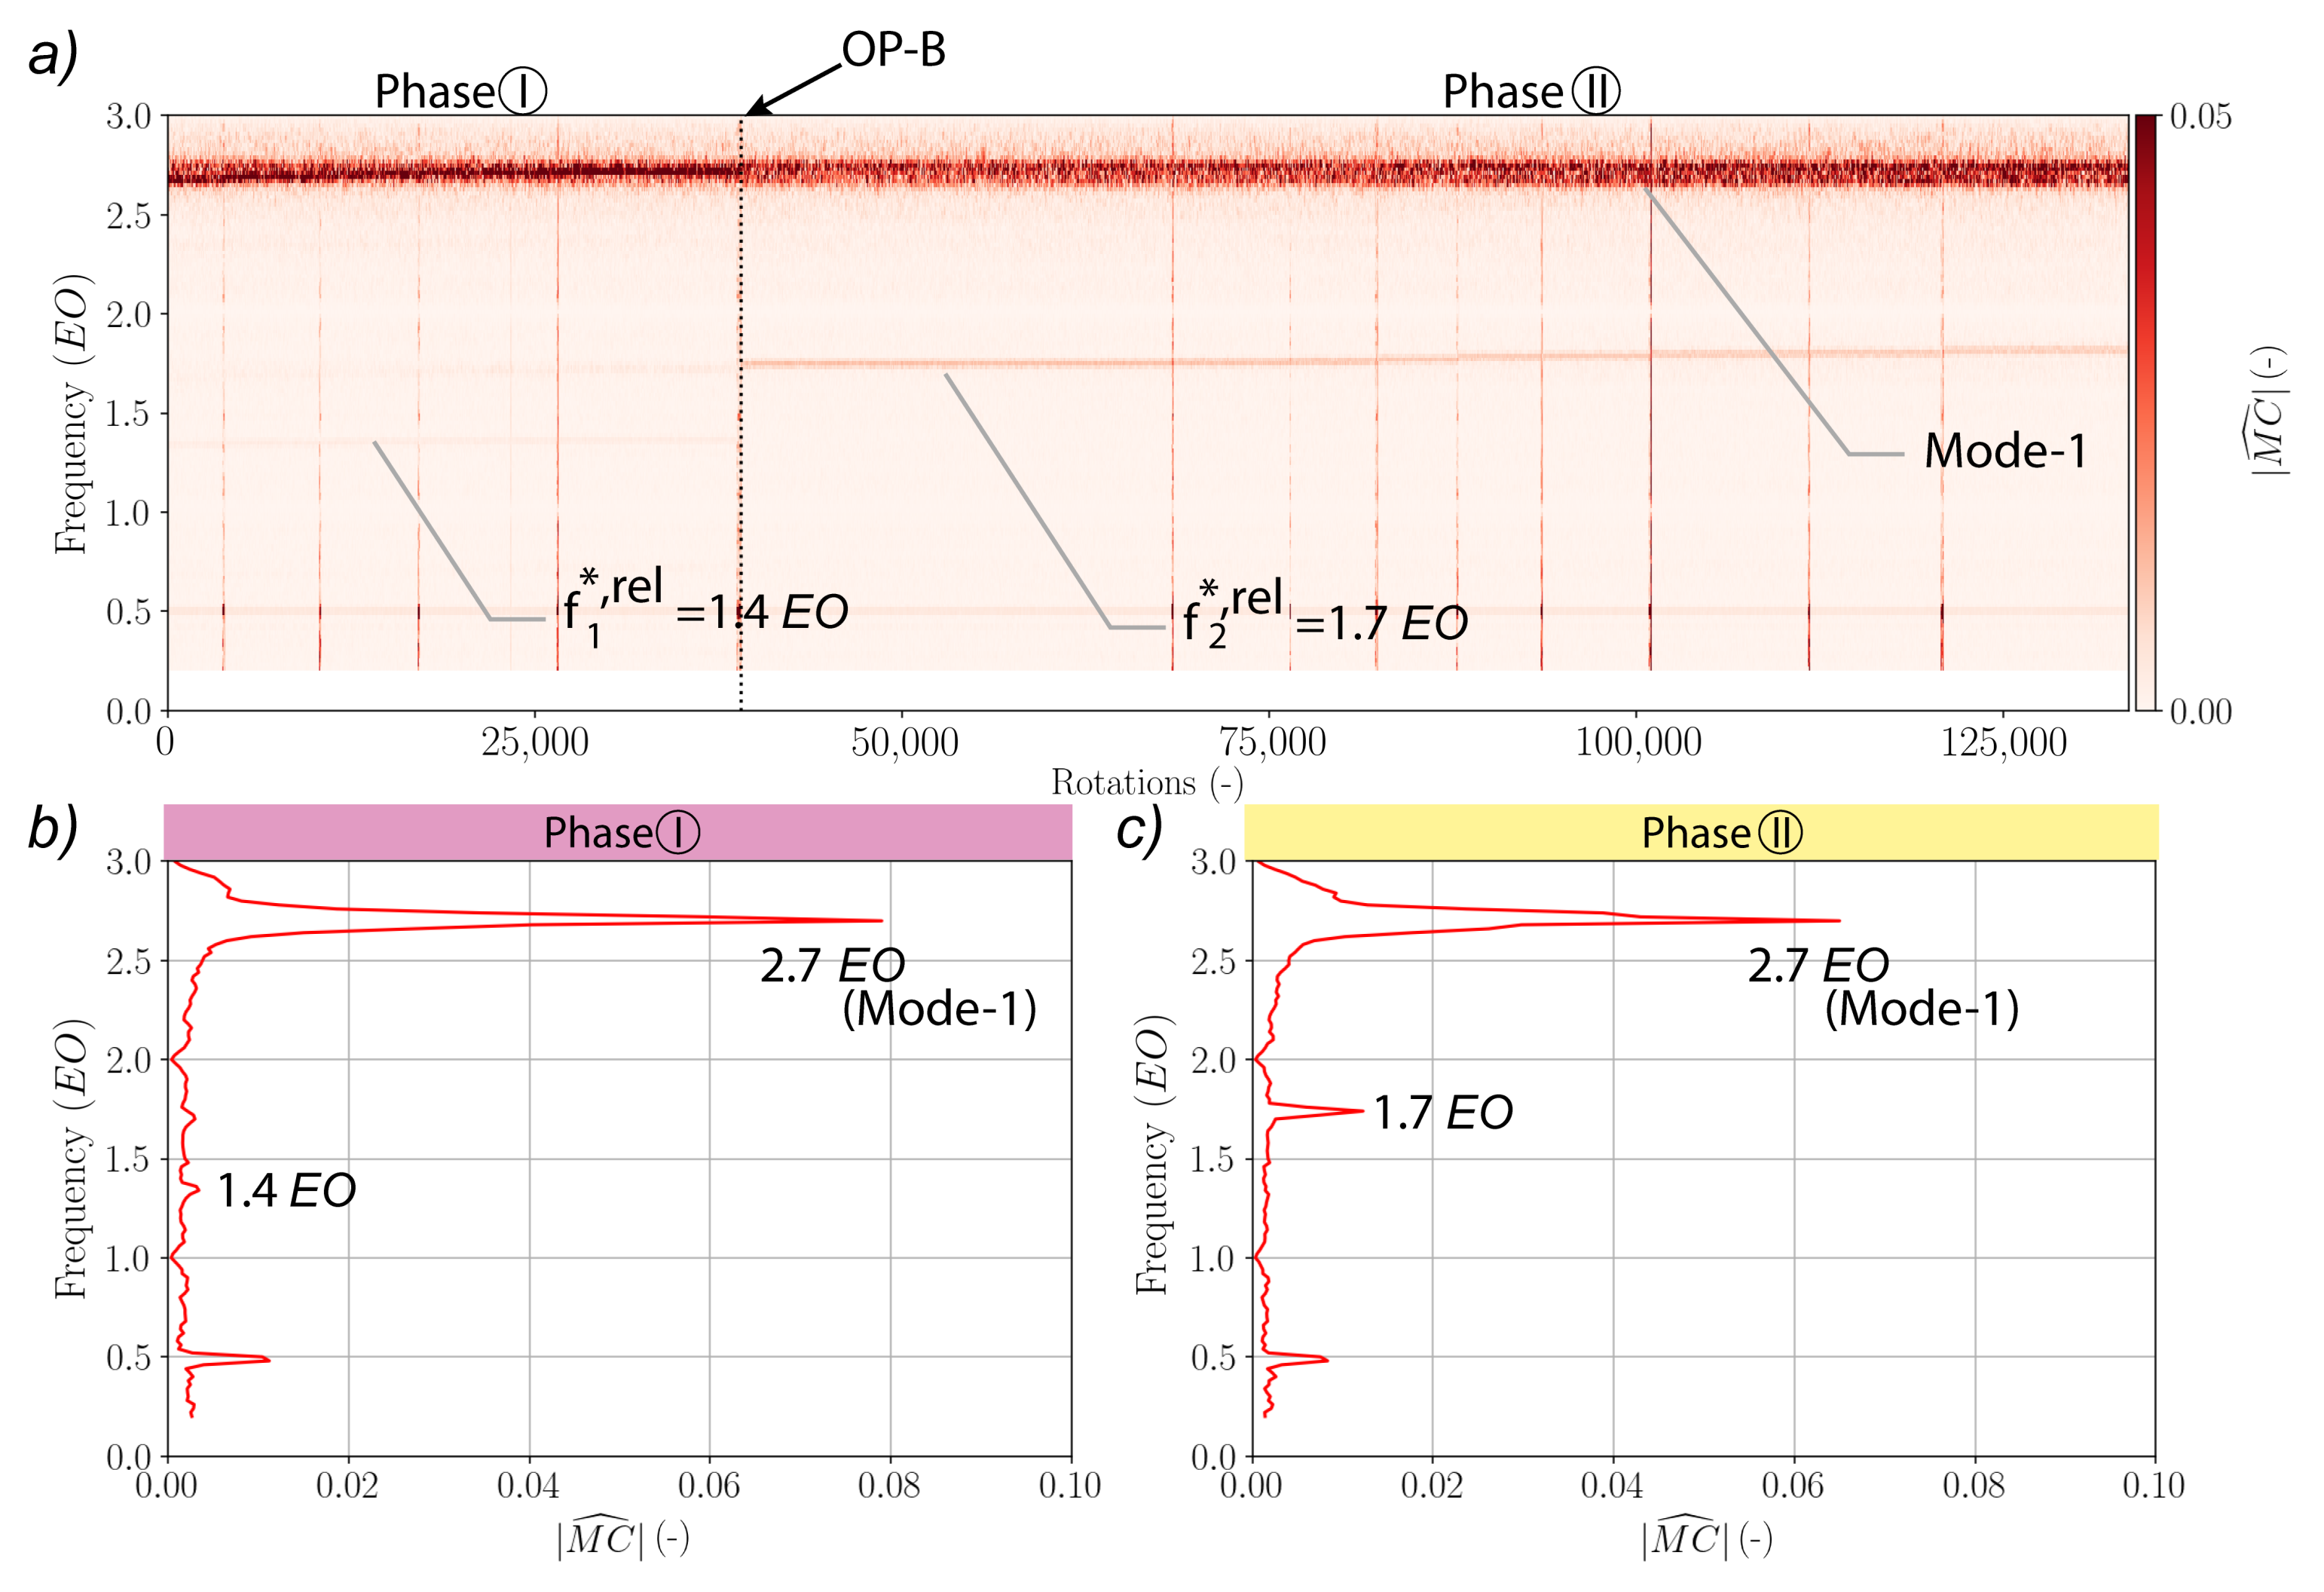
- The 1st blade eigenfrequency of Rotor-2 indicated by Mode-1 at ;
- The 2nd blade eigenfrequency of Rotor-2 indicated by Mode-2 at ;
- The 3rd blade eigenfrequency of Rotor-2 indicated by Mode-3 at .
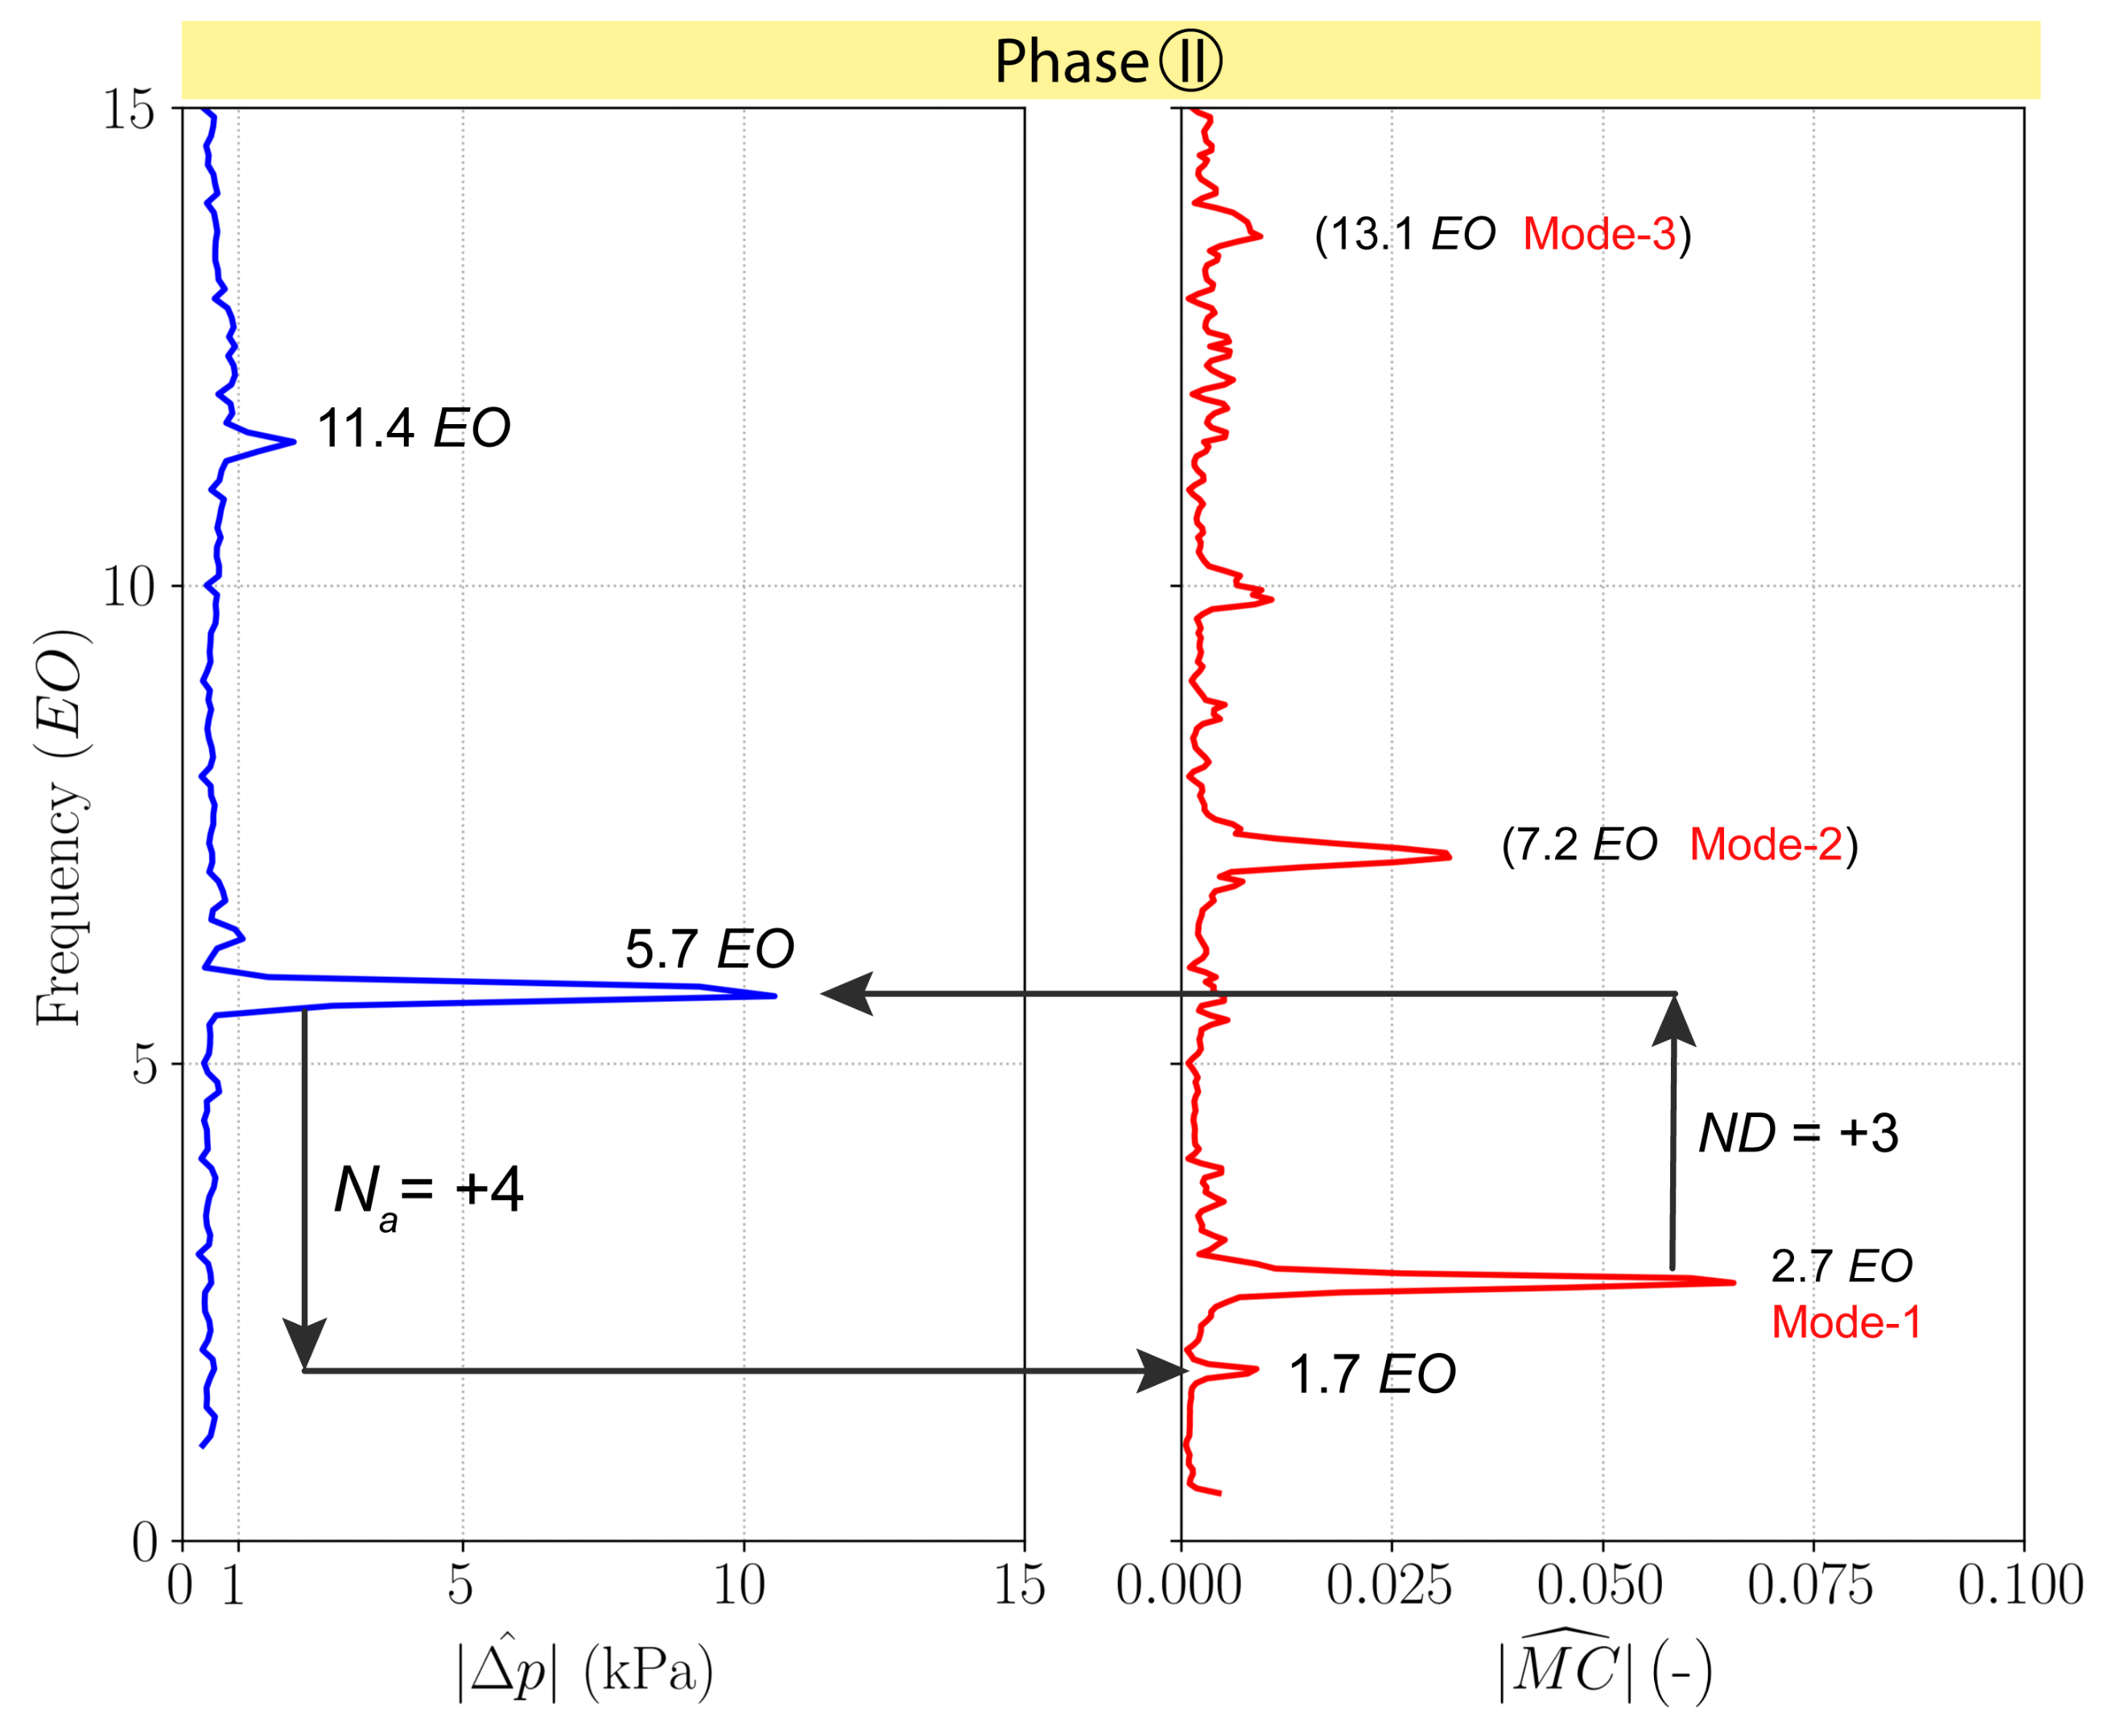
- A non-synchronous pressure frequency at ;
- Its 2nd harmonic at ;
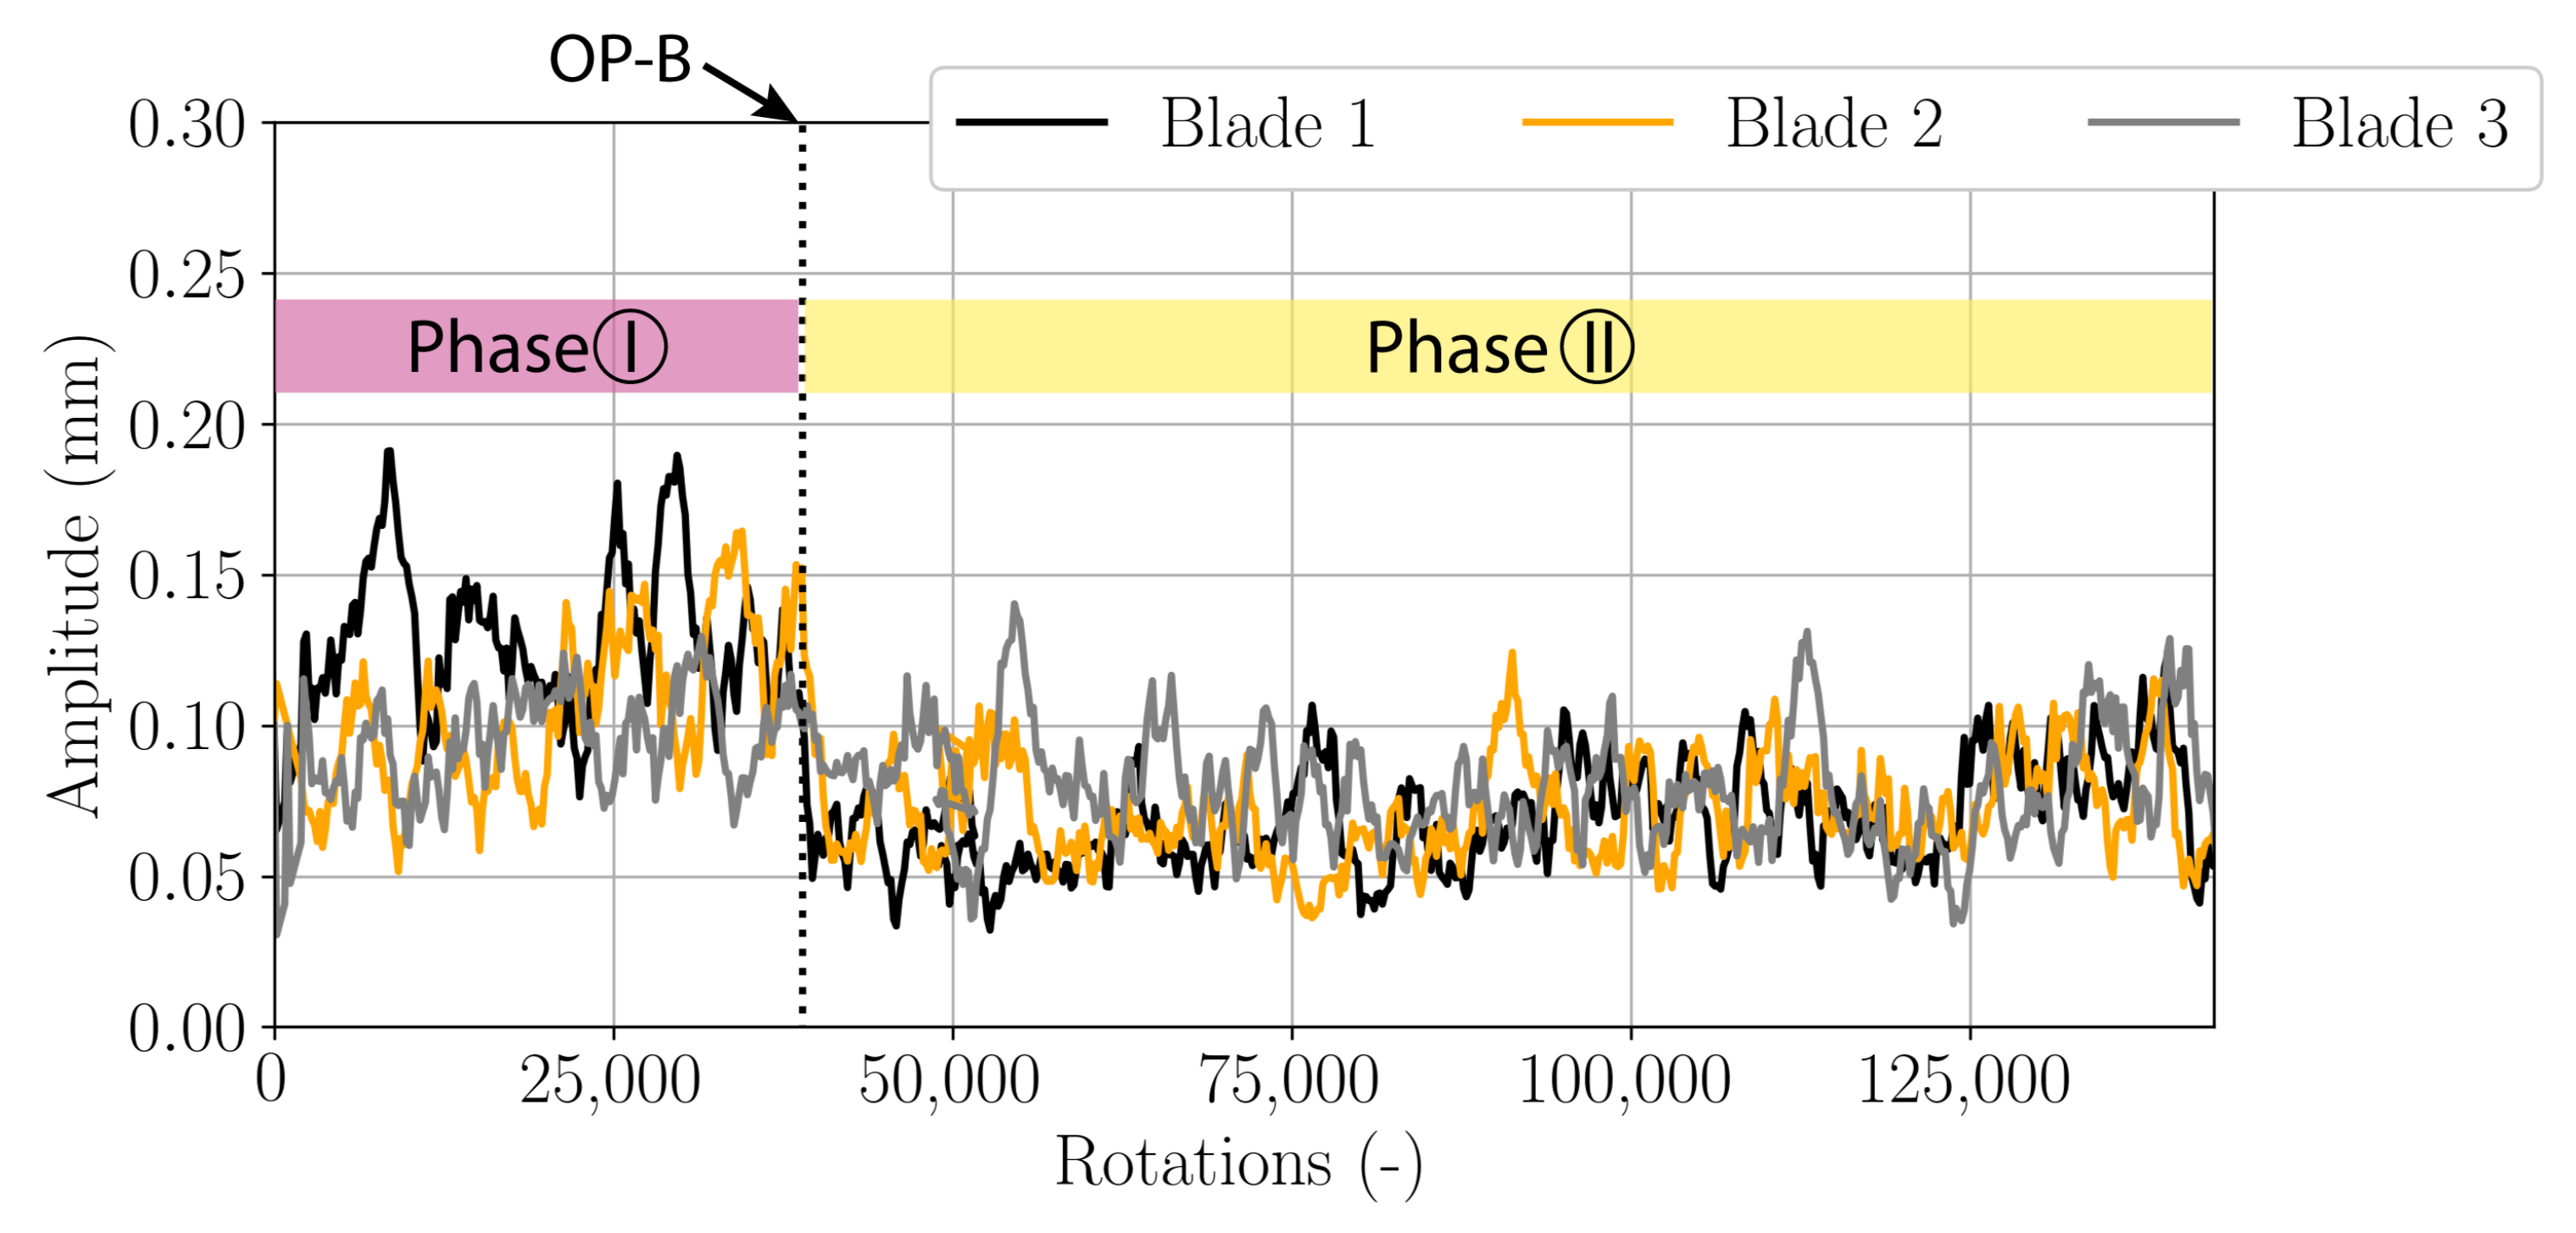
- a non-synchronous vibrating frequency at ;
- The 1st blade eigenfrequency of Rotor-2 indicated by Mode-1 at ;
- The 2nd blade eigenfrequency of Rotor-2 indicated by Mode-2 at ;
- The 3rd blade eigenfrequency of Rotor-2 indicated by Mode-3 at .
4. Numerical Investigation
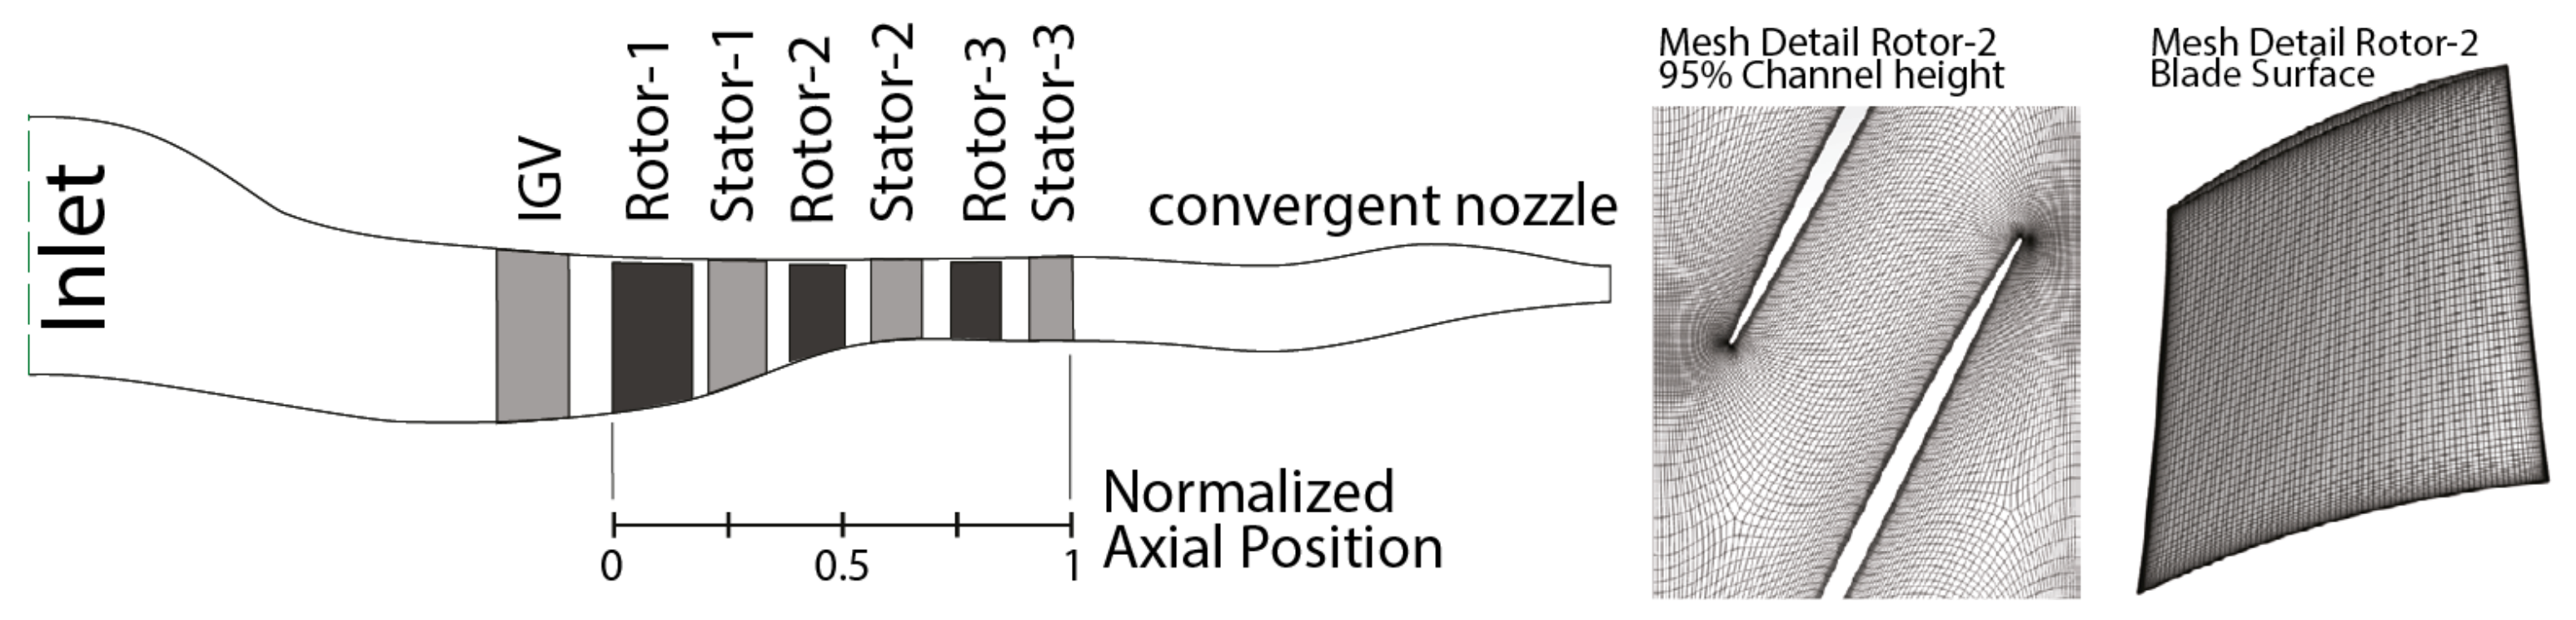
4.1. Numerical Setup
4.2. Simulation Results
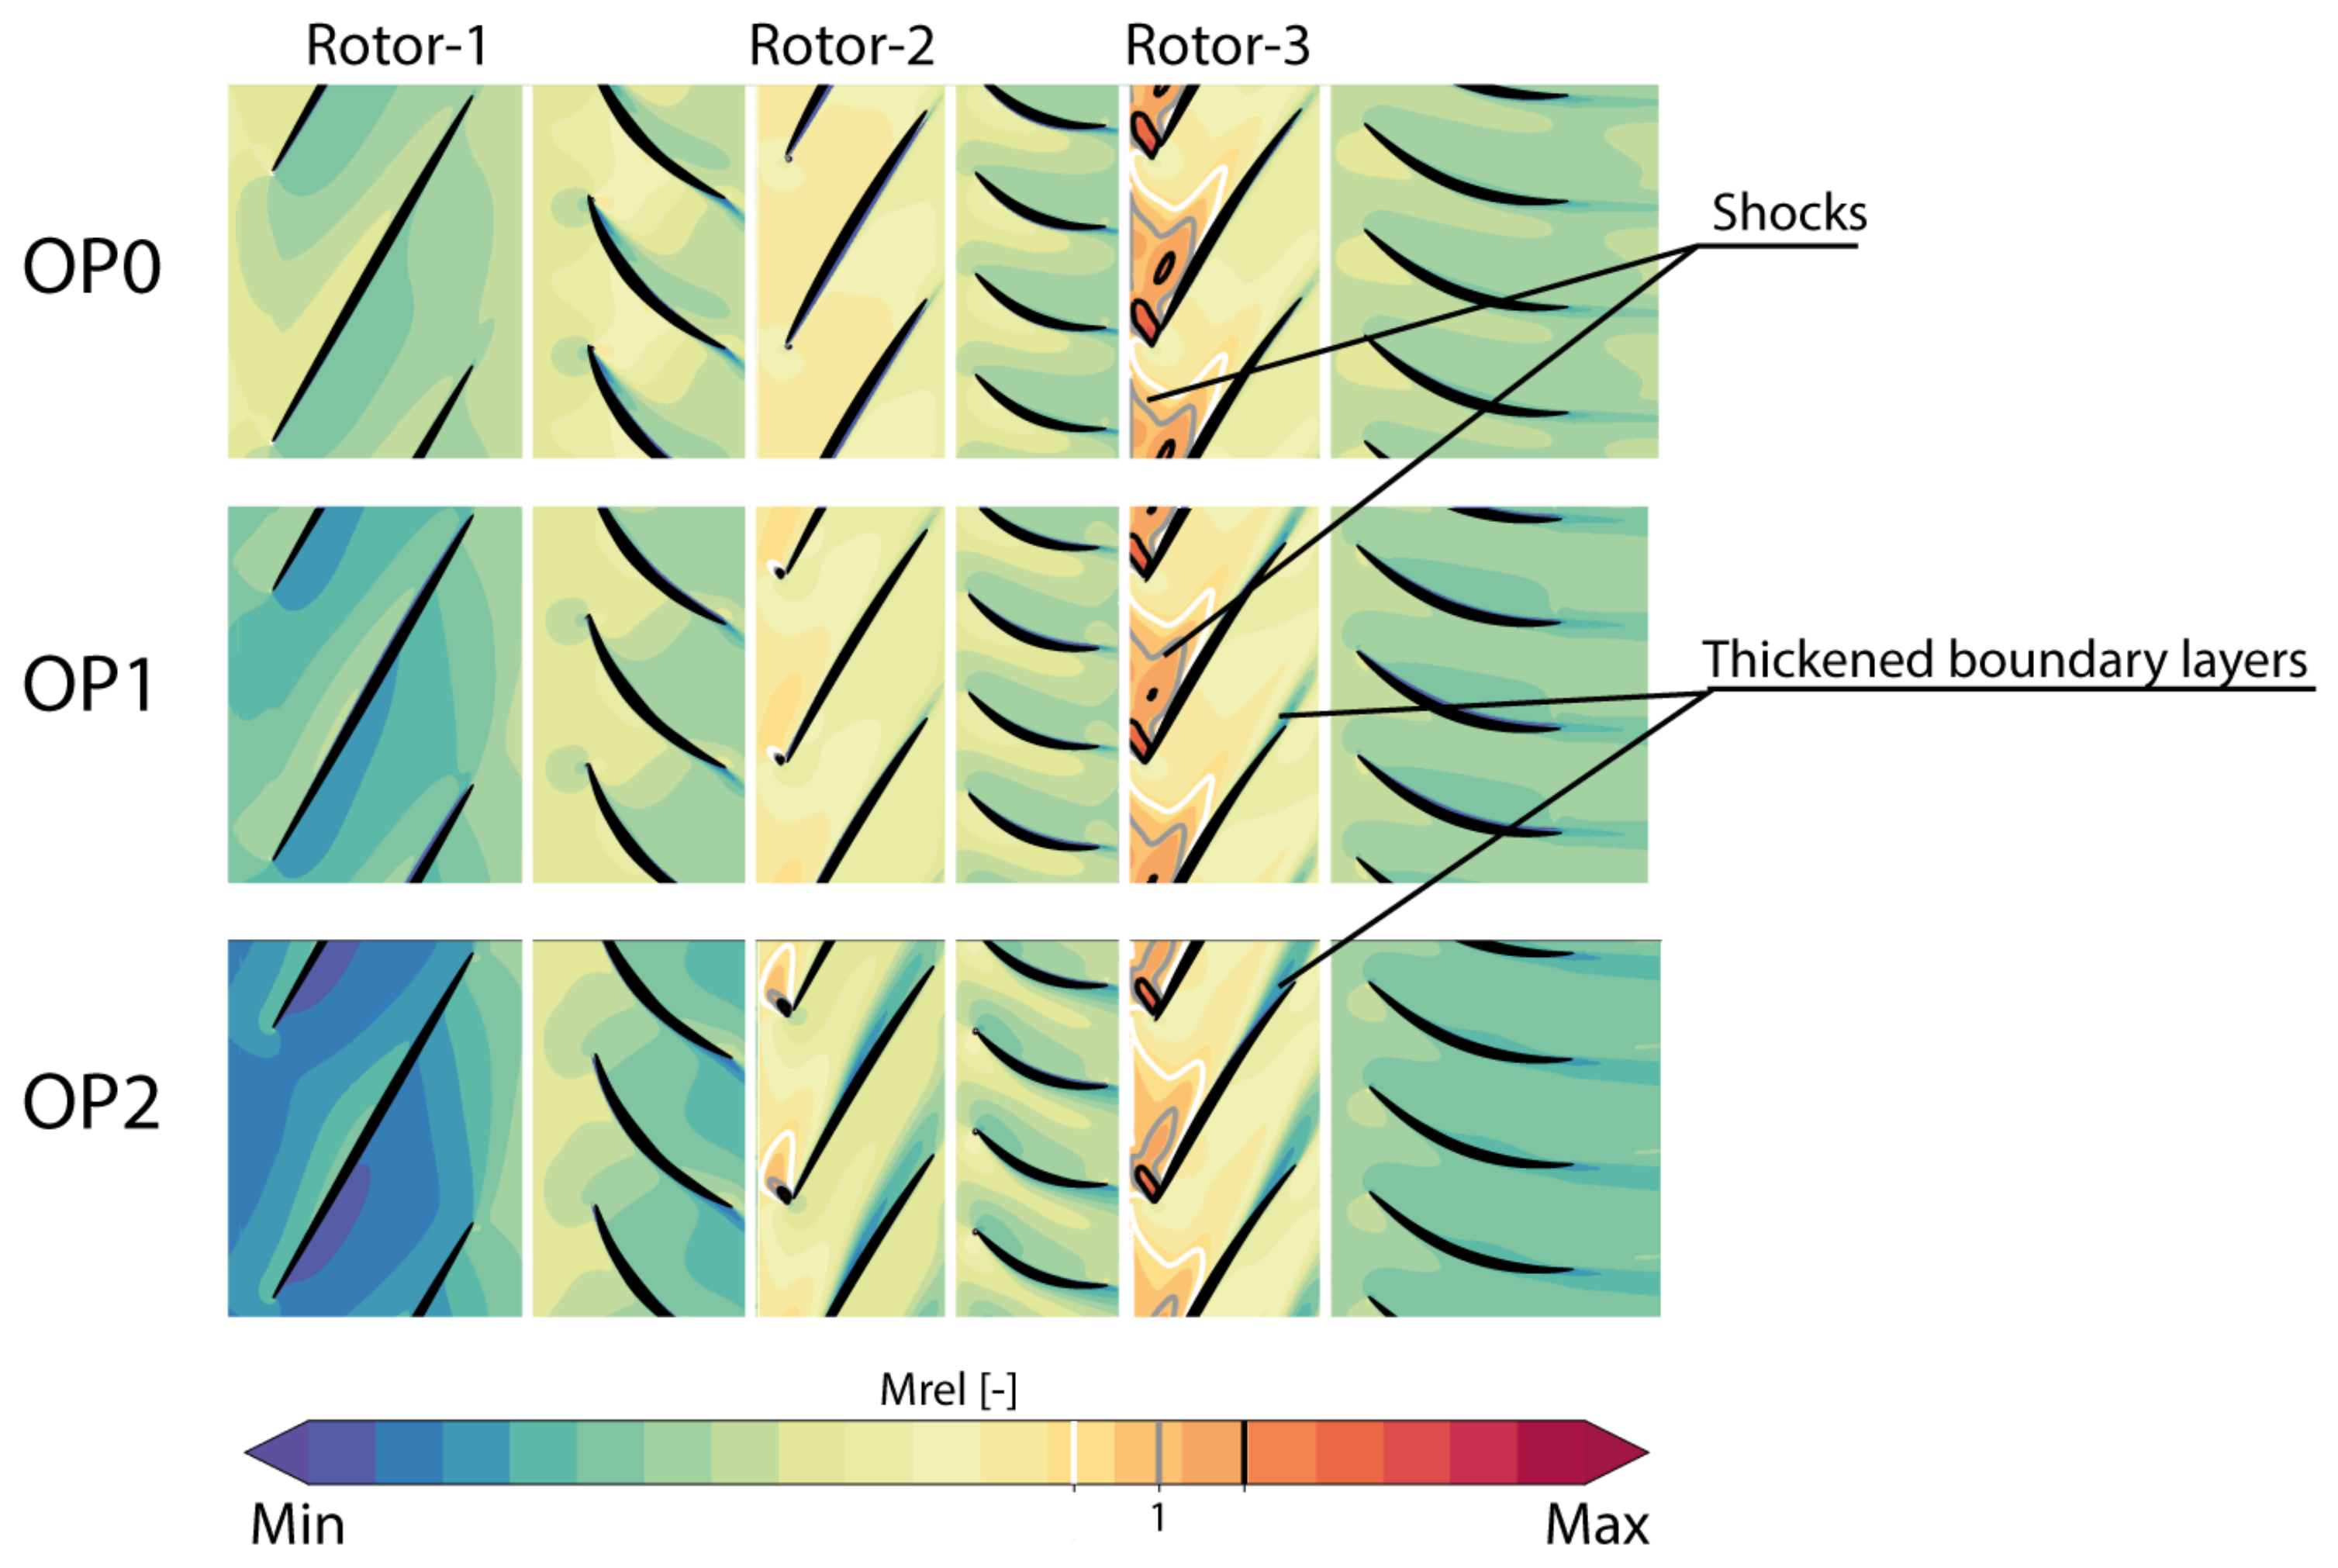
4.2.1. Mean Averaged Results
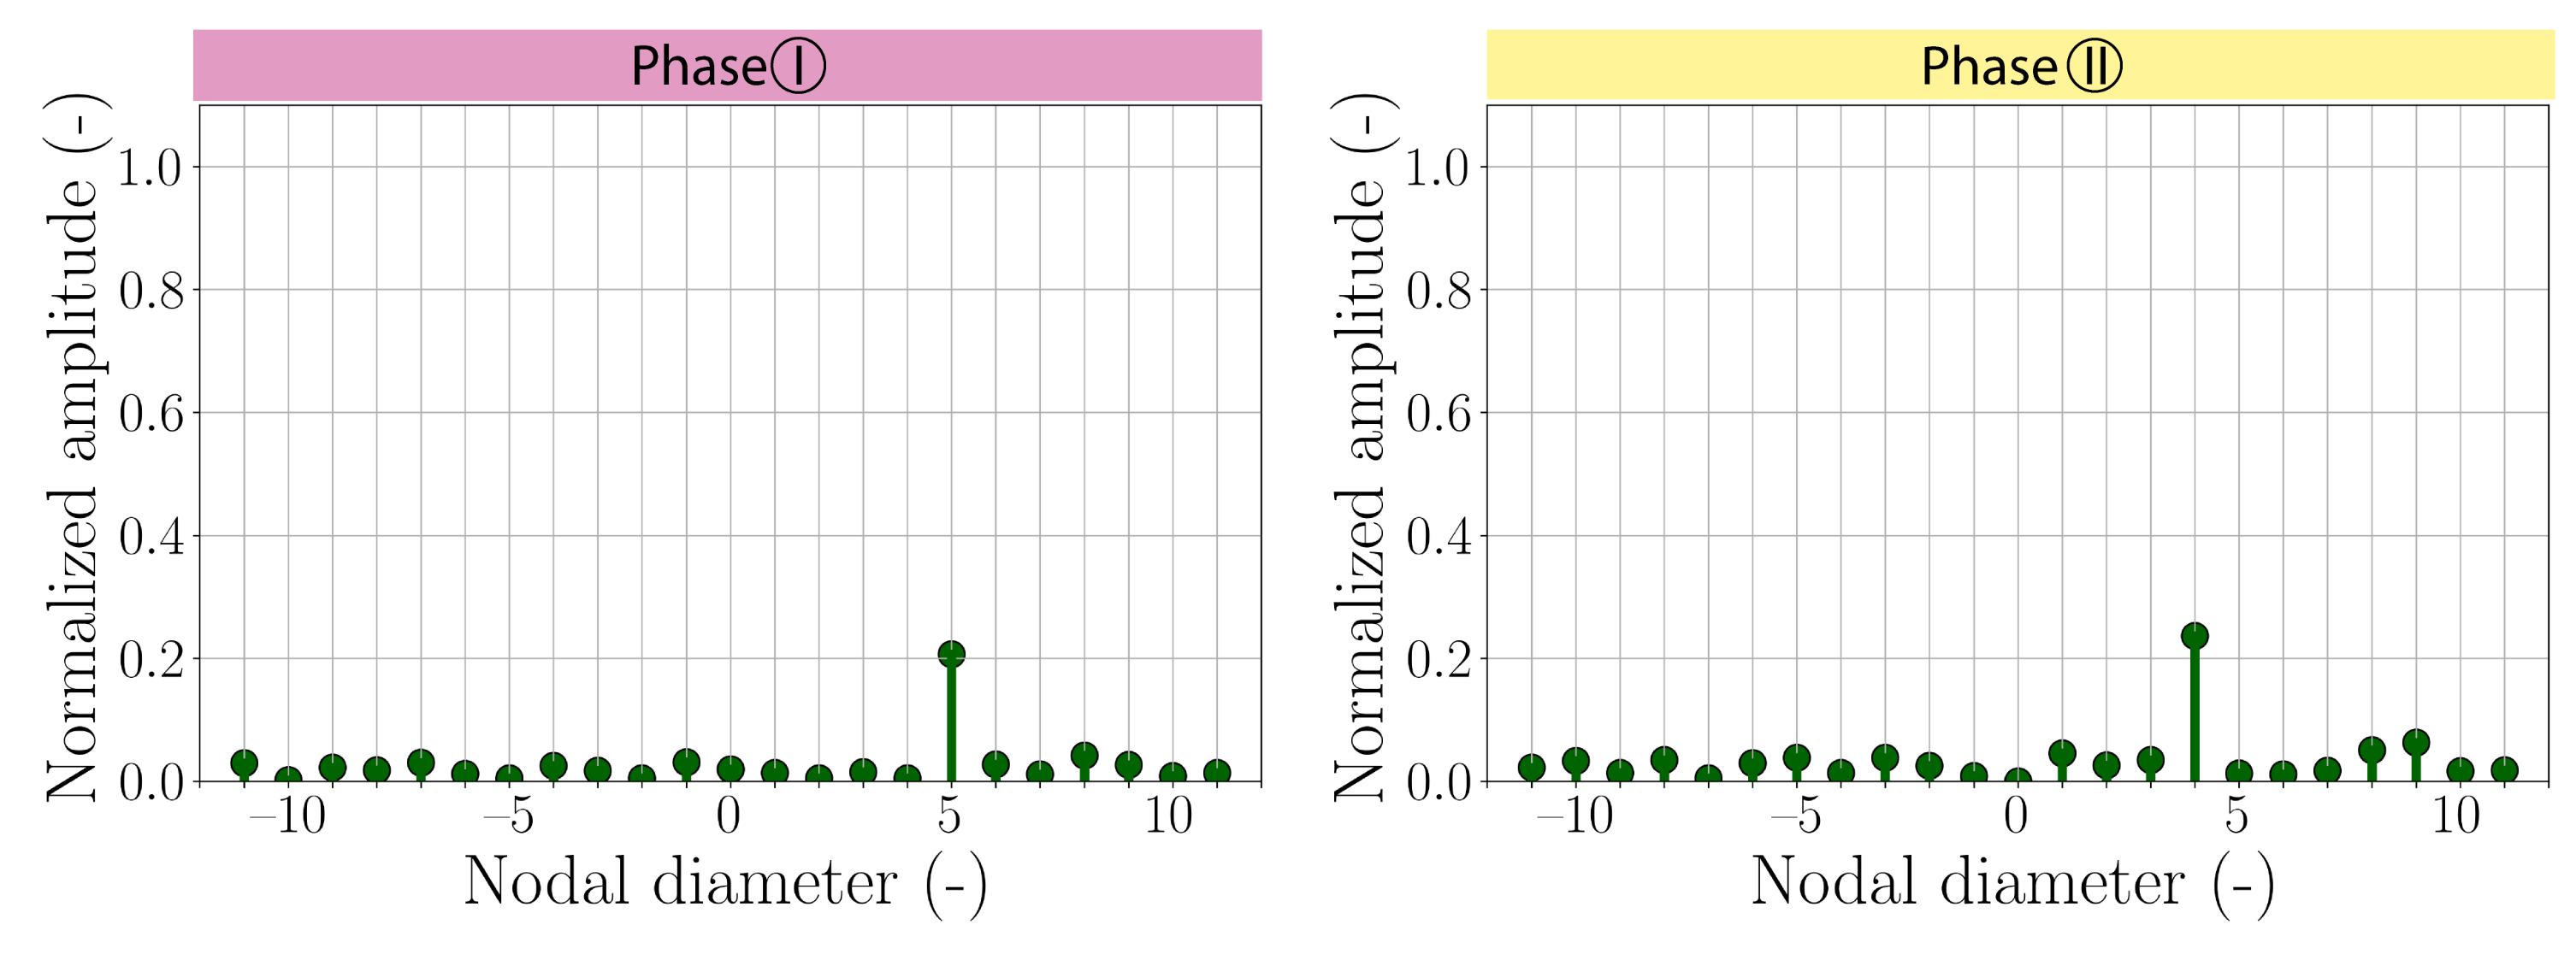
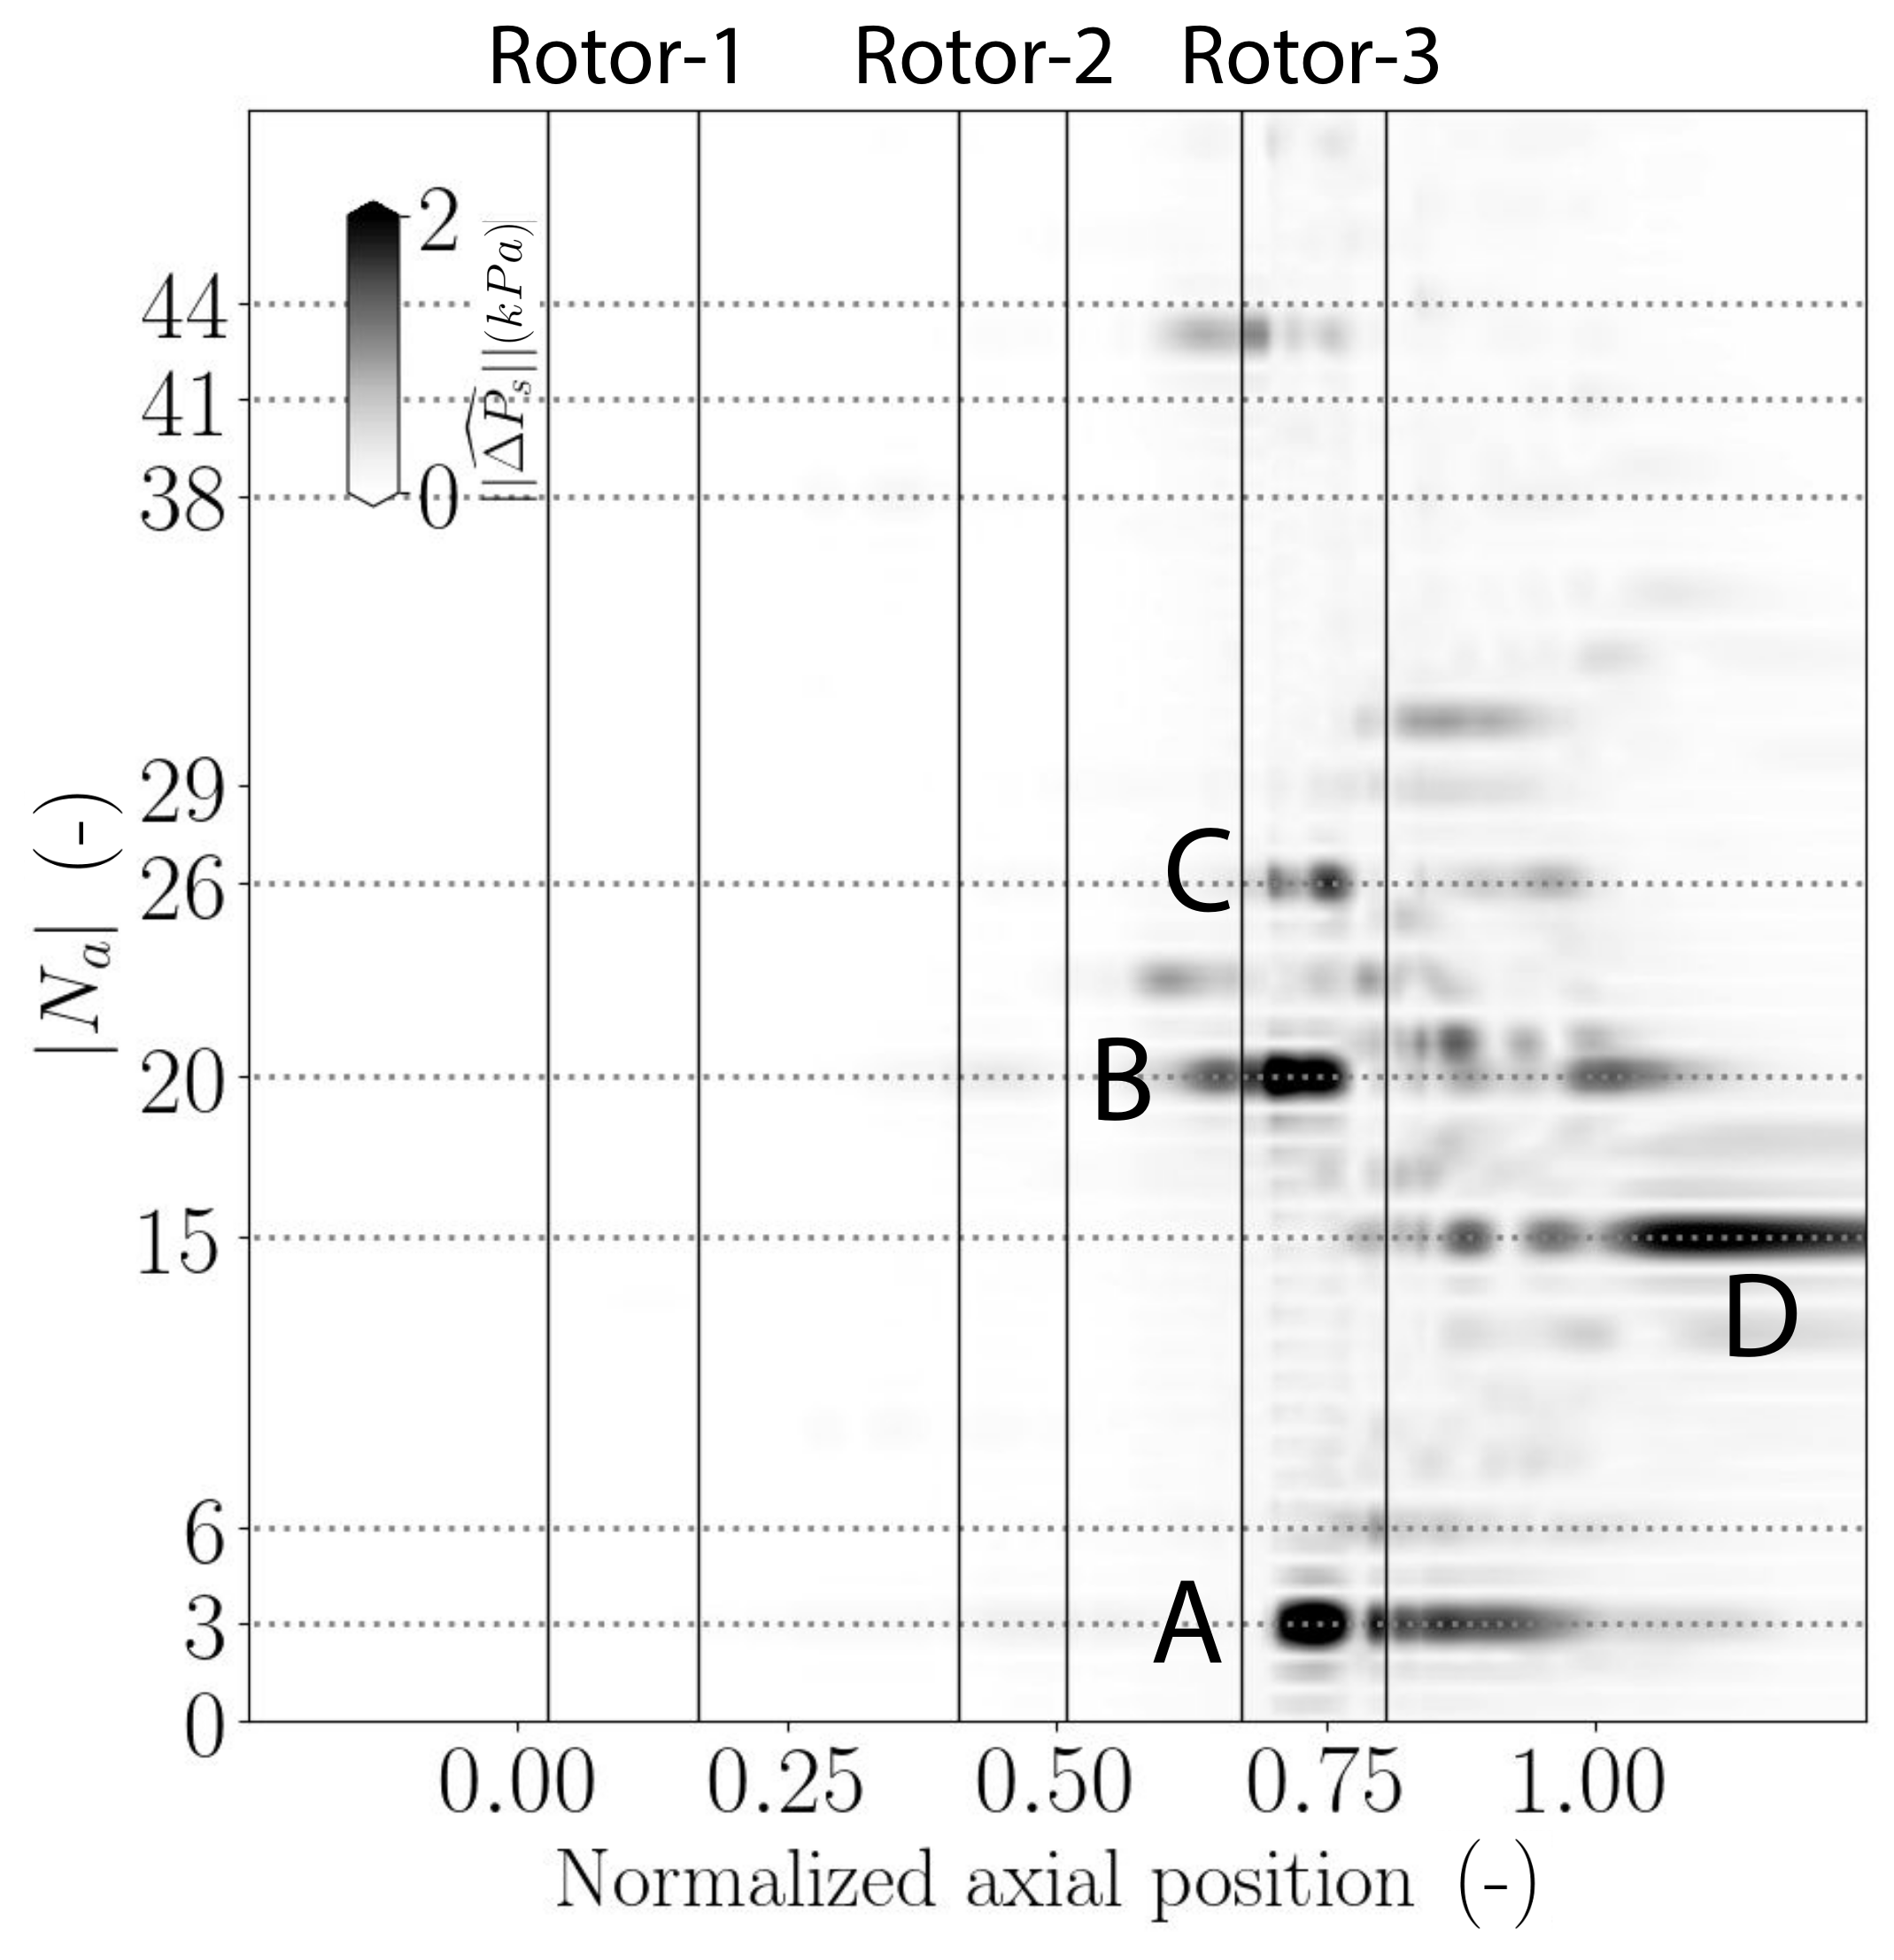
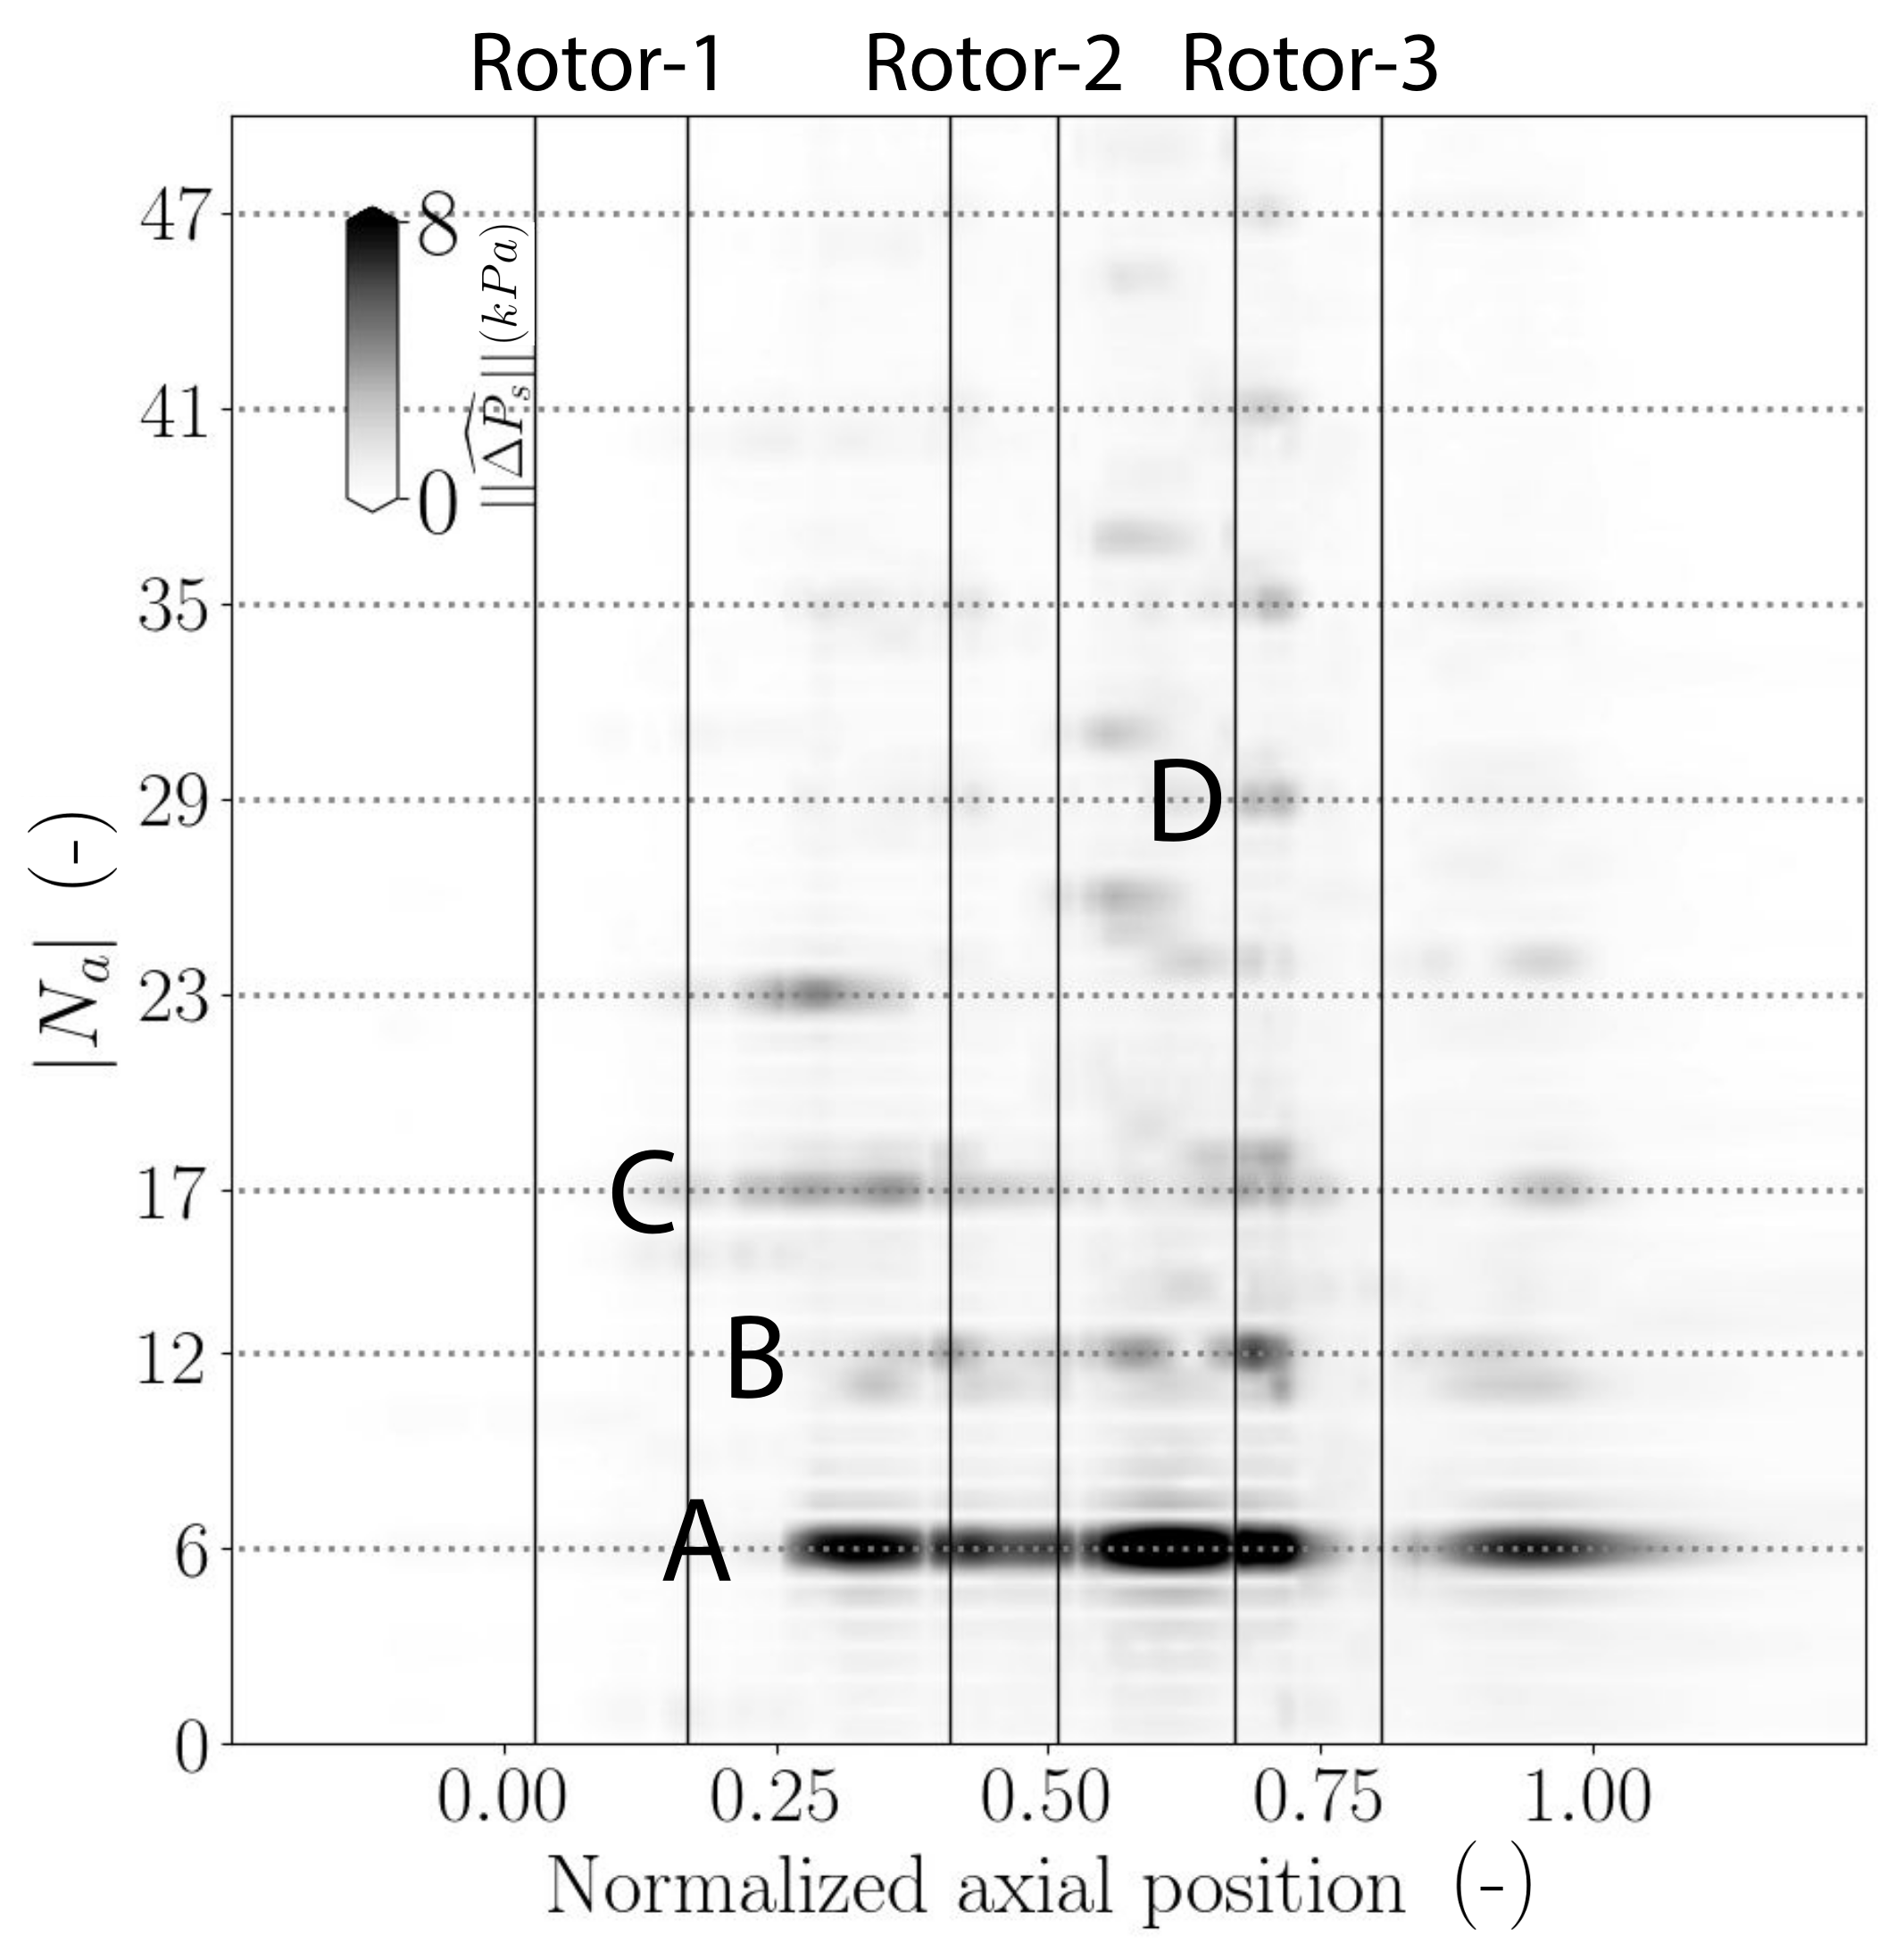
4.2.2. Modal Decomposition
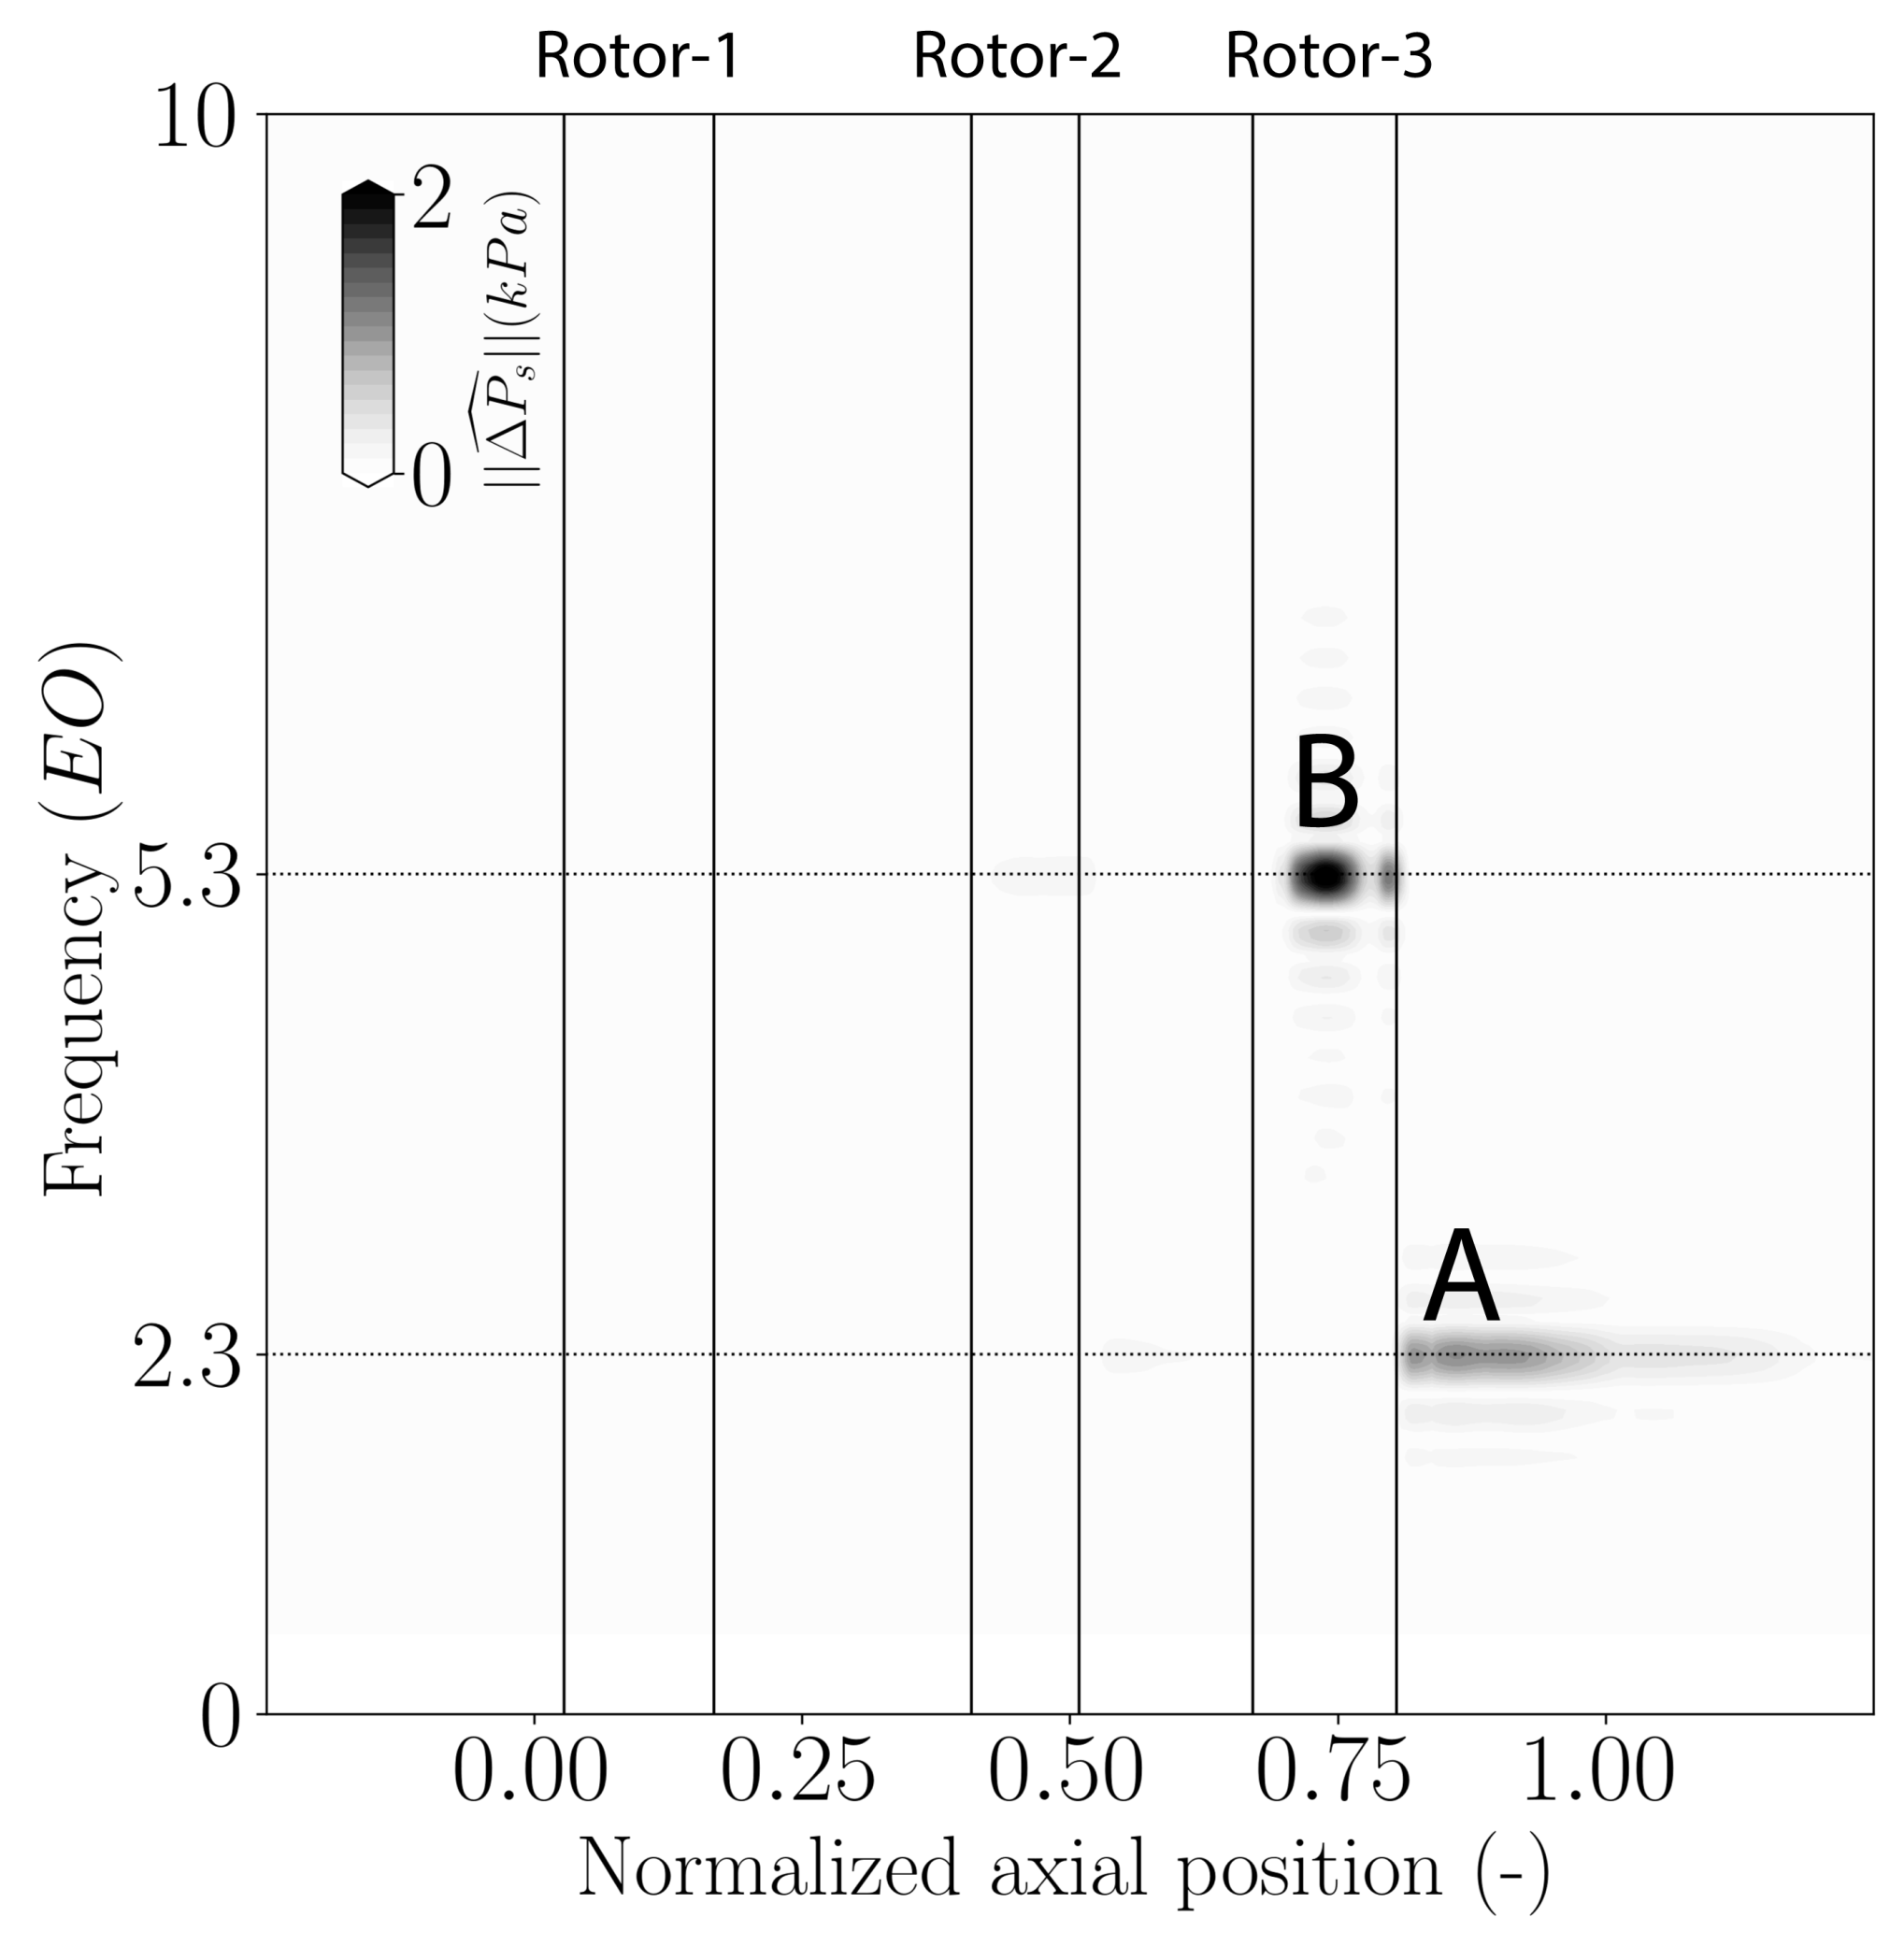
4.2.3. Characteristics of Non-Synchronous Dominant Modes
4.2.4. Lock-In between Aerodynamic Disturbances and Acoustic Modes
5. Comparison and Discussion
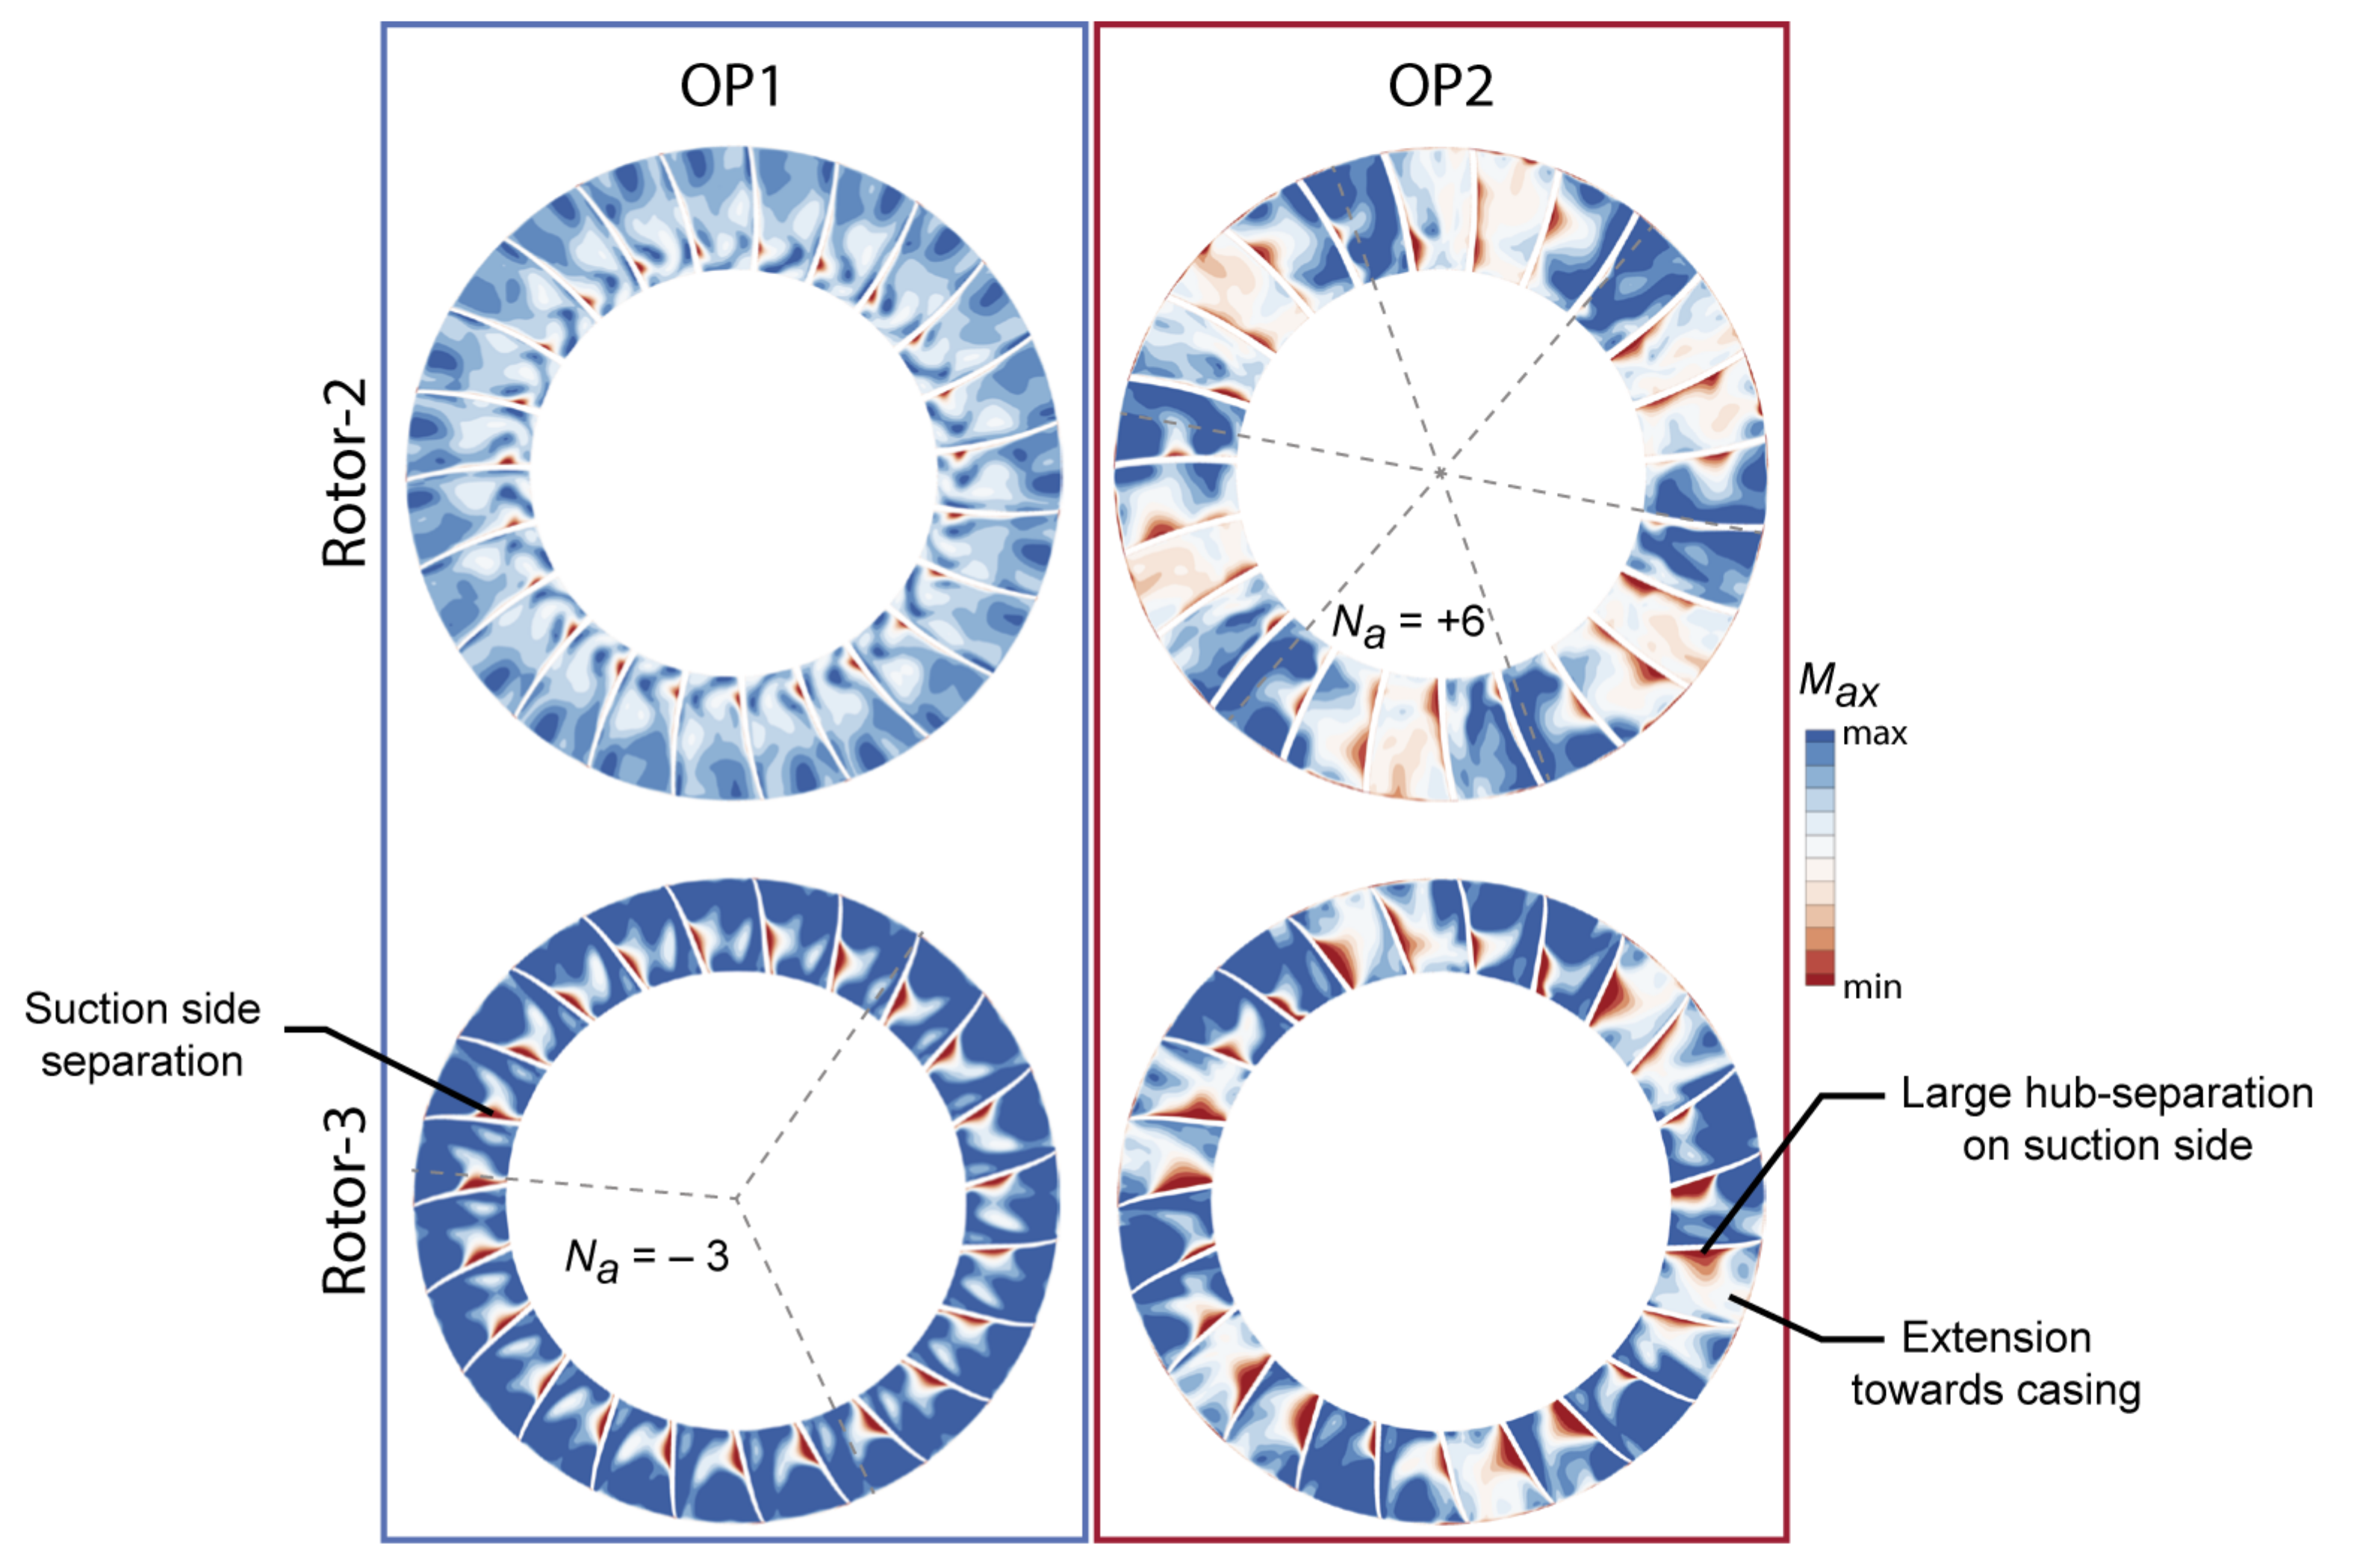
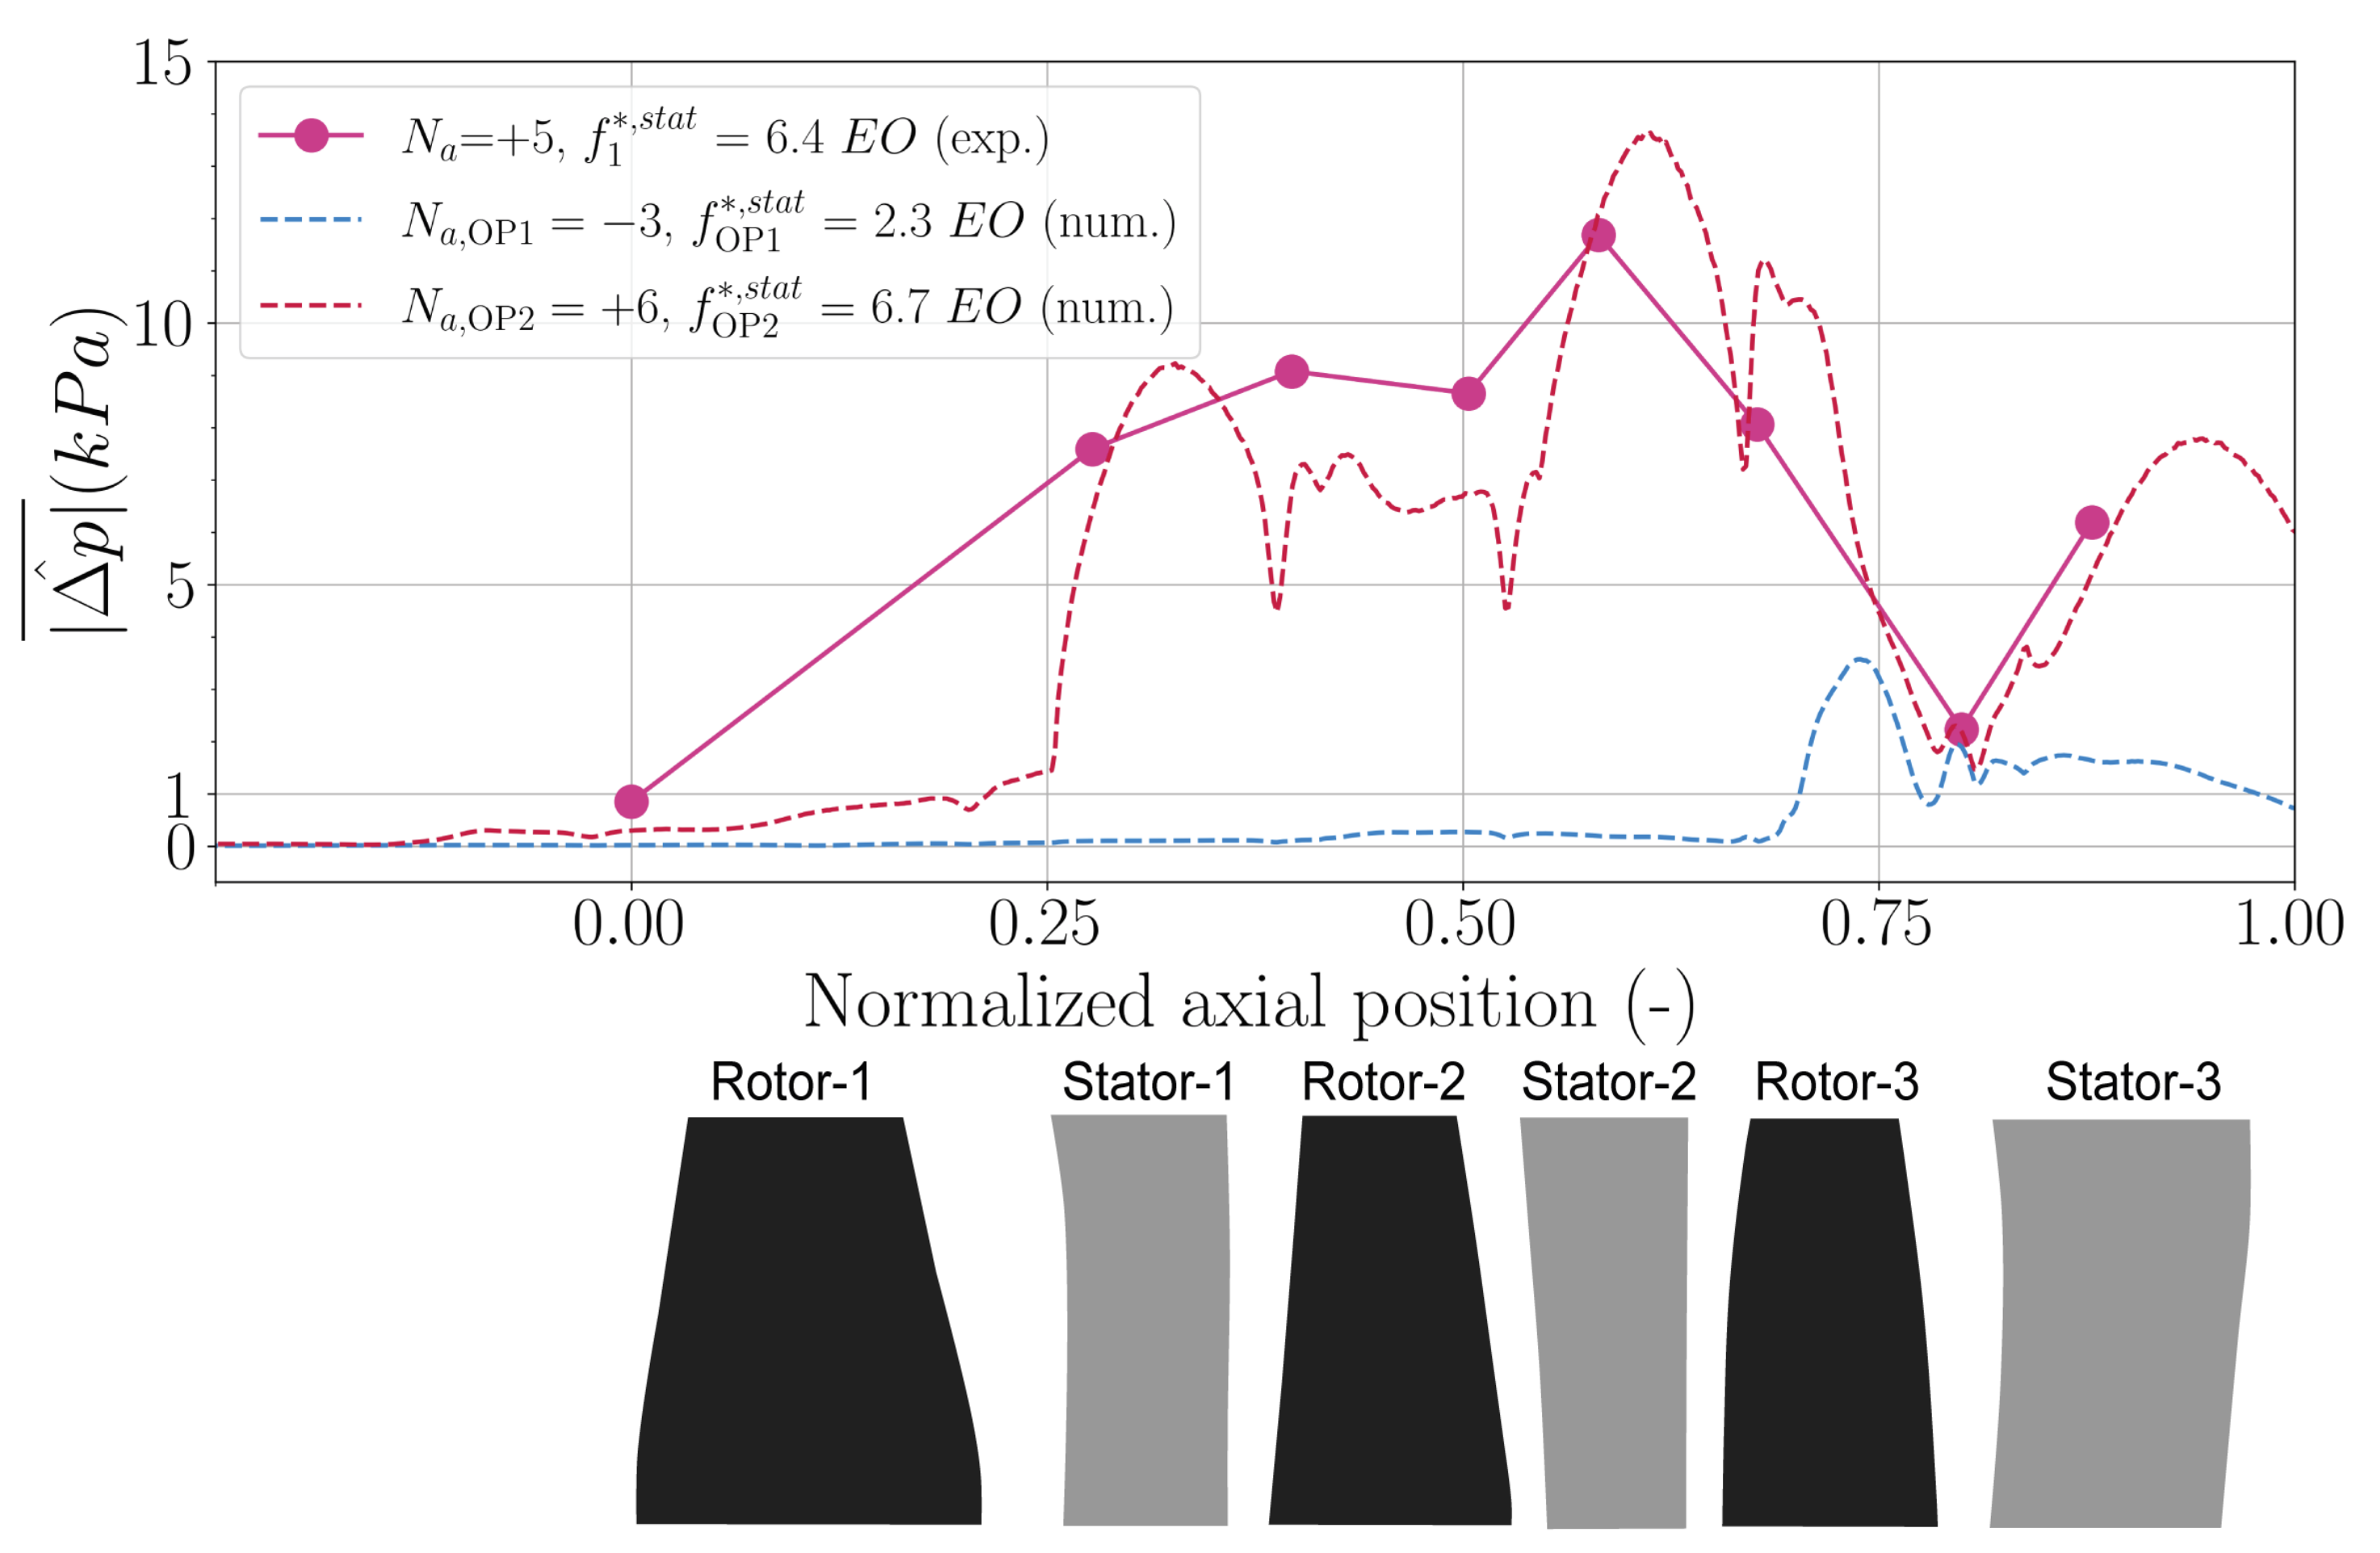
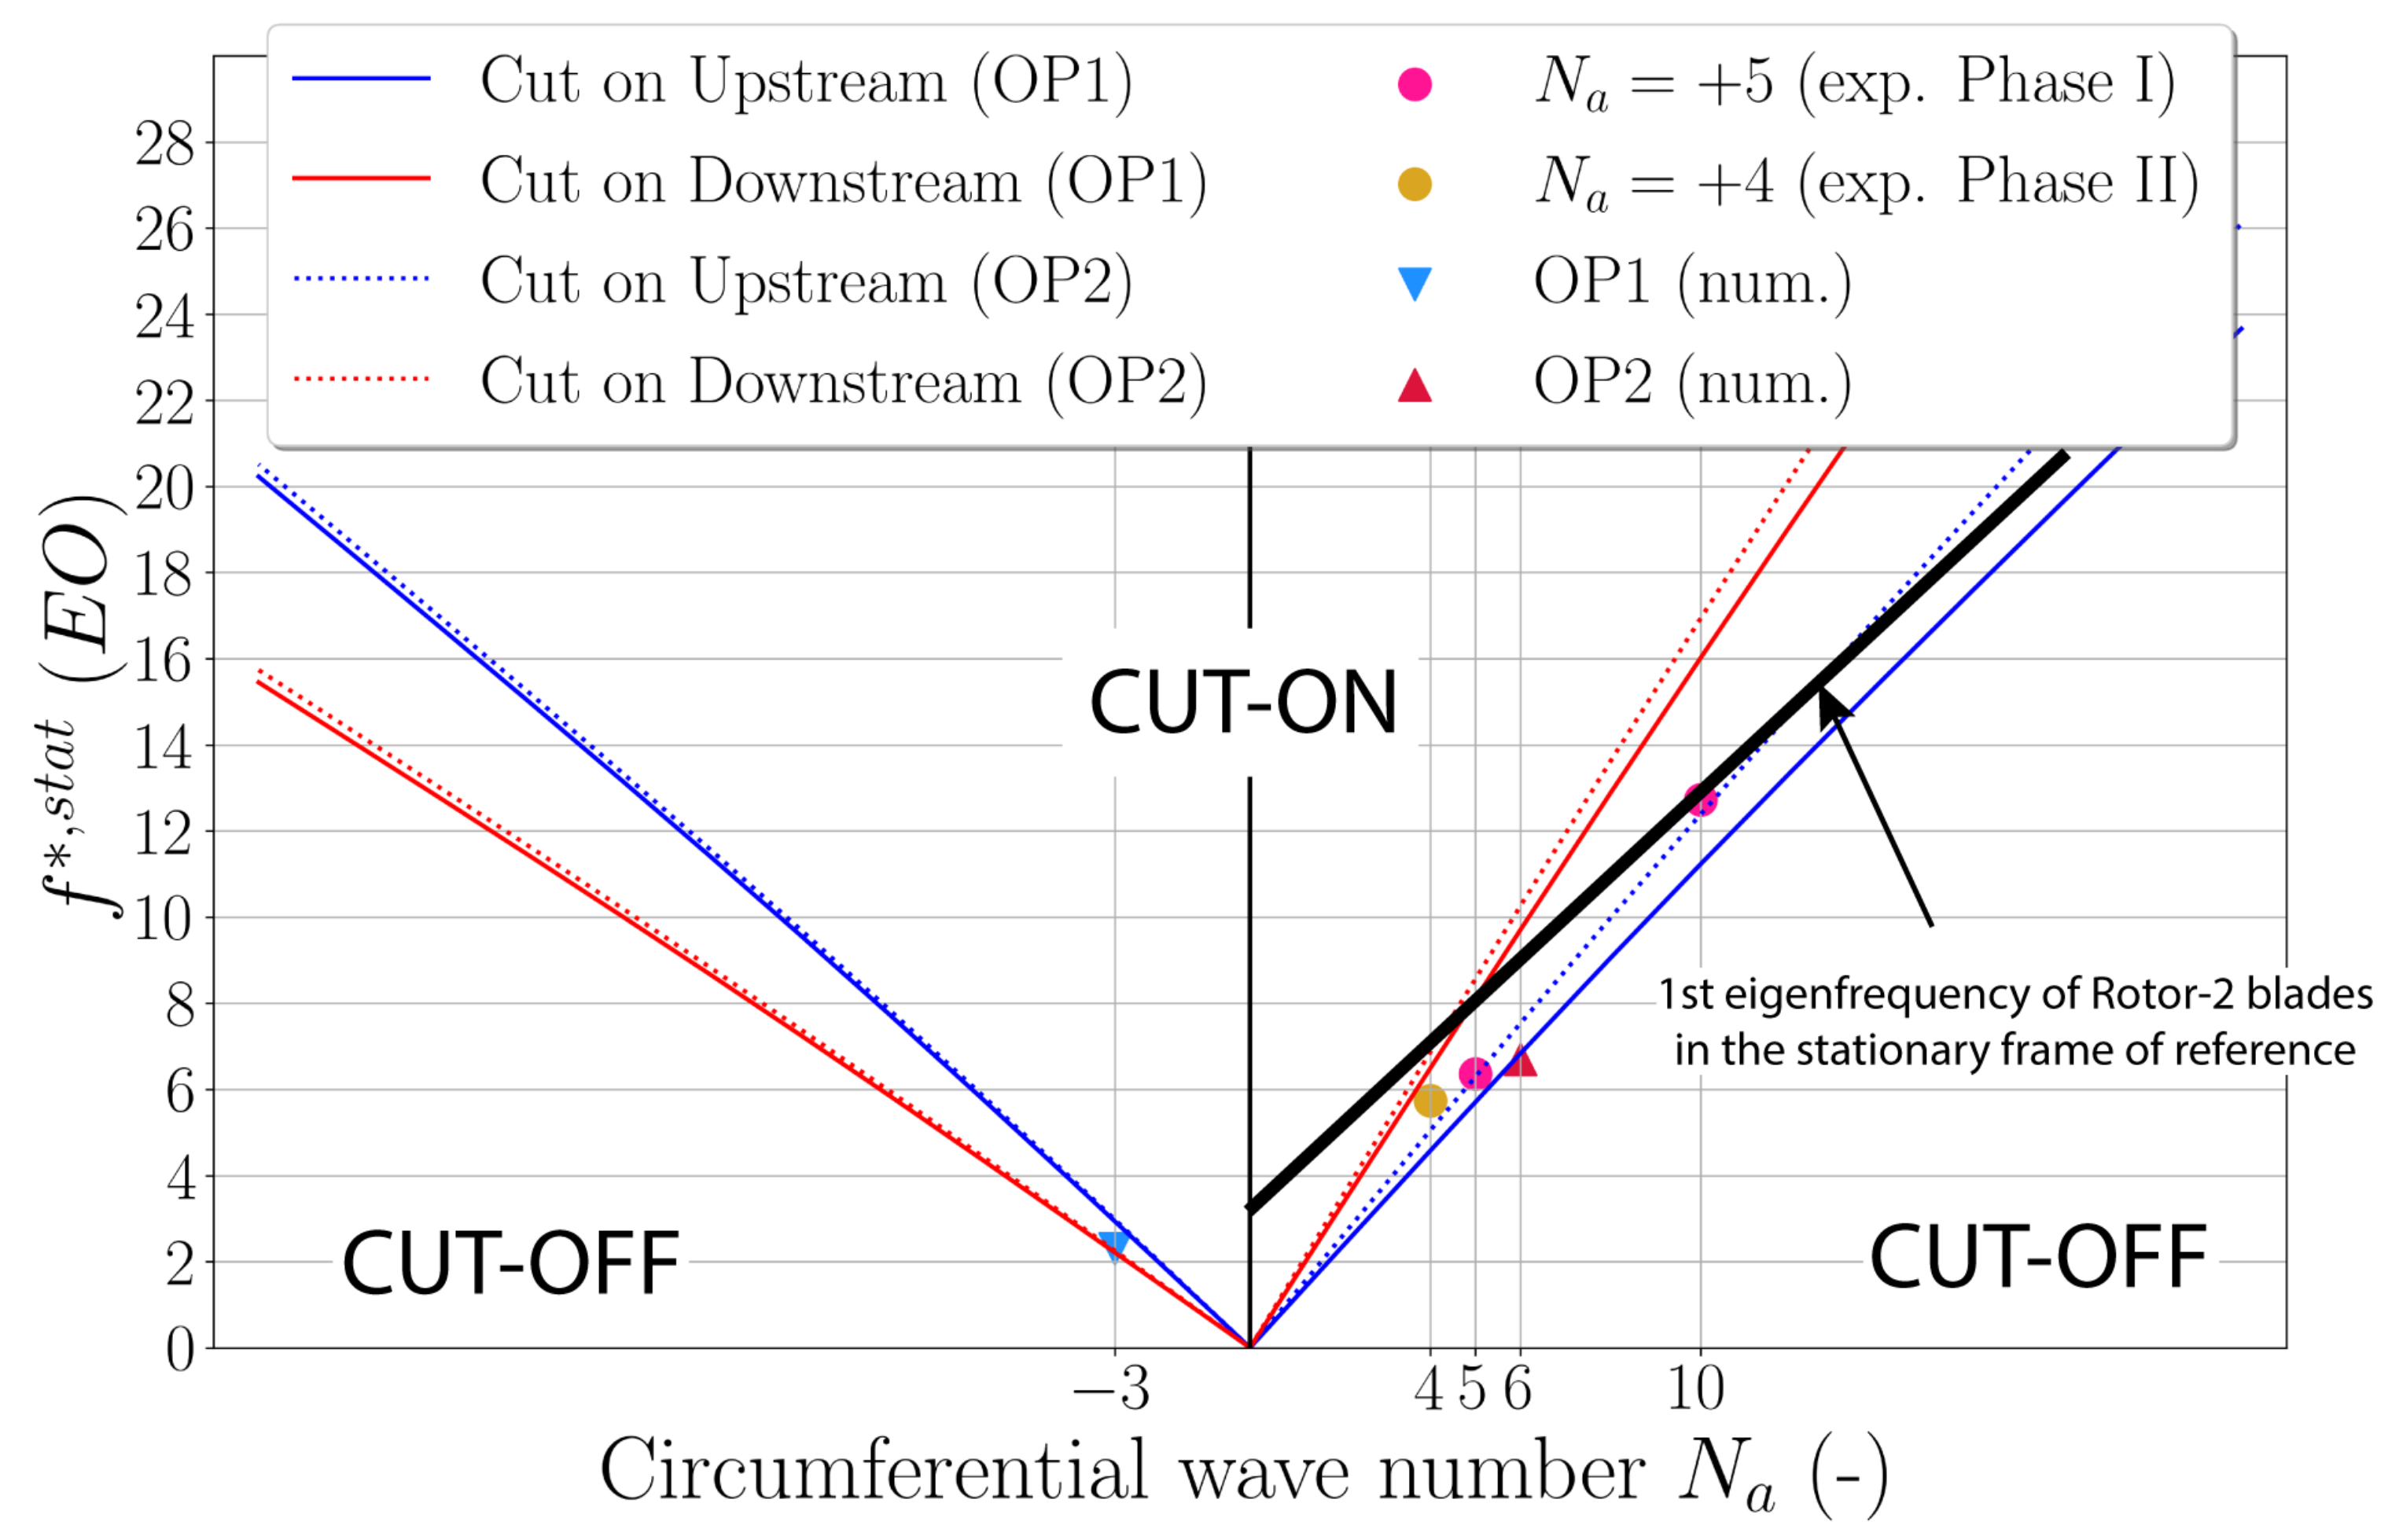
- All occurring modes, both experimentally and in simulations, are propagative only in one axial direction. Co-rotating modes () are cut-on only upstream, while contra-rotating modes () are cut-on only downstream;
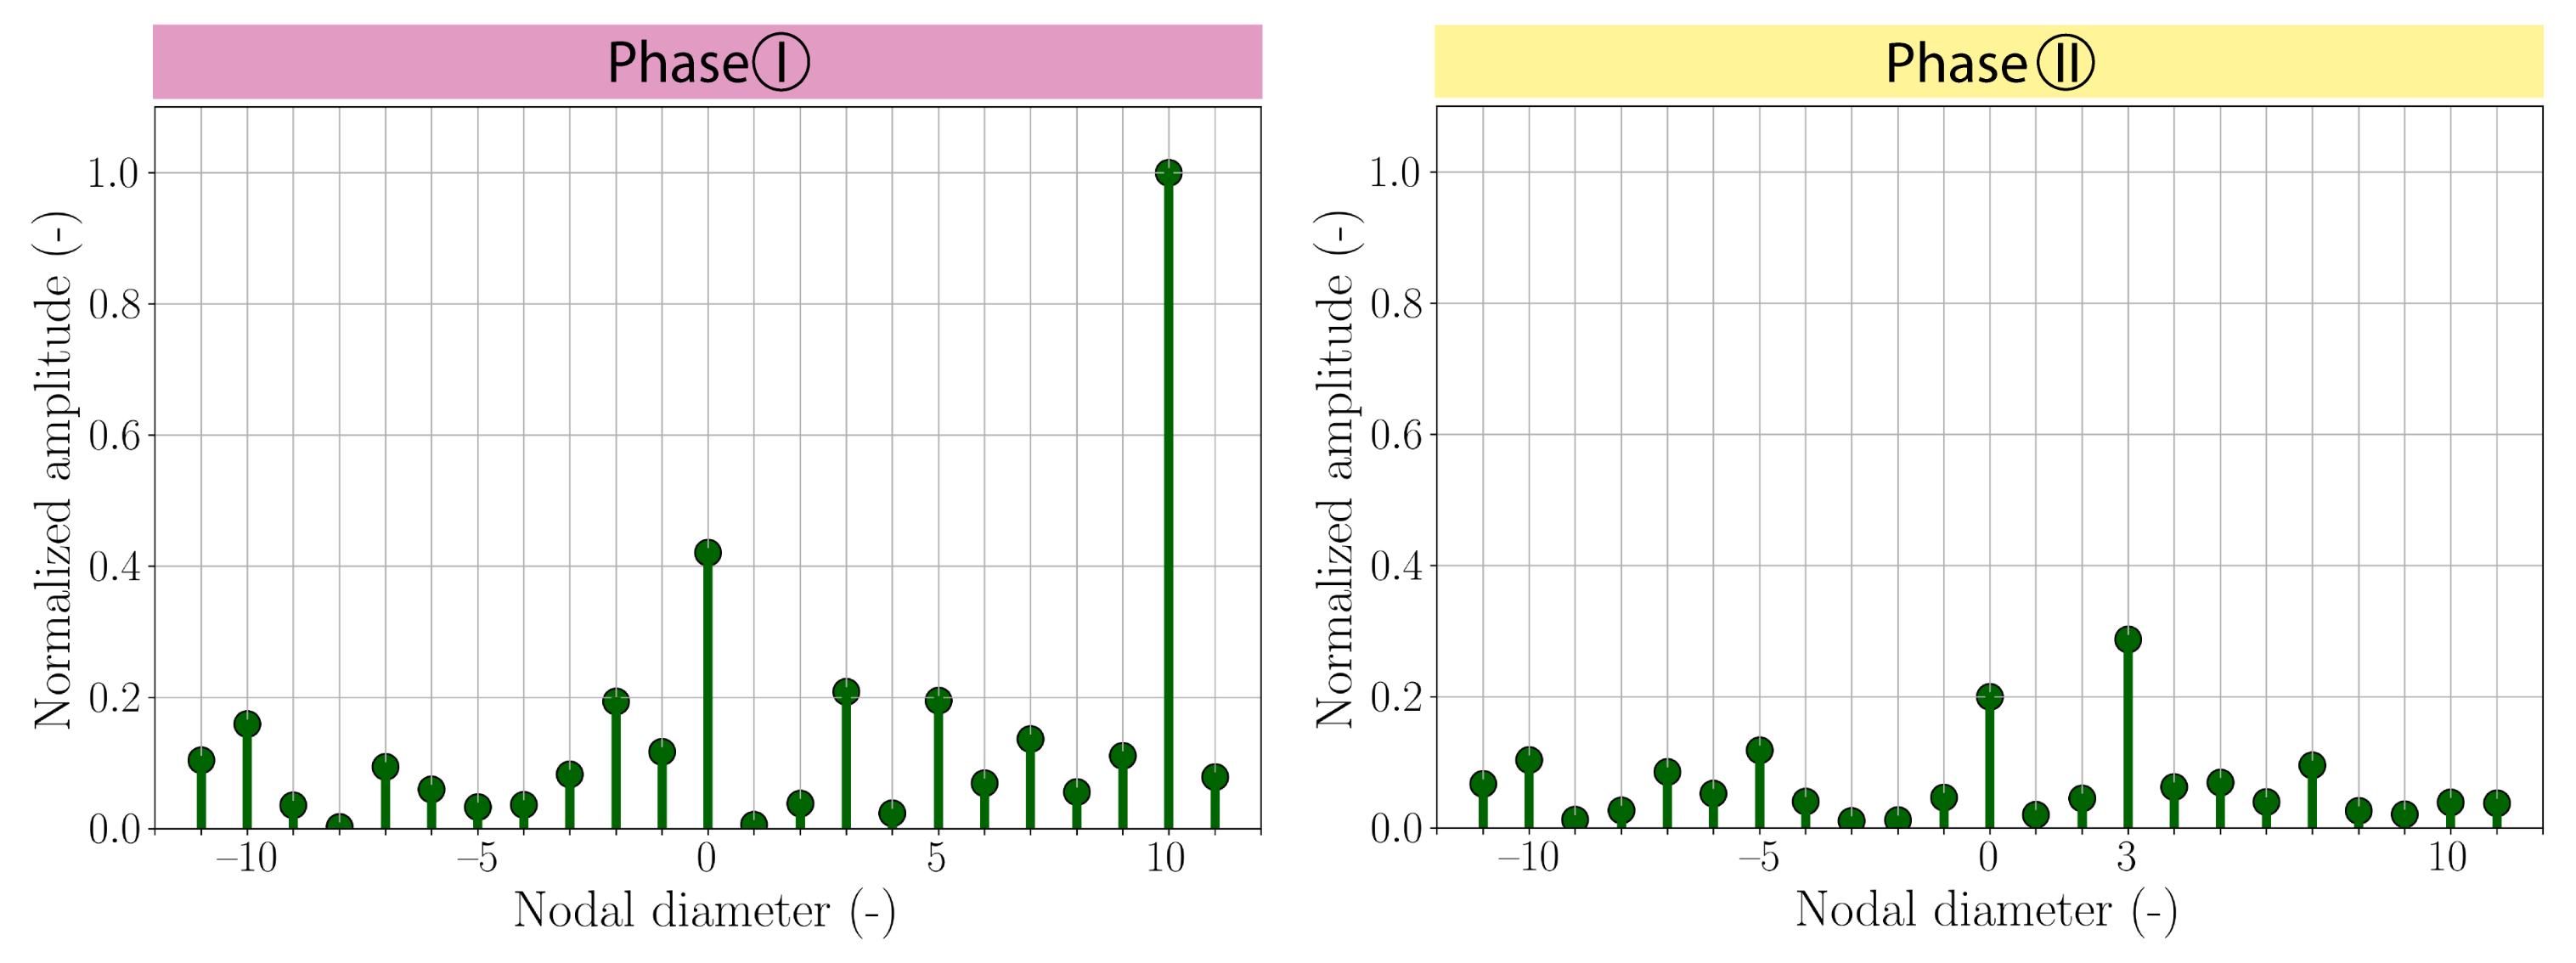
- At highly-loaded conditions OP2, the modes in the experiment and simulations are clustered in the wave-number and frequency ( and );
- Coincidence of the second harmonic at of an acoustic mode at with the structural blade-eigenfrequency leads to significant non-synchronous forced response in the experiment during Phase I. As soon as the mode switches to in Phase II, the vibration amplitude drops as the excitation at is far off resonance.
6. Conclusions
Author Contributions
Funding
Data Availability Statement
Acknowledgments
Conflicts of Interest
Abbreviations
| IGV | Inlet Guide Vane |
| MC | Magnet-coil |
| NSV | Non-Synchronous Vibrations |
| ND | Nodal diameter |
| EO | Engine Order |
| c | Speed of sound [m·s] |
| Circumferential propagating speed [m·s] | |
| Shaft rotation frequency [Hz] | |
| Pressure fluctuations [Pa] | |
| Axial Mach number | |
| Relative Mach number | |
| Circumferential wave number | |
| Number of blades | |
| Rotational speed [rad·s] | |
| r | Radius [m] |
| Absolute tangential velocity [m·s] | |
| Fourier coefficient | |
| Stationary frame of reference | |
| Rotating frame of reference |
References
- Baumgartner, M.; Kameier, F.; Hourmouziadis, J. Non-Engine Order Blade Vibration in a High Pressure Compressor. In Proceedings of the Twelfth International Symposium on Airbreathing Engines, Melbourne, Australia, 10–15 September 1995. [Google Scholar]
- Jüngst, M.; Holzinger, F.; Leichtfuss, S.; Schiffer, H.-P. Analysing non-synchronous blade vibrations in a transonic compressor rotor. In Proceedings of the 11th European Conference on Turbomachinery, Madrid, Spain, 23–27 March 2015. [Google Scholar]
- Kielb, R.E.; Barter, J.W.; Thomas, J.P.; Hall, K.C. Blade Excitation by Aerodynamic Instabilities: A Compressor Blade Study. In Turbo Expo: Power for Land, Sea, and Air; American Society of Mechanical Engineers: Atlanta, GA, USA, 2003. [Google Scholar]
- Möller, D.; Jüngst, M.; Holzinger, F.; Brandstetter, C.; Schiffer, H.-P.; Leichtfuss, S. Mechanism of Nonsynchronous Blade Vibration in a Transonic Compressor Rig. J. Turbomach. 2017, 139, 011002. [Google Scholar] [CrossRef]
- Stapelfeldt, S.; Brandstetter, C. Non-synchronous vibration in axial compressors: Lock-in mechanism and semi-analytical model. J. Sound Vib. 2020, 488, 115649. [Google Scholar] [CrossRef]
- Brandstetter, C.; Paoletti, B.; Ottavy, X. Acoustic and Convective Mechanisms Contributing to Non-Synchronous-Vibrations in a Multistage Compressor. In Turbo Expo: Power for Land, Sea, and Air; American Society of Mechanical Engineers: Phoenix, AZ, USA, 2019. [Google Scholar]
- Marshall, J.G.; Imregun, M. A review of aeroelasticity methods with emphasis on turbomachinery applications. J. Fluids Struct. 1996, 10, 237–267. [Google Scholar] [CrossRef]
- Brandstetter, C.; Jüngst, M.; Schiffer, H.-P. Measurements of Radial Vortices, Spill Forward, and Vortex Breakdown in a Transonic Compressor. J. Turbomach. 2018, 140, 061004. [Google Scholar] [CrossRef]
- Cooper, A.J.; Peake, N. Trapped acoustic modes in aeroengine intakes with swirling flow. J. Turbomach. 2000, 419, 151–175. [Google Scholar] [CrossRef]
- Hellmich, B.; Seume, J. Causes of Acoustic Resonance in a High-Speed Axial Compressor. In Turbo Expo: Power for Land, Sea, and Air; American Society of Mechanical Engineers: Barcelona, Spain, 2006. [Google Scholar]
- Holzinger, F.; Wartzek, F.; Schiffer, H.-P.; Leichtfuss, S.; Nestle, M. Self-Excited Blade Vibration Experimentally Investigated in Transonic Compressors: Acoustic Resonance. J. Turbomach. 2015, 138, 041001. [Google Scholar] [CrossRef]
- Parker, R. Acoustic resonances and blade vibration in axial flow compressors. J. Sound Vib. 1984, 92, 529–539. [Google Scholar] [CrossRef]
- Tyler, J.M.; Sofrin, T.G. Axial Flow Compressor Noise Studies; SAE Technical Paper; University of Leeds: Leeds, UK, 1962; Volume 620532. [Google Scholar]
- Fiquet, A.-L.; Brandstetter, C.; Aubert, S.; Philit, M. Non-Engine Order oscillations in an axial multi-stage compressor—Aeroacoustic interaction. In Proceedings of the 15th International Symposium on Unsteady Aerodynamics, Aeroacoustics and Aeroelasticity of Turbomachines, Oxford, UK, 24–27 September 2018. [Google Scholar]
- Fiquet, A.-L.; Brandstetter, C.; Aubert, S.; Philit, M. Non-Synchronous Aeroacoustic Interaction in an Axial Multi-Stage Compressor. J. Turbomach. 2019, 141, 101013. [Google Scholar] [CrossRef]
- Fiquet, A.-L.; Buffaz, N.; Vercoutter, A.; Aubert, S.; Brandstetter, C. Acoustic resonance in an axial multistage compressor leading to non-synchronous blade vibration. In Proceedings of the 14th European Conference on Turbomachinery Fluid dynamics and Thermodynamics, Gdansk, Poland, 12–16 April 2021. [Google Scholar]
- Fiquet, A.-L.; Buffaz, N.; Vercoutter, A.; Aubert, S.; Brandstetter, C. Non-synchronous forced response due to trapped acoustic modes in an axial multi-stage compressor. In Proceedings of the ASME Turbo Expo 2020, London, UK, 22–26 September 2020. [Google Scholar]
- Brandstetter, C.; Paoletti, B.; Ottavy, X. Compressible Modal Instability Onset in an Aerodynamically Mistuned Transonic Fan. J. Turbomach. 2019, 141, 031004. [Google Scholar] [CrossRef]
- Fiquet, A.-L. Analyse et Modélisation de Phénomènes Aéroélastiques Non-Synchrones dans un Compresseur Axial Multi-étages. Ph.D. Thesis, École Centrale de Lyon, Lyon, France, 2021. [Google Scholar]
- Garnier, J.; Vercoutter, A.; Talon, A. Magnet-Coil measurement technology for analyzing turbomachine blade vibrations. In Proceedings of the Surveillance-8, Roanne, France, 20–21 October 2015. [Google Scholar]
- Bouchain, A.; Picheral, J.; Lahalle, E.; Vercoutter, A.; Burgardt, B.; Talon, A. New Possibilities for Analyzing Complex Asynchronous Blade Vibrations From Tip-Timing Data Using a Sparse Spectral Analysis Method. In Turbo Expo: Power for Land, Sea, and Air; American Society of Mechanical Engineers: Phoenix, AZ, USA, 2019. [Google Scholar]
- Cambier, L.; Heib, S.; Plot, S. The Onera elsA CFD software: Input from research and feedback from industry. Mech. Ind. 2013, 14, 159–174. [Google Scholar] [CrossRef] [Green Version]
- Camp, T.R. A Study of Acoustic Resonance in a Low-Speed Multistage Compressor. J. Turbomach. 1999, 121, 36–43. [Google Scholar] [CrossRef]


| Observed Mode | Structural Mode 1st Blade Eigenm. Rotor-2 | Acoustic Mode 2nd Harmonic Leading Edge Stator-2 |
|---|---|---|
| 12.7 | 12.7 | |
| 2.7 | 2.7 | |
| Operating Point | OP1 | OP2 |
|---|---|---|
| −3 | +6 | |
| 2.3 | 6.7 | |
| 5.3 | 0.7 | |
| 1.1 | ||
| 0.1 | ||
| 1.02 |
Publisher’s Note: MDPI stays neutral with regard to jurisdictional claims in published maps and institutional affiliations. |
© 2022 by the authors. Licensee MDPI, Basel, Switzerland. This article is an open access article distributed under the terms and conditions of the Creative Commons Attribution (CC BY-NC-ND) license (https://creativecommons.org/licenses/by-nc-nd/4.0/).
Share and Cite
Fiquet, A.-L.; Aubert, S.; Buffaz, N.; Vercoutter, A.; Brandstetter, C. Trapped Acoustic Modes in an Axial Multi-Stage Compressor Leading to Non-Synchronous Blade Vibrations. Int. J. Turbomach. Propuls. Power 2022, 7, 6. https://0-doi-org.brum.beds.ac.uk/10.3390/ijtpp7010006
Fiquet A-L, Aubert S, Buffaz N, Vercoutter A, Brandstetter C. Trapped Acoustic Modes in an Axial Multi-Stage Compressor Leading to Non-Synchronous Blade Vibrations. International Journal of Turbomachinery, Propulsion and Power. 2022; 7(1):6. https://0-doi-org.brum.beds.ac.uk/10.3390/ijtpp7010006
Chicago/Turabian StyleFiquet, Anne-Lise, Stéphane Aubert, Nicolas Buffaz, Agathe Vercoutter, and Christoph Brandstetter. 2022. "Trapped Acoustic Modes in an Axial Multi-Stage Compressor Leading to Non-Synchronous Blade Vibrations" International Journal of Turbomachinery, Propulsion and Power 7, no. 1: 6. https://0-doi-org.brum.beds.ac.uk/10.3390/ijtpp7010006