A Review of Local Outlier Factor Algorithms for Outlier Detection in Big Data Streams


1
Department of Computer Science, University of Idaho, Moscow, ID 83844, USA
2
College of Computer Science and Engineering, University of Jeddah, Jeddah 23890, Saudi Arabia
3
Faculty of Computing and Information Technology, King Abdulaziz University, Jeddah 21589, Saudi Arabia
*
Authors to whom correspondence should be addressed.
Big Data Cogn. Comput. 2021, 5(1), 1; https://0-doi-org.brum.beds.ac.uk/10.3390/bdcc5010001
Submission received: 5 November 2020
/
Revised: 21 December 2020
/
Accepted: 23 December 2020
/
Published: 29 December 2020
Abstract
:Outlier detection is a statistical procedure that aims to find suspicious events or items that are different from the normal form of a dataset. It has drawn considerable interest in the field of data mining and machine learning. Outlier detection is important in many applications, including fraud detection in credit card transactions and network intrusion detection. There are two general types of outlier detection: global and local. Global outliers fall outside the normal range for an entire dataset, whereas local outliers may fall within the normal range for the entire dataset, but outside the normal range for the surrounding data points. This paper addresses local outlier detection. The best-known technique for local outlier detection is the Local Outlier Factor (LOF), a density-based technique. There are many LOF algorithms for a static data environment; however, these algorithms cannot be applied directly to data streams, which are an important type of big data. In general, local outlier detection algorithms for data streams are still deficient and better algorithms need to be developed that can effectively analyze the high velocity of data streams to detect local outliers. This paper presents a literature review of local outlier detection algorithms in static and stream environments, with an emphasis on LOF algorithms. It collects and categorizes existing local outlier detection algorithms and analyzes their characteristics. Furthermore, the paper discusses the advantages and limitations of those algorithms and proposes several promising directions for developing improved local outlier detection methods for data streams.
1. Introduction
Outlier detection is the term used for anomaly detection, fraud detection, and novelty detection. The purpose of outlier detection is to detect rare events or unusual activities that differ from the majority of data points in a dataset [1]. Recently, outlier detection has become an important problem in many applications such as in health care, fraud transaction detection for credit cards, and intrusion detection in computer networks. Therefore, many algorithms have been proposed and developed to detect outliers. However, most of these algorithms are designed for a static data environment and are difficult to apply to streams of data, which represent a significant number of important application areas.
Outlier detection can be viewed as a specific application of generalized data mining. The process of data mining involves two steps: data processing and data mining. The aim of data processing is to create data in good form, i.e., the outliers are removed. Data mining is the next step, which involves the discovery and understanding of the behavior of the data and extracting this information by machine learning [2]. Outlier detection (or data cleaning) is an important step in data processing because, if an outlier data point is used during data mining, it is likely to lead to inaccurate outputs [3]. For example, a traffic pattern of outliers in the network might mean the data has been sent out by a hacked computer to an unauthorized device [4]; if the outliers cannot be detected and removed, a machine learning technique applied to the data is likely to be misled. Additionally, in many cases, the goal of data mining is to find the outliers. For example, an outlier image in magnetic resonance imaging could mean the presence of malignant tumors [5]. An outlier reading from an aircraft sensor may indicate a fault in some components of the aircraft [6].
Outlier detection (also known as anomaly detection) is split into two types, global and local detection. For a global outlier, outlier detection considers all data points, and the data point pt is considered an outlier if it is far away from all other data points [7]. The local outlier detection covers a small subset of data points at a time (Figure 1). A local outlier is based on the probability of data point pt being an outlier as compared to its local neighborhood, which is measured by the k-Nearest Neighbors (kNN) algorithm [8].
Recently, many studies have been published in the area of outlier detection, and there is a need for these studies to be reviewed to understand the depth of the field and the most promising areas for additional research. This review is focused on local outlier detection algorithms in data stream environments. This review is distinguished from previous reviews as it specifically covers the Local Outlier Factor (LOF) algorithms in data stream environments and reviews the most recent, state-of-the-art techniques. In this paper, different methods and algorithms for local outlier detection are summarized. The limitations and challenges of the LOF and other local outlier detection algorithms in a stream environment are analyzed. Moreover, new methods for the detection of an LOF score in a data stream are proposed. This literature review will greatly benefit researchers in the field of local outlier detection because it provides a comprehensive explanation of the features of each algorithm and shows their strengths and weaknesses, particularly in a data stream environment. The paper has five remaining parts: the second section is Related Works and Background; the third section is Literature Review Methodology; the fourth section is Literature Review Results; the fifth section is Analysis and Discussion; and the sixth section is the Conclusion.
2. Related Works and Background
Many methods and algorithms have been developed to detect outliers in datasets. Most of these methods and algorithms have been developed for specific applications and domains. Outlier detection has been the focus of many review and survey papers, as well as several books. Patcha et al. and Snyder [9,10] published a survey of outlier detection techniques for intrusion detection. Markou and Singh [11,12] provided a review of outlier detection methods that use statistical approaches and neural networks. A comprehensive survey of outlier detection algorithms developed in statistical domains and by machine learning was provided by Hodge et al. [13]. Goldstein et al. [14] provided a comparative evaluation of several unsupervised outlier detection algorithms. Wang et al. [15] provided the progress of outlier detection algorithms up until 2019 and illustrated the different methods of outlier detection. Tellis et al. [16] presented a survey that aimed to describe the various techniques for outlier detection in data streams. The objective of their paper was to identify the various techniques that can be used in the detection of an anomaly in applications involving data streams, such as criminal behaviors, fraud detection for credit cards, finding computer intrusions, and calling cards. Park et al. [17] presented a comprehensive review of concept drift detection, outlier detection, and anomaly pattern detection for data streams. The main contribution of their paper was that the approach used varied, based on the size of the streams of data. Other review and survey papers of outlier detection for different applications and domains are provided in [18,19,20,21,22,23].
2.1. Statistical Outlier Detection
Outlier detection is a statistical process that aims to discover the data points that are inconsistent with the dataset [24]. In general, outliers and inliers are determined based on the model of data distribution. Statistical outlier detection techniques can be categorized as supervised, semi-supervised, and unsupervised modes. The scientific research on statistical outlier detection provides two approaches to handle outliers in a dataset. First, the outliers must be identified for further study. Second, the data model should be designed to accurately handle the outlier data points [25]. Statistical-based methods for outlier detection are further categorized into two methods: parametric and non-parametric [26].
2.1.1. Parametric Method
Parametric-based methods assume an underlying distribution model (e.g., Gaussian distribution) for describing normal data and fit the assumed model to the data by estimating the model parameters. Such models are based on the Gaussian model or non-Gaussian data models.
One of the most common statistical methods for outlier detection is the Gaussian model. In the training process, the Gaussian model uses Maximum Likelihood Estimates (MLE) to estimate the variance and mean of the Gaussian distribution of the data [27]. Discordancy tests are then implemented to detect outliers. The unsupervised method for outlier detection with a globally optimal exemplar-based Gaussian Mixture Model (GMM) was introduced in [28]. For a more accurate outlier detection approach, the GMM with Locality Preserving Projections (LPP) was developed in [29] and involves the use of GMM combined with subspace learning.
Another statistical method of outlier detection is to use a regression model. When implementing this technique, the first step is to build a regression model that is suitable for the data. For the test step, the regression model is tested by evaluating each data point as it relates to the model. A data instance is labeled an anomaly when a deviation occurs between the real value and the expected value generated by the regression model [30]. To detect an outlier in linear regression, Satman [31] proposed an algorithm based on a non-interacting covariance matrix and concentricity steps implemented using the least square estimation. Another method of regression-based outlier detection was proposed by Park et al. [32]. This method was created to detect outliers based on sensor measurement. In this method, the weighted summation approach is used to construct a synthesized independent variable from the observed values [15].
2.1.2. Non-Parametric Method
A non-parametric method must be used when the data is not normally distributed and there is no prior knowledge about the data distribution. It is also called the distribution-free method because the data does not have a specific (known) distribution. To identify whether a data point is an inlier or outlier, some criteria must be implemented for the dataset. The most common approaches are histograms and kernel density.
The main concept in histogram-based approaches is that for every dataset characteristic a histogram is created. It is similar to the Naïve Bayes algorithm, where all independent characteristic probabilities are multiplied. Typically, it measures the distance between a histogram-based model of normality and a new test data point to determine if it is an inlier or outlier [21].
Kernel Density Estimation (KDE) is another popular non-parametric statistical approach for outlier detection [33]. Latecki et al. [34] proposed an unsupervised approach for detecting outliers using kernel features. Their process of outlier detection is executed by comparing every local density data point to the local density neighbor. A better method was proposed by Gao et al. [35]; their method improved the performance and showed better scalability in wide datasets using kernel-based methods. KDE was successfully used by [36] to estimate the distribution of sensor data points to detect malignant nodes [15].
3. Literature Review Methodology
The aim of this literature review is to report on current works using the LOF with a focus on local outlier detection in data streams. It also proposes a new methodology for a more efficient LOF in data streams. This paper focuses on the research that was conducted from May 2000 to April 2020. The search took place through research papers in electronic databases published in English. These databases were Google Scholar, IEEE Xplore, ACM, Springer, Science Direct, and MDPI. Keywords including outlier detection, local outlier detection, local outlier detection in data streams, Local Outlier Factor in data streams, and data stream mining were used. In the initial search, a total of 528 papers were reviewed by title and abstract. The selected papers were then categorized into two sections: the static environment and the stream environment. After that, the selected papers were filtered by the full text. The total number of selected papers was 47 (Figure 2). In the static environment subsection, the local outlier detection papers with the most citations were selected to be reviewed in greater detail, while the remaining papers were reviewed more briefly. In the stream environment subsection, the recent state-of-the-art papers on the LOF in data streams were reviewed in detail, while the remaining papers were reviewed briefly.
The criteria for inclusion in this literature review were the following: (1) the article contained a new density—based local outlier detection algorithm in a static environment, (2) the local outlier detection algorithm was an unsupervised algorithm, (3) the article contained a new LOF algorithm for a stream environment, or (4) it included a local outlier detection algorithm in a stream environment. The research questions that have been answered in this literature review are the following: (1) what are the LOF algorithm problems and challenges in stream environments, (2) what are the existing methods and techniques that have been applied to the LOF in a stream environment, (3) what are the existing local outlier detection algorithms that need to be developed in order to work in a stream environment, and (4) how does the new methodology execute the LOF efficiently in a stream environment?
4. Literature Review Results
Outlier detection in datasets has been studied since the nineteenth century [37]. A huge amount of research on detecting outliers has been conducted [1,38,39,40,41,42,43,44]. As mentioned above, there are two forms of outlier detection: global and local. The LOF is a well-known algorithm for detecting local outliers. This work reviews local outlier detection algorithms for numerical data for both static and stream environments. Generally, outlier detection algorithms work in the following three modes:
Supervised Outlier Detection: Supervised algorithms assume the data includes fully labeled training and test datasets. A substantial approach in this situation is to develop a predictive model for non-normal and normal classes of data. Every hidden data point is compared with the model to decide in which class the data point belongs. The main issue of supervised outlier detection is that the outlier data points are much fewer than normal data points in training datasets. This issue appears to be due to the imbalance of class distribution. However, this issue has already been addressed in machine-learning and data-mining literature [45,46,47,48]. For instance, decision trees, such as C4.5 [49], cannot perform well with imbalanced data, while Artificial Neural Networks [50] perform better.
Semi-supervised Outlier Detection: Semi-supervised algorithms assume the data includes labeled training data for the normal class only. Since labels are not required for the outlier class in semi-supervised algorithms, they have wider applications than supervised algorithms. The main idea of semi-supervised algorithms is that a normal class model is learned, and then, the outliers are detected by deviating from the model. This is also called a one-class classification [51]. The one-class Support Vector Machine [52] is a popular algorithm used in the semi-supervised technique.
Unsupervised Outlier Detection: Unsupervised algorithms do not require labels in the data and there is no discrimination between training and testing datasets. Therefore, it is a more flexible mode than the others. The major idea of unsupervised outlier detection algorithms is to score the data points based on the essential characteristics of the dataset only. Generally, density or distance is used to provide an assessment about whether a data point is an inlier (normal) or outlier. This review is focused on unsupervised outlier detection.
4.1. Static Environment
Outlier detection in static environments has received a lot of attention in the areas of data mining and machine learning. Many algorithms have been designed for the unsupervised outlier detection of global and local outliers. The LOF is the foundation for local outlier detection. Many researchers have, however, addressed local outlier detection from different perspectives. This section reviews the local outlier detection algorithms in general and goes deeper into the most popular algorithms. Table 1 Summarizes the most-cited local outlier algorithms in a static environment. Figure 3 shows all of the reviewed papers included in this section.
4.1.1. Local Outlier Factor (LOF)
The LOF algorithm is defined in [53] by using density-based methods. For each data point, the process of finding the LOF includes calculating the degree of outlying. The idea of a local outlier is introduced by the LOF. The key definitions for the LOF [53] are:
Definition 1.
k-distance of a data point p.
The distance between the two data points p and o can be calculated by using a Euclidean n-dimensional space (Equation (1)).
Let the dataset be a D and a positive integer is k. For a data point p, the k-distance p is the distance d(p,o) between p and the farthest neighbor data point (record) o (o ∈ D) in the following conditions:
- (1)
- At the least, k data points (records) o’ ∈ D \ {p} maintains that d(p,o’) ≤ d(p,o);
- (2)
- At the most, k − 1 data points (records) o’ ∈ D \ {p} maintains that d(p,o’) < d(p,o).
Definition 2.
k-nearest neighbors of p.
Here, the meaning of k-Nearest Neighbors (kNN) of p is any data point q whose distance to the p data point is not greater than the k-distance(p). Those k-Nearest Neighbors of q form the so-called k-distance neighborhood of p, as described in Equation (2).
Definition 3.
Reachability distance of p with respect to o.
Let k be a positive integer. The reachability distance of a data point p with regard to the data point o is defined in Equation (3).
Figure 4 shows an example of the reachability distance when the k value is 5. If the actual distance between a data point p4 and data point o is shorter than the k-distance (o), then the reachability distance of data point p4 will be the k-distance (o). On the other hand, if the actual distance between a data point p6 and data point o is greater than the k-distance (o), then the reachability distance of p6 is the actual distance. Such a smoothing operation is used to reduce the statistical fluctuations of d(p,o) for each data point close to o. The smoothing strength is controlled by k.
Definition 4.
Local reachability density of p.
In density-based clustering algorithms, two parameters are used for defining the notion of density: (1) MinPts for a minimum number of data points and (2) a volume. The authors of [53] used reach-distMinPts(p,o) for o ∈ NMinPts(p) as a volume measurement. Thus, the local reachability density (Lrd) of data point p is defined in Equation (4).
In Equation (4), the average reachability distance based on the MinPts number of nearest neighbors of data point p is first calculated. Its inversion then generates the local reachability density (Lrd) of data point p.
Definition 5.
LOF of p.
With all the above-mentioned work, the LOF score of a data point p can be calculated through Equation (5).
Equation (5) calculates the average ratio of the local reachability density of data point p and the MinPts-nearest neighbors of data point p. Finally, an LOF score is assigned to each data point. To determine whether data point p is an outlier or not, the threshold score θ is used. The strength of the LOF is that it can identify the local density and determine local outliers. The weaknesses are that it requires a long execution time and is sensitive to the minimum points value.
4.1.2. Connectivity-Based Outlier Factor (COF)
The COF algorithm [54] works like the LOF algorithm, except that the density estimation of the COF for the data points works differently. For the LOF, the kNN is determined by using the Euclidean distance, while the COF uses a different approach to determine the kNN, called the chaining distance. In particular, the LOF assumes the data points are distributed in a spherical form, but the COF assumes the data points have a linear distribution. In mathematics, the chaining distances are the minimum of the total sum of the distances linking all neighbors. The advantage of the COF is that in datasets that have linear correlation, the COF performs with greater accuracy than the LOF. The COF builds a set path to determine the outlier. The COF weakness is that it requires a longer execution time than the LOF.
4.1.3. Local Correlation Integral (LOCI)
In the above-mentioned algorithms, selecting the k value is an important decision for the performance of an algorithm. However, the Local Correlation Integral (LOCI) uses the maximization approach to address the issue of choosing the k value [55]. The main idea is to use all possible k values for each data point and then take the top score. To implement this, the r-neighbor is defined, which uses the radius r. The radius r expands over time. Here, the estimation of local density is obtained by using a half-Gaussian distribution, similar to the LoOP, but the LOCI uses the quantity of data points in neighbors instead of using distances. Additionally, the estimation of local density in the LOCI is obtained by comparing two different sets of neighbors instead of the ratio of local densities. The parameter α controls the ratio of different neighbors. A disadvantage of the LOCI algorithm is that it requires a lot of time for large datasets because the radius r has to be expanded from one data point to the next. However, the strength of LOCI is that it can locate the maximum value for all radii.
4.1.4. Approximate Local Correlation Integral (aLOCI)
To address the issue of run time in the LOCI, the Approximate Local Correlation Integral (aLOCI) was proposed [55]. To speed up the counting of two neighbors, the aLOCI uses quad trees and places some constraints on α. The count estimation will be accurate in the aLOCI when the data point is located in the middle of a cell of its quad tree. By contrast, the approximation might be poor if the data point is located at the border of a quad tree. Because of this, multiple quad trees are built with the hope that the approximate tree is perfect for every data point. However, the depth of the tree must be specified. The strength of this method is that it can speed up the process by using quad trees; its weakness is that the tree depth has a significant effect on the performance of the algorithm.
4.1.5. Cluster-Based Local Outlier Factor (CBLOF)
The Cluster-Based Local Outlier Factor (CBLOF) works by using a cluster to determine the density area in the dataset [56]. It estimates the density for each cluster. First, k-means is used to cluster the dataset. Next, the CBLOF uses a heuristic procedure to split the resulting clusters into two categories: large and small. Finally, the calculation of the outlier score is accomplished by using the distance of each data point to the central data point of its cluster, multiplied by the data points that belong to its cluster. In a small cluster, the distance to the nearest large cluster is used. The advantage of CBLOF is that it uses the cluster method instead of the nearest neighbor method. Its disadvantage is that it is sensitive to the k parameter in the k-means clustering.
4.1.6. Influenced Outlierness (INFLO)
The Influenced Outlierness (INFLO) algorithm [57] is applied when the data points include clusters with diverse densities that are near each other. The LOF algorithm fails to correctly score the data points within the boundaries of the clusters. The k-NN method is used in the INFLO algorithm. In addition, the set of reverse nearest neighbors, where data points are stored with existing data points, is considered a neighbor. To calculate the INFLO score, both neighbor sets need to be combined. After this, the local reachability density and the score are calculated as in the LOF algorithm. The INFLO operation is illustrated in Figure 5, where the red data point has five nearest neighbors, as can be seen in the blue circle. The red data point will be detected as an outlier because the local density value of its four nearest neighbors is much higher. In the INFLO, the (green) data points are taken into consideration when the red data point is their neighbor. The INFLO algorithm calculates the score of outliers more accurately when the dataset contains multiple clusters of diverse densities that are near to each other. It can also detect outliers in different neighbor density distributions. The disadvantages are that it requires a long time to run, and it is only focused on local outliers.
4.1.7. Local Outlier Probability (LoOP)
Similar to the LOF, the Local Outlier Probability (LoOP) uses the set of nearest neighbors to estimate the local density [58]. However, the LoOP calculates the local density differently. While the LOF detects the outlier data points using the score of an outlier, the LoOP detects them by using the probability of an outlier. The main idea is that the distance of a data point to its nearest neighbors follows the Gaussian distribution. Because the distances have positive values, the LoOP presumes a “half-Gaussian” distribution and uses its probabilistic set distance, which is considered the local density. The proportions of each data point are compared to the proportions of its nearest neighbors, which result in the local outlier detection score. Finally, the normalization and a Gaussian error function are implemented to convert the score to a probability. The advantage of LoOP is that it depends on the probability score. The disadvantages of LoOP are that it requires more time to execute and the probabilistic size of the data points may cause incorrect measurements.
4.1.8. Local Density Cluster-Based Outlier Factor (LDCOF)
In the CBLOF algorithm, only the quantity of cluster members is used, and the density of the cluster is not considered. The Local Density Cluster-based Outlier Factor (LDCOF) resolves this issue by taking into consideration an estimation of the cluster densities, where the spherical distribution is assumed for the cluster members [59]. First, the LDCOF applies k-means to cluster the dataset, and then it uses the CBLOF process of dividing the clusters into large and small clusters. Next, the LDCOF calculates the average distance of the data points to the centroid for all clusters. The last step is to calculate the LDCOF value by dividing the distance of each data point to its centroid by the average distance of each point. A strength of the LDCOF is that it estimates cluster densities and presumes a spherical distribution. Its weakness is that it is sensitive to the k parameter.
4.1.9. Other Local Outlier Algorithms
Chiu et al. [60] introduced three enhancement schemes, called the LOF’, the LOF’’, and the GridLOF. The LOF’ provides a more intuitive meaning for local outlierness. The advantage of this method is that it introduces another version of the LOF for the minimum number of points, and it can also process large datasets by eliminating rd and lrd. Its disadvantage is that the minimum points value could be inaccurate depending on the computational results. The LOF’’ handles cases that the LOF cannot properly handle by introducing a new calculation method to determine neighbors. The GridLOF improves the efficacy of outlier detection by pruning the inliers. The weaknesses of this method are that it requires a long run time due to its complexity and it is difficult to select its parameters.
Jiang et al. [61] created a novel approach to determine the outlierness score, which is called the generalized local outlier factor (GLOF). They also proposed the rule of (k σ) that does not require a threshold or previous knowledge about the number of outliers in a dataset. The strength of this method is that it does not need thresholds. The weakness of this method is that it depends on the k value. Ren et al. [62] proposed an algorithm, called the Relative Density Factor (RDF), which detects an outlier using p-trees. A data point pt that has a high RDF score is an outlier. The advantage of this method is that it has better scalability when data size is increased; however, it requires more computational time.
Lozano et al. [63] introduced two parallel algorithms: the first algorithm detects a distance-based outlier, which depends on nested loops, randomization, and a pruning rule; the second algorithm is the parallel LOF algorithm, which detects density-based local outliers. The advantage of these algorithms is the fast execution time. Fan et al. [64] proposed an algorithm called Resolution-based Outlier Factor (ROF). This algorithm solves some impediments, such as poor accuracy. The strength of ROF is that it has a better outlierness score because it uses a growing window. The weaknesses of this method are that ROF cannot rank the outliers properly, cannot deal with different density clusters, and it requires more storage. Momtaz et al. [65] improved the ROF algorithm [64] by developing a new algorithm that detects the top-n outliers by assigning a score for each data point; it is called the Dynamic-Window Outlier Factor (DWOF). The DWOF improves the ROF by taking into consideration the varying-density clusters. This improves the ranking of the outliers even when presenting the same outliers. Its strength is that it identifies a new measurement using top-n, which improves outlier detection, while its weakness is that it is sensitive to the parameter choices.
A new density-based local outlier concept based on uncertain data (UDLO) was proposed in [66]. To detect the outlier faster, they built an algorithm that calculates the density of a data point rather than calculating all k-neighbors in order to detect the outliers, as in the LOF. The strength of this algorithm is it does not need to calculate all the k-neighbors, but it focuses on Euclidean distance only. The Clustering-based Multivariate Gaussian Outlier Score algorithm (CMGOS) algorithm was proposed by Goldstein [67]. The estimation of local density for CMGOS [14] is achieved using the estimate of the multivariate Gaussian model, where the Mahalanobis distance is used as a basis for the calculation of the outlier score. As a first step, the CMGOS applies the k-means to cluster the dataset and divides them into large and small clusters. Then the covariance matrix is calculated for each cluster. Next, the CMGOS value is calculated by dividing the Mahalanobis distance for each data point to its closest cluster centroid through the distribution of a chi-square together with a certain confidence interval. A strength of this algorithm is that it uses the multivariate Gaussian model and the Mahalanobis distance to find the outlier score. The weaknesses of this algorithm are that it requires more k values and it is not suitable for large datasets.
Tang et al. [68] proposed a method for detecting outliers using local kernel density estimation (KDE). They introduced the Relative Density-based Outlier Score (RDOS) to calculate the local outlier score of data points, where the estimation of the density distribution in the position of a data point, using a local KDE, depends on the extended nearest neighbors of the data point. KDE has the advantage of being able to estimate the density around a data point, and RDOS can find the local outlierness of a data point in the local KDE. Vázquez et al. [69] proposed a novel algorithm, called Sparse Data Observers (SDO), to locate outliers based on a model for low-density data. The strength of SDO is that it reduces the complexity of the quadratic formula used as well as the computational time. Ning et al. [70] developed a method, called relative density-based outlier detection, which uses a new technique to calculate the density of a data point’s neighbors. The strength of this method is that it can handle the problems caused by low-density patterns. Su et al. [71] introduced an effective density-based scheme that depends on the local outlier detection approach. It is used for scattered data and is named E2DLOS. Instead of the LOF, they used the Local Deviation Coefficient (LDC) for their measurements. The advantage of this algorithm is that it improves computational efficiency.
Zhao et al. [72] developed a framework, the Locally Selective Combination in Parallel Outlier Ensembles (LSCP) that works by determining a local region (area) around a test data point based on its compatibility with its nearest neighbors in randomly selected feature subspaces. LSCP selects and combines the best performing detectors in that local area. The strength of this algorithm is that it can quantify the degree of the local outliers. A new methodology of tuning the hyper-parameters for the LOF algorithm was proposed in [73]. The strength of this method is that it can handle small and large datasets; its weakness is that the algorithm has to well-sample the training data. Yang et al. [74] developed a new local outlier detection algorithm called the Neighbor Entropy Local Outlier Factor (NELOF) that improves the Self-Organizing Feature Map (SOFM) and uses it to cluster the dataset.
4.2. Stream Environment
Despite the contributions of the above research to local outlier detection, their focus has been on static environments rather than on steam environments, in which the data comes as a stream of points rather than a single, static dataset. The environments with streamed data have been much less studied. Thus, there has been growing interest in developing traditional local outlier detection algorithms to work in stream environments. This section reviews the research on local outlier detection algorithms in stream environments and focuses on the LOF-based approaches that contributed effectively to the calculation of the LOF score in these environments. Table 2 provides a summary of previous work on LOF in stream environments. Figure 6 shows all of the reviewed papers included in this section.
4.2.1. Incremental Local Outlier Factor (ILOF)
Although the LOF does not perform well in the stream environment, the Incremental Local Outlier Factor (ILOF) overcomes this weakness and is able to calculate the LOF score in a stream environment. The core principle of the ILOF method is to discover outliers in the local density in the stream environment [75]. ILOF is a density-based outlier detection technique. The major task of the ILOF is to update and re-calculate the score of the LOF when a new data point np is inserted.
ILOF uses the same components of the LOF for measuring the outlierness score: k-distance, k-nearest neighbors, reachability distance (Rd), and local reachability distance (Lrd). There are two parts to the method of insertion for the ILOF: (1) the Rd, the Lrd, and the LOF scores are computed according to the np; and (2) it updates the k-distance, the Rd, the Lrd, and the LOF score for the existing data points. A strength of the ILOF algorithm is that it can calculate LOF scores in streaming data. Despite the strengths of the ILOF algorithm for data streams, its main issue is memory consumption because it stores all of the previous data points. This takes up a large amount of memory and significantly increases the analysis time.
4.2.2. Memory Efficient Incremental Local Outlier Factor (MILOF)
The Memory Efficient Incremental Local Outlier Factor (MILOF) is an unsupervised outlier method for evaluating the local outliers in the data stream. The MILOF is able to reduce the time complexity and the memory requirements of ILOF, and it is suitable for a wide range of applications. The MILOF processes a data point in three phases: the summarization phase, the merging phase, and the revised insertion phase.
The summarization phase is initiated when the number of points reaches the memory limit. The first half of the data points are then summarized, whereas the most recent points are left intact to keep a higher resolution of the present streaming data points. The k-mean algorithm is used for clustering the first half of the data points to summarize them [76].
The merging phase takes place after the last half of data points is obtained from the summarization phase; a new cluster is created from the incoming data points. Afterward, the new cluster is combined with the existing cluster to produce a single set of clusters.
The advantage of the MILOF is that it is able to reduce the computational complexity and memory requirements. The major weakness of this method is that the k-means cannot maintain the density of data points.
4.2.3. Density Summarization Incremental Local Outlier Factor (DILOF)
The DILOF algorithm was proposed to address the limitation of the ILOF when processing a data stream [77]. The DILOF contains two steps: the detection step and the summarization step. The detection step is used to detect the outliers and update the data points in the window when new data points are inserted. The ILOF algorithm is used in this step to detect the outliers while a skipping scheme is used to detect the sequence of outliers, such as during DoS attacks. The summarization step is used to summarize the older half of the data points in the window based on non-parametric density summarization (NDS). A strength of the DILOF is that it performs better than the MILOF for the accuracy of outlier detection and execution time [77]. However, the NDS algorithm depends on a gradient-descent method, which may get stuck in the local minima.
4.2.4. Other Algorithms
Pokraiac et al. [78] proposed an incremental COF (connectivity-based outlier factor) whose detection performance in a data stream is equivalent to that of the integrated static connectivity-based outlier factor (COF) algorithm. The contribution of the paper is that it shows that the number of data profiles that updates for every deletion or insertion does not in any way rely on the number of points found in a given set of data. Ren et al. [79] discussed the issue of data stream attributes in memory usage. They presented a new approach, Heterogeneous Data Streams Outlier Detection (HDSOD), to overcome issues in processing data streams. The strength of this approach is that it is based on a heterogeneous data stream that uses the partition-cluster approach for the data stream segments, after which the segment is stored in a reference as a cluster. The outlier result is computed based on the number of cluster references and the degree of representation.
An improved version of the incremental LOF (ILOF) algorithm is introduced by [80], which uses a sliding window. The sliding window allows for updating data profiles, particularly during the window after which the profiles are declared an inlier/outlier. The strength of this paper is that it demonstrates that a false-positive rate could be reduced without incurring extra computational expense. For the Multiple Instance (MI) setting, Wang et al. [81] proposed an incremental MI algorithm, Inc. I-MLOF, for detecting outliers. The algorithm is capable of achieving outlier detection results that are similar to those of I-MLOF, an original LOF extension for MI. This paper demonstrates that simple incremental algorithms can be used to produce outlier detection results that are similar to those of more complex algorithms. The focus of [82] is on local outliers, and hence, an incremental solution was introduced with the assumption that finite memory is available. The advantage of the paper is that it shows that different outlier detection solutions are suitable for different application environments based on the available memory.
Kontaki et al. [83] presented an algorithm that is applied to the continuous monitoring of streams of data outliers. The basis for the algorithm is sliding windows. The strength of the algorithm is that memory requirements are reduced. The paper also contributed to the introduction of more flexible and efficient techniques for detecting anomalies in streams of data. Zhang et al. [84] presented a technique for detecting faults in streams of data that are highly dimensional and non-stationary. The technique presented is angle-based and can identify sub-space faults that are low-dimensional from high-dimensional dataset spaces. Hamlet et al. [85] proposed a new incremental algorithm that is a modification of the LoOP (Local Outlier Probabilities) algorithm, which is usually utilized for anomaly detection. The advantage of the Hamlet et al. algorithm is that it can detect outliers almost immediately. It reduces computational time meaning that low-resource machines can be used in incremental anomaly detection, even on large static sets of data. The disadvantage of this method is that it needs to be executed on the dataset before accepting incremental data points.
Siffer et al. [86] proposed a novel method for detecting outliers, particularly in the streaming of a univariate time series whose basis is the extreme value theory. An advantage of this method is that it does not make any distribution assumptions and it does not need a handset threshold. The objective of this paper was to develop a method where an anomaly can be detected in a more efficient manner. However, its weakness is the gap in terms of the multivariate case. Mu et al. [87] introduced an alternative technique as a solution to the problem of classifying new classes of data streams. The advantage of this work is that it demonstrates that it is possible to make use of random trees to find the solution to three key sub-problems: model updates, supervised learning, and unsupervised learning. The problem with this method is that it does not give true class labels. Ishimtsev et al. [88] considered a model-free anomaly detection technique that uses a univariate time-series and generates a probabilistic abnormality score. The advantage of this work is that it demonstrated that simple methods, such as the Lazy Drifting Conformal Detector (LDCD), can be used for performing anomaly detection and achieve results similar to those of more complex anomaly detection techniques. The disadvantage of this work is that the procedure of LDCD, required for the suitable validity warranty, needs further research for the Numenta Anomaly Benchmark (NAB) corpus.
A Neuromorphic Anomaly Detection (AnRAD) framework was introduced in [89] that can perform probabilistic inferences. The strength of the framework is that it improves memory efficiency and computing performance during anomaly detection. The paper also describes the improved speed of incremental learning and hence improved anomaly detection efficiency and accuracy. Yao et al. [90] introduced an incremental approach for detecting a local outlier aimed to evaluate the local outlier in a given stream of data in a dynamic manner. The strength of the work is that local outliers can be detected more accurately with advanced k nearest neighbor-based techniques. The weakness of the work is that it requires long computational time. Munir et al. [91] presented a new approach for detecting an anomaly, which is based on deep learning. The approach is known as DeepAnT and is used on time-series data. The method can also be used in non-streaming cases. The advantage of the approach is that an anomaly can be detected in real-life cases in which labeling a relatively big data stream, as well as static data, is required.
Manzoor et al. [92] proposed a method for detecting an outlier that is density based. The method, known as xSTREAM, is suitable for more extreme streaming data. The paper demonstrates that by making use of state-of-the-art methods, such as the xSTREAM, an anomaly can be detected more accurately, regardless of the size of the dimensions of the noise. Yang et al. [93] proposed a rather fast algorithm for outlier detection in data streams. The advantage of their method is a reduction in the time required for anomaly detection because the algorithm minimizes the required calculations in the LOF while still generating accurate outlier detection. However, it is based on a prediction model. Novel outlier semantics are proposed by Qin et al. [94], which deal with the shortcomings associated with the existing methods in light of modern high-velocity streams of data. The algorithm leverages KDE (kernel density estimation) to enhance the effectiveness of detecting local outliers from streaming data. The strength of this paper is that it shows how KDE can be leveraged to enhance the effectiveness of local outlier detection.
Kalliantzis et al. [95] focused on an outlier detection technique that is distributed and density based. The technique is applied to multi-dimensional streams of data. The strength of the work is that it establishes how the approximation computation method for LOCI (Local Correlation Integral) can be used to enhance the scalability and efficiency of detecting an anomaly, even when a largely distributed dataset is involved. Cai et al. [96] proposed an approach for detecting outliers that is two-phased and pattern-based and is known as Weighted Maximal Frequent Pattern-based Outlier (WMFP). The advantage of this method is that it shows that the impact of outliers, particularly from a weighted stream of data, can be detected more effectively. By accelerating the process of detecting outliers, the maximum frequent patterns are utilized rather than the frequent patterns. Novel methods for detecting and predicting outliers are introduced in [97]. The paper contributes to anomaly detection by showing that ensuring that an appropriate technique is used results in the achievement of accurate results, minimization of memory consumed, and the minimization of computational time.
A new approach for classifying data streams proposed in [98] is known as Evolving Micro-Clusters (EMC). The method learns the evolving micro-clusters in a dynamic manner in order to evaluate the evolution and concept drift. The advantage of this method is that it introduces the possibility of distinguishing evolution and concept drift from the distribution of noise. Alsini et al. [99] proposed a Grid Partition-based Local Outlier Factor (GP-LOF) algorithm for detecting a local outlier in a data stream. The GP-LOF has three phases: the first is the preprocessing phase where a sliding window is used to summarize the data points; the second is the processing phases that uses a grid method to split the data points, and the third is the detection phase that detects the outliers using the LOF. The strength of the algorithm is that it summarizes the data stream.
4.3. Applications of Local Outlier Detection
4.3.1. Intrusion Detection
Intrusion detection is a popular application of outlier detection. The purpose of its application is to monitor traffic networks. Outlier detection algorithms are used to identify intrusion attempts [100,101]. Intrusion Detection Systems (IDS) are hardware or software that observe the operation of the computer network and detect suspicious data or violations of network management policies. These devices and programs usually inform the network manager of any suspicious violations and processes that have been observed. Intrusion Detection Systems can be split into two basic types: Network Intrusion Detection Systems (NIDS) and Host-based Intrusion Detection Systems (HIDS). NIDS observes the operations of exchanged data on the network, and continuously compares it with normal data. It can therefore determine suspicious data or violations perpetrated on a network. HIDS works as software on devices and observes any modification or deletion of files. It also observes the outgoing and incoming data from the network to detect any suspicious data transfer between the device and the network [102]. The challenge of intrusion detection applications is the processing of huge amounts of data streams. Therefore, these applications use more basic, but more rapid, outlier detection algorithms.
4.3.2. Fraud Detection
Fraud detection is another common application for outlier detection. Fraud detection is used in many industries and other sectors, such as banking, insurance, and law enforcement. It aims to detect and prevent fraud [103]. Fraud detection software analyzes data, such as financial transactions, to detect abnormalities and unusual activities [104,105]. The Internet has become a necessity of life for many people. This has vastly increased e-shopping, which has led to the growth of online payments using credit cards. Outlier detection algorithms are used to identify attempted fraud.
4.3.3. Medical Applications
Outlier detection is also employed in many important medical applications. Outlier detection helps doctors monitor patients’ conditions when body sensors, such as electrocardiography (ECG), are used to detect critical situations [106,107]. Outlier detection algorithms are often used for analyzing medical images. For example, to detect abnormalities in a computed tomography scan (CT), doctors need to take into consideration the size, density, expansion, shape, structure, and location of suspicious tissue or structural part to compare the abnormality to normal tissue or structure. However, outlier detection algorithms in medical applications depend on image processing as a preprocessing stage.
5. Analysis and Discussion
We are now in the era of big data that is mined and analyzed to extract information. Data science, statistics, and machine learning are the fields where researchers are most interested in methods of extracting information from big data. Outlier detection is a major operation in these fields. Outlier detection is a task in data mining that has gained a lot of attention in this era of big data and an important type of big data is data streams. With the growing necessity of mining and analyzing data streams, it has become hard to use traditional outlier detection algorithms efficiently [108]. The LOF is an efficient and powerful algorithm for detecting local outliers. The main problem of the LOF is that it requires storage in computer memory of the whole dataset and the distance values [109]. A different issue with the LOF is that it requires recalculation from the beginning if any modification occurs in the dataset, such as the insertion of a new data point. The ILOF is a modified version of the LOF that can work in stream environments. Nevertheless, the ILOF also needs to keep all the data points in the computer memory in order to calculate the LOF score for every data point insertion that arrives at different times. Therefore, ILOF requires a large use of memory and computational time.
5.1. Computational Complexity
The LOF and the related local outlier detection algorithms are nearest neighbor-based algorithms. The computational complexity of these algorithms is O(n2), except for LOCI. Therefore, the execution times of these algorithms are similar. The computational complexity of the LOCI algorithm is O(n3), which requires more execution time because of the repetition required for the radius expansion. Another version of the LOCI algorithm is the aLOCI, which is faster than the LOCI because the execution time is based on the number of quad trees. The nearest neighbor-based algorithms have better accuracy of outlier detection than cluster-based algorithms [110]. However, long computation times are the cost of these methods because of the long time spent calculating pairwise distances.
When comparing the cluster-based algorithms with nearest neighbor-based algorithms, the cluster-based algorithms are more efficient; for example, the k-means computational complexity is O(nki), where n is the data point, k is the center of the cluster, and i is repetitions. By contrast, the nearest neighbor-base algorithms usually lead to quadratic computational complexity because they calculate the distances of all data points. The computational complexity of cluster-based algorithms, such as CBLOF, depends on the cluster algorithm, which is faster than O(n2) when using k-means. Therefore, the clustering algorithm is the essential reason for the computational complexity.
The most important issue for the LOF and its extensions is application in a stream environment. Few works exist in this domain, but some of them show better execution times. The ILOF algorithm addresses the issue of the LOF in a stream environment by updating and calculating the score of the LOF when a new data point arrives by using a landmark window. The computational complexity of the ILOF is O(N log N) and the memory usage complexity is O(Nk). The MILOF algorithm solved the issue of unlimited memory in the ILOF by summarizing the data points using k-means clustering and sliding windows, which limits the memory requirement. The computational complexity of the MILOF is O(N log Ws) and the memory usage complexity is O(Ws k), where N is the size of the data stream and Ws is the window size. The DILOF algorithm overcomes the issue of unbounded memory requirements by summarizing the data points using gradient-descent and sliding windows. The computational complexity of the DILOF is O(N Ws) and the memory usage complexity is O(Ws k). Finally, the MILOF and the DILOF solve the issue of the ILOF by summarizing and keeping only a small portion of the data points, which leads to reduced execution time.
5.2. Strengths and Weaknesses of Existing Methods
5.2.1. Nearest Neighbor-Based Techniques
Distance and similarity metrics can be determined by different approaches in the nearest neighbor-based outlier detection methods. The advantage of this approach is that it does not need an assumption for the data distribution and can be applied to different data types. However, it requires an appropriate distance calculation for the data. The Euclidean distance is the optimal approach for serving the outlier detection in continuous characteristics such as data streams [111]. The methods depend on two approaches:
- The use of techniques to measure the distance of the data point as for the outlier score.
- To identify the outlier score, the calculation of the relative density of each data point.
However, nearest neighbor-based techniques require a long computational time for big data.
5.2.2. Clustering-Based Techniques
In data mining, the clustering technique is a common alternative for clustering data with similar features [112,113]. Clustering is also an effective method for the study of outliers. In most of the clustering approaches, the primary assumption is that the normal data is often bound to density and significant clusters, where outliers can be separated into other classes [114]. The advantages of cluster approaches include the following:
- With the incremental model, it is simple to adjust.
- No oversight is required.
- Suitable for temporal data to detect outliers.
- Requires only a quick test step since the number of clusters needing comparison is typically small.
The disadvantages in the clustering-based techniques are the following:
- They depend strongly on the efficiency of the clustering algorithm for normal data points.
- The majority of approaches that identify outliers are cluster by-products and thus are not designed to perform well for detecting outliers.
- Several cluster approaches process each point to be distributed in some clusters. This could contribute to abnormalities in a large cluster, and techniques that work under the presumption that anomalies are included in each cluster may be viewed as normal data points.
- Some algorithms demand that each data point is allocated on a cluster. A wide cluster may be used for outliers and handled by methods that often conclude that outliers are isolated.
- Various approaches to the cluster are only applicable where outliers are not part of the main clusters.
- The measurement of the clustering algorithm is complicated.
5.3. New Methods to Be Explored
To address the limitation of the LOF in data streams, new methods should be developed. The primary purpose of any new method would be to measure the LOF score in all of the following circumstances: (1) keeping only a small part of the dataset in the computer memory; (2) the algorithm has no prior knowledge about the data distribution; (3) for an incoming data point pt, the algorithm should verify whether it is an outlier or inlier at the current time T; and (4) when the algorithm detects the current outlier, it has no prior knowledge about future data points.
To overcome the problems of the LOF in stream environments, we have designed a new methodology to detect local outliers. This methodology contains two phases: (1) the detection phase and (2) the summarization phase. For the detection phase, the ILOF is used with a skipping scheme [75,77]. For the summarization phase, the Genetic Density Summarization algorithm (GDS), based on the genetic algorithm (GA), is used to summarize the dataset. The framework of our methodology, named Genetic-based Incremental Local Outlier Factor (GILOF) [115], works as follows: First, the maximum size of the window (W) is determined as W-size. After that, the threshold of the LOF is applied to detect the local outliers, relying on the threshold θ, then using the GDS to summarize the data points. Thereafter, the GILOF uses the ILOF together with a skipping scheme to detect the local outlier when an incoming data point arrives. It is worth noting that the skipping scheme is used in order to detect the sequence of outliers, when the sequence of outliers is outlier data points that are trying to build a new class. The GILOF continues to detect the outlier data points and to compute the LOF values for every new data point until the window reaches the W-size. When the window becomes full, the GDS algorithm is applied to the window in order to summarize 50%W of the older data points in the window; it does so by choosing 25%W of the fittest data points to represent the 50%W of the older data points. After this, the GILOF deletes the older 50%W of the data points from the window and the selected 25%W of data points is transferred to the window and merges with the remaining 50%W. These 75%W of data points joins with the newly incoming data points in the window. When the window reaches the W-size again, the GDS repeats the same process. The video in [116] displays a simulation of the GILOF system process. Figure 7 shows the overall design and workflow for the methodology.
Local Outlier Factor by Reachability Distance (LOFR) is similar to the LOF, but the LOFR has a different calculation method, in which it does not need to apply the local reachability density [117]. To calculate the score of outlierness, the LOFR uses k-distance, k-nearest neighbor, and Reachability distance Rd. Subsequently, the Reachability distance Rd of data point p will be divided by the average Rd of the data point p neighbors. This new calculation method for local outlier detection can produce a lower “outlierness” score than the LOF. The LOFR can produce a more accurate outlierness score in various datasets. The LOFR score is calculated by using Equation (6).
The GILOF algorithm is discussed extensively in [115]. By trying to enhance the effectiveness of the GILOF algorithm, we propose another calculation method for the LOF, which is named LOFR. The newly adapted algorithm in the data stream is named Genetic-based Incremental Local Outlier Factor by Reachability Distance (GILOFR). The GILOFR algorithm is also extensively discussed in [117]. For future work, the other traditional local outlier detection algorithms, such as the COF, LoOP, LOCI, and the INFLO, etc., can be adapted to work in a data stream. To execute these traditional algorithms in a data stream, the mechanisms of the above-mentioned methods, such as the GILOF and DILOF algorithms, should be applied.
6. Conclusions
Outlier detection is an important task for many applications in many different domains. The aim of outlier detection is to find abnormal events that differ from normal events. This paper reviews local outlier detection algorithms in both static and stream environments. More specifically, it addresses the challenges of local outlier detection in stream environments and compares the different methods of local outlier detection that have been proposed. Extra attention has been given to the LOF in stream environments. Based on the results of this review, the paper also provides a method to improve the efficiency of the LOF in stream environments.
Author Contributions
Conceptualization, O.A. and X.M.; methodology, O.A.; writing—original draft preparation, O.A., writing—review and editing, O.A., R.A., T.S. and X.M.; funding acquisition, X.M. All authors have read and agreed to the published version of the manuscript.
Funding
This research was partially supported by the National Science Foundation under grant No. 2019609.
Institutional Review Board Statement
Not applicable.
Informed Consent Statement
Not applicable.
Data Availability Statement
No new data were created or analyzed in this study. Data sharing is not applicable to this article.
Acknowledgments
We thank the two anonymous reviewers for their time and constructive comments.
Conflicts of Interest
The authors declare no conflict of interest.
References
- Boukerche, A.; Zheng, L.; Alfandi, O. Outlier Detection: Methods, Models, and Classification. ACM Comput. Surv. 2020, 53, 1–37. [Google Scholar]
- Cios, K.J.; Pedrycz, W.; Swiniarski, R.W. Data Mining and Knowledge Discovery; Springer: Boston, MA, USA, 1998; pp. 1–26. [Google Scholar]
- Ramírez-Gallego, S.; Krawczyk, B.; García, S.; Woźniak, M.; Herrera, F. A survey on data preprocessing for data stream mining: Current status and future directions. Neurocomputing 2017, 239, 39–57. [Google Scholar] [CrossRef]
- Kumar, V. Parallel and distributed computing for cybersecurity. IEEE Distrib. Syst. Online 2005, 6. [Google Scholar] [CrossRef] [Green Version]
- Spence, C.; Parra, L.; Sajda, P. Detection, synthesis and compression in mammographic image analysis with a hierarchical image probability model. In Proceedings of the IEEE Workshop on Mathematical Methods in Biomedical Image Analysis (MMBIA 2001), Kauai, HI, USA, 9–10 December 2001; IEEE: New York, NY, USA, 2002. [Google Scholar]
- Fujimaki, R.; Yairi, T.; Machida, K. An approach to spacecraft anomaly detection problem using kernel feature space. In Proceedings of the Eleventh ACM SIGKDD International Conference on Knowledge Discovery in Data Mining, Chicago, IL, USA, 21–24 August 2005. [Google Scholar]
- Knox, E.M.; Ng, R.T. Algorithms for mining distance-based outliers in large datasets. In Proceedings of the International Conference on very Large Data Bases, New York, NY, USA, 24–27 August 1998; pp. 392–403. [Google Scholar]
- Souiden, I.; Brahmi, Z.; Toumi, H. A Survey on Outlier Detection in the Context of Stream Mining: Review of Existing Approaches and Recommadations. In Intelligent Systems Design and Applications; Springer: Cham, Switzerland, 2017; pp. 372–383. [Google Scholar]
- Patcha, A.; Park, J.-M. An overview of anomaly detection techniques: Existing solutions and latest technological trends. Comput. Netw. 2007, 51, 3448–3470. [Google Scholar] [CrossRef]
- Snyder, D. Online Intrusion Detection Using Sequences of System Calls. Master’s Thesis, Department of Computer Science, Florida State University, Tallahassee, FL, USA, 2001. [Google Scholar]
- Markou, M.; Singh, S. Novelty detection: A review—Part 1: Statistical approaches. Signal Process. 2003, 83, 2481–2497. [Google Scholar] [CrossRef]
- Markou, M.; Singh, S. Novelty detection: A review—Part 2: Neural network based approaches. Signal Process. 2003, 83, 2499–2521. [Google Scholar] [CrossRef]
- Hodge, V.; Austin, J. A Survey of Outlier Detection Methodologies. Artif. Intell. Rev. 2004, 22, 85–126. [Google Scholar] [CrossRef] [Green Version]
- Goldstein, M.; Uchida, S. A Comparative Evaluation of Unsupervised Anomaly Detection Algorithms for Multivariate Data. PLoS ONE 2016, 11, e0152173. [Google Scholar] [CrossRef] [Green Version]
- Wang, H.; Bah, M.J.; Hammad, M. Progress in Outlier Detection Techniques: A. Survey. IEEE Access 2019, 7, 107964–108000. [Google Scholar] [CrossRef]
- Tellis, V.M.; D’souza, D.J. Detecting Anomalies in Data Stream Using Efficient Techniques: A Review. In Proceedings of the 2018 International Conference on Control, Power, Communication and Computing Technologies (ICCPCCT), Kannur, India, 23–24 March 2018. [Google Scholar]
- Park, C.H. Outlier and anomaly pattern detection on data streams. J. Supercomput. 2019, 75, 6118–6128. [Google Scholar] [CrossRef]
- Pimentel, M.A.; Clifton, D.A.; Clifton, L.; Tarassenko, L. A review of novelty detection. Signal Process. 2014, 99, 215–249. [Google Scholar] [CrossRef]
- Chauhan, P.; Shukla, M. A review on outlier detection techniques on data stream by using different approaches of K-Means algorithm. In Proceedings of the 2015 International Conference on Advances in Computer Engineering and Applications, Ghaziabad, India, 19–20 March 2015. [Google Scholar]
- Salehi, M.; Rashidi, L. A Survey on Anomaly detection in Evolving Data. ACM Sigkdd Explor. Newsl. 2018, 20, 13–23. [Google Scholar] [CrossRef]
- Chandola, V.; Banerjee, A.; Kumar, V. Anomaly detection: A survey. ACM Comput. Surv. 2009, 41, 1–58. [Google Scholar] [CrossRef]
- Domingues, R.; Filippone, M.; Michiardi, P.; Zouaoui, J. A comparative evaluation of outlier detection algorithms: Experiments and analyses. Pattern Recognit. 2018, 74, 406–421. [Google Scholar] [CrossRef]
- Safaei, M.; Asadi, S.; Driss, M.; Boulila, W.; Alsaeedi, A.; Chizari, H.; Abdullah, R.; Safaei, M. A Systematic Literature Review on Outlier Detection in Wireless Sensor Networks. Symmetry 2020, 12, 328. [Google Scholar] [CrossRef] [Green Version]
- Barnett, V.; Lewis, T. Outliers in Statistical Data; Wiley: Chichester, UK, 1994. [Google Scholar]
- Zimek, A.; Filzmoser, P. There and Back Again: Outlier Detection between Statistical Reasoning and Data Mining Algorithms. 2018. Available online: https://onlinelibrary.wiley.com/doi/full/10.1002/widm.1280 (accessed on 30 November 2020).
- Eskin, E. Anomaly Detection over Noisy Data Using Learned Probability Distributions. In Proceedings of the 17th International Conference Machine Learning, Stanford, CA, USA, 17–22 July 2000; pp. 255–262. [Google Scholar]
- Maximum Likelihood Estimation. 2015. Available online: https://en.wikipedia.org/w/index.php?title=Maximum_likelihood_estimation&oldid=857905834 (accessed on 30 November 2020).
- Yang, X.; Latecki, L.J.; Pokrajac, D. Outlier Detection with Globally Optimal Exemplar-Based GMM. In Proceedings of the 2009 SIAM International Conference on Data Mining, Sparks, NA, USA, 30 April–2 May 2009. [Google Scholar]
- Tang, X.; Yuan, R.; Chen, J. Outlier detection in energy disaggregation using subspace learning and Gaussian mixture model. Int. J. Control Autom. 2015, 8, 161–170. [Google Scholar] [CrossRef]
- Zhang, J. Advancement of outlier detection: A survey. ICST Trans. Scalable Inf. Syst. 2013, 13, 1–26. [Google Scholar] [CrossRef] [Green Version]
- Satman, M.H. A new algorithm for detecting outliers in linear regression. Int. J. Stat. Probab. 2013, 2, 101–109. [Google Scholar] [CrossRef]
- Park, C.M.; Jeon, J. Regression-Based Outlier Detection of Sensor Measurements Using Independent Variable Synthesis. In Proceedings of the International Conference on Data Science, New York, NY, USA, 7–11 August 2015; pp. 78–86. [Google Scholar]
- Pavlidou, M.; Zioutas, G. Kernel Density Outlier Detector. In Proceedings of the Mathematics & Statistics Topics in Nonparametric Statistics, Chalkidiki, Greece, 15–19 June 2014; pp. 241–250. [Google Scholar]
- Latecki, L.J.; Lazarevic, A.; Pokrajac, D. Outlier Detection with Kernel Density Functions. In Machine Learning and Data Mining in Pattern Recognition; Springer: Berlin, Germany, 2007; pp. 61–75. [Google Scholar]
- Gao, J.; Hu, W.; Zhang, Z.; Wu, O. RKOF: Robust kernel- based local outlier detection. In Proceedings of the Pacific-Asia Conference on Knowledge Discovery and Data Mining, Delhi, India, 11–14 May 2011; pp. 270–283. [Google Scholar]
- Samparthi, V.S.K.; Verma, H.K. Outlier Detection of Data in Wireless Sensor Networks Using Kernel Density Estimation. Int. J. Comput. Appl. 2010, 5, 28–32. [Google Scholar] [CrossRef]
- Edgeworth, F., XLI. On discordant observations. Lond. Edinb. Dublin Philos. Mag. J. Sci. 1887, 23, 364–375. [Google Scholar] [CrossRef] [Green Version]
- Rousseeuw, P.J.; Leroy, A.M. Robust Regression and Outlier Detection. In Wiley Series in Probability and Statistics; Wiley Online library: Hoboken, NJ, USA, 1987. [Google Scholar]
- Hawkins, D.M. Identification of Outliers. In Monographs on Applied Probability and Statistics; Springer: Berlin/Heidelberg, Germany, 1980. [Google Scholar]
- Barnett, V.; Lewis, T. Statistical Interpretation of Data; John Wiley and Sons: Hoboken, NJ, USA, 1994. [Google Scholar]
- Bakar, Z.; Mohemad, R.; Ahmad, A.; Deris, M. A Comparative Study for Outlier Detection Techniques in Data Mining. In Proceedings of the 2006 IEEE Conference on Cybernetics and Intelligent Systems, Bangkok, Thailand, 7–9 June 2006. [Google Scholar]
- Aggarwal, C.C. Outlier Analysis. In Data Mining; Springer: Berlin/Heidelberg, Germany, 2015; pp. 237–263. [Google Scholar]
- Meng, F.; Yuan, G.; Lv, S.; Wang, Z.; Xia, S. An overview on trajectory outlier detection. Artif. Intell. Rev. 2019, 52, 2437–2456. [Google Scholar] [CrossRef]
- Gökalp, E.; Güngör, O.; Boz, Y. Evaluation of Different Outlier Detection Methods for GPS Networks. Sensors 2008, 8, 7344–7358. [Google Scholar] [CrossRef] [PubMed]
- Joshi, M.V.; Agarwal, R.C.; Kumar, V. Mining needle in a haystack: Classifying rare classes via two-phase rule induction. In Proceedings of the 2001 ACM SIGMOD International conference on Management of data–SIGMOD ‘01, Santa Barbara, CA, USA, 16–18 May 2001. [Google Scholar]
- Joshi, M.V.; Agarwal, R.C.; Kumar, V. Predicting rare classes: Can boosting make any weak learner strong? In Proceedings of the eighth ACM SIGKDD International Conference on Knowledge Discovery and Data Mining—KDD ‘02, Edmonton, AB, Canada, 26–26 July 2002. [Google Scholar]
- Chawla, N.V.; Japkowicz, N.; Kotcz, A. Editorial: Special issue on learning from imbalanced data sets. ACM Sigkdd Explor. Newsl. 2004, 6, 1–6. [Google Scholar] [CrossRef]
- Sen, P.C.; Hajra, M.; Ghosh, M. Supervised Classification Algorithms in Machine Learning: A Survey and Review. In Emerging Technology in Modelling and Graphics; Springer: Berlin, Germany, 2020; pp. 99–111. [Google Scholar]
- Quinlan, J.R. C4.5: Programs for Machine Learning; Morgan Kaufmann Publishers Inc.: Burlington, MA, USA, 1993. [Google Scholar]
- Mehrotra, K.; Mohan, C.; Ranka, S. Elements of Artificial Neural Networks; MIT Press: Cambridge, MA, USA, 1996. [Google Scholar]
- Moya, M.M.; Hush, D.R. Network constraints and multi-objective optimization for one-class classification. Neural Netw. 1996, 9, 463–474. [Google Scholar] [CrossRef]
- Schölkopf, B.; Platt, J.C.; Shawe-Taylor, J.; Smola, A.J.; Williamson, R.C. Estimating the Support of a High-Dimensional Distribution. Neural Comput. 2001, 13, 1443–1471. [Google Scholar] [CrossRef] [PubMed]
- Breunig, M.M.; Kriegel, H.-P.; Ng, R.T.; Sander, J. LOF: Identifying density-based local outliers. In Proceedings of the 2000 ACM SIGMOD international conference on Management of data—SIGMOD ‘00, Dallas, TX, USA, 16–18 May 2000. [Google Scholar]
- Tang, J.; Chen, Z.; Fu, A.; Cheung, D. Enhancing Effectiveness of Outlier Detections for Low Density Patterns. In Advances in Knowledge Discovery and Data Mining. Vol. 2336 of Lecture Notes in Computer Science; Chen, M.S., Yu, P., Liu, B., Eds.; American Association for Artificial Intelligence: Menlo Park, CA, USA, 2002; pp. 535–548. [Google Scholar]
- Papadimitriou, S.; Kitagawa, H.; Gibbons, P.; Faloutsos, C. LOCI: Fast outlier detection using the local correlation integral. In Proceedings of the 19th International Conference on Data Engineering, Bangalore, India, 5–8 March 2003. [Google Scholar]
- He, Z.; Xu, X.; Deng, S. Discovering cluster-based local outliers. Pattern Recognit. Lett. 2003, 24, 1641–1650. [Google Scholar] [CrossRef]
- Jin, W.; Tung, A.K.H.; Han, J.; Wang, W. Ranking Outliers Using Symmetric Neighborhood Relationship. In Proceedings of the Advances in Knowledge Discovery and Data Mining Lecture Notes in Computer Science 20th Pacific-Asia Conference, Auckland, New Zealand, 19–22 April 2016; Volume 3918, pp. 577–593. [Google Scholar]
- Kriegel, H.-P.; Kröger, P.; Schubert, E.; Zimek, A. LoOP: Local Outlier Probabilities. In Proceedings of the 18th ACM conference on Information and knowledge management—CIKM ‘09, Hongkong, China, 2–6 November 2009. [Google Scholar]
- Amer, M.; Goldstein, M. Nearest-Neighbor and Clustering based Anomaly Detection Algorithms for RapidMiner. In Proceedings of the 3rd RapidMiner Community Meeting and Conference, Budapest, Hungary, 28–31 August 2012; pp. 1–12. [Google Scholar]
- Chiu, A.; Fu, A.W.-C. Enhancements on local outlier detection. In Proceedings of the Seventh International Database Engineering and Applications Symposium, Hong Kong, China, 16–18 July 2003; IEEE: New York, NY, USA, 2003. [Google Scholar]
- Jiang, S.Y.; Li, Q.H.; Li, K.L.; Wang, H.; Meng, Z.L. GLOF: A new approach for mining local outlier. In Proceedings of the 2003 International Conference on Machine Learning and Cybernetics, Xi’an, China, 5 November 2003; pp. 157–162. [Google Scholar]
- Ren, D.; Wang, B.; Perrizo, W. Rdf: A density-based outlier detection method using vertical data representation. In Proceedings of the Fourth IEEE International Conference on Data Mining ICDM’04, Brighton, UK, 1–4 November 2004; pp. 503–506. [Google Scholar]
- Lozano, E.; Acuna, E. Parallel Algorithms for Distance-Based and Density-Based Outliers. In Proceedings of the Fifth IEEE International Conference on Data Mining (ICDM’05), Washington, DC, USA, 27–30 November 2005. [Google Scholar]
- Fan, H.; Zaïane, O.R.; Foss, A.; Wu, J. Resolution-based outlier factor: Detecting the top-n most outlying data points in engineering data. Knowl. Inf. Syst. 2008, 19, 31–51. [Google Scholar] [CrossRef]
- Momtaz, R.; Mohssen, N.; Gowayyed, M.A. DWOF: A Robust Density-Based Outlier Detection Approach. In Pattern Recognition and Image Analysis Lecture Notes in Computer Science; Springer: Berlin/Heidelberg, Germany, 2013; pp. 517–525. [Google Scholar]
- Cao, K.; Shi, L.; Wang, G.; Han, D.; Bai, M. Density-based local outlier detection on uncertain data. In Proceedings of the International Conference on Web-Age Information Management, Macau, China, 16–18 June 2014; pp. 67–71. [Google Scholar]
- Goldstein, M. Anomaly Detection in Large Datasets. Ph.D. Thesis, University of Kaiserslautern, Kaiserslautern, Germany, 2016. [Google Scholar]
- Tang, B.; He, H. A local density-based approach for outlier detection. Neurocomputing 2017, 241, 171–180. [Google Scholar] [CrossRef] [Green Version]
- Vazquez, F.I.; Zseby, T.; Zimek, A. Outlier Detection Based on Low Density Models. In Proceedings of the 2018 IEEE International Conference on Data Mining Workshops (ICDMW), Singapore, 17–20 November 2018. [Google Scholar]
- Ning, J.; Chen, L.; Chen, J. Relative Density-Based Outlier Detection Algorithm. In Proceedings of the 2018 2nd International Conference on Computer Science and Artificial Intelligence-CSAI ‘18, Shenzhan, China, 11–13 December 2018. [Google Scholar]
- Su, S.; Xiao, L.; Ruan, L.; Gu, F.; Li, S.; Wang, Z.; Xu, R. An Efficient Density-Based Local Outlier Detection Approach for Scattered Data. IEEE Access 2019, 7, 1006–1020. [Google Scholar] [CrossRef]
- Zhao, Y.; Nasrullah, Z.; Hryniewicki, M.K.; Li, Z. LSCP: Locally Selective Combination in Parallel Outlier Ensembles. In Proceedings of the 2019 SIAM International Conference on Data Mining, Calgary, AB, Canada, 2–4 May 2019; pp. 585–593. [Google Scholar]
- Xu, Z.; Kakde, D.; Chaudhuri, A. Automatic Hyperparameter Tuning Method for Local Outlier Factor, with Applications to Anomaly Detection. In Proceedings of the 2019 IEEE International Conference on Big Data (Big Data), Los Angelas, CA, USA, 9–12 December 2019. [Google Scholar]
- Yang, P.; Wang, D.; Wei, Z.; Du, X.; Li, T. An Outlier Detection Approach Based on Improved Self-Organizing Feature Map Clustering Algorithm. IEEE Access 2019, 7, 115914–115925. [Google Scholar] [CrossRef]
- Pokrajac, D.; Lazarevic, A.; Latecki, L.J. Incremental Local Outlier Detection for Data Streams. In Proceedings of the IEEE Symposium on Computational Intelligence and Data Mining, Honolulu, HI, USA, 1 March–5 April 2007. [Google Scholar]
- Salehi, M.; Leckie, C.; Bezdek, J.C.; Vaithianathan, T.; Zhang, X. Fast Memory Efficient Local Outlier Detection in Data Streams. IEEE Trans. Knowl. Data Eng. 2016, 28, 3246–3260. [Google Scholar] [CrossRef]
- Na, G.S.; Kim, D.; Yu, H. DILOF: Effective and memory efficient local outlier detection in data streams. In Proceedings of the 24th ACM SIGKDD International Conference on Knowledge Discovery & Data Mining, London, UK, 19–23 August 2018. [Google Scholar]
- Pokrajac, D.; Reljin, N.; Pejcic, N.; Lazarevic, A. Incremental Connectivity-Based Outlier Factor Algorithm. In Proceedings of the Visions of Computer Science-BCS International Academic Conference, London, UK, 22–24 September 2008; pp. 211–223. [Google Scholar]
- Ren, J.; Wu, Q.; Zhang, J.; Hu, C. Efficient outlier detection algorithm for heterogeneous data streams. Int. Conf. Fuzzy Syst. Knowl. Discov. 2009, 5, 259–264. [Google Scholar]
- Karimian, S.H.; Kelarestaghi, M.; Hashemi, S. I-IncLOF: Improved incremental local outlier detection for data streams. In Proceedings of the The 16th CSI International Symposium on Artificial Intelligence and Signal Processing, Shiraz, Iran, 2–3 May 2012. [Google Scholar]
- Wang, Z.; Zhao, Z.; Weng, S.; Zhang, C. Incremental multiple instance outlier detection. Neural Comput. Appl. 2015, 26, 957–968. [Google Scholar] [CrossRef]
- Salehi, M.; Leckie, C.; Bezdek, J.C.; Vaithianathan, T. Local outlier detection for data streams in sensor networks: Revisiting the utility problem invited paper. In Proceedings of the 2015 IEEE Tenth International Conference on Intelligent Sensors, Sensor Networks and Information Processing (ISSNIP), Singapore, 7–9 April 2015. [Google Scholar]
- Kontaki, M.; Gounaris, A.; Papadopoulos, A.N.; Tsichlas, K.; Manolopoulos, Y. Efficient and flexible algorithms for monitoring distance-based outliers over data streams. Inf. Syst. 2016, 55, 37–53. [Google Scholar] [CrossRef]
- Zhang, L.; Lin, J.; Karim, R. Sliding Window-Based Fault Detection From High-Dimensional Data Streams. IEEE Trans. Syst. Man Cybern. Syst. 2016, 47, 1–15. [Google Scholar] [CrossRef] [Green Version]
- Hamlet, C.; Straub, J.; Russell, M.; Kerlin, S. An incremental and approximate local outlier probability algorithm for intrusion detection and its evaluation. J. Cyber Secur. Technol. 2017, 1, 75–87. [Google Scholar] [CrossRef] [Green Version]
- Siffer, A.; Fouque, P.-A.; Termier, A.; Largouet, C. Anomaly Detection in Streams with Extreme Value Theory. In Proceedings of the 23rd ACM SIGKDD International Conference on Knowledge Discovery and Data Mining, Halifax, NS, Canada, 13–17 August 2017. [Google Scholar]
- Mu, X.; Ting, K.M.; Zhou, Z.-H. Classification Under Streaming Emerging New Classes: A Solution Using Completely-Random Trees. IEEE Trans. Knowl. Data Eng. 2017, 29, 1605–1618. [Google Scholar] [CrossRef] [Green Version]
- Ishimtsev, V.; Bernstein, A.; Burnaev, E.; Nazarov, I. Conformal k-NN Anomaly Detector for Univariate Data Streams. In Proceedings of the Conformal and Probabilistic Prediction and Applications, Stockholm, UK, 14–16 June 2017; pp. 213–227. [Google Scholar]
- Chen, Q.; Luley, R.; Wu, Q.; Bishop, M.; Linderman, R.W.; Qiu, Q. AnRAD: A Neuromorphic Anomaly Detection Framework for Massive Concurrent Data Streams. IEEE Trans. Neural Netw. Learn. Syst. 2017, 29, 1622–1636. [Google Scholar] [CrossRef]
- Yao, H.; Fu, X.; Yang, Y.; Postolache, O. An Incremental Local Outlier Detection Method in the Data Stream. Appl. Sci. 2018, 8, 1248. [Google Scholar] [CrossRef] [Green Version]
- Munir, M.; Siddiqui, S.A.; Dengel, A.; Ahmed, S. DeepAnT: A Deep Learning Approach for Unsupervised Anomaly Detection in Time Series. IEEE Access 2018, 7, 1991–2005. [Google Scholar] [CrossRef]
- Manzoor, E.; Lamba, H.; Akoglu, L. xstream: Outlier detection in feature-evolving data streams. In Proceedings of the 24th ACM SIGKDD International Conference on Knowledge Discovery & Data Mining, London, UK, 19–23 August 2018. [Google Scholar]
- Yang, X.; Zhou, W.; Shu, N.; Zhang, H. A Fast and Efficient Local Outlier Detection in Data Streams. In Proceedings of the 2019 International Conference on Image, Video and Signal Processing, Shanghai, China, 29–30 October 2019. [Google Scholar]
- Qin, X.; Cao, L.; Rundensteiner, E.A.; Madden, S. Scalable Kernel Density Estimation-based Local Outlier Detection over Large Data Streams. EDBT 2019, 421–432. [Google Scholar] [CrossRef]
- Kalliantzis, I.; Papadopoulos, A.; Gounaris, A.; Tsichlas, K. Efficient Distributed Outlier Detection in Data Streams; Research Report; Aristotle University of Thessaloniki: Thessaloniki, Greece, 2019. [Google Scholar]
- Cai, S.; Li, Q.; Li, S.; Yuan, G.; Sun, R. An efficient maximal frequent-pattern-based outlier detection approach for weighted data streams. Inf. Technol. Control 2019, 48, 505–521. [Google Scholar] [CrossRef]
- Reunanen, N.; Räty, T.; Jokinen, J.J.; Hoyt, T.; Culler, D. Unsupervised online detection and prediction of outliers in streams of sensor data. Int. J. Data Sci. Anal. 2019, 9, 285–314. [Google Scholar] [CrossRef] [Green Version]
- Din, S.U.; Shao, J. Exploiting evolving micro-clusters for data stream classification with emerging class detection. Inf. Sci. 2020, 507, 404–420. [Google Scholar] [CrossRef]
- Alsini, R.; Alghushairy, O.; Ma, X.; Soule, T. A Grid Partition-based Local Outlier Factor for Data Stream Processing. In Proceedings of the 4th International Conference on Applied Cognitive Computing, Las Vegas, NV, USA, 27–30 July 2020. [Google Scholar]
- Portnoy, L. Intrusion detection with unlabeled data using clustering. Ph.D. Dissertation, Columbia University, New York, NY, USA, 2000. [Google Scholar]
- García-Teodoro, P.; Díaz-Verdejo, J.; Maciá-Fernández, G.; Vázquez, E. Anomaly-based network intrusion detection: Techniques, systems and challenges. Comput. Secur. 2009, 28, 18–28. [Google Scholar] [CrossRef]
- Yeung, D.-Y.; Ding, Y. Host-based intrusion detection using dynamic and static behavioral models. Pattern Recognit. 2003, 36, 229–243. [Google Scholar] [CrossRef] [Green Version]
- Phua, C.; Lee, V.; Smith, K.; Gayler, R. A comprehensive survey of data mining-based fraud detection research. arXiv 2010, arXiv:1009.6119. [Google Scholar]
- Thiprungsri, S.; Vasarhelyi, M. Cluster Analysis for Anomaly Detection in Accounting Data: An Audit Approach. Int. J. Digit. Account. Res. 2011, 11. [Google Scholar] [CrossRef]
- Bolton, R.J.; Hand, D.J. Unsupervised profiling methods for fraud detection. In Proceedings of the Credit Scoring and Credit Control XII Conference, Edinburgh, UK, 24–26 August 2011; pp. 235–255. [Google Scholar]
- Bansal, R.; Gaur, N.; Singh, S.N. Outlier detection: Applications and techniques in data mining. In Proceedings of the 6th International Conference-Cloud System and Big Data Engineering, Noida, India, 14–15 January 2016; pp. 373–377. [Google Scholar]
- Lin, J.; Keogh, E.; Fu, A.; Herle, H.V. Approximations to Magic: Finding Unusual Medical Time Series. In Proceedings of the 18th IEEE Symposium on Computer-Based Medical Systems (CBMS’05), Dublin, Ireland, 23–24 June 2005. [Google Scholar]
- Alsini, R.; Ma, X. Data Streaming. In Encyclopedia of Big Data; Schintler, L., McNeely, C., Eds.; Springer: Cham, Switzerland, 2019. [Google Scholar]
- Alghushairy, O.; Ma, X. Data Storage. In Encyclopedia of Big Data; Schintler, L., McNeely, C., Eds.; Springer: Cham, Switzerland, 2019. [Google Scholar]
- Balcázar, J.L.; Bonchi, F.; Gionis, A.; Sebag, M. Machine Learning and Knowledge Discovery in Databases; Springer: Cham, Switzerland, 2010; Volume 6321. [Google Scholar]
- Fawzy, A.; Mokhtar, H.M.O.; Hegazy, O. Outliers detection and classification in wireless sensor networks. Egypt. Inf. J. 2013, 14, 157–164. [Google Scholar] [CrossRef] [Green Version]
- Jain, A.K.; Dubes, R.C. Algorithms for Clustering Data; Prentice-Hall, Inc.: Upper Saddle River, NJ, USA, 1988. [Google Scholar]
- Boulila, W.; Farah, I.R.; Ettabaa, K.S.; Solaiman, B.; Ghézala, H.B. A data mining based approach to predict spatiotemporal changes in satellite images. Int. J. Appl. Earth Obs. Geoinf. 2011, 13, 386–395. [Google Scholar] [CrossRef]
- Han, J.; Pei, J.; Kamber, M. Data Mining: Concepts and Techniques; Elsevier: Amsterdam, The Netherlands, 2011. [Google Scholar]
- Alghushairy, O.; Alsini, R.; Ma, X.; Soule, T. A Genetic-Based Incremental Local Outlier Factor Algorithm for Efficient Data Stream Processing. In Proceedings of the 2020 the 4th International Conference on Compute and Data Analysis, Silicon Valley, CA, USA, 9–12 March 2020; pp. 38–49. [Google Scholar]
- Simulation of Genetic Based Incremental Local Outlier Factor. Available online: https://www.youtube.com/watch?v=YY-lHhhe2Ew&t=15s (accessed on 30 July 2019).
- Alghushairy, O.; Alsini, R.; Ma, X.; Soule, T. Improving the Efficiency of Genetic based Incremental Local Outlier Factor Algorithm for Network Intrusion Detection. In Proceedings of the 4th International Conference on Applied Cognitive Computing, Las Vegas, NV, USA, 27–30 July 2020. [Google Scholar]
Figure 1.
The types of outliers, where grey points are global outliers, and the red point is a local outlier.
Figure 1.
The types of outliers, where grey points are global outliers, and the red point is a local outlier.

Figure 2.
The search strategy flowchart for selecting articles.

Figure 3.
Summary of references used in the literature review for static data [53,54,55,56,57,58,59,60,61,62,63,64,65,66,67,68,69,70,71,72,73,74].

Figure 4.
The reachability distance for different data points p with regard to o, when k equals 5.

Figure 5.
Comparison between the LOF and the INFLO. For the red data point, LOF will consider the data points in the blue area to be neighbors, which will result in a high outlier value. By contrast, the INFLO will take into account the green data points so that the value of the red data point will be more reasonable and will be more likely to be considered an outlier.

Figure 6.
Summary of references used in the literature review for streaming data [75,76,77,78,79,80,81,82,83,84,85,86,87,88,89,90,91,92,93,94,95,96,97,98,99].

Figure 7.
Diagram of the overall design and workflow for the methodology.


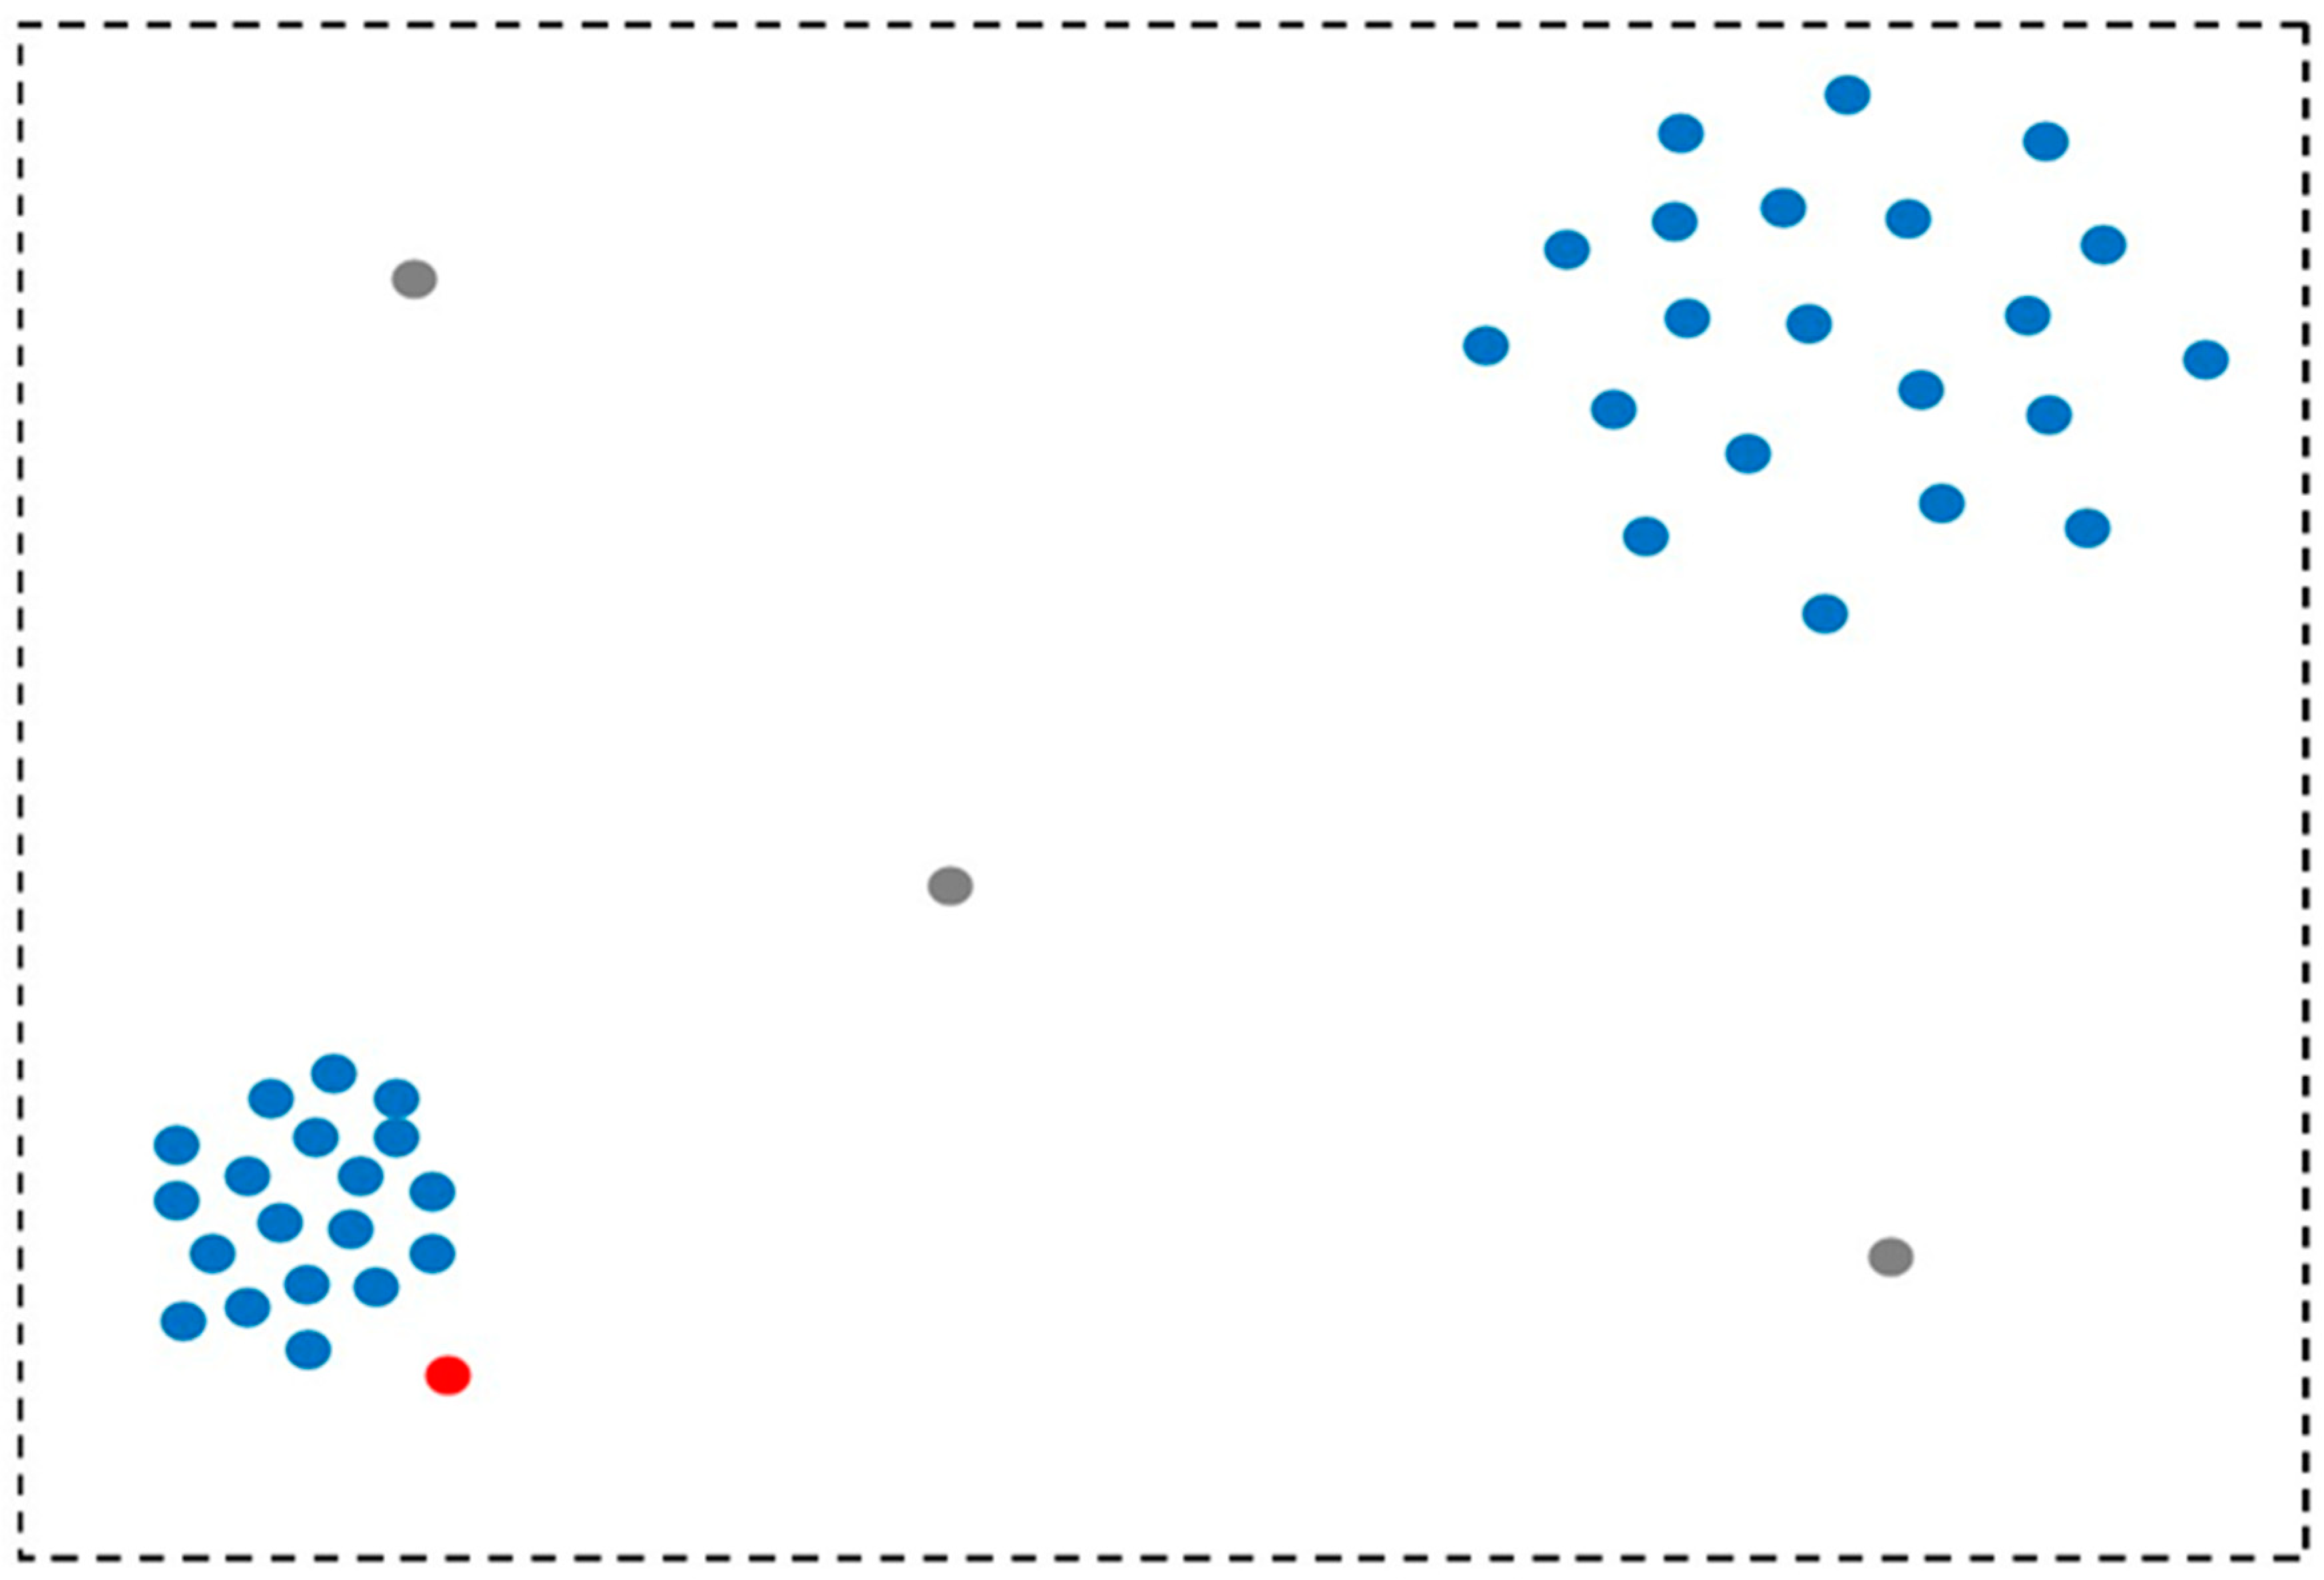
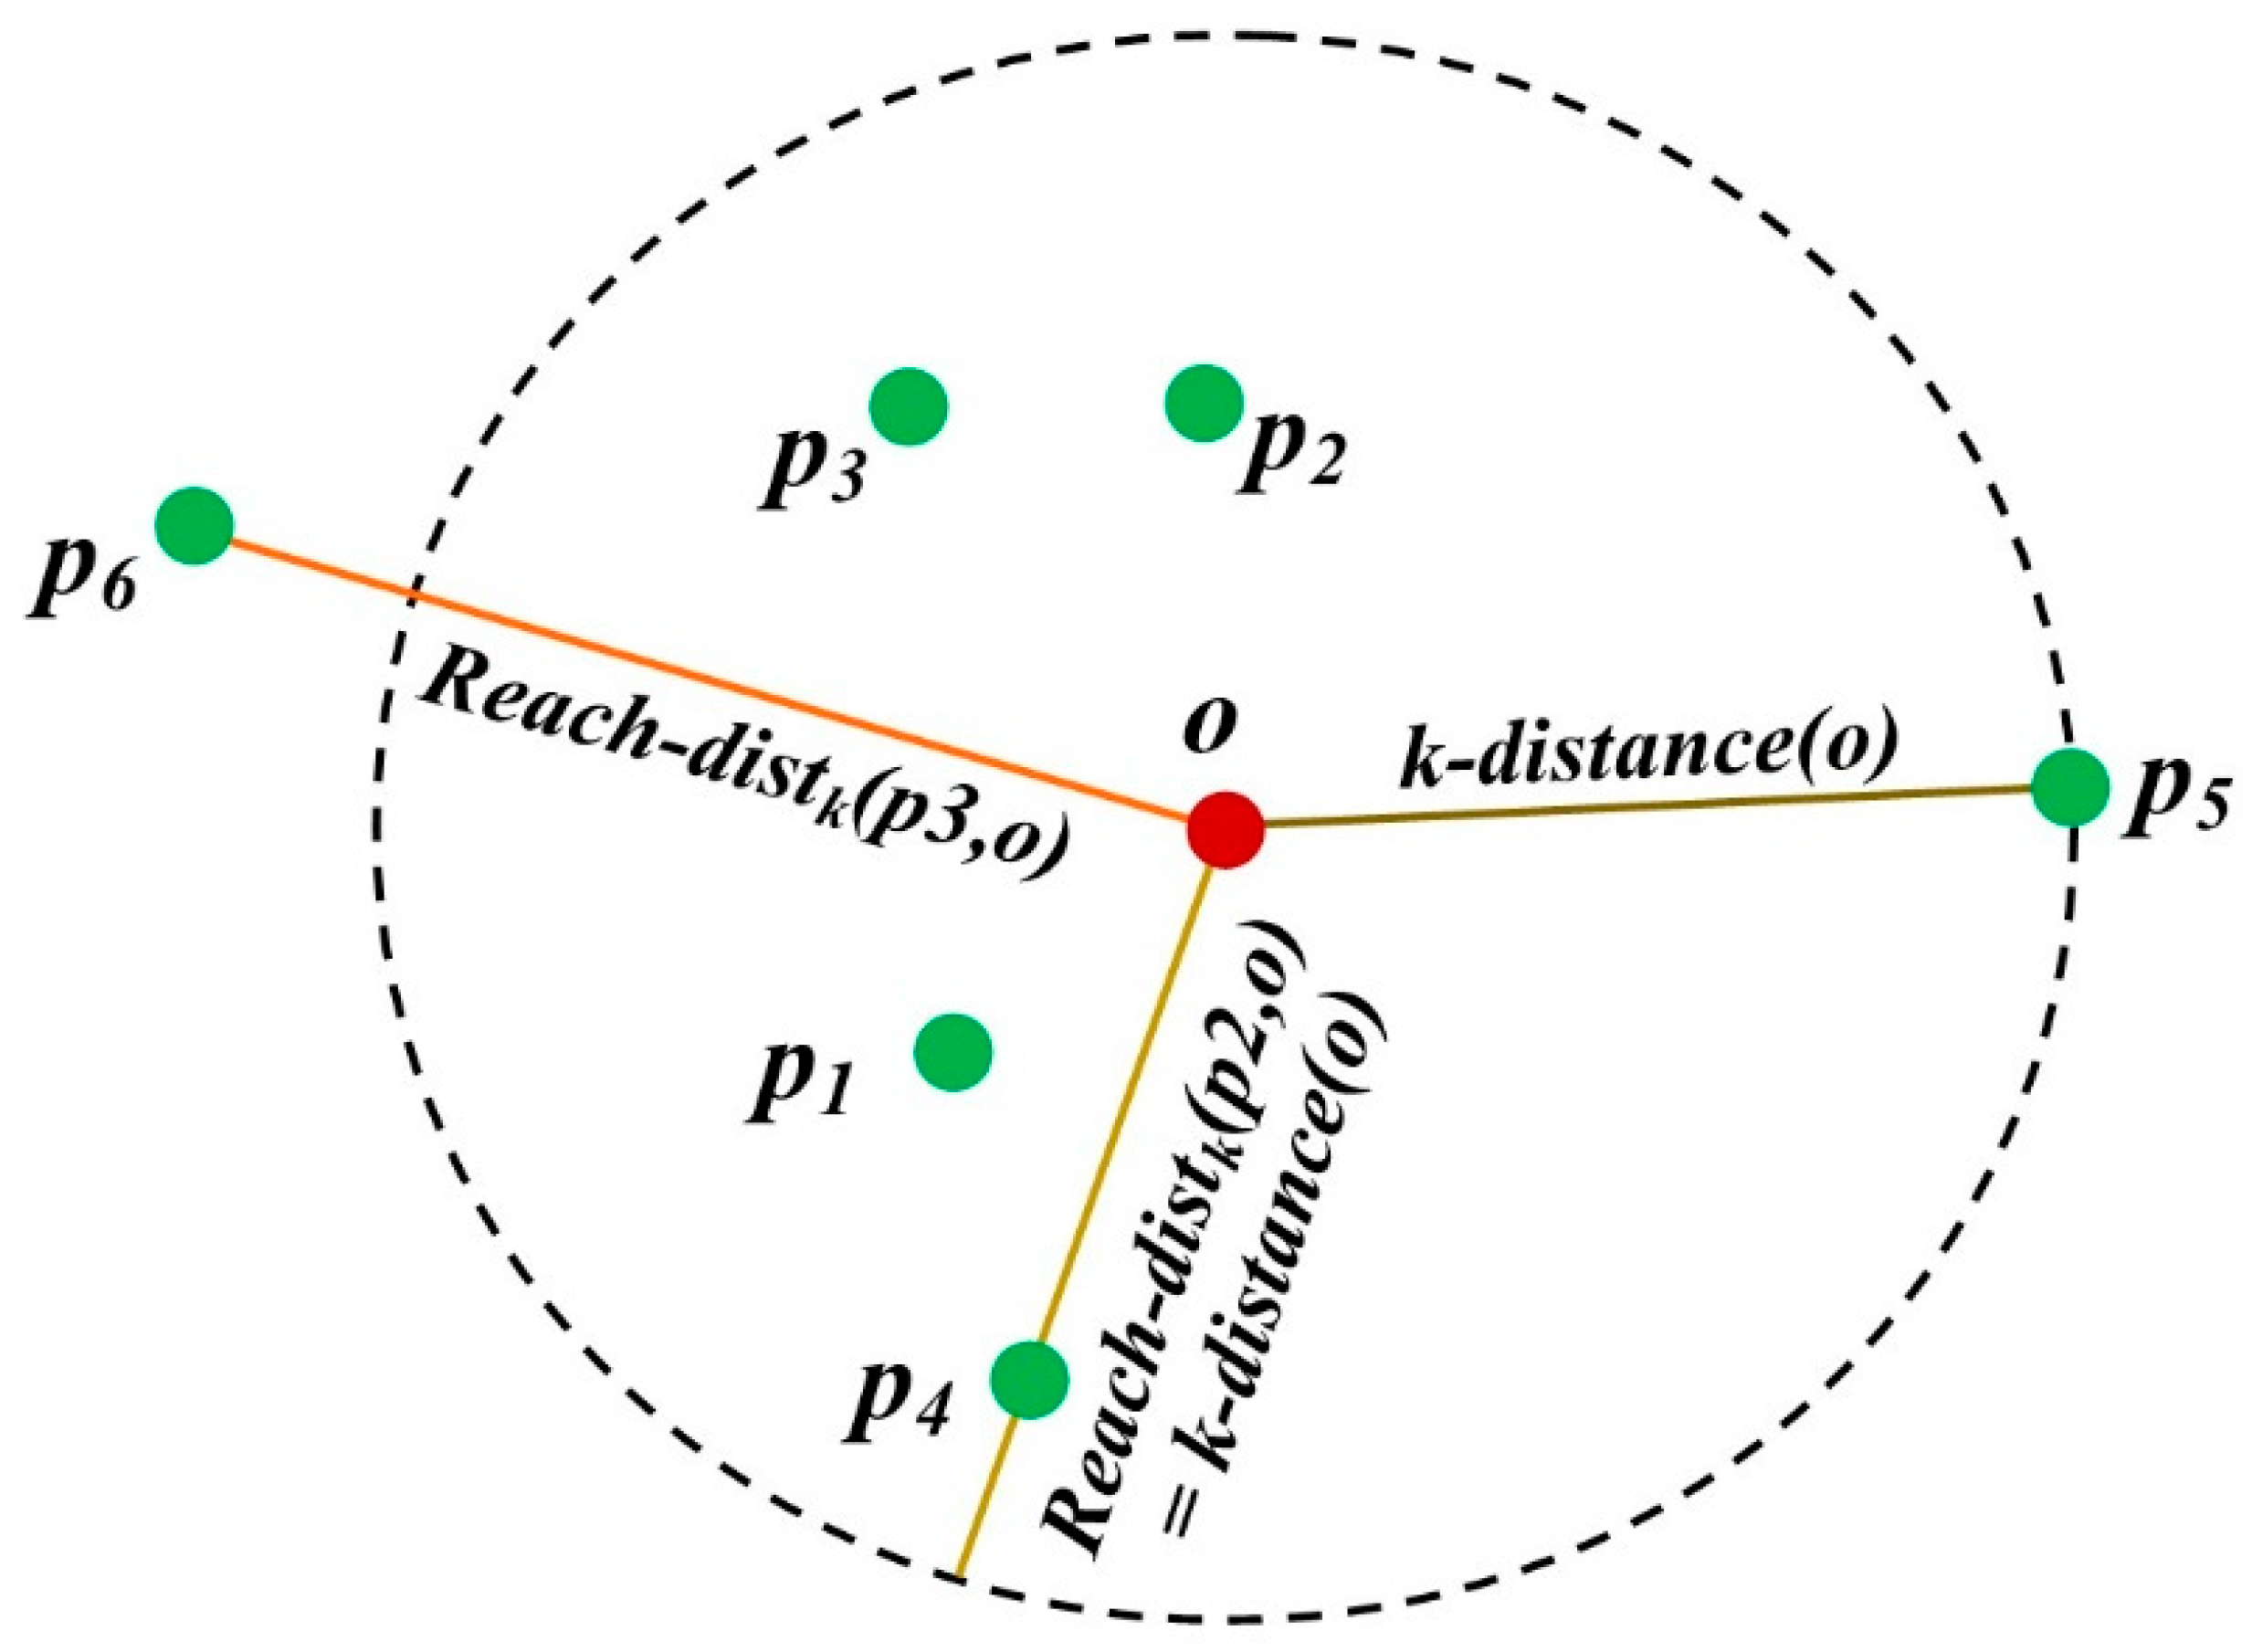
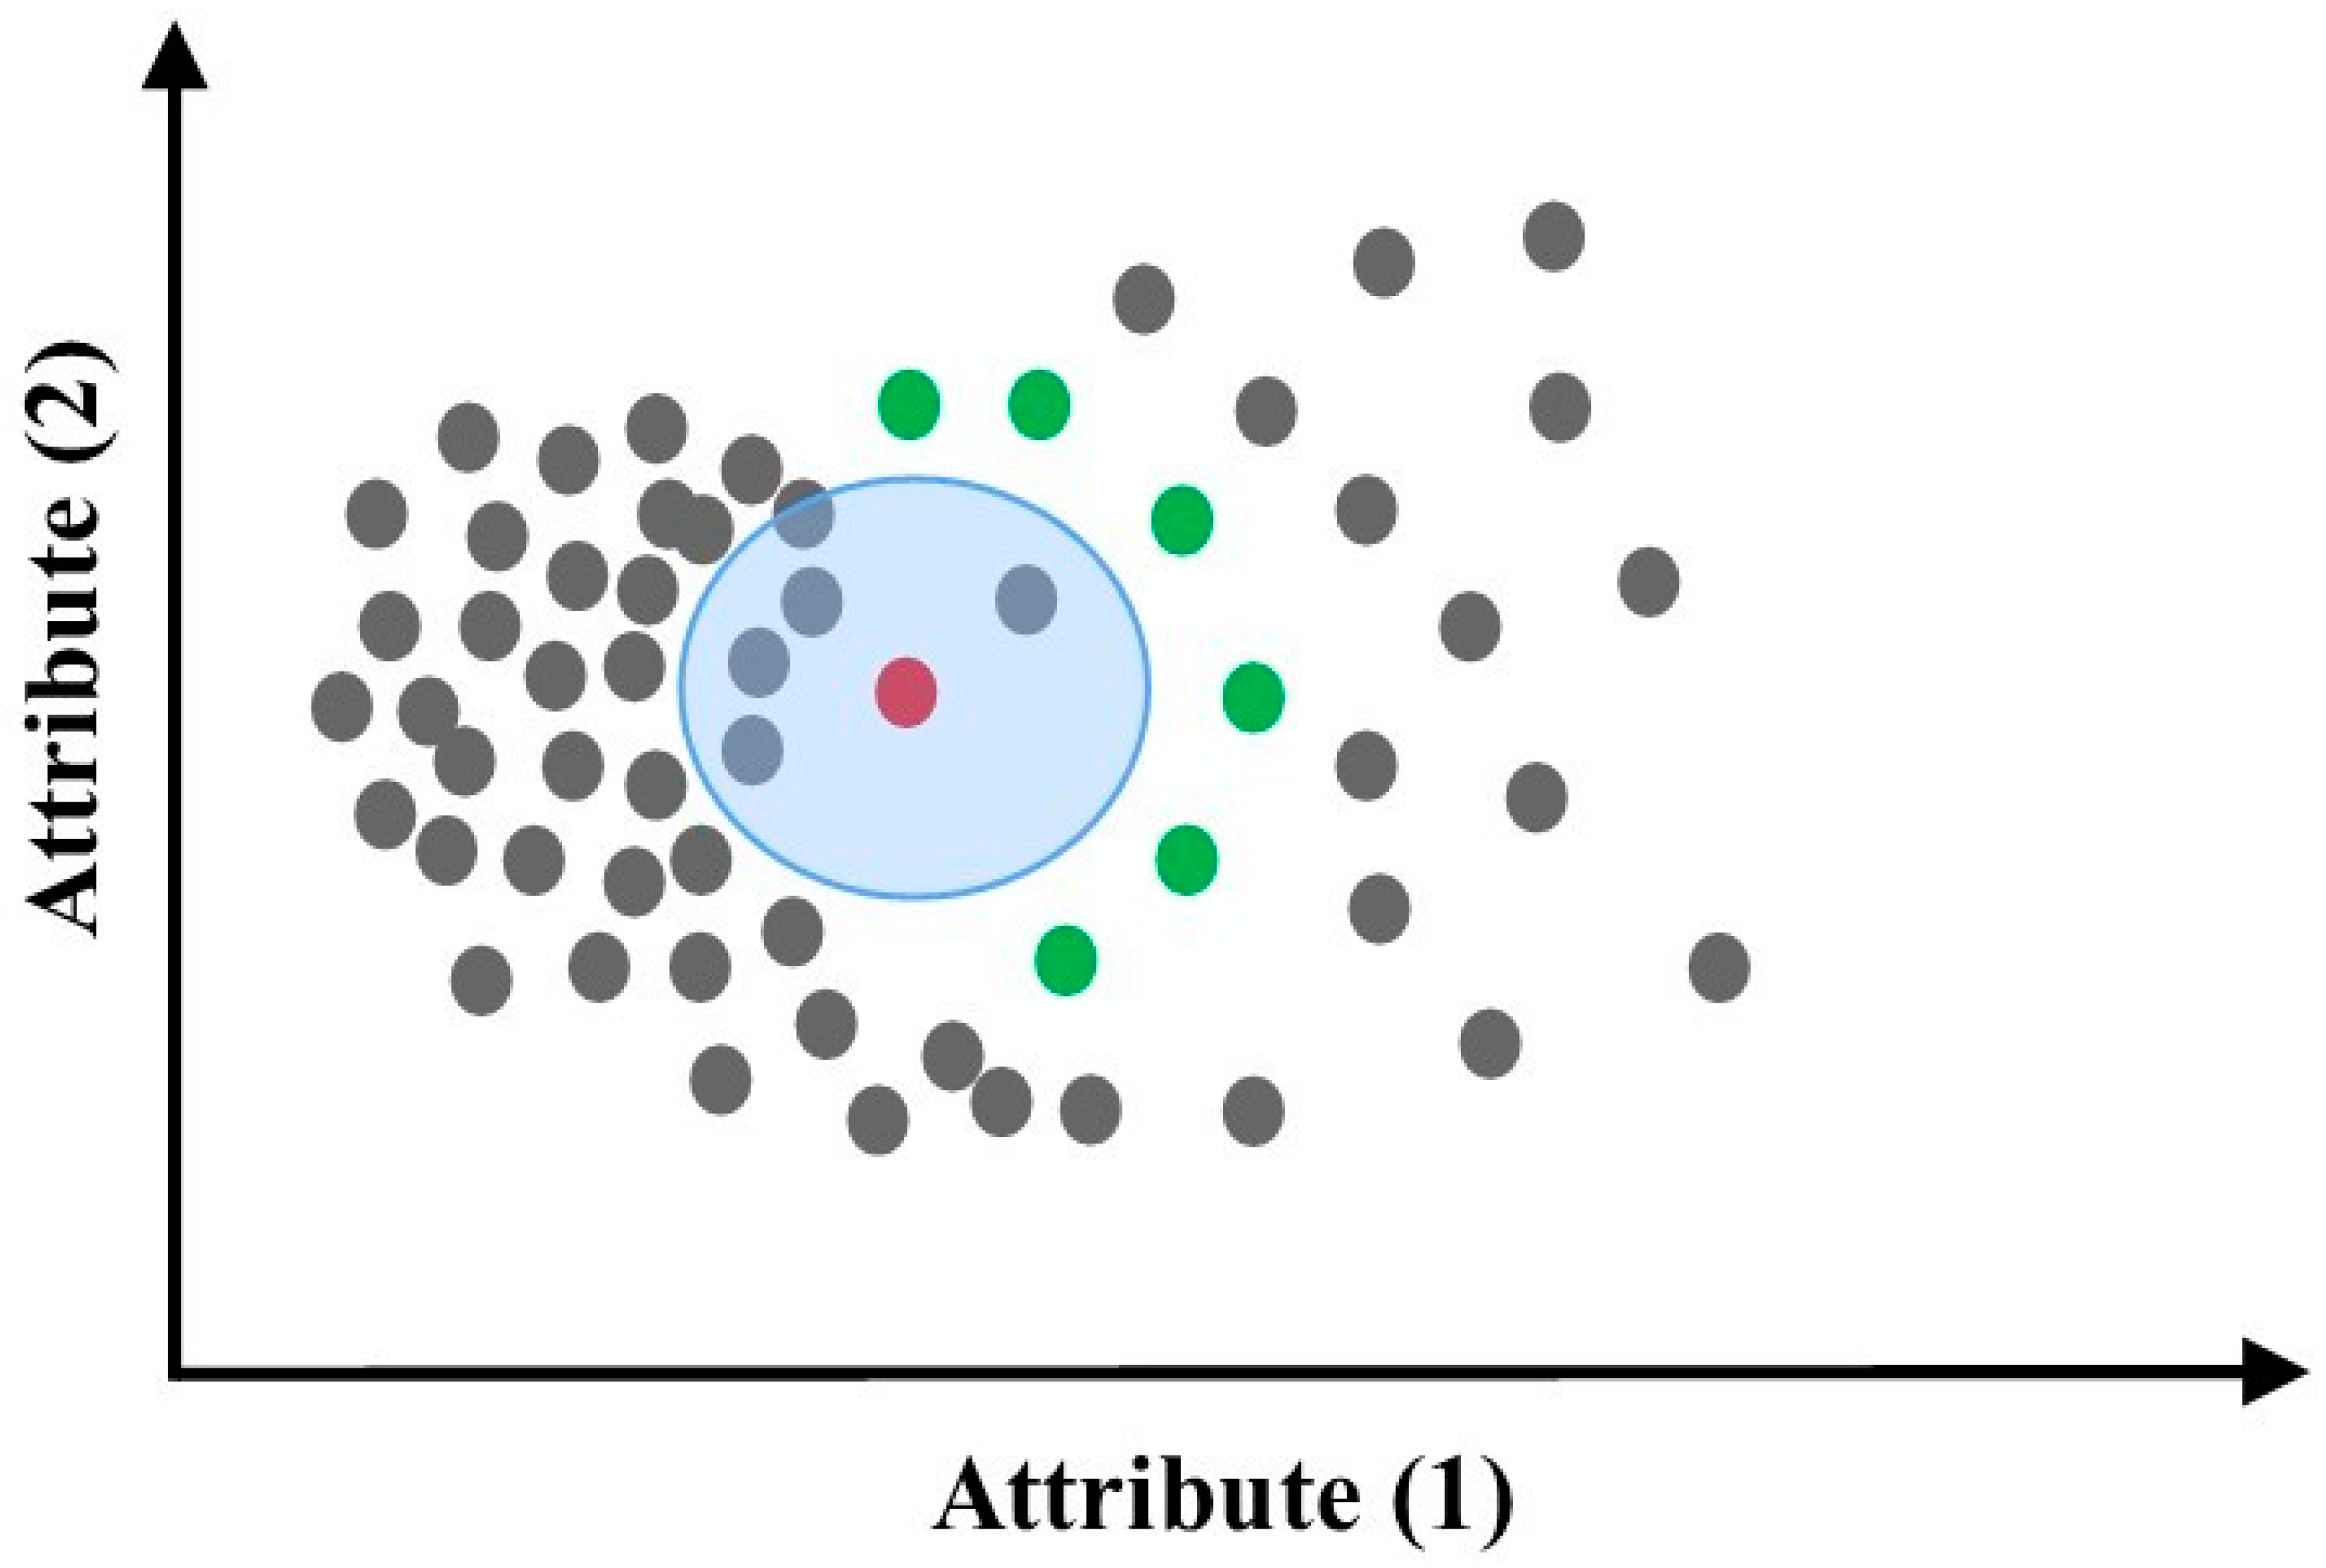
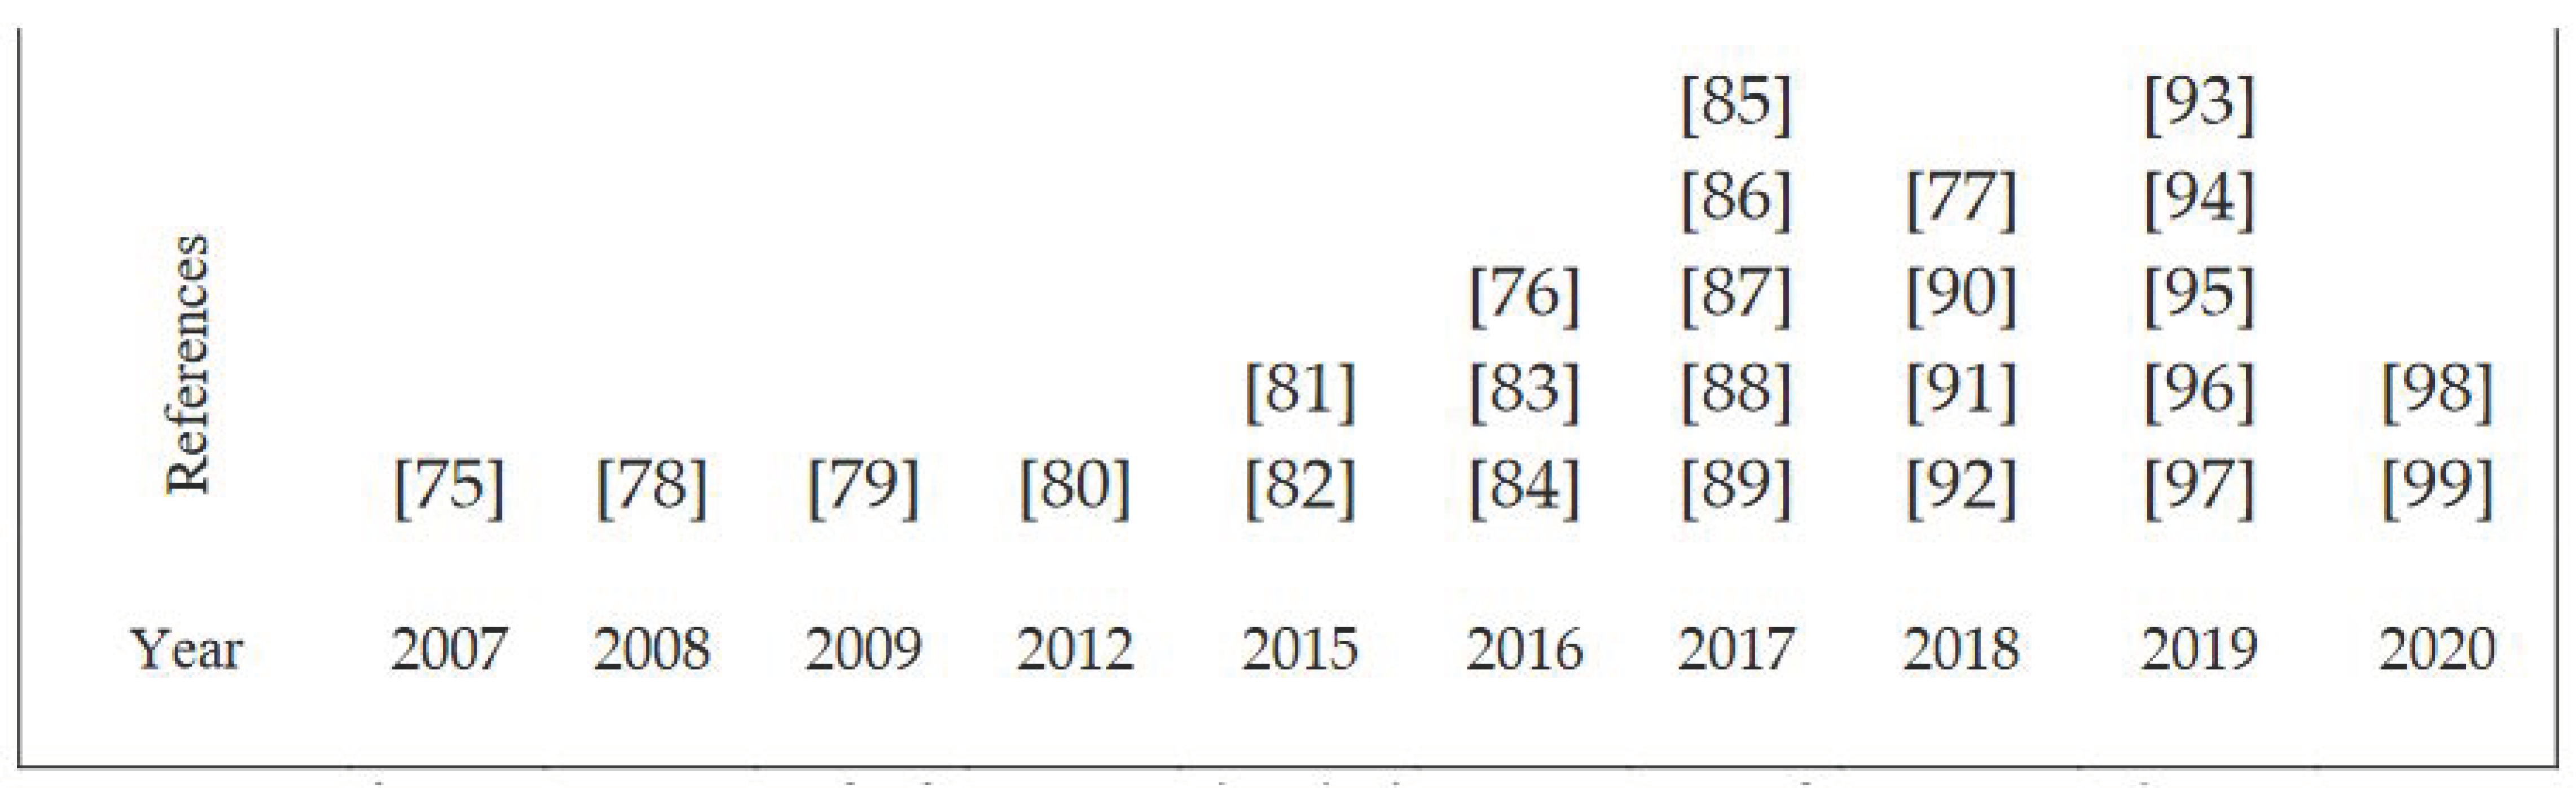
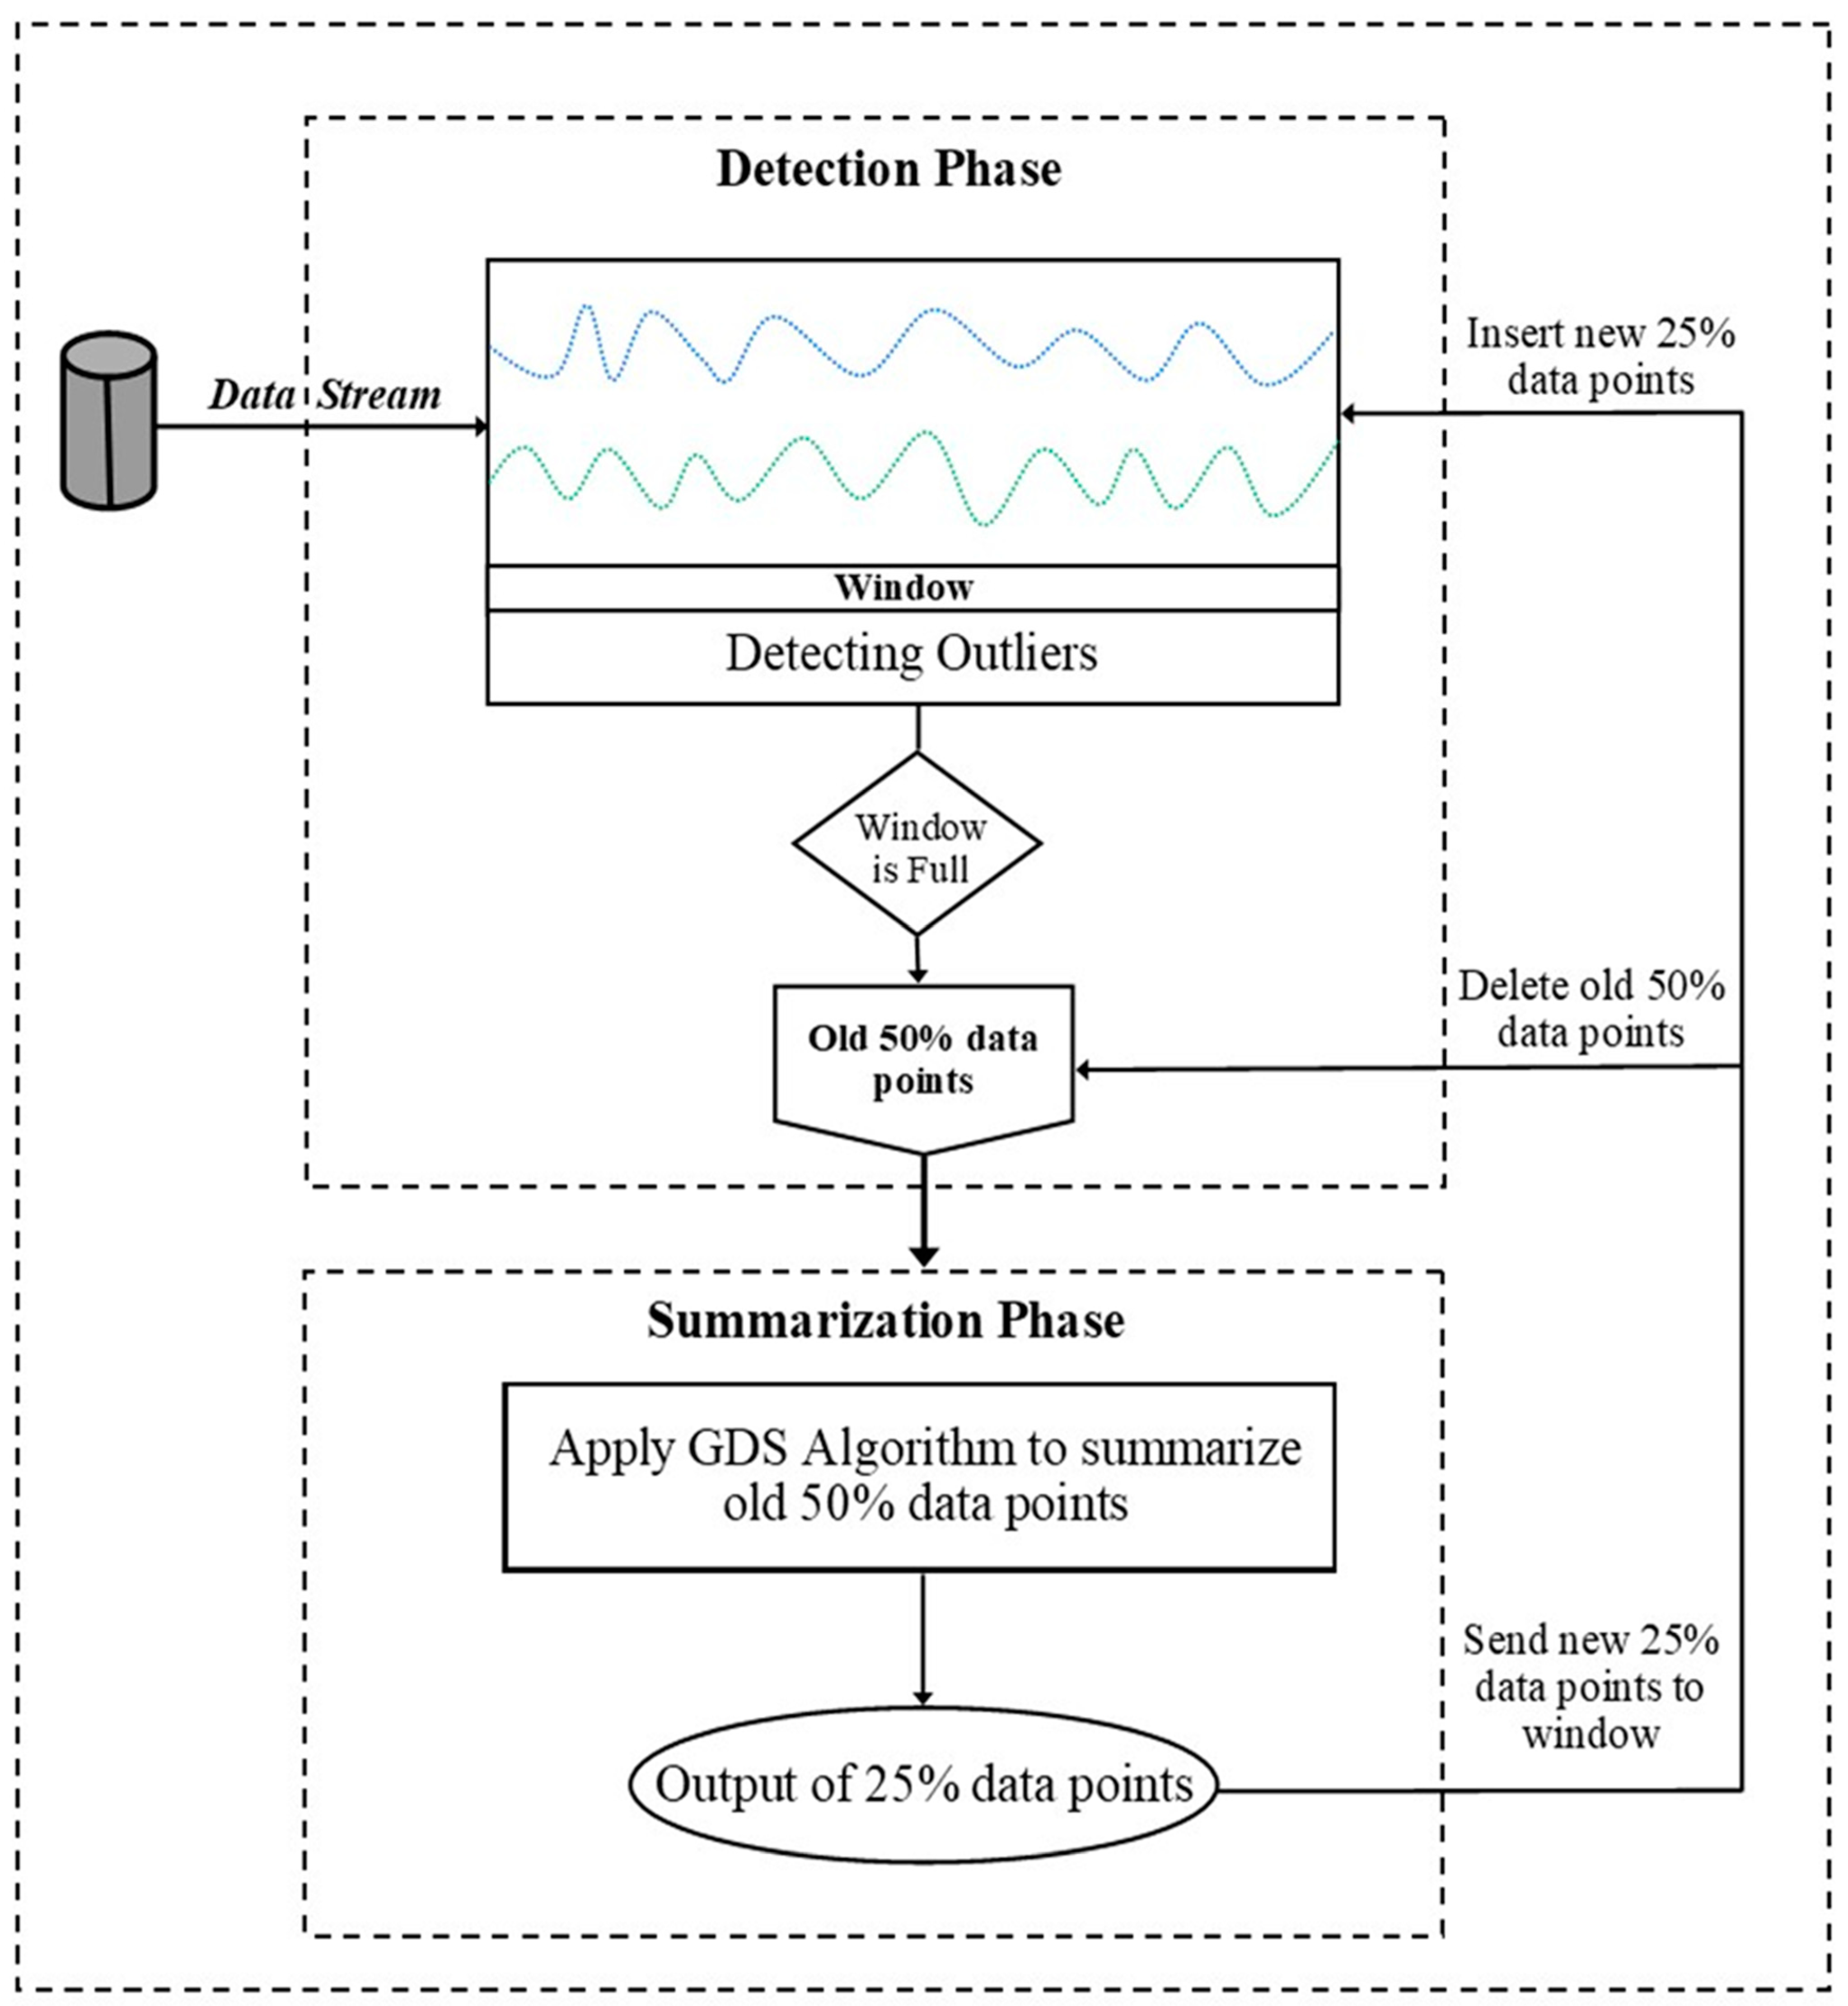
Table 1.
Summary of the most-cited local outlier algorithms in a static environment.
| Authors and Year | Algorithm | Features | Time Complexity | Taxonomy | Remarks |
|---|---|---|---|---|---|
| Breunig et al., 2000 [53] | LOF | Better in spherical data | O(n2) | Nearest neighbor based | Introduced local outlier detection, and it uses Euclidian distance and kNN to estimate local density. |
| Tang et al., 2002 [54] | COF | Better in linear data | O(n2) | Nearest neighbor based | Overcomes the linear distribution and it uses the chaining distance to find the local outlier. |
| Papadimitriou et al., 2003 [55] | LOCI | Presumes “half-Gaussian” distribution of quantity of data points density in the neighbors | O(n3) | Nearest neighbor based | Uses the same process as LoOP; the difference is the amount of instance is used rather than the distance. Long computation time but does not need parameters. |
| Papadimitriou et al., 2003 [55] | aLOCI | Uses the quad trees to speed up counts | O(NLdg + NL(dg + 2d)) | Nearest neighbor based | Simple approximation of density based on occupancy and depth. Overcomes the high time complexity in LOCI. |
| He et al., 2003 [56] | CBLOF | Uses a heuristic procedure for small and large clusters | O(n2) | Clustering-based | Many parameters. Ineffective in detecting the local outliers. It takes into consideration the local variation of clusters. |
| Jin et al., 2006 [57] | INFLO | Reversing the data point’s nearest neighbors | O(n2) | Nearest neighbor based | Overcomes the issue of the data points within the boundaries of the clusters. Effective for data points that include clusters with diverse densities. |
| Kriegel et al., 2009 [58] | LoOP | Presumes “half-Gaussian” distribution of distances | O(n2) | Nearest neighbor based | Estimates the local density by probabilistic set distance. Combines probability and statically approaches to provide outlier score. |
| Amer et al., 2012 [59] | LDCOF | Estimates the clusters’ densities. Spherical distribution is presumed for the cluster members | O(n2) | Clustering-based | Many parameters. Effective in detecting the local outliers. The threshold is included to determine whether or not the points are outliers. |
Table 2.
Previous works summary for LOF in a stream environment.
| Authors and Year | Algorithm | Method | Window Form | Time Complexity | S. Technique | Remark | |
|---|---|---|---|---|---|---|---|
| Opt | Clus | ||||||
| Pokrajac et al., 2007 [75] | ILOF | Updating data when new data point np is inserted. | Landmarkwindow | O(N log N) | Need to store all data points in the memory, which requires high memory complexity and high time complexity. | ||
| Salehi et al., 2016 [76] | MILOF | Summarizing the data by using k-means. | SlidingWindow | O(N log Ws) | ✓ | Summarized data points using k-means which cannot preserve the density of data and addressed the issue of high time complexity in ILOF. | |
| Na et al., 2018 [77] | DILOF | Summarizing the data by using gradient descent. | SlidingWindow | O(N Ws) | ✓ | Summarized data points using gradient descent. Addressed the issues of preserving the density of data points in MILOF. In contrast, it might be stuck in the local minima. | |
Note: Summarization (S), Optimization (Opt), Clustering (Clus).
Publisher’s Note: MDPI stays neutral with regard to jurisdictional claims in published maps and institutional affiliations. |
© 2020 by the authors. Licensee MDPI, Basel, Switzerland. This article is an open access article distributed under the terms and conditions of the Creative Commons Attribution (CC BY) license (http://creativecommons.org/licenses/by/4.0/).
Share and Cite
MDPI and ACS Style
Alghushairy, O.; Alsini, R.; Soule, T.; Ma, X. A Review of Local Outlier Factor Algorithms for Outlier Detection in Big Data Streams. Big Data Cogn. Comput. 2021, 5, 1. https://0-doi-org.brum.beds.ac.uk/10.3390/bdcc5010001
AMA Style
Alghushairy O, Alsini R, Soule T, Ma X. A Review of Local Outlier Factor Algorithms for Outlier Detection in Big Data Streams. Big Data and Cognitive Computing. 2021; 5(1):1. https://0-doi-org.brum.beds.ac.uk/10.3390/bdcc5010001
Chicago/Turabian StyleAlghushairy, Omar, Raed Alsini, Terence Soule, and Xiaogang Ma. 2021. "A Review of Local Outlier Factor Algorithms for Outlier Detection in Big Data Streams" Big Data and Cognitive Computing 5, no. 1: 1. https://0-doi-org.brum.beds.ac.uk/10.3390/bdcc5010001