1. Introduction
Virtual Reality (VR) has been used extensively for education and training [
1]. VR practitioners have developed educational VR environments for knowledge acquisition, such as learning about geometry [
2], World War I [
3], and how to inspect a haul truck [
4]. VR has also been used for training psychomotor skills, such as how to visually scan for threats [
5], use measurement tools [
6], and put on personal protective equipment [
7]. As consumer VR systems have become more easily available, these educational uses of VR have gained more attention [
8].
The field of Intelligent Tutoring Systems (ITSs) is closely related to VR training and education. The goal of an ITS is to develop a deep understanding of each learner’s behavior to allow for intelligent engagement in sustained learning activities [
9]. While much work in the field of ITSs is focused on immediate knowledge, some research has made strides towards attempting to understand and predict longer-term retention of information, which is a better indicator of mastery than short-term retention [
10]. ITSs incorporate Artificial Intelligence (AI) techniques to allow for tutoring systems that know “what they teach, who they teach, and how to teach it” through user models [
11]. ITSs can use these user models to provide adaptive support for learners because they provide a representation of the learner in terms of relevant traits like learning behaviors and meta-cognitive ability [
12]. This adaptive support can be implemented via proactive guidance (
scaffolding) or reactive guidance (
feedback) [
13]. Most ITSs that create adaptive learning environments employ feedback [
13], which is usually implemented with static rules for specific types of detected errors [
14].
In this paper, we investigate using a machine learning (ML) approach to classify users of a VR training application into groups of low and high learning and retention outcomes, expanding upon our previous work which only sought to predict learning outcomes [
15]. Our work in this paper makes use only of the head-mounted display (HMD) and handheld controller tracking data, as opposed to events or errors [
14], which makes our approach viable for real-time scaffolding, before events or errors even occur. Unlike most prior approaches that are only capable of feedback [
13], this tracking-based ML approach can potentially be used for both feedback and scaffolding, such as providing interaction cues [
16], guiding the user’s attention [
17], or even simplifying the interactions [
18]. Our work explores using HMD and controller tracking data as a means for predicting knowledge acquisition, knowledge retention, and performance retention.
After discussing related work, we present a user study in which participants used a VR training application to learn the procedure for troubleshooting a surgical robot [
19], then returned a week later to perform this task again in VR. Participants were administered a knowledge test after the initial training session and before the week-later retention session to evaluate knowledge acquisition and retention, respectively. Errors were tracked in the retention simulation to evaluate performance retention. For each learning and retention outcome, we used the results to separate participants into two groups: high-performance participants scoring at least one standard deviation above the mean and low-performance participants (i.e., all remaining participants that did not score at least one standard deviation above the mean).
We then present the results of an ML experiment that employed support-vector machines (SVMs) [
20] to predict which group each participant belonged to, based on their tracking data. For the experiment, we compared six different sets of input features based whether the data represented positions or velocities and three different combinations of HMD and controller data: (a) linear-and-angular features for both the HMD and controllers, (b) linear-and-angular features for the HMD and linear-only features for the controllers, and (c) linear-only features for both the HMD and controllers. We compared the accuracy (i.e., correctness of the prediction) and the Matthews correlation coefficient (MCC) (i.e., a measure of the quality of binary classifications [
21]) of each model learned from these six different sets of input features. For the feature representations, we applied Principal Component Analysis (PCA) [
22]. The results of our ML experiment indicate that this approach can yield high degrees of accuracy for predicting learning and retention outcomes, with our maximum observed overall accuracy at 96.7%. However, we note varying accuracy across our different input features, which reinforces the usefulness of exploring these features as hyperparameters when building models for similar educational purposes.
In order to understand how the SVMs classified participants into their high and low-performance groups with such high degrees of accuracy, we have visually inspected tracking data segments that were correctly identified by the SVMs. Visualizations show that participants with high learning and retention outcomes moved with better economies of motion than those participants with lower outcomes. These results show that it is feasible to use HMD and controller tracking data to develop new real-time scaffolding and feedback techniques for VR training applications. We anticipate that our work will be useful in the development of systems that predict learning and retention outcomes, and subsequently respond dynamically when learning can be improved. Such systems may make use of real-time classifiers to provide scaffolding and feedback that better support the user’s learning. In this paper, we present the following research activities:
A study that collected VR tracking data and results pertaining to knowledge acquisition, knowledge retention, and VR-based performance retention from 60 participants across two VR training sessions, separated by one week.
An ML experiment investigating six sets of input features for predicting the three different outcomes. This is the first such experiment to investigate both learning and retention, particularly psychomotor retention.
We also present the following research results:
Our results indicate that our velocity-based ML models generally outperformed our position-based models for predicting all three outcomes.
Our results also indicate that VR tracking data can be better used to predict psychomotor-based outcomes than cognitive-based outcomes.
3. VR Learning and Retention User Study
We made use of an existing VR application designed for training first assistants how to troubleshoot a faulted arm on a surgical robot [
19]. This robotic operating room (OR) application makes use of virtual hand-based selections and manipulations [
32,
33] to support multiple equipment interactions, as well as communicating with a virtual surgeon and staff member by selecting dialog options. In order to complete the scenario, the user must perform an ordered set of steps involving these interactions while moving around the virtual OR by physically walking [
34] and periodically looking at a vision cart screen.
Table 2 shows a list of these subtasks and the types of interactions that they require.
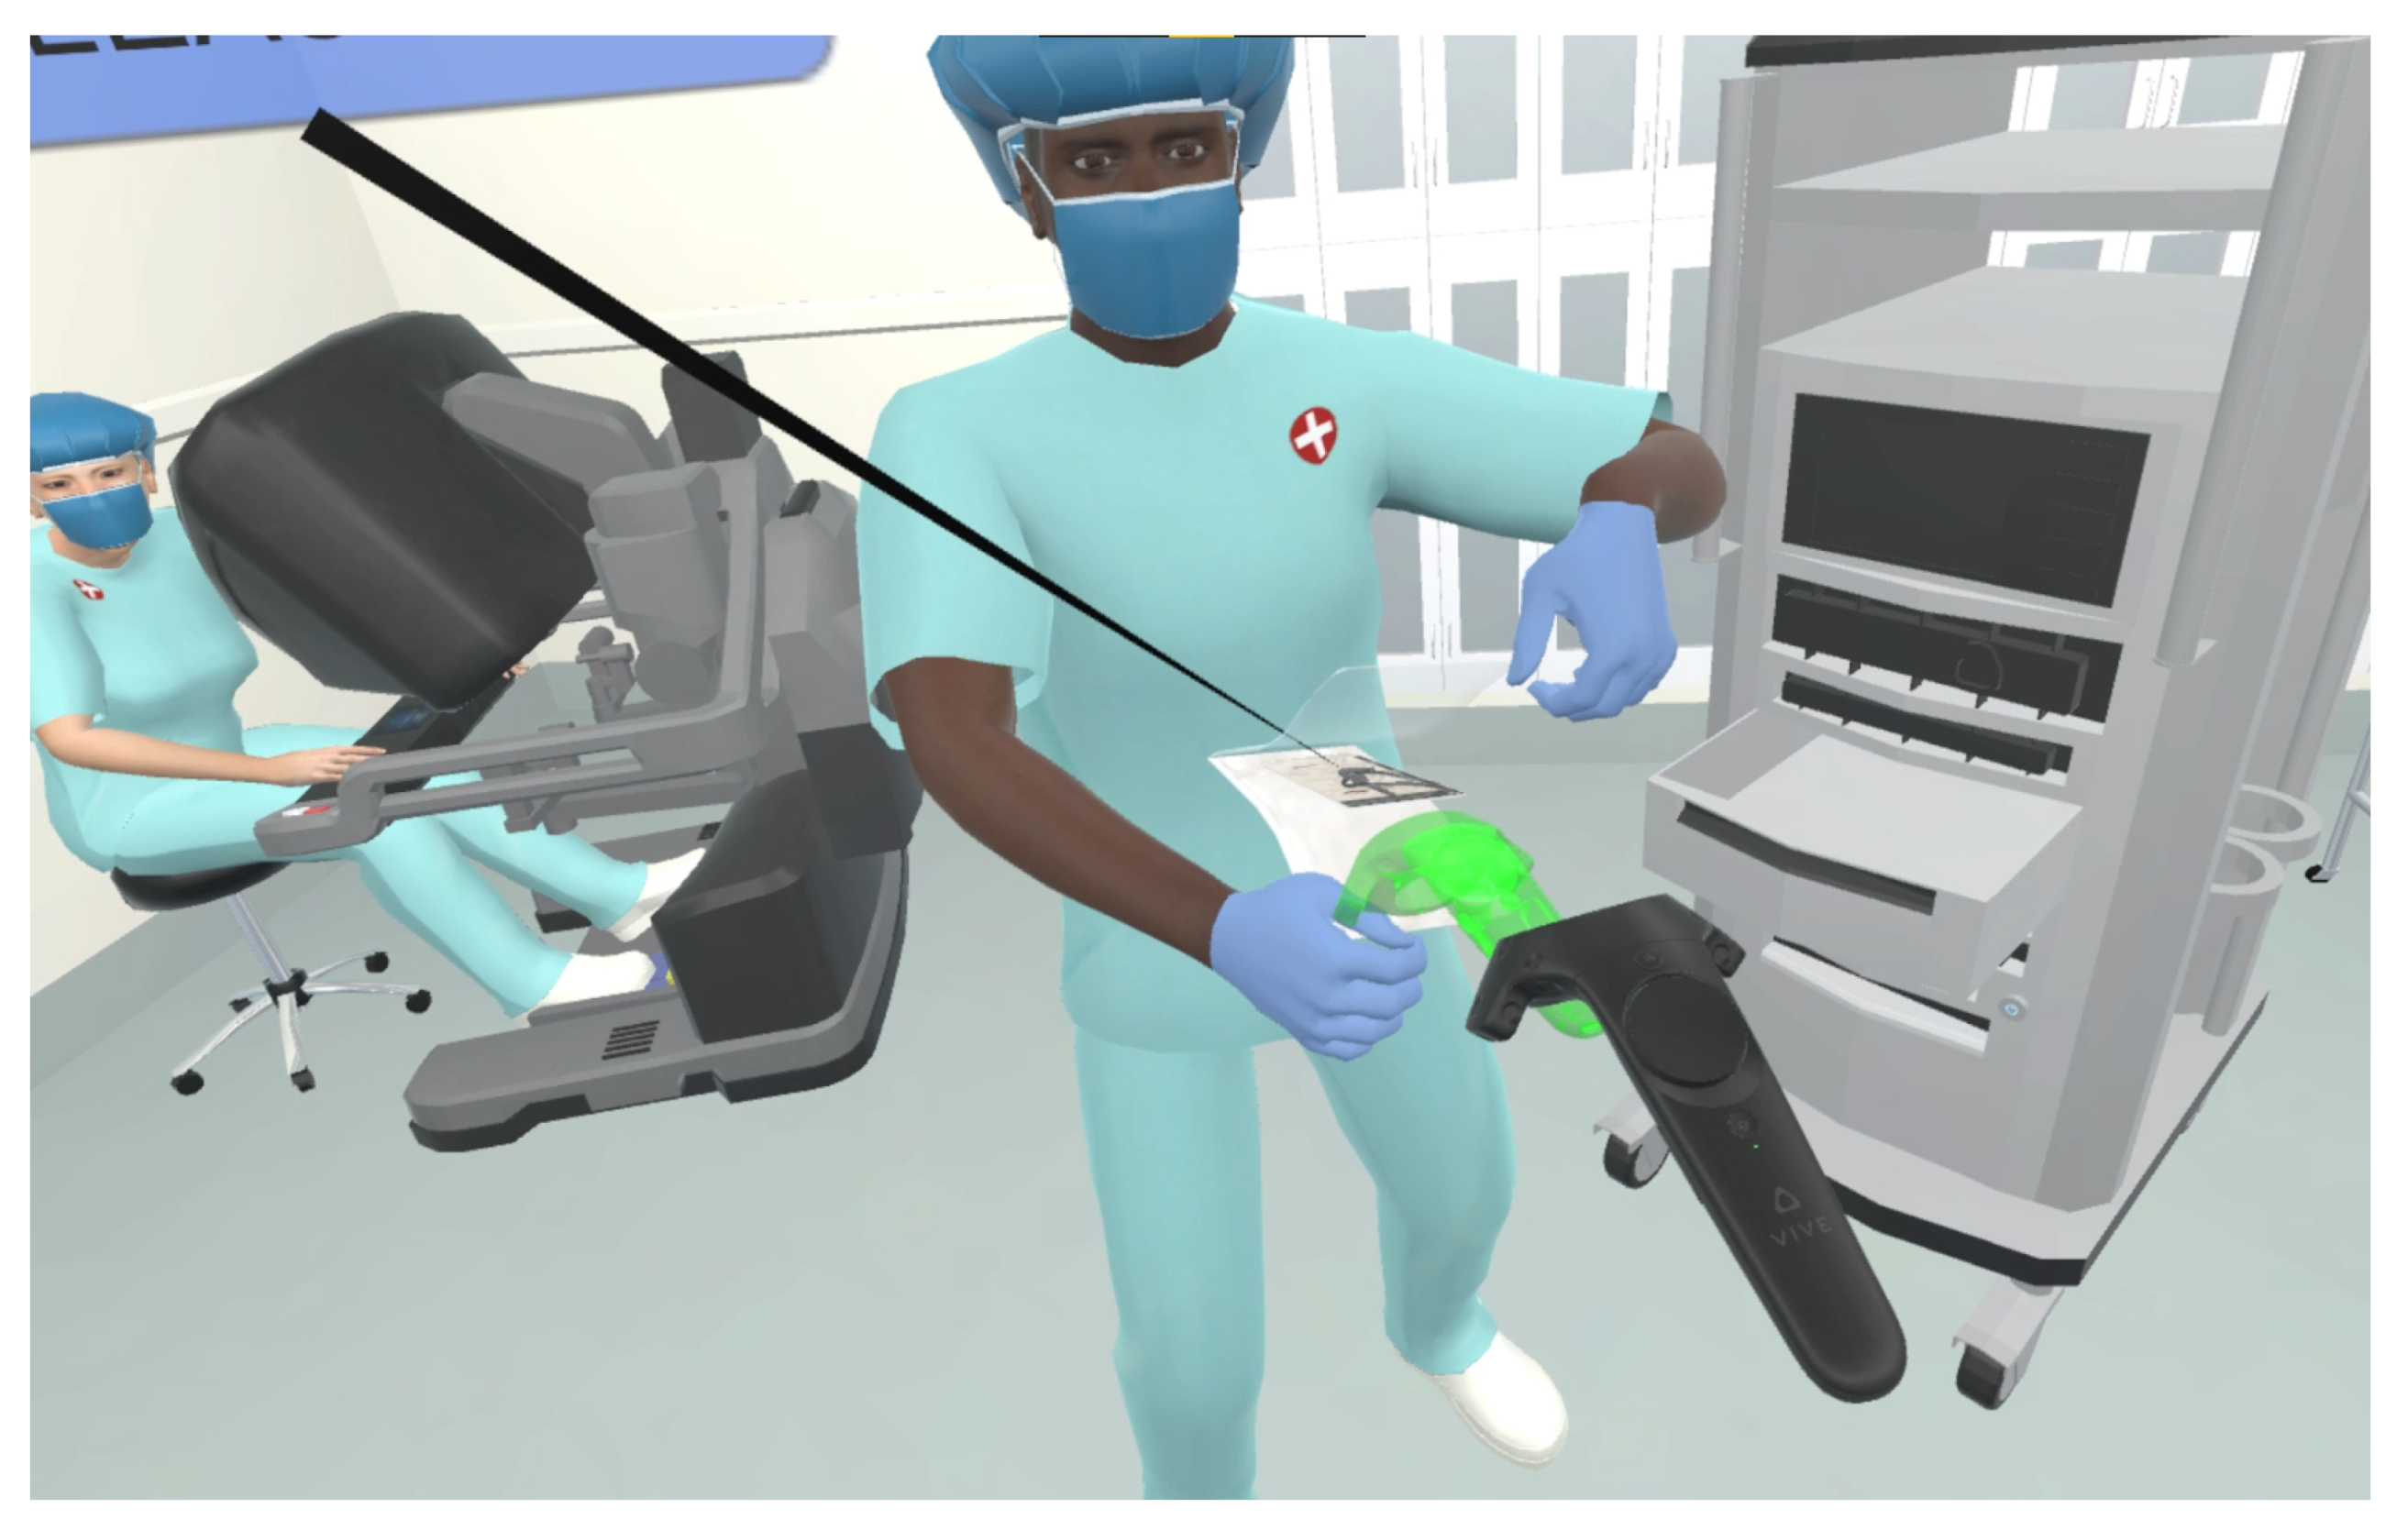
We slightly varied the virtual training application between the learning and retention sessions. During the learning session, it provided interaction cues, which convey actions to take [
35], for each step. These interaction cues consisted of verbal instructions and visual animations showing perceived affordances and feedforward information. Selection cues used semi-transparent green controller models that continuously linearly interpolated from the user’s controller to the target dialog option or object to be selected (see
Figure 1). Manipulation cues used semi-transparent green copies of the objects being manipulated and linearly interpolated these copies to the target positions for the manipulations. Finally, for travel cues, these animations consisted of semi-transparent green boots that linearly interpolated from the user’s position to a icon representing the travel destination that read “Stand Here”.
In the learning version of our VR training application, the interaction cues described were preemptively presented to the users, in order to demonstrate and train how to perform the troubleshooting task. However, for the retention-session version, these cues were not presented, unless the user committed an error or was inactive for 30 s.
3.1. Materials
The VR hardware for this study was HTC Vive system, consisting of an HMD and two handheld controllers, which were used to interact with the VR training application. The display of the Vive HMD has a resolution of pixels per eye, a 90 Hz refresh rate, and affords a 110° diagonal field of view (FOV). We fitted the HMD with the Vive audio strap that integrates over-the-ear headphones. The VR application maintained 90 frames per second to match the Vive’s refresh rate and was developed in Unity. The input data from the Vive was processed with the SteamVR plugin. For every frame in the VR training application, the HMD and controller tracking data was logged. This data consisted of the global positions and quaternions of both the HMD and the controllers, as well as the frame’s timestamp.
3.2. Procedure
The following procedure was reviewed and approved by the University of Texas at Dallas Institutional Review Board (IRB).
The human subjects study consisted of one learning and one retention session for each participant. The duration of the sessions was approximately 60 min for the learning session and 30 min for the retention session. The retention session occurred one week after the learning session.
Participants first gave informed consent, then the learning session began with a background survey on the demographics, education, and technology experience of the participant. To train the participant on how to use the HTC Vive, the experimenter would help the participant put on the HMD and run the SteamVR tutorial. After this, the experimenter would then run the participant through the VR training application. Once the participant finished, they were then administered a number of questionnaires regarding their VR experience. Finally, participants were administered a knowledge test consisting of multiple-choice questions pertaining to the training scenario.
One week later (restricted to the same day of the week to avoid confounds), a participant would begin the retention session with the experimenter administering the same knowledge test to measure knowledge retention. After completing the test, the experimenter would help the participant to put on the HTC Vive, and the participant would then experience the retention version of the VR application. After completing the retention application, the participant was given a free-response exit survey and compensated $15 USD.
3.3. Participants
A total of 61 participants were recruited through university mailing lists and completed the initial training session. However, one participant did not return to complete the retention session. Thus, our data consists of 60 participants (11 females, 49 males). None of our participants had prior knowledge of or experience with surgical robots or the training task. The mean age of the participants was 22.6 ± 4.2 years.
4. Machine Learning Experiments
In this section, we discuss the learning and retention outcomes, experimental design, input features, input feature representation, hyperparameters, and scoring method.
4.1. Learning and Retention Outcomes
For this research, we are concerned with three learning and retention outcomes: Knowledge Acquisition, Knowledge Retention, and Performance Retention. We measure Knowledge Acquisition and Knowledge Retention with the knowledge tests that were administered at the end of the learning session and beginning of the retention session, respectively. We measure Performance Retention by tracking errors and completion time at the subtask level. If participants made no errors and completed a subtask within 30 s (i.e., the period of inactivity allowed before an interaction cue was presented), they are regarded as having successfully completed that subtask. In order to predict these different outcomes in a consistent way, we choose to implement a similar approach to that by Moore et al. [
15]. For each outcome factor, we fit a Gaussian distribution to the observed scores, then classify all scores one standard deviation above the mean as high performance, and all others as low performance. These splits are described in
Table 3.
4.2. Experimental Design
In order to evaluate the performance of our models, we conduct an exhaustive grid-search with four-fold, participant-level cross-validation across all hyperparameter options. This is performed by first segmenting our data into an 80/20 train/test split for later evaluation. On the training data, we create four approximately equal partitions to iteratively train on three of the partitions and evaluate on the fourth, retaining the average score for comparison against other hyperparameter configurations. We then select the configuration with the highest average score, train on the entirety of the training data, and then test on both the training and testing data, separately and overall.
4.3. Input Features
Our data consists of the position and rotation of the tracked HMD and handheld controllers at a rate of 90 Hz, the frame rate of the training application. We encode this tracking data in the form of a three-value vector for position and a four-value quaternion for rotation. To mitigate possible noise introduced by including the rotation data, we compare three sets of position and rotation data: (a) linear-and-angular features for both the HMD and controllers, (b) linear-and-angular features for the HMD and linear-only features for the controllers, and (c) linear-only features for both the HMD and controllers. Because of recent success seen in making use of velocity rather than position for predicting success [
15,
36], we also look at the linear and angular velocities derived from the position and rotation data, thus resulting in six total conditions for each evaluation metric.
4.4. Input Feature Representation
In our analysis, we take the 90 Hz data and use a sliding window approach to chunk it into spans that are more meaningful than an instant of data. This window is made by selecting a time span for the segment length, and another for the shift size. Depending on these parameters, there can be a significant amount of overlap between subsequent windows. The frames of data within a window are concatenated to create a high-dimensional vector that encodes the information. These vectors are then processed with Principal Component Analysis (PCA) to extract salient features. This process greatly reduces the amount of data and forms the input vectors used for training our models.
4.5. Hyperparameters
We consider several hyperparameters for both the representation of the input and the support vector machine (SVM). The six described options for Input Feature Representation can be regarded as hyperparameters within an evaluation metric prediction. However, in this paper, we will treat them as separate experiments as we are interested in discussing the differences in their performance. The sliding window approach for chunking our data is determined by two hyperparameters: the segment length and shift size. The PCA feature extraction also has a hyperparameter for determining the number of features extracted. Finally, the SVM that we use in our methodology has two hyperparameters: penalty and expressivity. The range of values that we explore for these five hyperparameters are shown in
Table 4.
4.6. Scoring Method
We fit SVMs [
20] with Gaussian kernels to the featurized data. The resulting linear separator will yield a classification of low or high for each window segment. One possible way to extend the segment classification to an entire user is to determine the user’s label by majority vote over the predicted labels of the user’s velocity segments. This approach is reasonable, but doesn’t accommodate well for cases where several vectors are incorrectly classified with low confidence. Thus, we weight each vote based on its distance from the decision boundary.
Let
and
denote the predicted label and corresponding distance for the
ith segment of participant
p. We define the participant-level confidence that
p belongs to class
c as:
where
N is the number of segments that belong to participant
p. Then, the predicted label of the user is determined by selecting the class
c that maximizes the confidence.
5. Machine Learning Results
In this section, we will detail the results of our ML experiments across our learning metrics. We choose to analyze the performance of each model in terms of the Matthews correlation coefficient (MCC) score. This value is a special case of Pearson’s correlation coefficient for two categories and is valued from -1 (full counter-correlation) to 1 (full correlation). Unlike metrics such as accuracy, MCC takes into account the relative size of each category when assigning a score, thus balancing the weight of disparately sized categories [
21]. This is particularly useful for our experiments in which the relative category sizes have approximately a 5:1 ratio of low-performance to high-performance participants.
5.1. Knowledge Acquisition Results
Table 5 shows the full results of our Knowledge Acquisition experiment. First, it is clear from the discrepancies in high-performance accuracy between the training (High Acc = 1.000) and testing (High Acc = 0.000) datasets and the MCC scores for the testing data (MCC =
) that the first and third sets of input features, both position-based, suffered from overfitting the high-performance training data. Similarly, the sixth set, the velocity-based, linear-only input features set, also suffered from overfitting the high-performance training data, resulting in a low MCC score (MCC = 0.000).
Interestingly, the two best performing models were the second and fifth sets of input features (i.e., the position-based and velocity-based linear-and-angular HMD features and linear-only controller features, respectively). The velocity-based fifth set yielded the best test MCC of 0.674 and a better overall accuracy of 0.833 than the position-based second set, which yielded a test MCC of 0.400 and an overall accuracy of 0.783. This position-based second set was more conservative in identifying low-performance participants in both the training (Low Acc = 0.725) and testing (Low Acc = 0.900) datasets than the velocity-based fifth set, which was more accurate for both training (Low Acc = 0.825) and testing (Low Acc = 1.000).
5.2. Knowledge Retention Results
Table 6 shows the complete results of our Knowledge Retention experiment. Unlike the Knowledge Acquisition experiment, there are no clear results indicating that any of the six models overfitted the training data for low- or high-performance outcomes. However, it is also the case that none of the six models performed as well on the Knowledge Retention results, as they performed on the Knowledge Acquisition results. For Knowledge Acquisition, five of the six models yielded overall MCC scores ranging from 0.493 to 0.674. However, for Knowledge Retention, the six models only yielded overall MCC scores ranging from 0.327 to 0.430. In terms of test MCC scores, two of the models, the first and third sets, yielded chance-like results (i.e., near zero MCC scores).
The best performing model for predicting Knowledge Retention was the fourth set of velocity-based, linear-and-angular HMD and controller input features. This model yielded the best overall MCC of 0.430 and the second best test MCC of 0.258, which would have dramatically improved had it identified both high-performance participants instead of just one (i.e., High Acc = 0.500). The sixth set of velocity-based, linear-only HMD and controller input features performed similarly with an overall MCC of 0.380 and the same test MCC of 0.258. Finally, the fifth set of velocity-based, linear-and-angular HMD and linear-only controller features performed well with an overall MCC of 0.327 and the best test MCC of 0.316. However, this model was overly generous with high-performance labels, particularly in the testing data (High Acc = 1.000), which yielded poor low-performance identification (Low Acc = 0.400).
5.3. Performance Retention Results
Table 7 shows the complete results of our Performance Retention experiment. Like the Knowledge Retention results, there are no clear results indicating that any of the six models overfitted the training data for low- or high-performance outcomes. However, unlike the Knowledge Retention results, the six models performed relatively well on the Performance Retention results, yielding overall MCC scores ranging from 0.341 to 0.869 and test MCC scores ranging from 0.258 to 0.529.
The best performing model for predicting Performance Retention in the VR training application was the sixth set of velocity-based, linear-only HMD and controller input features. It yielded the highest overall MCC score of 0.869 (with an overall accuracy of 0.967), and it yielded one of the top test MCC scores of 0.400, incorrectly predicting exactly one low-performance participant and one high-performance participant. The third and fourth sets of input features yielded the best test MCC scores of 0.529. However, these models were generous with high-performance labels in the testing data (High Acc = 1.000), which yielded conservative low-performance identification (Low Acc = 0.700).
6. Visual Inspection of Results
Given the highly accurate results of our ML experiments, we decided to conduct visual inspections of the motions of participants, in order to try and understand how the SVMs are classifying participants with such high degrees of accuracy. We use an approach similar to our recent work [
15], rendering the positions and high-velocity moments of the tracking data within the environment, in a top-down orthographic view. We show the HMD tracking data in yellow, and the left and right controller data in blue and red, respectively. To convey high-velocity moments, green lines connecting the three tracked traces are rendered for frames in which the velocity of any tracked device exceeded 1 m/s, with a minimum 15 frame break since the last rendered line to prevent visual clutter. To convey time, we adjust the brightness of all four traces from dim to bright over the course of the segment. For example,
Figure 2 shows the visualizations of the same set of actions for a participant with low performances on all three metrics (i.e., Knowledge Acquisition, Knowledge Retention, and Performance Retention) and a participant with high performances on all three metrics.
Through our visual inspections, we have noticed that the motions of low-performance participants generally have more directional changes and return more often to prior positions than the motions of high-performance participants. Additionally, we have observed that low-performance participants exhibit fewer velocity peaks (i.e., moments in which velocity exceeds 1 m/s) than high-performance participants. Together, these results suggest that low-performance participants moved more haphazardly and with less certainty. In contrast, high-performance participants moved more smoothly and with greater certainty, and likely, intention. These results are similar to prior results from the robotic surgery domain, in which less-experienced robotic surgeons often demonstrate worse economies of motion (i.e., excessive motions) than more-experienced robotic surgeons [
37,
38].
Considering that our visualizations indicated that low-performance participants moved more haphazardly and timidly, we decided to investigate whether prior VR experience had a significant effect on whether a participant would be a low- or high-performance learner. We conducted a Mann–Whitney U test for each metric to compare the distribution differences of low and high performances among participants with and without prior VR experiences.
Table 8 shows the results of these tests. The results clearly indicate that prior VR experience did not have a significant effect on Knowledge Acquisition, Knowledge Retention, or even Performance Retention.
7. Discussion
In this section, we will discuss our results and what knowledge has been gained through this work.
7.1. Position-Based versus Velocity-Based Models
Overall, we found that our velocity-based models generally outperformed our position-based models. For all three metrics, we found that one of our velocity-based models yielded the best results. Our velocity-based, linear-and-angular HMD with linear-only controller model was the best for predicting Knowledge Acquisition. Our velocity-based, linear-and-angular HMD and controller input features had the best results for predicting Knowledge Retention. Finally, our velocity-based, linear-only HMD and controller input features were the best for predicting Performance Retention.
In contrast, we observed that our position-based models produced some of the worst results. For predicting Knowledge Acquisition, we found that two of the position-based models suffered from overfitting the high-performance training data. Similarly, we found that the same two position-based models, the linear-and-angular HMD and controller input features and the linear-only HMD and controller input features, yielded chance-like results for predicting Knowledge Retention. However, all three position-based models did perform moderately well for predicting Performance Retention, which is based on psychomotor skills as opposed to cognitive-only skills.
These results strongly support future research into the use of velocity-based models for predicting learning and retention outcomes, both cognitive and psychomotor ones. On the other hand, particularly if computing resources are limited, future researchers can likely omit position-based models for predicting cognitive learning and retention outcomes, like our Knowledge Acquisition and Knowledge Retention metrics. However, we believe that position-based models are still viable for predicting psychomotor outcomes, based on the results of our Performance Retention experiment.
7.2. Linear-and-Angular versus Linear-Only Models
In general, we did not find any results indicating that linear-and-angular or linear-only models performed better than the other. In our experiments, we investigated three different combinations of these features: (a) linear-and-angular features for both the HMD and controllers, (b) linear-and-angular features for the HMD and linear-only features for the controllers, and (c) linear-only features for both the HMD and controllers. We found that a velocity-based version of each combination performed the best for one of our three metric predictions. We found that the velocity-based, linear-and-angular HMD and controller combination performed the best overall for predicting Knowledge Retention. We found that the velocity-based, linear-and-angular HMD and linear-only controller model performed the best overall, without overfitting, for predicting Knowledge Acquisition. Finally, we found that the velocity-based, linear-only HMD and controller features performed the best overall for predicting Performance Retention.
These results suggest that there is still much research to be conducted into the investigation of these linear and angular features. It is likely that one combination is not superior to the others, and that researchers should investigate each to identify the best model for their prediction metric. Furthermore, it is important to note that we did not investigate angular-only features, which might be viable models for some types of prediction, such as simulator sickness [
39]. There are also other types of features that should be investigated, such as the linear distances between the HMD and handheld controllers [
40].
7.3. Cognitive versus Psychomotor Models
We found that our models produced the best results for the psychomotor-based Performance Retention metric, as opposed to the cognitive-based Knowledge Acquisition and Knowledge Retention metrics. The Performance Retention models yielded generally higher overall MCC scores, with five of the six models ranging from 0.517 to 0.869. In contrast, four of the six Knowledge Acquisition models had overall MCC scores ranging from 0.309 to 0.516 and the best Knowledge Retention model had an overall MCC score of 0.430. The psychomotor-based Performance Retention metric also yielded the best overall accuracy of 0.967, out of all 18 models evaluated, and the only perfect MCC score of 1.000 for the velocity-based, linear-only HMD and controller input features model.
These results indicate that VR tracking data can be better used to predict psychomotor-based learning and retention outcomes than to predict cognitive-based outcomes. This is intuitive as VR tracking data is directly generated by psychomotor-based actions. Hence, it is a more-direct representation of the psychomotor-based mental models that participants have.
These results also imply that VR technologies are most likely more useful for training psychomotor-based skills, such as troubleshooting a surgical robot, as opposed to cognitive-only skills, such as mathematical calculations. However, more research is necessary to investigate these potential differences in usefulness. In particular, real-world efficacy evaluations of skills transfer is necessary. In our research, we were only able to assess psychomotor retention by having participants use the retention version of our VR training application. Ideally, we would have assessed psychomotor retention by having participants demonstrate a real-world transfer of those psychomotor-based skills to a physical surgical robot and OR environment. However, this was not feasible due to the limited availability of such robotic ORs in hospitals [
19].
7.4. Limitations
In our ML experiments, we chose to omit predicting performance during the learning session of our study. This decision was made because while there may be utility in such a classifier, it would be trying to predict values derived in part from actions the participant has already undertaken, and wouldn’t be as directly comparable.
Additionally, in this study, we performed PCA to reduce the dimensionality of our input vectors before using them to train the SVM models. While this is a generally accepted practice, for completeness, a future study would ideally also treat rotation algorithms for the PCA, as well as other feature extraction techniques such as convex-hull representations [
15], and other types of ML models as hyperparameters, and evaluate performance among those. The decision not to explore those here was due in part to the computational complexity of such a broad exploration.
Finally, the positional data was originally encoded in terms of VR world space, and while this remained consistent with the real-world space in terms of scale, orientation, and being stationary, it decreased the model’s ability to encode salient features such as head-to-hand distance. Directly encoding such salient features would likely have been beneficial for our models’ predictive power as Pfeuffer et al. [
40] found. However, evaluating all possible salient features would be intractable, and selecting a subset of features to evaluate over may have introduced bias.


