Article

The Predictive Power of a Twitter User’s Profile on Cryptocurrency Popularity

1
Computer Engineering and Informatics Department, University of Patras, 26504 Patras, Greece
2
Department of Digital Media and Communication, Ionian University, 28100 Kefalonia, Greece
3
Department of Informatics, Ionian University, 49100 Corfu, Greece
*
Author to whom correspondence should be addressed.
Big Data Cogn. Comput. 2022, 6(2), 59; https://0-doi-org.brum.beds.ac.uk/10.3390/bdcc6020059
Submission received: 21 March 2022 / Revised: 15 May 2022 / Accepted: 18 May 2022 / Published: 20 May 2022
(This article belongs to the Special Issue Semantic Web Technology and Recommender Systems)

Abstract

:
Microblogging has become an extremely popular communication tool among Internet users worldwide. Millions of users daily share a huge amount of information related to various aspects of their lives, which makes the respective sites a very important source of data for analysis. Bitcoin (BTC) is a decentralized cryptographic currency and is equivalent to most recurrently known currencies in the way that it is influenced by socially developed conclusions, regardless of whether those conclusions are considered valid. This work aims to assess the importance of Twitter users’ profiles in predicting a cryptocurrency’s popularity. More specifically, our analysis focused on the user influence, captured by different Twitter features (such as the number of followers, retweets, lists) and tweet sentiment scores as the main components of measuring popularity. Moreover, the Spearman, Pearson, and Kendall Correlation Coefficients are applied as post-hoc procedures to support hypotheses about the correlation between a user influence and the aforementioned features. Tweets sentiment scoring (as positive or negative) was performed with the aid of Valence Aware Dictionary and Sentiment Reasoner (VADER) for a number of tweets fetched within a concrete time period. Finally, the Granger causality test was employed to evaluate the statistical significance of various features time series in popularity prediction to identify the most influential variable for predicting future values of the cryptocurrency popularity.

1. Introduction

A social network is a social structure that consists of nodes (e.g., unique users, businesses, artistic profiles, etc.), which are connected to each other by various types of interdependence (e.g., kinship, friendship, sympathy, admiration, curiosity, financial relations). In recent years, however, the usefulness of these networks, as well as the extensions they have taken on in our lives, make any definition rather incomplete.
Twitter is a tool for microblogging [1] and a social networking platform that appeared in March 2006 and still remains among the most visited websites in the world. The power of Twitter is essentially the production of news in real-time, and it remains today one of the best indicators of what is happening in the world at any given time. This is really amazing, considering that the original idea behind its creation was a platform that allows a registered user to compile and publish a status of up to 280 characters.
Influencer marketing and consequently influencers, as well as the ability provided by the data of millions of Twitter users to create or predict trends, thus determining even the global fluctuations of stock prices, are the main aspects discussed in this study. Influencers in the world outside of social networks are persons who have the ability to influence the choices of others because of their knowledge, their professional reputation, or their personal relationship that they have managed to develop with a certain portion of the audience. This audience can be influenced by each influencer to a small and sometimes to a greater extent. The natural question that arises is whether a social network can be the appropriate digital platform in which this power of influence of an individual can be measured, calculated, and in some way be a product of study.
When trying to empirically measure the impact of a Twitter account or any other social network, the following question will be triggered: what is the content that primarily increases the loyalty or commitment of an existing audience? Engagement is essentially considered as the way of discriminating whether the content of an account manages to keep the interest of its audience, which would result in a potential increase in the number of followers.
The ubiquity of Internet access has triggered the emergence of currencies distinct from those used in the prevailing monetary system. The advent of cryptocurrencies based on a unique method called “mining” has brought about significant changes in the online financial activities of users. Various cryptocurrencies have appeared since 2008, when Bitcoin was first introduced [2,3]. Nowadays, cryptocurrencies are often used in online transactions, and their usage has increased every year since their introduction [4,5].
Cryptocurrencies are mainly characterized by fluctuations in their price and number of transactions [3,4]. For instance, the most famous cryptocurrency, Bitcoin, did not fluctuate significantly in price and number of transactions until the end of 2013, when it began to attract global attention, and marked a significant increase and fluctuation in price and number of transactions [4]. Bitcoin quickly gained interest as a possible replacement for standard monetary forms. Other cryptocurrencies, such as Ripple and Litecoin, have shown significantly unstable fluctuations since the end of December 2013 [6]. Such volatile fluctuations have served as an opportunity for some users to speculate while preventing most others from using cryptocurrencies [3,7,8]. In this way, the plethora of objects, opinions, and information about Bitcoin are predominant through the majority of social media sphere [9]. In addition, the Bitcoin currency is considered the modern principal cryptocurrency that could even replace other currencies [10].
Twitter constitutes a platform on which peoples’ thoughts can be almost automatically translated into digital information. Nonetheless, one of the most important issues for the supporters of Bitcoin is not only the sharp fluctuation of its exchange rate but also the factors that influence these fluctuations. Sentiment analysis in Twitter has been extensively studied in numerous works that demonstrate the potential of this topic [11,12,13,14]. Based on these thoughts, in this article, we made a statistical causality test for investigating whether sentiment, followers, retweets, favorites, and lists time series are effective in forecasting the popularity of two cryptocurrencies. Finally, we conclude on the popularity of cryptocurrencies in users’ list timelines.
This study presents a comparison of the popularity of four popular cryptocurrencies, i.e., Bitcoin, Ethereum, Litecoin, and Stellar, based on different features that can be identified in the posts of Twitter users. These characteristics are the number of followers, the ratio of retweets per tweet, the ratio of favorites per tweet, and the number of lists to which the user belongs. Furthermore, the dataset used in the paper consists of 12,000 posts collected for a time period of 12 days, from 6 April to 18 April 2020. More to the point, the timelines of the 500 most influential users were taken into consideration. As a next step, we applied the Spearman, Pearson, and Kendall Correlation Coefficients as post-hoc procedures to support hypotheses about the correlation between these four features. Finally, the Granger causality test was employed to evaluate the statistical significance of various features time series in popularity prediction as it identified the most influential variable to predict future values of cryptocurrency popularity.
The rest of this paper is structured as follows: Section 2 presents related works in the field of Blockchain and Cryptocurrency, as well as sentiment analysis in Cryptocurrencies. Section 3 analyzes the proposed architecture and the tools required for its implementation. Next, Section 4 describes and analyzes the features of the used dataset and provides the experimental results, including correlation analysis and statistical tests. Finally, we summarize the paper and conclude with future work in Section 5.

2. Related Work

Numerous studies conducted empirical analyses regarding the economic considerations of cryptocurrencies, including market efficiency [15,16,17], price movements and their determinants [18,19], and price discovery [20,21]. Moreover, some other papers examine the existence of herding in the cryptocurrency market [22,23]. The analysis of the existence of herding in the cryptocurrency market is of paramount importance since the presence of this phenomenon would give rise to an inefficient market in which asset pricing models based on rational economic behavior cannot be properly applied. In this paper, we will delve into the effect of sentiment analysis and the user’s influence on the popularity of cryptocurrency on Twitter.

2.1. Blockchain and Cryptocurrencies Technology

In the last decades, the huge technological advances have managed to reshape or even radically change most, if not all, business sectors. More specifically, in the field of economics, this technological explosion has managed not only to improve and facilitate marketing methods but also to ask questions about money and whether its very form can be transformed into an alternative genre, much more transparent, and for the most part highly compatible with the digital world.
Nowadays, due to the evolution of internet platforms and social media, cryptocurrency remains a challenging issue to investigate. Cryptocurrency is predicted to become the future currency that could disrupt the present paper currency around the world [24]. In addition, the opportunities in cryptocurrency, such as the high investment return, the low transaction cost, and the security of its technology were discussed. Authors in [25] surveyed several widely used cryptocurrency systems such as Auroracoin, Bitcoin, Blackcoin, Dash, Decred, Ethereum, Litecoin, Namecoin, Peercoin, Permacoin, and Ripple.
The key element in the operation of cryptocurrencies at the technological and structural level is the Blockchain technology. Blockchain could be described as a database form that accepts a large number of user registrations. These records are placed in a data sheet, also known as a block, and over time, these records grow, and the blocks that are created are connected to each other in the form of a chain. This feature makes the blockchain look like an account book, open to all users, which verifies its designation as the most decentralized trading system.
The impact of government pseudo-events on changes in public discourse on controversial technologies is examined in [26]. The authors focused on changes in the public discourse on Twitter about cryptocurrency and blockchain technology, according to the different government agencies’ announcements regarding the regulation of domestic cryptocurrency transactions.

2.2. Sentiment Analysis in Cryptocurrencies

In recent years, there has been a growing interest in Sentiment Analysis exploiting data from social media, e.g., Twitter [27], and especially in discussion posts that review users’ opinions and feelings on cryptocurrencies [28].
The work in [29] attempted to predict whether sentiment analysis in Twitter posts that are related to Bitcoin can be regarded as a predictive premise to show if the Bitcoin price will increase or decrease. Authors in [30] outline several machine learning pipelines with the aim of making Sentiment Analysis on Twitter Data and identifying the Bitcoin cryptocurrency market movement. They apply several supervised learning algorithms and achieve prediction on an hour as well as a daily basis with accuracy exceeding 90 % . Similar work is presented in [31], where the way that prices of the cryptocurrencies mutually behave and are consistently related to the sentiment values identified through Twitter and StockTwits messages is investigated. Authors examine whether a specific characteristic structure is considered within a market and enquire what the location is of the major cryptocurrencies within this structure.
In [32], an approach for the prediction of changes in the prices of Bitcoin and Ethereum that utilize Twitter data are proposed. The ultimate goal of this work is to employ sentiment analysis techniques to retrieve tweets in order to determine if the tweets are generally positive or negative in their opinions of cryptocurrencies. Authors in [33] investigated whether blockchain ventures can efficiently use Twitter signaling for increasing funding; natural language processing techniques to a 144 , 492 tweets dataset related to 522 ventures for creating features in terms of regression models were applied.
Furthermore, authors in [34] estimate the relationship between Bitcoin price and sentiment extracted from social media, assuming lexicon-based sentiment analysis. In [35], researchers are concerned about the Bitcoin currency on the internet and on social media platforms to determine the importance and value of Bitcoin based on users’ discussions and points of view through which a sentiment analysis of the users’ tweets is carried out. The work in [36] utilizes the happiness in Twitter posts as a new feature for investors’ analytics and studies its dependency on the returns of five popular cryptocurrencies.
Finally, in a more recent work in [37], the authors examine Twitter signals as a method for sentiment analysis in order to forecast the price alternations of the ZClassic cryptocurrency. The posts retrieved for a time interval of 3.5 weeks were classified with the use of a Gradient Boosting Regression Tree Model as positive, negative, or neutral.

2.3. User Profiling and Influence

User profiling has gained significant interest in the last several years, and several works have been occupied and thoroughly study this problem. In particular, the authors in [38] proposed a novel context-aware knowledge model schema as well as a method for the dynamic activation of user preferences with the aim of efficiently representing user interests in coherence with occurring user activities.
There have been numerous works that target influence and influencers on Twitter [39,40]. Within the same scope, but in a different domain, an influence method in GitHub that focuses on identifying and comparing influence metrics is reported in [41]. The number of followers depicts the popularity of a GitHub member, whereas the number that the developer’s repositories were “forked” constitutes a measure of the value of the created content. User influence can be considered a measure that is related to the interest of the followers (using favorites, mentions, replies, and retweets) on the Twitter social network. The study in [42] focuses on analyzing the metrics of influence for all the users that took part in certain discussions and verifying the differences between them.
Moreover, user comments and replies found in online communities for predicting the number of transactions as well as the price of cryptocurrencies are utilized in [43]. These aspects showed their efficacy by affecting the number of transactions between users; this approach was examined and found to be efficient for buying and selling cryptocurrencies, as well as identifying aspects influencing user opinions.
There are six basic principles that govern any attempt to persuade a portion of the public to a new product on the market or even to adopt a new habit, namely, reciprocity, commitment and consistency, social proof, liking, authority as well as scarcity [44].
Focusing on whether or not one person is able to influence others highlights three specific actions that a Twitter user can take. The first step in actually expressing a user’s interest is linking to accounts whose content is considered interesting. In addition, users often share with their followers information that they find interesting. This aspect is recognized by the retweet caption, i.e., @username to be included in the tweet. The third and last action is the ability for the user to reply to or comment on a specific post. These three activities undoubtedly reflect the three different forms of user influence [45]:
  • Influence based on Followers: this number indicates the size of the user’s “audience”.
  • Influence based on Retweets: this type of influence indicates the user’s ability to produce content with timeless value or tweets that users can easily share.
  • Influence based on Replies: this feature indicates the user’s ability to initiate and participate in discussions within the network.

3. Tools and Environment

This section presents the preliminaries from the Twitter perspective, which will be utilized for the implementation of the proposed approach using Twitter API and Libraries [46]. Next, the framework for the two-dimensional evaluation of cryptocurrency popularity is presented. Finally, some background information on Spearman Correlation Coefficient is given as it will be used in the data analysis section.

3.1. Preliminaries

Twitter’s Streaming API provides access to the global Twitter feed. The creation of a connection to the Twitter Streaming API is implemented with a long-lasting HTTP request without having to stop the data flow like in Rest API.
Regarding the implementation, a set of Python libraries were utilized, which proved to be particularly useful both in collecting, processing, and displaying data. Several pre-processing steps must be applied in order for the mining methodology of the collected data to be facilitated. The major modules of the proposed methodology are:
  • Tweepy: It is a Python library that implements the fetching of the posts; it also permits, with the use of the Twitter interface, the management of the profile of a user, the data collection by considering specific search words, and finally the creation of a batch of posts over a particular time interval. Tweepy is therefore the communication bridge between Python and the Twitter API.
  • Textblob: It is a Python library capable of processing data in text format as it provides a simple API for performing natural language processing (NLP) tasks, including sentiment analysis, and, specifically, in our paper, it will be used to calculate the popularity of cryptocurrencies.
  • Pandas: It constitutes a Python library that effectively handles high-performance data and provides tools for the analysis of powerful structures. It also utilizes the fast and efficient structure of Dataframes with automatic initialization indexes and offers data alignment along with many options for managing potentially missing data.

3.2. Proposed Approach

In this subsection, two different and related points of interest are presented. On one hand, the users’ influence on Twitter can be practically evaluated using Python and Twitter API, whereas, in the second step, we elaborate on methods using the Twitter API search, which simulates a specific metric. This metric is entitled status.reply_count and is considered an additional metric of user popularity.
We aim to create a list of users that can be considered the most influential regarding specific criteria related to financial interest on the Twitter social networking platform. The topic of discussion on which we focus our attention is a cryptocurrency, while the relevant words that users search for are Economy, Bitcoin, Finance, Forex, Ethereum, and others related to cryptocurrencies.
The implementation details are presented below:
  • Search for tweets based on popular hashtags of financial interest (e.g., #Bitcoin, #Finance and #Markets).
  • Collection of users who address the specific tweets in dataframes, named List_of_Users _#X, where X corresponds to the hashtag of our search.
  • Create a common dataframe named List_of_Users_Final, which consists of the union of all the concrete dataframes and contains all the users sorted by the number of their followers; this is the first influence rank.
  • Three more columns to the dataframe are added, where each user receives a ranking number according to three different popularity features. The first criterion is the ratio of retweets per tweet, which expresses both the user’s ability to produce quality content and their ability to communicate their tweets to a larger audience. The second criterion constitutes the favorites per tweet ratio, which expresses the percentage of tweets that have a positive response from the user’s followers. The third and last is the number of lists to which the user belongs and thus taking into consideration the fact that this metric strengthens the user links through the creation of new networks.
  • These four criteria (followers, retweets, favorites, lists) are simultaneously applied by combining data from all rankings and extracting a list of 30 users who are considered as the Twitter users with the greatest influence on the economy and cryptocurrencies.
  • Having received the id of each user, the next step is to search their timeline with api.user_timeline in order to extract a variable-sized list of users that meets all four of the above popularity criteria.

3.3. Sentiment Score Calculation

The sentiment score of each tweet is calculated using the VADER algorithm, which is a combined approach of lexicon and rule-based sentiment analytic software [47]. VADER is feasible to identify the polarity of text into three categories, which are positive, negative, and neutral. It uses factors like emojis, intensifiers, contraction, punctuation, and acronyms to calculate the scores.
Pre-processing is not essential for VADER as, unlike with some supervised methods of NLP, pre-processing necessities such as tokenisation, stemming, and lemmatisation are not required. The sentiment is determined by the use of plain text. Python provides a library entitled “vaderSentiment” and specifically the “polarityscores” function.
Furthermore, there is no need for pre-processing as VADER implements five major heuristics in terms of sentiment intensity. These include capitalisation, degree modifiers, punctuation, tri-grams analysis as well as the use of “but”.

3.4. Correlation Coefficients

The correlation analysis of the sentiment score determined from the tweets with the cryptocurrency popularity plays an important role in prediction. This correlation can quantify the relationship strength associated with the derived sentiment score and popularity. Specifically, the change in opinion of users can later have an impact on the popularity. This marks the importance of the cross-correlation analysis.
The distinction is that cross-correlation introduces a lag, allowing one of the time-series to be shifted left or right to obtain a better correlation. Three statistical correlation methods, namely Spearman, Pearson, and Kendall, were used and compared in the analysis.
To support hypotheses about correlation or not between columns, the Spearman Correlation Coefficient was applied. This factor constitutes a numerical measure, or better indicator, of the size of the correlation between two sets of values. It ranges from 1.00 to + 1.00 passing through 0.00 . A positive sign indicates a positive correlation; this practically means that, when the values of one variable increase, the same happens with those of the second variable. On the contrary, the negative symbol indicates a negative correlation between the two variables; that is, when the values of one variable seem to increase, the values of the second variable decrease. The value 0.00 indicates complete randomness concerning the fluctuations of the two variables we are considering.
Spearman’s ρ is the Pearson Correlation Coefficient applied to a set of values after separately sorting the values of both variables, from the smallest to the largest. Calculating the constant correlation of Spearman is a non-parametric process, while the constant evaluates the relationship between two numerical variables without speculating on the real relationship between these two variables. The Spearman constant is calculated from the following equation and expresses the correlation between two tables:
ρ = 1 6 ( x i y i ) 2 N 3 N
where x i and y i are the ranks of the variables in a number of observations.
The Pearson Correlation constitutes one of the most widely used correlation approaches as it is for variables with a linear relationship and normal distribution of data. According to [48], Pearson’s correlation coefficient (r) is defined as:
r = i = 1 N ( x i x ¯ ) ( y i y ¯ ) i = 1 N ( x i x ¯ ) 2 ( y i y ¯ ) 2
where x i and y i are the values of features x and y and x ¯ , y ¯ denote the mean of x and y for the i-th record in N-ranking tables.
The Kendall Correlation constitutes a non-parametric statistical technique that measures the strength of dependency between two or more variables, similar to Spearman Rank Correlation. Following [49], this coefficient is defined as:
τ = N c N d N ( N 1 ) 2
where N is the sample size, N ( N 1 ) 2 are the unique unordered pairs, and N c , N d are the number of concordant and discordant, respectively.

4. Results

In this section, we show the outcomes from the evaluation of the proposed approach. For this purpose, three experiments have been conducted. The first one concerns the analysis of the features from a Twitter perspective, the second investigates the association between the involved features, and the last one concerns the sentiment score and the statistical significance of the time-lag per feature for the cryptocurrency popularity prediction.
The first set of experiments produced top-k ranked user lists for four different features, namely followers, retweets, favorites, and lists. In order to estimate whether a correlation between these columns exists, the second set of experiments was applied regarding the aforementioned correlation coefficients. In the following, we present the values of the three above correlation statistical methods. The third experiment employs the Granger causality test to assess the importance of sentiment and each feature, separately, in the cryptocurrency popularity.

4.1. Features Analysis

Twitter’s Streaming API, along with the Tweepy library, was used in order to fetch Twitter posts and information for the sentiment analysis. Tweepy constitutes, as previously mentioned, an effective way of retrieving concrete information through permitting information retrieval from Twitter and allowing filtering based on keywords, topics, or hashtags.
The hashtags were derived from the most representative words in the context of each corresponding cryptocurrency. However, this search may incorporate posts that are relevant to other cryptocurrencies as well, and so the selection must be focused in order to comprise particular words that are considered as synonyms to each cryptocurrency. For example, regarding #Bitcoin, the synonyms are #BTC and #Bitcoinprice. The posts we collected were published for a time period of 12 days (from 6 April to 18 April 2020), and in the following Table 1, the relevant hashtags are displayed.
In Table 2, the number of posts of the four most well-known cryptocurrencies, i.e., Bitcoin, Ethereum, Litecoin, and Stellar, are compared as the timelines of the 500 most influential users were taken into consideration. The results of this table are not associated with the actual prices of these cryptocurrencies but only with the profile of the users. The number of posts regarding Ethereum and Bitcoin is much larger than the others, followed by those of Litecoin and Stellar, respectively.
Specifically, in Table 3, we notice that, especially when considering a small number of users, overlap can be identified. More to the point, user #Forbes is observed among the top users in two features, namely followers as well as lists. The same stands for other users that exist in the lists of two different features.

4.2. Correlation Analysis

In the second set of experiments, we observe in Table 4 that the feature of lists has a strong degree of correlation with the feature of followers, that is, the highest value is equal to 0.795. Similarly, the feature of favorites is also strongly associated with the feature of retweets, with the value of 0.618 being the second highest degree of correlation. Finally, the feature of followers appears to have a weak correlation with the feature of retweets and the same stands for Lists with Favorites.
The relationship of the user influence is found to be positive using a Pearson statistical method. Respectively, Table 5 and Table 6 assess the relatedness among the same features by employing Pearson’s and Kendall’s coefficients. Similar behavior is verified by both of these correlation methods, although the values of the latter are slightly different (with either lower or higher reduction).

4.3. Sentiment Analysis Results

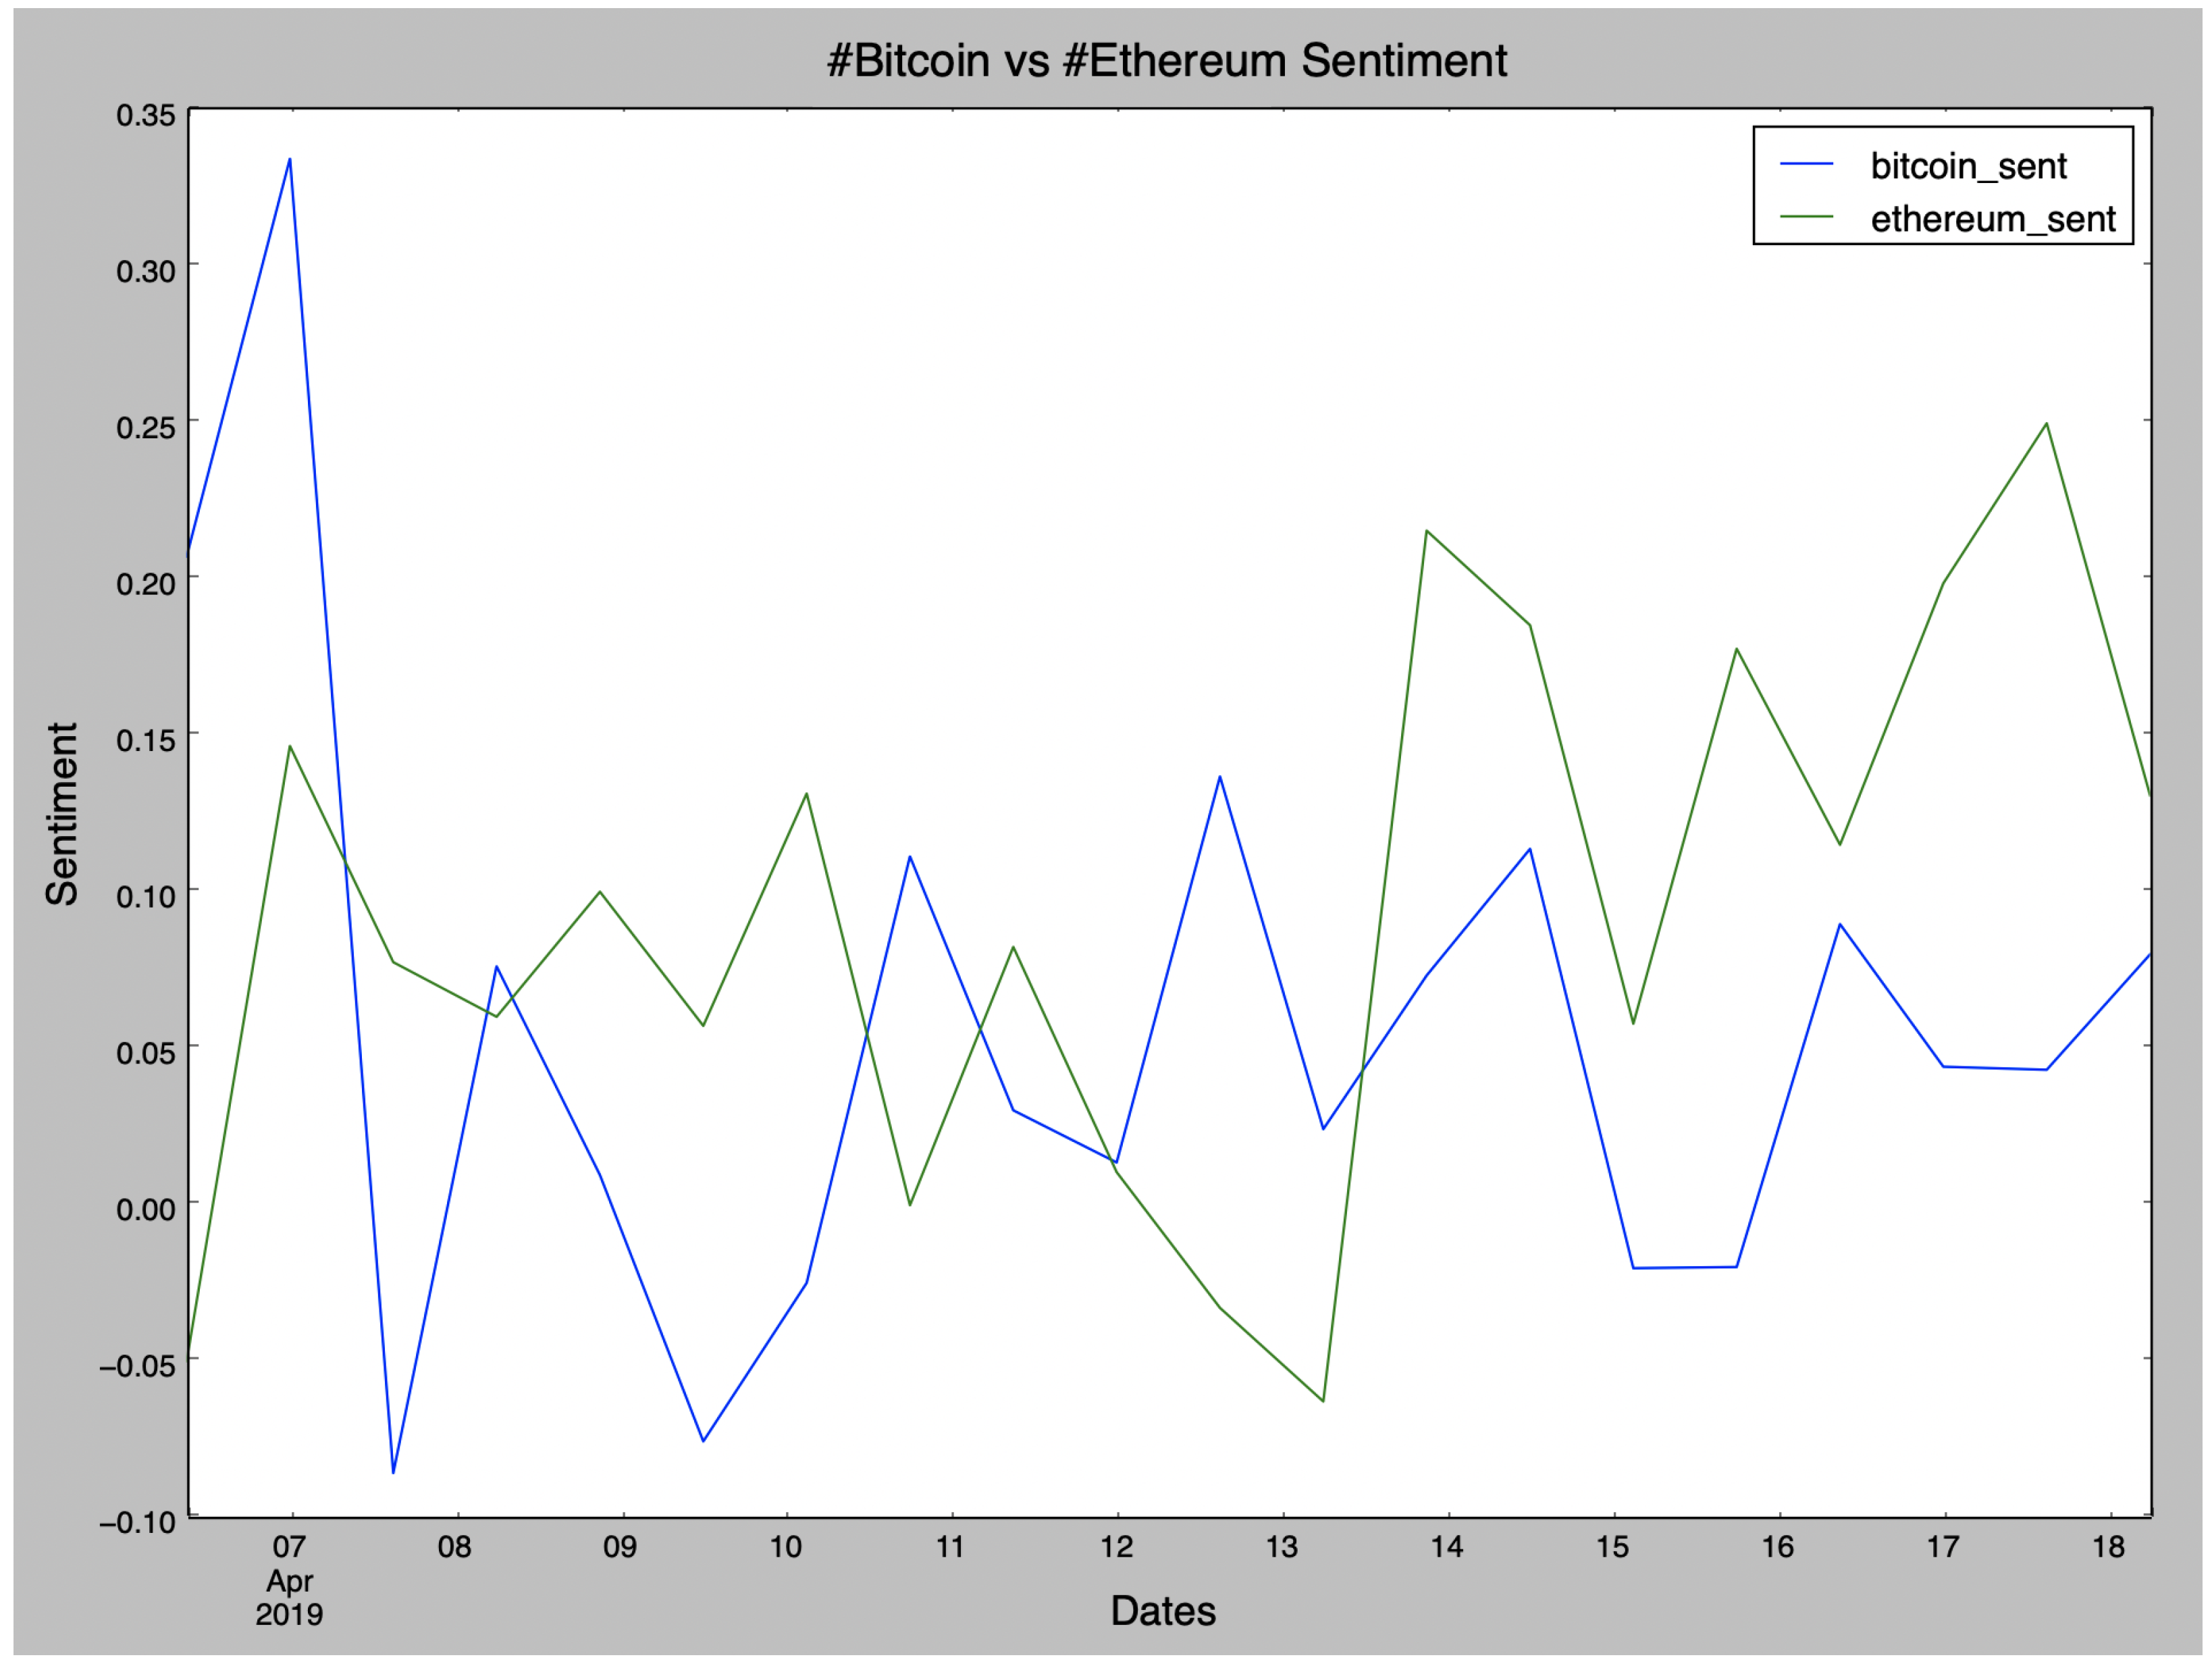
Furthermore, another experiment concerns the sentiment scores of posts per cryptocurrency, where we will focus only on Bitcoin and Ethereum in Figure 1. Sentiment analysis relies on a dictionary which has lexical features corresponding with emotion values, which constitute the sentiment scores. The sentiment score of a tweet can be acquired by summing up the sentiment score of each word in it.
We tried to draw conclusions about their popularity not by counting the overall number of tweets but by measuring the sentiment of the tweets regarding these two cryptocurrencies. We can not identify any important notions regarding the price of each cryptocurrency; nevertheless, fluctuations of tweets sentiment by observing the timelines of the most influential user groups can be illustrated.

4.4. Features Statistical Significance on Cryptocurrency Popularity Prediction

To assess cryptocurrency popularity, we based our proposed methodology on (a) user influence and (b) sentiment scores. Sentiment analysis is often combined with a (Granger-) causality test and/or regression model(s) [28]. Initially, we evaluate the statistical significance (p-value) of time lag in both components of popularity using the Granger causality test. The null hypothesis ( H 0 ) mentions that sentiment/followers/retweets/favorites/lists time series do not (Granger) cause cryptocurrency popularity time series.To reject the null hypothesis, it can be shown that sentiment/followers/retweets/favorites/lists values provide statistically significant information about future values of popularity.
Cryptocurrency popularity is treated as a multivariate autoregressive model of order p. Let us consider the variables C P t , S t , F t , R t , F V t , and L t that represent the popularity, sentiment, followers, retweets, favorites, and lists time series data, respectively. In the last experiment, we evaluate five cases where each column of Table 7, Table 8, Table 9 and Table 10 corresponds to one of the following cases for all four cryptocurrencies, respectively:
  • Case 1: Forecast C P t + 1 based on past values C P t , S t .
  • Case 2: Forecast C P t + 1 based on past values C P t , F t .
  • Case 3: Forecast C P t + 1 based on past values C P t , R t .
  • Case 4: Forecast C P t + 1 based on past values C P t , F V t .
  • Case 5: Forecast C P t + 1 based on past values C P t , L t .
We avoid combining the following pair of variables F t , R t , F V t and L t due to their dependency, as Spearman’s correlation coefficient shows. The popularity model considers the lagged values of both C P t and the time series of the rest features separately for various time lags. Specifically, this test aims to determine the significance of the association between time lag and each tweet sentiment (positive or negative). The same process is repeated independently for the time series that captures user influence, namely, followers, retweets, favorites, and lists in relation to the C P t time series. This test was performed on a short time period of 12 days (from 6 April to 18 April 2020) to identify relations that are statistically significant (p < 0.05).
Observing Table 7, Table 8, Table 9 and Table 10, for Bitcoin, Ethereum, Litecoin, and Stellar cryptocurrencies, we conclude the predictive power of all variables on the popularity variable, as the p-values are all well below the 0.05 level. Hence, we reject the null hypothesis, and, as a result, the current data are stationary. The lower the p-value ( p < 0.05 ) of the variables, the higher their predictive power on cryptocurrencies’ popularity is. Finally, the daily changes in Twitter metrics-variables could forecast a similar rise or fall in cryptocurrency popularity and its fluctuations in advance.

5. Conclusions and Future Work

In this paper, we focused on comparing the popularity of four popular cryptocurrencies based on two different results. Initially, the number of tweets for a concrete time period was measured, and, in the following, the classification of these tweets as positive or negative was implemented. Furthermore, the Granger causality analysis is applied to identify the proper time lag and the most influential variable to predict future values of the cryptocurrency popularity considering the past. In addition, given that previous correlation analysis only indicates the relationship between features (either positive or negative), it could be used in conjunction with convergent cross-mapping (CCM) [50] to determine the direction and magnitude of the causality (as illustrated in Figure 4 of Sugihara et al. [51]), also studying the problem under noisy conditions.
For future work, the analysis could be improved by employing a domain-specific lexicon, as the latter can improve the classifier performance and the prediction accuracy by identifying corresponding cryptocurrency, economy and financial terms; thus, a more representative sentiment can be yielded [28]. Moreover, Bitcoin price can be treated as a time-series problem where the price index can be forecasted with the use of machine learning techniques, like Recurrent Neural Network (RNN), Long Short Term Memory (LSTM), or ARIMA model [52,53,54]. The proposed method of predicting fluctuations in the price and trading volume of cryptocurrencies based on user comments and replies in online communities is likely to increase the understanding and availability of cryptocurrencies if a range of improvements and applications are implemented. Finally, different approaches to user comments and replies in online communities are expected to bring more significant results in diverse fields.

Author Contributions

M.T., A.K., E.D., G.V. and P.M. conceived of the idea, designed and performed the experiments, analyzed the results, drafted the initial manuscript, and revised the final manuscript. All authors have read and agreed to the published version of the manuscript.

Funding

This research received no external funding.

Institutional Review Board Statement

Not applicable.

Informed Consent Statement

Not applicable.

Data Availability Statement

The data presented in this study are available on request from the corresponding author.

Conflicts of Interest

The authors declare no conflict of interest.

References

  1. Java, A.; Song, X.; Finin, T.; Tseng, B. Why We Twitter: Understanding Microblogging Usage and Communities. In Proceedings of the 9th WebKDD and 1st SNA-KDD Workshop on Web Mining and Social Network Analysis (WebKDD/SNA-KDD), San Jose, CA, USA, 12 August 2007; pp. 56–65. [Google Scholar]
  2. Nakamoto, S. Bitcoin: A Peer-to-Peer Electronic Cash System. Decentralized Bus. Rev. 2008, 21260. Available online: https://bitcoin.org/en/bitcoin-paper (accessed on 19 May 2022).
  3. Reid, F.; Harrigan, M. An Analysis of Anonymity in the Bitcoin System. In Proceedings of the IEEE Third International Conference on Privacy, Security, Risk and Trust (PASSAT)/IEEE Third International Conference on Social Computing (SocialCom), Boston, MA, USA, 9–11 October 2011; pp. 1318–1326. [Google Scholar]
  4. Böhme, R.; Christin, N.; Edelman, B.; Moore, T. Bitcoin: Economics, Technology, and Governance. J. Econ. Perspect. 2015, 29, 213–238. [Google Scholar] [CrossRef] [Green Version]
  5. Grinberg, R. Bitcoin: An Innovative Alternative Digital Currency. Hastings Sci. Technol. Law J. 2012, 4, 159. [Google Scholar]
  6. Ahamad, S.; Nair, M.; Varghese, B. A survey on crypto currencies. In Proceedings of the 4th International Conference on Advances in Computer Science (AETACS), Delhi, India, 13–14 December 2013; pp. 42–48. [Google Scholar]
  7. Kondor, D.; Pósfai, M.; Csabai, I.; Vattay, G. Do the Rich Get Richer? An Empirical Analysis of the Bitcoin Transaction Network. PLoS ONE 2014, 9, e86197. [Google Scholar] [CrossRef] [PubMed] [Green Version]
  8. Ron, D.; Shamir, A. Quantitative Analysis of the Full Bitcoin Transaction Graph. In Proceedings of the 17th International Conference on Financial Cryptography and Data Security, Okinawa, Japan, 1–5 April 2013; Volume 7859, pp. 6–24. [Google Scholar]
  9. Franco, P. Understanding Bitcoin: Cryptography, Engineering and Economics; John Wiley & Sons: Hoboken, NJ, USA, 2014. [Google Scholar]
  10. Bornholdt, S.; Sneppen, K. Do Bitcoins Make the World Go Round? On the Dynamics of Competing Crypto-currencies. arXiv 2014, arXiv:abs/1403.6378. [Google Scholar]
  11. Agarwal, A.; Xie, B.; Vovsha, I.; Rambow, O.; Passonneau, R. Sentiment Analysis of Twitter Data. In Proceedings of the Workshop on Language in Social Media (LSM), Portland, OR, USA, 23 June 2011; pp. 30–38. [Google Scholar]
  12. Baltas, A.; Kanavos, A.; Tsakalidis, A. An Apache Spark Implementation for Sentiment Analysis on Twitter Data. In Proceedings of the International Workshop on Algorithmic Aspects of Cloud Computing (ALGOCLOUD), Aarhus, Denmark, 22 August 2016; pp. 15–25. [Google Scholar]
  13. Kanavos, A.; Nodarakis, N.; Sioutas, S.; Tsakalidis, A.; Tsolis, D.; Tzimas, G. Large Scale Implementations for Twitter Sentiment Classification. Algorithms 2017, 10, 33. [Google Scholar] [CrossRef]
  14. Kanavos, A.; Perikos, I.; Hatzilygeroudis, I.; Tsakalidis, A. Emotional Community Detection in Social Networks. Comput. Electr. Eng. 2018, 65, 449–460. [Google Scholar] [CrossRef]
  15. Al-Yahyaee, K.H.; Mensi, W.; Yoon, S.M. Efficiency, Multifractality, and the Long-memory Property of the Bitcoin Market: A Comparative Analysis with Stock, Currency, and Gold Markets. Financ. Res. Lett. 2018, 27, 228–234. [Google Scholar] [CrossRef]
  16. Bariviera, A.F. The Inefficiency of Bitcoin Revisited: A Dynamic Approach. Econ. Lett. 2017, 161, 1–4. [Google Scholar] [CrossRef] [Green Version]
  17. Jiang, Y.; Nie, H.; Ruan, W. Time-varying Long-term Memory in Bitcoin Market. Financ. Res. Lett. 2018, 25, 280–284. [Google Scholar] [CrossRef]
  18. Balcilar, M.; Bouri, E.; Gupta, R.; Roubaud, D. Can Volume Predict Bitcoin Returns and Volatility? A Quantiles-based Approach. Econ. Model. 2017, 64, 74–81. [Google Scholar] [CrossRef] [Green Version]
  19. Cagli, E.C. Explosive Behavior in the Prices of Bitcoin and Altcoins. Financ. Res. Lett. 2019, 29, 398–403. [Google Scholar] [CrossRef]
  20. Brandvold, M.; Molnár, P.; Vagstad, K.; Valstad, O.C.A. Price Discovery on Bitcoin Exchanges. J. Int. Financ. Mark. Inst. Money 2015, 36, 18–35. [Google Scholar] [CrossRef]
  21. Ciaian, P.; Rajcaniova, M.; d’Artis, K. The Economics of BitCoin Price Formation. Appl. Econ. 2016, 48, 1799–1815. [Google Scholar] [CrossRef] [Green Version]
  22. da Gama Silva, P.V.J.; Klotzle, M.C.; Pinto, A.C.F.; Gomes, L.L. Herding Behavior and Contagion in the Cryptocurrency Market. J. Behav. Exp. Financ. 2019, 22, 41–50. [Google Scholar] [CrossRef]
  23. Vidal-Tomás, D.; Ibáñez, A.M.; Farinós, J.E. Herding in the Cryptocurrency Market: CSSD and CSAD Approaches. Financ. Res. Lett. 2019, 30, 181–186. [Google Scholar] [CrossRef]
  24. Fauzi, M.A.; Paiman, N.; Othman, Z. Bitcoin and Cryptocurrency: Challenges, Opportunities and Future Works. J. Asian Financ. Econ. Bus. (JAFEB) 2020, 7, 695–704. [Google Scholar] [CrossRef]
  25. Mukhopadhyay, U.; Skjellum, A.; Hambolu, O.; Oakley, J.; Yu, L.; Brooks, R.R. A Brief Survey of Cryptocurrency Systems. In Proceedings of the IEEE 14th Annual Conference on Privacy, Security and Trust (PST), Auckland, New Zealand, 12–14 December 2016; pp. 745–752. [Google Scholar]
  26. Hong, Y. How the Discussion on a Contested Technology in Twitter Changes: Semantic Network Analysis of Tweets about Cryptocurrency and Blockchain Technology. In Proceedings of the 22nd Biennial Conference of the International Telecommunications Society (ITS), Seoul, Korea, 24–27 June 2018. [Google Scholar]
  27. Dritsas, E.; Livieris, I.E.; Giotopoulos, K.; Theodorakopoulos, L. An apache spark implementation for graph-based hashtag sentiment classification on twitter. In Proceedings of the 22nd Pan-Hellenic Conference on Informatics, Athens, Greece, 29 November–1 December 2018; pp. 255–260. [Google Scholar]
  28. Kraaijeveld, O.; Smedt, J.D. The predictive power of public Twitter sentiment for forecasting cryptocurrency prices. J. Int. Financ. Mark. Inst. Money 2020, 65, 101188. [Google Scholar] [CrossRef]
  29. Stenqvist, E.; Lönnö, J. Predicting Bitcoin Price Fluctuation with Twitter Sentiment Analysis; KTH Royal Institute of Technology, School of Computer Science and Communication: Stockholm, Sweden, 2017. [Google Scholar]
  30. Colianni, S.; Rosales, S.; Signorotti, M. Algorithmic Trading of Cryptocurrency Based on Twitter Sentiment Analysis. CS229 Project. 2015, pp. 1–5. Available online: https://www.semanticscholar.org/paper/Algorithmic-Trading-of-Cryptocurrency-Based-on-Colianni-Rosales/9b838a3177523b8179511283b9489caa0f69910d (accessed on 20 March 2022).
  31. Aste, T. Cryptocurrency Market Structure: Connecting Emotions and Economics. Digit. Financ. 2019, 1, 5–21. [Google Scholar] [CrossRef] [Green Version]
  32. Abraham, J.; Higdon, D.; Nelson, J.; Ibarra, J. Cryptocurrency Price Prediction Using Tweet Volumes and Sentiment Analysis. SMU Data Sci. Rev. 2018, 1, 1. [Google Scholar]
  33. Albrecht, S.; Lutz, B.; Neumann, D. The Behavior of Blockchain Ventures on Twitter as a Determinant for Funding Success. Electron. Mark. 2020, 30, 241–257. [Google Scholar] [CrossRef]
  34. Karalevicius, V.; Degrande, N.; Weerdt, J.D. Using Sentiment Analysis to Predict Interday Bitcoin Price Movements. J. Risk Financ. 2018, 19, 56–75. [Google Scholar] [CrossRef]
  35. Alghobiri, M. Using Data Mining Algorithm for Sentiment Analysis of Users’ Opinions about Bitcoin Cryptocurrency. J. Theor. Appl. Inf. Technol. 2019, 97, 2195–2205. [Google Scholar]
  36. Naeem, M.A.; Mbarki, I.; Suleman, M.T.; Vo, X.V.; Shahzad, S.J.H. Does Twitter Happiness Sentiment Predict Cryptocurrency? Int. Rev. Financ. 2020, 21, 1529–1538. [Google Scholar] [CrossRef]
  37. Li, T.R.; Chamrajnagar, A.S.; Fong, X.R.; Rizik, N.R.; Fu, F. Sentiment-Based Prediction of Alternative Cryptocurrency Price Fluctuations Using Gradient Boosting Tree Model. Front. Phys. 2019, 7, 98. [Google Scholar] [CrossRef]
  38. Vallet, D.; Fernández, M.; Castells, P.; Mylonas, P.; Avrithis, Y. A Contextual Personalization Approach Based on Ontological Knowledge. In Proceedings of the 2nd International Workshop on Contexts and Ontologies: Theory, Practice and Applications (C&O-2006) Collocated with the 17th European Conference on Artificial Intelligence (ECAI-2006), Riva del Garda, Italy, 28 August 2006; Volume 210. [Google Scholar]
  39. Drakopoulos, G.; Kanavos, A.; Mylonas, P.; Sioutas, S. Defining and evaluating Twitter influence metrics: A higher-order approach in Neo4j. Soc. Netw. Anal. Min. 2017, 7, 52:1–52:14. [Google Scholar] [CrossRef]
  40. Kafeza, E.; Kanavos, A.; Makris, C.; Vikatos, P. T-PICE: Twitter Personality Based Influential Communities Extraction System. In Proceedings of the 2014 IEEE International Congress on Big Data, Anchorage, AK, USA, 27 June–2 July 2014; pp. 212–219. [Google Scholar]
  41. Badashian, A.S.; Stroulia, E. Measuring User Influence in Github: The Million Follower Fallacy. In Proceedings of the 3rd International Workshop on CrowdSourcing in Software Engineering (CSI-SE@ICSE), Austin, TX, USA, 16 May 2016; pp. 15–21. [Google Scholar]
  42. Kanavos, A.; Livieris, I.E. Fuzzy Information Diffusion in Twitter by Considering User’s Influence. Int. J. Artif. Intell. Tools 2020, 29, 2040003:1–2040003:22. [Google Scholar] [CrossRef]
  43. Kim, Y.B.; Kim, J.G.; Kim, W.; Im, J.H.; Kim, T.H.; Kang, S.J.; Kim, C.H. Predicting Fluctuations in Cryptocurrency Transactions Based on User Comments and Replies. PLoS ONE 2016, 11, e0161197. [Google Scholar] [CrossRef] [Green Version]
  44. Cialdini, R.B. Influence: Science and Practice; Pearson Education: Boston, MA, USA, 2009; Volume 4. [Google Scholar]
  45. Cha, M.; Haddadi, H.; Benevenuto, F.; Gummadi, P.K. Measuring User Influence in Twitter: The Million Follower Fallacy. In Proceedings of the 4th International Conference on Weblogs and Social Media (ICWSM), Washington, DC, USA, 23–26 May 2010; The AAAI Press: Palo Alto, CA, USA, 2010. [Google Scholar]
  46. Dritsas, E.; Vonitsanos, G.; Livieris, I.E.; Kanavos, A.; Ilias, A.; Makris, C.; Tsakalidis, A.K. Pre-processing Framework for Twitter Sentiment Classification. In Proceedings of the 15th IFIP International Conference on Artificial Intelligence Applications and Innovations (AIAI), Hersonissos, Crete, Greece, 24–26 May 2019; Volume 560, pp. 138–149. [Google Scholar]
  47. Hutto, C.J.; Gilbert, E. VADER: A Parsimonious Rule-Based Model for Sentiment Analysis of Social Media Text. In Proceedings of the 8th International Conference on Weblogs and Social Media (ICWSM), Ann Arbor, MI, USA, 1–4 June 2014; The AAAI Press: Palo Alto, CA, USA, 2014. [Google Scholar]
  48. Yang, B.; Sun, Y.; Wang, S. A Novel Two-stage Approach for Cryptocurrency Analysis. Int. Rev. Financ. Anal. 2020, 72, 101567. [Google Scholar] [CrossRef]
  49. Puth, M.T.; Neuhäuser, M.; Ruxton, G.D. Effective Use of Spearman’s and Kendall’s Correlation Coefficients for Association between Two Measured Traits. Anim. Behav. 2015, 102, 77–84. [Google Scholar] [CrossRef] [Green Version]
  50. Tu, C.; Fan, Y.; Fan, J. Universal Cointegration and Its Applications. iScience 2019, 19, 986–995. [Google Scholar] [CrossRef] [PubMed] [Green Version]
  51. Sugihara, G.; May, R.; Ye, H.; hao Hsieh, C.; Deyle, E.; Fogarty, M.; Munch, S. Detecting Causality in Complex Ecosystems. Science 2012, 338, 496–500. [Google Scholar] [CrossRef] [PubMed]
  52. Alessandretti, L.; ElBahrawy, A.; Aiello, L.M.; Baronchelli, A. Anticipating Cryptocurrency Prices using Machine Learning. Complexity 2018, 2018, 8983590:1–8983590:16. [Google Scholar] [CrossRef]
  53. Madan, I.; Saluja, S.; Zhao, A. Automated Bitcoin Trading via Machine Learning Algorithms; Stanford University: Stanford, CA, USA, 2015. [Google Scholar]
  54. McNally, S.; Roche, J.; Caton, S. Predicting the Price of Bitcoin using Machine Learning. In Proceedings of the 26th Euromicro International Conference on Parallel, Distributed and Network-Based Processing (PDP), Cambridge, UK, 21–23 March 2018; pp. 339–343. [Google Scholar]
Figure 1. Sentiment scores of posts per cryptocurrency.
Bdcc 06 00059 g001
Table 1. Example Hashtags.
BitcoinEthereumLitecoinStellar
BTCETHLTCXLM
BitcoinpriceEthereumpriceLitecoinpriceStellarprice
Table 2. Number of posts per cryptocurrency.
Bitcoin4700
Ethereum5200
Litecoin1700
Stellar400
Total Posts12,000
Table 3. Top-4 ranked users for different features.
FollowersRetweetsFavoritesLists
ForbesShashiTharoorAVFCOfficialForbes
detikcommaggieNYTmaggieNYTMilenio
ShashiTharoorgtconway3dgtconway3dCNBC
MilenioRewards4JusticeRewards4JusticemaggieNYT
Table 4. Spearman’s Correlation between Influence Ranks.
FollowersRetweetsFavoritesLists
Followers1.0000.2790.1860.795
Retweets0.2791.0000.6180.242
Favorites0.1860.6181.0000.124
Lists0.7950.2420.1241.000
Table 5. Pearson’s Correlation between Influence Ranks.
FollowersRetweetsFavoritesLists
Followers1.0000.2580.1630.743
Retweets0.2581.0000.5980.212
Favorites0.1630.5981.0000.104
Lists0.7430.2120.1041.000
Table 6. Kendall’s Correlation between Influence Ranks.
FollowersRetweetsFavoritesLists
Followers1.0000.1780.1230.713
Retweets0.1781.0000.5080.142
Favorites0.1230.5081.0000.100
Lists0.7130.1420.1001.000
Table 7. Statistical significance (p-values) of bivariate Granger causality correlation for Bitcoin popularity based on tweet sentiment, followers, retweets, favorites, and lists.
Time LagSentimentFollowersRetweetsFavoritesLists
1 day0.04680.00250.01100.00160.0075
2 day0.03180.00180.01210.01780.0084
3 day0.04200.00110.02070.01420.0096
4 day0.02510.02530.02510.01630.0135
5 day0.03650.02760.02810.01370.0174
6 day0.02530.03560.03140.01440.0286
7 day0.02710.01820.04810.01690.0275
8 day0.01690.04430.04210.02880.0197
9 day0.02140.04220.03720.01840.0106
10 day0.03750.03250.03510.01360.0195
11 day0.03490.02490.03080.01070.0183
12 day0.04350.03380.02040.01480.0116
Table 8. Statistical significance (p-values) of bivariate Granger causality correlation for Ethereum popularity based on tweet sentiment, followers, retweets, favorites, and lists.
Time LagSentimentFollowersRetweetsFavoritesLists
1 day0.04420.00350.02100.00860.0225
2 day0.03780.00280.01210.01220.0171
3 day0.04120.00100.01070.00320.0492
4 day0.02560.01830.02010.00630.0205
5 day0.01830.02360.02610.00760.0017
6 day0.01530.02760.03340.01140.0006
7 day0.01610.01720.04210.01920.0009
8 day0.01090.04340.04990.02280.0019
9 day0.01140.03220.04720.02840.0056
10 day0.02750.03650.04310.02160.0115
11 day0.02490.02190.03680.03470.0133
12 day0.03350.01080.03040.03180.0076
Table 9. Statistical significance (p-values) of bivariate Granger causality correlation for Litecoin popularity based on tweet sentiment, followers, retweets, favorites, and lists.
Time LagSentimentFollowersRetweetsFavoritesLists
1 day0.03550.01020.02780.01320.0256
2 day0.02180.00780.01670.02550.0223
3 day0.03890.01250.00870.01030.0385
4 day0.03180.02230.01550.00970.0165
5 day0.02780.02530.03350.01020.0123
6 day0.02450.03550.01230.00860.0095
7 day0.02890.01680.03240.02380.0045
8 day0.02210.03870.04420.01280.0078
9 day0.01450.02670.04920.03970.0032
10 day0.02980.03540.04120.01290.0097
11 day0.01750.01790.02180.03270.0163
12 day0.03740.03320.02440.01230.0054
Table 10. Statistical significance (p-values) of bivariate Granger causality correlation for Stellar popularity based on tweet sentiment, followers, retweets, favorites, and lists.
Time LagSentimentFollowersRetweetsFavoritesLists
1 day0.01450.01880.02350.00550.0099
2 day0.03380.01820.02160.01430.0054
3 day0.03670.01280.03050.02110.0156
4 day0.02120.03570.01710.02350.0259
5 day0.03980.02120.02490.01670.0128
6 day0.03180.03640.03580.02230.0241
7 day0.04110.02720.04950.02910.0376
8 day0.02190.04130.04760.03280.0377
9 day0.03450.04860.04160.02170.0256
10 day0.04150.03870.03980.01770.0214
11 day0.04080.03150.03870.02470.0288
12 day0.04490.04180.03440.01190.0155
Publisher’s Note: MDPI stays neutral with regard to jurisdictional claims in published maps and institutional affiliations.

