
A Novel Method of Exploring the Uncanny Valley in Avatar Gender(Sex) and Realism Using Electromyography


School of Information and Physical Sciences, College of Engineering, Science and Environment, University of Newcastle, Callaghan 2308, Australia
*
Author to whom correspondence should be addressed.
Big Data Cogn. Comput. 2022, 6(2), 61; https://0-doi-org.brum.beds.ac.uk/10.3390/bdcc6020061
Submission received: 23 March 2022
/
Revised: 17 May 2022
/
Accepted: 26 May 2022
/
Published: 30 May 2022
(This article belongs to the Special Issue Cognitive and Physiological Assessments in Human-Computer Interaction)
Abstract
:Despite the variety of applications that use avatars (virtual humans), how end-users perceive avatars are not fully understood, and accurately measuring these perceptions remains a challenge. To measure end-user responses more accurately to avatars, this pilot study uses a novel methodology which aims to examine and categorize end-user facial electromyography (f-EMG) responses. These responses (n = 92) can be categorized as pleasant, unpleasant, and neutral using control images sourced from the International Affective Picture System (IAPS). This methodology can also account for variability between participant responses to avatars. The novel methodology taken here can assist in the comparisons of avatars, such as gender(sex)-based differences. To examine these gender(sex) differences, participant responses to an avatar can be categorized as either pleasant, unpleasant, neutral or a combination. Although other factors such as age may unconsciously affect the participant responses, age was not directly considered in this work. This method may allow avatar developers to better understand how end-users objectively perceive an avatar. The recommendation of this methodology is to aim for an avatar that returns a pleasant, neutral, or pleasant-neutral response, unless an unpleasant response is the intended. This methodology demonstrates a novel and useful way forward to address some of the known variability issues found in f-EMG responses, and responses to avatar realism and uncanniness that can be used to examine gender(sex) perceptions.
1. Introduction
The term avatar originates from the Sanskrit word for ‘incarnation’ and is commonly defined as digital models of people that either look or behave like the users they represent [1]. The potential for avatars to be effective communication mediums in human–avatar interaction (HAI) hinges on our ability to accurately measure the effect that they have on end-users. These interactions can occur in a range of serious game applications, such as military training simulations [2], educational exercises [3], and medical training scenarios [4].
Despite the different areas of use, a common key area of interest stems from how the physical appearance of an avatar may affect end-users, and importantly, how we might measure this effect. Khan and Sutcliffe [5] suggest that relatively small variations in the appearance of an avatar could severely reduce the effectiveness of avatars, which highlights the need for measurement approaches to be sufficiently sensitive to capturing this variability.
Additional issues that affect avatars during HAIs include the visual realism of an avatar’s appearance which occurs when an avatar fails to meet the expectations of end-users [6]. Despite the advances in graphical rendering and image generation capabilities, there are still limitations to how achievable and believable avatar realism can be in given contexts. Additionally, this realism is often also related to how effectively an avatar’s behavior can mimic the facial and emotional expressions of humans or communicate behavioral realism [7]. Again, perception of uncanniness is not uniform and thus measurement of affective responses to avatars are likely to include individual variations.
These limitations may result in avatars that cause a feeling of uncanniness or eeriness in end-users Seymour, Riemer [8], and may be associated with Mori and MacDorman [9] Uncanny valley theory. This theory was originally associated with robotics but has transitioned into HAI, where human-like avatars that have been created using computer graphic capabilities with a focus on boundary-pushing realism [10,11]. These boundary-pushing hyper realism attempts are not always successful, which leads to resources such as time and money being wasted. Thus, uncanniness affecting in end-users is thus a primary concern for developers and animators of avatars, as users may simply reject an avatar because they experience a negative emotional response. However, accurately measuring these negative affective responses remains a challenge.
There are several approaches that can be used to measure affective end-user responses to avatars. These different approaches allow for the collection of both subjective and objective data, each of which provides a mechanism for understanding aspects of perception. Subjective tools can include self-report surveys [12,13,14], which seek to quantify aspects of an avatar. Each of these measures will give subjective ratings on the perceptions for an avatar regarding specific and important issues for avatar acceptance among end-users.
Alternatively, objective measures such as eye tracking [15] or physiological markers [16,17] can be used to record responses to avatars to empirically determine the intensity of affect-based responses. However, this is met with an additional issue as the use of physiological measures can be complicated by individual variability [17], particularly as it relates to individuals of different sexes. (The term ‘sexes’ was taken from the articles reviewed and generally refers to differences between those the study identified as female and male, with no distinction between gender, sex or gender identities which may or may not reflect the gender of the participants in the studies reviewed here) [18].
Additional issues arise when recognizing emotional expressions from a single facial feature such as eyes, lips, or cheeks. Emotion and expressions are somewhat synergistic whereby these features combine to generate and convey emotional expressions. Currently, there is software available that analyses facial expression such as the iMotion FEA [19]. However, investigating how to make convincing emotional expressions which do not come across as eerie is an active area of research in the field of human–avatar interaction. An example of this is seen in the work of Grewe and Liu [20], who proposed using a type of avatar whose expressions were designed by an artistic expert and the second was derived from statistical learning from a 3D facial expression database. Their results suggest that the avatars who had learned facial expressions were rated as more realistic in terms of photographically and behaviorally.
To reiterate, the aim of this research is to contribute a novel methodology that can give a better understanding of end-user perceptions of avatars. The key contribution of this methodology is to design and test avatars that will return either a pleasant or neutral or close pleasant-neutral response as seen in avatars such to avatar stimuli. In practice, ensuring that the avatars produced are largely accepted as pleasant or neutral or pleasant-neutral, this may reduce the impact of unpleasantness experienced by the end-users. Avatars that are pleasant, neutral, or pleasant-neutral may reduce the impact of poor avatar design on end-users.
2. Related Materials
There are several ways to measure affect-based responses, which include both objective and subjective approaches. Subjective approaches are those that study the perceptions of the individual with an emphasis on the importance of personal perspective and interpretations. Primarily, subjective data are collected from observations or interviews, which leads to an interpretivist approach to research that focuses on the viewpoints and interpretations of the end-users involved in a specific situation [21]. Alternatively, objective approaches are focused on collecting data through experiments or large-scale surveys that seek to establish law-like generalisations that can be applied to the same phenomenon in different contexts. Using a positivist approaches, the data can be statistically analysed to create generalisations [21]. While both approaches can provide valuable insights into the affective responses to stimuli, the focus of this work is the use of objective approaches for measuring and categorising affective responses through a case study examining responses an avatar set.
We begin this investigation but examining the current literature which revealed several objective approaches to the measurement of affective responses. These measures include the use of physiological measurements such as heart rate [22], skin conductance [23], and facial electromyography [17]. These measurements have been used to determine emotional states; however, their application requires some understanding of underlying emotion models and corresponding physiological processes.
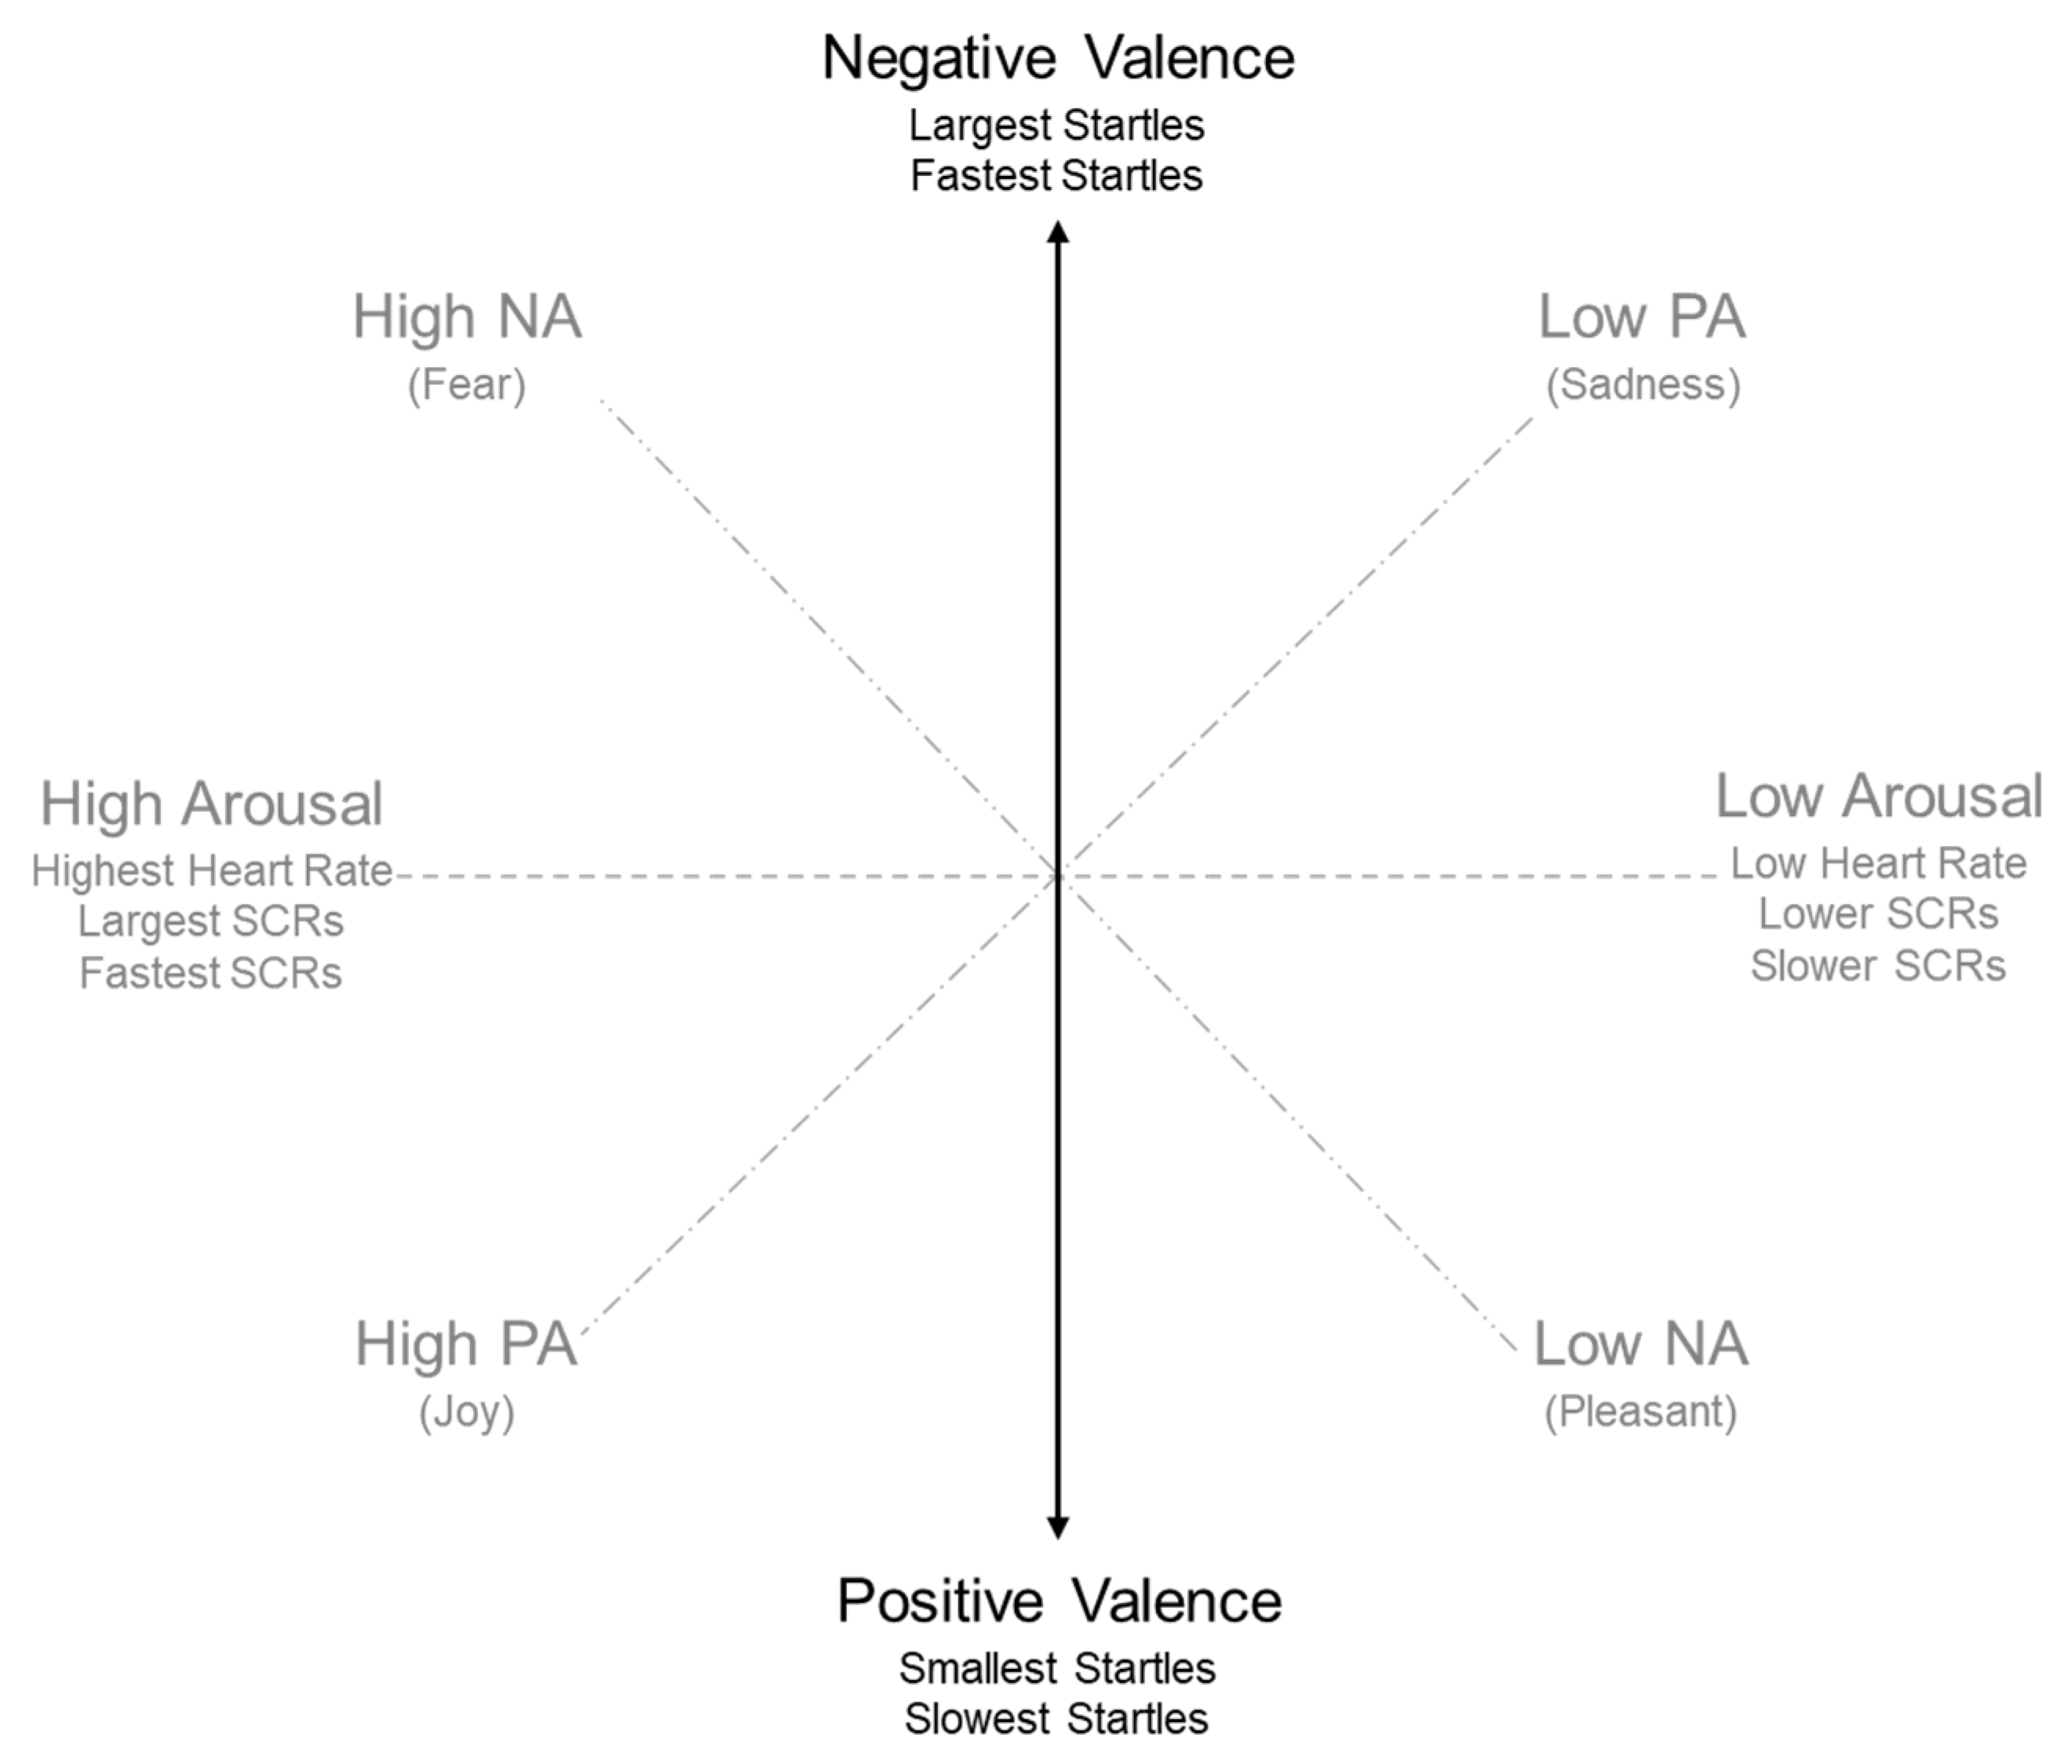
While examining the literature, a model for measuring emotions emerged, given the nature of this investigation, this model has proven to be very useful for this research. This emotional model places all emotions in a two-dimensional space as a function of valence and arousal (Figure 1) [22]. In this model, valence represents a person’s emotional reaction to a stimulus as a reflection of how positive (pleasant) or negative (unpleasant) an experience is for a person, whereas arousal indicates the level of activation associated with the experience. Affective processing is often a preferable construct than emotion, as the latter is more prone to confusing and arbitrary definitions [24]. While the use of a simplified model has received some criticism [25], the wide acceptance of this model makes it a useful lens for understanding participant responses to avatars in this case study.
Using this lens, there are many measures available, for tasks that require cognitive effort or active coping. Heart rate measurement corresponds to emotional arousal, mediated by the sympathetic nervous system [22,27]. In contrast, skin conductance commonly assesses indices of the autonomic nervous system, which may measure the intensity of an emotional state rather than identifying the state itself [27]. Alternatively, facial electromyography (referred to throughout this article as f-EMG), is measured through f-EMG recording of the startle eye-blink reflex, and is influenced by variations in the valence (pleasantness) of affect-based responses [17]. As identified (Figure 1), when measuring valence, responses can be defined on a scale of positive (pleasant) and negative (unpleasant) responses. Larger and faster startles may be associated with negative or unpleasant emotional responses [28]. In contrast, slower and smaller startle responses are correlated with positive or pleasant emotional reactions. As such, f-EMG signals from the startle-eye blink have been identified as an appropriate, objective measure for this affect based study [17,29], and also specifically for our avatar-based case studies [16].
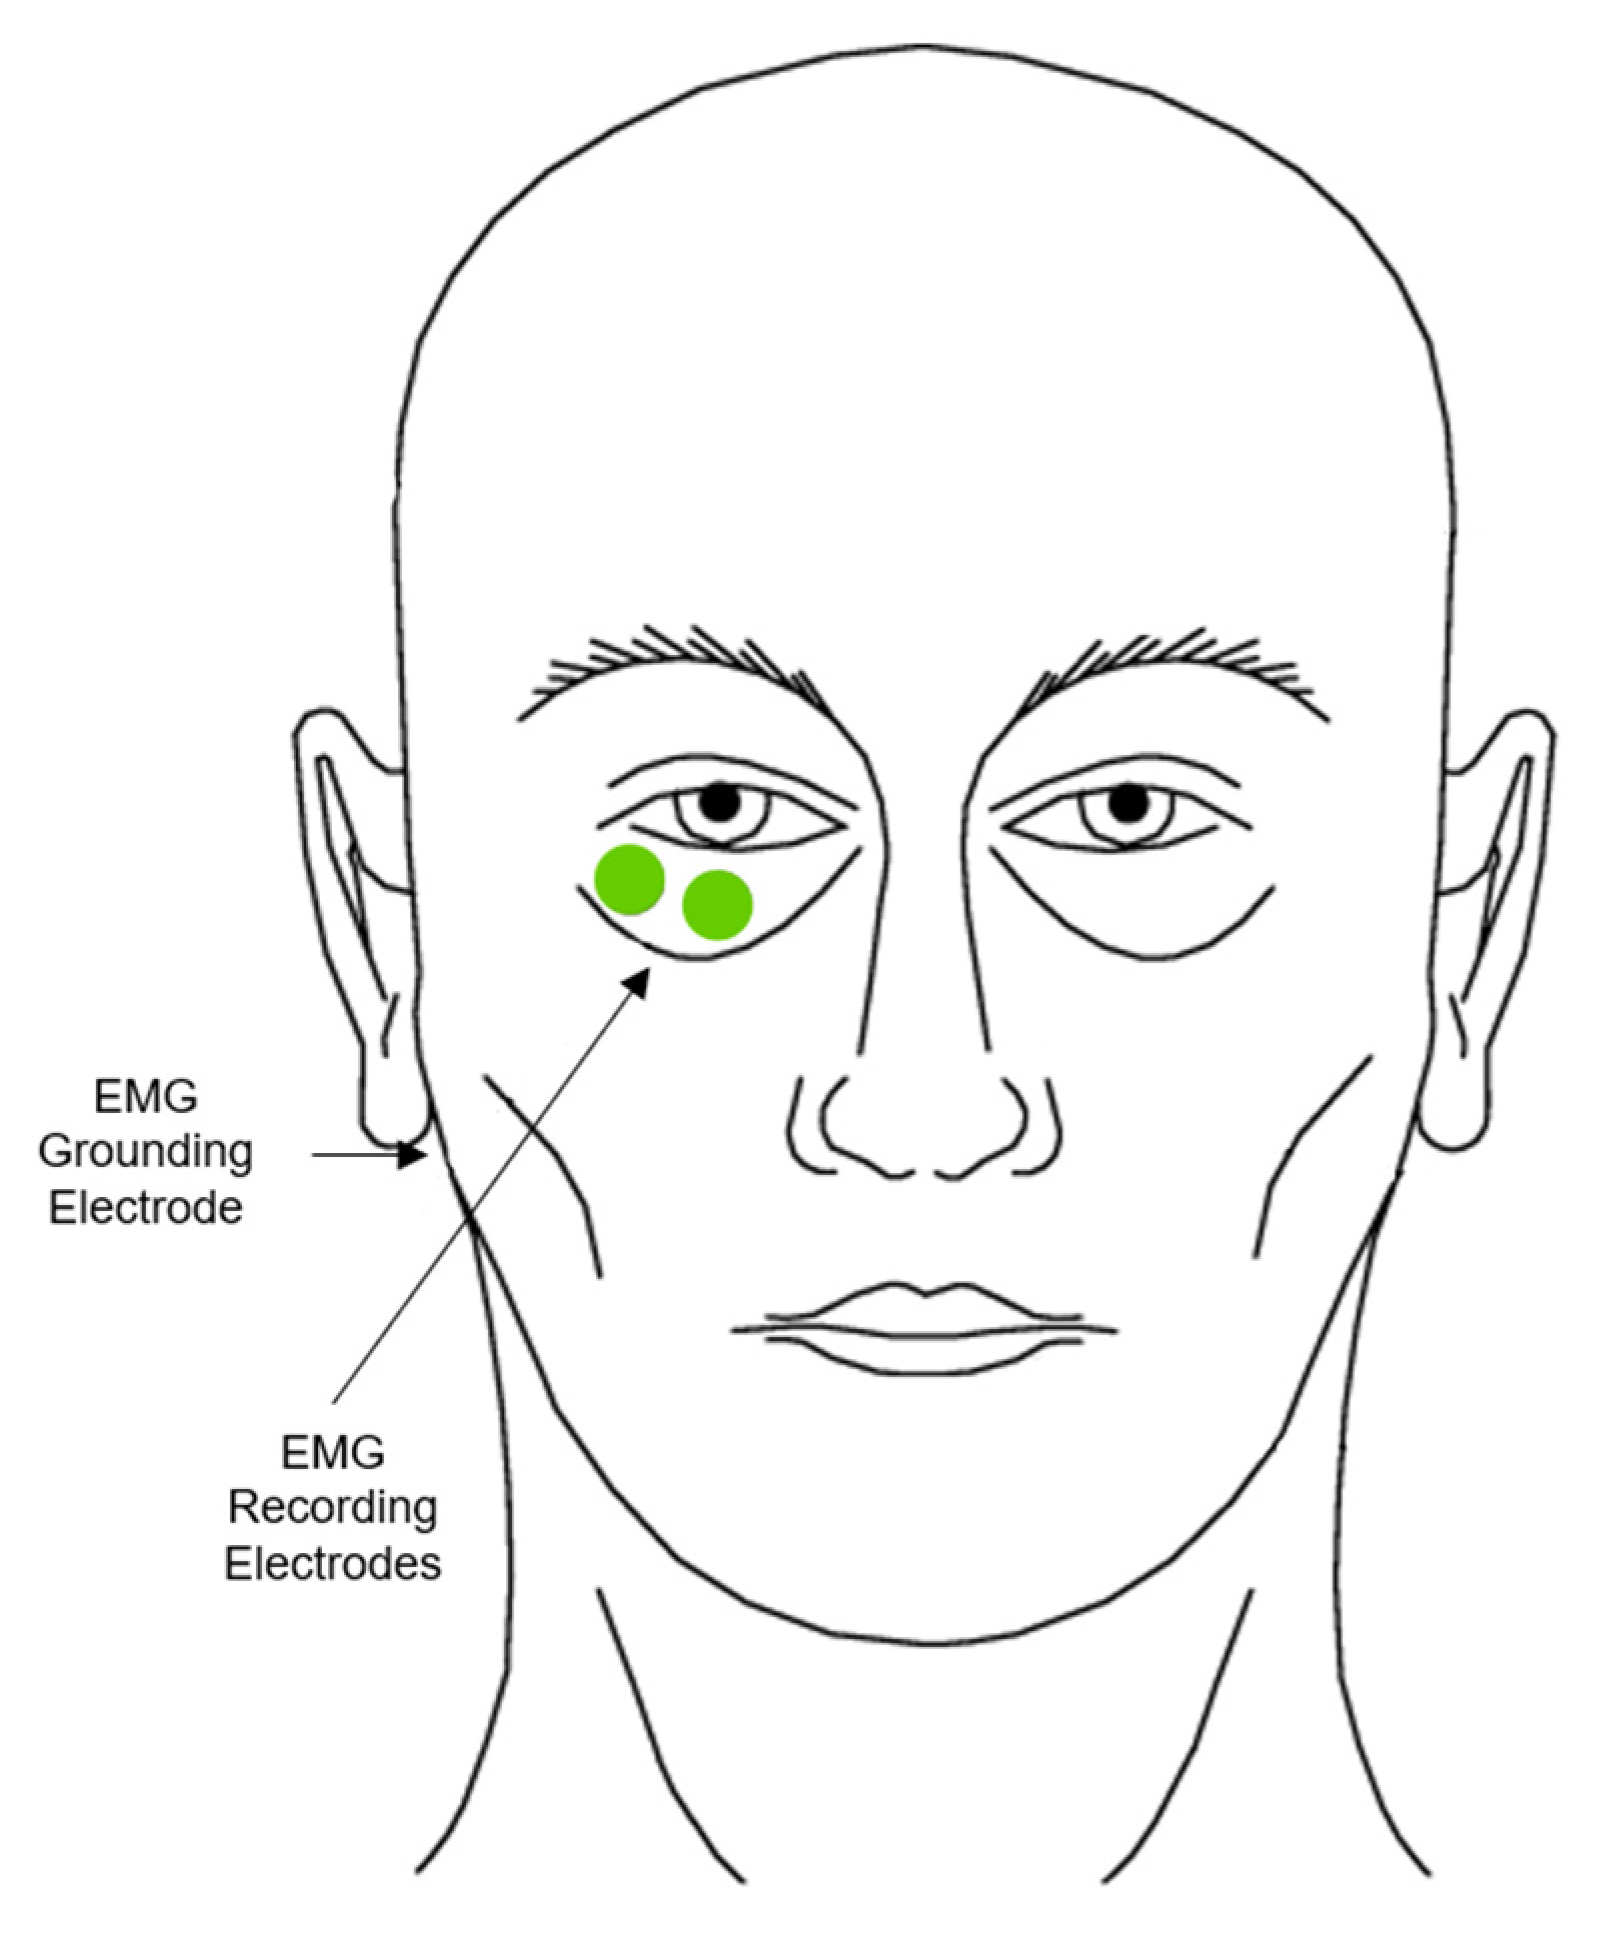
The startle-eye blink reflex consists of coordinated movements of several muscle groups, primarily the contraction of the orbicularis oculi and reciprocal inhibition of the levator palpebrate [30] (Figure 2). There are three primary means of inducing the startle reflex; these include using auditory, cutaneous, and visual stimuli [17]. As further described in the methodology section, the audio inducement of the startle-eye blink reflex stems from the acoustic blink [31], which typically consists of a burst of orbicularis oculi f-EMG activity with an average latency of 30–50 ms in human adults [30]. This f-EMG activity is recorded through the placement of two electrodes directly over the orbicularis oculi to record activity and one on the mastoid process for grounding (Figure 2).
When recording f-EMG responses, there are several factors to consider, including electrode placement, skin preparation, and the filtering and smoothing of the signal. To record the f-EMG signal, recording involves placing the reusable Shielded Biopotential Electrodes (Ag-AgCl, 4 mm, 3 pk) on the orbicularis oculi muscle, which lays directly underneath the skin around the eyes. One electrode is placed over the orbital portion of the orbicularis oculi with the second one placed 1 cm lateral to this position, while the third grounding electrode is placed on the mastoid process behind the ear, using skin surface electrodes [17]. Before this application, these areas must be cleaned with a non-alcoholic wipe to remove surface contaminants that may interfere with signal recording. The signal must then be filtered to eliminate all electrical potentials or ‘noise’ to retain the unaltered signal prior to being rectified and integrated. Rectification involves the removal of any portion of the signal that either falls below 0 or the ongoing baseline; the signal is then inverted and combined with the positive position of the signal [17,30] prior to integration. Once complete, the resulting signal is then smoothed or integrated by passing through a low-pass filter [30]. After this processing, the signal can then be analyzed using various scoring parameters.
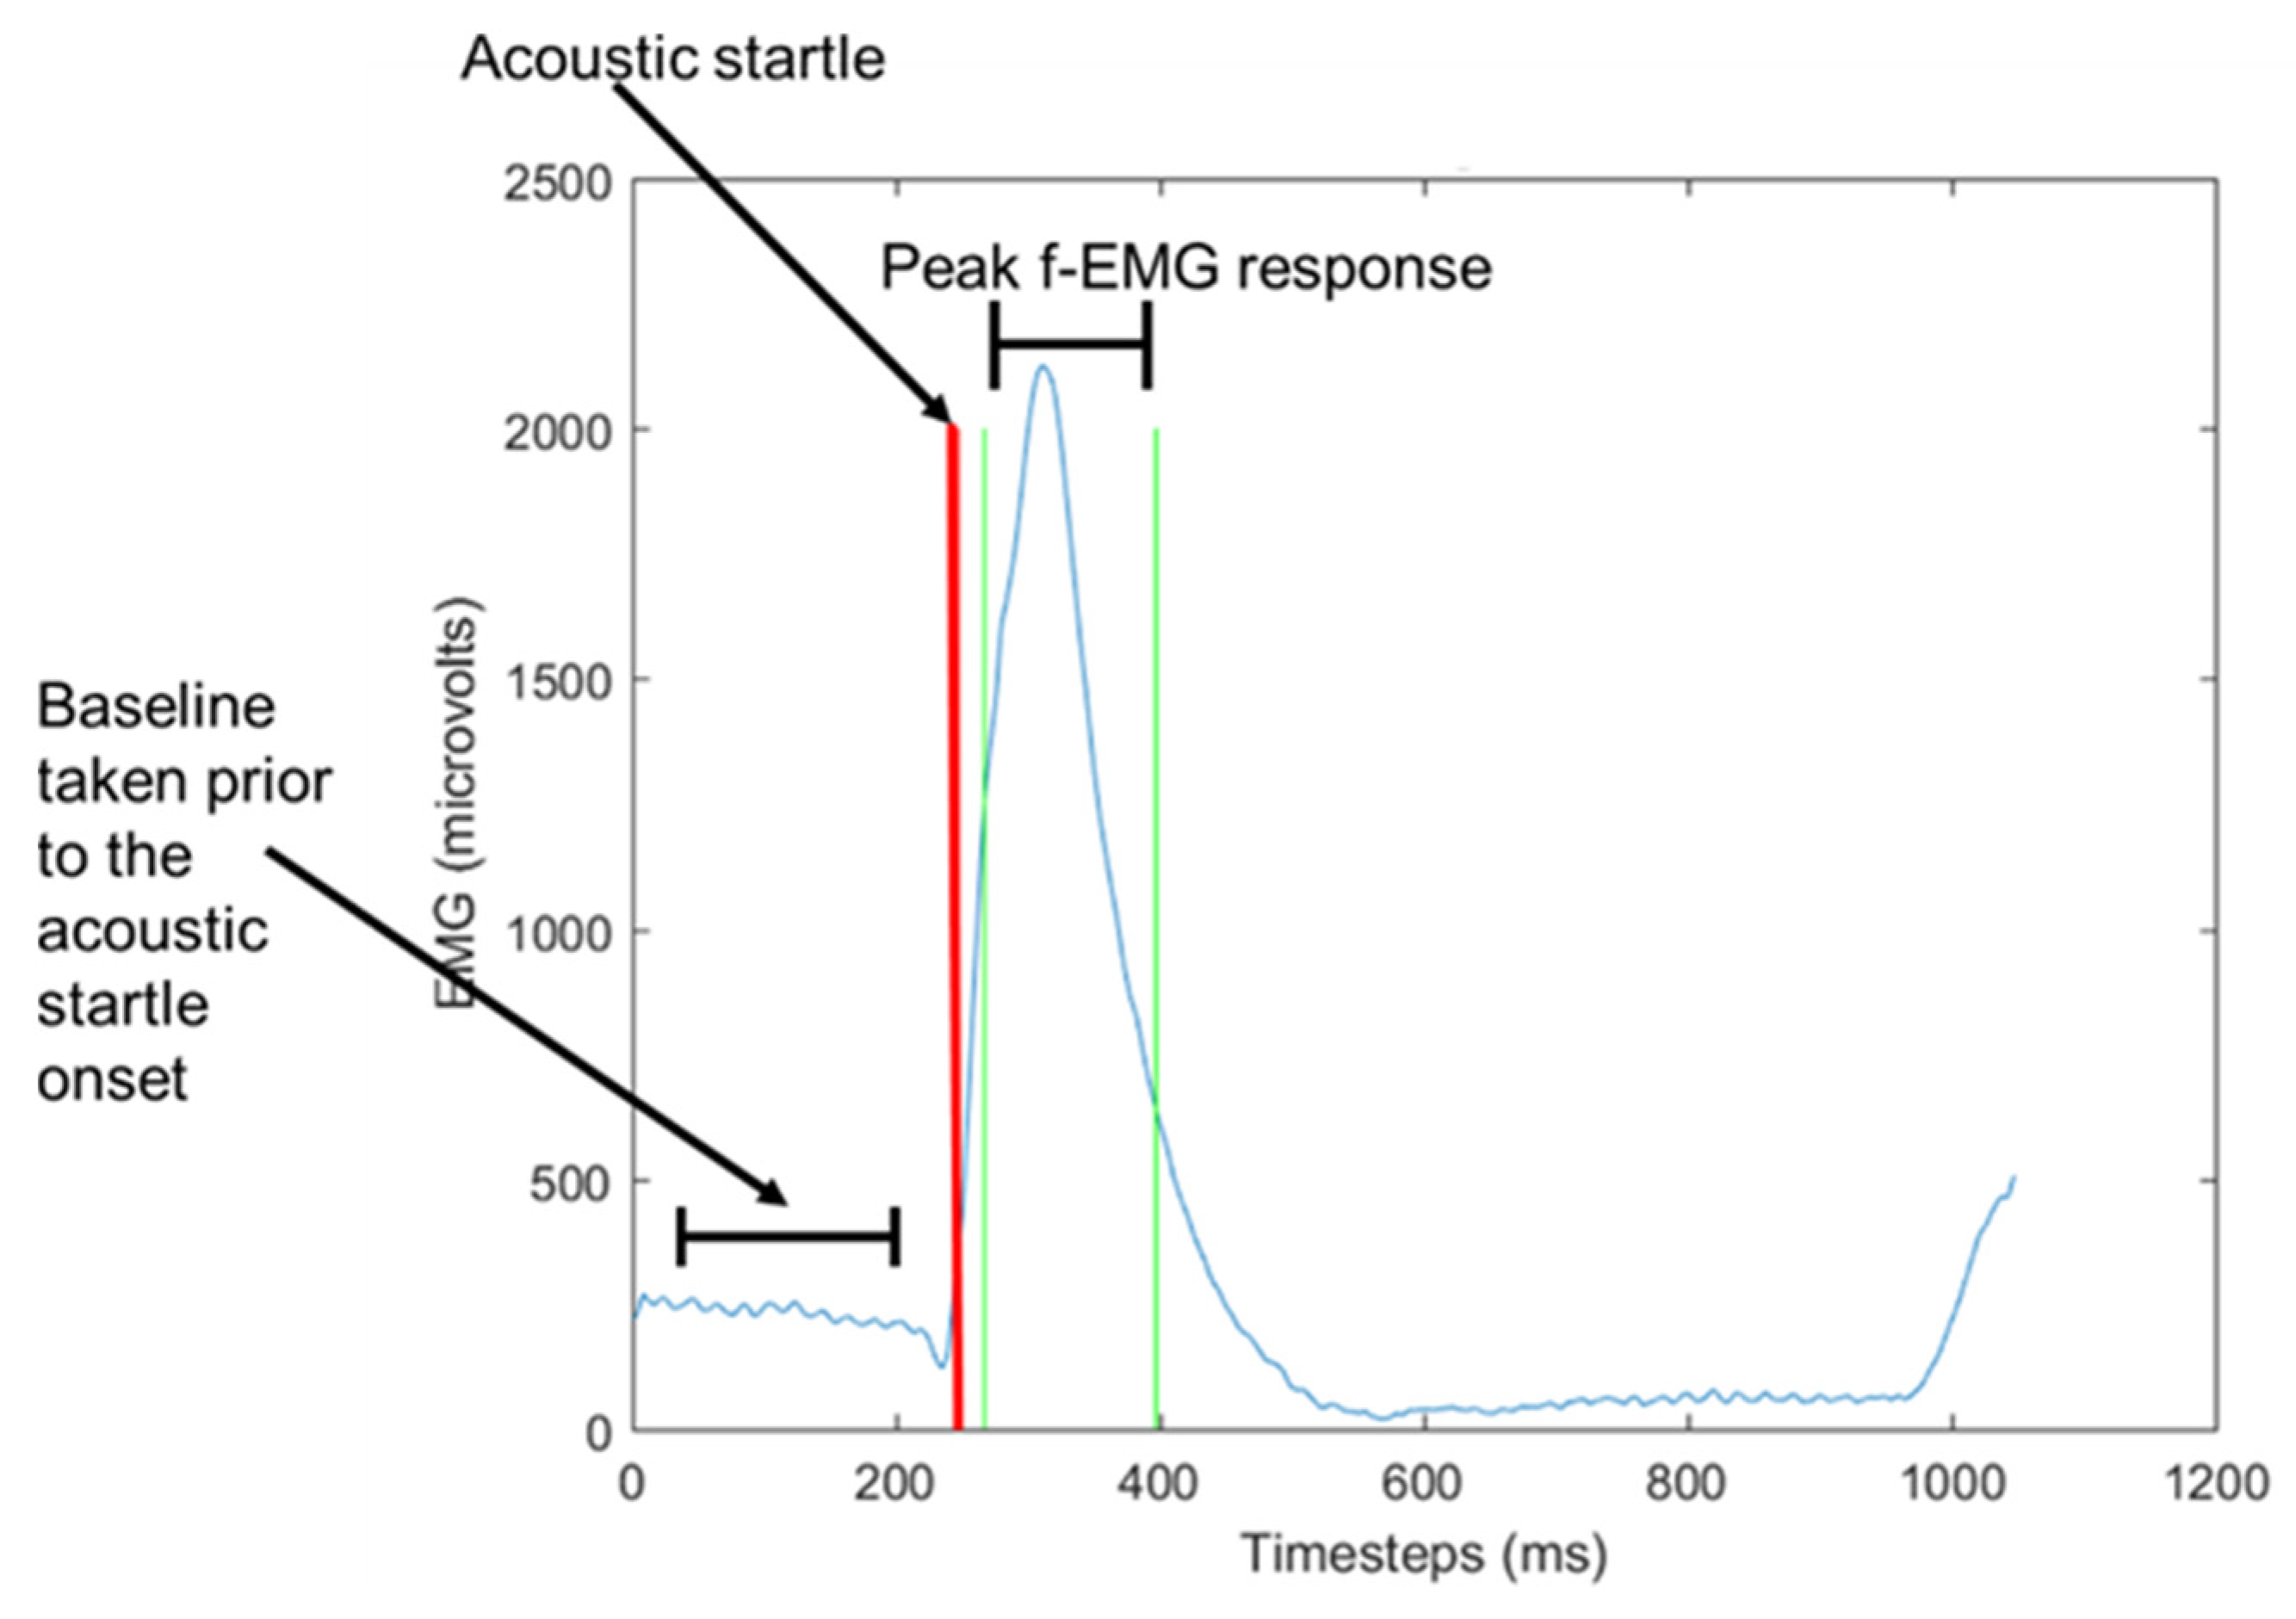
f-EMG scoring parameters include the response window, baseline, response detection, peak amplitude, and response latency, each of which are defined below. A response window is considered as the time window in which a response onset will be considered a blink; the peak response window describes the time during which the peak of the blink occurs (Figure 3) [30]. The blue line is the raw f-EMG signal from the participant, the red line indicates when the audio stimulus was introduced which then trigged the startle eye-blink reflex. The vertical green lines are the window in which the participants’ peak f-EMG response was recorded in accordance with the parameters set by the literature for healthy human adults. According to Balaban and Losito [32], the recommended window for scoring onset latency is 21–120 ms for acoustic blinks. To detect and define the size of a response, an initial baseline period is typically defined to capture and calculate non-blink f-EMG activity. Berg and Balaban [30] state that there are three methods for generating the baseline calculations including the level of pre-stimulus activity before the active window, the first 20 ms following the eye-blink stimuli onset, and the first n samples before the detected onset of the response. To detect the responses, scoring algorithms may use threshold parameters either as a change in the slope of the signal or the increment of the amplitude relative to the baseline [30]. The goal of this to identify true startles amongst the noise of the signal to measure affective responses.
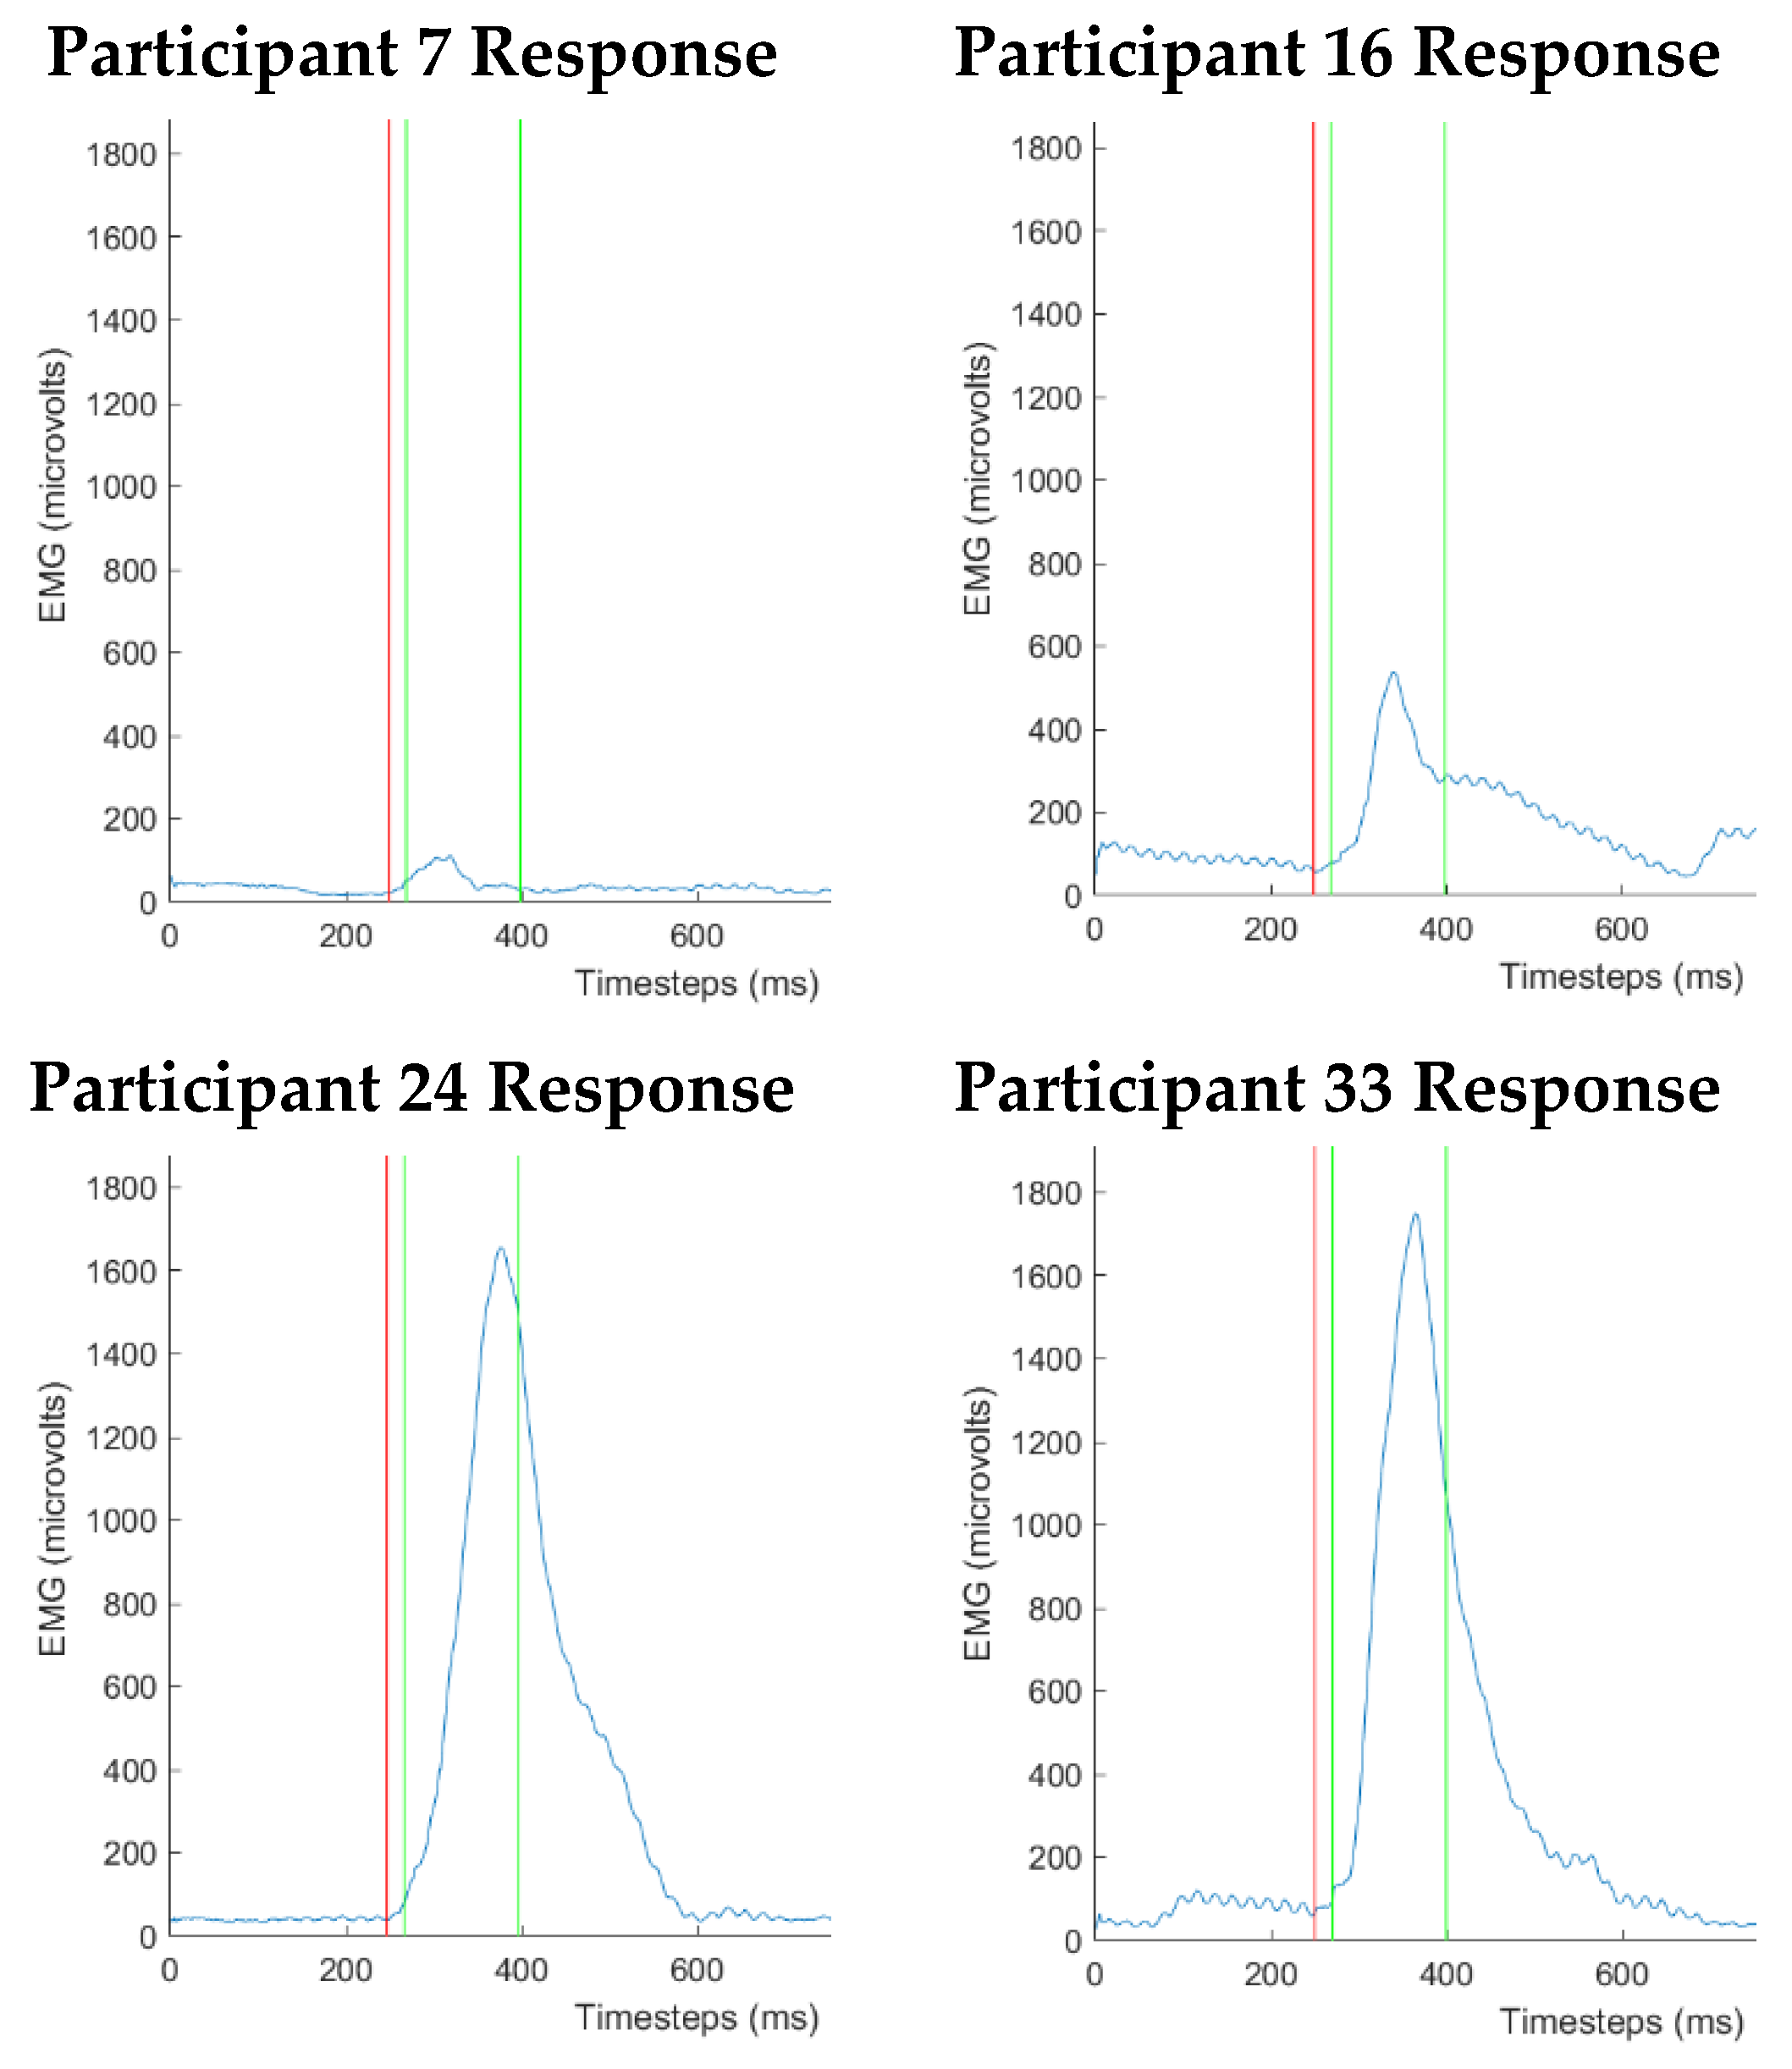
A major concern when recording f-EMG responses is the variability in f-EMG signals. This variability can be seen between participants, and within a single participant. Thus, a key aim for our research is to select a suitable objective approach for measuring and categorizing affective responses. While f-EMG emerges as a viable approach that has the potential to identify the key underlying emotional (pleasant/unpleasant) responses of individuals to visual stimuli, it does pose some problems. These f-EMG recorded signals are known to have a wide variation in the magnitude of responses between individuals. To demonstrate this variation, see Figure 4 where four different participants viewed the same unpleasant image leading to wildly different responses. Some of these variations can be explained by factors such as the end-user having an underlying low fear level or being exposed to phobia inducing imagery such as an image of a snake or spider [33]. However, these phobias are not the only cause. Therefore, effectively accounting for individual variability in f-EMG responses when participants view the same stimuli is a key challenge.
From this perceptive, Halaki and Ginn [34] suggest that it is not possible to evaluate the level of activity in muscles between individuals as the amplitude alone only indicates responses relative for an individual participant. One way to account for this is through the use of control measures to determine the scale of each participant’s response [17] as examined in this research. In this way, an individual’s responses to visual stimuli are measured and categorized relative to their responses to known visual stimuli.
As such, this research uses the International Affective Picture System (IAPS) [35], which is a set of known visual stimuli that provides normative pleasant, unpleasant and neutral images appropriate for use as a control set. The International Affective Picture System (IAPS), produced by the NIMH Centre for Emotion and Attention, is a set of emotionally evocative color images designed to prompt an emotional response from the viewer [35]. The images in this set have been assessed on the dimensions of pleasure, arousal, and dominance as part of a nominal rating procedure, to determine the mean response and standard deviation for each image. The availability of these images encourages better control over emotional experiment stimulus and encourage and facilitate comparisons across laboratories [35]. Codispoti and Bradley [36] argue that the use of affective images, such as IAPS, to elicit an emotional response is an effective cue for activating the emotional response. As f-EMG recording of the startle eye-blink reflex measures variations in the valence (pleasantness) of affect-based responses, IAPS presents as a particularly useful control image set for this research.
Our novel method explores a way to account for some of the variabilities in f-EMG responses in a pilot study that examines gender(sex)-based differences in affective responses to facial avatars. In both entertainment and serious games, avatar faces act as communication mediums for both explicit and implicit information. In serious games, where an added learning or educational aspect exists, avatar faces also act to convey knowledge [37], authority [38], or companionship [39]. The gender(sex) of an avatar is a key design choice in all these scenarios; however, the impact of this choice on end-users, and particularly end-users of difference gender(sex), is not well understood in human–avatar interaction [40,41,42,43,44].
There are many factors that can affect the perception of an avatars face in human–avatar interactions. These factors can translate from human-to-human interaction, particularly where avatars are used to convey human emotional expressions. There are several aspects that impact facial perceptions that enable everyday communication and interaction. These signals can provide information about a person’s identity, gender, race, and emotional state [45]. Furthermore, the perception of human faces can be influenced by factors such as cultural or societal expectations [46,47]. Each of these factors result in avatars that produce an emotional response in end-users that can be considered along the valence dimension of the emotion model we are using [48]. This means that f-EMG is likely to be useful to account for gender(sex)-based differences in these responses, provided an appropriate method for accounting for known individual variability is developed, which is the key aim of our pilot study.
We expect to see gender(sex) related differences in the perception of uncanniness relating to the uncanny valley based on several factors. Despite the many design choices that are available to designers, the impact of fundamental aspects such as the avatars’ gender(sex) and how this gender(sex) may influence the end user’s perceptions of realism and uncanniness is not well studied. Given that other perceptual responses, for example physical attraction, can be affected by gender(sex) [49], there is a possible link between the perception of gender(sex) and the perception of realism which is investigated in this research.
Lastly, one major factor that can influence the perception of an avatar can be the medium in which it appears. For example, whether the avatar is 2D or 3D, in virtual reality, a virtual environment or is superimposed into the real world using mixed-reality [50,51,52]. While this is an important factor that can influence the perception of the avatar, it is not directly considered in this work. Our avatars were presented as a close-up of their face and next on a gray/blurred background to try to minimize unintentional effects from the environment.
The details for collecting and analyzing our dataset for this novel method to account for individual variabilities in f-EMG responses are discussed next.
3. Materials and Methods
To collect our dataset, we conducted a series of lab-based experiments that were designed to evaluate gender(sex)-based differences in the perception of avatar faces. Treated as a pilot study, these experiments allow for refinement of an appropriate objective approach to measuring affective states. To refine this approach, our study asked participants to view a set of control images to establish individual affective response benchmarks and a set of videos of avatar facial expressions. In this section, we outline the participant demographics and the methods used for data collection, including the experiment procedure equipment, stimuli, and measures. These experiments were conducted with the approval of the University of Newcastle, Australia Ethics Committee (Ethics approval number: H-2015-0163).
3.1. Participant Demographics
The participants (n = 92) consisted of 44 (47.82%) female and 48 (52.17%) male undergraduate students, sourced from Computer Science and Psychology degree programs who completed the study in return for course credit. Due to this recruitment strategy, 59.8% of participants were aged between 18–25 years old. More than half the participants considered themselves to be computer/video gamers (55.2%) and the most frequently reported time spent with avatars (32.2%) was 0–5 h per week. Despite the relatively large portion of self-reported gamers in the cohort, almost half the sample had no character animation experience (48.8%) or no experience with character animation outside of course work (21.2%).
3.2. Experiment Procedure
At the commencement of the experiments, participants were briefed on the experiment process and to provide their written consent for participation. Participants were then asked to clean and dry electrode placement areas on the skin; reusable Shielded Biopotential Electrodes (Ag-AgCl, 4 mm, 3 pk) were attached to the participant with two electrodes under the left eye onto the orbicularis oculi, and one behind the left ear on the mastoid process.
Once attached, participants were asked to randomly blink to ensure the placed electrodes were capturing clear f-EMG responses; these blinks were deleted before the data capture began. If the signal was not clear, the position of the electrodes was adjusted until the issue was rectified.
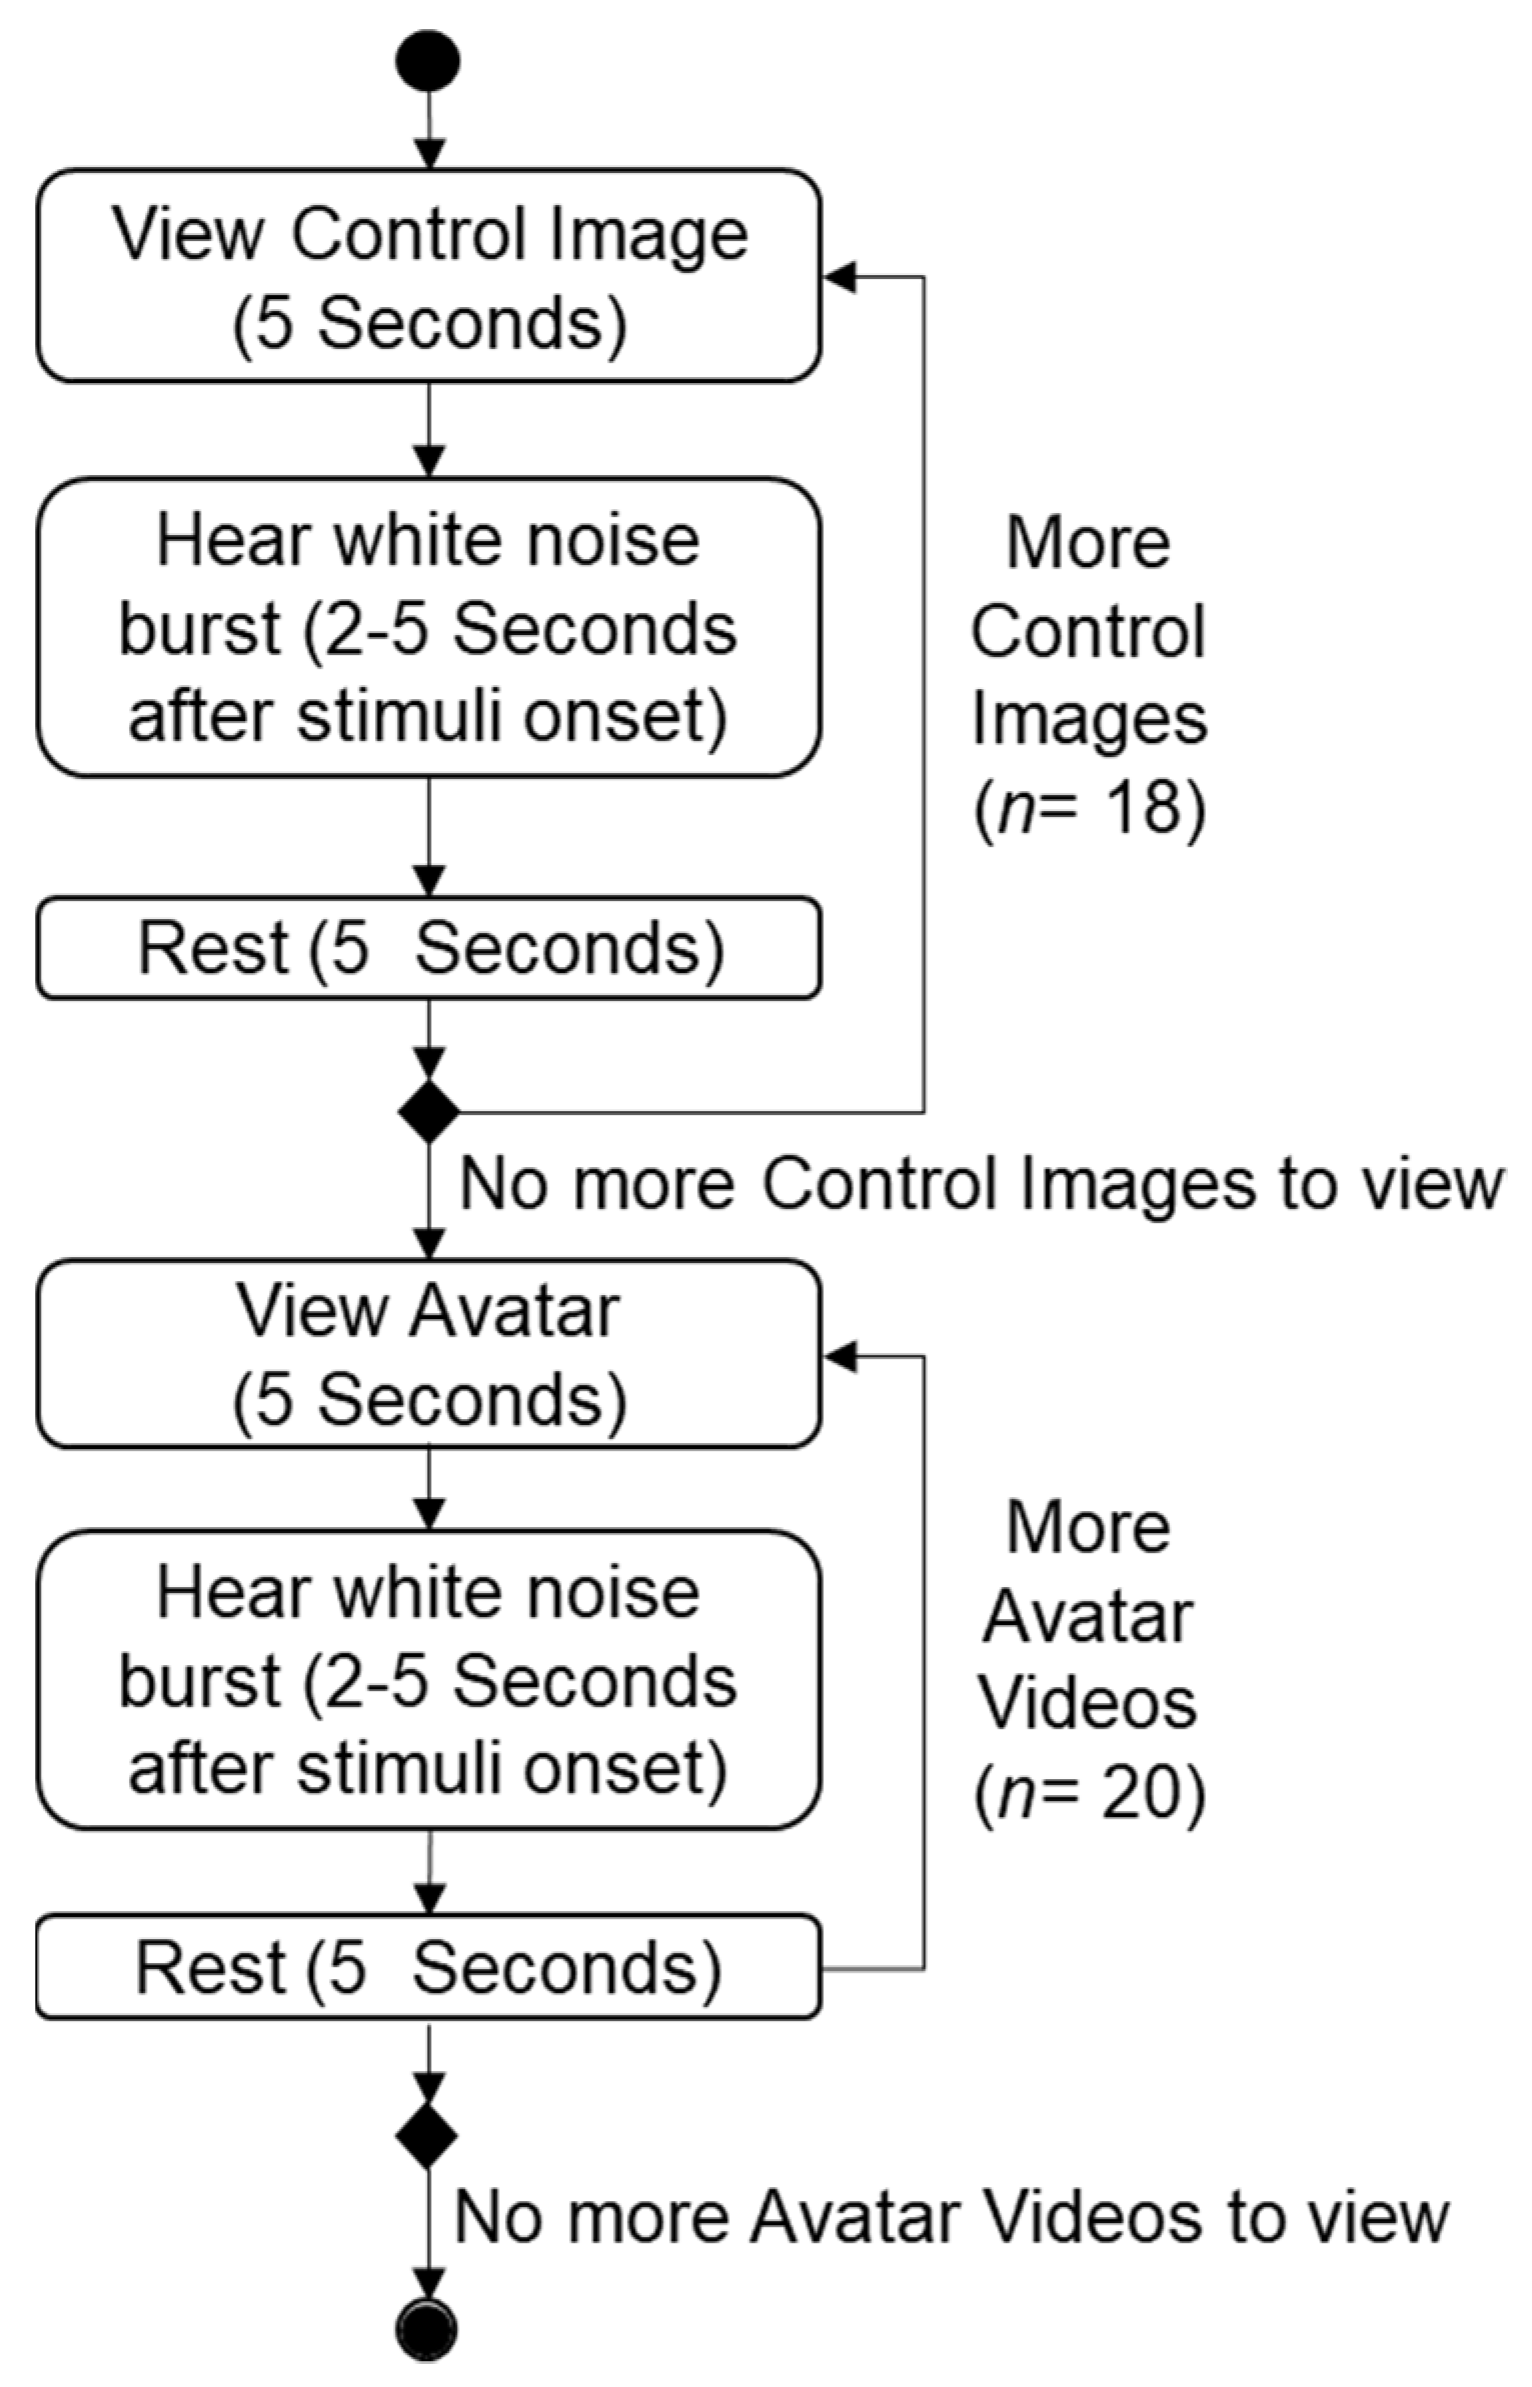
Figure 5 shows the procedure for collecting the f-EMG responses, which began with capturing the control image responses for the individual signal categorization. The control images used in this experiment were sourced from the International Affective Picture System (IAPS) [35]. The participant f-EMG responses were collected by displaying each control image for 5 s. A burst of white noise was delivered at a random interval of between 2–5 s during this viewing time, to induce the startle response [53]. Participants were provided with a 5 s rest period between each of the 18 control images. A similar approach was adopted for the avatar videos, whereby 20 individual 5 s videos, consisting of ten (10) avatars who appear twice, were shown to participants with a white noise burst delivered at a random 2–5 s interval to stimulate the startle response.
The experiment stimuli (control images and avatar videos) were displayed on a Samsung Smart TV 75 (1920 × 1080 pixels). Participants were seated approximately 1.5 m away from the screen facing the middle, as per the guidelines set by Blumenthal et al. [17]. A burst of white noise through a set of headphones (Sennheiser K-55 stereo) attached to an Arcam PMJ AVR380 amplifier was delivered at 100–105 dBs. Responses were recorded using Power Lab Bio Amps (ADInstruments Bio Amp (FE123)) feeding into a PowerLab 8/35. The responses were recorded using two 4 mm AG/AGCL electrodes for surface EMG, placed under the left eye on the orbiluaris oculi and one grounded behind the left eye on the mastoid process. These responses were recorded while participants viewed the stimuli discussed in the following section.
3.3. Stimuli
As previously mentioned, for our experiments, there were two types of stimuli; the Control Image Set and the Avatar Video Set. Outlined in the following section are the details of both sets of stimuli.
To compare and categorize participant f-EMG responses, we collected a set of control responses to standardized pictures using images from the International Affective Picture System (IAPS) [35] (see sample images in Table 1). These are a set of emotionally evocative color images that are designed to affect the emotional response of the viewer to measure areas of arousal, dominance, and valence. These images are provided with a normative set of scores which are rated on the dimensions of affective valence (pleasant-unpleasant), arousal (calm-excited) and dominance. In this study, we are focused on affective valence and therefore selected images based on the scores from this dimension.
Similar to the work of Bartholow and Bushman [54], we used images rated closely to 1 as our unpleasant images (negative valence), while images that are rated close to 9 were our pleasant images (positive valence), and neutral images were rated around 4.5. The valence and arousal means and standard deviations for the pleasant, unpleasant, and neutral categories selected for our experiments can be seen below (Table 2).
In total, for each category, we selected 30 images (10 each for the pleasant, unpleasantness and neutral categorizes), and our selection was based on the selection process in the work of Bartholow and Bushman [54]. These were then sorted into five different sets of control images. Prior to an experiment beginning, a set of images was randomly assigned to a participant to measure their responses to the control images. This randomization removes any potential bias in a participants’ control responses that might come from the specific images selected for the experiments. Each of the images shown to a participant were presented randomly to reduce any remaining unintentional bias from the previous image, with no two categories being the same for consecutive slides [55]. This process was used to ensure that any remaining perceptions from the previous category did not influence the response to the upcoming image.
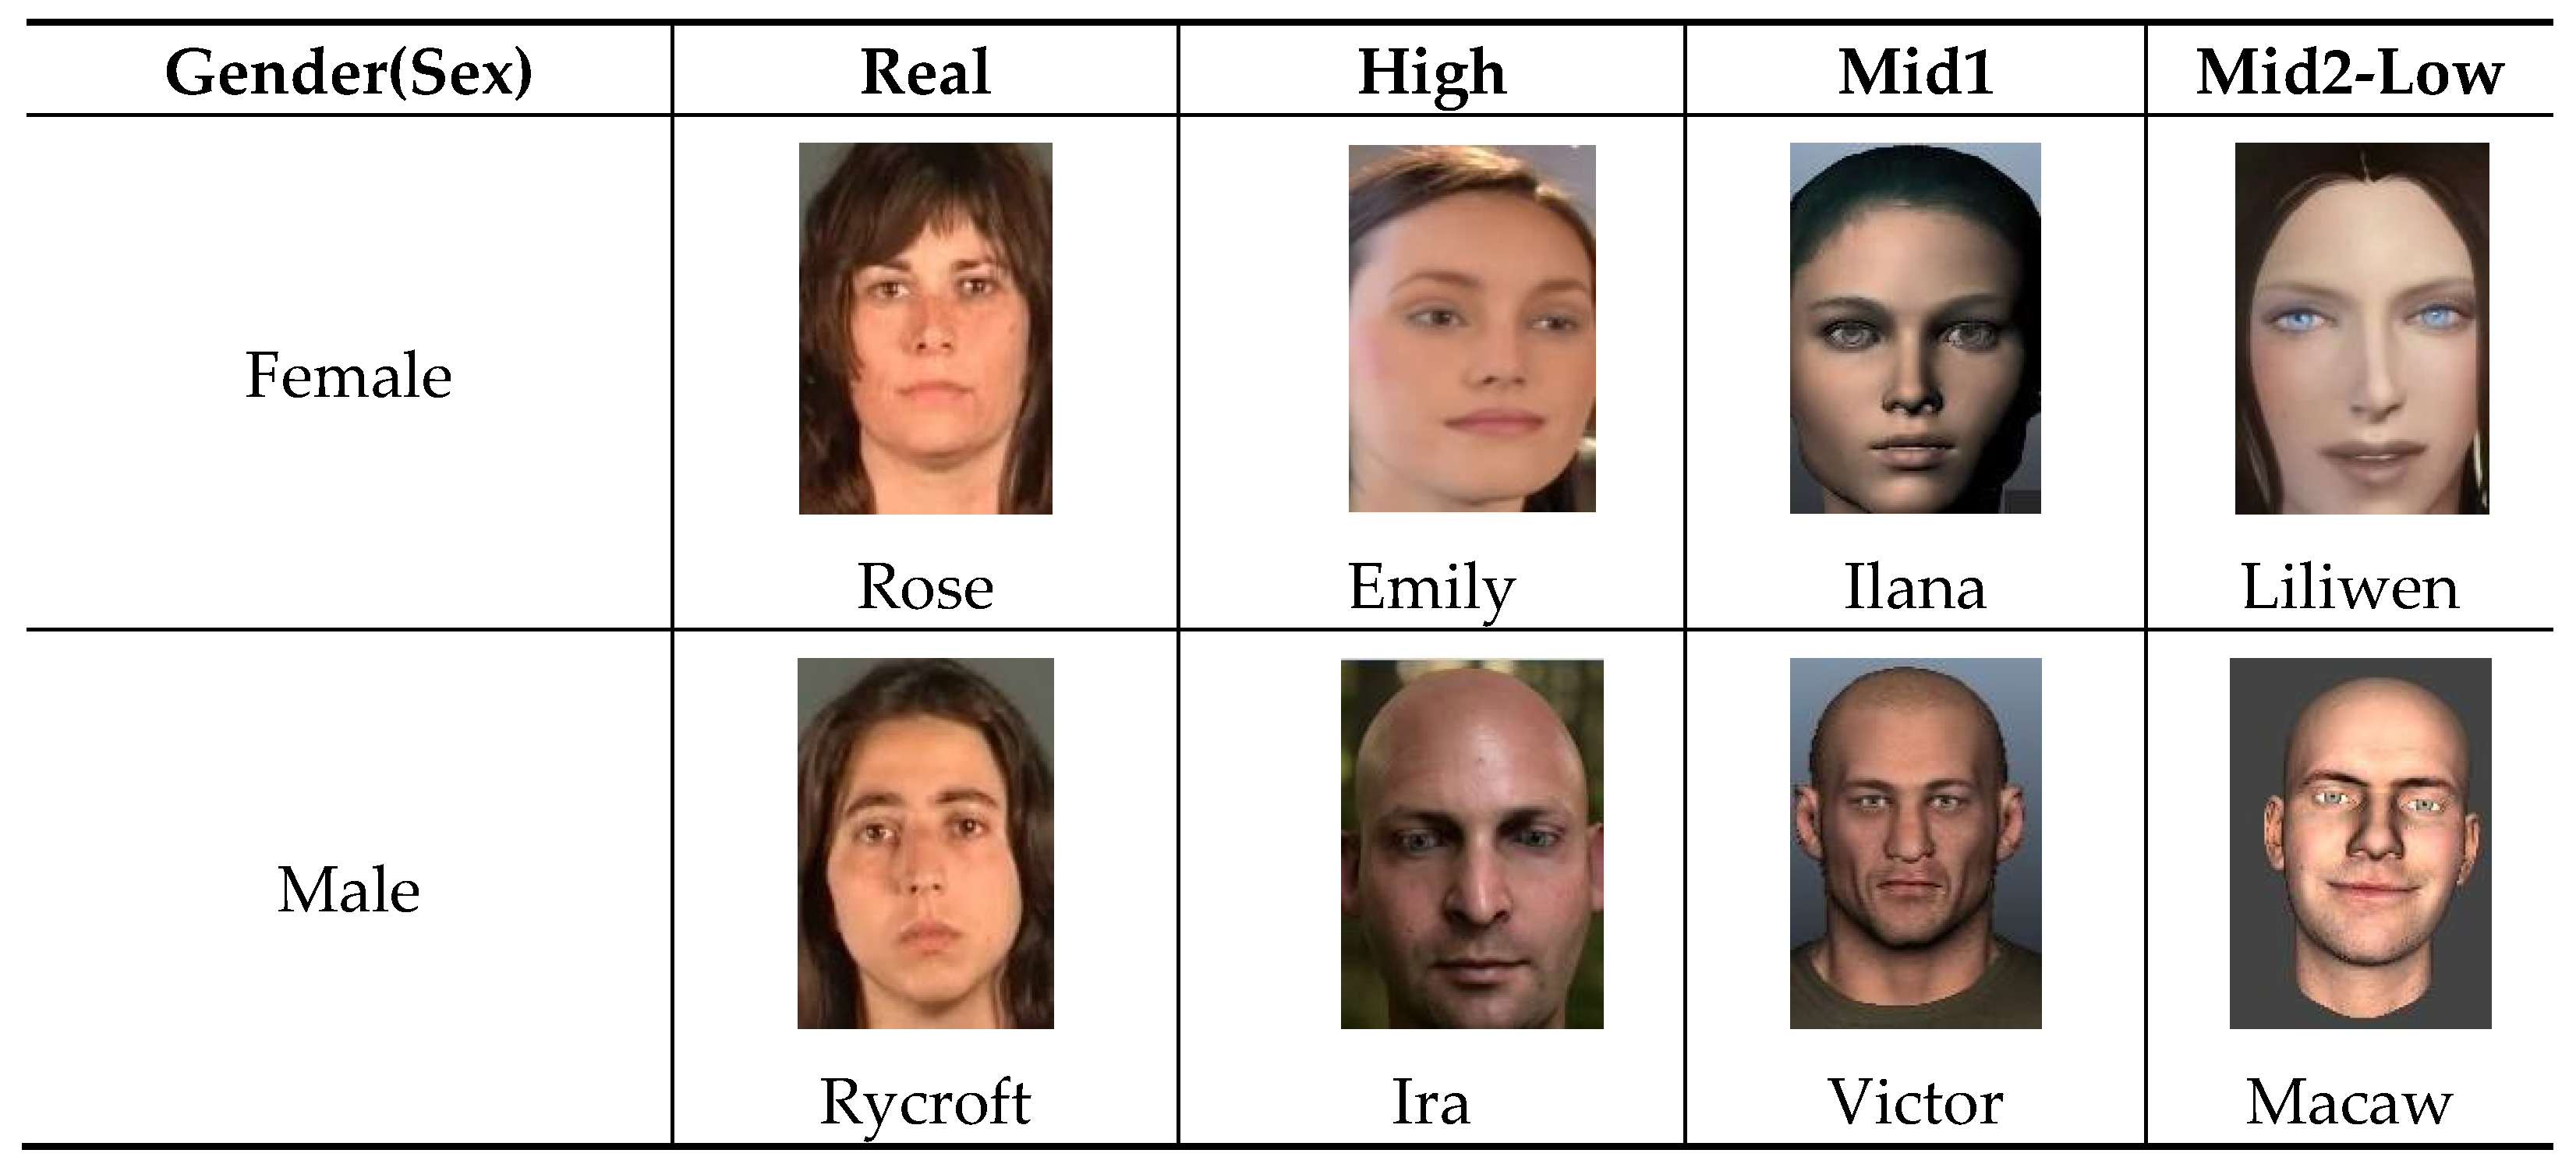
For our experiment, we used a set of 10 homogenous facial avatars of female and male biological gender(sex) and diverse realism levels (Figure 6). These avatars form a representative sample that would be found in simulation and training platforms.
The two real human faces are sourced from a database of kinetic facial expressions DaFEx known as Rose and Rycroft [56]. The higher realism avatars (Emily and Ira avatars) have been produced by the University of California and Image Metrics. The Mid1 & Mid2-Low realism avatars are sourced from several Commercial Off the Shelf-Software (COTS) applications. The Ilana and Victor avatars are sourced from Faceware [57], whereas Macaw and Leo are produced from FaceShift. Liliwen was an independently made avatar face sourced from YouTube that is representative of a user developed avatar from a commercial game [58]. Finally, the Bailie avatar was created in the 3D Avatar Store. Participants viewed the facial avatar set as 5 s videos that were seen twice, once while the avatar transitioned from a neutral expression to a happy expression and again when the avatar transitioned from a neutral to a sad expression. In total, participants viewed 20 videos. While the focus here is on gender(sex), there may be some unconscious effect stemming from the age of the avatar. However, this was not investigated directly in this study.
The Realism Levels for the avatar set were determined in a second online study with (n = 2065) participants. These participants were asked to rank each of the above faces from most to least realistic. The approach adopted here is akin to that used by Lange [59], who used a similar rating exercise for their study into realism perceptions of virtual landscapes. In both cases, a ranking rather than rating approach is adopted as these have been shown to have higher reliability [60,61,62,63]. Additionally, ranking approaches are considered a useful method of comparison to score items using a standard scale [64]. The avatar ranks were analyzed using Friedman tests to determine if there are significant differences between avatars in the perception of realism. Following a significant Friedman test, post hoc Wilcoxon signed-rank tests using a Bonferroni adjustment for multiple tests (significance level reduced to 0.0001) were conducted to examine where the differences occur in the rankings. Once the ranks were analyzed, we conducted a cluster analysis using the realism scores collected in this research to determine realism level subgroups. In order to find these subgroups, the cluster analysis grouped objects together based on their characteristics similar to the work of Hair [65]—in this instance, the realism scores given to each of the avatars. In this research, a simple k means cluster analysis of the avatar set realism scores was used to divide the avatars into realism level groups.
4. Results
Our results are presented in four sections; first, we present the process for validating the f-EMG responses in Section 4.1. Second, the outcome of the validation process to identify all valid f-EMG responses to both to the control images and avatar videos is discussed in Section 4.2.
Third, in Section 4.3, we discuss the results of assigning a classification to each of the participant responses to the avatar set to compare responses, where the control image categories of pleasant, unpleasant, and neutral are used to compare participant responses to the avatar video set.
The fourth and final Section 4.4 presents the results of the pilot study that examines the participants’ perceptions of our avatar set. Using a series of Mann–Whitney tests, we examine the differences between the control image categories assigned after the validation process for each of the avatars and their emotional expressions. Finally, we investigate the impact of participant biological sex on the perception of our avatar by control image category.
4.1. Validating the Responses
Validation of the f-EMG responses involves both automated and manual steps to confirm the correctness of each response. A valid f-EMG signal is considered to be one that a) has a single detectable peak f-EMG response in the interval 20–150 ms after each startle onset, and b) does not contain f-EMG activity, such as that associated with a normal eye-blink, in the baseline period. The automated steps involve signal processing to generate smoothed plots. The manual validation step relies on both raw and smoothed (using a moving −30 ms average) f-EMG response plots (see Figure 4 for a sample) to determine if there is activity in either the baseline or response window which would render the response invalid.
Manual validation of the f-EMG response signals followed a double-blind review process. First, Researcher 1 (the First Author) visually assessed each response from each participant and applied a validation code (0 = Accept, 1 = Reject, 2 = No f-EMG response detected, 3 = Unsure or possible latency issue). Following this, the First Authors judgments were hidden, and the validation task was assigned to Researcher 2, the Second Author, and the same validation process was re- applied. On completion, the separate judgments were amalgamated, with any discrepancies discussed and resolved.
4.2. Examining the Pleasant, Unpleasant, and Neutral Classifications
After the validation process was complete, we assessed the valid responses to the control image set for use in the classification of the avatar responses to compare participant responses.
From the total number of responses to the control image set, we can see that, for the pleasant category, there are 318 (77.6%) valid responses, 18 (4.4%) invalid responses and 68 (16.6%) non-responses. For the unpleasant images, 313 (74.9%) are valid, 38 (9.1%) are invalid, and 61 (14.6%) are classified as non-responses. Lastly, for the neutral images, 292 (73.7%) are valid, 25 (6.3%) are invalid, and 73 (18.4%) are non-responses (Table 3).
For the control image set, the validation process assessed 1206 participant responses. From these responses, there are a total number of 923 (76.5%), valid responses, 81 (6.7%) invalid responses, and 202 (16.7%) non-responses. Chi-square frequency analysis was used to evaluate the internal validity of the control images and avatar sets. The results of the analysis were statistically significant (χ2 (5) = 5769.71, p ≤ 0.000), indicating that the proportion of valid responses for the avatar set was higher than the control image set. The reasons for this may relate to the higher number of presentations overall in the avatar set (n = 1739) compared with the control image set (n = 1206), resulting in some conditioning effects. Additionally, during the experiments, the control set was always presented to the participants first, which may have contributed to this conditioning. However, the increased number of valid responses to the avatars is not considered to have any effect on the analysis of subsequent analysis as the actual response values are independent of the determination of their validity.
For the avatar set, each of the f-EMG responses were validated following the same process described above. In total, 1739 responses were recorded for the avatar set, 1367 (78.6%) of these responses are valid, with 93 (5.3%) being invalid and 279 (16.0%) being non-responses.
A search was conducted for other studies to compare the percent of valid, invalid, and non-responses. While many papers noted complexities with collecting and analyzing f-EMG data [60,61], these papers did not discuss in detail the ratio of valid, invalid, and non-response rates. However, a publication by Hookham [62] showed that portions for valid, invalid, and non-response rates are somewhat comparable to our work.
Once the validation process was complete for both datasets, a classification can be assigned to each participant’s response to the avatar set as outlined in the next section.
4.3. Assigning Pleasant, Unpleasant, and Neutral Classifications to the Avatar Responses
The valid responses to the control image set were used to classify classification of the participants’ responses to the avatars. Once the control image classifications were assessed, each participant’s mean pleasant, unpleasant, and neutral responses were calculated to give a score for each classification. These scores were used and then used to classify individual participant responses to the avatar set using a nearest neighbour calculation.
The results of the nearest neighbour calculation show the allocation of all 1367 valid responses into 469 (34.3%) pleasant responses, 456 (33.3%) unpleasant responses, and 442 (32.3%) neutral responses for the avatar responses.
Once the allocation of a classification of all valid responses to each avatar was conducted, the data were used in our study to examine gender(sex)-based differences in the perceptions of facial avatars. Using these classifications, our study investigated whether the pleasant, unpleasant, and neutral classifications can provide insights into the data collected for the avatar set, which is discussed in the next section.
4.4. Case Study Results
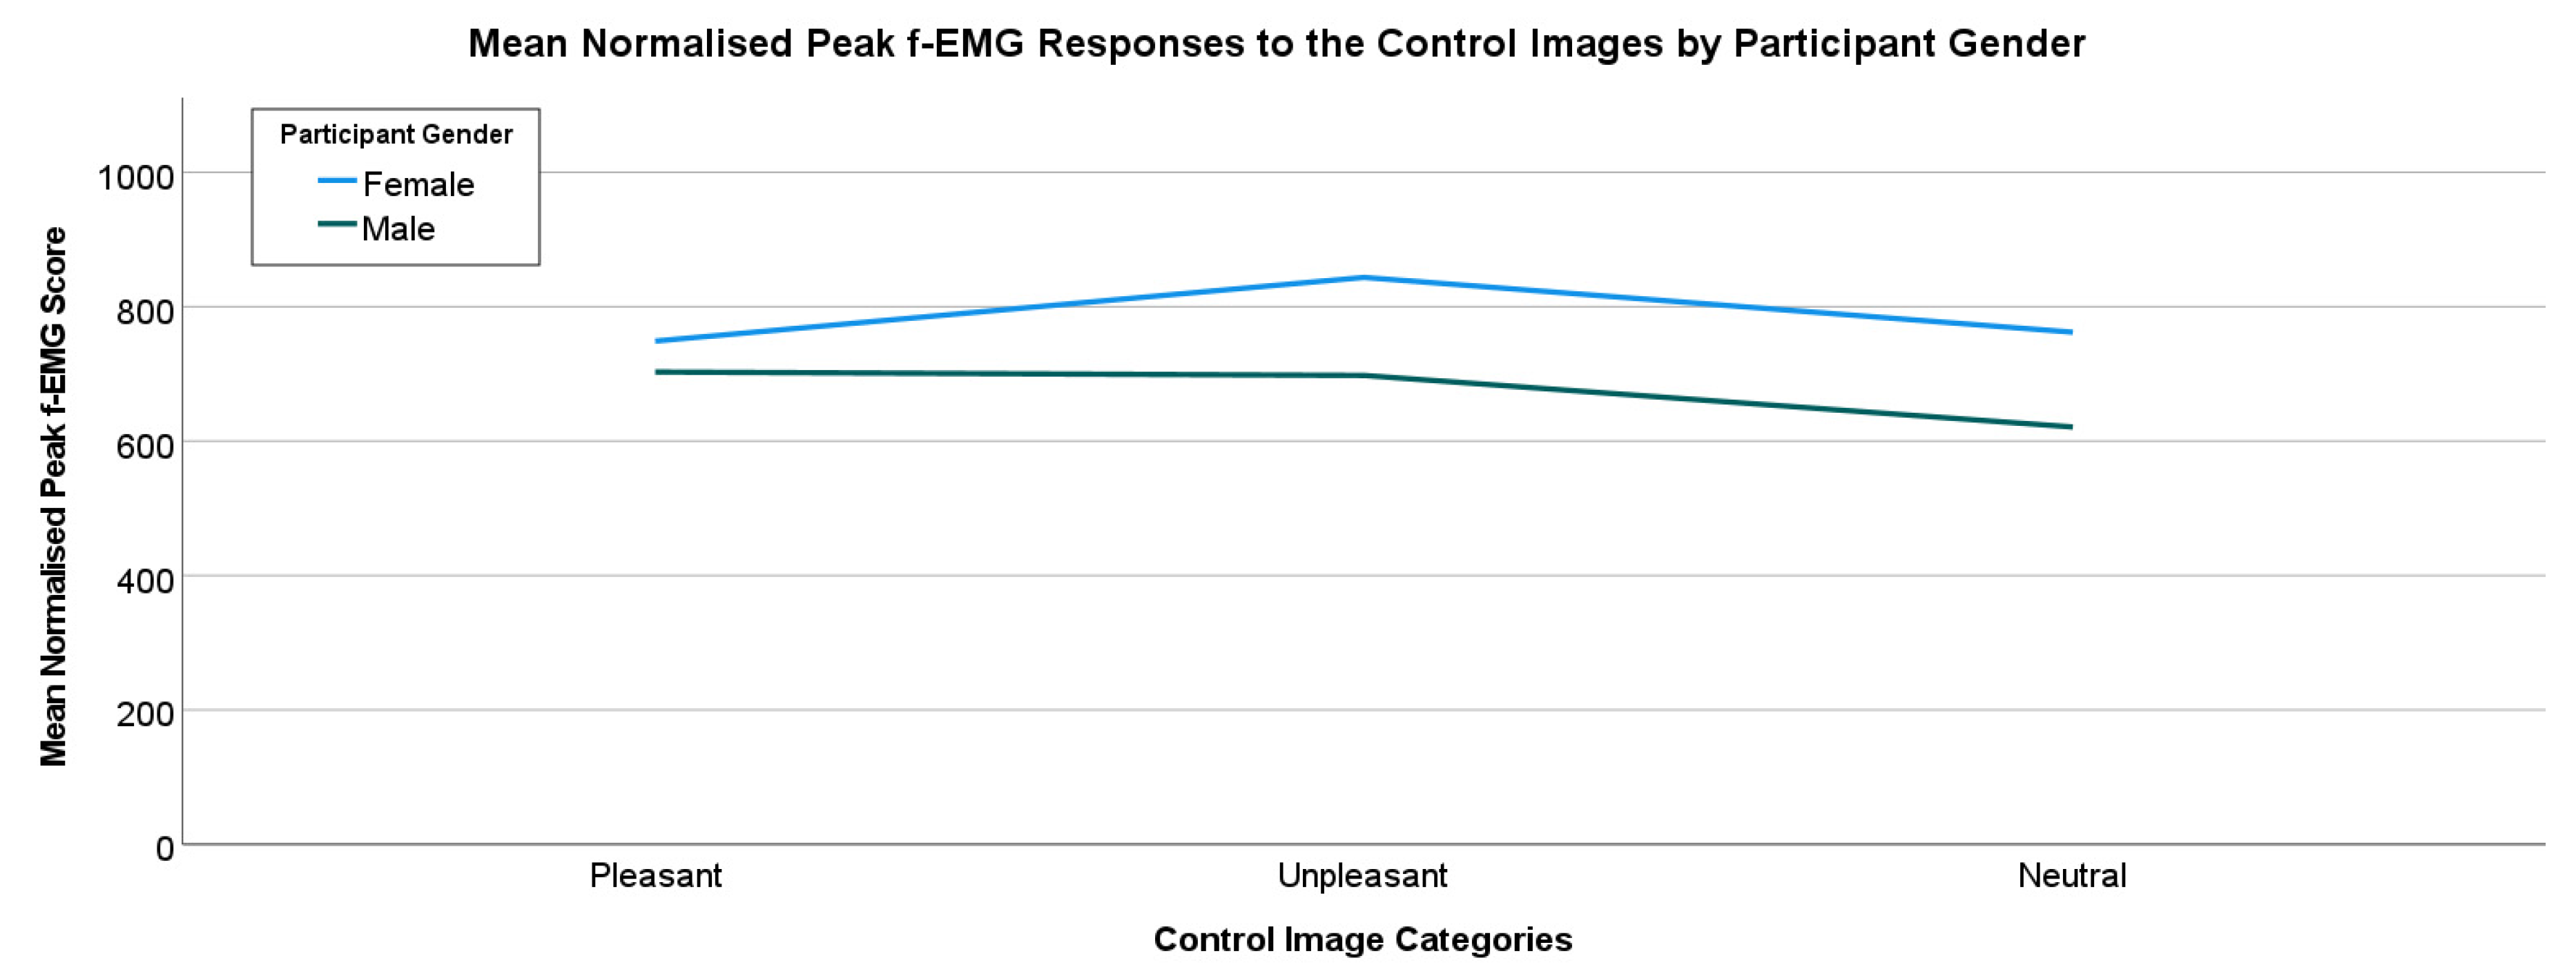
Overall, for the control image set, the unpleasant images have the highest mean f-EMG response for all participants (M = 903.95, SD = 851.66). However, this result is very similar to the pleasant response. Neutral images have the lowest response (M = 818.27, SD = 728.92) and responses to the pleasant images (M = 852.64, SD = 717.65). However, an analysis of the overall responses by the Control Image Categories reveals no statistically significant differences. Further analysis of the responses to the Control Image Set by participant biological gender(sex) shows some differences in the categories (Figure 7).
Generally, female participants have a higher mean response to the Control Image Set in each category. The most noticeable difference is seen in the unpleasant category, with female participants (M = 843.69, SD = 1005.01) having a higher mean than their male counterparts (M = 697.79, SD = 619.43). However, responses to the neutral images also have a visible difference, with females having a higher mean response (M = 762.17, SD = 878.53) than the male participants (M = 621.09, SD = 557.01). Finally, there is also a clear difference in the perception of pleasant images between females (M = 748.93, SD = 790.90) and males (M = 702.93, SD = 622.44), although the differences in mean scores are smaller than the other categories. Despite these perceptible differences, there were no statistically significant differences between female and male participants when compared by category.
Though the total sample size is 92 (n = 92) for this study, it is worth noting that the breakdown of valid responses by participant biological sex leads to a smaller subset of samples. For the pleasant responses, there were more valid responses for the male participants for all the control image categories (pleasant (female (n = 26), male (n = 48)), unpleasant (female (n = 26), male (n = 47)) and neutral (female (n = 39), male (n = 46))).
4.4.1. Case Study Results: Classified Responses to the Avatar Set
As previously discussed, using f-EMG to measure affect-based responses gives an objective measure of valence, where large and fast responses are associated with negative affect (unpleasantness) and small and slow responses are correlated with positive affect (pleasantness) [28]. However, as discussed, there is an inherent problem with individual variations in the f-EMG responses which makes comparisons between participants difficult, if not impossible [34]. Therefore, this section seeks to examine whether using standardised images to benchmark an individual participants response to pleasant, unpleasant, and neutral images may assist in accounting for some of the individual variations in f-EMG responses to enable a comparison across individual participants and indeed for this case study, comparisons between gender(sex) based on these individual responses.
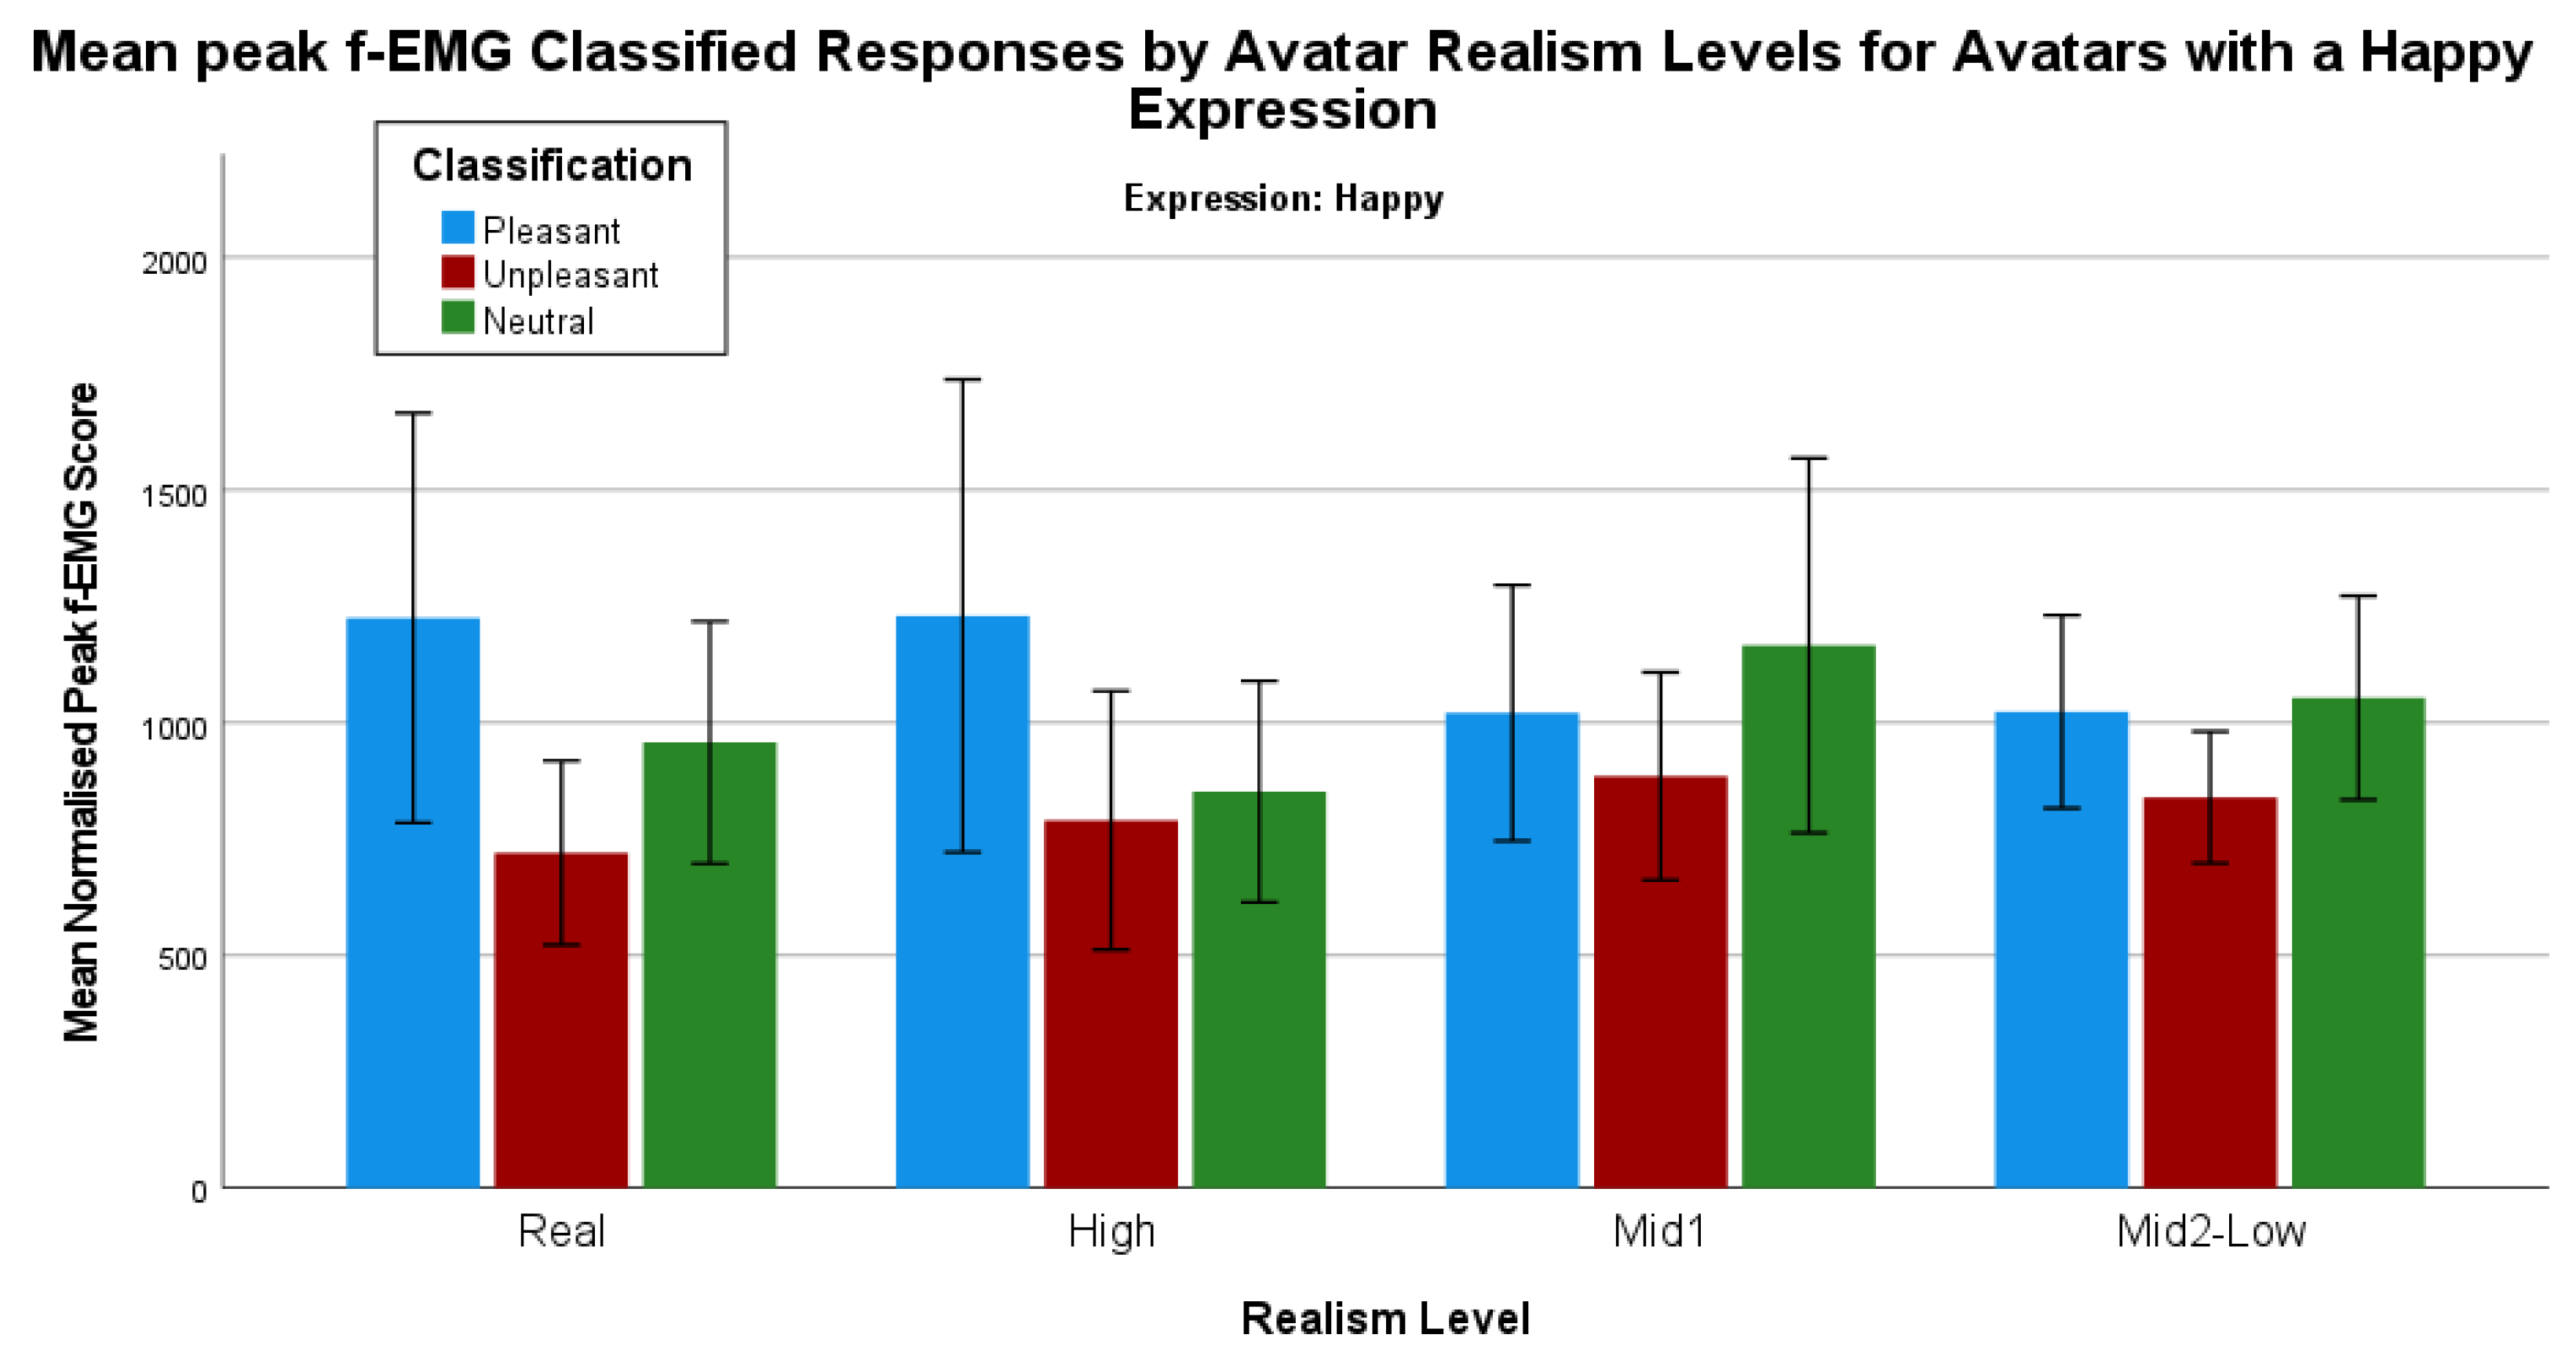
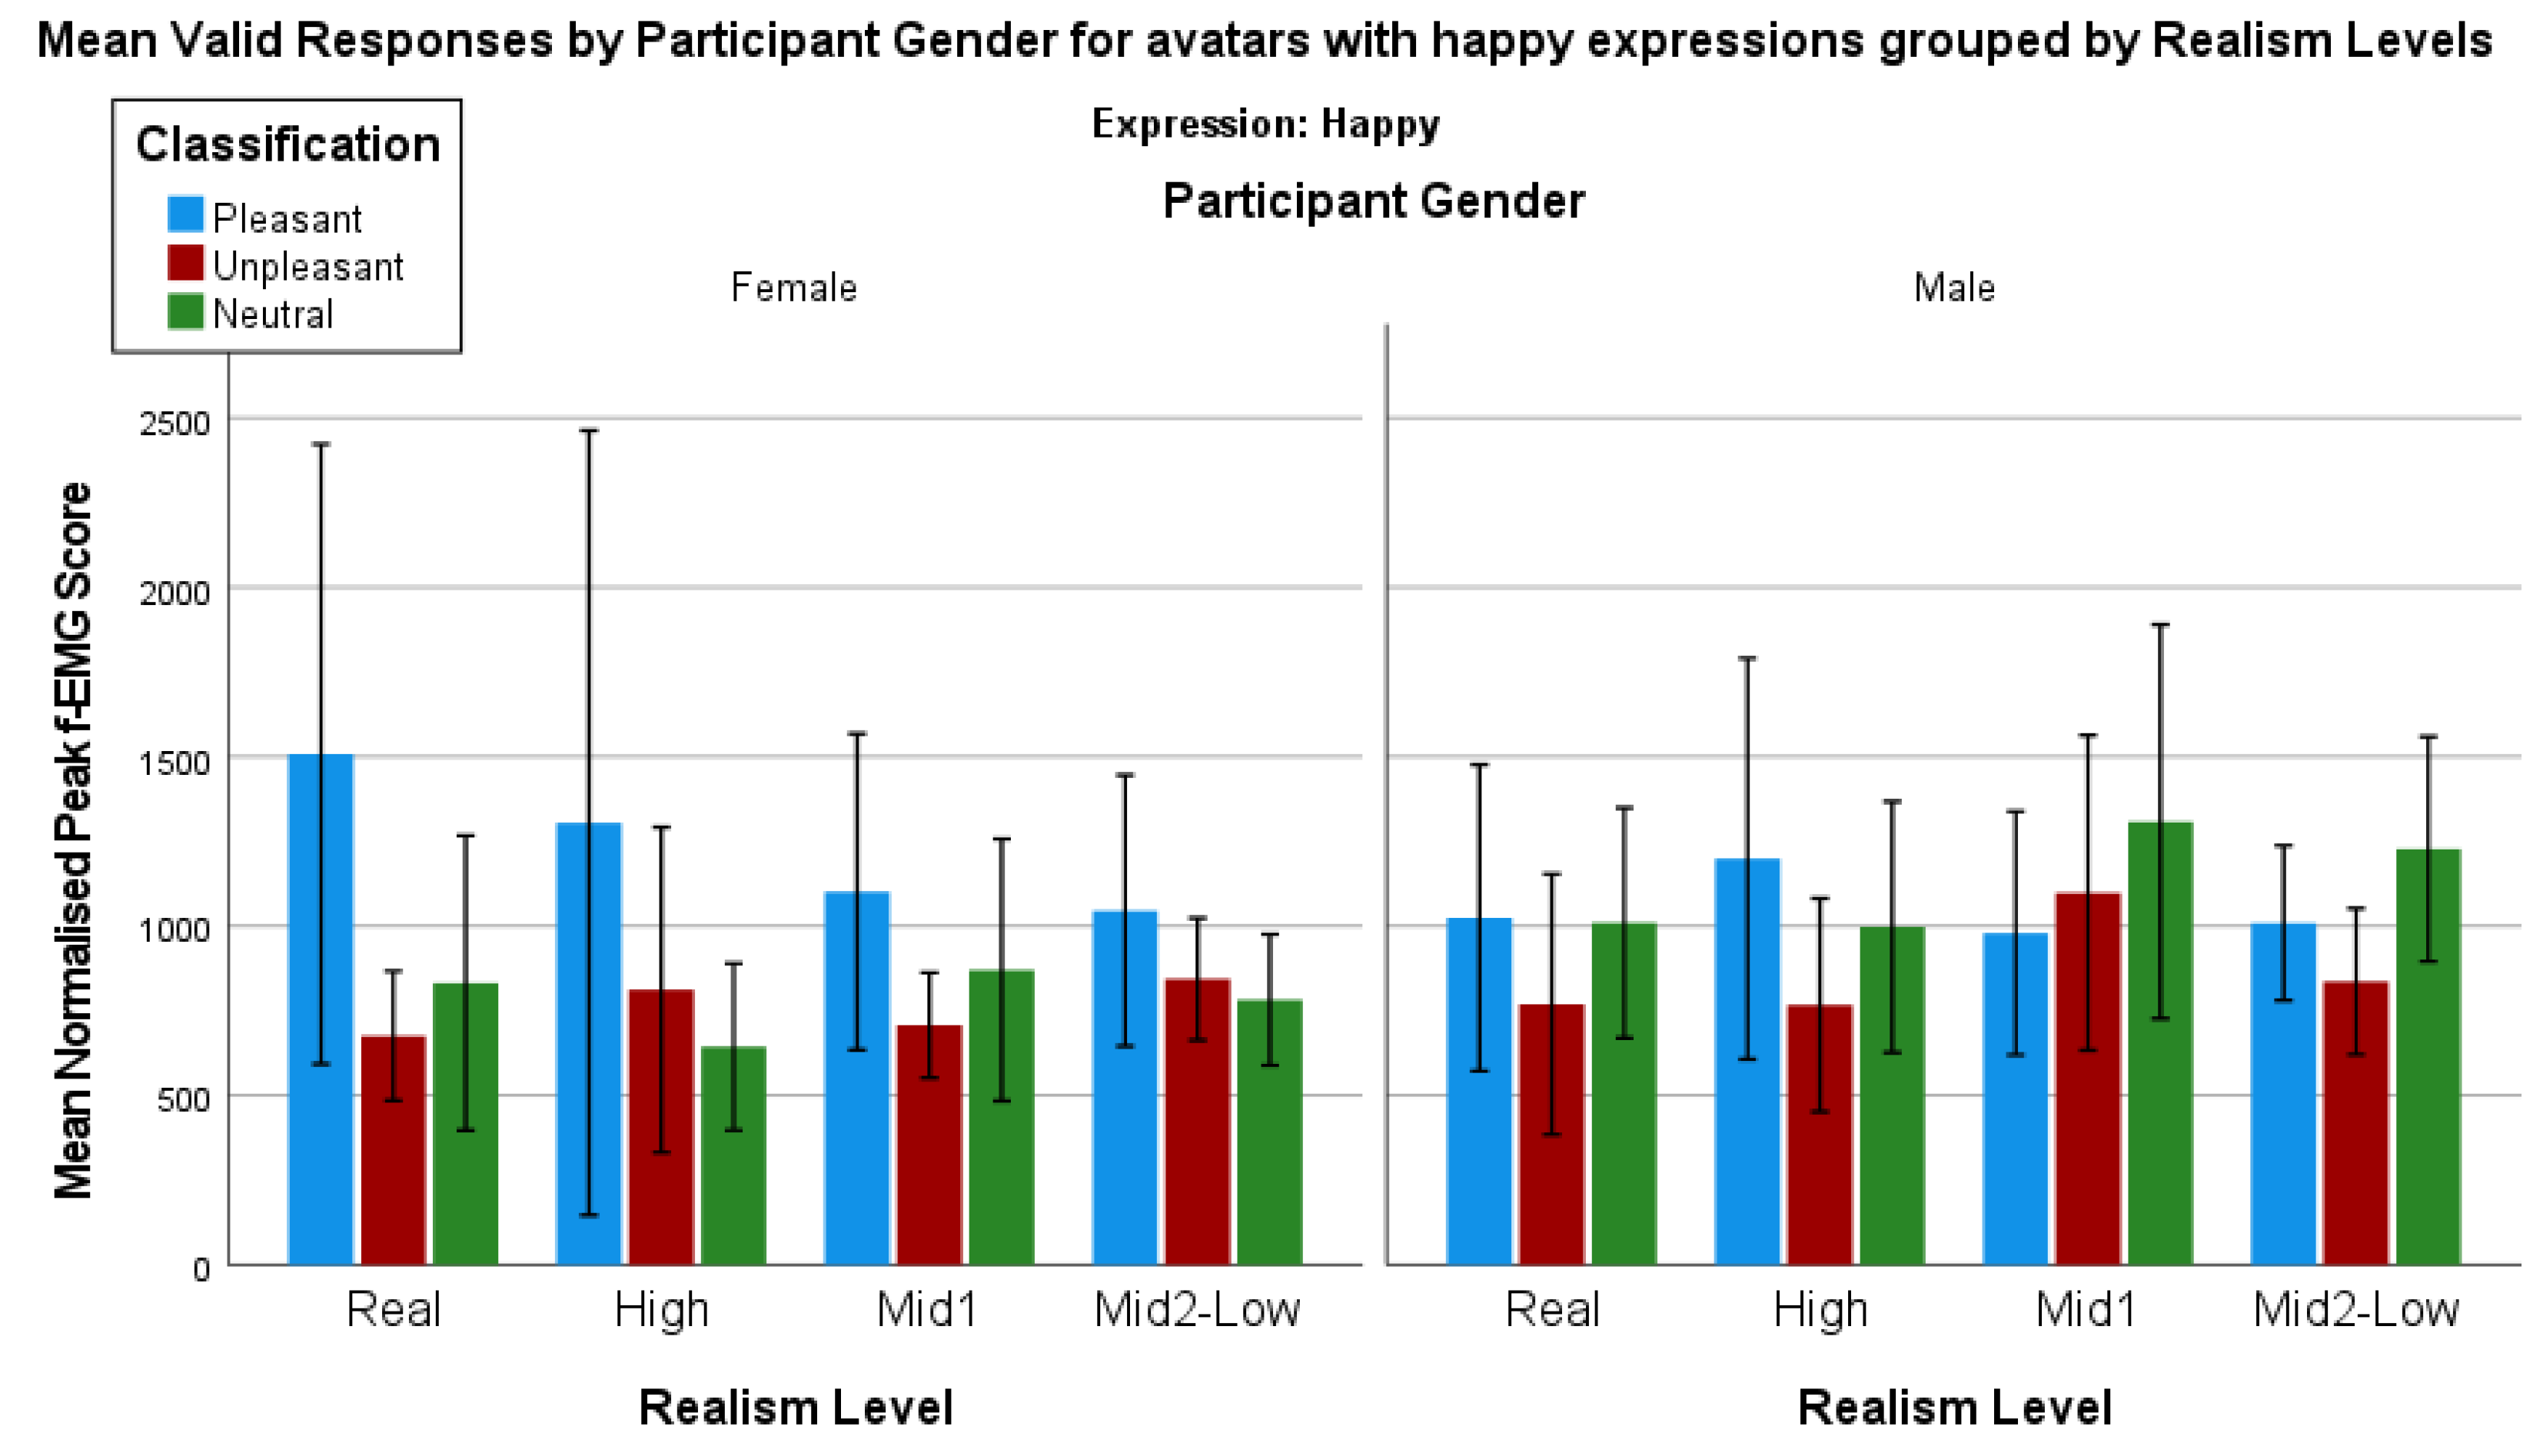
Mean responses to each avatar with a happy expression, grouped by the pleasant, unpleasant, and neutral classifications derived from the control image responses for each individual participant, indicate some interesting visual differences (Figure 8).
To determine whether the sex of an avatar affects a pleasant, unpleasant, and neutral perception, a series of Mann–Whitney tests were conducted. First, determining whether there are any statistically significant differences between the categories for each avatar with a happy expression shows some statistically significant differences. There are two statistically significant differences between the comparisons for the real human male with a sad expression. First, there is a difference between the pleasant (mean rank = 26.71) and unpleasant (mean rank = 18.65) responses U = 153.00, z = −2.079, p = 0.04. Second, for the real human male with a sad expression, there is also a statistically significant difference between the unpleasant (mean rank = 17.26) and neutral (mean rank = 25.78) responses U = 121.00, z = −2.259, p = 0.02. All other comparisons are not statistically significant.
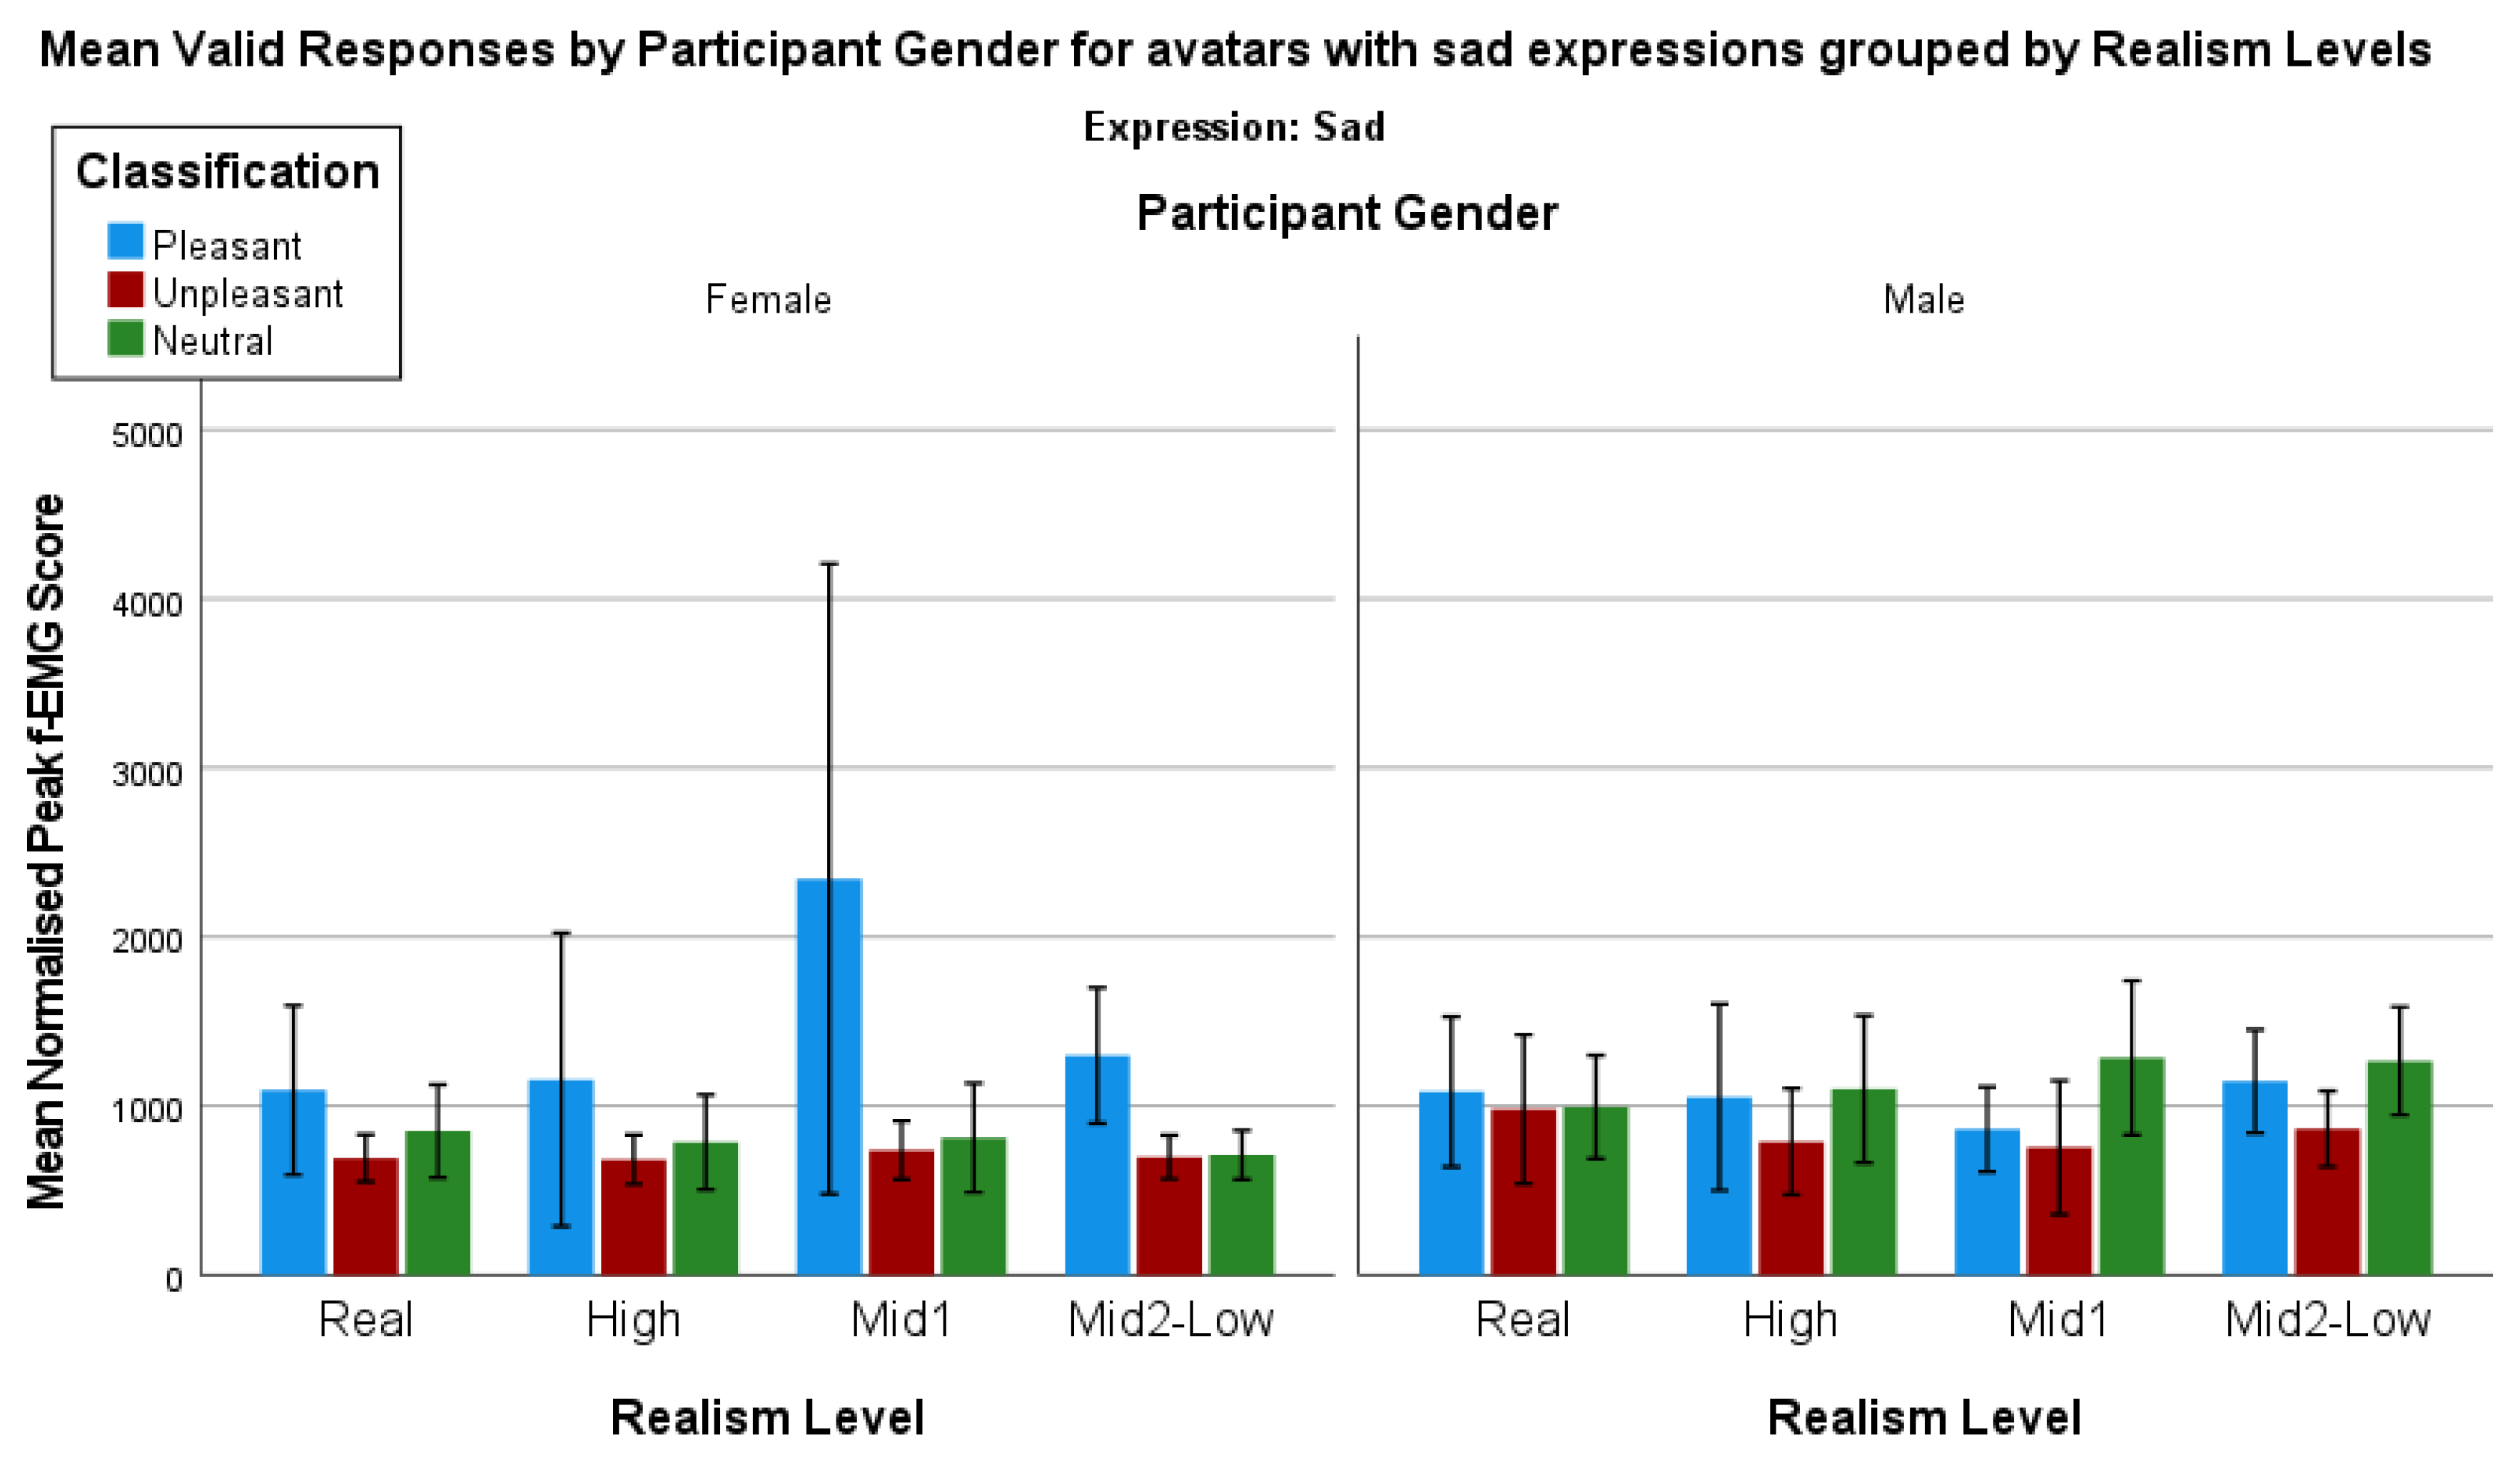
Continuing with the analysis of responses grouped by categorized response, the count of valid responses for the avatars with sad expressions shows some interesting trends (Figure 9).
Using a series of Mann–Whitney tests to determine whether there are any statistically significant differences between the control image categories and avatars with sad expressions shows some differences. There is one statistically significant difference when comparing the pleasant (mean rank = 30.91) and unpleasant (mean rank = 22.28) responses for Macaw, the one of the Mid2-Low realism male avatar U = 211.00, z = −2.054, p = 0.04. All other comparisons are not statistically significant.
4.4.2. Case Study Results: Comparing the Classified f-EMG Responses by Participant Biological Sex
Analysis of the avatars with a happy expression by the control image classifications can be furthered by considering the potential impact of the participants biological sex (Figure 10).
A series of Mann–Whitney tests were used to determine whether there are any statistically significant differences between the control image categories for each avatar when comparing the female and male responses to happy facial avatar expressions. However, despite the visual differences, there are no statistically significant differences when comparing the female and male responses to each avatar and their happy expressions when the responses have been grouped by the control image categories.
Finally, when analyzing avatars with a sad expression by the control image classifications and biological sex, some interesting trends emerge (Figure 11).
We again use a series of Mann–Whitney tests to determine whether there are any statistically significant differences between the control image categories for each avatar when comparing the female and male responses to sad expressions. There is one statistically significant difference when comparing the female neutral (mean rank = 7.64) and male neutral (mean rank = 14.70) responses for Bailie, one of the Mid2-Low realism female avatars U = 18.00, z = −2.60, p = 0.01. All other comparisons are not statistically significant.
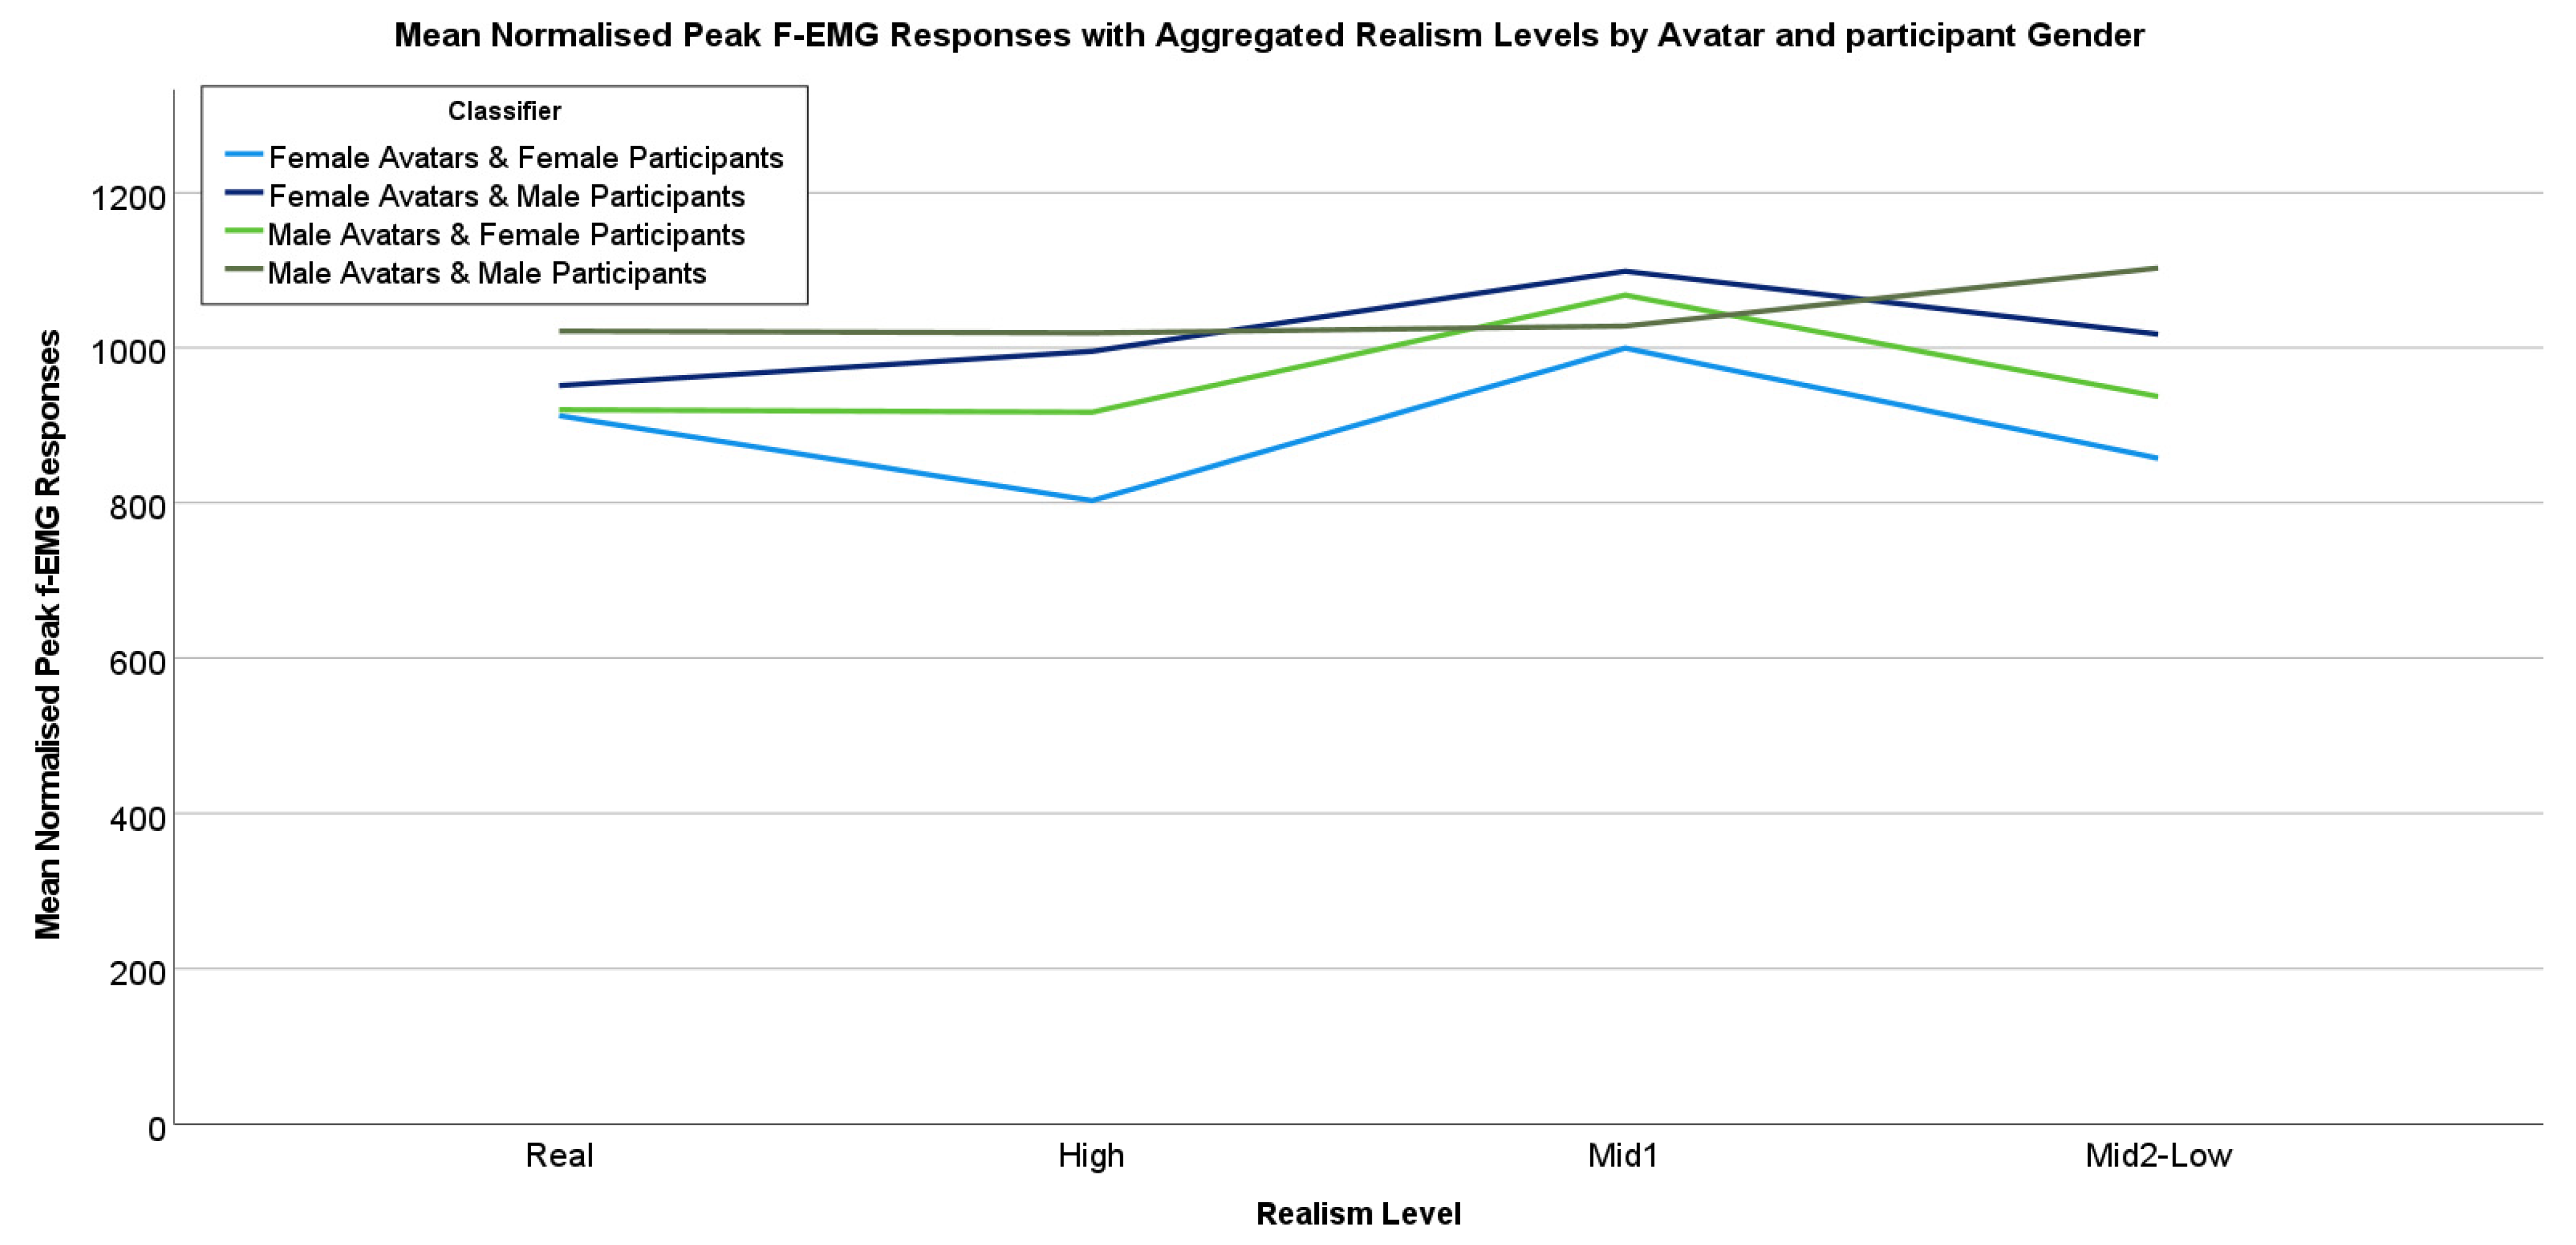
Lastly, we present the mean normalized peak f-EMG responses that have been aggregated by the realism levels of the avatars and participant gender(sex) (Figure 12).
The data here are broken down into four categories, female participants viewing female avatars, female participants viewing male avatars, male participants viewing female avatars, and, lastly, the male participants viewing male avatars. As can be seen in Figure 12, female and male avatars with the ‘Real’ level of realism are very close for female participants. This may indicate that the female participants found the real avatars somewhat pleasant regardless of the avatar’s gender. In contrast, male participants had somewhat higher responses to the ‘Real’ avatars, which may indicate a more unpleasant response regardless of the avatar’s gender when compared to female participants. The lowest of all the mean responses for this dataset is for the female avatars when viewed by female participants for the high realism avatars. This may indicate that the high realism female avatar was the most pleasant avatar for the female participants overall. For the Mid1 realism avatars, all the responses were somewhat high, with each reaching higher than the Real and High subgroups, except for the male avatar and when viewed by male participants. Lastly, the male Mid2-Low realism avatars when viewed by male participants appear to be more unpleasant than others in this subgroup. This may suggest that some perceptual differences based on the mid-low realism levels of an avatar can be affected by realism perceptions and both participant/avatar gender(sex).
5. Discussion and Conclusions
Existing research demonstrates that measurement of f-EMG responses to visual stimuli produces an objective measure of affect-based responses in humans [19]. However, complications in the understanding of f-EMG data arise from the differences in the peak amplitude to the same stimuli. High variability in f-EMG responses is a known issue and was evident in our experiment results. In line with observations from Blumenthal and Cuthbert [17], this variability extends across responses to different stimuli by the same individual, as well as variability in responses across individuals. In our study, we aimed to classify individual participant f-EMG responses to account for some of the known variabilities found in these responses.
These individual variabilities in the f-EMG responses can stem from variations in both the person and the stimuli. For example, if a participant is shown six pleasant images, the responses may not have a consistently low responses, which are associated with pleasant (positive) stimulus [24]. Such trends were evident in our data, and several participants recorded a range of responses to each of the categories of pleasant, unpleasant, and neutral rather than a simple binary response of low/pleasant (positive) and high/unpleasant (negative) responses.
Furthermore, as seen in the example above (Figure 4), each of the participants were looking at the same image and their responses have been classified as unpleasant, the actual peak of their f-EMG response is vastly different, ranging between 150 and 1700 microvolts. Interestingly, for some participants, we see that the responses to the pleasant and unpleasant stimuli are the reverse of what was expected from the literature. Thus, it is important to consider differences between participants and within the valid responses of a single participant when comparing f-EMG responses. In this study, we have used a set control images as a method to account for these variabilities.
We seek to better account for this variability by using the images from the International Affective Picture System (IAPS) [35]. Using the responses to the IAPS images, we explore each participant’s response to standardized pleasant, unpleasant, and neutral images, and use these responses to categorize their responses to the facial avatar videos in our case study. These responses to visual stimuli are induced by triggering the human startle eye-blink response, which acts as a measure of the subconscious priming of humans and can be used to determine whether an individual’s response to stimuli is pleasant (positive) or unpleasant (negative) [24]. Using these responses, we can represent how a participant subconsciously views visual stimuli, provided these measures account for individual variability.
However, before we can account for the variabilities in the responses, the validation process must be completed. Although we have many valid responses, in some instances, the number of valid individual startles were low for some participants which made it difficult to clearly identify what was a typical f-EMG response for some individual’s responses to pleasant, unpleasant, and neutral images.
Further complicating the analysis of the responses were the number of non-responses. These non-responses occurred more frequently than the invalid count for the control image and avatar sets. For example, for the control image set, we see there were 81 (6.7%) invalid responses and 202 (16.7%) non-responses, and, for the avatar set, there are 93 (5.3%) and 279 (16.0%) non-responses, which leads to 283 (23.4%) responses from the control image set and 372 (21.3%) responses to the avatar set reducing the overall amount of available data for analysis.
Furthermore, the count of valid results also impacts the results of our case study. While there are some statistically significant differences between the f-EMG responses to the avatars, the number of valid responses was considerably limited when divided by participant biological sex. Given the modest sample size of our study, a post hoc power analysis revealed the basis of mean, between-groups comparison effect size observed in the present study with an n of approximately 1674 needed to obtain statistical power at the recommended 0.80 level, all of which would need to be valid responses. However, obtaining 1674 valid sets of f-EMG responses would be a time-consuming process, as any invalid and non-responses must be excluded from the analysis.
However, using our novel approach to categorize f-EMG responses to account for variabilities, we were able to see some interesting insights in our dataset used in the pilot study. This approach shows promise as a method to interpret the significant variabilities found in f-EMG responses in terms of classifying responses as pleasant, unpleasant, and neutral.
Our analysis using the valid and categorized responses (pleasant, unpleasant, and neutral) shows several interesting differences between the female and male participant responses to the facial avatars. As previously stated, we expect to see gender(sex) based on other perceptual responses, which can also be affected by gender(sex). For example, physical attraction based on physical attributes can be affected by gender(sex) [49], and there is a possible link between the perception of gender(sex) and the perception of realism which was investigated in this research. First, the female participants found Emily, the higher realism female avatar with a happy expression, largely unpleasant, while the males have a larger pleasant response. Second, the female participants consistently found all the Mid2-low realism avatars with sad expressions to be mostly pleasant while the male participants have more variation in their responses.
Third, there is a statistically significant difference between female and male participants’ neutral responses to Bailie, one of the Mid2-Low realism female avatars with a sad expression, suggesting that, while both the biological sexes (female and male) have a largely neutral response to this avatar, the response is not the same in both genders(sexes). This may suggest that the categorization of responses may provide additional insight to show the differences in perception of facial avatars for female and male participants.
The facial expression of the avatars is another important factor to consider. For example, for the responses to Bailie, one of the female Mid2-Low realism avatars, the highest mean score for the happy expression is neutral, whereas the sad expression is perceived as largely pleasant as reflected in the higher mean score. The only characteristic of the avatar that changed was the expression; all cosmetic attributes and realism levels remain the same.
Therefore, the key recommendation from this pilot study may be to design an avatar who will return either a pleasant or neutral or close pleasant-neutral response such as Bailie, one of the Mid2-low realism female avatars with a sad expression when a user base is predominately male. Avatars that have a clearly dominant pleasant or neutral response or have close pleasant-neutral responses may reduce the impact of unpleasantness for end-users. If an avatar is rated either unpleasant or bordering on unpleasant, it may be worth considering whether that avatar is suitable for use in wider applications as a significant portion of the end-users may find the avatar unpleasant.
However, for avatars that are designed to make participants feel unpleasant, for example, in training scenarios, avatars with a high mean unpleasant score would be ideal. A direction for future work could generate a set of deliberately uncanny facial avatars to investigate how this would impact the participants’ f-EMG responses, and, in particular, f-EMG responses show a high unpleasant score. Using the approach outlined in this research, avatar designers could use this method to somewhat objectively categorize their avatars and aim for the intended pleasant, neutral, or unpleasant response in their end-users.
While our method may have proven to be a viable option for measuring physiological feedback that aligns with similar studies, future work should also include a second physiological measure to account for potential issues such as detecting and identifying anomalies that may affect the results for example electrode lift or improper placement. Further exploration of this method will include a mixed-method approach using a second physiological marker or sensor like eye tracking.
Additionally, future work using this method should consider using control images devoid of human faces, in order to avoid potential overlap. Furthermore, at the time of data collection, to the best of our knowledge, there were no comparable video sets available to be used as Control Stimuli, leading to some questions of image and video comparisons.
The research presented here contributes to the knowledge of the use of standardized imagery and f-EMG recording as an approach that can give a better understanding of end-user perceptions of avatars in terms of the uncanny valley—that is, how pleasant or unpleasant (uncanny/eerie) the end-users find an avatar to be. The key contribution of this technique is to design and test avatars that will return either a pleasant or neutral or close pleasant-neutral response. In practice, ensuring that the avatars produced are largely accepted as pleasant or neutral or pleasant-neutral may reduce the impact of unpleasantness experienced by the end-users. Avatars that are pleasant, neutral, or pleasant-neutral may reduce the impact of poor avatar design on end-users. In conclusion, using the method outlined here to further understand whether an individual’s response is pleasant, unpleasant, and neutral shows promise for exploring a whole range of perceptual responses to visual stimuli. Using the approach outlined in this article helps to further understand how individual variabilities in f-EMG responses can be accounted for using objective measures. Overall, the experiments in this research have highlighted variations found in f-EMG responses, and the approach presented here shows a potentially useful way forward to address some of the variabilities found in f-EMG responses to visual stimuli. Although this study was a pilot, we have gained a sufficient amount of data to suggest that f-EMG is a viable option for measuring physiological feedback that aligns with similar studies, while using our novel methodology.
Author Contributions
Conceptualization, J.D.B. and K.L.B.; methodology, J.D.B.; validation, J.D.B., K.L.B., formal analysis, J.D.B.; investigation, J.D.B.; resources, J.D.B. data curation, J.D.B.; writing—original draft preparation, J.D.B.; writing—review and editing, J.D.B. and K.L.B.; supervision, K.L.B.; project administration, J.D.B.; funding acquisition, K.L.B. All authors have read and agreed to the published version of the manuscript.
Funding
This research was supported by an Australian Government Research Training Program (RTP) Scholarship.
Institutional Review Board Statement
The study was conducted in accordance with the University of Newcastle Australia’s Ethics Committee (Protocol Number/Ethics Approval Number: H-2015-0163, Approved on: 06 December 2016).
Informed Consent Statement
Informed consent was obtained from all subjects involved in this study. Written informed consent was also obtained from the participants to publish this paper.
Data Availability Statement
Not applicable.
Conflicts of Interest
The authors declare no conflict of interest.
References
- Bailenson, J.N.; Yee, N.; Merget, D.; Schroeder, R. The effect of behavioral realism and form realism of real-time avatar faces on verbal disclosure, nonverbal disclosure, emotion recognition, and copresence in dyadic interaction. Presence Teleoperators Virtual Environ. 2006, 15, 359–372. [Google Scholar] [CrossRef]
- Alexander, A.L.; Brunyé, T.; Sidman, J.; Weil, S.A. From gaming to training: A review of studies on fidelity, immersion, presence, and buy-in and their effects on transfer in pc-based simulations and games. DARWARS Train. Impact Group 2005, 5, 1–14. [Google Scholar]
- Annetta, L.A.; Murray, M.R.; Laird, S.G.; Bohr, S.C.; Park, J.C. Serious games: Incorporating video games in the classroom. Educ. Q. 2006, 29, 16. [Google Scholar]
- Rosen, K.R. The history of medical simulation. J. Crit. Care 2008, 23, 157–166. [Google Scholar] [CrossRef] [PubMed]
- Khan, R.F.; Sutcliffe, A. Attractive agents are more persuasive. Int. J. Hum. Comput. Interact. 2014, 30, 142–150. [Google Scholar] [CrossRef]
- Tinwell, A.; Grimshaw, M.; Nabi, D.A.; Williams, A. Facial expression of emotion and perception of the Uncanny Valley in virtual characters. Comput. Hum. Behav. 2011, 27, 741–749. [Google Scholar] [CrossRef]
- Tinwell, A. Uncanny as usability obstacle. In Proceedings of the Online Communities and Social Computing, Third International Conference, OCSC 2009. Held as Part of HCI International 2009, Berlin, Germany, 19–24 July 2009; pp. 622–631. [Google Scholar]
- Seymour, M.; Riemer, K.; Kay, J. Interactive Realistic Digital Avatars-Revisiting the Uncanny Valley. In Proceedings of the Hawaii International Conference on System Sciences, HICSS-50, Honolulu, HI, USA, 4–7 January 2017. [Google Scholar]
- Mori, M.; MacDorman, K.F.; Kageki, N. The uncanny valley [from the field]. IEEE Robot. Autom. Mag. 2012, 19, 98–100. [Google Scholar] [CrossRef]
- Latoschik, M.E.; Roth, D.; Gall, D.; Achenbach, J.; Waltemate, T.; Botsch, M. The effect of avatar realism in immersive social virtual realities. In Proceedings of the 23rd ACM Symposium on Virtual Reality Software and Technology, Gothenburg, Sweden, 8–10 November 2017; pp. 1–10. [Google Scholar]
- Tinwell, A. The Uncanny Valley in Games and Animation; AK Peters/CRC Press: Boca Raton, FL, USA, 2014. [Google Scholar]
- Ochs, M.; Pelachaud, C.; Sadek, D. An empathic virtual dialog agent to improve human-machine interaction. In Proceedings of the 7th International Joint Conference on Autonomous Agents and Multiagent Systems, Estoril, Portugal, 12–16 May 2008; Volume 1, pp. 89–96. [Google Scholar]
- Ho, C.-C.; MacDorman, K.F. Revisiting the uncanny valley theory: Developing and validating an alternative to the Godspeed indices. Comput. Hum. Behav. 2010, 26, 1508–1518. [Google Scholar] [CrossRef]
- Bem, S.L. The measurement of psychological androgyny. J. Consult. Clin. Psychol. 1974, 42, 155. [Google Scholar] [CrossRef]
- Schrammel, F.; Pannasch, S.; Graupner, S.T.; Mojzisch, A.; Velichkovsky, B.M. Virtual friend or threat? The effects of facial expression and gaze interaction on psychophysiological responses and emotional experience. Psychophysiology 2009, 46, 922–931. [Google Scholar] [CrossRef]
- Weyers, P.; Mühlberger, A.; Hefele, C.; Pauli, P. Electromyographic responses to static and dynamic avatar emotional facial expressions. Psychophysiology 2006, 43, 450–453. [Google Scholar] [CrossRef] [PubMed]
- Blumenthal, T.D.; Cuthbert, B.N.; Filion, D.L.; Hackley, S.; Lipp, O.V.; Van Boxtel, A. Committee report: Guidelines for human startle eyeblink electromyographic studies. Psychophysiology 2005, 42, 1–15. [Google Scholar] [CrossRef] [PubMed]
- Pak-San, L.; Ching-Ling, C.; Zhiyong, H. Development of a computational cognitive architecture for intelligent virtual character. Comput. Animat. Virtual Worlds 2009, 20, 257–266. [Google Scholar] [CrossRef]
- iMotions. iMotions Facial Expression Analysis. 2022. Available online: https://imotions.com/ (accessed on 23 May 2020).
- Grewe, C.M.; Liu, T.; Kahl, C.; Hildebrandt, A.; Zachow, S. Statistical Learning of Facial Expressions Improves Realism of Animated Avatar Faces. Front. Virtual Real. 2021, 2. [Google Scholar] [CrossRef]
- Thomas, P.Y. Towards Developing a Web-Based Blended Learning Environment at the University of Botswana. Ph.D. Thesis, University of South Africa, Pretoria, South Africa, 2010. [Google Scholar]
- Ravaja, N.; Saari, T.; Salminen, M.; Laarni, J.; Kallinen, K. Phasic emotional reactions to video game events: A psychophysiological investigation. Media Psychol. 2006, 8, 343–367. [Google Scholar] [CrossRef]
- Mundy-Castle, A.; McKiever, B. The psychophysiological significance of the galvanic skin response. J. Exp. Psychol. 1953, 46, 15. [Google Scholar] [CrossRef]
- Scherer, K.R. What are emotions? And how can they be measured? Soc. Sci. Inf. 2005, 44, 695–729. [Google Scholar] [CrossRef]
- Fontaine, J.R.; Scherer, K.R.; Roesch, E.B.; Ellsworth, P.C. The world of emotions is not two-dimensional. Psychol. Sci. 2007, 18, 1050–1057. [Google Scholar] [CrossRef]
- Liu, Z.; Xu, A.; Guo, Y.; Mahmud, J.; Liu, H.; Akkiraju, R. Seemo: A Computational Approach to See Emotions. In Proceedings of the 2018 CHI Conference on Human Factors in Computing Systems, Montreal, QC, Canada, 21–26 April 2018; pp. 1–12. [Google Scholar]
- Mauss, I.B.; Robinson, M.D. Measures of emotion: A review. Cogn. Emot. 2009, 23, 209–237. [Google Scholar] [CrossRef]
- VanOyen Witvliet, C.; Vrana, S.R. Psychophysiological responses as indices of affective dimensions. Psychophysiology 1995, 32, 436–443. [Google Scholar] [CrossRef]
- Nesbitt, K.; Blackmore, K.; Hookham, G.; Kay-Lambkin, F.; Walla, P. Using the Startle Eye-Blink to Measure Affect in Players. In Serious Games Analytics: Methodologies for Performance Measurement, Assessment, and Improvement; Loh, S.C., Sheng, Y., Ifenthaler, D., Eds.; Springer International Publishing: Cham, Switerland, 2015; pp. 401–434. [Google Scholar]
- Berg, W.K.; Balaban, M.T. Startle elicitation: Stimulus parameters, recording techniques, and quantification. In Startle Modification: Implications for Neuroscience, Cognitive Science, and Clinical Science; Cambridge University Press: Cambridge, UK, 1999; pp. 21–50. [Google Scholar]
- Säring, W.; Von Cramon, D. The acoustic blink reflex: Stimulus dependence, excitability and localizing value. J. Neurol. 1981, 224, 243–252. [Google Scholar] [CrossRef] [PubMed]
- Balaban, M.; Losito, B.; Simons, R.; Graham, F. Off-line latency and amplitude scoring of the human reflex eye blink with Fortran IV. Psychophysiology 1986, 23, 612. [Google Scholar]
- Cook, E.W. Affective Individual Differences Psychopathology, and Startle Reflex Modification. In Startle Modification: Implications for Neroscience, Cognitive Science, and Clincal Science; Dawson, M., Schell, A., Bohmelt, A.H., Eds.; Cambridge Univeristy Press: New York, NY, USA, 1999. [Google Scholar]
- Halaki, M.; Ginn, K. Normalization of EMG signals: To normalize or not to normalize and what to normalize to? In Computational Intelligence in Electromyography Analysis—A Perspective on Current Applications and Future Challenges; IntechOpen: London, UK, 2012. [Google Scholar]
- Lang, P.J.; Bradley, M.M.; Cuthbert, B.N. International Affective Picture System (IAPS): Technical Manual and Affective Ratings; The Center for Research in Psychophysiology, University of Florida: Gainesville, FL, USA, 1999; Volume 2. [Google Scholar]
- Codispoti, M.; Bradley, M.M.; Lang, P.J. Affective reactions to briefly presented pictures. Psychophysiology 2001, 38, 474–478. [Google Scholar] [CrossRef] [PubMed]
- Baylor, A.L. Preliminary design guidelines for pedagogical agent interface image. In Proceedings of the 10th International Conference on Intelligent User Interfaces, San Diego, CA, USA, 10–13 January 2005; pp. 249–250. [Google Scholar]
- Patel, H.; MacDorman, K.F. Sending an avatar to do a human’s job: Compliance with authority persists despite the uncanny valley. Presence 2015, 24, 1–23. [Google Scholar] [CrossRef]
- Kim, Y.; Baylor, A.L.; Shen, E. Pedagogical agents as learning companions: The impact of agent emotion and gender. J. Comput. Assist. Learn. 2007, 23, 220–234. [Google Scholar] [CrossRef]
- Ellemers, N. Gender Stereotypes. Annu. Rev. Psychol. 2018, 69, 275–298. [Google Scholar] [CrossRef] [Green Version]
- Marini, M.M. Sex and gender: What do we know? In Sociological Forum; Springer: Berlin/Heidelberg, Germany, 1990; pp. 95–120. [Google Scholar]
- Sandnabba, N.K.; Ahlberg, C. Parents’ attitudes and expectations about children’s cross-gender behavior. Sex Roles 1999, 40, 249–263. [Google Scholar] [CrossRef]
- Eagly, A.H. Gender and social influence: A social psychological analysis. Am. Psychol. 1983, 38, 971. [Google Scholar] [CrossRef]
- Oberst, U.; Renau, V.; Chamarro, A.; Carbonell, X. Gender stereotypes in Facebook profiles: Are women more female online? Comput. Hum. Behav. 2016, 60, 559–564. [Google Scholar] [CrossRef]
- Yan, X.; Young, A.W.; Andrews, T.J. The automaticity of face perception is influenced by familiarity. Atten. Percept. Psychophys. 2017, 79, 2202–2211. [Google Scholar] [CrossRef] [Green Version]
- Kramer, R.S.; Young, A.W.; Day, M.G.; Burton, A.M. Robust social categorization emerges from learning the identities of very few faces. Psychol. Rev. 2017, 124, 115. [Google Scholar] [CrossRef] [PubMed] [Green Version]
- Macrae, C.N.; Bodenhausen, G.V. Social cognition: Thinking categorically about others. Annu. Rev. Psychol. 2000, 51, 93–120. [Google Scholar] [CrossRef] [PubMed] [Green Version]
- Bailey, J.; Blackmore, K.; Robinson, G. Exploring avatar facial fidelity and emotional expressions on observer perception of the Uncanny Valley. In Proceedings of the Australasian Simulation Congress, Melbourne, Australia, 15–16 November 2017. [Google Scholar]
- Cunningham, M.R.; Barbee, A.P.; Pike, C.L. What do women want? Facialmetric assessment of multiple motives in the perception of male facial physical attractiveness. J. Personal. Soc. Psychol. 1990, 59, 61. [Google Scholar] [CrossRef]
- Fabri, M.; Moore, D. The use of emotionally expressive avatars in collaborative virtual environments. Virtual Soc. Agents 2005, 88, 88–94. [Google Scholar]
- Egges, A.; Papagiannakis, G.; Magnenat-Thalmann, N. An interactive mixed reality framework for virtual humans. In Proceedings of the 2006 International Conference on Cyberworlds, Los Alamitos, CA, USA, 28–29 November 2006; p. 8. [Google Scholar]
- Mohler, B.J.; Creem-Regehr, S.H.; Thompson, W.B.; Bulthoff, H.H. The Effect of Viewing a Self-Avatar on Distance Judgments in an HMD-Based Virtual Environment. Presence-Teleoper. Virtual Environ. 2010, 19, 230–242. [Google Scholar] [CrossRef]
- Bernat, E.; Patrick, C.J.; Benning, S.D.; Tellegen, A. Effects of picture content and intensity on affective physiological response. Psychophysiology 2006, 43, 93–103. [Google Scholar] [CrossRef] [Green Version]
- Bartholow, B.D.; Bushman, B.J.; Sestir, M.A. Chronic violent video game exposure and desensitization to violence: Behavioral and event-related brain potential data. J. Exp. Soc. Psychol. 2006, 42, 532–539. [Google Scholar] [CrossRef]
- Elsesser, K.; Sartory, G.; Tackenberg, A. Attention, heart rate, and startle response during exposure to trauma-relevant pictures: A comparison of recent trauma victims and patients with posttraumatic stress disorder. J. Abnorm. Psychol. 2004, 113, 289. [Google Scholar] [CrossRef]
- Battocchi, A.; Pianesi, F.; Goren-Bar, D. A first evaluation study of a database of kinetic facial expressions (dafex). In Proceedings of the 7th International Conference on Multimodal Interfaces, Trento, Italy, 4–6 October 2005; pp. 214–221. [Google Scholar]
- Metrics, I. Faceware 3.1; Faceware Tech: Los Angeles, CA, USA, 2018. [Google Scholar]
- AppleInc. FaceShift. 2015, FaceShift AG. Available online: http://www.cgchannel.com/2015/03/faceshift-releases-faceshift-studio-2015/ (accessed on 23 January 2022).
- Nao4288, n. Female Facial Animation ver 1.0 (No Sound). 2013. Available online: https://www.youtube.com/watch?v=akdrHY9bBwk (accessed on 23 January 2022).
- Lange, E. The limits of realism: Perceptions of virtual landscapes. Landsc. Urban Plan. 2001, 54, 163–182. [Google Scholar] [CrossRef]
- Gulliksen, H.; Tucker, L.R. A general procedure for obtaining paired comparisons from multiple rank orders. Psychometrika 1961, 26, 173–183. [Google Scholar] [CrossRef]
- Mantiuk, R.K.; Tomaszewska, A.; Mantiuk, R. Comparison of four subjective methods for image quality assessment. Comput. Graph. Forum 2012, 31, 2478–2491. [Google Scholar] [CrossRef]
- Rankin, W.L.; Grube, J.W. A comparison of ranking and rating procedures for value system measurement. Eur. J. Soc. Psychol. 1980, 10, 233–246. [Google Scholar] [CrossRef]
- Winkler, S. On the properties of subjective ratings in video quality experiments. In Proceedings of the Quality of Multimedia Experience (QoMEx 2009), International Workshop on Quality of Multimedia Experience, San Diego, CA, USA, 29–31 July 2009; pp. 139–144. [Google Scholar]
- Hair, J.; Anderson, R.E.; Thatham, R.L.; Black, W.C. Multivariate Analysis with Readings, 4th ed.; Prentice-Hall: Englewood Cliffs, NJ, USA, 1995. [Google Scholar]
Figure 1.
Graphical representation of the valence-affect model [26].
Figure 1.
Graphical representation of the valence-affect model [26].

Figure 2.
Placement of electrodes on the orbicularis oculi (adapted from: Blumenthal et al. [17]).
Figure 2.
Placement of electrodes on the orbicularis oculi (adapted from: Blumenthal et al. [17]).

Figure 3.
Example f-EMG response.

Figure 4.
Different participants viewing the same normatively rated visual imagery can produce highly variable f-EMG responses. Key: Slide Number: 3015, Description: Accident, Category: Unpleasant, Valence Mean SD: (M = 1.52, SD = 0.95). Note: The blue line is a raw response from a participant; the red line is the startle noise; the green lines are the response window.

Figure 5.
Data collection procedure.

Figure 6.
A sample of the avatars used in the experiments.

Figure 7.
Responses to the Control imagery by participants’ self-reported bio sex.

Figure 8.
Mean peak f-EMG classified responses by avatars with a happy expression grouped by realism level.
Figure 8.
Mean peak f-EMG classified responses by avatars with a happy expression grouped by realism level.

Figure 9.
Mean peak f-EMG classified responses by avatars with a sad expression grouped by realism level.
Figure 9.
Mean peak f-EMG classified responses by avatars with a sad expression grouped by realism level.

Figure 10.
Mean valid responses by participant bio sex for avatars with happy expressions grouped by realism level.
Figure 10.
Mean valid responses by participant bio sex for avatars with happy expressions grouped by realism level.

Figure 11.
Mean valid responses by participant bio sex for avatars with sad expressions grouped by realism level.
Figure 11.
Mean valid responses by participant bio sex for avatars with sad expressions grouped by realism level.

Figure 12.
Mean normalized peak f-EMG responses for the realism levels by both avatar and participant gender(sex).
Figure 12.
Mean normalized peak f-EMG responses for the realism levels by both avatar and participant gender(sex).


Table 1.
Sample IAPS images used in the baseline portion of the experiments.
| Pleasant | Neutral | Unpleasant |
|---|---|---|
 Puppies (M = 8.34, SD = 1.12) |  Lonely Boy (M = 4.50, SD = 1.78) |  Man on fire (M = 1.90, SD = 1.31) |
Table 2.
IAPS image valence means and standard deviations.
| Category | Valence Mean (SD) | Arousal Mean (SD) |
|---|---|---|
| Pleasant | 8.14 (1.28) | 4.69 (2.49) |
| Unpleasant | 1.62 (1.11) | 6.62 (2.26) |
| Neutral | 4.53 (1.44) | 3.71 (1.94) |
Note: IAPS, International Affective Picture System. Numbers in parentheses are standard deviations. The identification numbers (from the IAPS manual; Lang et al., 2001) for the neutral images were 1390, 2272, 7920, 7011, 7031, 9210, 9401, 9150, 7110, and 7595. The pleasant images were 5830, 2340, 5210, 5760, 2070, 1440, 1460, 8190, 1750, and 1710. The unpleasant images were 9940, 3053, 3080, 3015, 3266, 9410, 9183, 6563, 3301, and 9635.1.
Table 3.
Count and percent of valid, invalid, and non-responses to the control image and avatar set responses.
Table 3.
Count and percent of valid, invalid, and non-responses to the control image and avatar set responses.
| Validation Category | Control Image Set | Avatar Set |
|---|---|---|
| Valid | 923 (76.5%) | 1367 (78.6%) |
| Invalid | 81 (6.7%) | 93 (5.3%) |
| Non-response | 202 (16.7%) | 279 (16.0%) |
| Total | 1206 | 1739 |
| Grand total responses | 2945 | |
Publisher’s Note: MDPI stays neutral with regard to jurisdictional claims in published maps and institutional affiliations. |
© 2022 by the authors. Licensee MDPI, Basel, Switzerland. This article is an open access article distributed under the terms and conditions of the Creative Commons Attribution (CC BY) license (https://creativecommons.org/licenses/by/4.0/).
Share and Cite
MDPI and ACS Style
Bailey, J.D.; Blackmore, K.L. A Novel Method of Exploring the Uncanny Valley in Avatar Gender(Sex) and Realism Using Electromyography. Big Data Cogn. Comput. 2022, 6, 61. https://0-doi-org.brum.beds.ac.uk/10.3390/bdcc6020061
AMA Style
Bailey JD, Blackmore KL. A Novel Method of Exploring the Uncanny Valley in Avatar Gender(Sex) and Realism Using Electromyography. Big Data and Cognitive Computing. 2022; 6(2):61. https://0-doi-org.brum.beds.ac.uk/10.3390/bdcc6020061
Chicago/Turabian StyleBailey, Jacqueline D., and Karen L. Blackmore. 2022. "A Novel Method of Exploring the Uncanny Valley in Avatar Gender(Sex) and Realism Using Electromyography" Big Data and Cognitive Computing 6, no. 2: 61. https://0-doi-org.brum.beds.ac.uk/10.3390/bdcc6020061