
Analysis and Prediction of User Sentiment on COVID-19 Pandemic Using Tweets


 ,
,  , , and
Abstract
:1. Introduction
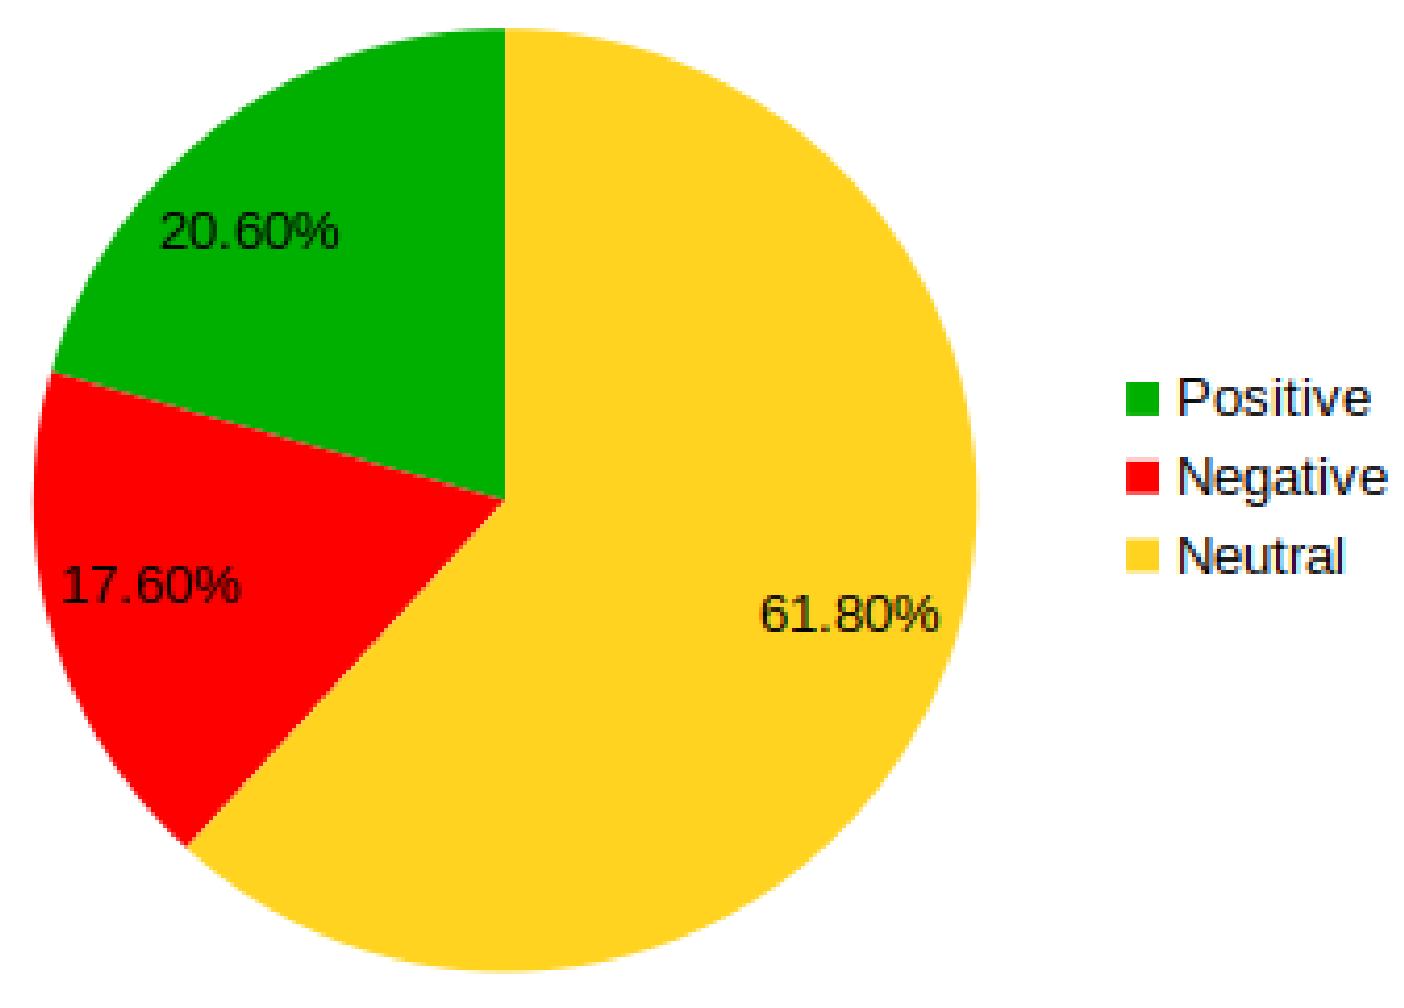
- We examined people’s emotions with COVID-19 by considering neutral, positive, and negative labels.
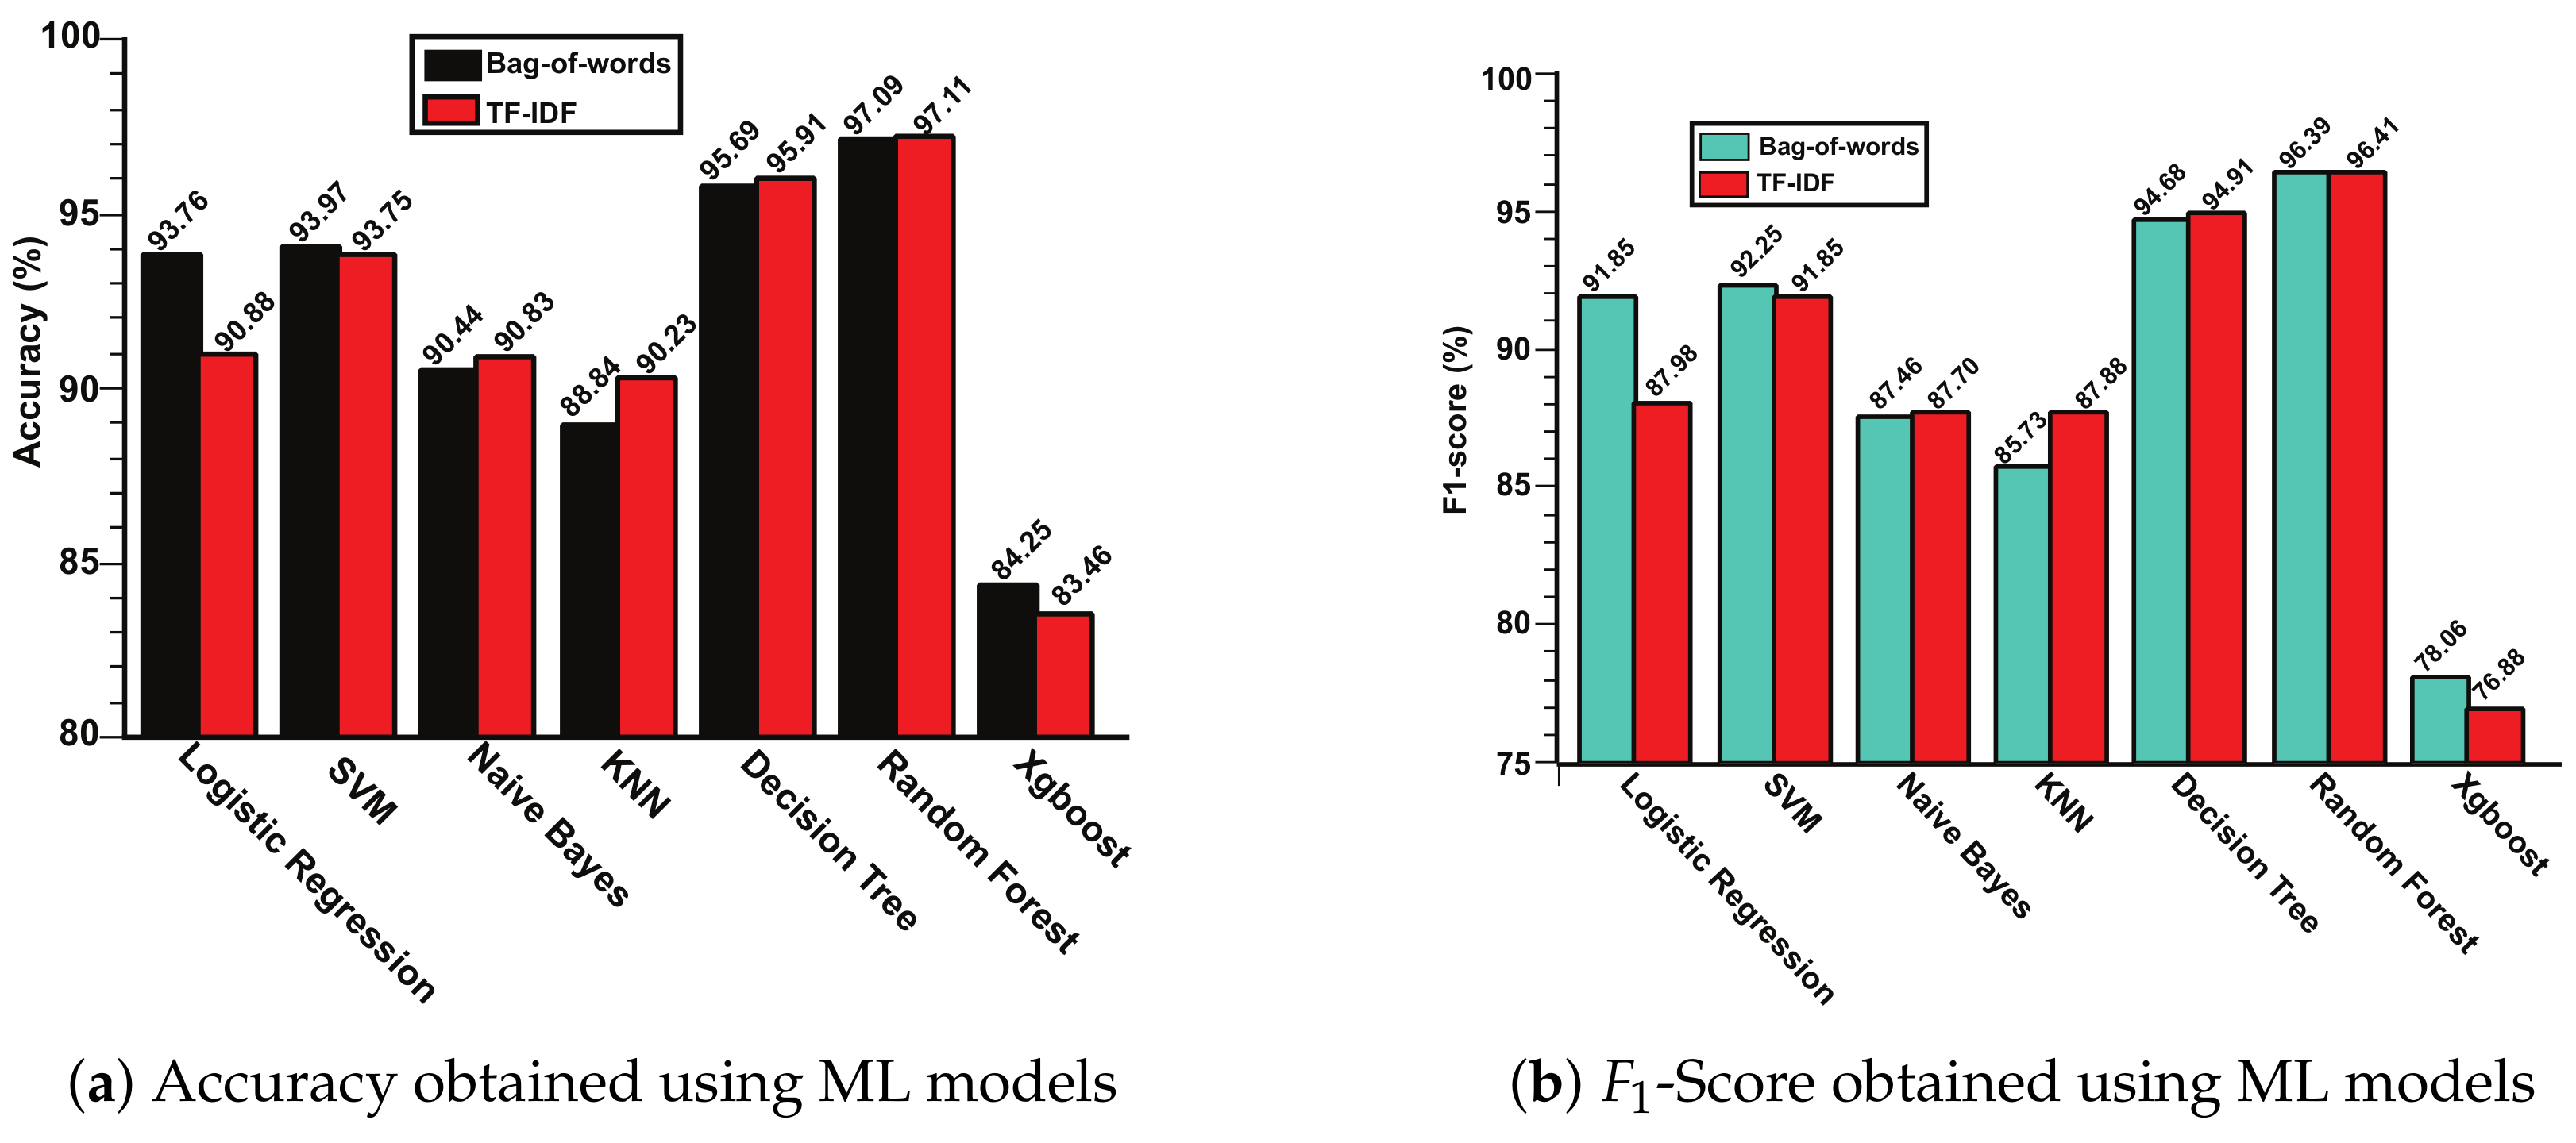
- We used ML models to calculate the accuracy of various ML approaches to classify the user’s feelings about COVID-19 and show that the random forest provides a better result than other ML models.
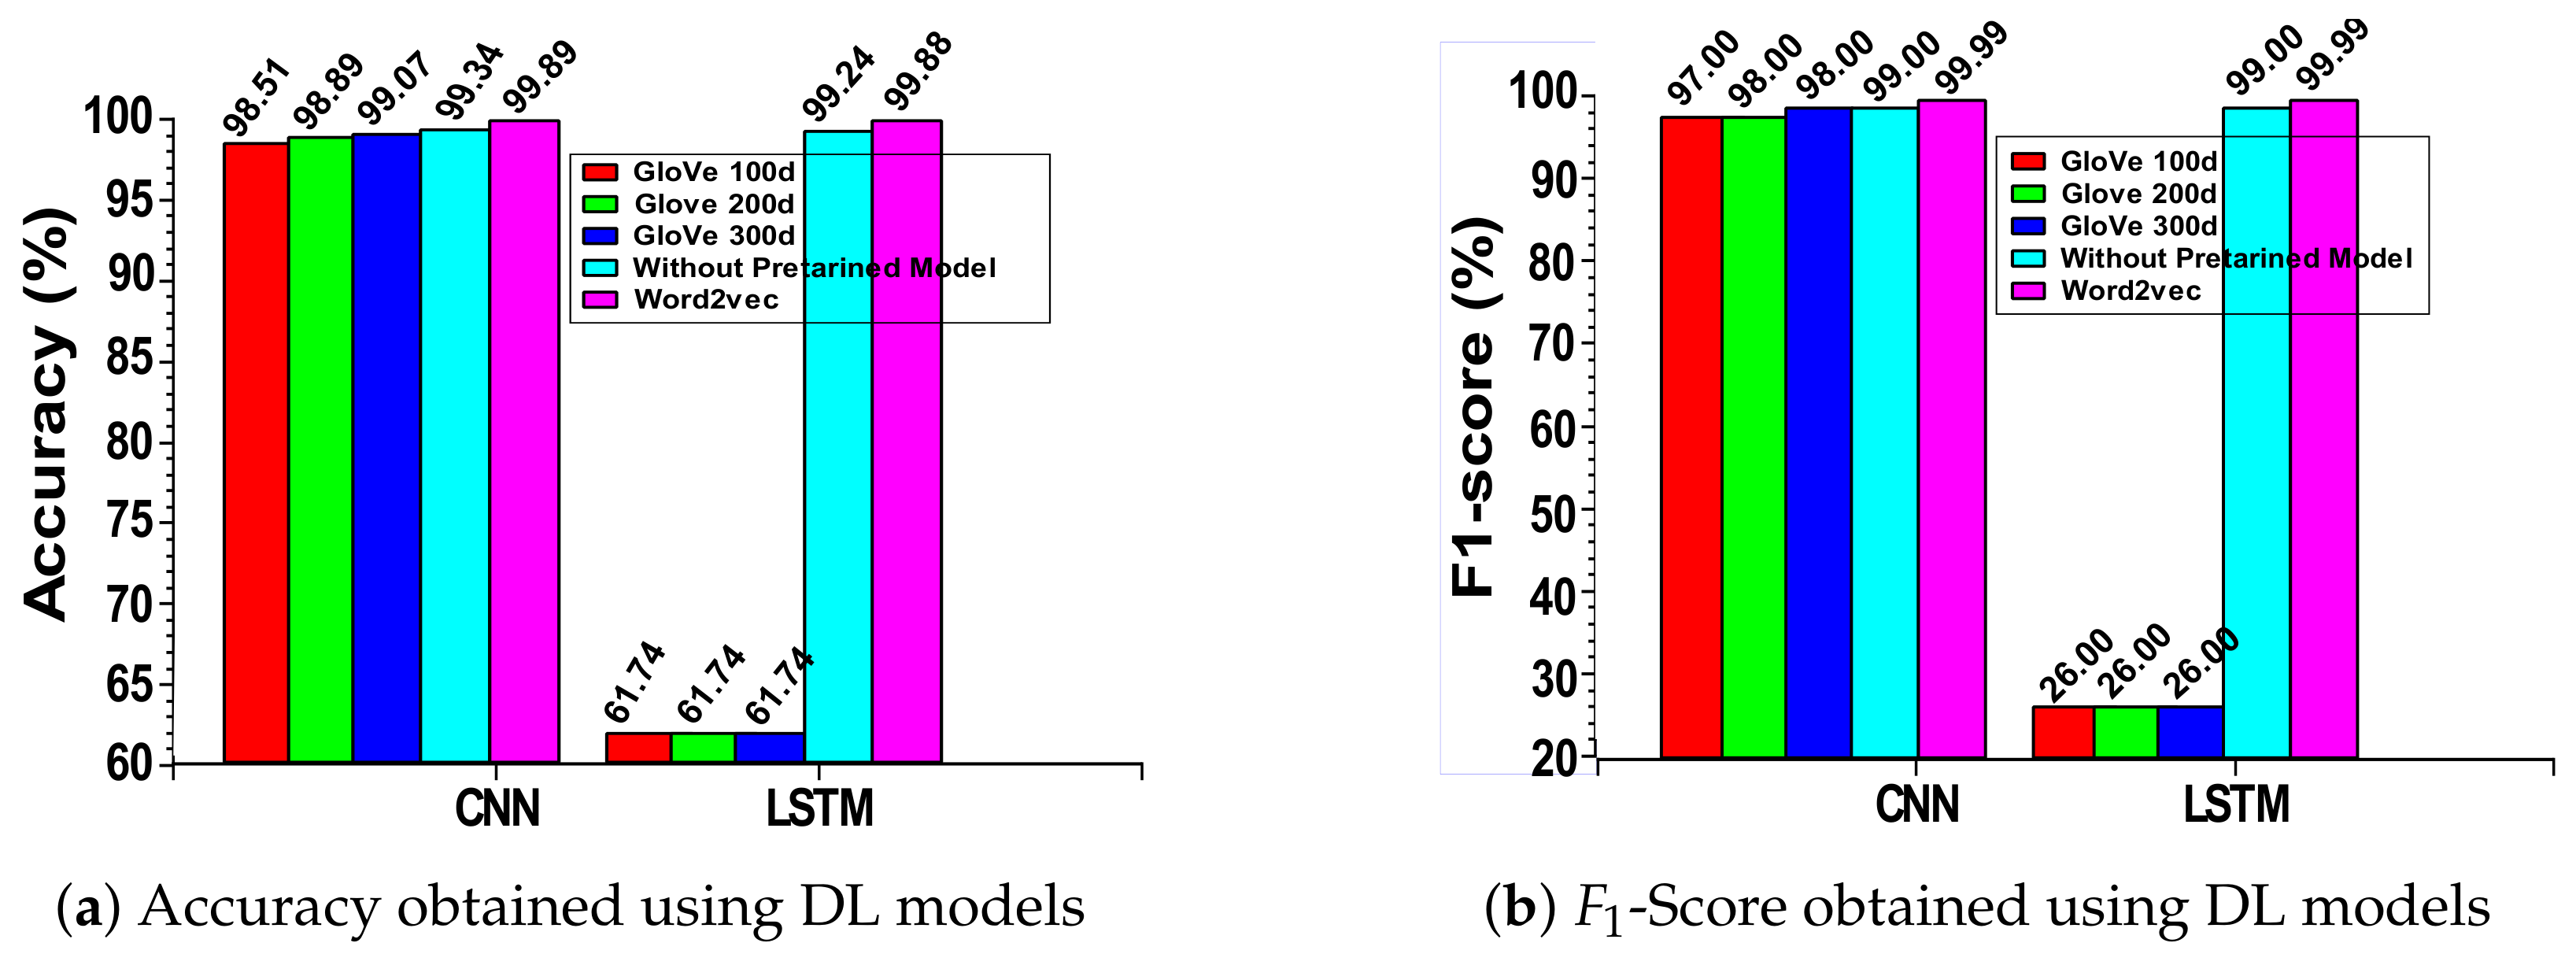
- We have expanded our focus on exploring DL models to classify the user’s sentiment about COVID-19, compute the DL models’ predictive performance, compare the ML models’ results, and show that Maximum times DL models provide a better result than ML models.
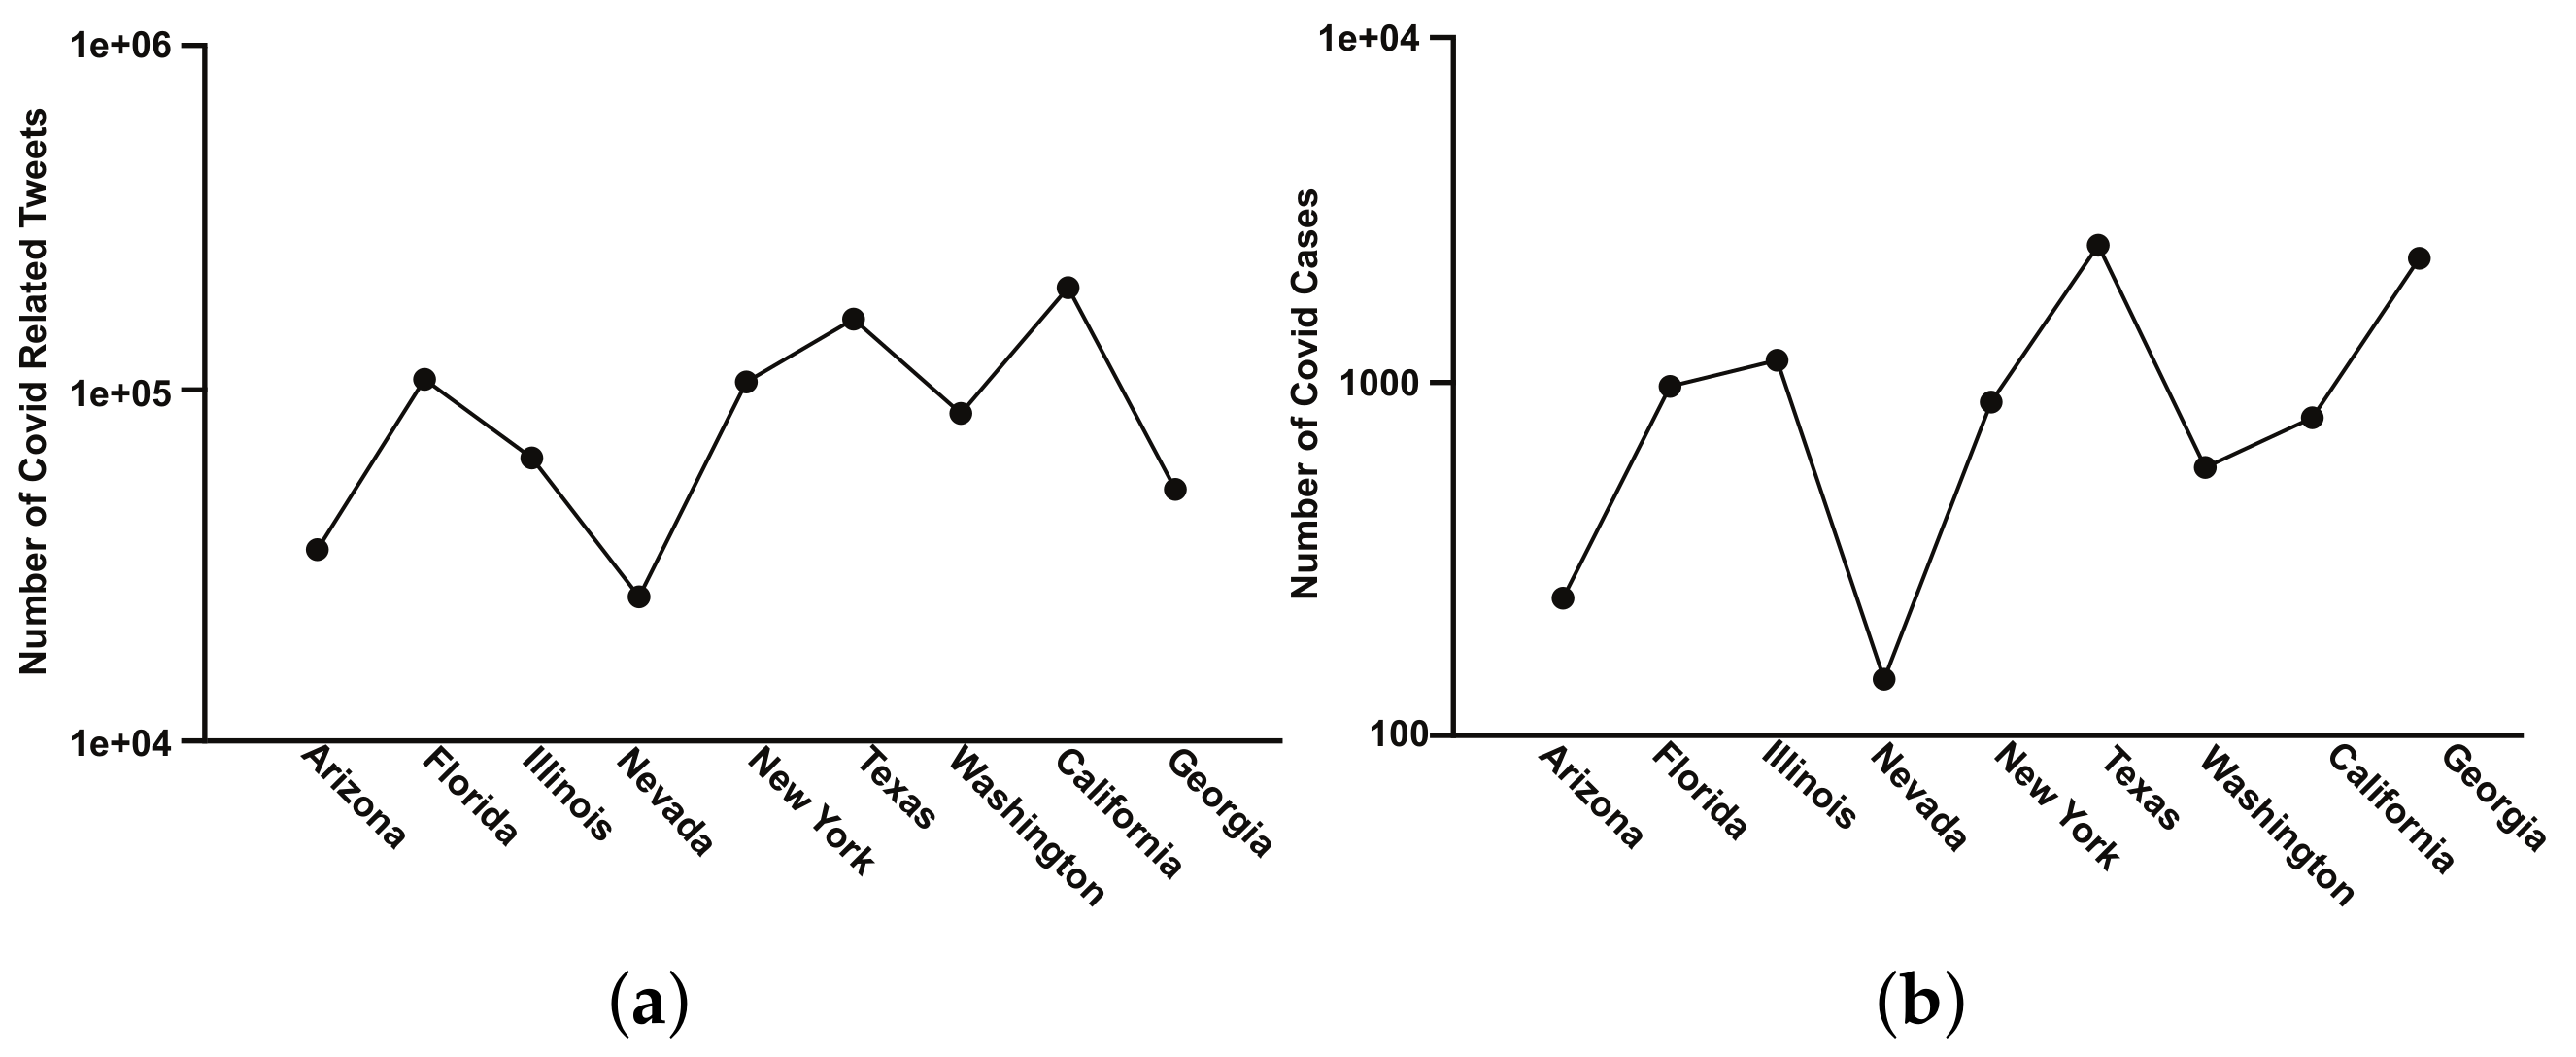
- We try to relate COVID-19 outbreak cases and COVID-19-related tweets among the nine states in the USA.
2. Related Works
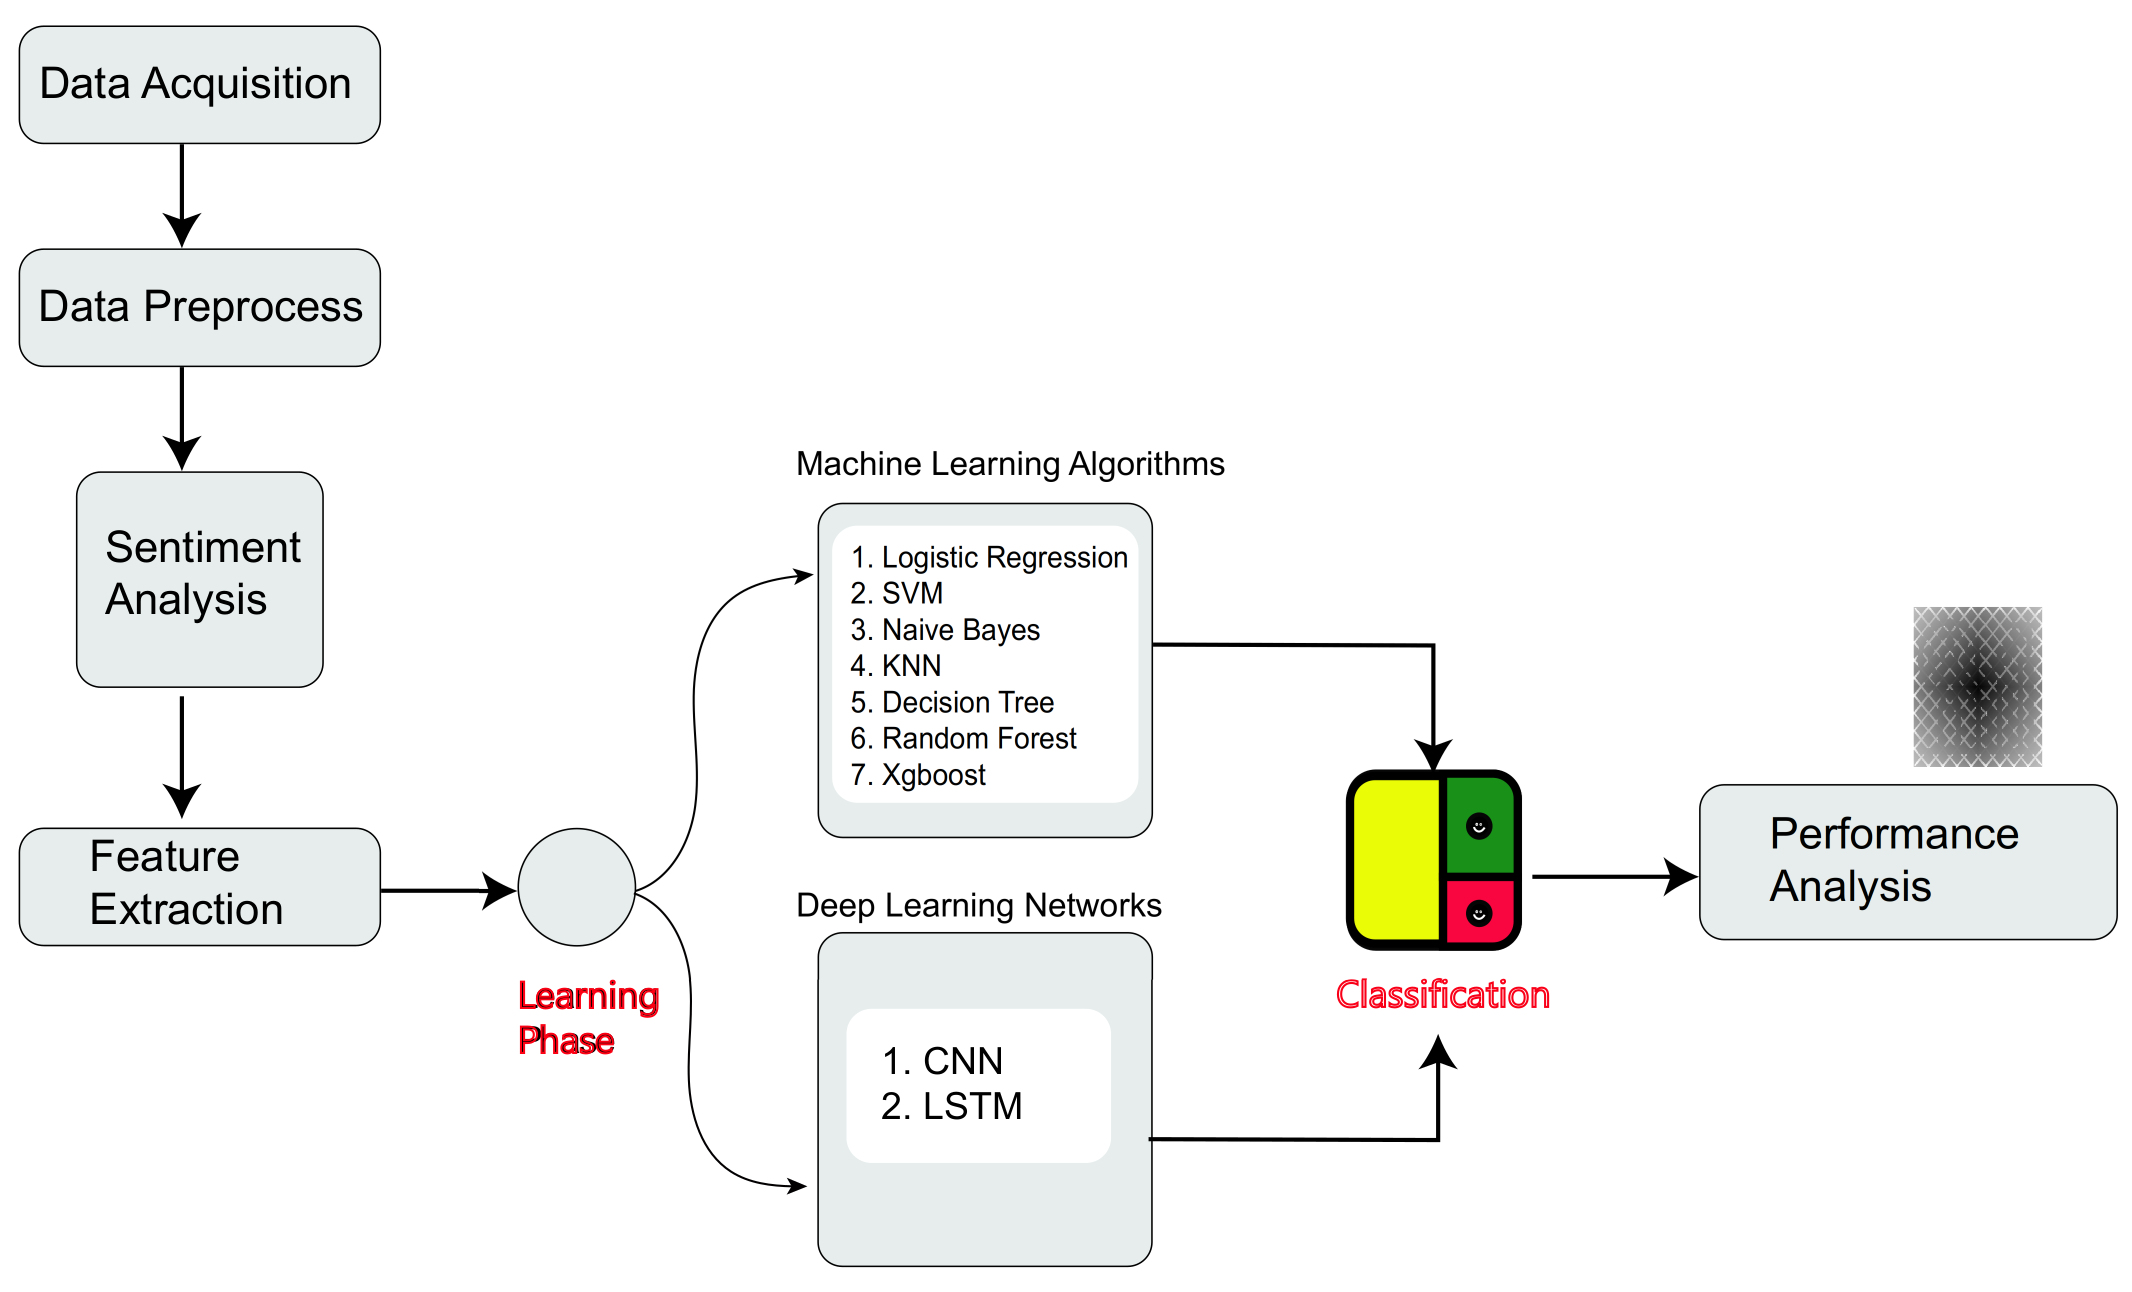
3. Methodology
3.1. Data Acquisition
3.2. Data Processing
- Firstly, we removed all forms of symbols such as #,@,!,$,%,&, HTML tags, and numbers included in the whole dataset. We used a regular expression module from the Python language to perform these steps.
- Our collected dataset contains both lower case and upper case words. We convert all words into lower case words.
- Then, we performed tokenization on our whole text data. Tokenization means the division of smaller units of a comprehensive text document, such as individual terms or phrases [38].
- Finally, we utilized stemming on our whole text dataset to get clean tweet text. Stemming is an approach for obtaining the root shape of terms by eliminating their affixes [39]. We utilized the NLTK library from Python to perform tokenization and stemming.
3.3. Sentiment Analysis
- tweet1 = TextBlob (“The older people and others who have serious health problems are at higher risk of getting very sick from COVID-19”);
- print(format(tweet1.sentiment))
- Sentiment(polarity = −0.2113, subjectivity = 0.625)
- tweet2= TextBlob(“COVID-19 is bringing people closer during lockdown period.”);
- print(format(tweet2.sentiment))
- Sentiment(Polarity = 0.0, Subjectivity = 0.0)
3.4. Feature Extraction
3.5. Classifier Models
3.5.1. Machine Learning (ML) Techniques
3.5.2. Deep Learning (DL) Techniques
3.6. Evaluation Criteria
4. Experimental Results Analysis
4.1. Setup for the Experiment
Parameters Setting
4.2. Sentiment Analysis
4.3. Machine Learning Analysis
4.4. Deep Learning Analysis
4.5. Infected COVID-19 Cases vs. Estimated COVID-19 Cases Using Twitter Dataset
5. Discussion and Conclusions
Author Contributions
Funding
Institutional Review Board Statement
Informed Consent Statement
Data Availability Statement
Conflicts of Interest
References
- Wang, H.; Wang, Z.; Dong, Y.; Chang, R.; Xu, C.; Yu, X.; Zhang, S.; Tsamlag, L.; Shang, M.; Huang, J. Others Phase-adjusted estimation of the number of coronavirus disease 2019 cases in Wuhan, China. Cell Discov. 2020, 6, 10. [Google Scholar] [CrossRef] [PubMed]
- World Health Organization. Novel Coronavirus (2019-nCoV): Situation Report. Available online: https://www.who.int/docs/default-source/coronaviruse/situation-reports/20200207-sitrep-18-ncov.pdf?sfvrsn=fa644293_2/ (accessed on 9 February 2020).
- Twitter Usage Statistics. Internet Live Stats Website. Available online: http://www.internetlivestats.com/twitter-statistics/ (accessed on 11 October 2016).
- Soriano, C.; Roldan, M.; Cheng, C.; Oco, N. Social media and civic engagement during calamities: The case of Twitter use during typhoon Yolanda. Philipp. Political Sci. J. 2016, 37, 6–25. [Google Scholar] [CrossRef]
- Van Lent, L.; Sungur, H.; Kunneman, F.; Van De Velde, B.; Das, E. Too far to care? Measuring public attention and fear for Ebola using Twitter. J. Med Internet Res. 2017, 19, e193. [Google Scholar] [CrossRef] [PubMed]
- Nair, M.; Ramya, G.; Sivakumar, P. Usage and analysis of Twitter during 2015 Chennai flood towards disaster management. In Proceedings of Procedia Computer Science, Cochin, India, 22–24 August 2017; pp. 350–358. [Google Scholar]
- Fu, K.; Liang, H.; Saroha, N.; Tse, Z.; Ip, P.; Fung, I. How people react to Zika virus outbreaks on Twitter? A computational content analysis. Am. J. Infect. Control 2016, 44, 1700–1702. [Google Scholar] [CrossRef]
- Pang, B.; Lee, L. Opinion mining and sentiment analysis Foundations and Trends. Inf. Retr. 2008, 2, 1–2. [Google Scholar]
- Liu, B. Sentiment analysis and opinion mining. Synth. Lect. Hum. Lang. Technol. 2012, 5, 1–167. [Google Scholar] [CrossRef]
- Huang, Q.; Chen, R.; Zheng, X.; Dong, Z. Deep sentiment representation based on CNN and LSTM. In Proceeding of the International Conference On Green Informatics (ICGI), Fuzhou, China, 15–17 August 2017; pp. 30–33. [Google Scholar]
- Sethi, M.; Pandey, S.; Trar, P.; Soni, P. Sentiment identification in COVID-19 specific tweets. In Proceedings of the 2020 International Conference On Electronics And Sustainable Communication Systems (ICESC), Coimbatore, India, 2–4 July 2020; pp. 509–516. [Google Scholar]
- Shamantha, R.; Shetty, S.; Rai, P. Sentiment Analysis Using Machine Learning Classifiers: Evaluation of Performance. In Proceedings of the 2019 IEEE 4th International Conference On Computer And Communication Systems (ICCCS), Singapore, 23–25 February 2019; pp. 21–25. [Google Scholar]
- Singh, B.C.; Carminati, B.; Ferrari, E. Learning Privacy Habits of PDS Owners. In Proceedings of the IEEE 37th International Conference on Distributed Computing Systems (ICDCS), Atlanta, GA, USA, 5–8 June 2017; pp. 151–161. [Google Scholar]
- Singh, B.C.; Carminati, B.; Ferrari, E. Privacy-Aware Personal Data Storage (P-PDS): Learning how to Protect User Privacy from External Applications. IEEE Trans. Dependable Secur. Comput. 2021, 18, 889–903. [Google Scholar] [CrossRef]
- Baowaly, M.K.; Kibirige, G.W.; Singh, B.C. Co-Comment Network: A Novel Approach to Construct Social Networks within Reddit. Comput. Sist. 2022, 26, 311–323. [Google Scholar]
- Shin, W.Y.; Singh, B.C.; Cho, J.; Everett, A.M. A new understanding of friendships in space: Complex networks meet Twitter. J. Inf. Sci. 2015, 41, 751–764. [Google Scholar] [CrossRef]
- Singh, B.C.; Alom, Z.; Hu, H.; Rahman, M.M.; Baowaly, M.K.; Aung, Z.; Azim, M.A.; Moni, M.A. COVID-19 Pandemic Outbreak in the Subcontinent: A Data Driven Analysis. J. Pers. Med. 2021, 11, 889. [Google Scholar] [CrossRef]
- Jain, A.; Dandannavar, P. Application of machine learning techniques to sentiment analysis. In Proceedings of the 2nd International Conference On Applied And Theoretical Computing And Communication Technology (iCATccT), Bangalore, India, 21–23 July 2016; pp. 628–632. [Google Scholar]
- Chen, E.; Lerman, K.; Ferrara, E. Tracking Social Media Discourse About the COVID-19 Pandemic: Development of a Public Coronavirus Twitter Data Set. JMIR Public Health Surveill. 2020, 6, e19273. [Google Scholar] [CrossRef]
- Neogi, A.S.; Garg, K.A.; Mishra, R.K.; Dwivedi, Y.K. Sentiment analysis and classification of Indian farmers’ protest using twitter data. Int. J. Inf. Manag. Data Insights 2021, 1, 100019. [Google Scholar] [CrossRef]
- Shofiya, C.; Abidi, S. Sentiment Analysis on COVID-19-Related Social Distancing in Canada Using Twitter Data. Int. J. Environ. Res. Public Health 2021, 18, 5993. [Google Scholar] [CrossRef]
- Naseem, U.; Razzak, I.; Khushi, M.; Eklund, P.W.; Kim, J. COVIDSenti: A large-scale benchmark Twitter data set for COVID-19 sentiment analysis. IEEE Trans. Comput. Soc. Syst. 2021, 8, 1003–1015. [Google Scholar] [CrossRef]
- Stringhini, G.; Kruegel, C.; Vigna, G. Detecting spammers on social networks. In Proceedings of the 26th Annual Computer Security Applications Conference, Austin, TX, USA, 6–10 December 2010; pp. 1–9. [Google Scholar]
- Kabir, M.; Madria, S. CoronaVis: A Real-time COVID-19 Tweets Analyzer. arXiv 2020, arXiv:2004.13932. [Google Scholar]
- Pokharel, B. Twitter Sentiment analysis during COVID-19 Outbreak in Nepal. 2020. Available online: https://ssrn.com/abstract=3624719 (accessed on 15 June 2020).
- Sharma, M.K.; Dhiman, N.V.; Mishra, V.N. Mediative fuzzy logic mathematical model: A contradictory management prediction in COVID-19 pandemic. Appl. Soft Comput. 2021, 105, 107285. [Google Scholar] [CrossRef]
- Sharma, M.K.; Dhiman, N.; Mishra, V.N.; Mishra, L.N.; Dhaka, A.; Koundal, D. Post-symptomatic detection of COVID-2019 grade based mediative fuzzy projection. Comput. Electr. Eng. 2022, 101, 108028. [Google Scholar] [CrossRef]
- Day, M.; Lee, C. Deep learning for financial sentiment analysis on finance news providers. In Proceedings of the IEEE/ACM International Conference On Advances In Social Networks Analysis And Mining (ASONAM), San Francisco, CA, USA, 18–21 August 2016; pp. 1127–1134. [Google Scholar]
- Heikal, M.; Torki, M.; El-Makky, N. Sentiment analysis of Arabic Tweets using deep learning. In Proceedings of the Procedia Computer Science, Dubai, United Arab Emirates, 17–19 November 2018; pp. 114–122. [Google Scholar]
- Goularas, D.; Kamis, S. Evaluation of deep learning techniques in sentiment analysis from Twitter data. In Proceedings of International Conference On Deep Learning And Machine Learning In Emerging Applications (Deep-ML), Istanbul, Turkey, 26–28 August 2019; pp. 12–17. [Google Scholar]
- Ain, Q.; Ali, M.; Riaz, A.; Noureen, A.; Kamran, M.; Hayat, B.; Rehman, A. Sentiment analysis using deep learning techniques: A review. Int. J. Adv. Comput. Sci. Appl. 2017, 8, 6. [Google Scholar]
- Cliche, M. Bb_twtr at semeval-2017 task 4: Twitter sentiment analysis with cnns and lstms. arXiv 2017, arXiv:1704.06125. [Google Scholar]
- Chen, N.; Wang, P. Advanced combined LSTM-CNN model for twitter sentiment analysis. In Proceedings of the 5th IEEE International Conference On Cloud Computing And Intelligence Systems (CCIS), Nanjing, China, 23–25 November 2018; pp. 684–687. [Google Scholar]
- Ali, N.; Abd El Hamid, M.; Youssif, A. Sentiment analysis for movies reviews dataset using deep learning models. Int. J. Data Min. Knowl. Manag. Process (IJDKP) 2019, 9, 42–49. [Google Scholar]
- Maas, A.; Daly, R.; Pham, P.; Huang, D.; Ng, A.; Potts, C. Learning Word Vectors for Sentiment Analysis. In Proceedings of the 49th Annual Meeting of the Association For Computational Linguistics: Human Language Technologies, Portland, OR, USA, 19–24 June 2011; pp. 142–150. [Google Scholar]
- Sosa, P. Twitter sentiment analysis using combined LSTM-CNN models. Eprint Arxiv 2017, 1–9. [Google Scholar]
- Your machine learning and Data Science Community. Kaggle. (n.d.). Retrieved 30 November 2021. Available online: https://www.kaggle.com/ (accessed on 30 November 2021).
- Straka, M.; Straková, J. Tokenizing, pos Tagging, Lemmatizing and Parsing ud 2.0 with Udpipe; Association for Computational Linguistics: Vancouver, BC, Canada, 2017; pp. 88–99. [Google Scholar]
- Lovins, J. Development of a stemming algorithm. Mech. Transl. Comput. Linguist. 1968, 11, 22–31. [Google Scholar]
- Loria, S. TextBlob: Simplified Text Processing. Release ver. 0.15.2. Available online: https://textblob.readthedocs.org/en/dev/index.html (accessed on 26 March 2020).
- El-Din, D. Enhancement bag-of-words model for solving the challenges of sentiment analysis. Int. J. Adv. Comput. Sci. Appl. 2016, 7, 99. [Google Scholar]
- Aizawa, A. An information-theoretic perspective of tf–idf measures. Inf. Process. Manag. 2003, 39, 45–65. [Google Scholar] [CrossRef]
- Pennington, J.; Socher, R.; Manning, C. Glove: Global vectors for word representation. In Proceedings of the Conference on Empirical Methods In Natural Language Processing (EMNLP), Doha, Qatar, 25–29 October 2014; pp. 1532–1543. [Google Scholar]
- Kleinbaum, D.; Dietz, K.; Gail, M.; Klein, M.; Klein, M. Logistic Regression, 3rd ed.; Springer: New York, NY, USA, 2002; p. 702. [Google Scholar]
- Stoltzfus, J. Logistic regression: A brief primer. Acad. Emerg. Med. 2011, 18, 1099–1104. [Google Scholar] [CrossRef]
- Joachims, T. Svmlight: Support Vector Machine; University of Dortmund: Dortmund, Germany, 1999; Volume 19, p. 25. Available online: http://svmlight.joachims.org/ (accessed on 9 February 2020).
- Noble, W.S. What is a support vector machine? Nat. Biotechnol. 2006, 24, 1565–1567. [Google Scholar] [CrossRef]
- Tan, S. An effective refinement strategy for KNN text classifier. Expert Syst. Appl. 2006, 30, 290–298. [Google Scholar] [CrossRef]
- Rish, I. An empirical study of the naive Bayes classifier. IJCAI 2001 Workshop Empir. Methods Artif. Intell. 2001, 3, 41–46. [Google Scholar]
- Dai, W.; Xue, G.; Yang, Q.; Yu, Y. Transferring naive bayes classifiers for text classification. AAAI 2007, 7, 540–545. [Google Scholar]
- Kibriya, A.; Frank, E.; Pfahringer, B.; Holmes, G. Multinomial Naive Bayes for Text Categorization Revisited; Springer: Berlin/Heidelberg, Germany, 2004; pp. 488–499. [Google Scholar]
- Priyam, A.; Abhijeeta, G.; Rathee, A.; Srivastava, S. Comparative analysis of decision tree classification algorithms. Int. J. Curr. Eng. Technol. 2013, 3, 334–337. [Google Scholar]
- Xu, B.; Guo, X.; Ye, Y.; Cheng, J. An Improved Random Forest Classifier for Text Categorization. J. Comput. 2012, 7, 2913–2920. [Google Scholar] [CrossRef]
- Belgiu, M.; Drăguţ, L. Random forest in remote sensing: A review of applications and future directions. ISPRS J. Photogramm. Remote Sens. 2016, 114, 24–31. [Google Scholar] [CrossRef]
- Chen, Z.; Jiang, F.; Cheng, Y.; Gu, X.; Liu, W.; Peng, J. XGBoost classifier for DDoS attack detection and analysis in SDN-based cloud. In Proceedings of the IEEE International Conference On Big Data And Smart Computing (bigcomp), Shanghai, China, 15–17 January 2018; pp. 251–256. [Google Scholar]
- Kim, Y. Convolutional neural networks for sentence classification. arXiv 2014, arXiv:1408.5882. [Google Scholar]
- Severyn, A.; Moschitti, A. Unitn: Training deep convolutional neural network for twitter sentiment classification. In Proceedings of the 9th International Workshop on Semantic Evaluation (SemEval 2015), Denver, CO, USA, 4–5 June 2015; pp. 464–469. [Google Scholar]
- Wang, X.; Liu, Y.; Sun, C.; Wang, B.; Wang, X. Predicting polarities of tweets by composing word embeddings with long short-term memory. In Proceedings of the 53rd Annual Meeting of The Association For Computational Linguistics and the 7th International Joint Conference On Natural Language Processing (Volume 1: Long Papers), Beijing, China, 26–31 July 2015; pp. 1343–1353. [Google Scholar]
- Hochreiter, S.; Schmidhuber, J. Long short-term memory. Neural Comput. 1997, 9, 1735–1780. [Google Scholar] [CrossRef]
- Rojas-Barahona, L. Deep learning for sentiment analysis. Lang. Linguist. Compass 2016, 10, 701–719. [Google Scholar] [CrossRef]
- Lee, K.; Caverlee, J.; Webb, S. Uncovering social spammers: Social honeypots+ machine learning. In Proceedings of the 33rd International ACM SIGIR Conference on Research and Development in Information Retrieval, New York, NY, USA, 19–23 July 2010; pp. 435–442. [Google Scholar]


| Name of the State | Number of Tweets |
|---|---|
| Arizona | 34,588 |
| California | 195,602 |
| Florida | 105,525 |
| Georgia | 51,098 |
| Illinois | 63,110 |
| Nevada | 24,926 |
| New York | 104,874 |
| Texas | 158,319 |
| Washington | 84,960 |
| Name of the State | Number of Covid Cases |
|---|---|
| Arizona | 238 |
| California | 791 |
| Florida | 977 |
| Georgia | 2302 |
| Illinois | 1164 |
| Nevada | 140 |
| New York | 874 |
| Texas | 2471 |
| Washington | 569 |
| Feature Extraction | Algorithms | Accuracy | Precision | Recall | -Score |
|---|---|---|---|---|---|
| bag-of-words | Logistic Regression | 93.76% | 95.08% | 89.28% | 91.85% |
| SVM | 93.97% | 95.49% | 89.66% | 92.25% | |
| Naïve Bayes | 90.44% | 89.10% | 86.05% | 87.46% | |
| k-NN | 88.84% | 93.29% | 81.06% | 85.73% | |
| Decision Tree | 95.69% | 94.98% | 94.39% | 94.68% | |
| Random Forest | 97.09% | 97.68% | 95.21% | 96.39% | |
| XGBoost | 84.25% | 91.07% | 72.17% | 78.06% | |
| TF-IDF | Logistic Regression | 90.88% | 93.46% | 84.18% | 87.98% |
| SVM | 93.75% | 95.10% | 89.27% | 91.85% | |
| Naïve Bayes | 90.83% | 91.79% | 84.67% | 87.70% | |
| k-NN | 90.23% | 93.04% | 83.96% | 87.68% | |
| Decision Tree | 95.91% | 95.44% | 94.41% | 94.91% | |
| Random Forest | 97.11% | 97.83% | 95.13% | 96.41% | |
| XGBoost | 83.46% | 90.91% | 70.82% | 76.88% |
| Algorithms | Feature Extraction | Accuracy | Precision | Recall | -Score |
|---|---|---|---|---|---|
| CNN | GloVe with 100d | 98.51% | 98.00% | 98.00% | 98.00% |
| GloVe with 200d | 98.89% | 98.00% | 98.00% | 98.00% | |
| GloVe with 300d | 99.07% | 99.00% | 98.00% | 98.00% | |
| Encoding Techniques | 99.34% | 99.00% | 99.00% | 99.00% | |
| word2vec | 99.89% | 99.91% | 99.99% | 99.99% | |
| LSTM | GloVe with 100d | 61.74% | 21.00% | 33.00% | 26.00% |
| GloVe with 200d | 61.74% | 21.00% | 33.00% | 26.00% | |
| GloVe with 300d | 61.74% | 21.00% | 33.00% | 26.00% | |
| Encoding techniques | 99.24% | 99.00% | 99.00% | 99.00% | |
| word2vec | 99.88% | 99.99% | 99.99% | 99.99% |
Publisher’s Note: MDPI stays neutral with regard to jurisdictional claims in published maps and institutional affiliations. |
© 2022 by the authors. Licensee MDPI, Basel, Switzerland. This article is an open access article distributed under the terms and conditions of the Creative Commons Attribution (CC BY) license (https://creativecommons.org/licenses/by/4.0/).
Share and Cite
Yeasmin, N.; Mahbub, N.I.; Baowaly, M.K.; Singh, B.C.; Alom, Z.; Aung, Z.; Azim, M.A. Analysis and Prediction of User Sentiment on COVID-19 Pandemic Using Tweets. Big Data Cogn. Comput. 2022, 6, 65. https://0-doi-org.brum.beds.ac.uk/10.3390/bdcc6020065
Yeasmin N, Mahbub NI, Baowaly MK, Singh BC, Alom Z, Aung Z, Azim MA. Analysis and Prediction of User Sentiment on COVID-19 Pandemic Using Tweets. Big Data and Cognitive Computing. 2022; 6(2):65. https://0-doi-org.brum.beds.ac.uk/10.3390/bdcc6020065
Chicago/Turabian StyleYeasmin, Nilufa, Nosin Ibna Mahbub, Mrinal Kanti Baowaly, Bikash Chandra Singh, Zulfikar Alom, Zeyar Aung, and Mohammad Abdul Azim. 2022. "Analysis and Prediction of User Sentiment on COVID-19 Pandemic Using Tweets" Big Data and Cognitive Computing 6, no. 2: 65. https://0-doi-org.brum.beds.ac.uk/10.3390/bdcc6020065