
Iris Liveness Detection Using Multiple Deep Convolution Networks


1
Symbiosis Institute of Technology, Symbiosis International (Deemed University), Pune 412115, India
2
Symbiosis Centre for Applied Artificial Intelligence, Symbiosis International (Deemed University), Pune 412115, India
3
Centre for Advanced Modelling and Geospatial Information Systems (CAMGIS), School of Civil and Environmental Engineering, Faculty of Engineering and Information Technology, University of Technology Sydney, Sydney, NSW 20017, Australia
4
Center of Excellence for Climate Change Research, King Abdulaziz University, Jeddah 21589, Saudi Arabia
5
Earth Observation Center, Institute of Climate Change, Universiti Kebangsaan Malaysia (UKM), Bangi 43600, Malaysia
*
Author to whom correspondence should be addressed.
Big Data Cogn. Comput. 2022, 6(2), 67; https://0-doi-org.brum.beds.ac.uk/10.3390/bdcc6020067
Submission received: 18 May 2022
/
Revised: 8 June 2022
/
Accepted: 9 June 2022
/
Published: 15 June 2022
(This article belongs to the Special Issue Data, Structure, and Information in Artificial Intelligence)
Abstract
:In the recent decade, comprehensive research has been carried out in terms of promising biometrics modalities regarding humans’ physical features for person recognition. This work focuses on iris characteristics and traits for person identification and iris liveness detection. This study used five pre-trained networks, including VGG-16, Inceptionv3, Resnet50, Densenet121, and EfficientNetB7, to recognize iris liveness using transfer learning techniques. These models are compared using three state-of-the-art biometric databases: the LivDet-Iris 2015 dataset, IIITD contact dataset, and ND Iris3D 2020 dataset. Validation accuracy, loss, precision, recall, and f1-score, APCER (attack presentation classification error rate), NPCER (normal presentation classification error rate), and ACER (average classification error rate) were used to evaluate the performance of all pre-trained models. According to the observational data, these models have a considerable ability to transfer their experience to the field of iris recognition and to recognize the nanostructures within the iris region. Using the ND Iris 3D 2020 dataset, the EfficeintNetB7 model has achieved 99.97% identification accuracy. Experiments show that pre-trained models outperform other current iris biometrics variants.
1. Introduction
Iris identification systems have proven to be dependable over time and are inexpensive, non-invasive, and contactless; these attributes will help it to expand in the market over the following years [1]. Presentation attack instruments (PAI) have been proven to be a significant threat to iris recognition systems [2]. Here, PAI refers to a trait of biometrics employed in a presentation attack (PA). Presentation attack detection (PAD) refers to a biometric system’s ability to identify PAIs, which would otherwise deceive the system into mistaking an unauthorized user for a legitimate one by presenting an artificial, forged version of the original biometric attribute to the image capture equipment.
The biometric community, including researchers and manufacturers, has taken on the difficult challenge of designing and creating effective security measures against this issue [3], with PAD approaches being recommended as a possible solution. Threats are no longer limited to theoretical or scientific research; they are already being conducted against real-world businesses. One example is using a regular printer and a contact lens to attack Samsung Galaxy S8 devices with the iris unlock feature. Hacking groups aiming to gain notoriety for genuine criminal cases have disclosed this instance to the public via live biometric presentations during conferences [4]. All of these threats, as well as any new or unfamiliar PAI forms that might be developed in the future, should be detectable using an ideal PAD approach [4]. As early models of the LivDet competition have demonstrated, PAD for iris recognition systems is diverse, with many unresolved issues in developing practical algorithms for identifying iris PAD [5]. This article uses five pre-trained networks to recognize iris liveness: VGG-16 [6], Inceptionv3 [7], Resnet50 [8], Densenet121 [9], and EfficientNetB7 [10]. We compared models in this study using the same data and factors to find the best model for distinguishing between real and fake iris images. To eliminate any biases, the models were trained and evaluated on real and fake iris images from several datasets. The models were then evaluated using performance measures, along with the time it takes to compute them. The findings were thoroughly examined, and the best model for binary classification was selected.
To our knowledge, the most commonly employed transfer learning models for identifying iris liveness in the existing literature are VGG-16 [11], Inceptionv3 [7], Resnet50 [8], Densenet121 [8], and EfficientNetB7. These models are validated using one or two iris datasets. To date, no one has carried out a comparative analysis among these models, based on different state-of-the-art iris biometric databases. Therefore, there is a need for these comparative analyses to identify which pre-trained model gives the best iris liveness detection among the different standard iris benchmark datasets.
In this paper, several transfer learning models are used to identify iris liveness detection.
This work’s primary contributions can be summarized in the following points:
- To identify iris liveness through five pre-trained networks, namely, VGG-16, Inceptionv3, Resnet50, Densenet121, and EfficientNetB7;
- To conduct a performance comparison across all five models to decide which pre-trained model is better for Iris-PAD;
- To fine-tune all these models to achieve better performance.
To assess these models as performance indicators, twelve metrics are used: i.e., validation accuracy, training accuracy, validation loss, training loss, precision, recall and f1-score, APCER, BPCER, ACER, training time, and testing time.
The rest of the paper is structured as follows. Section 2 discusses related work in the published literature. The background, architecture, and working process of the proposed system are all described in Section 3. Section 4 explains the experimental setup, along with a description of the datasets used for experimentation and the performance metrics used for evaluation. Section 5 describes the experimental results. A comparison of the model’s performance with other models and a discussion of the results is offered in Section 6. Lastly, Section 7 offers our conclusions.
2. Related Work
Due to the increasing deployment of these systems for various secure processes, which raises the possibility of criminal assaults on these sensitive systems, numerous PAD approaches for iris identification systems have been presented in the research literature [12]. The majority of iris PAD research has been focused on deep learning algorithms since 2018, but a few traditional computer-vision-based methods have been proposed [13].
The following are some of the most prevalent methods previously used for detecting iris liveness: Czajka [14] used pupil dynamics to create a liveness detection system. The pupil reaction was tested in this technique, using unexpected changes in light intensity. Fathy and Ali [15] did not take into account the segmentation and normalization steps that are commonly employed in fake iris identification systems. The original image is broken down into wavelets using wavelet packets (WPs). For false iris identification, Agarwal et al. [16] employed a feature descriptor called a local binary hexagonal extreme pattern. The proposed description takes advantage of the Hexa neighbor relationship between the center pixel and its neighbors. Thavalengal et al. [17] created a smartphone device for capturing RGB and NIR images of the eye and iris. For detection, distance measurements and pupil localization algorithms are often applied. One of the most recent and promising classification techniques uses deep learning. In the field of iris images, there are many works that use and apply this approach. Some of these works are described below. The author Kuehl Kamp [18] suggested integrating two iris PAD techniques: ensemble learning and CNNs. Widespread testing of this technique was carried out with the most challenging datasets available that were widely accessible. Cross-sensor and cross-dataset analyses were part of their experiments.
Their results revealed that different BSIF + CNN representations have differing abilities to capture distinct elements of the input images. This technique outperforms the LivDet-Iris 2017 competition results. One author, Hoffman, also reported good cross-dataset and cross-attack performance. A CNN had previously been used in [9] to perform classification tests on patches of an iris region. The findings revealed that the most challenging presentation attack to identify is that of textured contact lenses. This classification test method was eventually expanded to include the ocular region [19]. Three CNNs were combined to generate classification judgments in that study. Additional information that assists classification and excellent cross-dataset performance can be obtained by studying the ocular region in conjunction with the iris.
Transfer learning [20] is a process in which a model trained for one purpose on any large dataset can be reused for training and testing for a related purpose on small datasets. This approach is still used and is applied to iris images in several previous studies, some of which are described here.
Spoof nets [7] comprise four convolutional layers and one inception module and were inspired by GoogleNet. The inception module is made up of parallel layers of convolutional filters with dimensions of 11, 33, and 55. The module benefits from minimizing the architecture’s complexity and increasing its efficiency, as the dimension-11 filters reduce the number of features beforehand, implementing layers of convolution through higher-dimensional filters. The ResNet50 framework was used by Boyd [8] to see if iris-specific feature extractors could outperform a network trained for non-iris applications. They used five distinct sets of weights to demonstrate “three types of networks: off-the-shelf networks, fine-tuned networks, and networks trained from scratch for iris identification. They found that fine-tuning a current network to the specific iris domain outperformed training from scratch”.
For iris PAD, Yadav et al. [11] integrated handmade and deep-learning-based features. The VGG16 features were acquired from the last fully connected layer, which had a size of 4096; then, PCA (principal component analysis) was used to reduce it to a lower-dimensional vector. Trokielewicz et al. [21] offered a method of iris PAD to detect post-mortem samples, using a fine-tuned VGG-16 architecture. By providing class activation maps, this approach also examines those features and regions that the network finds most relevant to PAD classification. The results demonstrated a significant ability to detect post-mortem iris samples; however, there was no discussion of the cross-attack analysis. Yadav et al. [9] offered DensePAD, a novel PAD design based on the famous DenseNet CNN architecture. This suggested architecture received 120 × 160 normalized iris images as input and would then output a judgment on whether the sample was genuine or not. Their study looked at textured contact lenses in an uncontrolled, cross-sensor environment and presented promising findings on previously unseen varieties of textured contacts.
Unfortunately, because different researchers use separate deep learning approaches, it is questionable which model is superior. As a result, this paper examines multiple deep neural networks that have previously produced excellent results in identifying iris liveness. Based on our classification needs, the existing models were fine-tuned (VGG-16, Inceptionv3, Resnet50, Densenet121, and EfficientNetB7) in this research. As a result, the models were evaluated throughout this study using the same datasets and parameters to find the best model for distinguishing between authentic and false iris images. To prevent biases, the models were first trained and evaluated on real and fake iris images from diverse datasets. The models were then evaluated, based on their evaluation criteria and the amount of time they took to compute the results. The findings were thoroughly examined, and the best model for binary classification was chosen.
3. Proposed Iris Liveness Detection
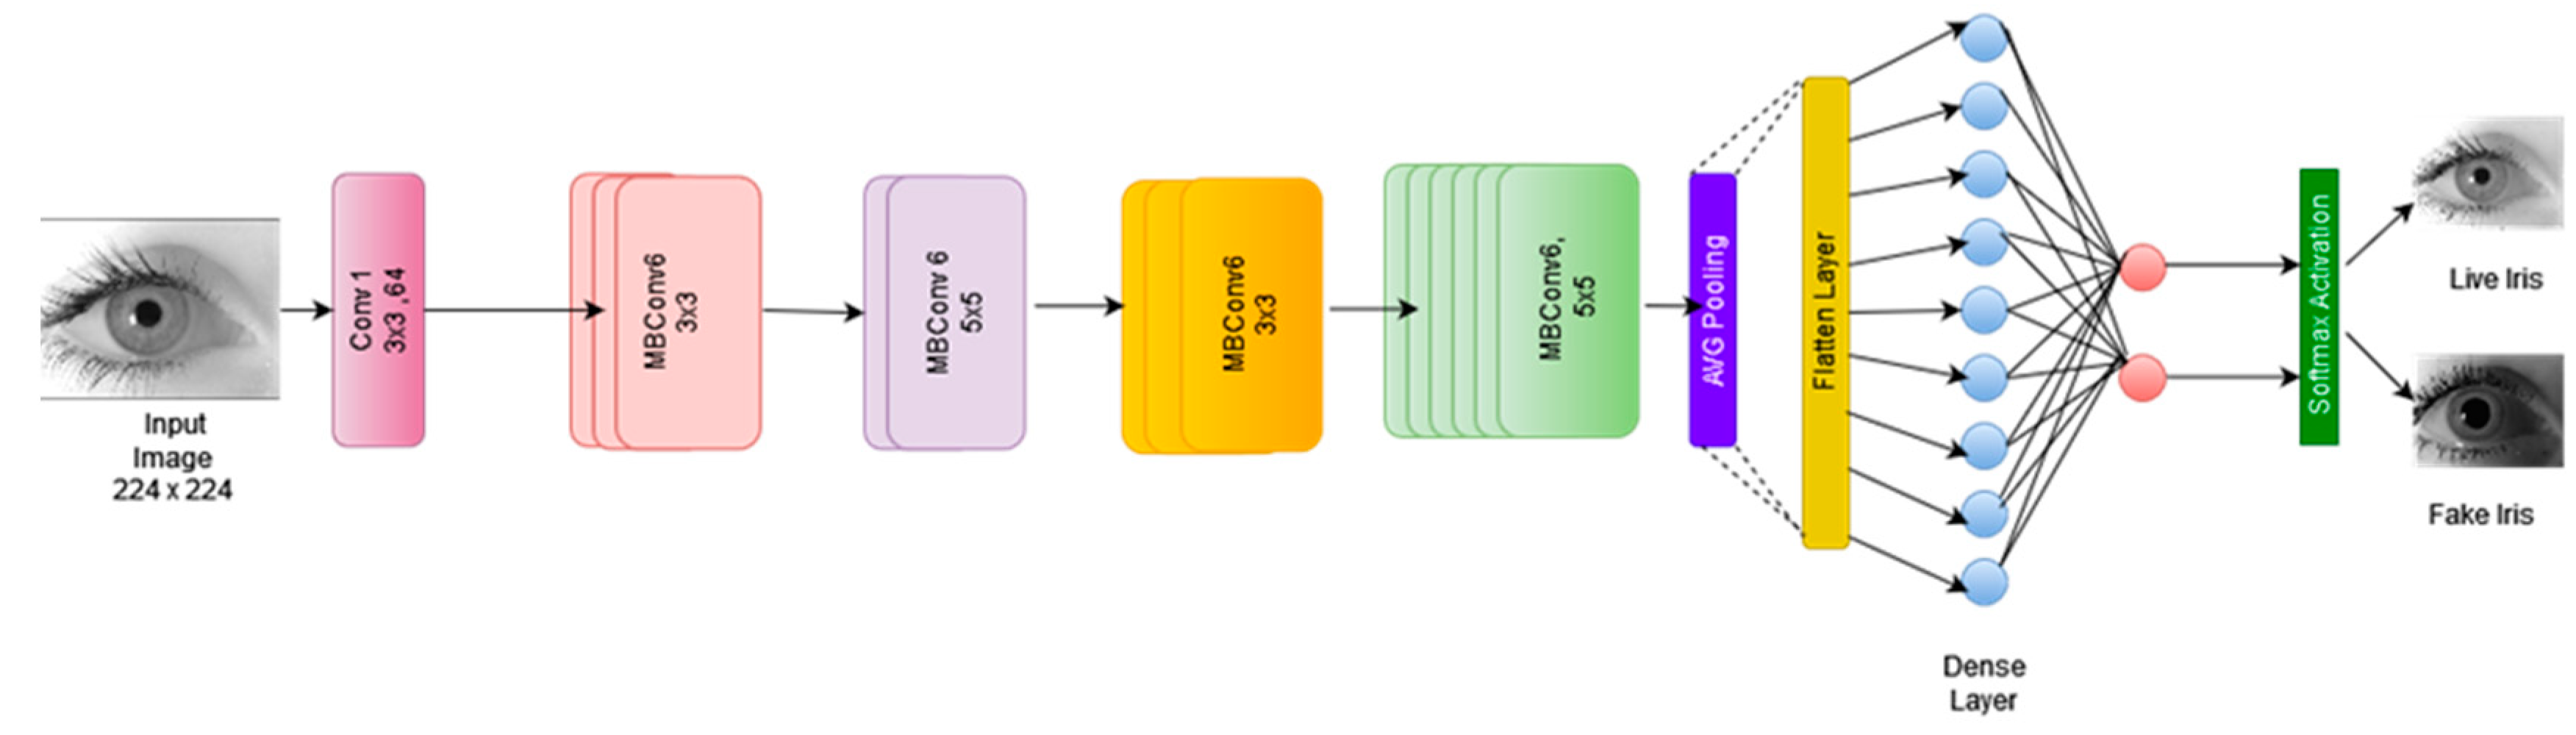
To mitigate time issues with the training data set, a transfer learning strategy was applied and pre-trained weights from ImageNet were used, which helped to speed up the process. Due to the tiny data set, the models avoided overfitting via transfer learning. The schematic design of the proposed model is illustrated in Figure 1. In this investigation, three standard iris benchmark datasets were used. To prevent any biases toward data, images from several different databases were sent to the models. We fine-tuned the last layer of five state-of-the-art deep learning models—VGG-16, Inceptionv3, Resnet50, Densenet121, and EfficientNetB7. For binary classification, these models were fine-tuned: the last set of layers was modified with a flattened layer, consisting of fully connected layers and a SoftMax activation function that turned the data from the existing layer into a huge one-dimensional matrix. During the training of these networks, the data augmentation (DA) technique was used. Some augmentation approaches, like flipping and rotation, were used on the input image matrix to generate supplementary training images. For regularization, a 0.5-dropout was added. Finally, a dense layer was added that employed SoftMax activation for the earlier layers and produced two probability outputs for the “Live Iris Image” and “Fake Iris Image” classes. Finally, we offered model selection criteria based on performance and time complexity. We have made all trained models public so that they may be utilized for iris liveness detection transfer learning. The design of these models and how they have been employed for two-class classification will be briefly described in the following section.
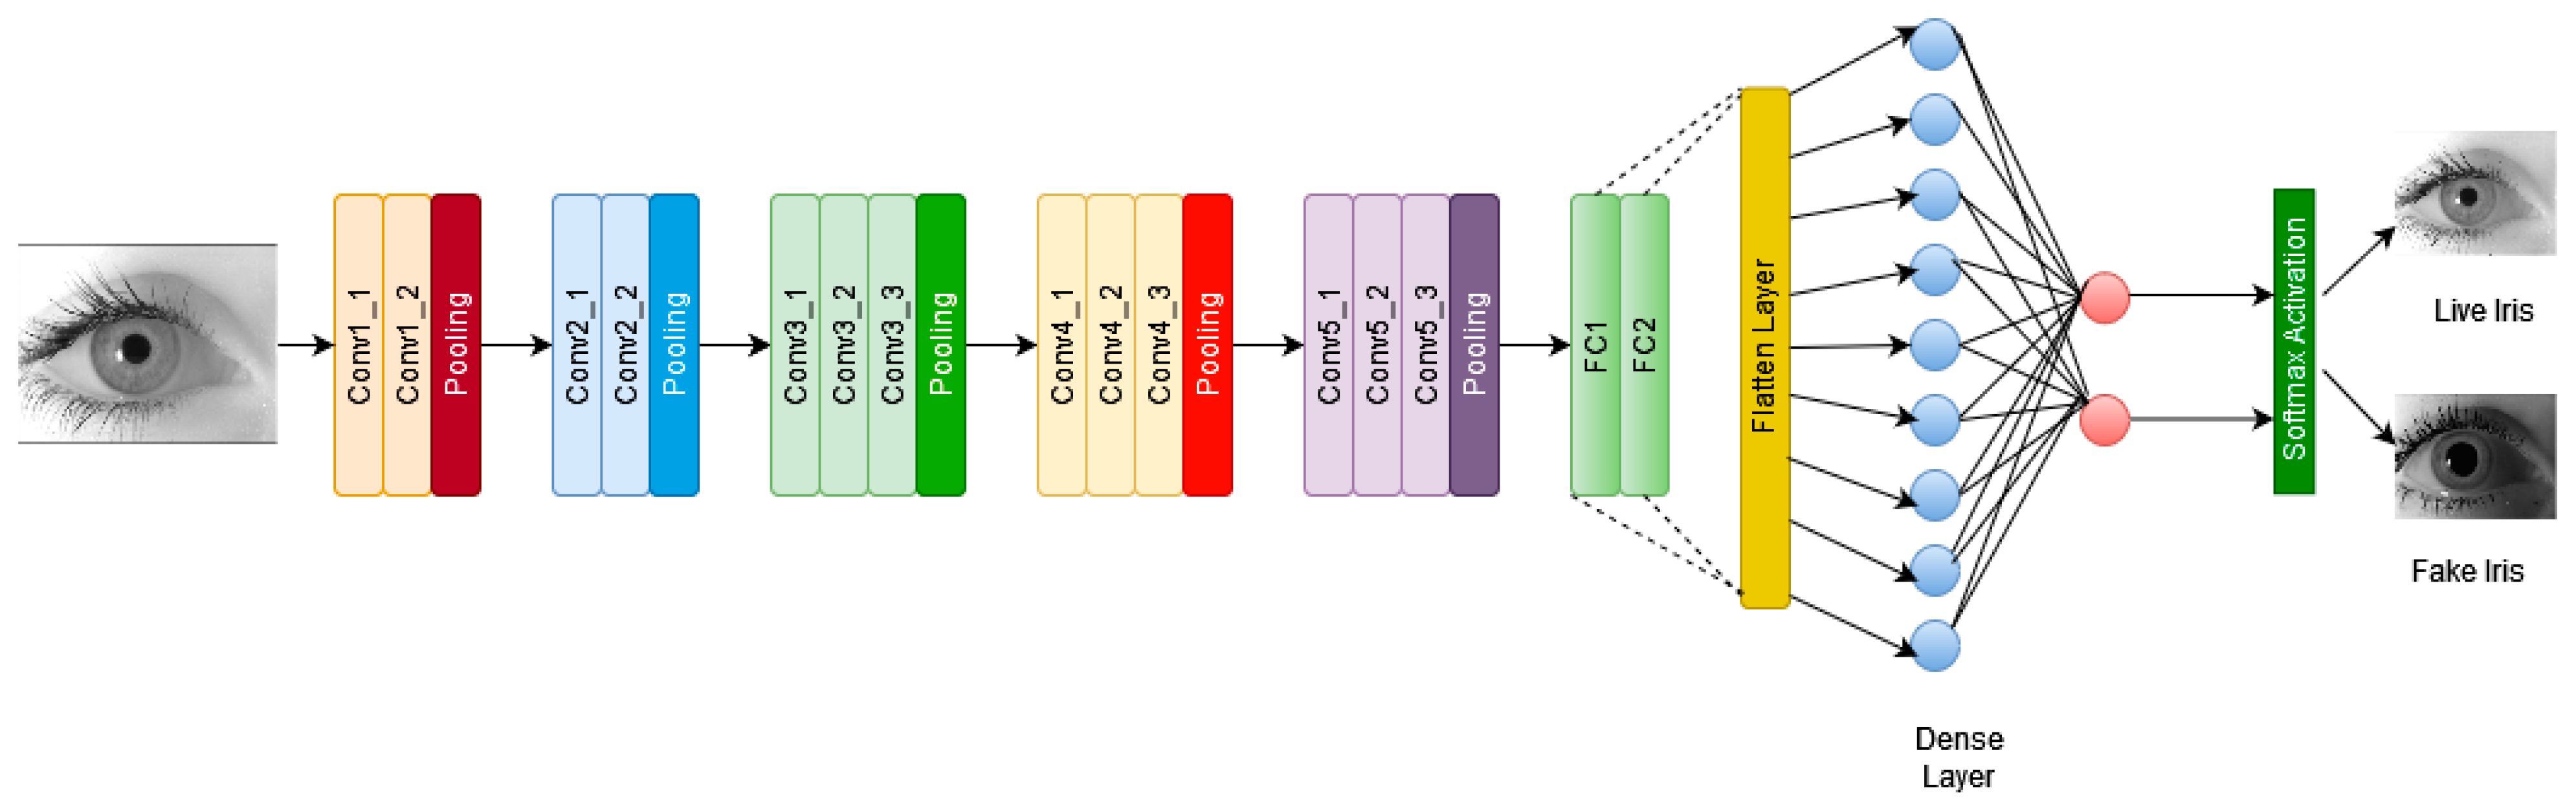
3.1. VGG-16
The VGG16 input is a 224 × 224 RGB image with a predefined size. It has 16 layers, including 13 convolutional layers and three fully connected layers, using maxpooling to minimize volume size and a SoftMax classifier just after the fully connected layer. For this learning process, the last fully connected layer and SoftMax activation are substituted with our designed classifier, as shown in Figure 2 [6].
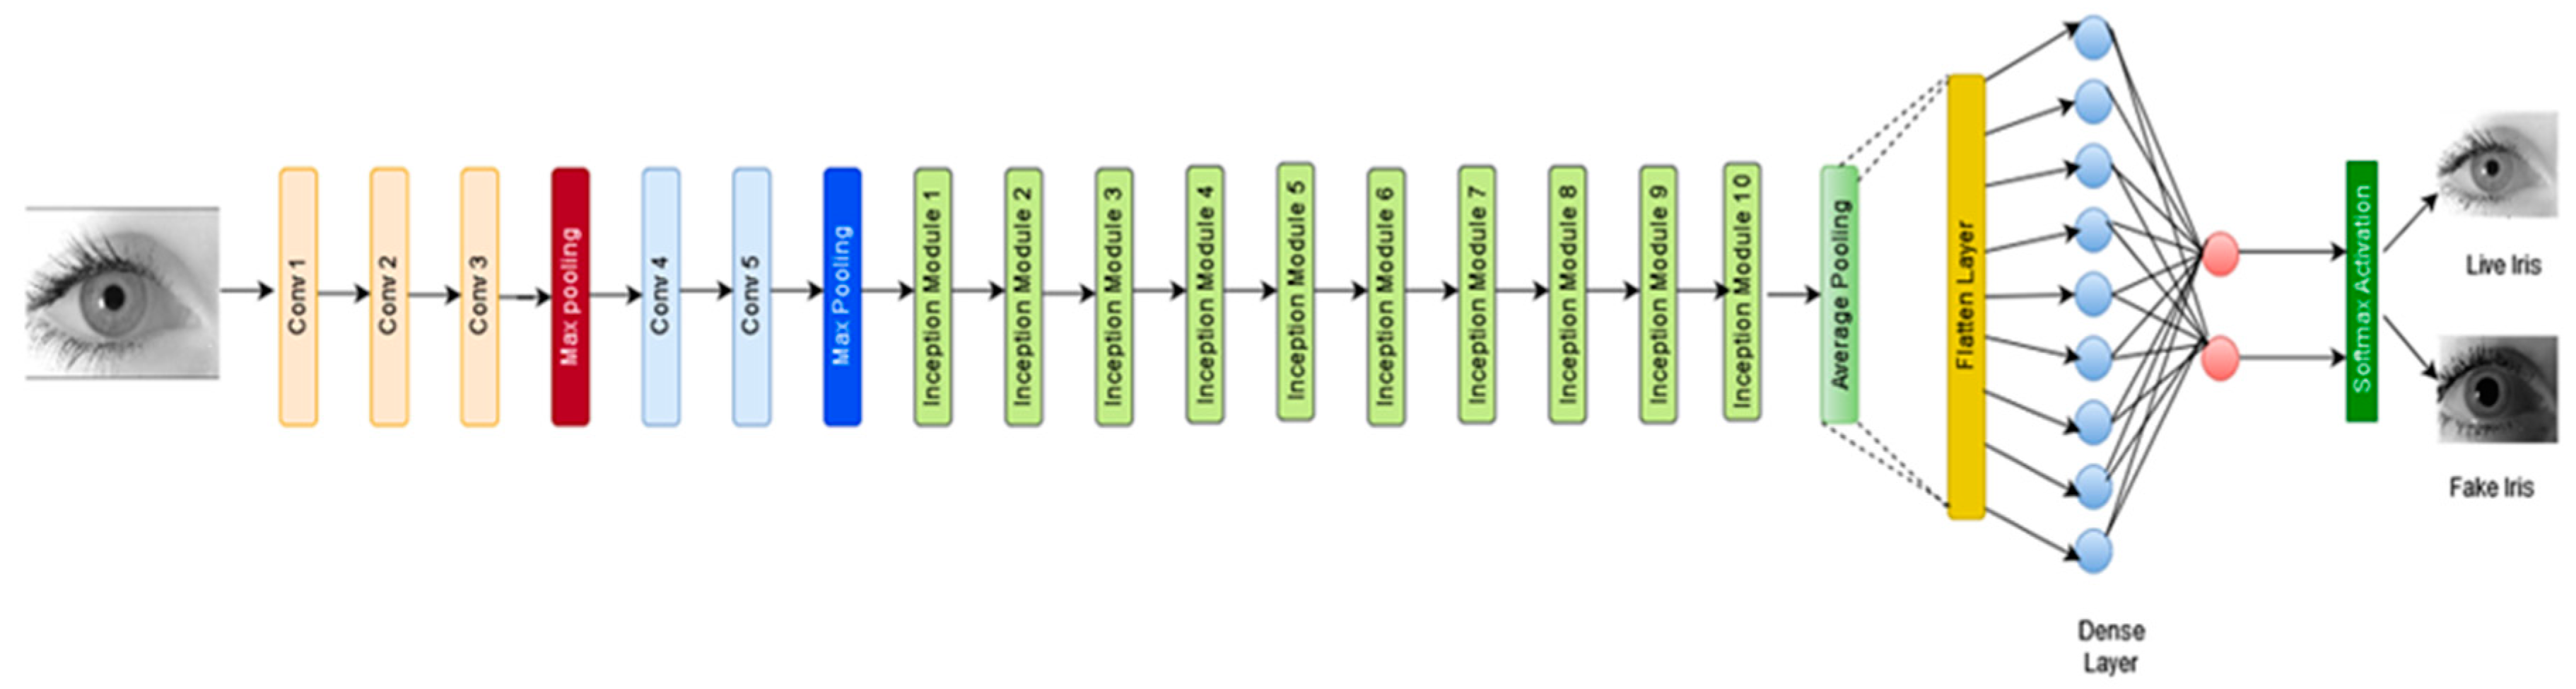
3.2. InceptionV3
InceptionV1 architecture is also known as GoogleNet. InceptionV3 has 484 levels, each of which contains 11 inception modules. It has a 299 × 299 image input size. Convolution filters, pooling layers, and the Relu activation function are included in each module. InceptionV3 lessens the number of variables without compromising network efficiency, by factoring in convolutions.
To minimize the number of features, InceptionV3 developed a revolutionary downsizing method. Figure 3 depicts our fine-tuned InceptionV3 model for detecting iris liveness.
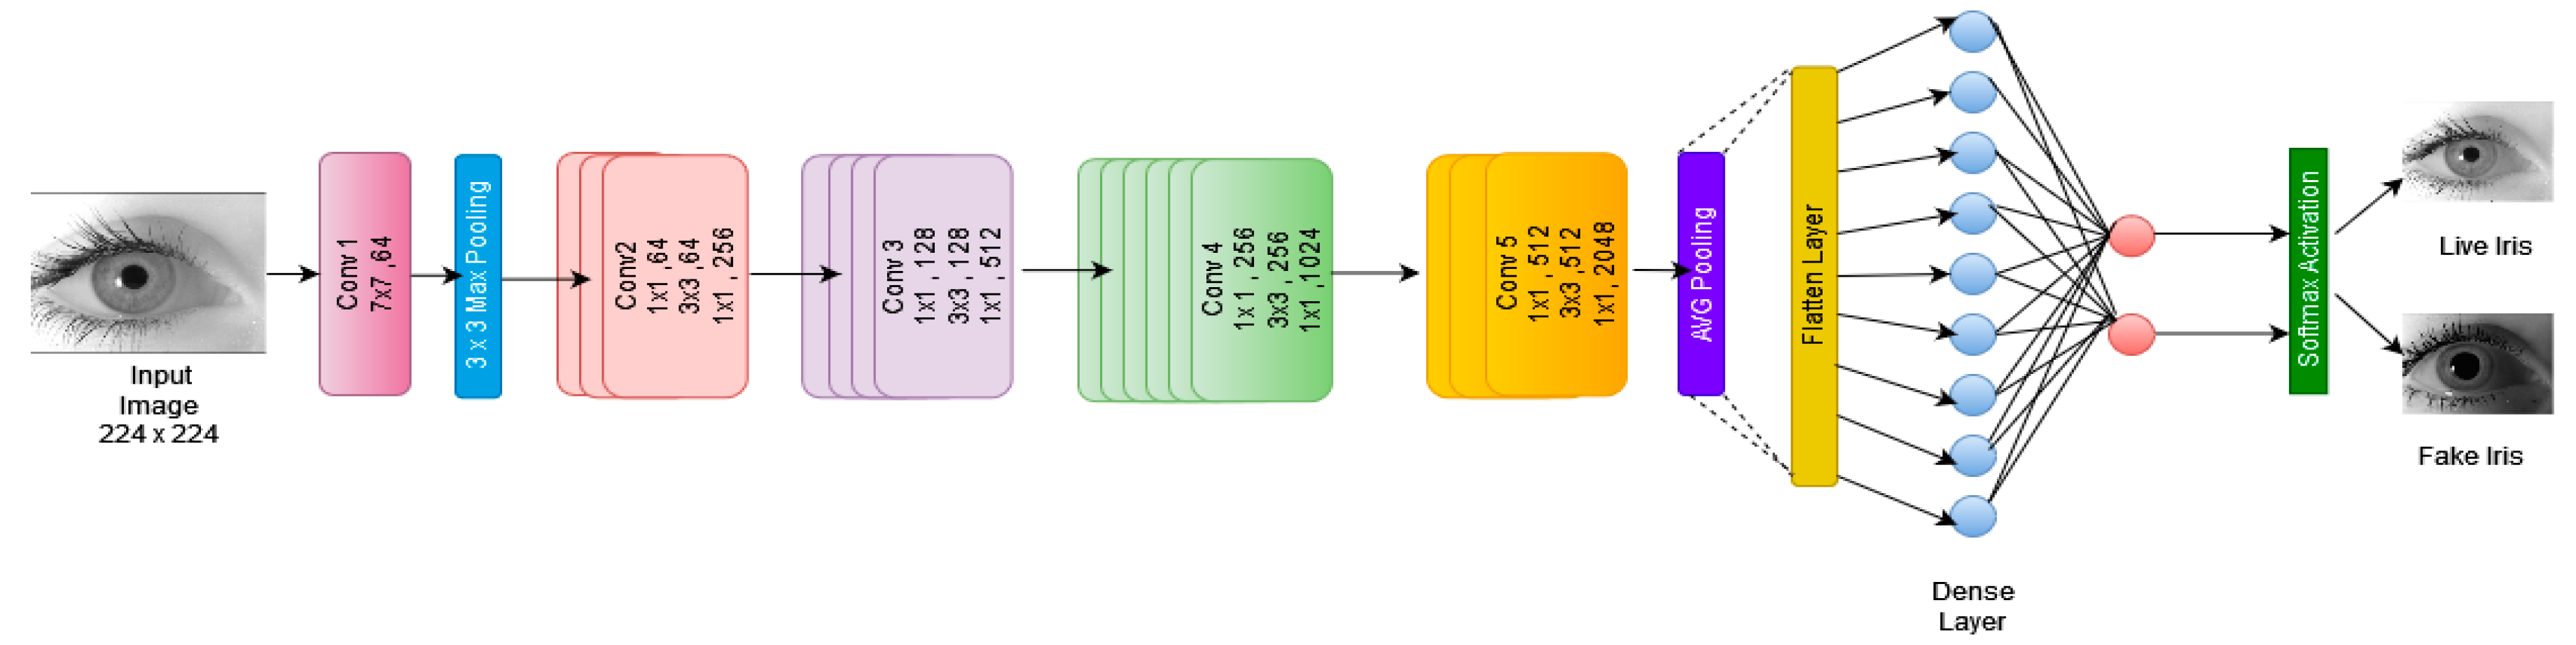
3.3. ResNet 50
ResNet50 is a ResNet (residual network) variant. There are 48 convolutional layers, 1 MaxPool, and one average pool layer in this model. Each convolution block has three convolution layers, and each identification block also has three convolution layers. ResNet-50 can be trained with about 23 million parameters. Figure 4 depicts the fine-tuned ResNet50 model for detecting Iris liveness.
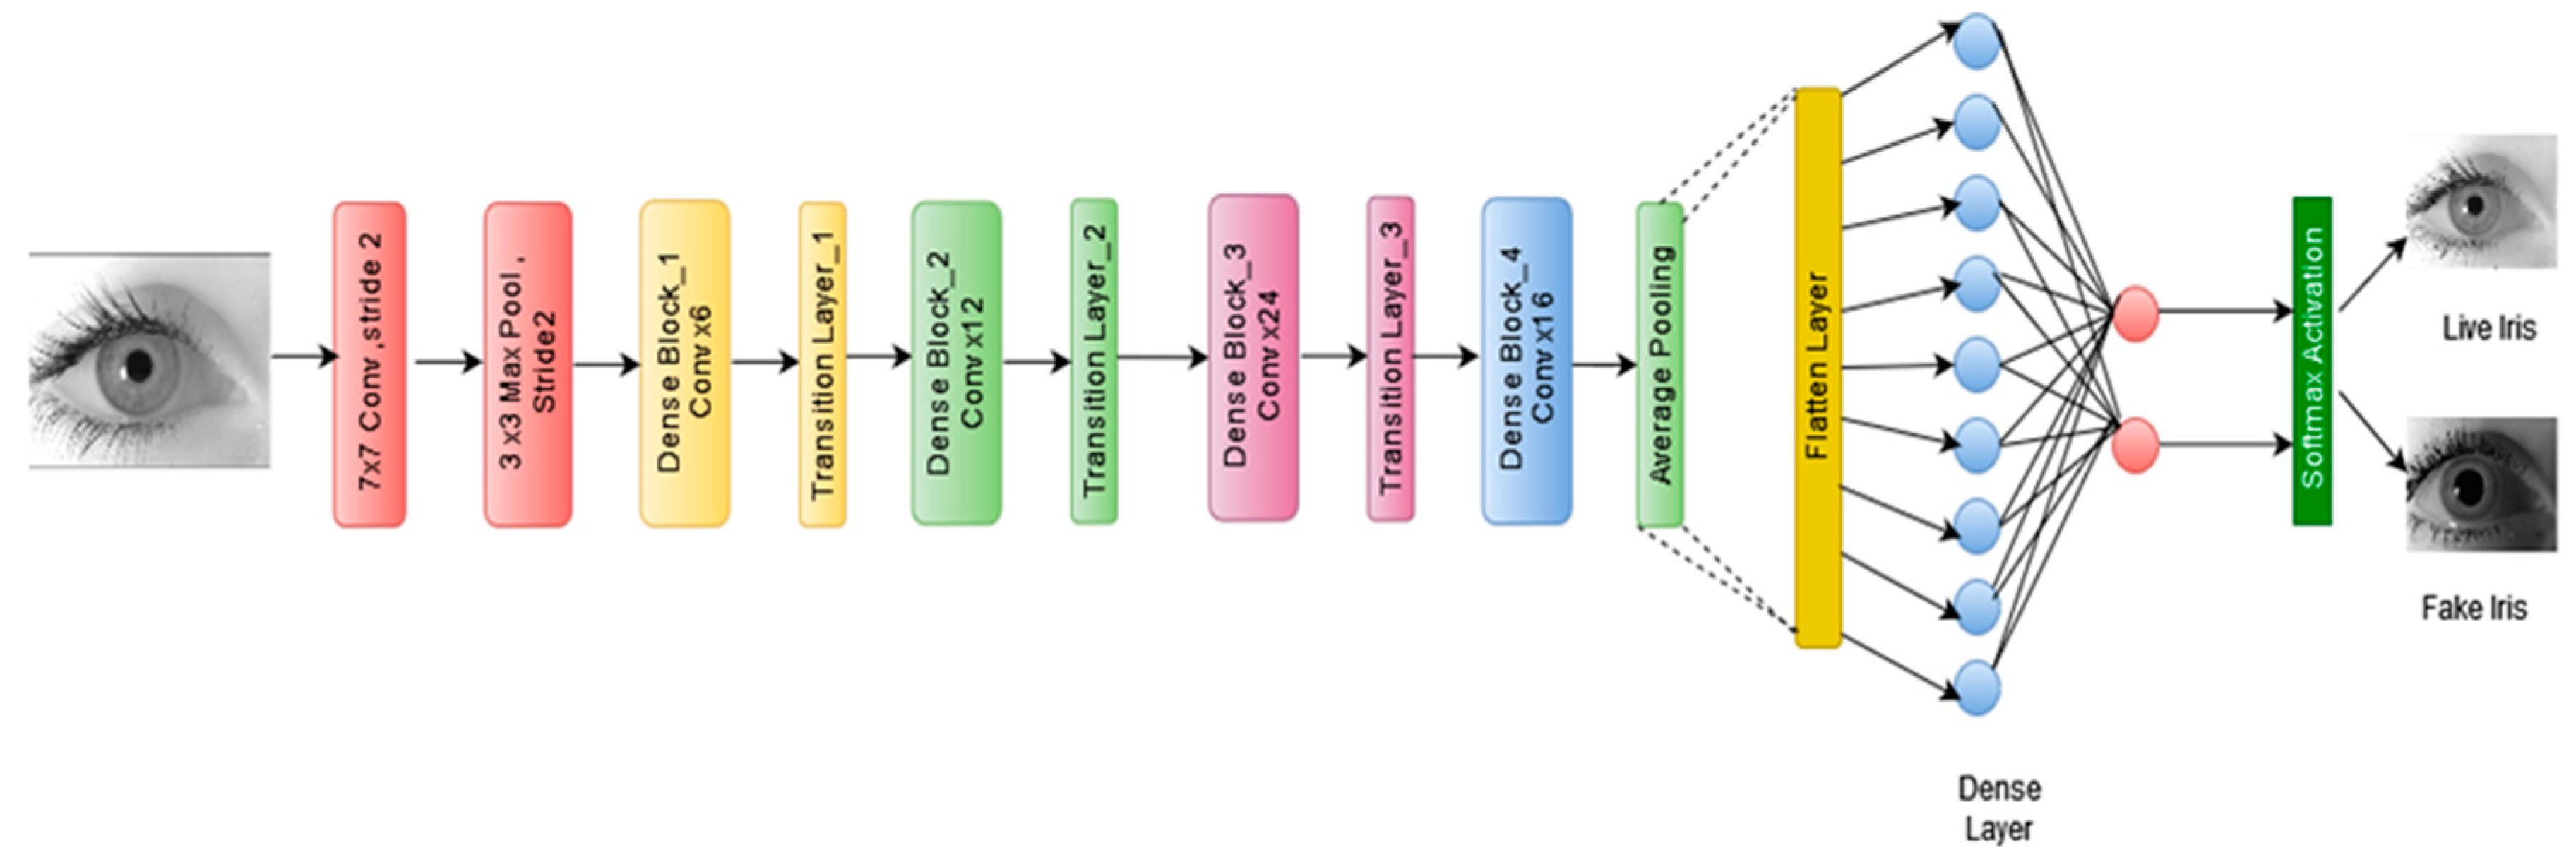
3.4. DenseNet121
DenseNet121′s input is a 224 × 224 RGB image of a predefined size. DenseNet121 is made up of 121 layers, with about 8 million parameters. It is organized into dense blocks, with the same feature map size but with various filters within each block. Transition layers are the layers that reside between the blocks and apply batch normalization for down-sampling. The last fully connected layer and SoftMax activation are substituted with a classifier in this experiment, as shown in Figure 5.
3.5. EfficientNetB7
Efficient Net [10], one of the most advanced models, introduced a scaling strategy that uses a compound coefficient to equally scale all parameters of a network’s depth, width, and resolution. The EfficientNetB0-B7 designs are a family of architectures that have been built up from the baseline network and represent a good blend of accuracy and efficiency. Figure 6 depicts our fine-tuned EfficientNetB7 model for detecting iris liveness.
4. Experimental Set-Up
There are three subheadings in this section. All three datasets utilized for experimental validations are discussed in the first subsection. The second subsection describes how these deep learning models are trained. The third subsection delves deeper into the evaluation criteria utilized to evaluate the suggested approach’s results.
4.1. Description of the Dataset
Using numerous databases, the efficacy of the suggested models against various types of iris spoofing assaults is assessed. A description of each dataset and the total images used for experimentation is given below. From the total samples, 50% of images were arbitrarily used for testing. The remaining 50% of images were divided into two groups, with 80% used for training and 20% used for validation.
4.1.1. LivDet-Iris 2015: Clarkson Dataset
The Clarkson dataset has different training and testing images. The chosen classifiers were trained on training samples and tested on testing samples that are present in the dataset. In total, 3588 images were used for experimentation. Dalsa and LG sensors were utilized to acquire the images on this dataset. For both training and testing, three types of iris images were provided: live, patterned (contact lenses), and printed photographs [22]. Table 1 shows the number of images used for training, testing, and validation, along with samples of live and fake images from the LivDet-Iris 2015 dataset.
4.1.2. IIITD Contact Lens Iris (CLI Dataset)
The IIIT-D CLI database is provided by the image analysis and biometrics laboratory of the IIIT in Delhi [23,24]. It consists of 6570 iris images from 101 separate people. A total of 202 iris classifications were created by photographing each subject’s left and right iris. Images were captured using the Cogent CIS 202 dual iris sensor and the VistaFA2E single iris sensor [25]. Datasets provided three types of iris images: live (original images), colored contact lenses, and clear contact lenses. A total of 2000 images were selected randomly for experimentation. Table 2 shows the number of images used for training, testing, and validation, along with a sample of live and fake images from the CLI dataset.
4.1.3. ND_Iris3D_2020
Images were taken of 88 subjects (176 irises) wearing three distinct brands of contact lenses: Johnson & Johnson, Ciba Vision, and Bausch & Lomb, of irises with and without contact lenses [5,26]. Under varying near-infrared illumination, images were acquired using the LG4000 and AD100 iris sensors, allowing optical stereo-based 3D reconstruction techniques to be designed and tested. The dataset contains 6838 images, with the LG4000 sensor acquiring 3488 images and the AD100 sensor acquiring 3362 images. Table 3 shows the number of images used for training, testing, and validation, along with a sample of live and fake images from the ND_Iris3D_2020 dataset.
4.2. Model Training
For this study, a transfer learning approach was adopted, and pre-trained weights from ImageNet were used for the training data set. The pre-trained model weights were treated as the initial values for the new training process, and they were updated and adjusted in the training process. In this case, the weights were fine-tuned, from generic feature maps to the specific features associated with the new dataset. The goal of fine-tuning is to adapt generic features to a given task, rather than overwrite the generic learning.
The VGG-16, Inceptionv3, Resnet50, Densenet121, and EfficientNetB7 models were trained on an Intel(R) Core(TM) i3-6006U CPU @ 2.00 GHz 1.99 GHz, 12.0 GB RAM computer, running on a 64-bit operating system, for this experiment. The deep learning library TensorFlow 2.7 with Keras API was utilized for the algorithm creation and implementation of all models. To quantify the model’s effectiveness from the ground truth probabilities, the categorical cross-entropy loss function was used to train it. We then used an Adam optimizer with a learning rate of 0.001 to reduce the loss function and increase efficacy. To avoid the problem of an overfitting or underfitting model, we created an early termination approach, based on validation performance. During the training of these networks, data augmentation (DA) techniques, such as flipping and rotation, were used. Flipping and rotation are used on the input image matrix to generate supplementary training images. These augmentation techniques are used to reduce the risk of overfitting, thereby improving the accuracy of unseen data. To reduce the bias toward a dataset, the system was introduced to images from several databases. For regularization, a 0.5-dropout was added. Finally, a dense layer was added that employed SoftMax activation in the earlier layers and produced two probability outputs for the “Live Iris Image” and “Fake Iris Image” classes.
4.3. Performance Measures
Accuracy, as a common machine learning performance evaluation metric, was utilized to compare the performance of all the tested variations of the suggested approach. In addition, other critical biometric measures were considered: performance indices, such as loss, validation accuracy, precision, recall, f1_score, APCER, NPCER, and ACER were used to evaluate our analysis. The formulae for all performance measures are given in Equations (1)–(8).
where:
TP indicates the data samples, which are predicted as live iris samples and in fact are live samples;
TN gives the data samples detected as spoofed iris and also are spoofed iris samples;
FP indicates the samples identified as live iris samples but that are in fact spoofed ones;
FN shows the data samples detected as spoofed but that are in fact live iris samples;
M indicates the class;
yi, c and pi, c indicate the ground truth and predicted probabilities for individual images.
5. Results
This section gives the results of several experiments on the three datasets with five transfer learning networks, i.e., VGG-16, Inceptionv3, Resnet50, Densenet121, and EfficientNetB7. This section is organized into four sub-sections. Section 5.1 presents the results and graphs for the VGG-16 approach. Section 5.2 presents the results of the InceptionV3 network tests. The ResNet50 approach is discussed in Section 5.3. Section 5.4 presents the results of the DenseNet121 network tests. Section 5.5 presents the results of the EfficientNetB7 network tests. Table 4, Table 5, Table 6, Table 7 and Table 8 show the results of validation for the respective networks.
5.1. VGG-16
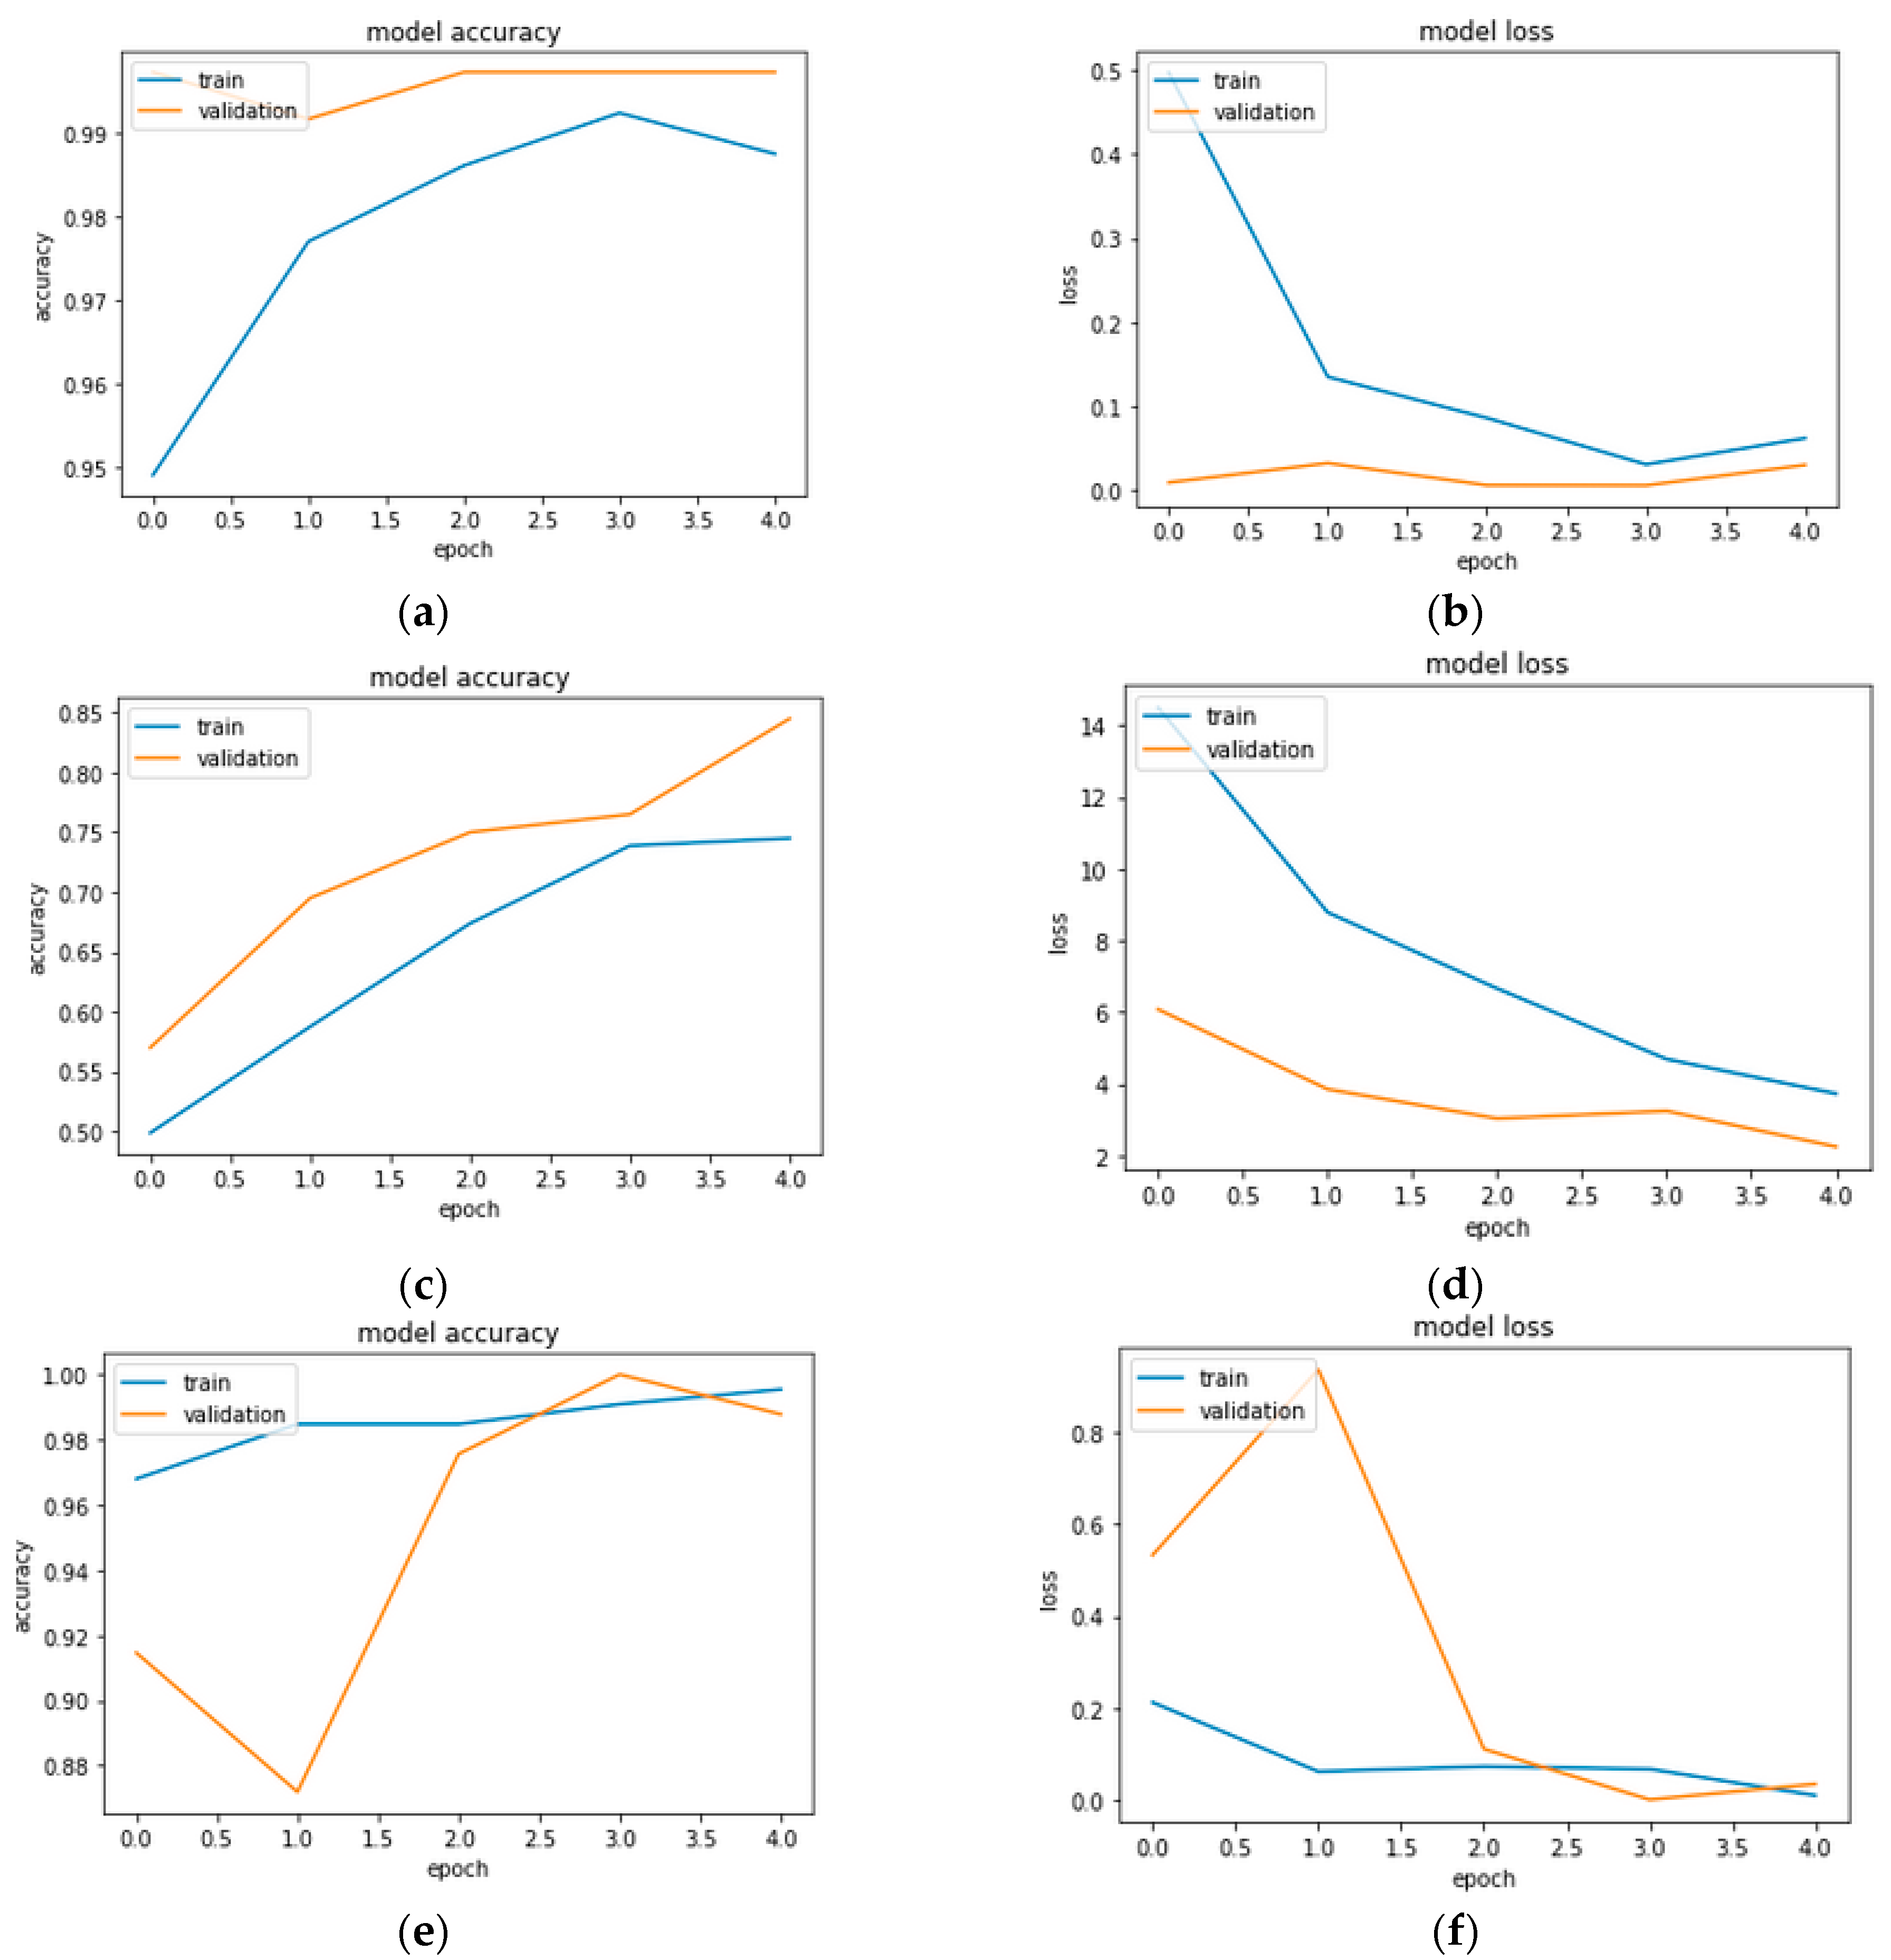
This section reports the best results for each dataset using the VGG16 model. Adam optimization achieved better performances compared to SGD. Table 4 shows a summary of the outcomes of the VGG16 model across all three datasets. It can be observed from Table 4 that the Clarkson 2015 dataset gave the best validation accuracy of 99.72%, while the ND Iris3D_2020 dataset gave the lowest ACER of 0.1%, with the lowest testing time of 417 s. Figure 7 shows the training and validation analysis over five epochs of the pre-trained VGG-16 model. From Figure 7, we can infer that, overall, the best results were observed using Adam optimization, with the Clarkson 2015 dataset for fine-tuning.
5.2. InceptionV3
The InceptionV1 architecture is also known as GoogleNet. This section reports the best results for each dataset, using the InceptionV3 model. Adam optimization achieved improved performances compared to SGD. Table 5 shows a summary of the outcomes of the InceptionV3 model across all datasets. It can be observed from Table 5 that the Clarkson 2015 dataset gave the best validation accuracy of 99.44% and the lowest ACER of 1.4%. The IIITD_contact dataset yielded the lowest testing time of 194 sec.
5.3. ResNet50
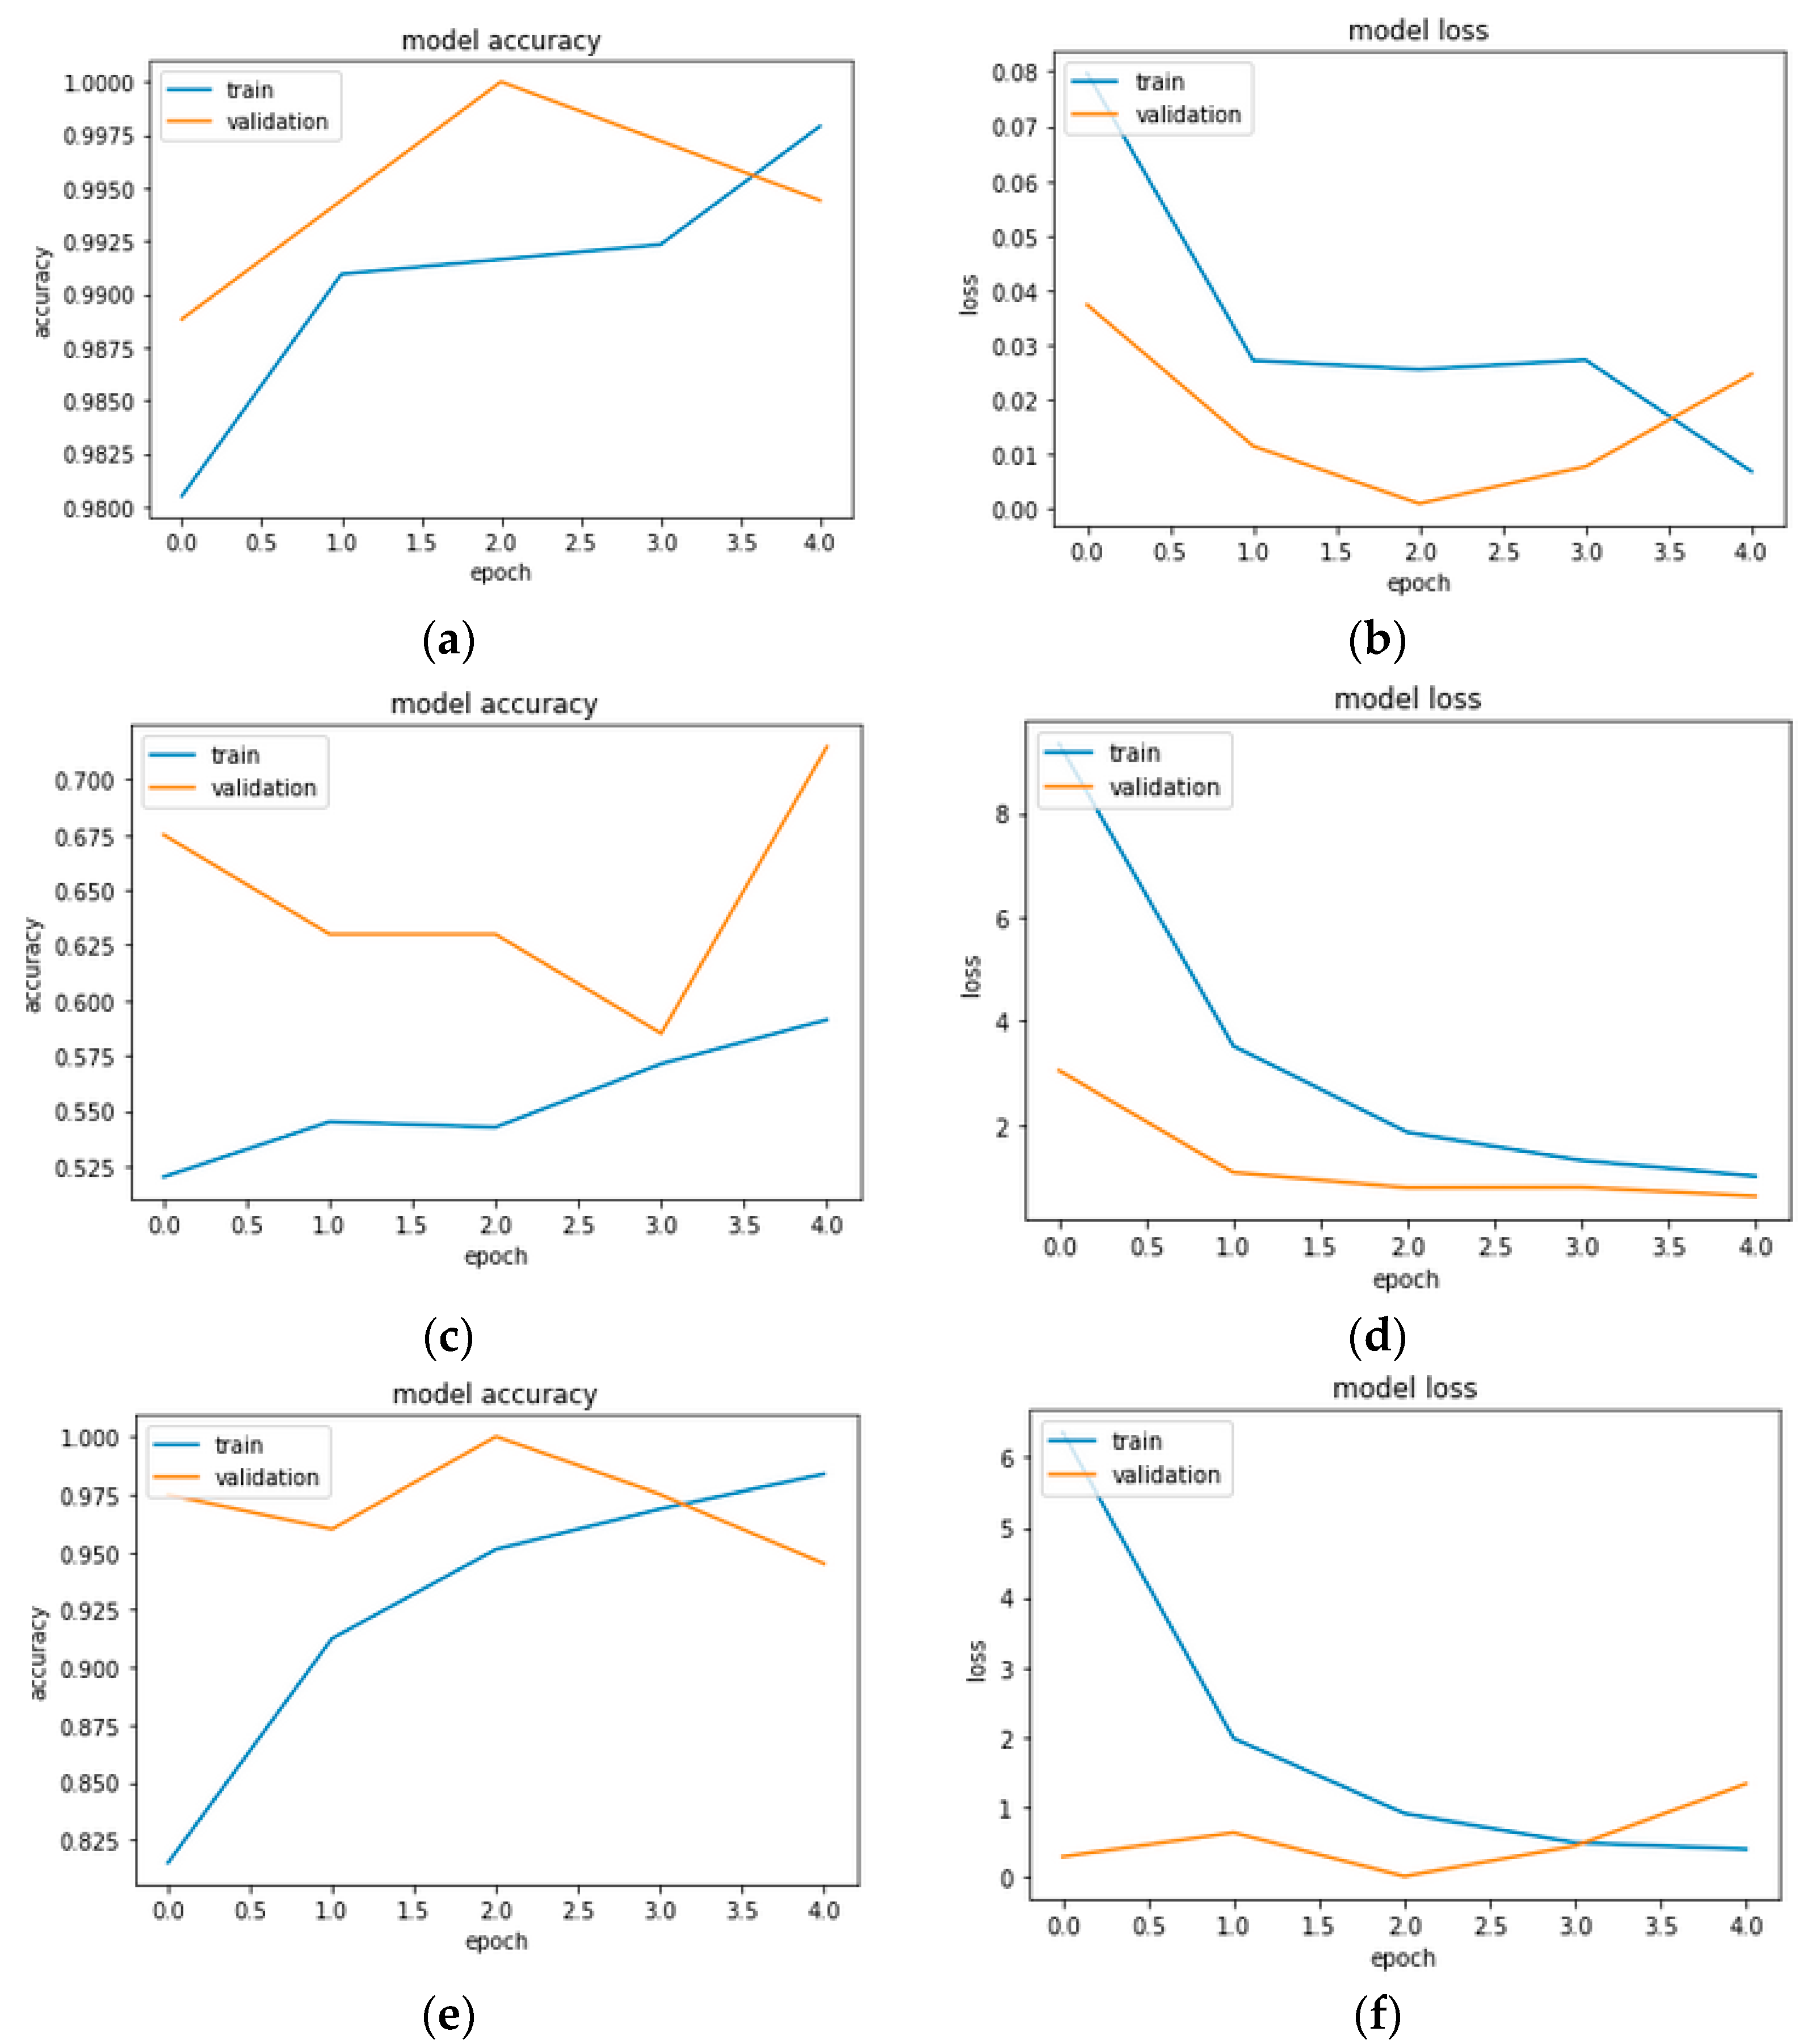
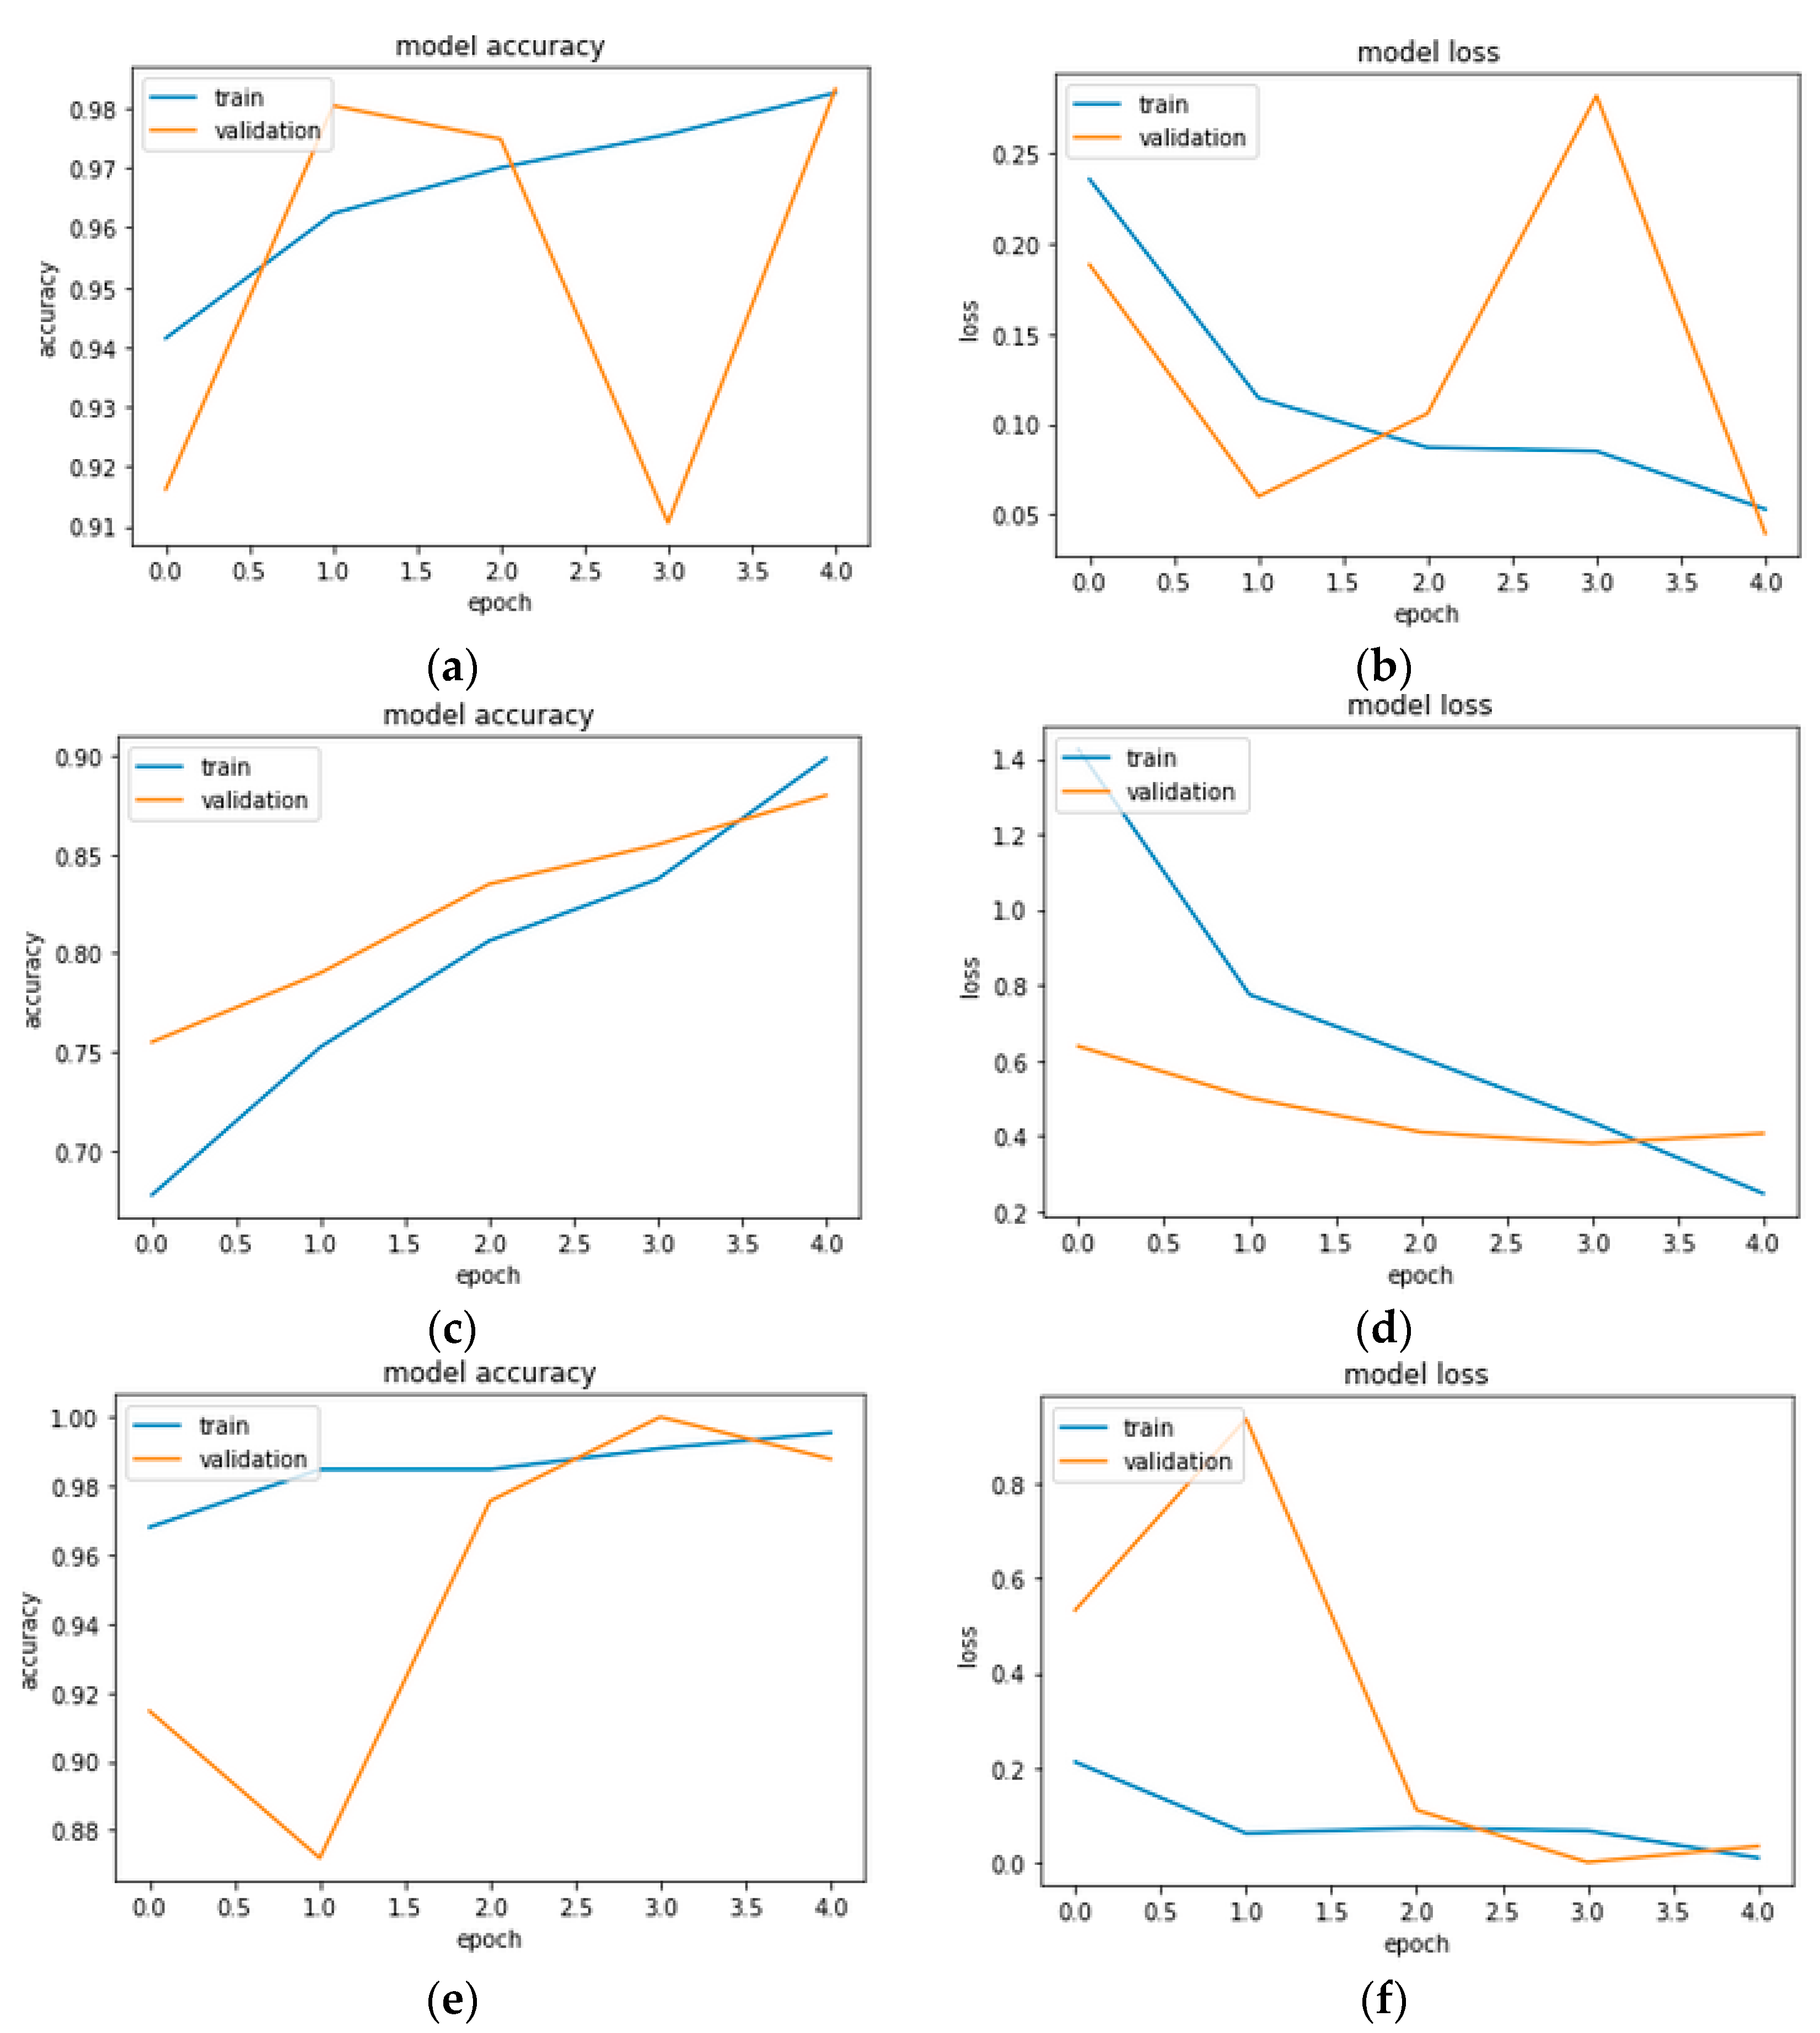
This section reports the best results for each dataset, using the ResNet50 model. Table 6 shows an overview of the results for the ResNet50 model across all datasets. It can be observed from Table 6 that Clarkson 2015 gave the best validation accuracy of 99.72%, while the ND Iris3D_2020 dataset gave the lowest ACER of 0.1%, with the lowest testing time of 121 s. Figure 9 shows training and validation analyses over five epochs of the pre-trained ResNet50 model. From Figure 9, we can infer that, overall, the best results were observed using Adam optimization with the Clarkson 2015 dataset for fine-tuning.
5.4. DenseNet121
DenseNet121′s input is a 224 × 224 RGB image with a predefined size. The best results for each dataset using the DenseNet121 model are reported in this section. Table 7 shows an overview of the results for the DenseNet121 model across all datasets. It can be observed from Table 7 that Clarkson 2015 gave the best validation accuracy of 99.72%, while the ND Iris3D_2020 dataset gave the lowest ACER 0.1%, with the lowest testing time of 121 s. Figure 9 shows the training and validation analysis over five epochs of the pre-trained ResNet50 model. From Figure 10, one can infer that, overall, the best results were observed using Adam optimization, with the Clarkson 2015 dataset for fine-tuning.
5.5. EfficientNetB7
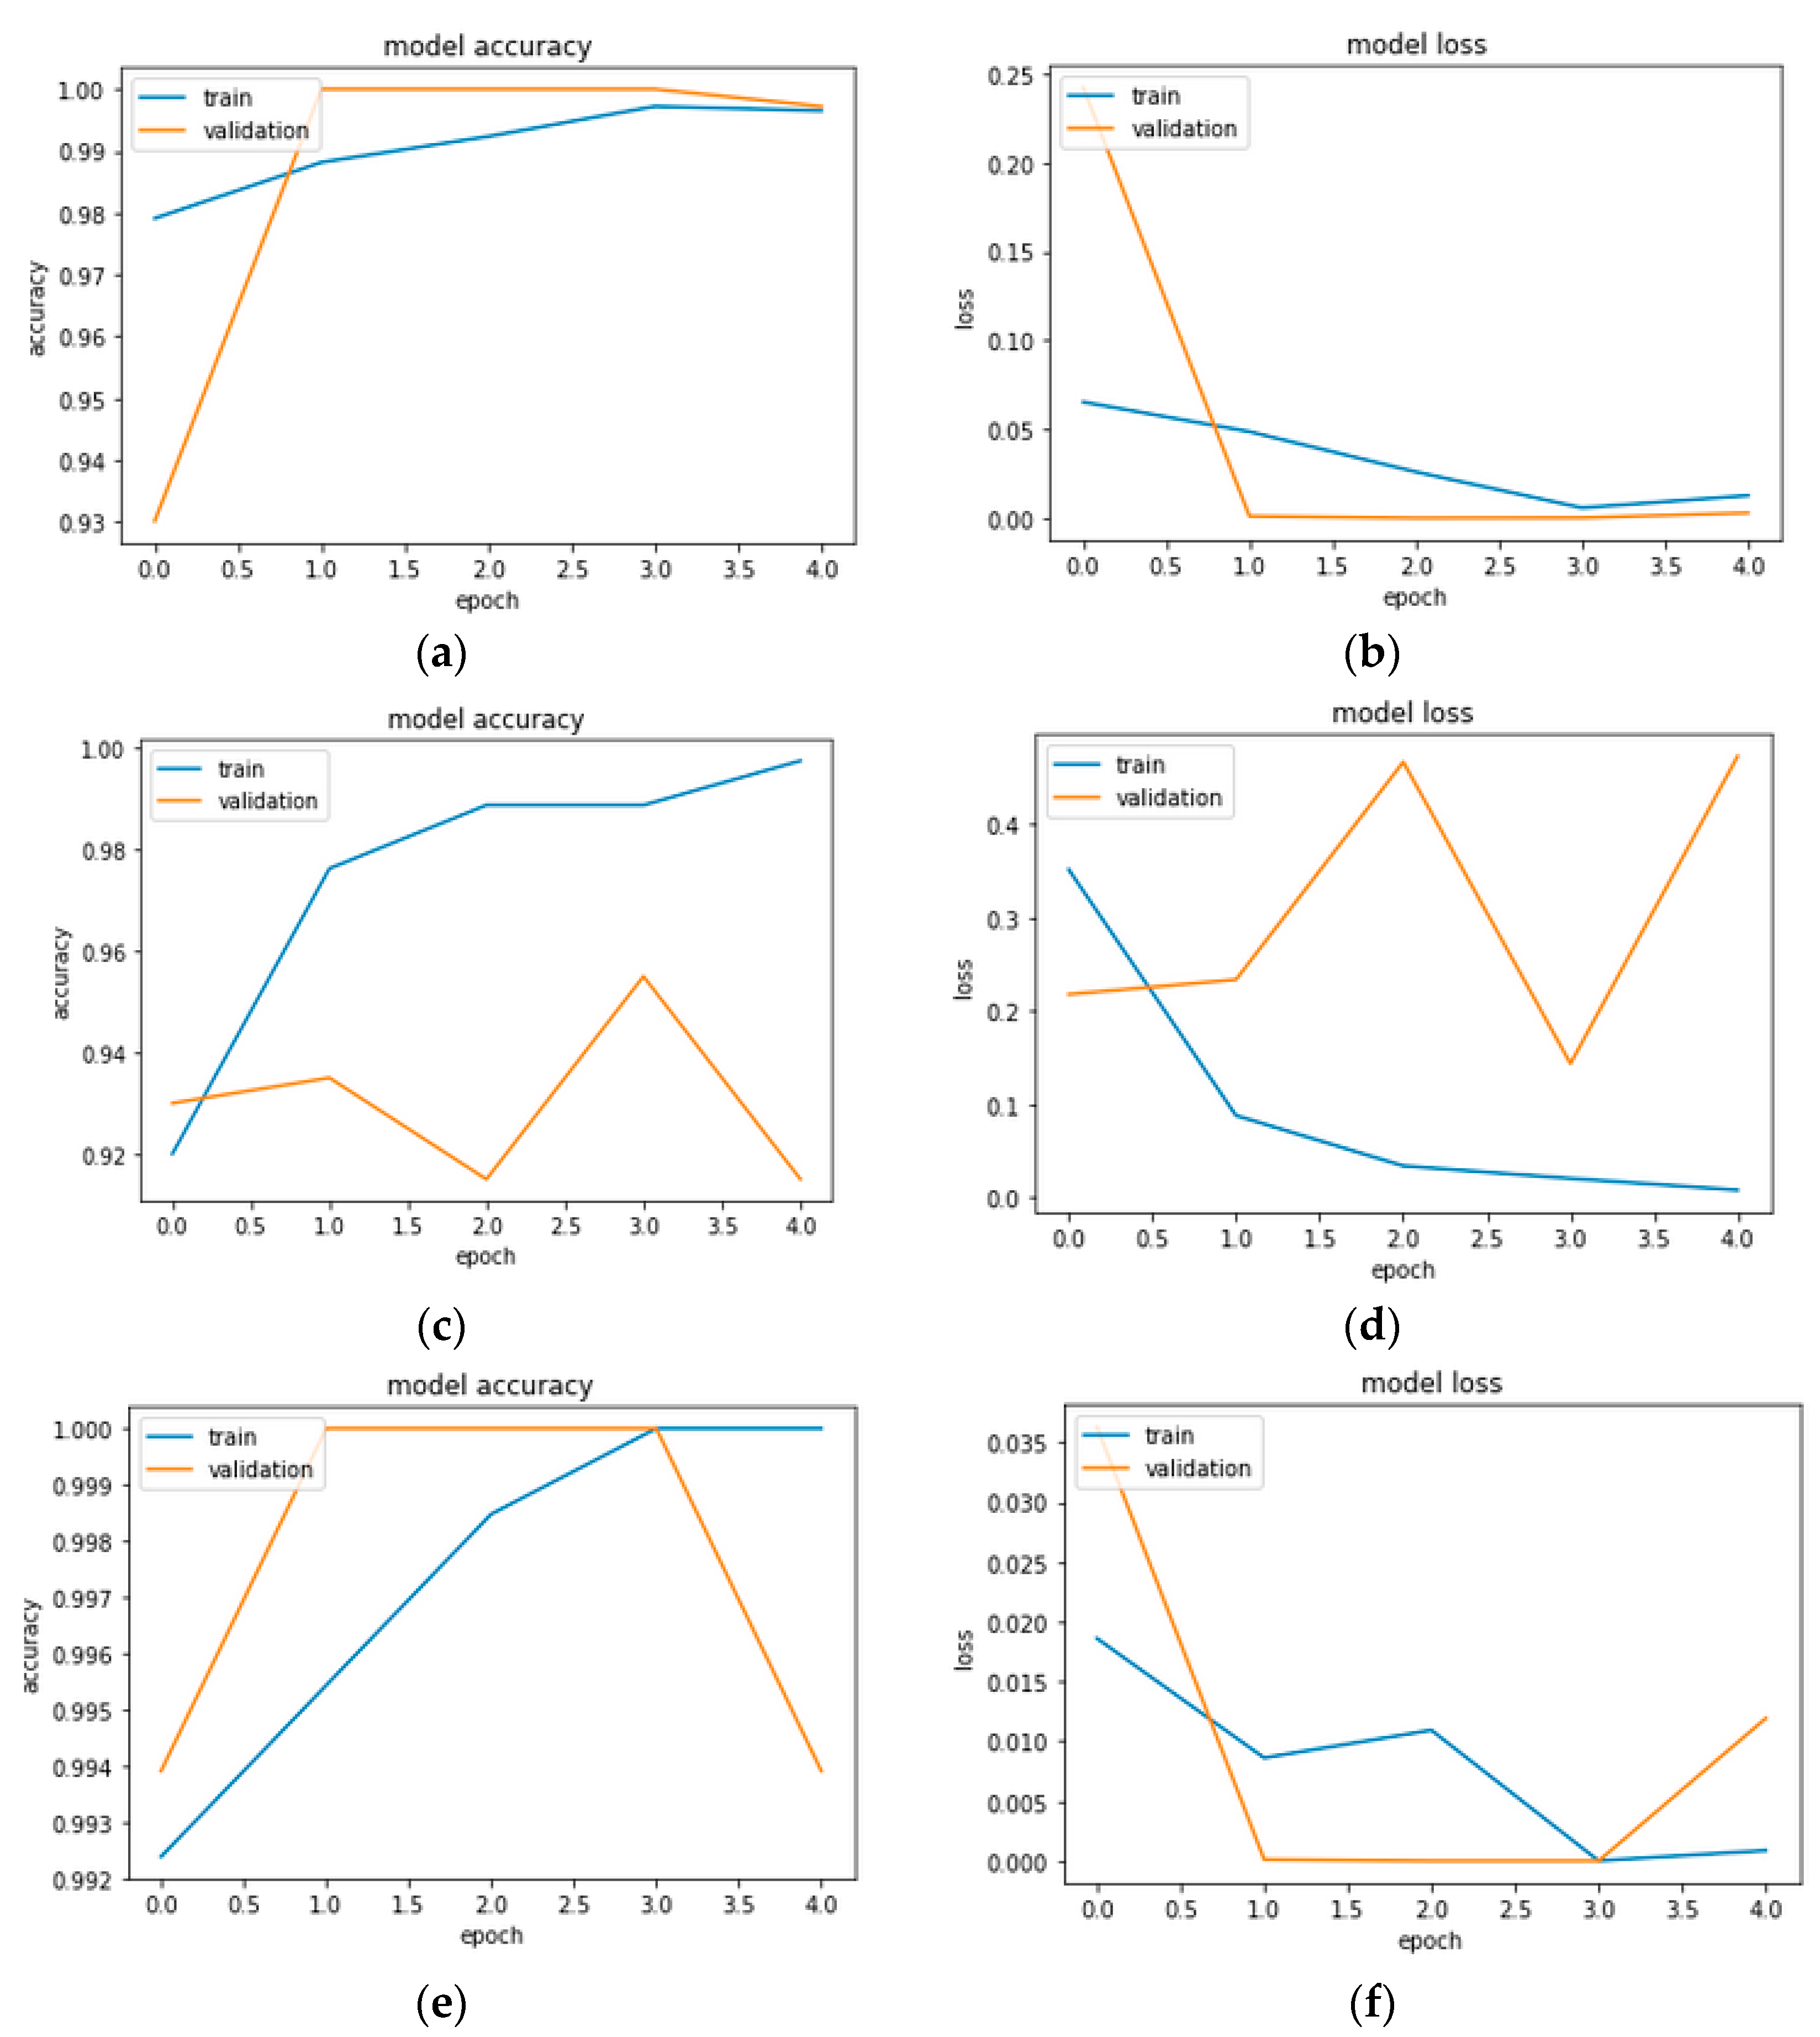
EfficientNetB7, one of the most advanced models, introduced a scaling strategy that uses a compound coefficient to equally scale all parameters of a network’s depth, width, and resolution. The best results for each dataset using the EfficientNetB7 model are reported in this section. Table 8 shows an overview of the results for the EfficientNetB7 model across all datasets. It can be observed from Table 8 that ND Iris3D_2020 gave the best validation accuracy of 99.97% and the lowest ACER 0%, with the lowest testing time of 319 s. Figure 9 shows the training and validation analysis of the pre-trained EfficientNetB7 model of five epochs. From Figure 9, we can infer that, overall, the best results were observed using Adam optimization, with the ND Iris3D_2020 dataset for fine-tuning.
The confusion matrix shows how many images the model both erroneously and accurately detected. For all datasets and models, a confusion matrix was created. The confusion matrix for all five models is given in Table 9. Although multiple models performed well during validation, EfficientNetB7 showed the lowest false positive and false negative results, implying that the EfficientNetB7 model made the fewest errors when predicting whether the image was real or not.
Table 10 shows that EfficientNetB7 is an excellent choice, offering the highest accuracy. EfficientNetB7 also showed promising results in terms of ACER. For faster execution, DenseNet121 can be used with reasonable accuracy. If processing time is not an issue, then EfficientNetB7 should be utilized for the best level of accuracy.
6. Discussions
As per the extensive literature review, VGG-16, Inceptionv3, Resnet50, Densenet121, and EfficientNetB7 are the most frequently used transfer learning models in the literature for detecting iris liveness. These models are validated using one or two iris datasets. To date, no one has carried out a comparative analysis among these models, based on the different state-of-the-art iris biometric databases. To compensate for the training data set, a transfer learning strategy was applied, and ImageNet pre-trained weights were utilized, which helped to speed up the process. Due to the small size of the data set, the models avoided overfitting via transfer learning.
The loss and the accuracy values during the validation and training procedures for each fine-tuned model are listed in Table 4, Table 5, Table 6, Table 7 and Table 8 and are presented in Figure 7, Figure 8, Figure 9, Figure 10 and Figure 11. When comparing accuracy and ACER, it can be observed that the EfficientNetB7 model gives the maximum accuracy and minimum ACER values, followed by the VGG16 model. These can both attain a validation accuracy of 99 percent or more with only a few epochs. This suggests that these models are capable of rapidly learning the differences between live and fake iris images. When the loss and accuracy for the validation set are considered, it is clear that EfficientNetB7 and VGG16 have the highest training accuracy, while ResNet50 has the lowest training loss. VGG16, EfficientNetB7, and ResNet50 have the lowest training loss in the training set [4]. As a result of this data, it can be concluded that the EfficientNetB7 model outperforms the other five models in terms of training and validation.
ACER gives the average classification error rate. Table 10 summarizes the ACER for all five models. Though numerous models did well during validation, EfficientNetB7 had the lowest ACER, meaning that the EfficientNetB7 model produced the fewest faults when identifying whether the image was real or fake. The accuracy, precision, recall, and F1 score of these pre-trained models were compared in this study, as shown in Table 4, Table 5, Table 6, Table 7 and Table 8. EfficientNetB7, with a validation accuracy of 99.97%, was the most accurate, closely followed by VGG16, with a validation accuracy of 99.75%. Table 4, Table 5, Table 6, Table 7 and Table 8 compare each model’s training and testing computational times. The VGG16 model takes the longest time to train (2983 s); DenseNet121, on the other hand, was slowest throughout the learning procedure (300 s) but was the speediest during the testing step (87 s).
The initial experimental results demonstrate that transfer learning models have a great deal of potential for iris liveness detection. Table 10 shows that EfficientNetB7 is an excellent choice, with the highest accuracy. EfficientNetB7 also showed promising results in terms of ACER. For faster execution, DenseNet121 can be used with reasonable accuracy. Statistical analysis was performed using a Wilcoxon signed-rank test to compare the two top models’ performances (Wilcoxon P = 0.059). The analysis has demonstrated that if processing time is not an issue, then EfficientNetB7can be utilized for the best level of accuracy.
We recommend EfficientNetB7 for live and artificial iris image classification, based on the results mentioned earlier (99.97% accuracy, 100% precision, 100% recall, and 100% F1 score), further comparing our fine-tuned EfficientNetB7 against other publications that have recently published classification models for iris images. As demonstrated in Table 11, our analysis achieved the highest binary classification accuracy compared to other works that have worked with iris liveness detection. While comparing related works with various models, in our approach, the studies are selected based on the models used for ILD. Only a few studies have worked on the same datasets as those that are used in our analysis. Arora et al. [23] employed VGGNet, a pre-trained network, and the IIITD dataset; however, the accuracy attained was lower, possibly because of the smaller number of training images. Umer et al. [27] achieved the second-greatest accuracy with their suggested network, VGG16.
7. Conclusions
Deep learning models can help to identify iris liveness with minimal preprocessing of iris images. Several two-class datasets were employed in this investigation, which contained genuine iris and fake iris images from standard benchmark datasets. The transfer learning technique was used to evaluate many state-of-the-art pre-trained neural networks, including VGG-16, Inceptionv3, Resnet50, Densenet121, and EfficientNetB7. EfficientNetB7, with a classification accuracy of 99.97 percent, was found to be the best model, followed by the VGG16 model, which achieved a 99.75 percent classification accuracy. The results of this work show that recognition models created using transfer learning and CNNs can perform well in binary classification tasks using iris images. Both natural and synthetic iris images have similar characteristics that humans can decipher. However, the CNN model can quickly learn the salient features and adequately categorize the images after only a few training epochs. The excellent accuracy found shows that the deep learning models were able to detect something exceptional in the counterfeit iris images, allowing the deep networks to accurately differentiate the images. These trained models can improve the confidentiality and security of biometric systems and the accuracy and efficiency of biometric authentication. Our approach analysis can be extended to other biometric traits like fingerprints and facial recognition and could present a promising framework for robust biometric identification.
Author Contributions
Data curation: S.K.; writing original draft: S.K.; supervision: S.G. and B.P.; project administration: S.G. and B.P.; conceptualization: S.K. and S.G.; methodology: S.K. and S.G.; validation: B.P.; visualization: S.K., S.G. and B.P.; resources: B.P.; review and editing: B.P.; funding acquisition: S.K. and S.G. All authors have read and agreed to the published version of the manuscript.
Funding
This research is funded by the Symbiosis Institute of Technology, Symbiosis International (Deemed University) and Symbiosis Centre for Applied Artificial Intelligence Pune, India.
Institutional Review Board Statement
Not applicable.
Informed Consent Statement
Not applicable.
Data Availability Statement
The data that support the findings of this study are available on request from the respective corresponding author, [Mention in references]. The data are not publicly available due to the privacy concern of research participants.
Acknowledgments
We offer our thanks to the Symbiosis Institute of Technology, Symbiosis International (Deemed University) and Symbiosis Centre for Applied Artificial Intelligence for supporting this research.
Conflicts of Interest
The authors declare no conflict of interest.
References
- Tapia, J.; Gonzalez, S.; Busch, C. Iris Liveness Detection using a Cascade of Dedicated Deep Learning Networks. IEEE Trans. Inf. Forensics Secur. 2021, 17, 42–52. [Google Scholar] [CrossRef]
- Khade, S.; Gite, S.; Thepade, S.D.; Pradhan, B.; Alamri, A. Detection of Iris Presentation Attacks Using Hybridization of Discrete Cosine Transform and Haar Transform with Machine Learning Classifiers and Ensembles. IEEE Access 2021, 9, 169231–169249. [Google Scholar] [CrossRef]
- Galbally, J.; Marcel, S.; Fierrez, J. Biometric Antispoofing Methods: A Survey in Face Recognition. IEEE Access 2014, 2, 1530–1552. [Google Scholar] [CrossRef]
- Khade, S.; Gite, S.; Thepade, S.D.; Pradhan, B.; Alamri, A. Detection of Iris Presentation Attacks Using Feature Fusion of Co-Occurrence Matrix Features. Sensors 2021, 21, 7408. [Google Scholar] [CrossRef] [PubMed]
- Das, P.; Mcfiratht, J.; Fang, Z.; Boyd, A.; Jang, G.; Mohammadi, A.; Purnapatra, S.; Yambay, D.; Marcel, S.; Trokielewicz, M.; et al. Iris Liveness Detection Competition (LivDet-Iris)—The 2020 Edition. In Proceedings of the 2020 IEEE International Joint Conference on Biometrics (IJCB), Houston, TX, USA, 28 September–1 October 2020; pp. 1–9. [Google Scholar] [CrossRef]
- Shazia, A.; Xuan, T.Z.; Chuah, J.H.; Usman, J.; Qian, P.; Lai, K.W. A comparative study of multiple neural network for detection of COVID-19 on chest X-ray. EURASIP J. Adv. Signal Process. 2021, 2021, 50. [Google Scholar] [CrossRef] [PubMed]
- Kimura, G.Y.; Lucio, D.R.; Britto Jr, A.S.; Menotti, D. CNN Hyperparameter Tuning Applied to Iris Liveness Detection. arXiv 2020, arXiv:2003.00833. [Google Scholar]
- Boyd, A.; Czajka, A.; Bowyer, K. Deep Learning-Based Feature Extraction in Iris Recognition: Use Existing Models, Fine-tune or Train From Scratch? In Proceedings of the 2019 IEEE 10th International Conference on Biometrics Theory, Applications and Systems (BTAS), Tampa, FL, USA, 23–26 September 2019; pp. 1–9. [Google Scholar] [CrossRef]
- Yadav, D.; Kohli, N.; Vatsa, M.; Singh, R.; Noore, A. Detecting Textured Contact Lens in Uncontrolled Environment Using DensePAD. In Proceedings of the IEEE/CVF Conference on Computer Vision and Pattern Recognition Workshops, Long Beach, CA, USA, 15–20 June 2019. [Google Scholar] [CrossRef]
- Hsiao, C.-S.; Fan, C.-P. EfficientNet Based Iris Biometric Recognition Methods with Pupil Positioning by U-Net. In Proceedings of the 2021 3rd International Conference on Computer Communication and the Internet (ICCCI), Nagoya, Japan, 25–27 June 2021; pp. 1–5. [Google Scholar] [CrossRef]
- Yadav, D.; Kohli, N.; Agarwal, A.; Vatsa, M.; Singh, R.; Noore, A. Fusion of Handcrafted and Deep Learning Features for Large-Scale Multiple Iris Presentation Attack Detection. In Proceedings of the IEEE Conference on Computer Vision and Pattern Recognition Workshops, Salt Lake City, UT, USA, 18–22 June 2018; pp. 685–6857. [Google Scholar] [CrossRef]
- Khade, S.; Ahirrao, S.; Thepade, S. Bibliometric survey on biometric iris liveness detection. Libr. Philos. Pract. 2020, 1–29. [Google Scholar]
- Khade, S.; Ahirrao, S.; Phansalkar, S.; Kotecha, K.; Gite, S.; Thepade, S.D. Iris Liveness Detection for Biometric Authentication: A Systematic Literature Review and Future Directions. Inventions 2021, 6, 65. [Google Scholar] [CrossRef]
- Czajka, A. Pupil Dynamics for Iris Liveness Detection. IEEE Trans. Inf. Forensics Secur. 2015, 10, 726–735. [Google Scholar] [CrossRef]
- Fathy, W.S.-A.; Ali, H.S. Entropy with Local Binary Patterns for Efficient Iris Liveness Detection. Wirel. Pers. Commun. 2017, 102, 2331–2344. [Google Scholar] [CrossRef]
- Agarwal, R.; Jalal, A.S.; Arya, K.V. Local binary hexagonal extrema pattern (LBHXEP): A new feature descriptor for fake iris detection. Vis. Comput. 2020, 37, 1357–1368. [Google Scholar] [CrossRef]
- Thavalengal, S.; Nedelcu, T.; Bigioi, P.; Corcoran, P. Iris liveness detection for next generation smartphones. IEEE Trans. Consum. Electron. 2016, 62, 95–102. [Google Scholar] [CrossRef]
- Kuehlkamp, A.; Pinto, A.; Rocha, A.; Bowyer, K.W.; Czajka, A. Ensemble of Multi-View Learning Classifiers for Cross-Domain Iris Presentation Attack Detection. IEEE Trans. Inf. Forensics Secur. 2018, 14, 1419–1431. [Google Scholar] [CrossRef] [Green Version]
- Hoffman, S.; Sharma, R.; Ross, A. Iris + Ocular: Generalized Iris Presentation Attack Detection Using Multiple Convolutional Neural Networks. In Proceedings of the 2019 International Conference on Biometrics (ICB), Crete, Greece, 4–7 June 2019; pp. 1–8. [Google Scholar] [CrossRef]
- Kumari, P.; Seeja, K. Periocular Biometrics for non-ideal images: With off-the-shelf Deep CNN & Transfer Learning approach. Procedia Comput. Sci. 2020, 167, 344–352. [Google Scholar] [CrossRef]
- Trokielewicz, M.; Czajka, A.; Maciejewicz, P. Presentation Attack Detection for Cadaver Iris. In Proceedings of the 2018 IEEE 9th International Conference on Biometrics Theory, Applications and Systems (BTAS), Redondo Beach, CA, USA, 22–25 October 2018; pp. 1–10. [Google Scholar] [CrossRef] [Green Version]
- Yambay, D.; Walczak, B.; Schuckers, S.; Czajka, A. LivDet-Iris 2015—Iris Liveness Detection Competition 2015. In Proceedings of the 2017 IEEE International Joint Conference on Biometrics (IJCB), Denver, CO, USA, 1–4 October 2017; pp. 733–741. [Google Scholar] [CrossRef]
- Yadav, D.; Kohli, N.; Doyle, J.S.; Singh, R.; Vatsa, M.; Bowyer, K. Unraveling the Effect of Textured Contact Lenses on Iris Recognition. IEEE Trans. Inf. Forensics Secur. 2014, 9, 851–862. [Google Scholar] [CrossRef]
- Kohli, N.; Yadav, D.; Vatsa, M.; Singh, R. Revisiting iris recognition with color cosmetic contact lenses. In Proceedings of the 2013 International Conference on Biometrics (ICB), Madrid, Spain, 4–7 June 2013; pp. 1–7. [Google Scholar] [CrossRef]
- Marra, F.; Poggi, G.; Sansone, C.; Verdoliva, L. A deep learning approach for iris sensor model identification. Pattern Recognit. Lett. 2018, 113, 46–53. [Google Scholar] [CrossRef]
- Fang, Z.; Czajka, A.; Bowyer, K.W. Robust Iris Presentation Attack Detection Fusing 2D and 3D Information. IEEE Trans. Inf. Forensics Secur. 2020, 16, 510–520. [Google Scholar] [CrossRef]
- Umer, S.; Sardar, A.; Dhara, B.C.; Rout, R.K.; Pandey, H.M. Person identification using fusion of iris and periocular deep features. Neural Netw. 2019, 122, 407–419. [Google Scholar] [CrossRef] [PubMed]
- Arora, S.; Bhatia, M.P.S.; Kukreja, H. A Multimodal Biometric System for Secure User Identification Based on Deep Learning. Adv. Intell. Syst. Comput. 2021, 1183, 95–103. [Google Scholar] [CrossRef]
- Hsiao, C.S.; Fan, C.P.; Hwang, Y.T. Iris location and recognition by deep-learning networks based design for biometric authorization. In Proceedings of the 2021 IEEE 3rd Global Conference on Life Sciences and Technologies (LifeTech), Nara, Japan, 9–11 March 2021; pp. 144–145. [Google Scholar] [CrossRef]
- Hsiao, C.S.; Fan, C.P.; Hwang, Y.T. Design and Analysis of Deep-Learning Based Iris Recognition Technologies by Combination of U-Net and EfficientNet. In Proceedings of the 2021 9th International Conference on Information and Education Technology (ICIET), Okayama, Japan, 27–29 March 2021; pp. 433–437. [Google Scholar] [CrossRef]
- Chatterjee, P.; Yalchin, A.; Shelton, J.; Roy, K.; Yuan, X.; Edoh, K.D. Presentation Attack Detection Using Wavelet Transform and Deep Residual Neural Net. In International Conference on Security, Privacy and Anonymity in Computation, Communication and Storage; Springer: Cham, Switzerland, 2019. [Google Scholar] [CrossRef]
Figure 1.
Graphical representation of the results of a study on the efficiency of transfer learning models for detecting iris liveness.
Figure 1.
Graphical representation of the results of a study on the efficiency of transfer learning models for detecting iris liveness.

Figure 2.
The VGG-16 architecture, designed for iris liveness detection.

Figure 3.
The InceptionV3 architecture, designed for iris liveness detection.

Figure 4.
The ResNet 50 architecture, designed for iris liveness detection.

Figure 5.
The DenseNet121 architecture, designed for iris liveness detection.

Figure 6.
The EfficientNetB7 architecture, designed for iris liveness detection.

Figure 7.
Validation and training analyses over five epochs of the pre-trained VGG-16 model, using various datasets: (a) validation and training model accuracy analysis, using the Clarkson 2015 dataset; (b) validation and training model loss analysis, using the Clarkson 2015 dataset; (c) validation and training model accuracy analysis, using the IIITD dataset; (d) validation and training model loss analysis, using the IIITD dataset; (e) validation and training model accuracy analysis, using the ND_Iris3D_2020 dataset; and (f) validation and training model loss analysis, using the ND_Iris3D_2020 dataset.

Figure 8.
Validation and training analyses over five epochs of the pre-trained Inception model, using various datasets: (a) validation and training model accuracy analysis, using the Clarkson 2015 dataset; (b) validation and training model loss analysis, using the Clarkson 2015 dataset; (c) validation and training model accuracy analysis, using the IIITD dataset; (d) validation and training model loss analysis, using the IIITD dataset; (e) validation and training model accuracy analysis, using the ND_Iris3D_2020 dataset; and (f) validation and training model loss analysis, using the ND_Iris3D_2020 dataset.

Figure 9.
Validation and training analysis over five epochs of the pre-trained ResNet50 model using various datasets: (a) validation and training model accuracy analysis, using the Clarkson 2015 dataset; (b) validation and training model loss analysis, using the Clarkson 2015 dataset; (c) validation and training model accuracy analysis, using the IIITD dataset; (d) validation and training model loss analysis, using the IIITD dataset; (e) validation and training model accuracy analysis, using the ND_Iris3D_2020 dataset; and (f) validation and training model loss analysis, using the ND_Iris3D_2020 dataset.

Figure 10.
Validation and training analysis over five epochs of the pre-trained DenseNet121 model using various datasets: (a) validation and training model accuracy analysis, using the Clarkson 2015 dataset; (b) validation and training model loss analysis, using the Clarkson 2015 dataset; (c) validation and training model accuracy analysis, using the IIITD dataset; (d) validation and training model loss analysis, using the IIITD dataset; (e) validation and training model accuracy analysis, using the ND_Iris3D_2020 dataset; and (f) validation and training model loss analysis, using the ND_Iris3D_2020 dataset.

Figure 11.
Validation and training analysis over five epochs of the pre-trained EfficientNetB7 model using various datasets: (a) validation and training model accuracy analysis, using the Clarkson 2015 dataset; (b) validation and training model loss analysis, using the Clarkson 2015 dataset; (c) validation and training model accuracy analysis, using the IIITD dataset; (d) validation and training model loss analysis, using the IIITD dataset; (e) validation and training model accuracy analysis, using the ND_Iris3D_2020 dataset; and (f) validation and training model loss analysis, using the ND_Iris3D_2020 dataset.


Table 1.
The Clarkson dataset description.
| Datasets Features | Parameters |
|---|---|
| Total Instances | 3588 |
| Total Training Data | 1436 |
| Total Validation Data | 358 |
| Total Testing Data | 1794 |
| Number of classes | 2 |
| Live Iris Images |  |
| Fake Iris Images |  |
Table 2.
IIITD contact lens iris dataset description.
| Datasets Features | Parameters |
|---|---|
| Total Instance | 2000 |
| Total Training Data | 800 |
| Total Validation Data | 200 |
| Total Testing Data | 1000 |
| Number of classes | 2 |
| Live iris images |  |
| Fake iris images |  |
Table 3.
ND_Iris3D_2020 dataset description.
| Datasets Features | Parameters |
|---|---|
| Total Instance | 1640 |
| Total Training Data | 656 |
| Total Validation Data | 164 |
| Total Testing Data | 820 |
| Number of classes | 2 |
| Live Iris Images |  |
| Fake Iris Images |  |
Table 4.
Performance evaluation of the VGG16 model for iris liveness detection.
| Dataset | Clarkson 2015 | IIITD_Contact | ND Iris3D_2020 |
|---|---|---|---|
| Validation accuracy (%) | 99.72 | 99.75 | 98.78 |
| Training accuracy (%) | 99.23 | 98.75 | 1 |
| Validation loss (%) | 0.62 | 3.05 | 11.74 |
| Training loss (%) | 3.11 | 6.23 | 0.000003 |
| Precision (%) | 100 | 85.00 | 100 |
| Recall (%) | 100 | 85.00 | 100 |
| F1-score (%) | 100 | 85.00 | 100 |
| APCER (%) | 0.14 | 0.136 | 0 |
| BPCER (%) | 0.49 | 0.158 | 0.2 |
| ACER (%) | 0.32 | 0.147 | 0.1 |
| Training time (s) | 2983 | 2938 | 1297 |
| Testing time (s) | 888 | 502 | 417 |
Table 5.
Performance evaluation of the InceptionV3 model for iris liveness detection.
| Dataset | Clarkson 2015 | IIITD_Contact | ND Iris3D_2020 |
|---|---|---|---|
| Validation accuracy (%) | 99.44 | 71.5 | 94.5 |
| Training accuracy (%) | 99.79 | 59.13 | 98.37 |
| Validation loss (%) | 2.47 | 63.57 | 1.3255 |
| Training loss (%) | 0.69 | 10.15 | 3.902 |
| Precision (%) | 99.0 | 71.00 | 99.0 |
| Recall (%) | 99.0 | 70.00 | 99.0 |
| F1-score (%) | 99.0 | 70.00 | 99.0 |
| APCER (%) | 0 | 30.6 | 3.4375 |
| BPCER (%) | 2.9925 | 28.4 | 0 |
| ACER (%) | 1.4962 | 29.5 | 1.7187 |
| Training time (s) | 877 | 656 | 724 |
| Testing time (s) | 365 | 194 | 216 |
Table 6.
Performance evaluation of the ResNet50 model for iris liveness detection.
| Dataset | Clarkson 2015 | IIITD_Contact | ND Iris3D_2020 |
|---|---|---|---|
| Validation accuracy (%) | 99.72 | 91.5 | 99.39 |
| Training accuracy (%) | 99.79 | 99.75 | 100 |
| Validation loss (%) | 0.3 | 47.33 | 1.19 |
| Training loss (%) | 1.28 | 0.78 | 0.0086 |
| Precision (%) | 100 | 98.00 | 100 |
| Recall (%) | 100 | 98.00 | 100 |
| F1-score (%) | 100 | 98.00 | 100 |
| APCER (%) | 0 | 0 | 0 |
| BPCER (%) | 0.748 | 3.6 | 0.2 |
| ACER (%) | 0.374 | 1.8 | 0.1 |
| Training time (s) | 945 | 537 | 398 |
| Testing time (s) | 296 | 165 | 121 |
Table 7.
Performance evaluation of the DenseNet121 model for iris liveness detection.
| Dataset | Clarkson 2015 | IIITD_Contact | ND Iris3D_2020 |
|---|---|---|---|
| Validation Accuracy (%) | 98.32 | 88 | 98.78 |
| Training Accuracy (%) | 98.26 | 89.88 | 99.54 |
| Validation Loss (%) | 03.96 | 40.64 | 03.59 |
| Training Loss (%) | 05.29 | 24.68 | 01.09 |
| Precision (%) | 99.00 | 93.00 | 100 |
| Recall (%) | 99.00 | 93.00 | 100 |
| F1-score (%) | 99.00 | 93.00 | 100 |
| APCER (%) | 0.3589 | 9.2 | 0.9375 |
| BPCER (%) | 2.7431 | 4.6 | 0 |
| ACER (%) | 1.551 | 6.9 | 0.4687 |
| Training Time (s) | 907 | 587 | 300 |
| Testing Time (s) | 256 | 162 | 87 |
Table 8.
Performance evaluation of the EfficientNetB7 model for iris liveness detection.
| Dataset | Clarkson 2015 | IIITD_Contact | ND Iris3D_2020 |
|---|---|---|---|
| Validation accuracy (%) | 99.44 | 94.5 | 99.97 |
| Training accuracy (%) | 99.16 | 1 | 100 |
| Validation loss (%) | 04.28 | 21.41 | 00.47 |
| Training loss (%) | 0.42 | 00.25 | 00.11 |
| Precision (%) | 98.00 | 99.00 | 100 |
| Recall (%) | 98.00 | 99.00 | 100 |
| F1-score (%) | 98.00 | 99.00 | 100 |
| APCER (%) | 1.5793 | 0.2 | 0 |
| BPCER (%) | 5.2369 | 2 | 0 |
| ACER (%) | 3.4081 | 1.1 | 0 |
| Training time (s) | 2003 | 1092 | 1098 |
| Testing time (s) | 644 | 334 | 319 |
Table 9.
Confusion matrix of all pre-trained models across all datasets.
| Datasets | Clarkson 2015 | IIITD_Contact | ND Iris3D_2020 | |||||||||
|---|---|---|---|---|---|---|---|---|---|---|---|---|
| CNN Model | TP | TN | FP | FN | TP | TN | FP | FN | TP | TN | FP | FN |
| VGG-16 | 399 | 1391 | 2 | 2 | 421 | 432 | 68 | 79 | 499 | 500 | 0 | 1 |
| InceptionV3 | 389 | 1393 | 0 | 12 | 358 | 347 | 153 | 142 | 500 | 309 | 11 | 0 |
| ResNet50 | 389 | 1393 | 0 | 3 | 482 | 500 | 0 | 18 | 499 | 320 | 0 | 1 |
| DenseNet121 | 390 | 1388 | 5 | 11 | 477 | 454 | 46 | 23 | 500 | 317 | 3 | 0 |
| EfficientNetB7 | 380 | 1371 | 22 | 21 | 490 | 499 | 1 | 10 | 500 | 500 | 0 | 0 |
Table 10.
Performance evaluation of all pre-trained models for iris liveness detection across all datasets using validation accuracy (%), ACER (%), and testing time values.
Table 10.
Performance evaluation of all pre-trained models for iris liveness detection across all datasets using validation accuracy (%), ACER (%), and testing time values.
| Clarkson 2015 | IIITD_Contact | ND Iris3D_2020 | |||||||
|---|---|---|---|---|---|---|---|---|---|
| CNN Model | Accuracy | ACER | Time/s | Accuracy | ACER | Time/s | Accuracy | ACER | Time/s |
| VGG-16 | 99.72 | 0.32 | 888 | 99.75 | 0.14 | 502 | 98.78 | 0.1 | 417 |
| InceptionV3 | 99.44 | 1.49 | 365 | 71.50 | 29.5 | 194 | 94.50 | 1.72 | 216 |
| ResNet50 | 99.44 | 1.49 | 296 | 91.50 | 1.8 | 165 | 99.39 | 0.1 | 121 |
| DenseNet121 | 98.32 | 1.55 | 256 | 88.00 | 6.9 | 162 | 98.78 | 0.46 | 87 |
| EfficientNetB7 | 99.44 | 3.40 | 644 | 94.50 | 1.1 | 334 | 99.97 | 0 | 319 |
Note. The values in bold and underlined indicate the highest recorded accuracy and lowest recorded ACER and time needed.
Table 11.
Comparison with other related work that has performed iris liveness detection.
| Paper ID | Year | Models | Datasets | Performance measures | Results (%) | |
|---|---|---|---|---|---|---|
| Comparison with the same datasets | [5] | 2021 | ND PAD, MSU PAD1, MSU PAD2 | WUT, ND, CU | APCER, BPCER, ACER | ACER = 2.61 ACER = 2.18 ACER = 28.96 |
| [28] | 2021 | VGGNet LeNet ConvNet | IIITD | Accuracy FAR | Accuracy = 97.98 Accuracy = 89.38 Accuracy = 98.99 | |
| Comparison with different datasets | [29] | 2021 | VGG16, YOLO | Self-made database | Accuracy FAR, FRR | Accuracy = 98 |
| [30] | 2021 | EfficientNet | CASIA v1 | Accuracy FAR, FRR | Accuracy = 98 | |
| [27] | 2020 | VGG16, ResNet50, Inception-v3 | UPOL, CASIA | CCR | CCR = 99.64 | |
| [31] | 2019 | ResNet | ATVS | Accuracy | Accuracy = 92.57 | |
| Suggested Analysis | VGG-16, Inceptionv3, Resnet50, Densenet121, and EfficientNetB7 | Clarkson 2015, IIITD Contact Lens, ND_Iris3D_2020 | Accuracy, Loss, APECR, NPCER, ACER | Accuracy = 99.97 ACER = 0 |
Publisher’s Note: MDPI stays neutral with regard to jurisdictional claims in published maps and institutional affiliations. |
© 2022 by the authors. Licensee MDPI, Basel, Switzerland. This article is an open access article distributed under the terms and conditions of the Creative Commons Attribution (CC BY) license (https://creativecommons.org/licenses/by/4.0/).
Share and Cite
MDPI and ACS Style
Khade, S.; Gite, S.; Pradhan, B. Iris Liveness Detection Using Multiple Deep Convolution Networks. Big Data Cogn. Comput. 2022, 6, 67. https://0-doi-org.brum.beds.ac.uk/10.3390/bdcc6020067
AMA Style
Khade S, Gite S, Pradhan B. Iris Liveness Detection Using Multiple Deep Convolution Networks. Big Data and Cognitive Computing. 2022; 6(2):67. https://0-doi-org.brum.beds.ac.uk/10.3390/bdcc6020067
Chicago/Turabian StyleKhade, Smita, Shilpa Gite, and Biswajeet Pradhan. 2022. "Iris Liveness Detection Using Multiple Deep Convolution Networks" Big Data and Cognitive Computing 6, no. 2: 67. https://0-doi-org.brum.beds.ac.uk/10.3390/bdcc6020067