Article

Water and Nitrogen (N) Use Efficiency of Upland Rice (Oryza sativa L. × Oryza glaberrima Steud) under Varying N Application Rates

by
Isaac Newton Alou
1,2,
Michael van der Laan
1,
John George Annandale
1 and
Joachim Martin Steyn
1,*
1
Department of Plant and Soil Sciences, University of Pretoria, Private Bag X20 Hatfield, Pretoria 0028, South Africa
2
National Agricultural Research Organization (NARO), Bulindi ZARDI, P.O. Box 101, Hoima 256-465, Uganda
*
Author to whom correspondence should be addressed.
Submission received: 25 October 2020 / Revised: 13 November 2020 / Accepted: 17 November 2020 / Published: 20 November 2020

Abstract

:
Upland rice (Oryza sativa L.) production systems in sub-Saharan Africa are faced with challenges of water stress and nitrogen (N) deficiency, which reduce grain yield, water use efficiency (WUE), and nitrogen use efficiency (NUE). The objective of the study was to determine the response of upland rice to N fertilizer rates under well-watered conditions and to clarify the relationships between WUE and NUE. Upland rice variety Nerica 10 was grown under well-watered conditions and varying N rates in 2014/2015 (Y1) and 2015/2016 (Y2) on the same field at the University of Pretoria’s Hatfield Experimental Farm, South Africa. Yields at harvest increased with increasing N rates, linearly in Y1, and following a quadratic trend in Y2. Mean grain yield was highest (4.5 t ha−1) at 120 kg N ha−1 and lowest (2.4 t ha−1) at 0 kg N ha−1. Agronomic NUE was lowest for 160 kg N ha−1 (11.7 kg kg−1 N), while WUE was highest for the 120 kg N ha−1 (7.58 ± 1.7 kg mm−1) and lowest for 0 kg N ha−1 (4.1 ± 0.9 kg mm−1). Findings revealed that at high N levels, compensative N uptake during tillering can reduce harvest index, WUE, and to a lesser extent, grain N concentration.

1. Introduction

Rice (Oryza sativa L.) is an important food crop and source of income worldwide. In Africa, the rate of consumption of rice is increasing faster than most other staple food crops. For instance, between 2000 and 2010, the increase was estimated at 5.5% per year [1]. This increased demand for rice has been accompanied by a rapid expansion in cultivated rice area of between 0.4–7.7% per year across sub-Saharan Africa (SSA) [1]. Upland rice can be rotated with other crops, water and labor inputs (because it is not transplanted) are low compared to lowland rice, and above all, it often fetches higher returns on investment than most other crops [2]. However, many rice-growing countries in Africa remain heavily reliant on imports to meet domestic rice demand [1] and will thus need to increase the area under cultivation and more importantly, the production per unit area, to become more self-sufficient. Upland rice yield potential is not realized worldwide because production is often limited to less fertile and drought-prone lands [3].
Nitrogen (N) management, in addition to water management, differs considerably across rice cropping systems [3]. In Africa, low N application rates are predominant in upland rice production and rice mono-cropping is common. Nitrogen deficiencies are also common in upland rice because of uneven rainfall distribution during the growing season [3,4]. The low nitrogen use efficiency (NUE) levels (15–20 kg grain kg−1 N applied) reported for rainfed upland rice [5,6] means that approximately 50–67 kg N is required for each 1 Mg of grain yield, which is costly for the average SSA rice farmer.
Studies on N fertilization, including under favorable growing conditions, are lacking for upland rice [6]. In South Africa, some desktop feasibility studies reported upland rice production as viable under rainfed conditions, while others concluded that it was not viable [7]. Previously, rice had also been grown successfully on a small scale in the KwaZulu-Natal Province [8]. In Asia, Belder et al. [5] reported that fertilization at 150 kg N ha−1 improved water use efficiency (WUE) of irrigated rice from 4.0 to 7.5 kg mm−1 (based on volume of water applied). Past N fertilization studies neglected water use when fertilizer rates were varied. Moreover, Belder et al. [5] speculated that rice growth and yield were limited by water deficits at high N level, probably because N leads to increased transpiration [9]. Kondo et al. [4] observed that water uptake of potted rice under aerobic conditions increased with N fertilization, suggesting a modification in crop water demand by N. Thus, previously reported N recommendations may be too low to achieve high WUE levels.
Irrigating according to soil water depletion is a recommended practice to improve rainfall use efficiency and maximize yield [10]. As rice has a shallow root system (<0.4 m depth) [11], N management can be challenging, and as a result, it is important to optimize N applications to avoid nitrate (NO3) leaching and reduce production costs. Understanding the factors that enable high NUE and the relationship between crop water use/N uptake and growth is needed to close yield gaps in such cropping systems [9]. It was therefore hypothesized that: (I) N fertilization increases seasonal water use of upland rice, and water management should thus be tailored to N availability; (II) the depth of water extraction is not affected by varying N rates when water is not limiting; and (III) the highest WUE and NUE can be achieved at the highest N rate. The overall aim of this study was to improve our understanding of upland rice response to N fertilizer rates under well-watered conditions to address knowledge gaps regarding optimal N application rates and seasonal water requirements.

2. Materials and Methods

2.1. Variety Selection

Upland rice cv. Nerica 10 seed was sourced from the National Crop Resources Research Institute (NaCRRI) in Uganda. New Rice for Africa (Nerica) lines are progeny derived from interspecific crossings between Asian lowland rice, WAB 56-104 (O. sativa L. Japonica), and African indigenous upland rice, CG 14 (O. glaberrima Steud), and were released as Nerica varieties 1 to 18 [12]. Nerica 10 is a short-duration variety and takes about 110 days to maturity in the tropics.

2.2. Description of Study Site

The field experiment was conducted on the University of Pretoria’s Hatfield Experimental Farm, South Africa (25°45′ S, 28°16′ E, 1370 m a.s.l.). The sandy clay loam soil is classified as a Hutton (loamy, kaolinitic, mesic, Typic Eutrustox) [13]. The profile is deep (>1.15 m) and well-drained and the soil had no physical restrictions to root growth, based on observations during soil sampling. Soil properties of the 0.6 m soil layer at the start of the experiment are shown in Table 1. Soil tests before the study commenced indicated that there was 23.3 mg kg−1 phosphorus (P) (Bray 1), 258 mg kg−1 calcium (Ca), 83 mg kg−1 potassium (K), 92 mg kg−1 magnesium (Mg), and 2 mg kg−1 sodium (Na) in the top soil (0–0.2 m) layer. Hatfield receives about 670 mm of rainfall per annum, falling mainly between October and March (summer) [14].

2.3. Agronomic Practices, N Treatments, and Experimental Design

Winter wheat (Triticum aestivum L.) was grown under sprinkler irrigation without fertilization before each rice crop to remove excess inorganic N from the soil profile. The wheat was sown on 21 May 2014 and 5 June 2015 and on average, 10 to 15 mm of water was applied weekly to ensure good establishment and growth. The preceding wheat crop was harvested on 9 October in both 2014 and 2015, when all aboveground plant material was removed from the trial site before primary tillage.
For the rice, a randomized complete block design was used with three replicates and five N application rates (0, 40, 80, 120, and 160 kg N ha−1) as treatments. Plot dimensions were 5 m × 4 m and paths of 1 m wide were used to separate plots. Muriate of potash (11% K) and single super phosphate (12% P) were applied at equivalent rates of 55 kg K ha−1 and 42 kg P ha−1 at sowing of the rice. Fertilizers were then incorporated into the soil with a rotovator to achieve a fine tilth. Nerica 10 seed was sown in shallow furrows (±0.03 m deep) on 29 November 2014 and 20 October 2015. The spacing between rows was 0.25 m.
Sprinkler irrigation was used to supplement rainfall on three occasions (10–15 mm per event) between 0 to 14 days after sowing (DAS). A high-density drip irrigation system was installed 14 DAS. Soil water content in the 0–0.4 m layer was restored to field capacity (FC) at three to five day intervals to avoid water stress (WS). A uniform plant stand was achieved at 21–25 days after emergence (DAE) after thinning to approximately 25 plants m−1 row length (1,000,000 plants ha−1). Limestone ammonium nitrate (28% N) was applied 27 DAE and 50–55 DAE in two equal splits of 50% each, at the respective N treatment rates. The N fertilizer was applied along plant rows and incorporated into the soil to a depth of approximately 0.01 m using a hand hoe. Irrigation (±20 mm) was applied if the topsoil was dry after top dressings. Weeds were regularly removed by hoe and handpicking. The crop was kept free of pests and diseases as needed. Malathion® (active ingredient O,O-dimethyl phosphorodithioate) was sprayed once for aphids during vegetative growth in the 2014/2015 season, according to the manufacturer’s instructions. A net was placed over the crop at the grain-filling stage to minimize damage by birds.

2.4. Measurements

2.4.1. Soil Water Content

Aluminum access tubes for a neutron probe water meter (CPN Hydroprobe model 503DR, Campbell Pacific Nuclear, CA, USA) were installed within plant rows at the center of each plot about 7 DAE. The neutron probe that was calibrated for the trial site was used to take readings from about 7–14 DAE onward in both seasons. Soil water content at 0.2 m depth intervals was monitored to a 1.0 m profile depth. Each N treatment was irrigated independently after determining the volumetric soil water content (θ) and calculating the deficit to FC for individual replicate plots. The profile deficit was determined as the difference between measured θ and FC for the top 0.4 m layer.
Water flow meters (CL. C, qp 1.5 SA 1453, Elster Kent Metering Pty Ltd., South Africa) were used to measure the amount of irrigation water applied to each treatment. In addition to the data of a nearby automated weather station, three manual rain gauges were installed within the field for measurement of rainfall. The soil water balance equation, I + P = E T + Δ S + D + R [14] was used to estimate evapotranspiration (ET). Irrigation (I) and precipitation (P) were measured, and drainage (D) and runoff (R) were assumed to be zero. Drainage was assumed negligible over the growing seasons because irrigation typically did not coincide with rainfall events. The change in storage (∆S) was calculated as:
Δ S =   θ n θ n 1
where θ is the volumetric water content of a layer on a specific day (n) and on the preceding measurement day (n−1).

2.4.2. Soil Inorganic N

Soil samples for N analysis were taken from the 0–0.2, 0.2–0.4, and 0.4–0.6 m layers just before sowing, during flowering (76/90 DAE for Y1/Y2) and at crop maturity (110/125 DAE for Y1/Y2), respectively. Although rice roots are rarely found beyond 0.4 m depth [11], this study sought to clarify the possibility of N uptake from deeper soil layers. Before sowing the rice, nine points in the field were randomly selected for sampling. Samples during crop growth were taken from the middle of each plot. In Y1, two sub-samples per plot were taken, mixed to a homogenous sample and a composite sample for each N treatment was submitted to the laboratory, while in Y2, samples were composited per plot and three samples per N treatment were taken and analyzed. Inorganic N in the soil [nitrate (NO3) and ammonium (NH4+)] were determined using steam distillation (Büchi 321 Kjeldahl unit, LABEQUIP, Ontario, Canada). Ammonium-N was determined by titrating with 0.005 M sulfuric acid (H2SO4). The color change at end-point was from green to a permanent feint pink. The detailed procedures of the method are available in AgriLASA [15].

2.4.3. Plant Growth and Yield Components

Plant height, number of tillers per plant and per unit area, leaf area index (LAI), and aboveground dry matter were measured at seven to 10 day intervals from about 20 DAE to maturity. The number of tillers was counted, and plant height was measured weekly from 10 plants in the middle of each plot. The number of flower-bearing tillers, main stems inclusive, were counted for estimation of 50% flowering and flower duration. Plants in a 0.25 m × 0.50 m area were carefully cut off at ground level. Leaf blades were detached from plants and passed through an LI-3100 leaf area meter (LiCor, Lincoln, NE, USA) to determine surface area. Leaf area index was calculated as the total leaf area divided by the corresponding ground surface area. Stems and in later stages panicles and grains, were separated, and biomass was weighed fresh for percentage moisture determination. Dry matter (DM) content of each plant organ was determined after oven drying at 65–70 °C to constant mass.
At final harvest, aboveground DM and grain yields were determined from a 1.25 m × 1.00 m area. Sub-samples of the stover and the grains from each plot were oven dried for determination of moisture content. Grain yield was adjusted to 120 g kg−1 water content for comparison with commercial yields. Panicles m−2, length of panicles, spikelets per panicle, 1000-grain mass, and sterility percentage were assessed from plants harvested from a 0.25 m × 0.50 m area. Full grains were counted using a seed counter (Numigral®, Triplette and Renaud, Paris, France).

2.4.4. Leaf, Grain, and Stem N Concentration

All leaf blades from a 0.50 m × 0.25 m area were taken at booting, flowering, and anthesis for the determination of leaf DM yield and analysis of N concentration. Destructive sampling of all main stems plus tillers from a specific area (0.125 m2) was preferred to selection of random plants across the plot to better capture the crop leaf N variability that is common under field conditions. Except at the booting stage, leaves were profiled into the flag and lower leaves, as a gradient in leaf N along the canopy profile is known to exist in most crops [16], and using a composite of older and younger leaf samples may obscure N treatment effects on leaf N content. Leaf blades were weighed fresh, part of the sample was taken for moisture content determination, and the remainder was kept for chemical analysis. Leaves were oven-dried at 65 °C to constant mass, ground, and passed through a 1-mm sieve.
Nitrogen and protein analysis was done using the Dumas Method (Dumatherm® N Pro-Rapid Nitrogen/Protein Analyzer, C. Gerhardt GmbH & Co., Königswinter, Germany). A combustion temperature of 950 °C and reduction temperature of 650 °C in the reactor was used with helium (He) as a carrier gas. Crude protein (CP) values were converted to N using a CP factor of 6.25. For the two stages when samples of the flag and lower leaves were analyzed separately, leaf N concentration per plot was calculated as the mean concentration of the two leaf positions. Nitrogen concentration of 2.5% N in rice stems was used for estimating N uptake in the organs [17]. Crop N uptake was estimated as the sum of N content in individual plant organs.

2.4.5. Water and Nitrogen Use Efficiencies

To study N uptake, absorption and utilization from indigenous soil supply (unfertilized treatment) and from fertilizer, selected metrics of NUE as defined by Fageria et al. [17] were calculated. These components relate acquisition and utilization of N to application rates and N uptake in the grains at physiological maturity, and therefore one parameter alone is not sufficient. The following equations were used to calculate the different metrics of NUE:
Harvest   index =   Y TDM
Agronomic   efficiency =   Y F   Y O   NA
Apparent   recovery =   ( NU F NU O )   × 100 NA
Water   use   efficiency =   Y ET
Agricultural   UE = Y ET   × NA
where Y (kg ha−1) is the grain yield (compensated to 12% moisture content); YF is yield of the N-fertilized plot; YO of the zero-N plot; and NA (kg N ha−1) is the N application rate.
Nitrogen   uptake   ( kg   N   ha 1 ) =   10   × [ N   concentration   ( g   N   100   g 1 )   × Y i   ( g   m 2 ) ] 100   × 10
where Yi is the total DM yield of plant organs.
The ratio of N uptake by grains (kg N ha−1) to WUE (kg mm−1 ha−1) was calculated to better understand the relationship between N utilization in grains and crop evapotranspiration (ET) [9]. A plot of Agricultural UE and WUE as a function of N rate was used to determine the point of intersection using the graphical method.

2.5. Statistical Analysis

Data were analyzed using SAS® 9.3 version 6.1.7061 (SAS Institute Inc., Cary, NC, USA) for Windows using general linear model (GLM) procedures. The differences between treatments and years were tested at an α = 0.05 level of significance using the F-test. Means for main and interaction effects that were significant were separated using the Tukey’s Studentized post-hoc test. The means of ET could not be separated using ANOVA because a single water meter was used to measure irrigation applied per N treatment.

3. Results

3.1. Seasonal Weather Conditions and Crop Water Demand during Growth

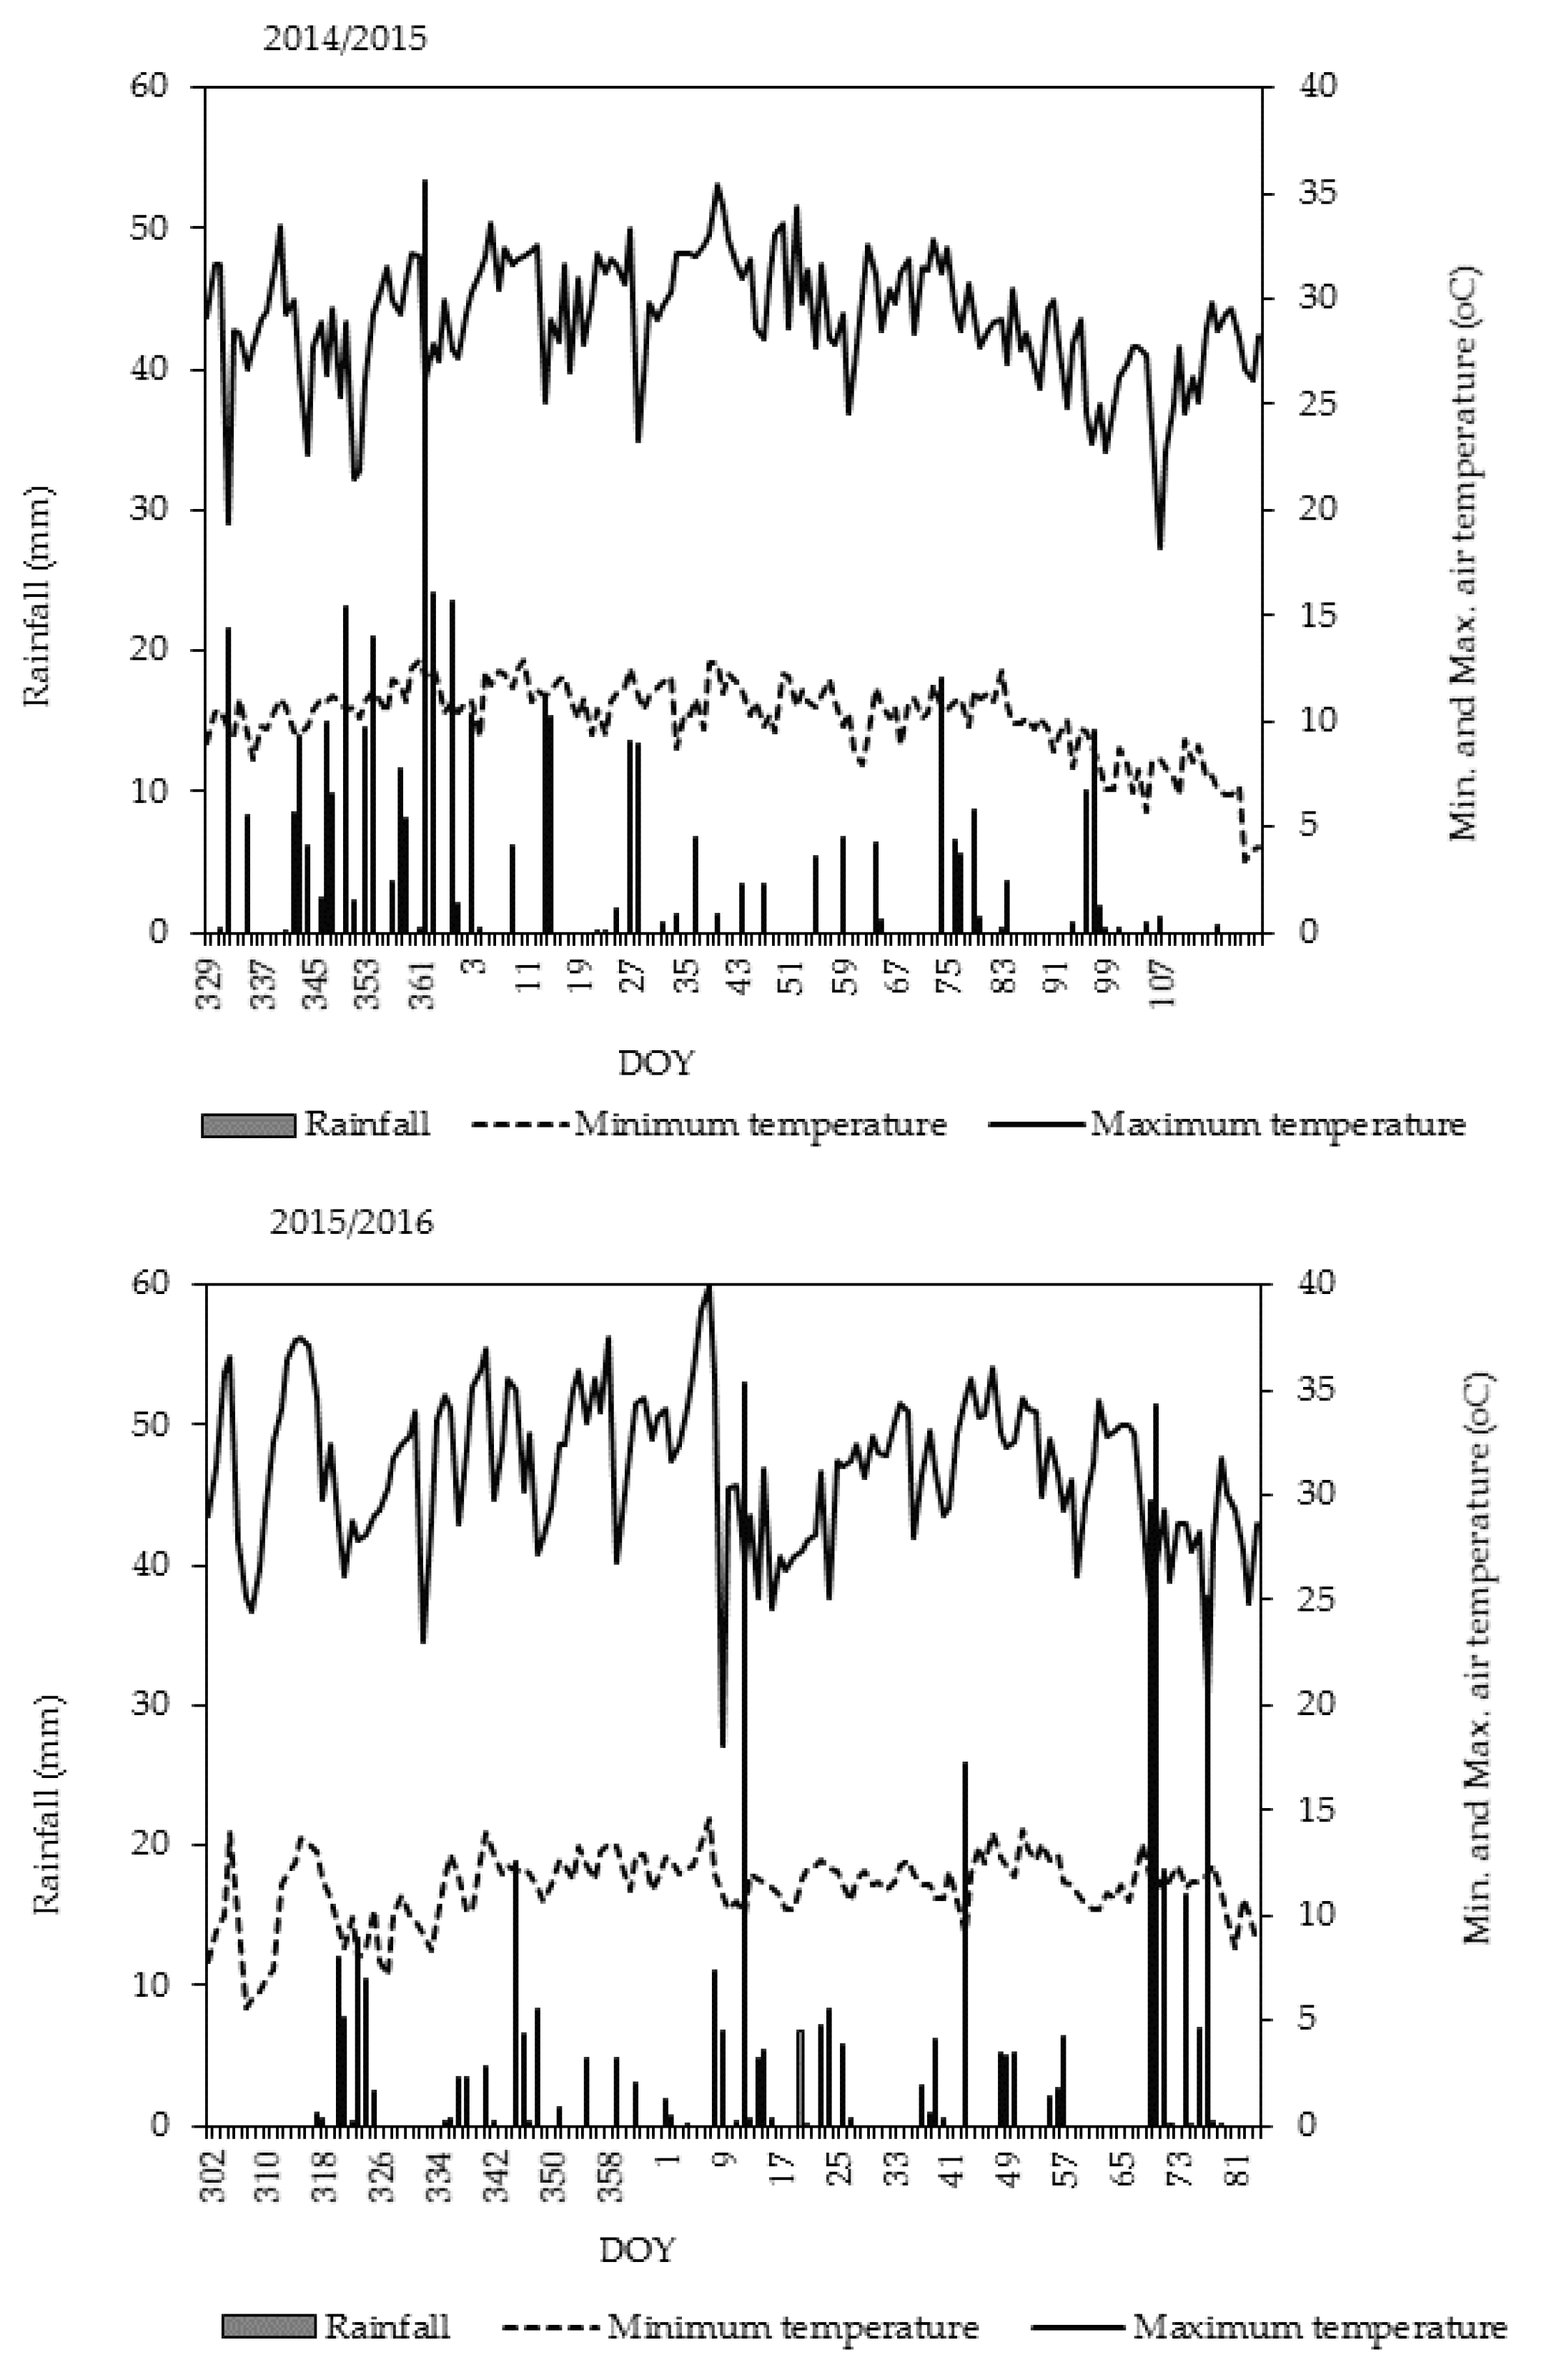
Figure 1 shows the daily weather data from sowing to harvest for selected parameters during the two seasons. Maximum and minimum temperatures averaged over the growing periods (29.0 °C and 15.3 °C in Y1 and 31.2 °C and 13.7 °C in Y2, respectively), were favorable for rice growth. Rainfall received during the period 52–112 DAE was 105 mm in the Y1 and 175 mm in Y2. Rainfall was more biased toward the early season in Y1 and to the late season in Y2 (Figure 1). During day of the year (DOY) 69–77 in 2016 (late reproductive growth), heavy rainfall events coincided with the ripening stage (Y2). In contrast, rainfall was more frequent during DOY 346–362 in 2014 (early vegetative growth of Y1). The total amount received from sowing (DOY 324) to 20 DAE in Y1 was 155 mm, compared to 48 mm for the same growth stage in Y2. Although sowing was earlier (DOY 293) in Y2 than in Y1 (DOY 333), the cumulative amount of solar radiation during the season differed by only 77.5 MJ m−2.
Irrigation amount was lower in Y1 (130 mm) than in Y2 (234 mm) due to more rainfall received in Y1. Amount of irrigation water applied for a given N rate did not significantly (p > 0.05, paired t-test) differ between seasons. Although not consistent, irrigation amount generally tended to increase with increasing N rates (Table 2). It was higher for 120 kg N ha−1 (385 mm) than for 160 kg N ha−1 (361 mm) and lowest for the zero-N treatment (336.5 mm). Table 2 also shows that the zero-N treatment required a substantially lower irrigation amount, notably during vegetative growth in Y1 and during reproductive growth in Y2. Mean soil water content measured in the 0–0.4 m and 0–0.6 m layers at the end of each season for the zero-N and 40 kg N ha−1 treatments was generally higher than for higher N rates, signifying that water extraction by plants was limited at lower N rates. These findings support the hypothesis that increasing N level increases crop water demand, even when water is not limiting growth.
One water meter was used per treatment and differences in irrigation amount between treatments could not be statistically separated.
A fairly constant soil water regime was maintained to avoid WS. However, it was important to note that θ was depleted from layers deeper than 0.4 m in plots receiving more than 80 kg N ha−1, notably during the reproductive growth stage. Soil water deficits for 160 kg N ha−1 were lower than for 120 kg N ha−1 over time across seasons. Results indicated that N levels above 120 kg N ha−1 reduced the amount of water extracted at maximum depth. Excessive N fertilization might have inhibited root growth and reduced water uptake despite the observed deep rooting and increased LAI at 160 kg N ha−1. These findings thus reject the hypothesis on the negligible effect of N on the depth of water extraction under well-watered conditions.

3.2. Crop Development, Leaf Area Index and Yield

Flowering for the 0 and 40 kg N ha−1 treatments was delayed (+6 days), and duration was shorter, compared to higher N rates, which could be because the low N fertilized plants took longer to achieve maximum tiller number. However, maturity was reached much earlier for these treatments than higher N rates during both years, resulting in a shorter grain filling period and lower final grain yields.
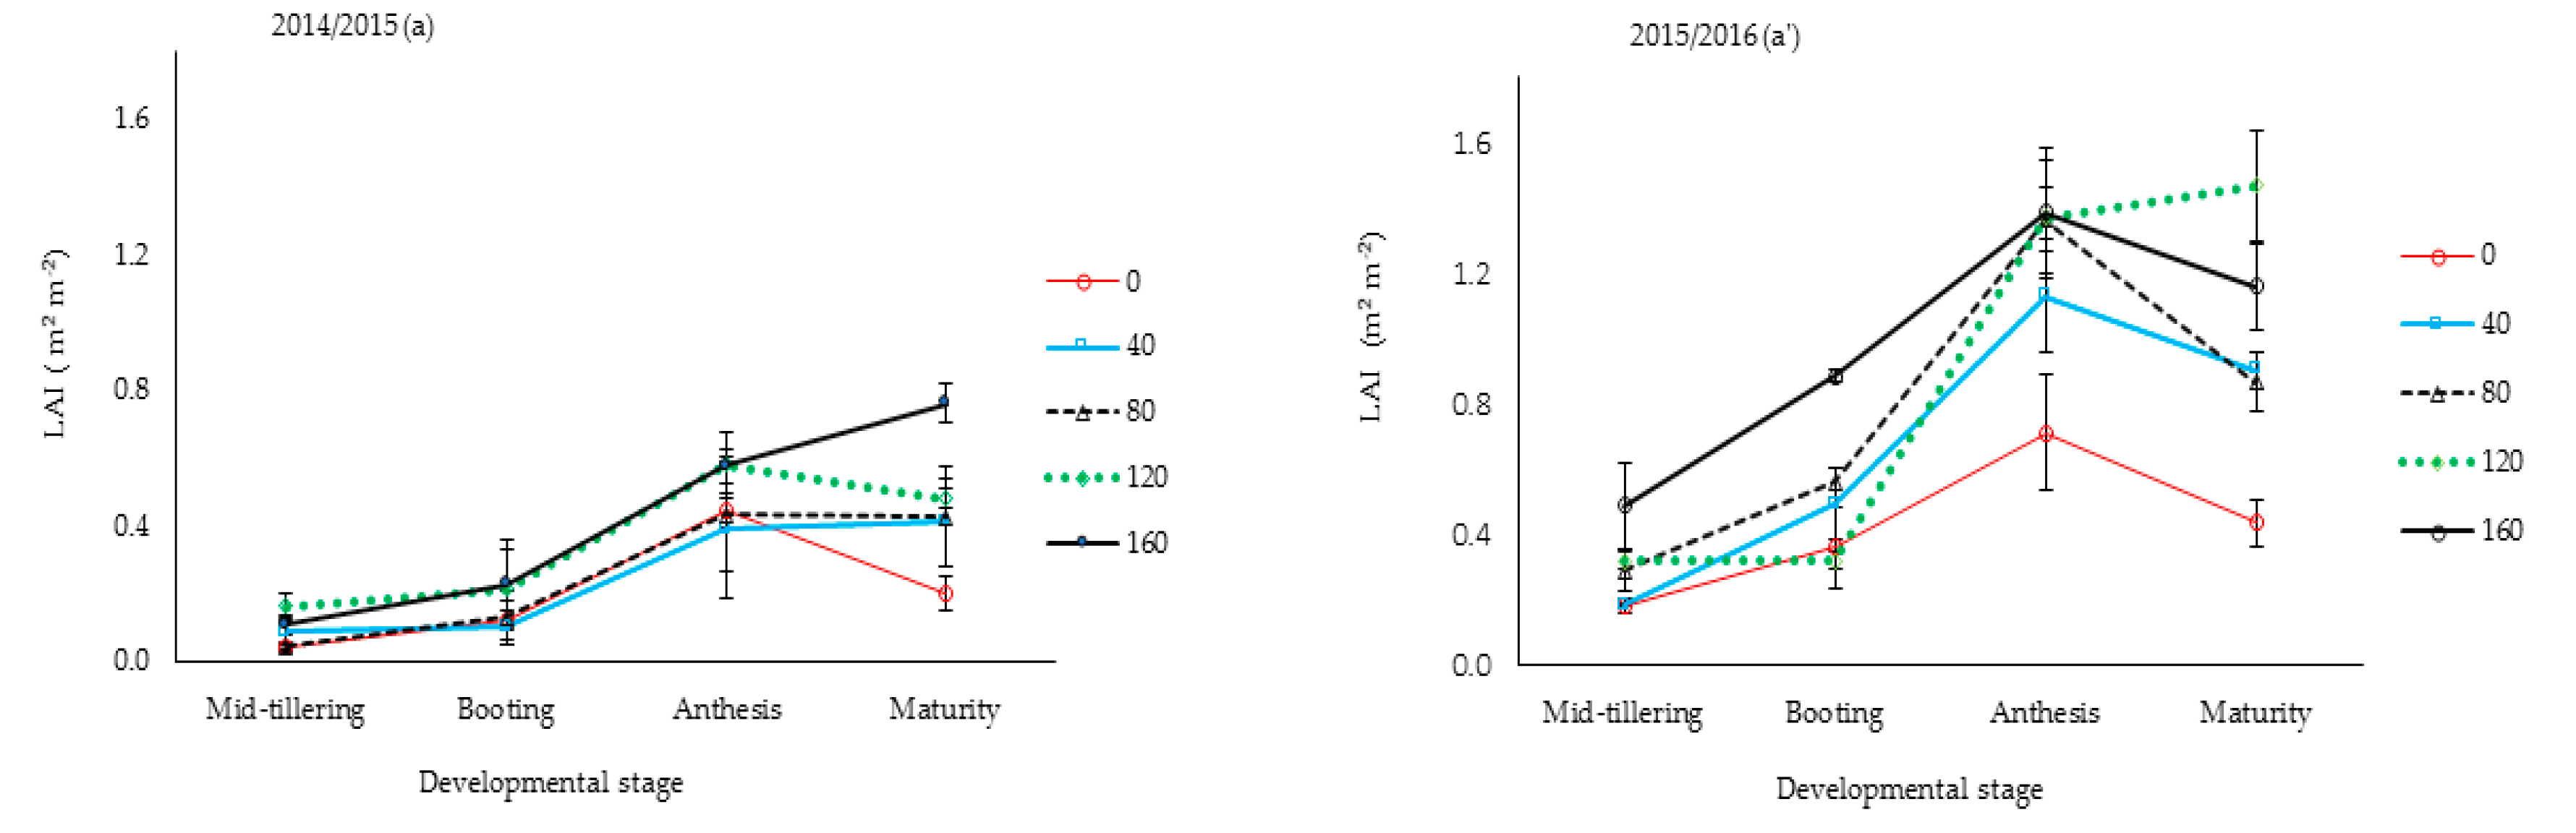
The interaction effect of season and N rates on growth (except for plant height) and TDM at maturity was not significant (p > 0.05). Larger maximum LAI in Y2 by 15–66%, compared to the same N treatment mean values than in Y1 (Figure 2), was attributed to inter-seasonal differences in daily temperatures. Figure 2 also shows that LAI for the two highest N rates did not differ significantly from each other during the post-anthesis stage. Plants for the two highest N rates maintained greener canopies (stay green attribute) for longer periods than the other treatments.
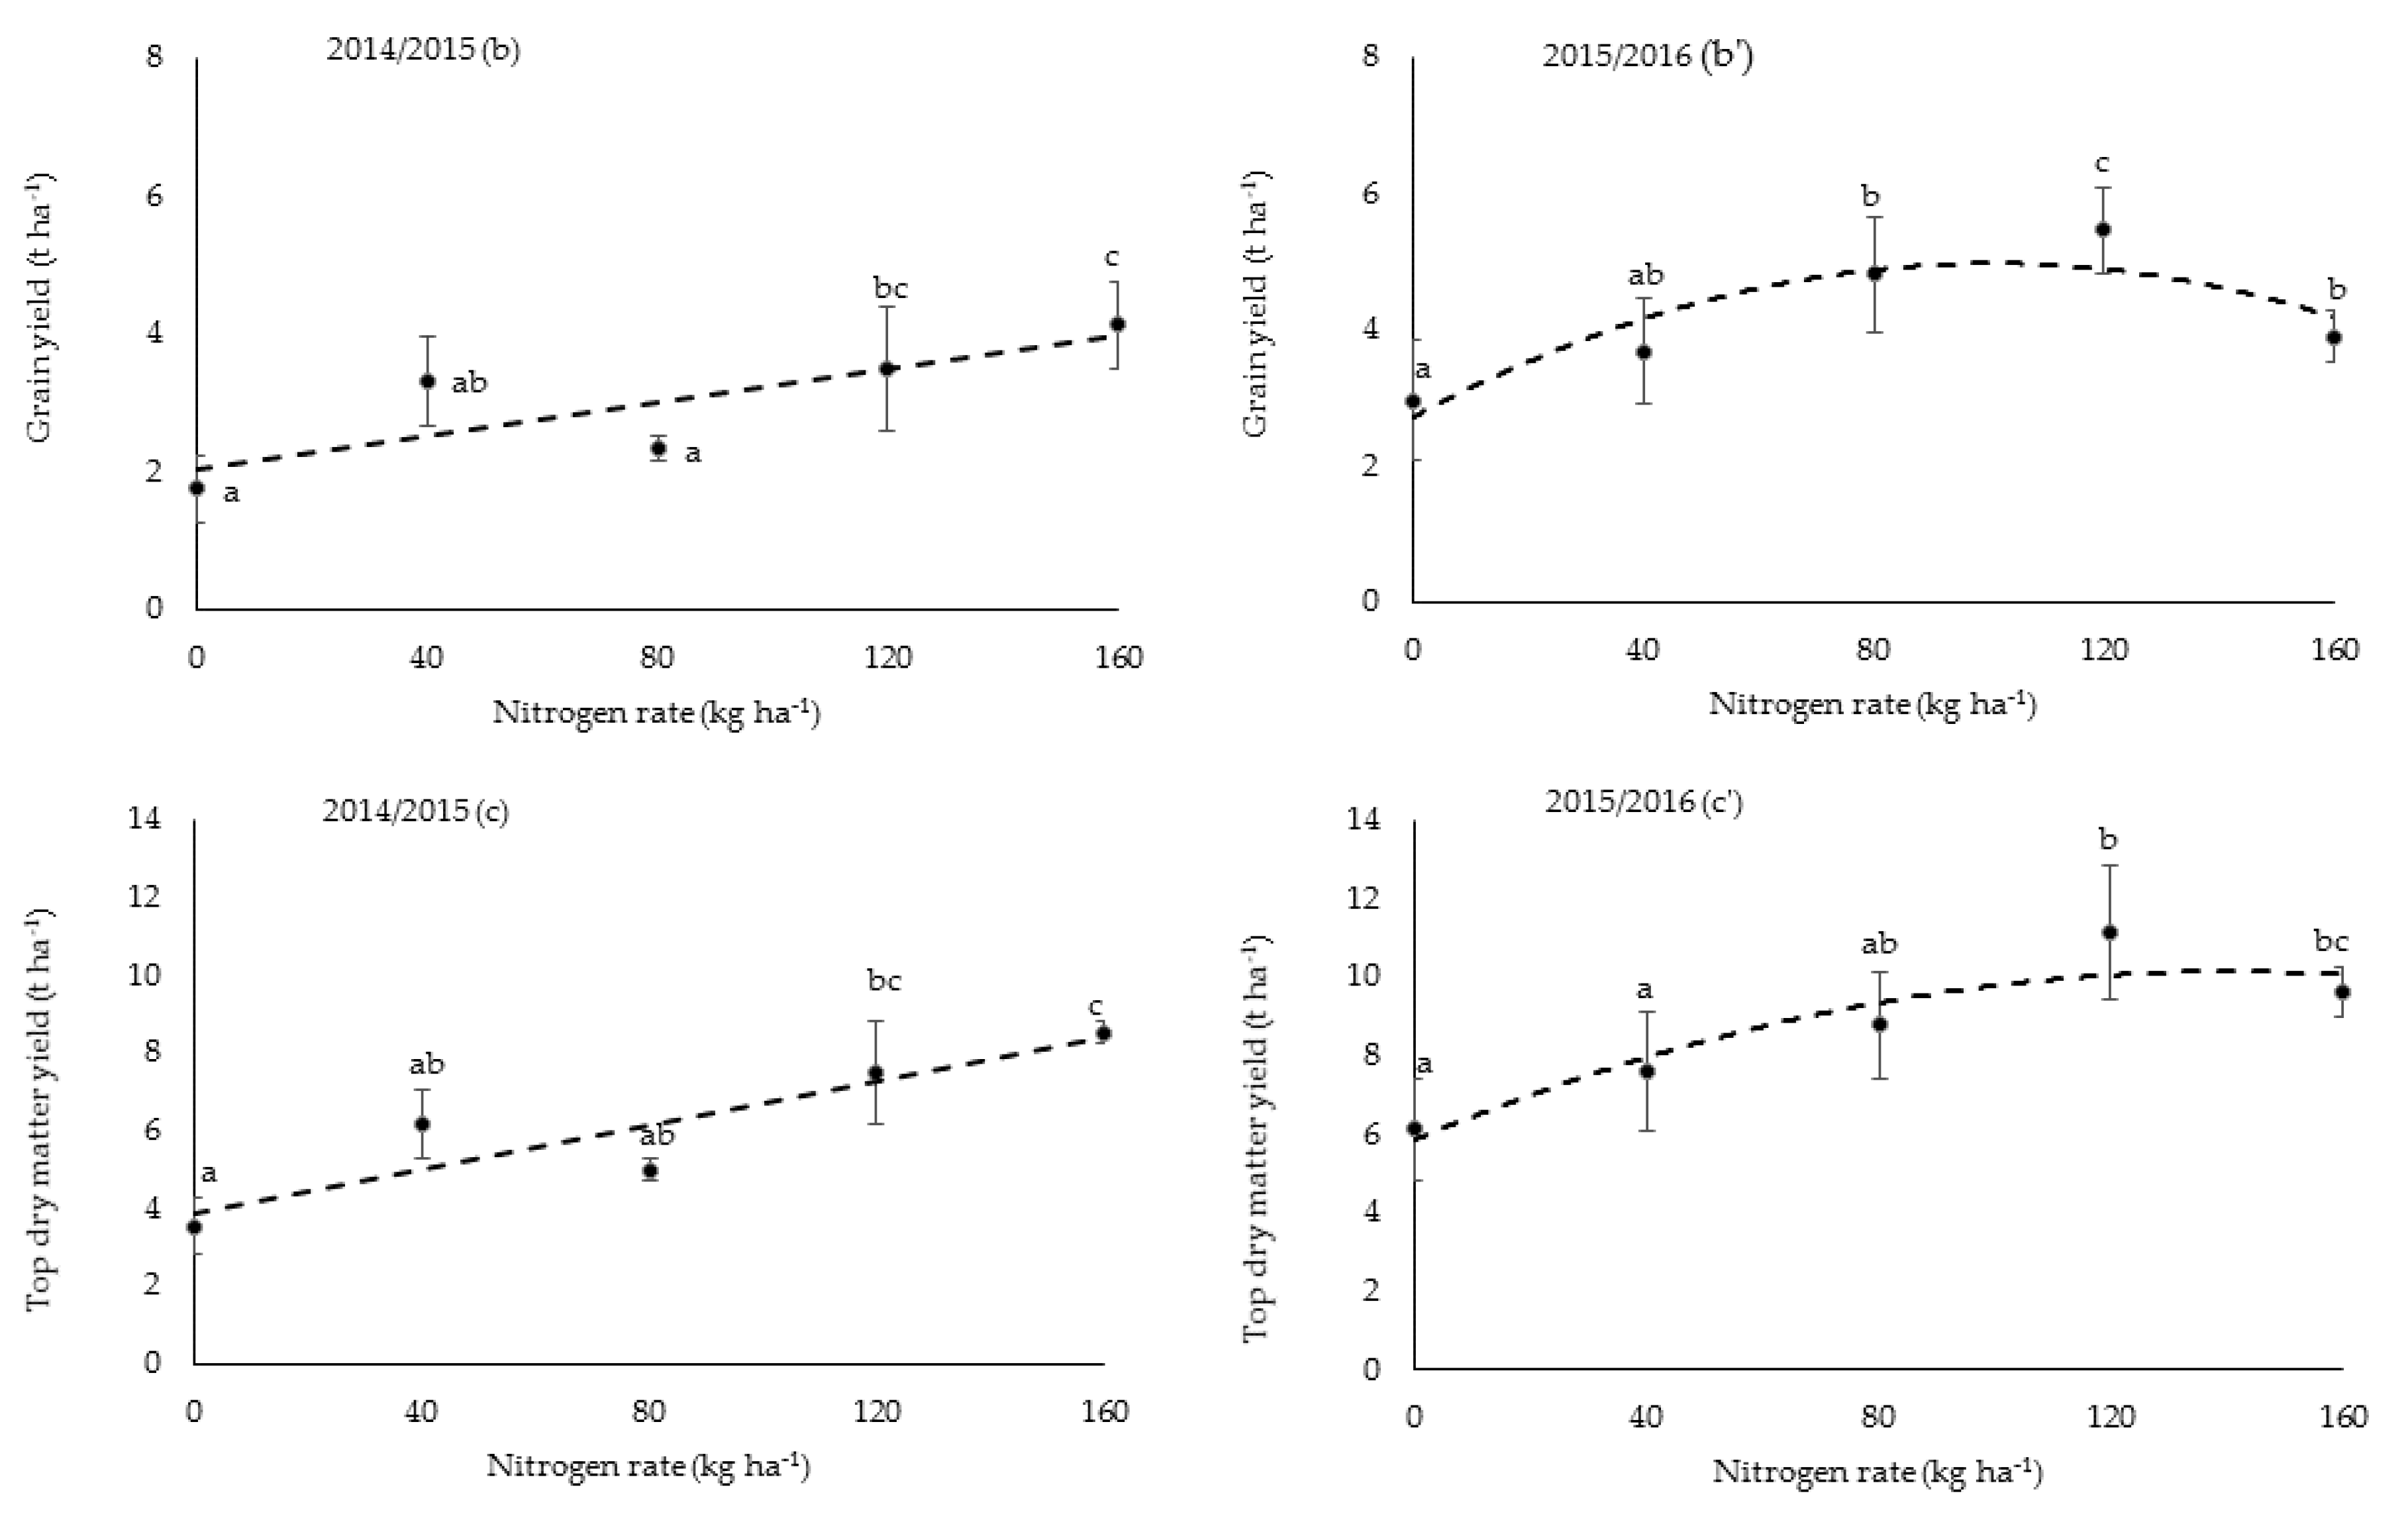
Grain yield (Y) increased significantly (p = 0.027) with increasing N rates (x), following a linear relationship ( Y = 1.926 + 0.0126 x ,   R 2 = 0.72 ) during Y1, and a quadratic relationship ( Y = 3.04 + 0.04486 x + 0.0003 x 2 ,   R 2 = 0.77 ) during Y2 with the maximum yield achieved at 120 kg N ha−1. High grain yield significantly correlated positively (p < 0.001) with the higher number of spikelets per panicle (59.3 ± 4.3 in Y1 and 92.1 ± 5.9 in Y2) and productive panicles m−2 (403.2 ± 82.5 in Y1 and 447.2 ± 73.7 in Y2) as a result of the larger LAI. Panicle length (17.0 ± 1.2 cm), 1000 grain mass (21.8 ± 0.6 g), and filled grains per panicle (7.0 ± 1.2%) were not different between seasons.
Correlation analysis revealed that grain yield variations due to N rates were closely linked to the number of spikelets (R2 = 0.91, p < 0.05) and panicles (R2 = 0.56, p < 0.05) per unit area. A reduction in grain yield at 160 kg N ha−1 in Y2 was linked to a significantly (p < 0.05) lower number of spikelets m−2 (45.63 × 10³) than for the 120 kg N ha−1 treatment (64.30 × 10³), lower leaf N concentration at maturity and more tillers, but a higher proportion of unproductive tillers.

3.3. Tiller Growth and Leaf N Concentrations

Mean tiller number was higher in Y1 than in Y2, except at final harvest for the zero-N treatment (Table 3). The mean number of tillers counted during V growth, for instance at 65 DAE, was lowest (1.3 ± 0.1) for 0 kg N ha−1, but not significantly (p > 0.05) different from the other treatments. Tillering pattern over the season was very different between the seasons for the N-fertilized treatments. Tiller abortion, therefore, occurred only during Y2, a season of normal tiller development, and was slightly higher at 0 kg N ha−1 than for most N-fertilized treatments. During Y2, maximum tiller number for 80–160 kg N ha−1 was early (80 DAE) compared to 92 DAE for the lower N rates. The cause of tiller abortion was not mutual shading, because maximum canopy cover measured was low, at approximately 60% fractional interception.
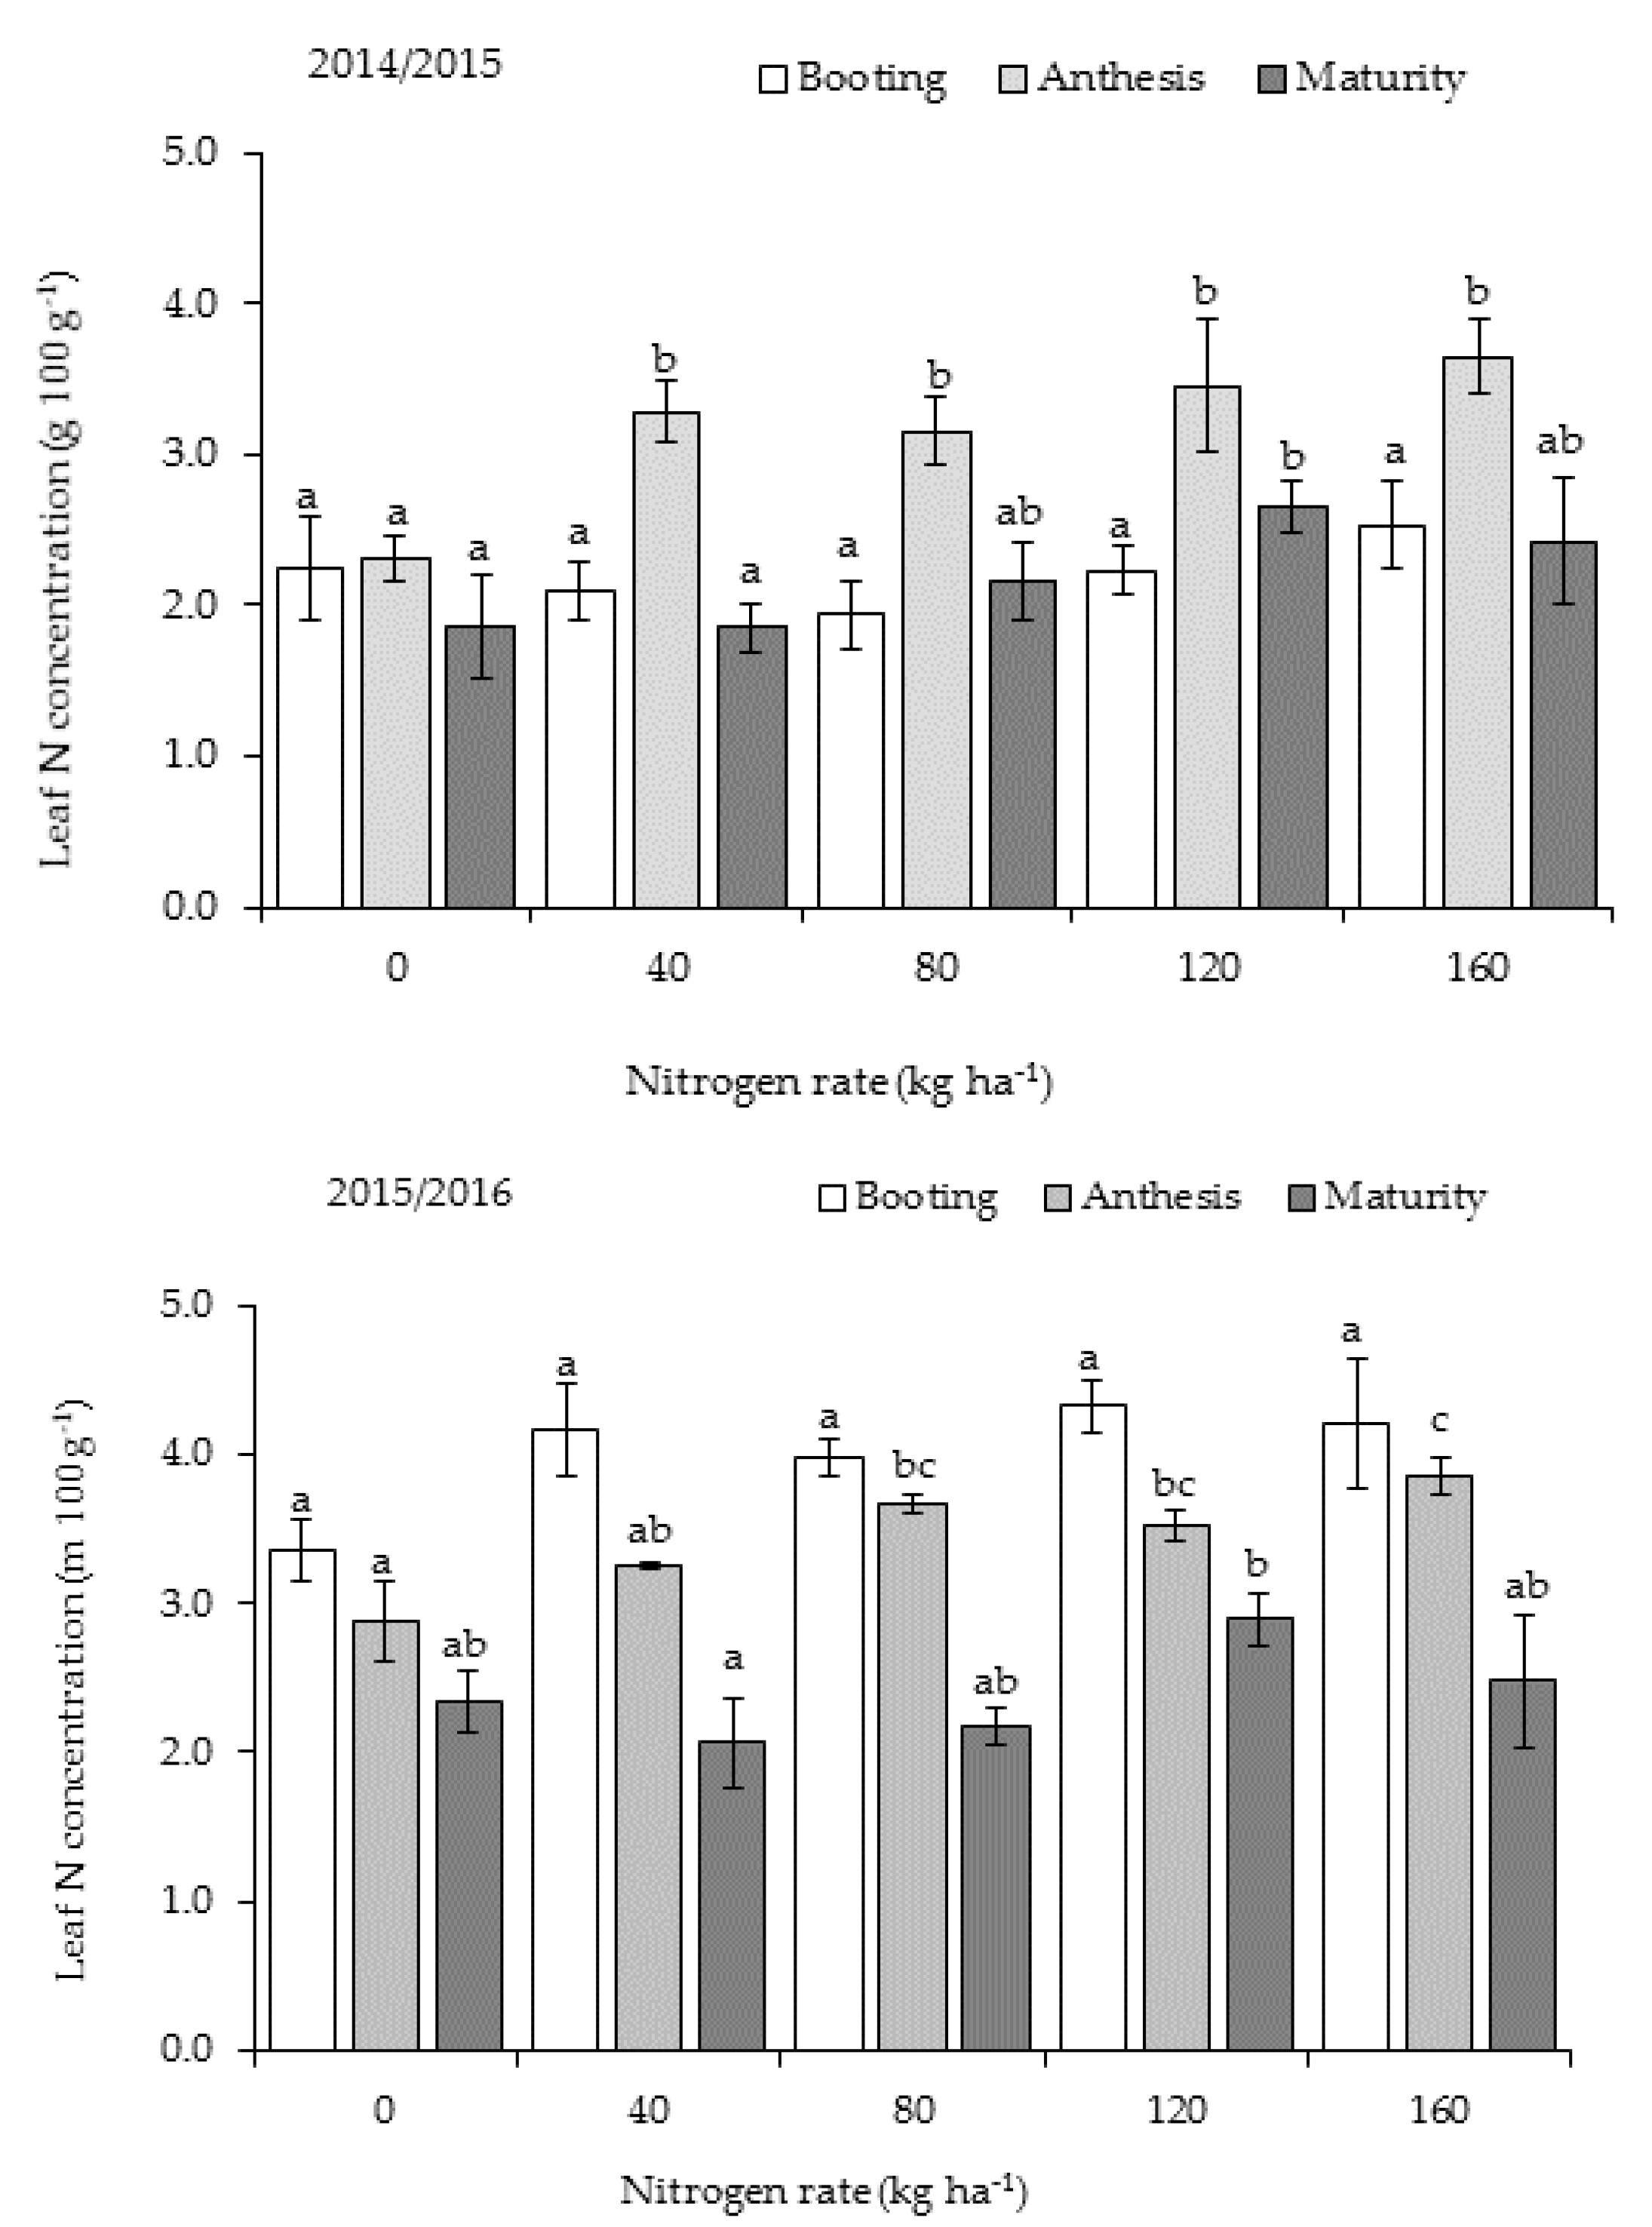
Leaf N concentration usually increased with increasing N application rate, independent of stage, although not always significant (Figure 3). The highest N concentrations in Y1 were measured during anthesis and in Y2 during booting. Frequent rainfall events during the early vegetative growth in Y1 (Figure 1) may have caused anaerobic conditions that were detrimental to root growth and promoted denitrification, which could have resulted in reduced N uptake. In the lower leaves (without the flag leaf), N concentration was significantly higher (p < 0.05) for 120 kg N ha−1 (2.68 ± 0.16%) than other treatments, including 160 kg N ha−1 (2.24 ± 0.08%). These findings suggest that the more N is applied, the more the crop takes up beyond what it needs for growth and grain production.
The decline in leaf N from booting to maturity was lower during Y1 than Y2, indicating that much N was retained in tillers (new tillers emerged post-flowering in Y1) and unavailable to the grains. The decline in tiller number post-flowering in Y2 at lower N rates was consistent, signifying a smaller maintenance burden at lower N rates, as there was less of a decline at higher N rate.

3.4. Water and N Use Efficiencies and Relationships and Estimated Crop N Uptake

Table 4 shows crop water use (ET), harvest index (HI), WUE, and NUE data as affected by N rates over the two growing seasons. The zero-N treatment consistently had the lowest ET. Although differences in total ET were negligible between N treatments, plants in the zero-N treatment had likely lower transpiration, but higher soil evaporation due to smaller LAI.
Grain quality did not change considerably with increasing N rate above 80 kg N ha−1. In addition to the yield response observed in Y2, the most efficient utilization of N fertilizer and water was thus achieved at a lower N rate than for maximum yield. It is thus important to achieve a balance between grain N concentration and yield when applying N fertilizers. Yield response was strongly affected by the recovery of N as indicated by a highly significant correlation (p < 0.001, R2 = 0.60) between apparent recovery and agronomic efficiency. Mean values of estimated AR indicate that the recovery of N was not affected by season and the interaction effect of N x season.
Grain N content per unit of water use increased with increasing N rate. Table 4 shows that increasing N fertilizer rate from 40 to 160 kg N ha−1 increased grain N uptake per unit crop water use from 8.7 to 10.6 kg N kg−1 mm−1 on average across years. Although N concentration in the stems was not analyzed, the highly significant (p < 0.0001) stem DM yield differences measured at harvest (Table 4) suggest that the total N retained in the stem parts for N fertilized treatments was high. The ratio of stem DM for N fertilized treatments to the zero-N treatment (1.8:1–2.8:1) suggests that stem N content for 120 kg N ha−1 and 160 kg N ha−1 was likely more than twice the level for 0 kg N ha−1. It is thus likely that stems of plants receiving 120 kg N ha−1 and 160 kg N ha−1 contained more than twice the total amount of N of the zero-N treatment. Estimated total crop N uptake averaged 87.6 ± 29.5 kg N ha−1 in Y1 and 93.5 ± 23.3 kg N ha−1 in Y2. These results suggest that more N was locked up in the V parts. Hence, no further yield gains (though crop N uptake increased) would probably have been achieved above 160 kg N ha−1.
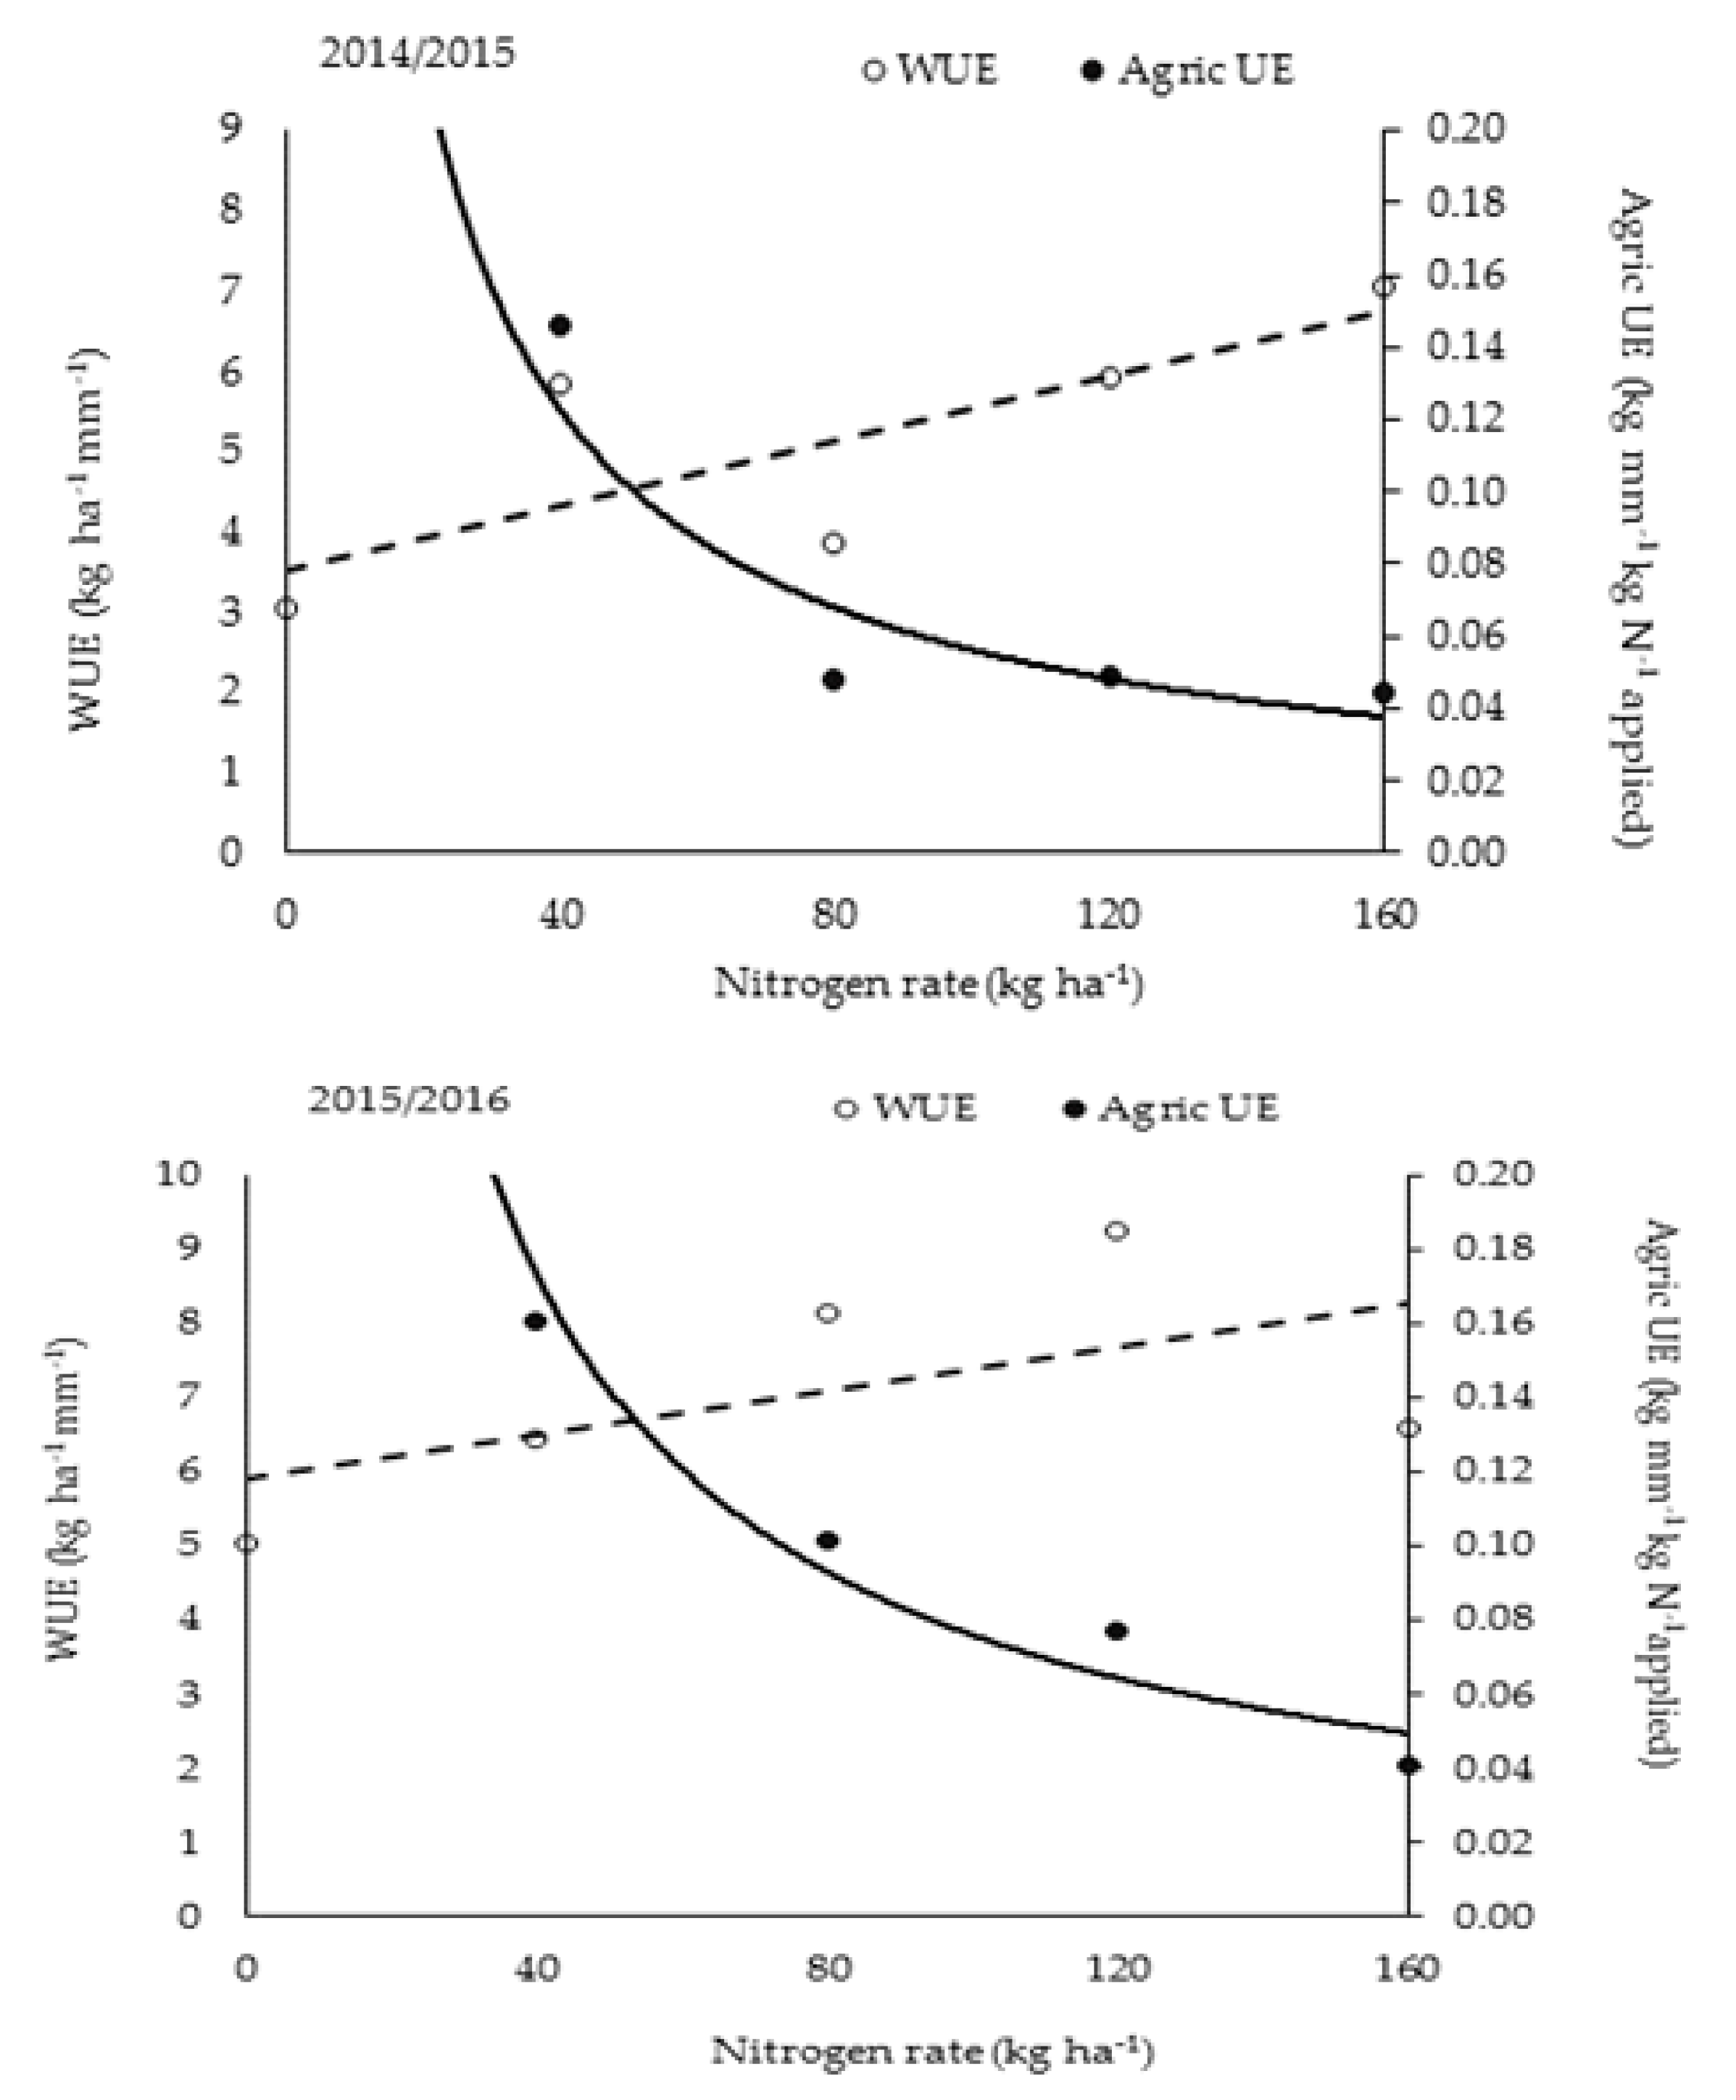
Agricultural UE decreased at a strongly (R2 = 0.80 and 0.97) negative exponential rate with increase in N fertilizer rates in both years (Figure 4). Mean values for 160 kg N ha−1 treatment were the same in both years, despite a substantial reduction in grain yield for this rate in Y2. Since grain quality did not change considerably with increasing N rate, except for 160 kg N ha−1, the relationship indicates that to produce grain with 1.7% N (the grand average), lower N rates than for maximum yield will result in a more efficient utilization of N fertilizer and water. During both seasons, the intersection between the WUE and Agricultural UE functions occurred at a rate of ±55 kg N ha−1 (Figure 4), indicating that maximizing use efficiency for N and water simultaneously was achieved at this N rate.

3.5. Soil Inorganic N Dynamics and Linkages with Soil Water Uptake

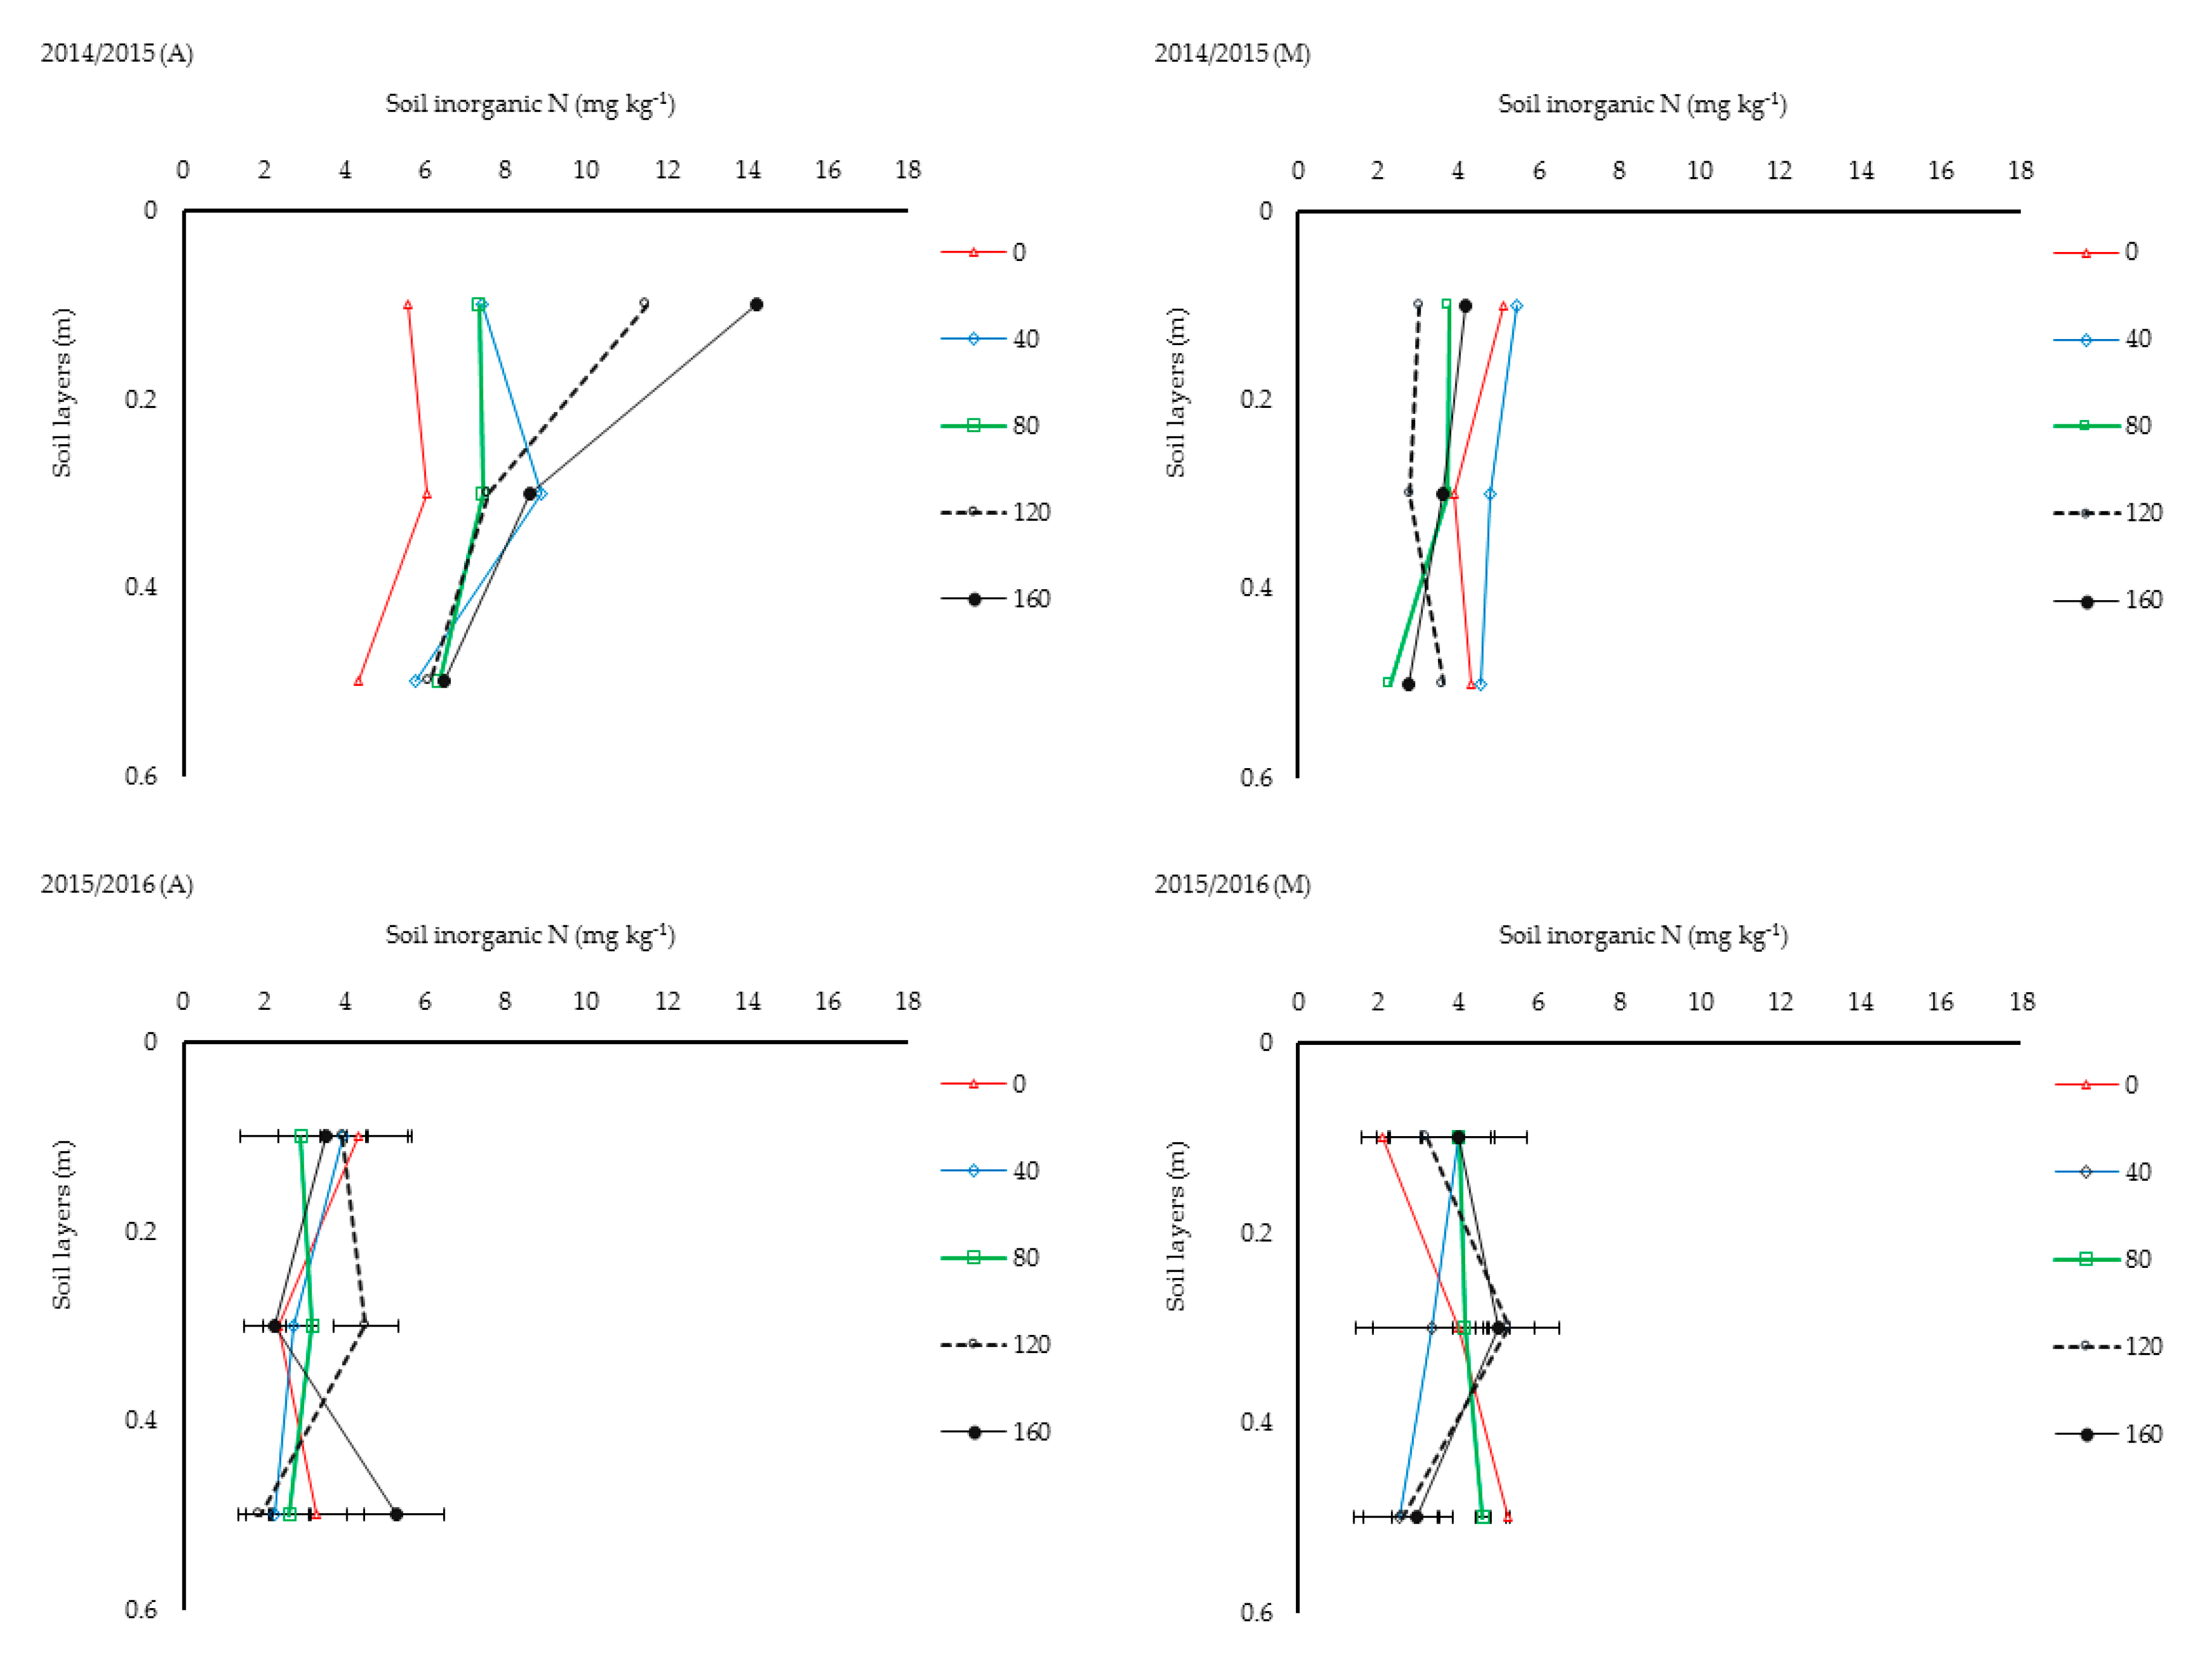
Soil inorganic N values in the top 0.6 m soil layer at harvest (2–8 mg kg−1) across all treatments were generally lower than values measured at sowing (6.9–7.4 mg kg−1). Differences in residual soil inorganic N levels were small in Y2 compared to Y1, most notably in the 0.4–0.6 m soil layer (Figure 5), because late season rains (Figure 1) probably diluted treatment effects. For the 0.4–0.6 m soil layer, plots without N fertilizer had higher mean soil inorganic N (4.32 mg kg−1 in Y1 and 5.23 mg kg−1 in Y2) than N fertilized treatments (3.31 ± 0.8 mg kg−1 in Y1 and 3.19 ± 0.8 mg kg−1 in Y2) at crop maturity. The high residual soil inorganic N for the 0 kg N ha−1 treatment, approximately 16–47% more than the mean levels for the higher N rates in Y1 and by 44–51% in Y2, was most likely due to limited water uptake from deeper soil layers. This can probably be associated with poor root development and low root activity for this treatment. Furthermore, the lowest residual soil inorganic N measured for 120 kg N ha−1, and the fact that the most soil water was depleted for this treatment, confirms that N fertilizer simultaneously increased water use and N uptake.

4. Discussion

Variation in rice yields between seasons for the same N rate was because canopy growth was greater during Y2 than in Y1. The inter-seasonal variations in LAI, growth, and yield shown in Figure 2 could be explained by differences in rainfall patterns or distribution between years. The very wet conditions from frequent rainfall events in early Y1, as shown in Figure 1, likely affected N availability, which was reflected by low leaf N at booting in Y1 compared to Y2. Great variation in rice yields between seasons has been reported previously. Yoshida [18] attributed inter-seasonal yield variation to differences in the available amount of solar radiation (Rs) during a season. There was no possibility of this effect in our study as cumulative Rs differed by only 77.5 MJ m−2 between the seasons. The great inter-seasonal yield variation was a result of different rainfall patterns during the years.
The high grain yield in Y2 compared to Y1 was due to a generally higher number of spikelets per panicle and per unit area and productive panicles per square meter, as shown in Table 3. The number of spikelets strongly depends on LAI at heading and the latter is positively related to crop N uptake at flowering [18]. While yield dependence on spikelets m−2 was significant in both years, the influence of leaf N was evident in Y2. A reduction in grain yield at 160 kg N ha−1 in Y2 was linked to lower leaf N concentration at maturity and a lower number of spikelets than for the 120 kg N ha−1 treatment. Furthermore, the diminishing increase in grain yields was caused by a higher proportion of unproductive tillers. In rice production, N is commonly applied during early vegetative stages to promote tillering and increase panicle number, followed by top-dressing around panicle initiation to increase spikelet number per panicle. Based on the findings of this study, it is important to promote reproductive growth to achieve high grain yield, because the increase in grain yield (which was often not significant between fertilized treatments) with increasing N rate was mainly attributed to more (but poorly filled) spikelets and more unproductive tillers.
Results on in-season leaf N concentrations suggest that the more N is applied, the more the crop takes up beyond it needs for growth and grain production, and the pattern for N-fertilized treatments can be altered by high soil water levels during tillering. It was expected that leaf N concentrations follow a normal pattern with time, which is initially high during early stages and decline gradually as the crop approached late developmental stages. In Y1, the highest N concentrations were measured during anthesis, while in Y2, the highest was at booting. The very wet soil conditions from frequent rainfall events for many days during the early vegetative growth stage (Y1, Figure 1) may have caused anaerobic conditions that were detrimental to root growth and promoted denitrification, which could have resulted in reduced N uptake. Nevertheless, findings in Y1 showed that upland rice can still accumulate substantial N levels in the leaves during the reproductive growth stages, which were equal to levels in Y2, even when N uptake is hampered during vegetative growth. Such ‘compensative uptake’ of N after flowering has not been documented for upland rice previously, but was observed in irrigated sugarcane (Saccharum officinarum). Wood et al. [19], for example, found late accumulation of leaf N just before maximum biomass production during the first season of a newly planted sugarcane crop.
The tillering patterns previously discussed (Table 3) are strongly linked to N availability. In contrast to most crops, tillering in rice is widely spread over time. Tillers from a main or primary stem are at different chronological ages, and a substantial overlap between the vegetative and reproductive stages occurs [11]. Uptake and utilization of N at a point in time can, therefore, differ considerably between a primary stem and secondary and tertiary tillers. This is similar to cotton (Gossypium hirsutum L.), where the spread of boll production over time results in different N demands within a single cotton bush [16]. Since the growth habit of rice is partly similar to that of cotton, competition for N between tillers in the vegetative growth stage as well as the grains can be expected, and the degree of competition depends on N availability. The decline in tiller number after flowering in Y2 at lower N rates was consistent, signifying a smaller maintenance burden at lower N rates as there was less of a decline in higher N treatments. Differences in tillering between N-fertilized and zero-N treatments thus influenced the onset and duration of flowering, and to a lesser extent maturity. The present study findings on N influence on flowering contrast those of previous studies, for example, Belder et al. [5] reported early maturity of aerobic rice in N-fertilized treatments under irrigation in a lowland. It is noteworthy that upland rice differs from lowland rice in several respects, among others, soil water availability.
The values of NUE and grain N in our study were slightly higher compared to the values (9–14 kg grain kg−1 N for agronomic NUE, 1.13–1.28 g N 100 g−1 for grain N, and 0.24–0.31 for HI) reported by Fageria et al. [17] and Kaizzi et al. [2]. One likely reason for the differences in NUE trends between studies is that the crops in the present study did not suffer from drought stress and the rice varieties were different.
The objective of N fertilization is to achieve high NUE and maximize profits. The pattern of Agricultural UE shown in Figure 4, which was similar in both years, indicates that growth and resource use efficiencies declined with increasing N rate. The observed decline in Agric UE and in grain N per crop N uptake, means that N fertilizer should be optimized in irrigated rice production. The present study identified compensative uptake of N, increased rooting depth, and delayed senescence as specific physiological traits, which can be attributed to high NUE and sink capacity for this upland rice variety. However, it was noted that low panicle number due to few productive tillers in Y1 occurred with the late accumulation of N in the leaves, which reduced grain yield and thus N utilization efficiency. Findings suggest that improving spikelet number through high planting density under well-watered conditions will compensate for low HI under high N rates and likely improve WUE.

5. Conclusions

Nitrogen fertilization up to 120 kg N ha−1 had a positive effect on WUE and NUE of well-watered upland rice. Low N fertilizer levels limited water use through a reduction in the maximum soil depth of water extraction and a smaller canopy. Crop development and flowering dates were altered by N fertilizer levels, even though water was not limiting in all treatments, which is important for farmers that do use fertilizers; because a longer period to peak tillering for N-fertilizer treatments contributed to a higher proportion of unproductive panicles. In well-watered upland rice, spikelet fertility, delayed leaf senescence and grain filling period, leaf N uptake, panicle length, and grain mass are stable traits over seasons for optimization of fertilizer NUE. From a practical perspective, this study has provided information on the water use of upland rice, and showed that while too little N limits yield, too much N can also lead to lower resource use efficiencies.

Author Contributions

Conceptualization, I.N.A. and J.M.S.; Methodology, I.N.A., M.v.d.L., J.G.A., J.M.S., and J.G.A.; Formal analysis, I.N.A. and J.M.S.; Investigation, I.N.A.; Writing—Original Draft Preparation, I.N.A. and M.v.d.L.; Writing—Review and Editing, I.N.A., M.v.d.L., J.G.A., and J.M.S. All authors have read and agreed to the published version of the manuscript.

Funding

The National Agricultural Research Organization through the Agricultural Technology and Agribusiness Advisory Services (ATAAS) project partly supported Dr Isaac Newton Alou’s tuition fees and the University of Pretoria fully provided research facilities.

Acknowledgments

The authors are grateful to the National Crops Resources Research Institute (NaCCRI) Rice breeding program for providing seed and the University of Pretoria for providing the necessary facilities as well as the staff at the University of Pretoria’s Experimental Farm on the Hillcrest campus for their technical support.

Conflicts of Interest

The authors declare no conflict of interest or competing financial interests.

References

  1. United States Department of Agriculture (USDA). USDA Production, Supply and Distribution (PSD) Data Base. Foreign Agricultural Service, USDA, 2013. Available online: https://www.fas.usda.gov/psdonline/ (accessed on 20 December 2018).
  2. Kaizzi, K.C.; Byalebeka, J.; Semalulu, O.; Alou, I.; Zimwanguyizza, W.; Nansamba, A.; Odama, E.; Wortmann, C.S. Upland rice response to nutrient application in Uganda. Afr. J. Plant Sci. 2014, 8, 416–425. [Google Scholar]
  3. Saito, K.; Linquist, B.; Atlin, G.N.; Phathaboon, K.; Shiraiwa, T.; Horie, T. Response of traditional and improved upland rice varieties to N and P fertilisers in northern Laos. Field Crops Res. 2005, 96, 216–223. [Google Scholar]
  4. Kondo, M.; Murty, V.R.M.; Aragones, D.V. Characteristics of root growth and water uptake from soil in upland rice and maize under water stress. Soil Sci Plant Nutr. 2000, 46, 721–732. [Google Scholar] [CrossRef]
  5. Belder, P.; Bouman, B.A.M.; Spiertz, J.H.J.; Peng, S.; Castaneda, A.R.; Visperas, R.M. Crop performance, nitrogen and water use in flooded and aerobic rice. Plant Soil 2005, 273, 167–182. [Google Scholar] [CrossRef]
  6. Kijoji, A.A.; Nchimbi-Msolla, S.; Kanyeka, Z.L.; Serraj, R.; Henry, A. Linking root traits and grain yield for rainfed rice in sub-Saharan Africa: Response of Oryza sativa x Oryza glaberrima introgression lines under drought. Field Crops Res. 2014, 165, 25–35. [Google Scholar] [CrossRef]
  7. Department of Science and Technology South Africa. Findings of the Feasibility Study and the Business Case for the Commercial Production of Dryland Rice in South Africa and Establishing a Rice Value Chain. A Stakeholder Workshop on Inputs to the Potential Growth of Rice in South Africa. DST Building Pretoria (TBC), South Africa; 28 May 2019. Available online: https://www.dst.gov.za/ (accessed on 1 June 2019).
  8. Van den Berg, E.; De Waele, D. Further observations on nematodes associated with rice in South Africa. Phytophylactica 1989, 21, 125–130. [Google Scholar]
  9. Sadras, V.O.; Hayman, P.T.; Rodriguez, D.; Monjardino, M.; Bielich, M.; Unkovich, M.; Mudge, B.; Wang, E. Interactions between water and nitrogen in Australian cropping systems: Physiological, agronomic, economic, breeding and modelling perspectives-review. Crop Pasture Sci. 2016, 67, 1019–1053. [Google Scholar] [CrossRef] [Green Version]
  10. Wang, D. Water use efficiency and optimal supplemental irrigation in a high yield wheat field. Field Crops Res. 2017, 213, 213–220. [Google Scholar] [CrossRef]
  11. Alou, I.N.; Steyn, J.M.; Annandale, J.G.; Van der Laan, M. Growth, phenological, and yield response of upland rice (Oryza sativa L. cv. Nerica 4®) to water stress during different growth stages. Agri. Water Manag. 2018, 198, 39–52. [Google Scholar] [CrossRef]
  12. Jones, M.P.; Dingkuhn, M.; Aluko, G.K.; Semon, M. Interspecific O. sativa L. x O. glaberrima Steud. progenies in upland rice improvement. Euphytica 1997, 94, 237–246. [Google Scholar] [CrossRef]
  13. Soil Classification Working Group. Soil Classification—A Taxonomic System for South Africa. Memoirs on the Agricultural Natural Resources of South Africa; Department of Agricultural Development: Pretoria, South Africa, 1991.
  14. Annandale, J.G.; Benadé, N.; Jovanovic, N.Z.; Steyn, J.M.; Du Sautoy, N. Facilitating irrigation scheduling by means of the Soil Water Balance Model. In Water Research Commission Report No. 753/1/99; Water Research Commission: Pretoria, South Africa, 1999. [Google Scholar]
  15. Agri-LASA. Agri-Laboratory Association of Southern Africa Handbook of Standard Soil Testing Methods for Advisory Purposes; Soil Science Society of South Africa: Pretoria, South Africa, 2004; Volume 22, pp. 1–109. [Google Scholar]
  16. Milroy, S.P.; Bange, M.P.; Sadras, V.O. Profiles of leaf nitrogen and light in reproductive canopies of Cotton (Gossypium hirsutum). Ann. Bot. 2001, 87, 325–333. [Google Scholar] [CrossRef] [Green Version]
  17. Fageria, N.K.; de Morais, O.P.; dos Santos, A.B. Nitrogen use efficiency in upland rice genotypes. J. Pant Nutr. Soil Sci. 2010, 33, 1696–1711. [Google Scholar] [CrossRef]
  18. Yoshida, S.; Cock, J.H.; Parao, F.T. Physiological aspects of high yields. Ann. Rev. Plant Physiol. 1972, 23, 437–464. [Google Scholar] [CrossRef]
  19. Wood, A.W.; Muchow, R.C.; Robertson, M.J. Growth of sugarcane under high input conditions in tropical Australia. III. Accumulation, partitioning and use of nitrogen. Field Crops Res. 1996, 48, 223–233. [Google Scholar] [CrossRef]
Figure 1. Daily temperature and rainfall from sowing to harvest for two summer-to-autumn growing seasons of a rice field experiment under irrigation at the Hatfield Experimental Farm, South Africa.
Nitrogen 01 00013 g001
Figure 2. In-season leaf area index (LAI) (a) and (a’), grain yield (b) and (b’), and top dry matter yield at final harvest (c) and (c’) response to N fertilizer rates in two consecutive years. Standard deviation bars show variability in the data. Means with the same letters for each parameter do not differ significantly at p < 0.05 by Tukey’s Studentized test.
Nitrogen 01 00013 g002aNitrogen 01 00013 g002b
Figure 3. Leaf nitrogen (N) concentration during booting, anthesis, and physiological maturity in response to N rates. Means for a stage followed by the same letters do not differ significantly by Tukey’s Studentized test at p < 0.05. Standard deviation bars show variability in data.
Nitrogen 01 00013 g003
Figure 4. Agricultural use efficiency (Agric UE) and water use efficiency (WUE) of rice as influenced by nitrogen rate in the two seasons.
Nitrogen 01 00013 g004
Figure 5. Soil inorganic nitrogen (N) around anthesis (A) and maturity (M) in the 0–0.6 m soil layer. Standard deviation bars show variability in the data (not indicated for 2014/2015 because one composite soil sample per treatment was analyzed).
Nitrogen 01 00013 g005
Table 1. Selected soil properties at the beginning of the trial.
PropertySoil Layer (m)
0–0.20.2–0.40.4–0.60.6–0.80.8–1.0
Field capacity (m3 m−3)0.240.270.290.240.25
Sand (%)71.864.657.7
Clay (%)24.730.736.3
Soil pH (2.5 water:1 soil)5.85.55.6
Bulk density (Mg m−3)1.651.651.551.531.40
NH4 -N (kg ha−1)14.817.017.2
NO3 -N (kg ha−1)2.75.85.7
Table 2. Irrigation, rainfall in different growth phases, and mean soil water content (0–0.4 and 0–0.6 m depth) at maturity.
SeasonsTreatment
(kg N ha−1)
Rainfall (mm)Irrigation (mm)Soil Water Content at Maturity (mm m−1)
VegetativeReproductiveVegetativeReproductive0–0.4 m0–0.6 m
2014/20150365666015474.9129.1
403656611915074.0125.7
803656612215774.7126.2
1203656613515672.4120.9
160365669016074.0125.2
2015/20160192653926782.1132.8
40192653999078.4129.1
80192653869372.8124.3
120192653676974.0125.0
160192653997374.3125.4
Table 3. Tiller number from flowering to maturity as affected by N fertilizer rates.
Treatment
(kg N ha−1)
2014/2015 2015/2016
DAEDAE
73951178092113128
01.4 a1.76 a1.76 a2.79 a 3.503.21 a2.61 a
401.64 ab2.07 ab3.31 ab3.88 ab4.404.00 ab2.64 a
801.64 ab3.31 ab3.52 ab4.20 ab3.803.60 ab3.21 ab
1201.74 ab3.45 b3.76 ab4.55 bc4.304.95 b4.23 b
1602.33 b3.64 b4.19 b5.21 bc4.904.36 b3.65 ab
F-test ******ns***
ns, not significant at ∞ = 5%. * Significant (0.05); ** Significant (p < 0.01). Means within columns followed by the same letters do not differ significantly at p < 0.05 by Tukey’s Studentized test.
Table 4. Water and nitrogen (N) use efficiencies of upland rice over two consecutive years.
Season, N Rate
(kg N ha−1)
2014/2015
Irrigation (mm)ET (mm)Harvest IndexWUE
(kg ha−1 mm−1)
Agric. UE
(kg mm−1 kg−1 N Applied)
Grain N
(g 100 g−1)
Grain N Content
(kg ha−1)
Leaf N Content (kg ha−1)Stem DM (kg m−2)AE
(kg kg−1)
AR
(%)
02145730.432.70 a-1.58 a23.85 a15.60 a0.14 a--
402695850.444.99 a0.131.70 a49.50 b27.80 b0.27 bc29.8955.94
802795870.383.49 a0.051.69 b38.71 a28.10 ab0.23 ab13.7115.99
1202915910.405.20 a0.051.95 b60.58 b42.90 c0.33 bc17.3540.83
1602505870.416.14 b0.042.07 b74.69 b41.40 c0.36 c12.8731.77
F-testnanans*-**********nsns
2015/2016
04595880.464.43-1.65 a46.019.140 a0.22 a--
404895940.475.440.171.76 a60.6712.28 a0.27 ab26.71 a55.41 a
804795910.487. 160.101.86 ab79.0410.83 ab0.32 ab23.71 a51.28 b
1204365900.428.150.081.88 ab 91.2229.52 c0.42 bc23.81 a53.44 b
1604725930.365.790.042.05 b69.6517.82 d0.41 bc8.51 b14.77 c
F-testna*nsns-**ns****
N rate x season nanansns-nsnsnsns*ns
AE, Agronomic efficiency; AR, apparent recovery; IE, internal efficiency; Agric. UE, Agricultural use efficiency. na, not applicable. * Significant (p < 0.05); ** significant (p < 0.01); *** significant (p < 0.001). ns, not significant at p = 5%. WUE for grain yield. Means within columns followed by the same letter do not differ significantly at p < 0.05 by Studentized post-hoc test.
Publisher’s Note: MDPI stays neutral with regard to jurisdictional claims in published maps and institutional affiliations.

