1. Introduction
Nitrogen (N) inputs in the form of synthetic mineral fertilizers provide plant-available forms of N and have increased yields significantly ever since the Harber-Bosch process allowed fertilizers to be mass-produced [
1]. Since the long-term sustainability of synthetic N fertilizers is questionable, alternative fertilizers based on, e.g., compost, liquid manure, recycled fertilizer or green manure have been developed to conserve natural resources while maintaining productivity. Most N in organic fertilizers must be mineralized to become available to plants, a process in which soil microorganisms play a crucial role [
2]. Understanding the factors that shape soil microbial communities and the processes associated with N mineralization is vital to ensure an adequate plant N supply and to calculate the requirements of N fertilizers [
3].
The current climate models predict increasingly frequent and severe summer droughts for most European countries [
4]. Given that microbial communities strongly depend on soil water contents [
5,
6], changes in precipitation patterns may negatively affect microbial communities [
7], with consequences for N-related microbial activity [
8] and plant N supplies from organic fertilizers. The ultimate effect of drought on processes related to N mineralization may depend on local soil management practices and may thus differ between organic and conventional farming systems. These farming systems are based on different fertilization and plant protection concepts, which, in turn, significantly affect the physical and biological soil properties. Soils under organic farming contain, for example, higher soil organic carbon (SOC) in the topsoils [
9]. SOC can increase the soil’s water-storage capacity [
10,
11,
12], and it may thus take longer for SOC-rich soils to dry out when precipitation is low. Soils that store more water and dry out more slowly expose soil organisms to less drought.
Organically managed soils are further characterized by higher microbial diversity, abundance and activity when compared with conventionally managed soils, as highlighted in a recent meta-analysis [
13]. Reduced levels of soil biodiversity adversely affect soil multifunctionality, including N cycling, as shown in a mesocosm study in which soil biodiversity and community composition were experimentally manipulated [
14]. In a drought, such contrasting levels of soil biological quality as created by organic and conventional farming may play a large role for soil functioning; a high biodiversity can increase the variability of species’ responses to environmental stress [
15,
16] and help to maintain soil functioning, including N cycling. Conducting an experiment under controlled drought conditions, Lori et al. [
17] found that the supply of N to plants from organic fertilizer was higher in soil derived from organic than conventional farming systems. Moreover, these authors showed that the community composition of microbes involved in N mineralization differed in the two farming systems, and microbes in organically managed soils were the most resistant to drought [
17]. In contrast, under field conditions, Bosshard et al. [
18] found similar levels of N provisioning from organic fertilizers under organic versus conventional management; however, in this field experiment, the soil water content was not systematically assessed. The combined effect of farming system history and drought on plant N supply from organic fertilizers has not yet been investigated in arable crops under field conditions.
Here, we present results from a field experiment in which we used rainout shelters [
19] to simulate a drought period in winter wheat fields with a history of more than forty years of conventional or organic (biodynamic) farming. During the tillering phase of wheat, we buried
15N-labelled ryegrass in the soil, simulating a fertilization event with green manure. On two sampling dates, we measured the soil water content and assessed the plant biomass production and the amount of N derived from the organic fertilizer (Ndff) in the plants. The higher microbial abundance, activity and diversity in organic than conventional soils previously described [
13] may promote N mineralization and enhance plant N supply from organic fertilizer. However, based on results of Lori et al. [
17], we expected similar levels of N derived from organic fertilizer in the plants in organically and conventionally managed soil under non-drought conditions. Given the relationship between biodiversity and resistance to disturbances, and the findings of Lori et al. [
17], we expected to find higher levels of N derived from organic fertilizer under drought conditions in organic compared to conventional farming systems.
We intended to study the soil microbiome, particularly the N cycle-related microbial communities (similar to [
8,
17]), to link the effects of farming system history and drought on the plants’
15N content to properties of the underlying microbial community. Unfortunately, after the first sampling date, several experimental subplots were flooded by repeated, massive rainfall events. Moreover, water flowed in from the irrigation system of the neighboring vegetable farm. A visual inspection of the field site indicated that the flooding severely affected the experiment. It is unclear whether the results obtained after the first sampling date were valid, because an unknown quantity of the
15N-labelled green manure might have been washed out or transported to deeper soil layers. Additionally, because the soil water content was altered due to unintended water inflow, potential interactions between the farming system history and experimental drought could not be explored on the second sampling date. Given these drawbacks, we focused on the ultimate effects of droughts and farming system history on the soil’s capacity to supply N from organic fertilizers to the crop plant. We did so by presenting data associated with plant growth and the plants’ stable isotope signature as an indicator for net N mineralization. We further proposed how microbes related to the N cycle can be studied in future experiments to improve our understanding of the mechanisms that may underlie a possible interaction between farming systems and drought. Moreover, we presented the set-up of the field experiment in detail and proposed improvements to guide future experiments on this important research topic.
2. Materials and Methods
2.1. Site Description
The study was conducted in 2018 in the DOK (bio-dynamic (D), organic (O), konventionell (K) (conventional)) farming system comparison trial (Therwil, Switzerland, 47°30′09.3″ N 7°32′21.5″ E; 300 m above sea level). The DOK trial started in 1978 and compares organic and conventional farming systems under identical seven-year crop rotations. The soil is a Haplic Luvisol on deep sediments of loess; the past five-year average temperature in the DOK trial was 10.5 °C (
https://www.bodenmessnetz.ch/messwerte/datenabfrage; data retrieved on 1 August 2019). A detailed description of the DOK experiment can be found elsewhere [
20,
21]. The winter wheat (
Triticum aestivum L. cv. “Wiwa”) plots of the biodynamically and conventionally managed farming systems (hereafter called “factor system”), with potato as the preceding crop, were used for the study. The management in the biodynamic farming system (hereafter called BioDyn) follows the concept of “Demeter” food production (
https://demeter.ch/). This type of farming extends practices of the organic farming system; as in organic farming, it relies exclusively on organic fertilizers such as slurry and composted animal manure and uses only biological pest control agents and mechanical forms of weed control. Additionally, biodynamic preparations are applied to soils, plants and compost. The conventional farming system (hereafter called ConMin) of the DOK trial is fertilized with synthetic mineral products following the Swiss guidelines [
22]. Plant protection in the ConMin system is carried out with insecticides, herbicides and fungicides, according to threshold values and the concept of integrated production systems (IP-SUISSE).
2.2. Set-Up of the Field Experiment
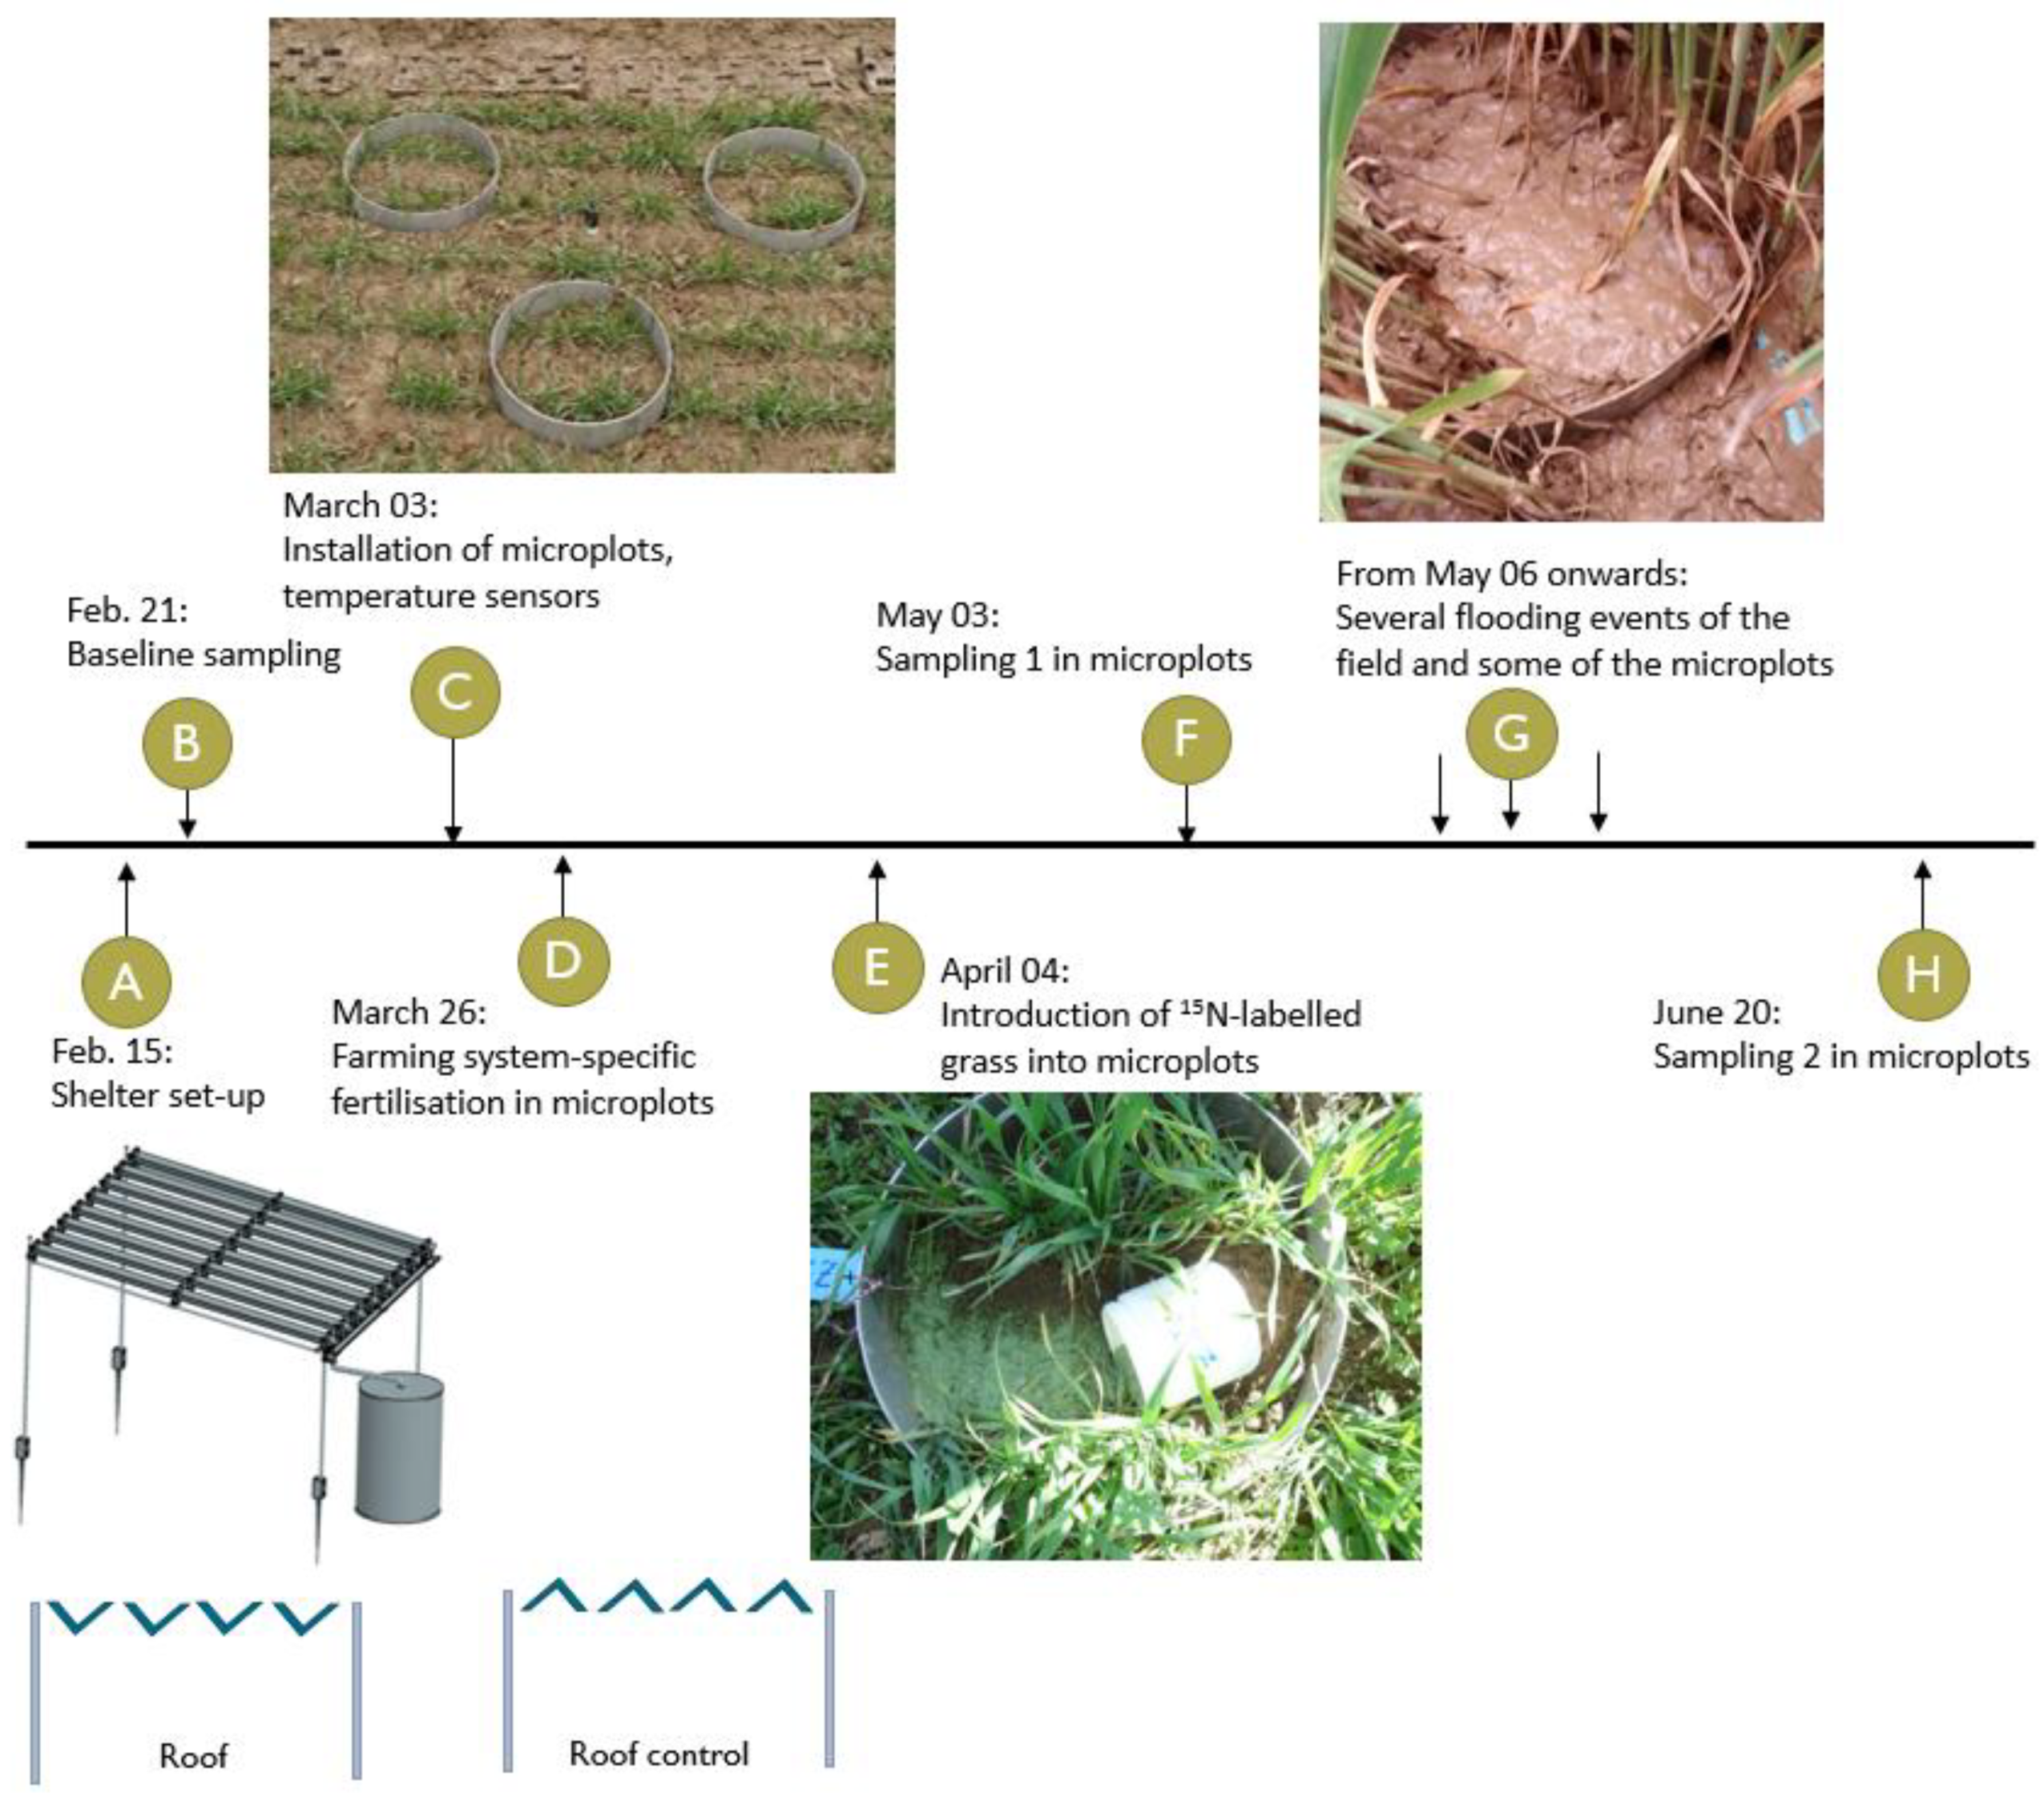
Within the four replicate field plots (5 m × 20 m in size) per farming system, we established two drought subplots (hereafter called factor “drought”) resulting in 16 experimental subplots (four replicated plots in two farming systems with two drought treatment subplots each). The two levels of the drought treatment were (i) a fixed location, a partial rainout shelter (hereafter called “roof”), which reduced precipitation by around 80%, and (ii) a control rainout shelter (hereafter called “roof control”), which did not actively intercept precipitation levels but had the same side effects on the microclimate as the roof. A detailed description of the rainout shelters has been published previously [
19]. In brief, the rainout shelters were 1.3 m high and covered an area of 6.25 m
2; highly UV-transparent V-shaped acrylic glass panels created a cover, with small spaces between the panels. The panels gullied a part of the rainfall via a rain gutter system into barrels. The panels were turned over for the rainout shelter control, allowing the precipitation to fall onto the soil.
Once the soil was completely thawed in March 2018, under each of the 16 drought subplots, three microplots in the form of metal cylinders (diameter: 40 cm, height: 20 cm) were driven into the soil to a depth of 16 cm. Wheat plants in each microplot were counted, and, if needed, more plants were transplanted from outside to obtain comparable numbers across the microplots. Since the site had a small slope (3–5% in a north-south direction), metal barriers were inserted into the soil outside of each roof subplot to prevent heavy rainfall from flooding the experiment. Compared to earlier studies [
19], we used more acrylic glass panels on our rainout shelter constructions (15 vs. 12 panels). Therefore, we again assessed the shelter artefacts on the temperature above- and belowground. Temperature loggers (iButtons DS1922L/T/E/S, accuracy: 0.0625 °C, one record/h) were installed in a subset of drought subplots (at +1.2 m and −0.1 m height; for each height, three iButtons were installed in the roof and roof control subplots, respectively), microplots (−0.1 m height; three iButtons were installed in the roof and roof control microplot, respectively) and the open field (+1.2 m and −0.1 m height; for each height, three iButtons were installed in three different field plots), allowing us to assess the shelter artefacts and measure the effects of the metal cylinders on the soil temperature. When heavy rainfalls were forecasted, wind protection nets, such as those used in open barns, were mounted on the roofs’ prevailing weather sides. Daily precipitation levels were recorded from the on-field meteorological station (Campbell-CR1000) or the nearby back-up station (Biel-Benken, CH).
At the end of March, values of mineral N (Nmin) were higher in the BioDyn system (31 kg N/ha) than in the ConMin system (17 kg N/ha). Therefore, we fertilized the microplots with fertilizers specific to the farming system, adjusting the N supply to compensate for differences in the Nmin content. We applied manure compost (6 t/ha) and slurry (20 m3/ha) to the BioDyn system and ammonium nitrate with sulfur (220 kg/ha) to the ConMin system. Since the slurry application added additional water to the BioDyn system, we applied the corresponding volume of water to the ConMin microplots.
At the beginning of April, the top five centimeters of soil were carefully removed from each microplot, and 37g of dried and milled 15N-labeled ryegrass shoots (0.75-mm particle size, 13.17 atom% 15N, N: 3.54%, C: 40.6%, C/N: 11.45, 142 kg N/ha) was evenly spread and covered again with soil. The 15N-labeled ryegrass was previously produced in the greenhouse by applying 15N-enriched inorganic N fertilizer. The introduction of the labeled plant material marked the beginning of the experiment. Throughout the experiment, we pulled out any weed emerging in the microplots and left it on the soil surface.
2.3. Sampling Dates
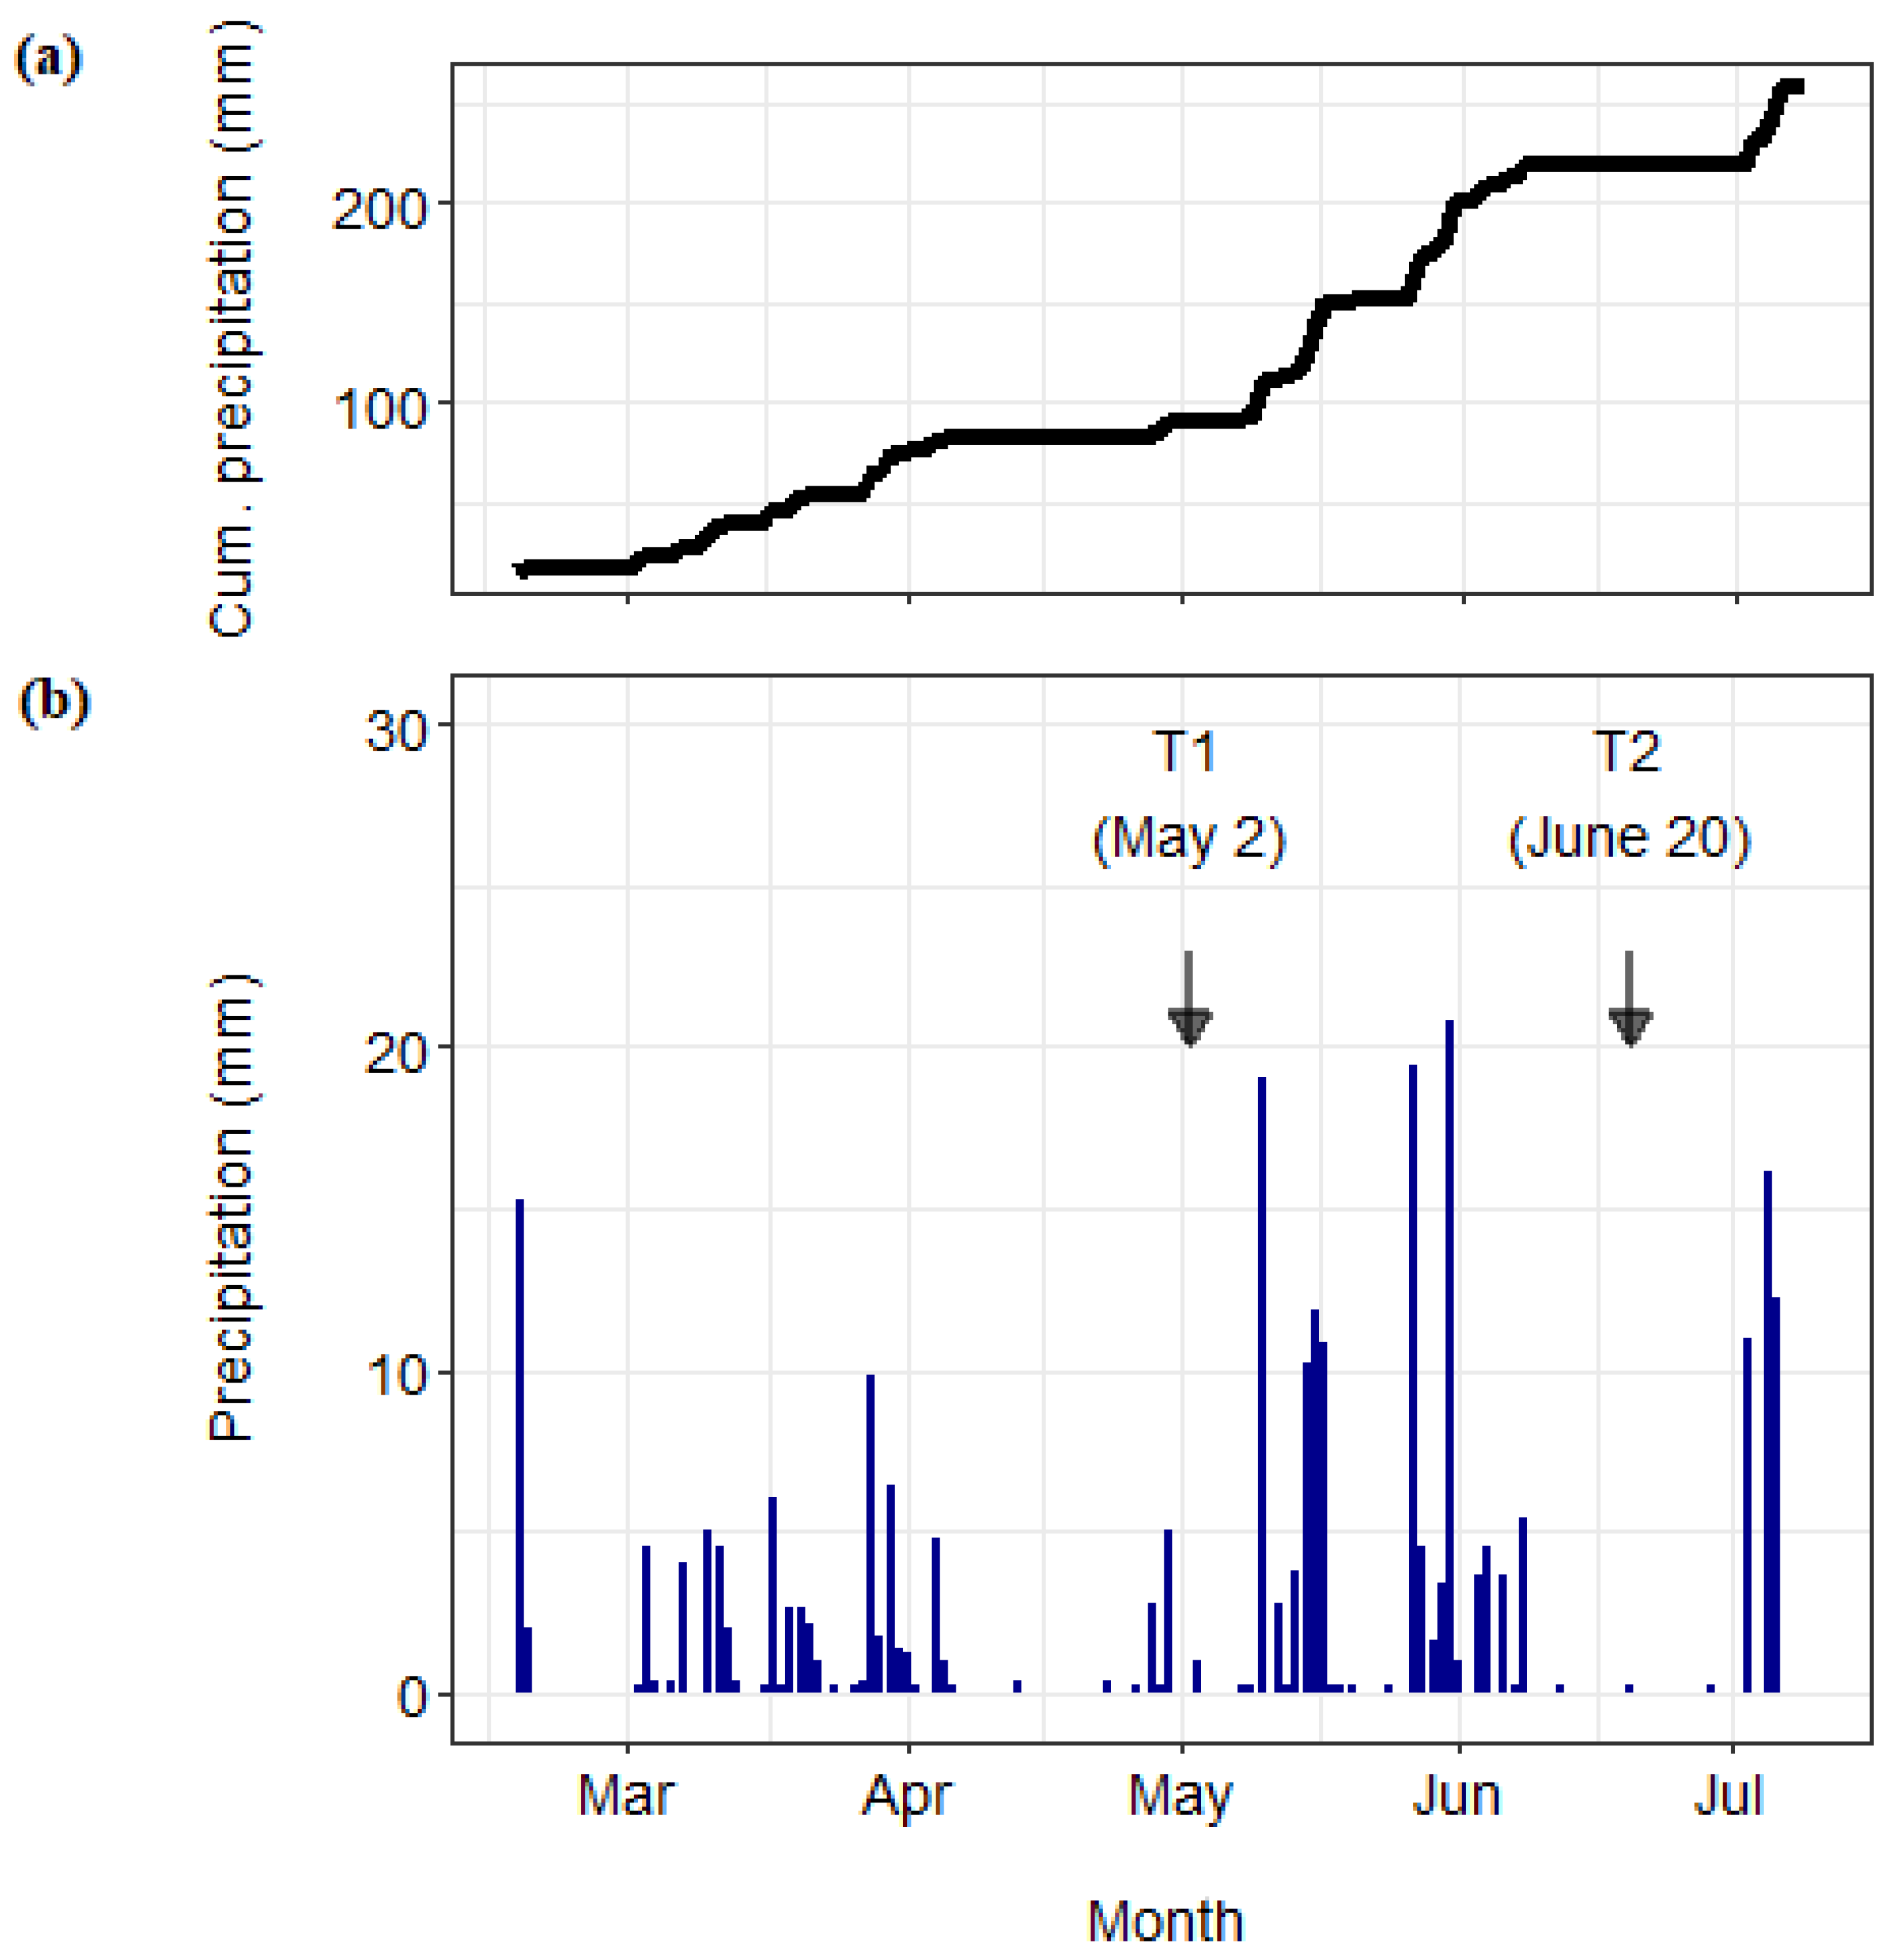
Shortly after setting up the rainout shelters, a baseline sampling (T0) was conducted to assess the soil characteristics at the study site. Two more sampling campaigns (hereafter referred to as “sampling”) were conducted during the experiment. At the beginning of May, 28 days after introducing the labeled material, one microplot per drought subplot was harvested (T1 sampling). After T1, the experimental site was unintentionally flooded several times, and the timing of the subsequent sampling dates had to be adjusted. Initially, three sampling dates were planned, corresponding to crucial growth stages of winter wheat (tillering, flowering and grain ripening). However, it was too wet for the sampling when plants were at the flowering stage (
Figure S1). It was June when the second sampling (T2, 76 days after introducing the labeled material) was finally possible. Since T2 was already close to the end of the growing season of winter wheat, we cancelled the planned last sampling (T3). A timeline for the field experiment summarizing the set-up stages, flooding events and sampling dates is provided in
Figure 1.
2.4. Sampling Procedure
At the baseline (T0) sampling, undisturbed ring samples from 0–10-cm depths were taken, along with disturbed soil samples from the top 10 cm of soil in areas close to, but outside of, the drought subplots. In these samples, the essential soil characteristics were assessed, including the water-holding capacity (WHC), bulk density, soil pH, total soil carbon and total soil N. On the main sampling dates (T1 and T2), aboveground biomass was harvested by cutting the plants 5 cm above the soil surface. Using a soil corer (d = 5 cm), samples were then taken on and between wheat rows from the top 10 cm of soil in which the root biomass and soil water content (SWC) were measured. To assess the natural abundance of 15N, shoot and root samples were taken once (T1) in areas outside of the drought subplots (shelters). All samples were stored in cooling boxes and transferred to the lab for further processing, as described in the following sections.
2.5. Plant- and Soil-Related Analyses
Maximum WHC and soil bulk density were assessed in the undisturbed volumetric ring samples; the chemical analyses were done on dried and sieved (2 mm) soil. Soil pH was measured in water at a soil-to-water ratio of 1:2.5 (20 g of soil in 50 mL of demineralized water). Total soil C (Ctot) and total N (Ntot) were analyzed on an Elementar Vario Max Cube (Elementar Analysensysteme GmbH, Langenselbold, Germany). As the soil at the site was almost entirely free of carbonates, Ctot equaled the organic carbon. Volumetric SWC was obtained from drying (105 °C) field-moist soil to a constant weight and considering the soil bulk density. Soil water content was related to the plant-available water content by calculating the field capacity and the wilting point of the soil following Eckelmann et al. [
23].
Fresh root samples were washed over a 1-mm sieve, and adherent organic material was removed by hand using forceps. Aboveground wheat biomass was cut into small pieces, and all plant material was dried at 60 °C to constant weight before weighing the biomass.
To determine C, N and 15N content in root and shoot tissues, two mg of dried and ball-milled material were weighed in tin capsules (5.0 × 9.0 mm). Two technical replicates per sample were analyzed at the Georg-August-Universität Göttingen in the Kompetenzzentrum Stabile Isotope (KOSI) on an Isotope Mass Spectrometer (Delta C, Finnigan MAT, Bremen, Germany) coupled to an Elemental Analyzer (NA1108, Fisons Instruments, Rodano, Milano, Italy). Plant N content was calculated separately for root (NRoot) and shoot tissues (NShoot), taking into account root and shoot dry weights and N concentrations. Total plant N content (NtotPlant) was then calculated per microplot as the sum of NShoot and NRoot.
Total N that accumulated in the plant—which was derived from the applied fertilizer N (Ndff)—was calculated using the principles originally described by Hauk and Bremner [
24] (Equation (1)).
where
15N
ex in the shoot and root biomass samples corresponds to atom%
15N excess in shoot and root biomass samples, respectively, and
15N
ex fertilizer corresponds to atom%
15N excess of the labeled, applied fertilizer (ryegrass). The atom%
15N
ex represents the abundance of
15N in a sample after
15N natural abundance is subtracted from its reference sample.
N derived from soil (Ndfs) was calculated according to Equation (2):
The total recovery of N in plants from the fertilizer applied (REC%) is a direct measure of the effective N uptake from fertilization and only considers N from the labeled fertilizers. REC% was calculated according to Equation (3):
where N
input is the amount of N applied as fertilizer (g/microplot).
2.6. Statistical Analyses
RStudio [
25], a development environment for
R version
3.6.1 [
26], was used to analyze the data; graphs were created in the R package
ggplot2 [
27]. Multilevel Bayesian regression models were performed using Stan’s probabilistic programming language [
28] through the R package
brms [
29] to assess the effect of the farming system and the experimental drought on the soil- and plant-related data. Although data from the second sampling have to be interpreted with caution, they were considered in the analyses. However, at T2, we removed one roof control microplot in the BioDyn system, since it had an extremely high SWC, exceeding the average SWC in the other microplots on this sampling date by a factor of almost 2.3. The models applied to this dataset included the main experimental factors (system, drought and sampling) with all interactions as fixed effects. To account for the paired design of the DOK experiment (field plot was grouped into four blocks) and repeated measurements on the drought subplot level, the random part of the model consisted of a drought subplot nested in a field plot nested in a field block. The posterior probability distribution was then simulated using fifteen thousand effective samples for each parameter, with the prior weakly informative defaults of
brms. After assessing the sampling quality and model fit with
shinystan [
30], the posterior probability distribution of the model parameters was used to obtain median values and differences between the selected factor levels, together with their 95% credible intervals (CrIs), using the 97.5% and 2.5% quantiles as the upper and lower limits. In the following, we treat an effect as relevant if the 95% CrI of an effect does not include zero, and we talk about marginal effects if the 90% CrI excludes zero. The results of the data analyses are presented primarily in graphical forms showing the affected plot with the estimates for the model parameters together with selected treatment comparisons.
4. Discussion
Unintended flooding events followed by harsh, naturally occurring droughts severely affected our field study after the first sampling date. We reiterate that interpretation of the data from the second sampling must acknowledge the difficulties of this field experiment and, thus, needs to be evaluated cautiously. Nevertheless, we believe that the data collected, the underlying research question, the set-up and the lessons learned from this study may be of interest for future experiments. Here, we discuss the insights gained and lessons learned to improve the set-up before closing with suggestions for future experiments.
4.1. Shelter Artefacts on Soil and Air Temperature
Fixed-location rainout shelters inevitably impact the microclimate, including soil and air temperature. Overall, however, the artefacts of our rainout shelter design on the microclimate can be considered small [
19]. The temperature differences recorded above- and belowground in the current study resembled those of an earlier study, even though, in the current study, we used more interception panels (
n = 15 compared to
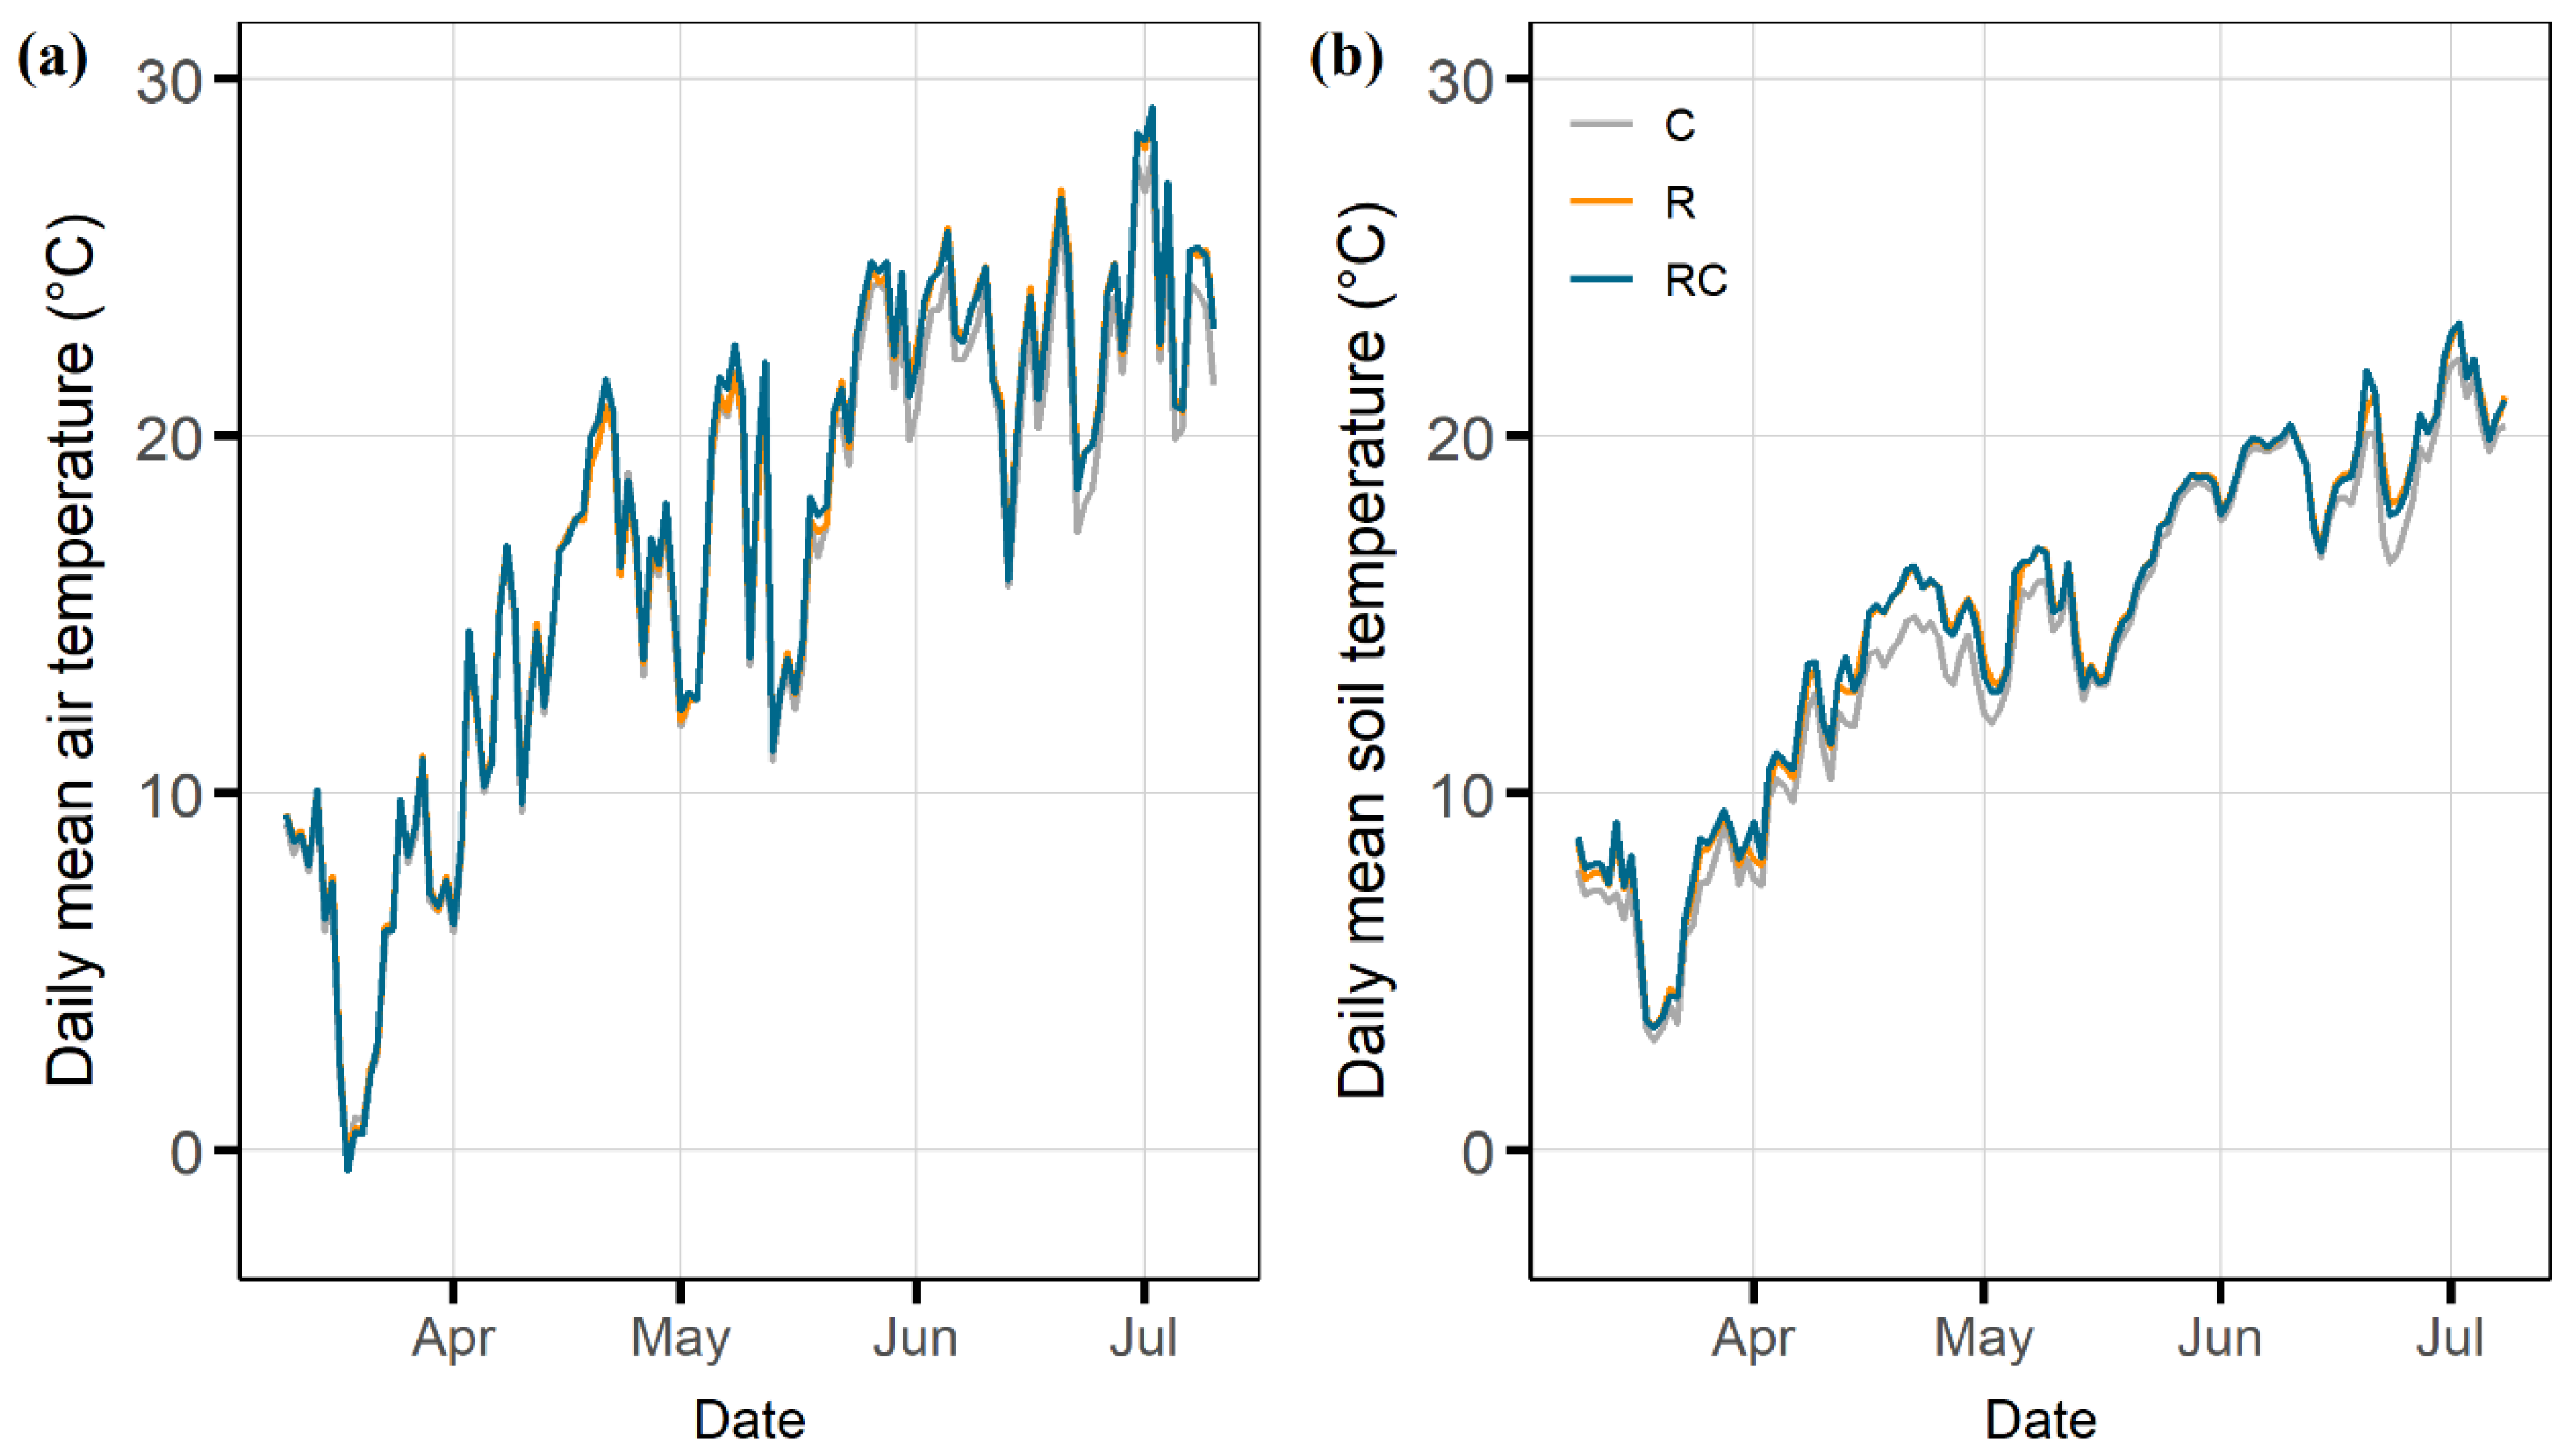
n = 12 in earlier studies). The only artefact of the roofs we found was a transient increase in soil temperature (
Figure 2b). This result highlights the usefulness of including a roof control treatment, which allows the effects of drought to be studied under identical microclimatic conditions.
4.2. A Drought Experiment under Extreme Weather Conditions: Challenges and Recommendations for Future Experimental Set-Ups
Massive thunderstorms led to high local rainfall, most of which arrived within a very short time [
31]. Several roads in the vicinity of the DOK experiment had to be temporarily closed due to flooding. The extremely wet spring was followed by an extremely hot summer, the third in short succession (2003, 2015 and 2017). Temperatures well above average—15.3 degrees nationwide—set the season well apart from the norm, and the summer half-year was warmer than any since measurements began in 1864 [
32].
During the flooding phase in spring, we tried to protect the experimental plots from lateral rainfall through wind protection nets and from surface water through sheet metal soil barriers. However, these measures were not sufficient, and water inundated several microplots of our experiment. The loess soil in the DOK is characterized by a relatively low infiltration capacity and may have contributed to the fact that these precipitation events had such profound effects. At sites with similar soil conditions and under similarly difficult weather conditions, in addition to the measures already taken, reducing the insertion depth of the metal cylinders (microplots) and, thus, raising the edge above the ground would provide additional protection.
Due to the natural drought in the second phase of the experiment, the additional reduction in precipitation levels achieved by the rainout shelters resulted in only small SWC differences. Reducing the SWC in dry soils may create fundamental shifts in the water potential [
6], significantly impacting the soil function. Although the experimental drought affected the plant N, Ndff, and Ndfs, these effects were mostly small. Maintaining more substantial differences in the SWC between the roof and the roof control would likely have increased the measured effects. Therefore, when working with passive rainout shelters, the SWC in the control plots must be monitored closely, especially in times of natural droughts; if critical, the controls can be watered, as has been suggested previously [
33]. The watering regime (amount and timing) of the control plots needs careful planning and depends on the crop and soil type and seasonal precipitation norms. In our study, we refrained from irrigating the controls, because (i) the SWC had already been drastically altered before, and (ii) we were forced to shift the second sampling date close to the time of harvest for winter wheat; irrigation at a time when the soil is supposed to be dry, to deliver high-quality yields, did not seem appropriate.
4.3. Soil Water Conditions
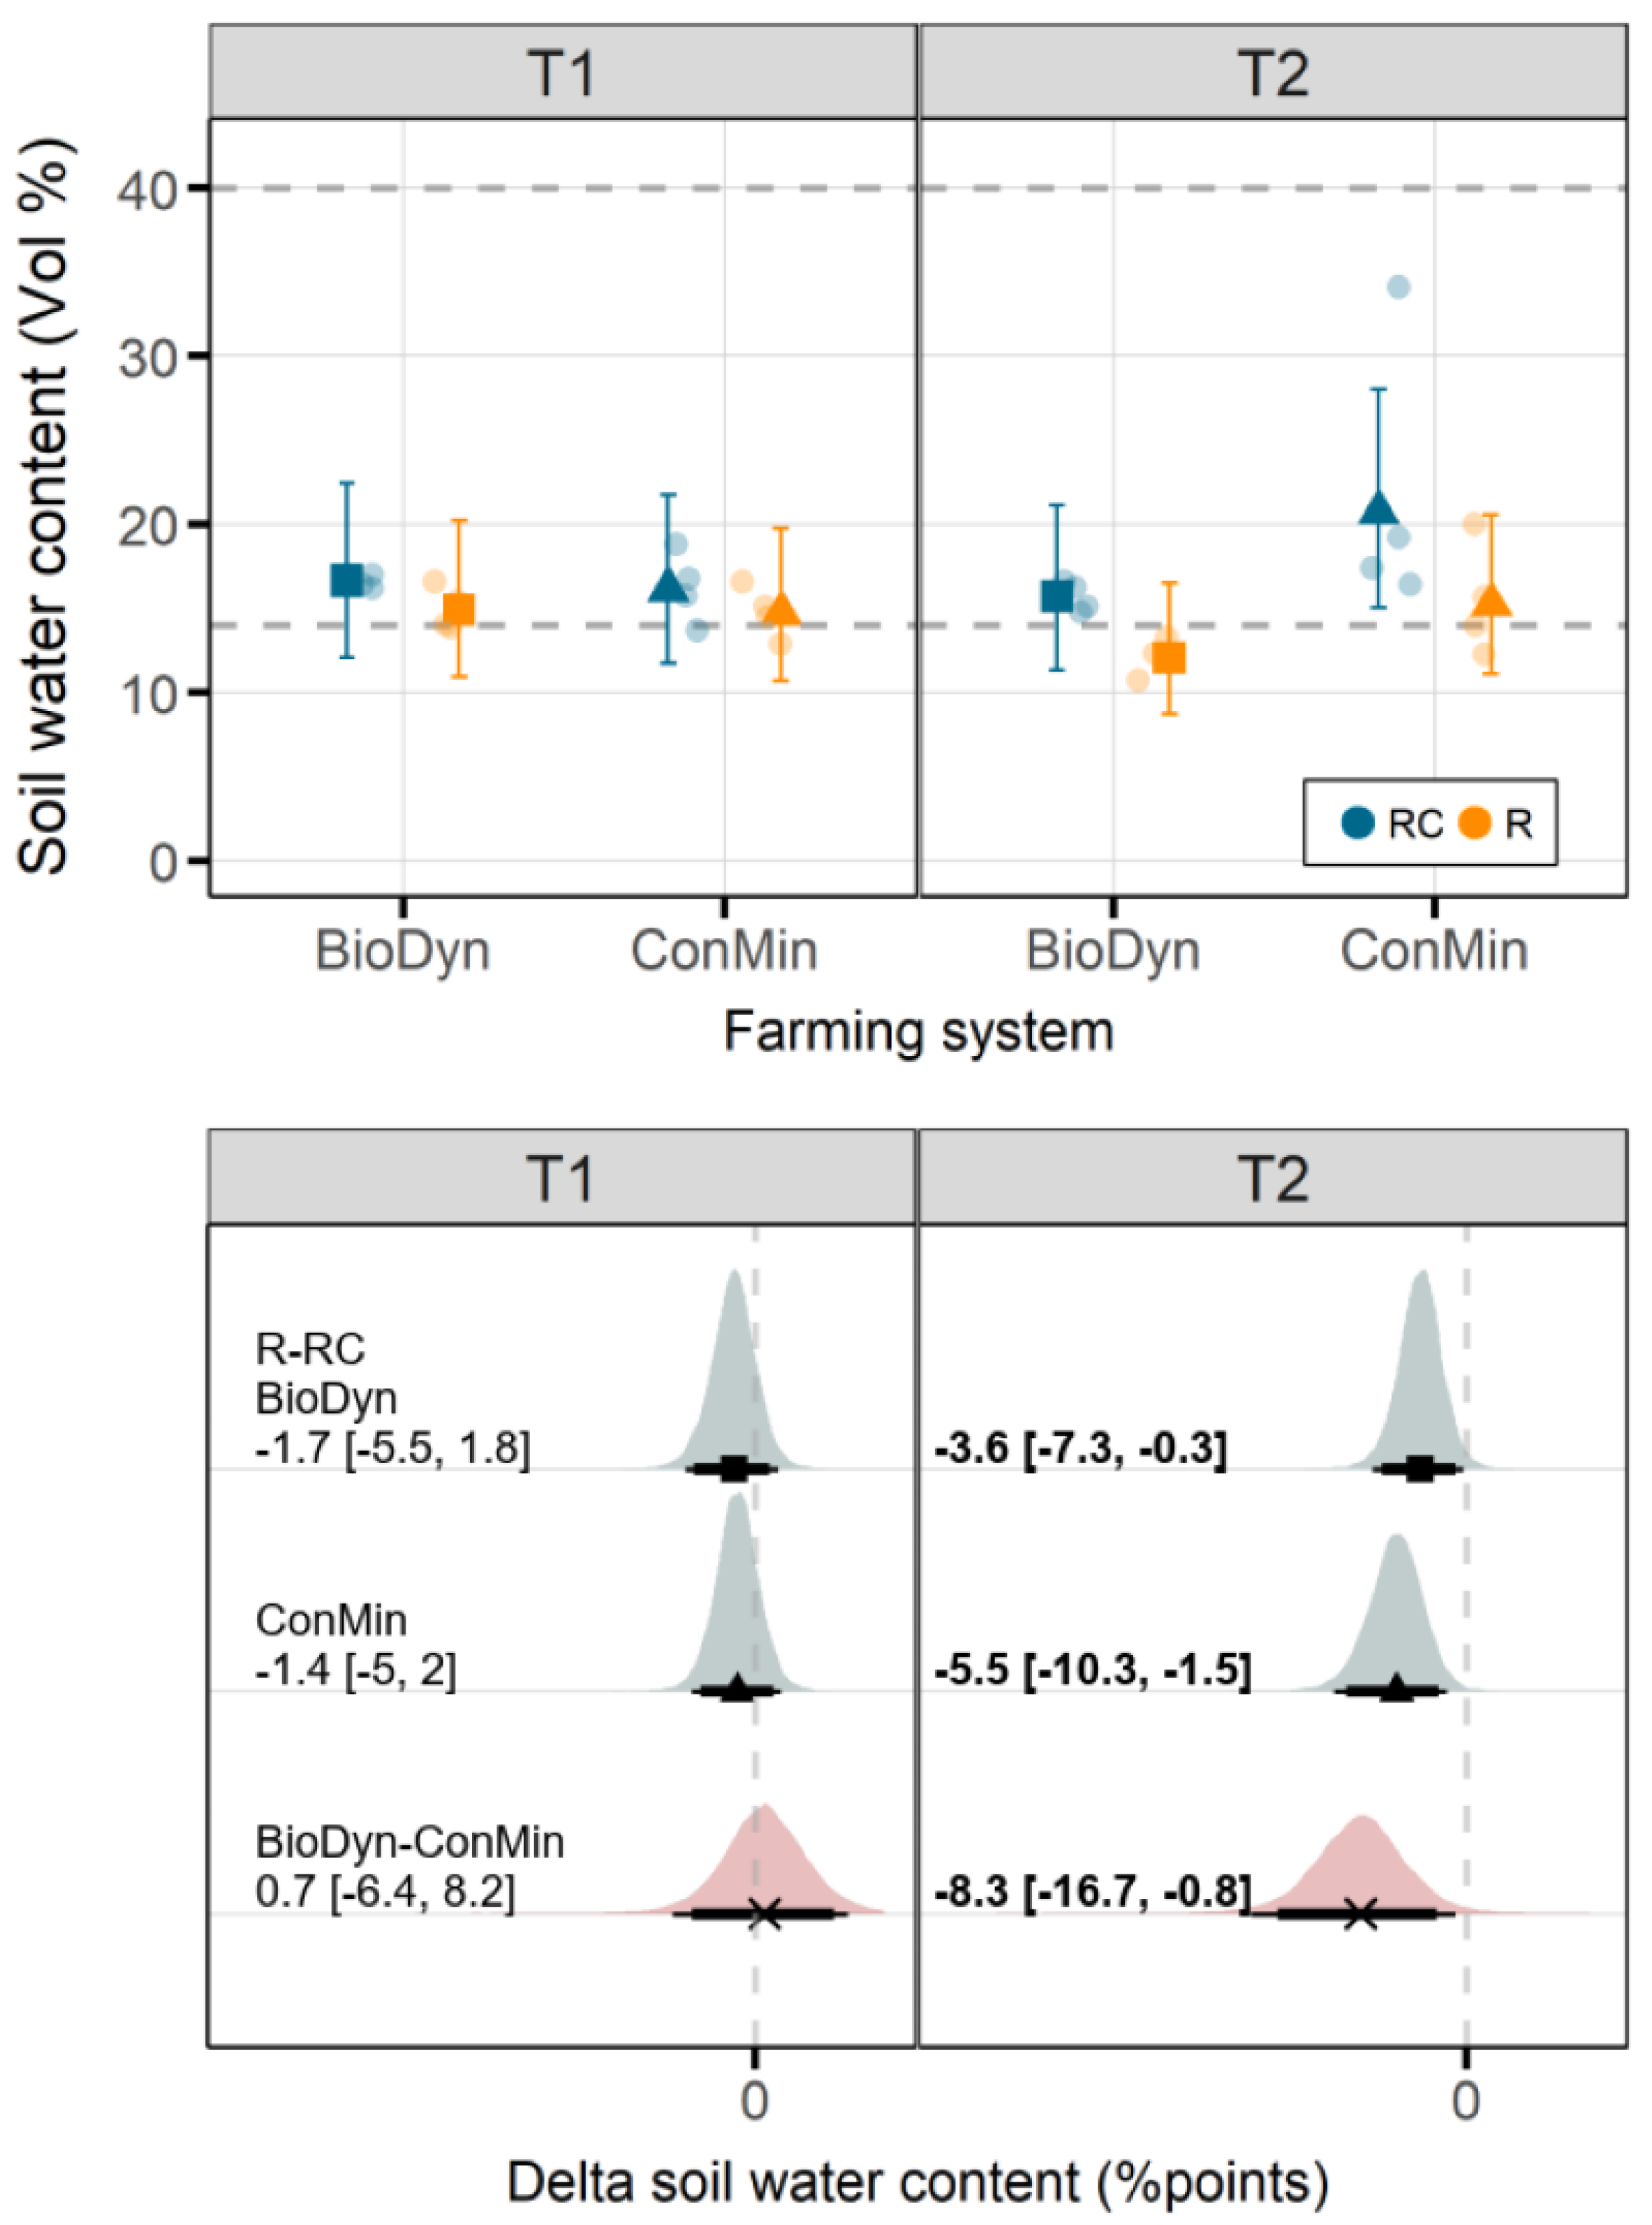
On T1, the differences in the SWC between the drought treatments were small, regardless of the farming system. On T2, the values of the SWC were higher in the ConMin compared to the BioDyn farming system. However, after the spring floods and the water inflow from the irrigation system of the neighboring farm, the differences in the SWC between the farming systems could no longer be attributed with certainty to properties of the farming systems. Accordingly, in the following, we focus primarily on the first sampling date, and we refrain entirely from discussing farming system x drought interactions on the second sampling date.
4.4. Effects of Drought and Farming System on Plant and N-Related Processes
Drought may reduce wheat yield levels, especially when it cooccurs with heat [
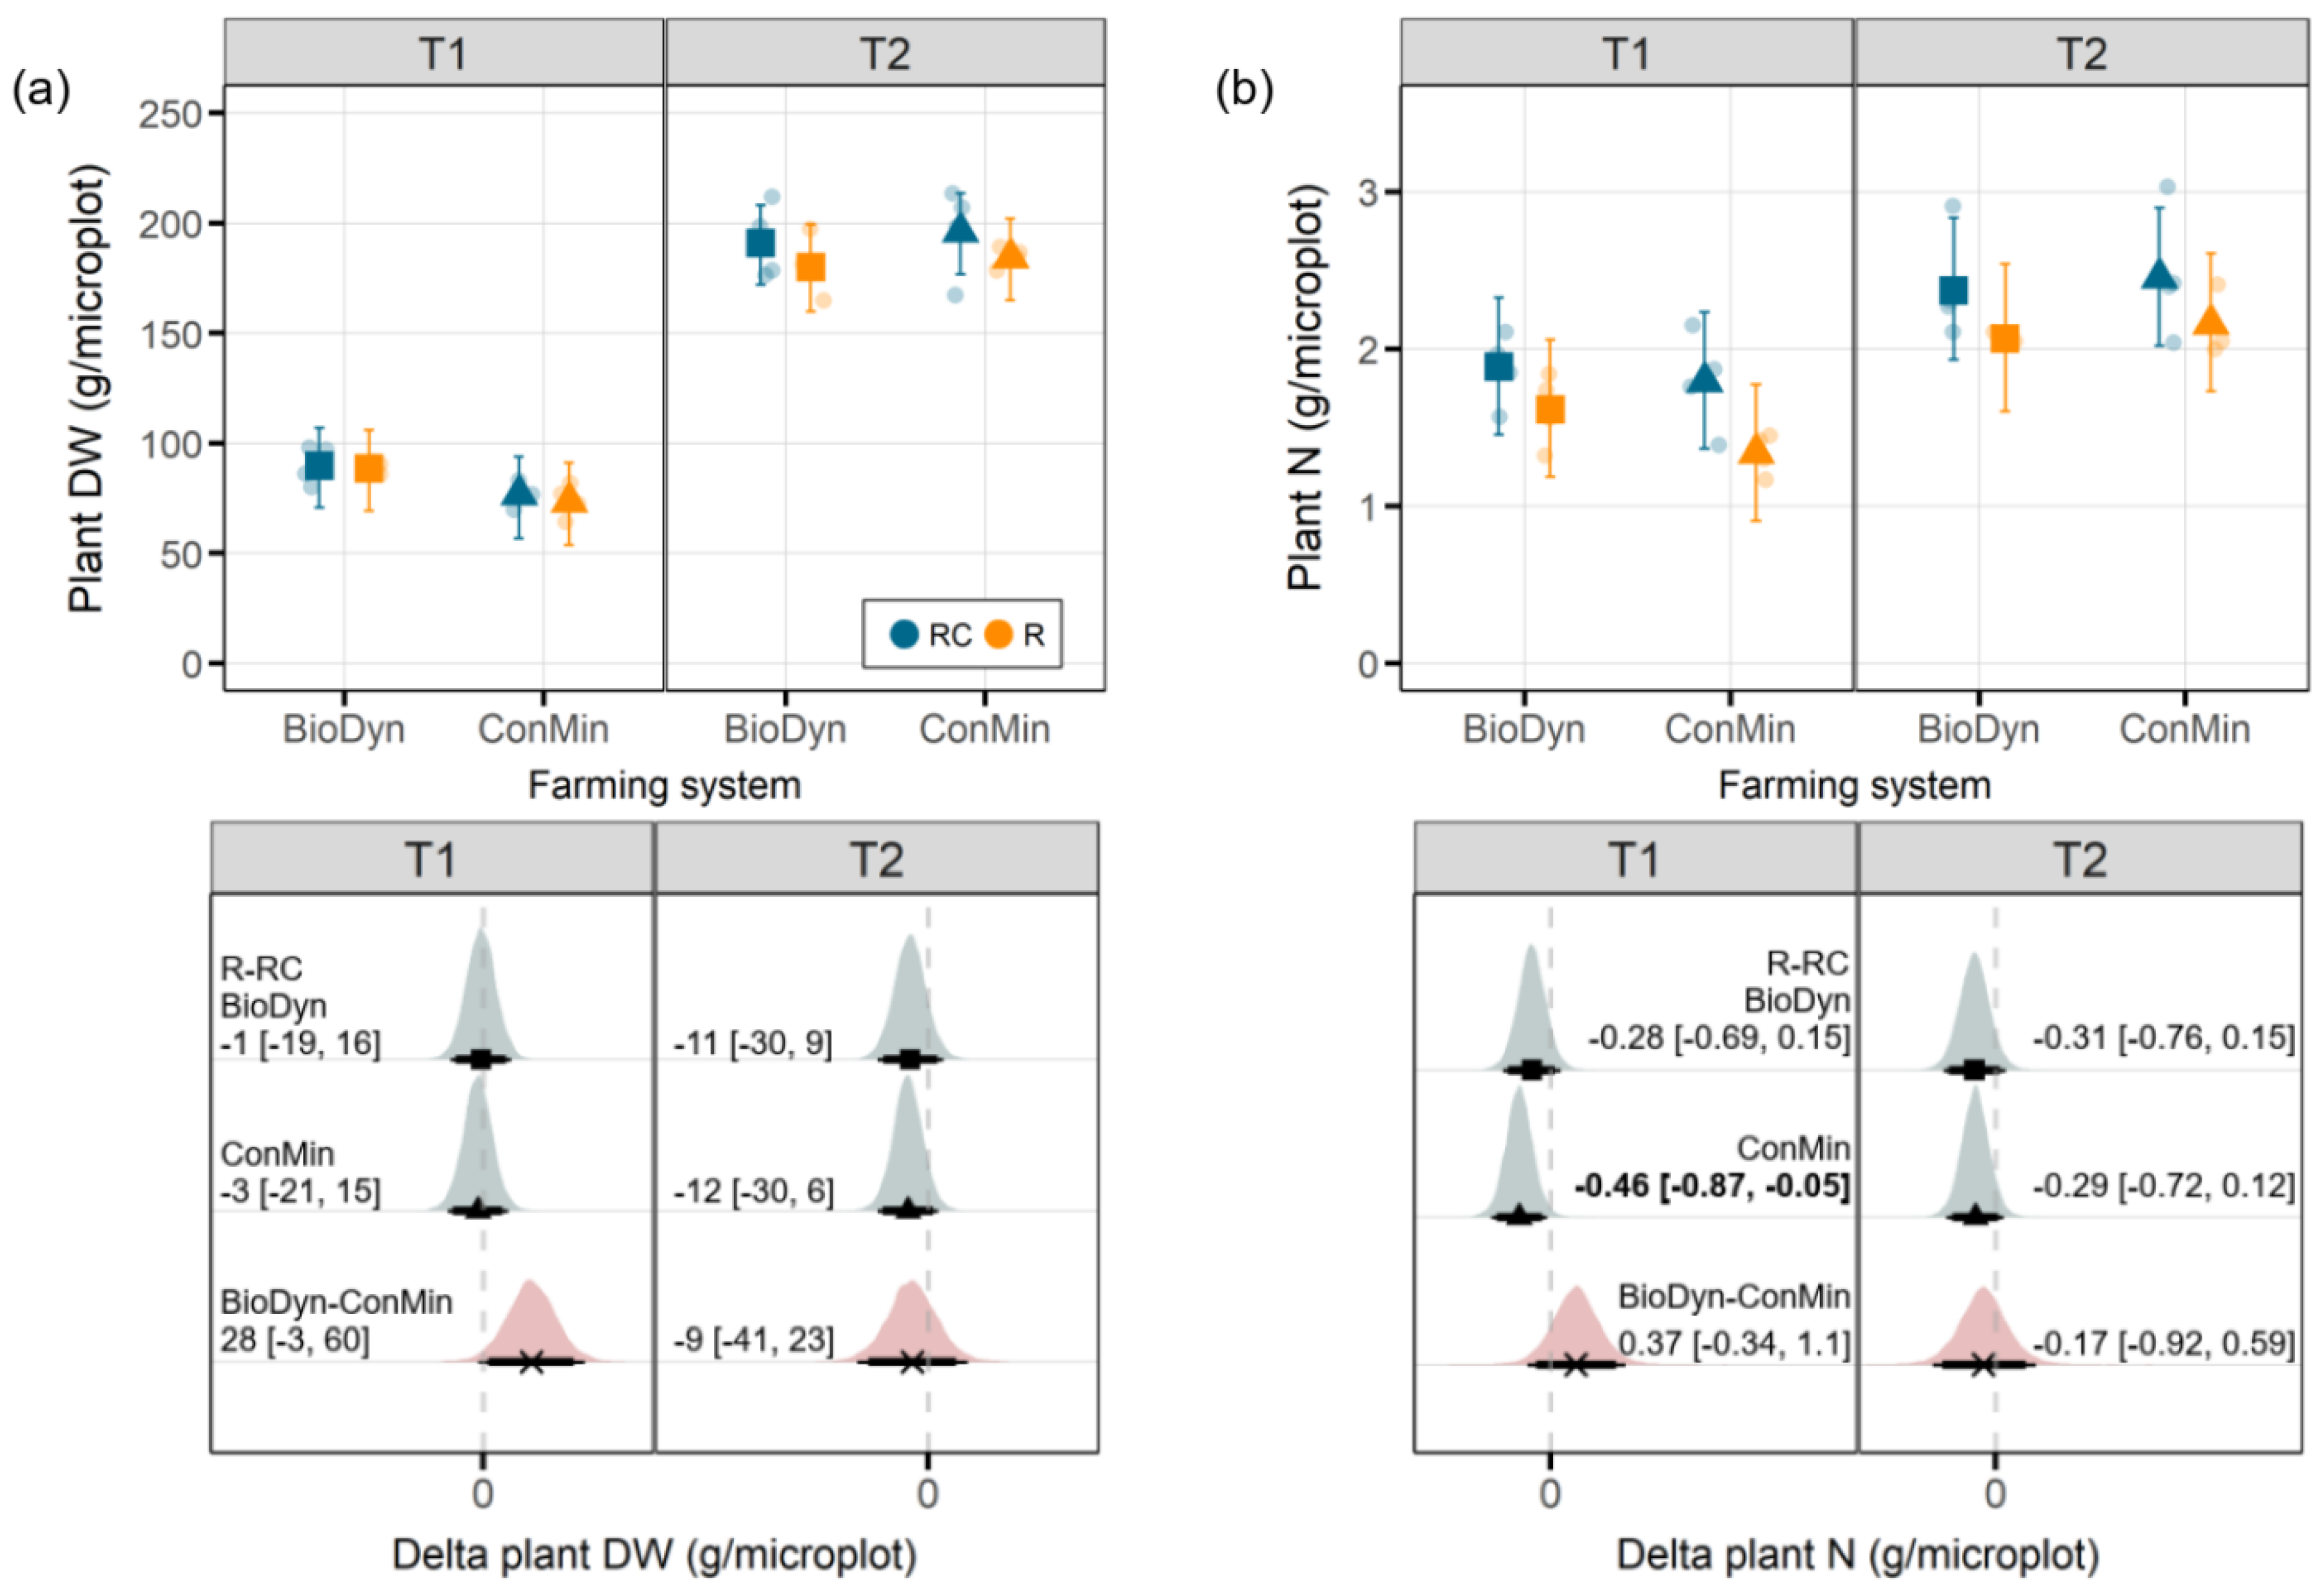
34]. In our study, we assessed the plant biomass production, which, in both farming systems, remained mostly unaffected by the experimental drought. The absence of an intense drought effect on the plant biomass production may be linked to small differences in the SWC between the drought treatment levels. Although, on T2, the differences in the SWC between the drought treatment levels were more pronounced, the drought was interrupted by massive precipitation events (between T1 and T2), and the plants likely already produced an extensive root system allowing them to access water from deeper soil layers.
The total plant N content, which is correlated with the final quality of grain yields [
35], was reduced under the experimental drought. However, on T1, apparent effects were observed only in the ConMin system, not in the BioDyn system. A reduction in plant N contents in response to short-term droughts was also found in a meta-analysis [
36]. Lower plant N contents under drought conditions may be linked to reduced N mobility, lower N diffusion rates and less mass flow in dry soils [
37]. These processes may restrict the access of roots to mineral N pools, resulting in lower N uptake rates [
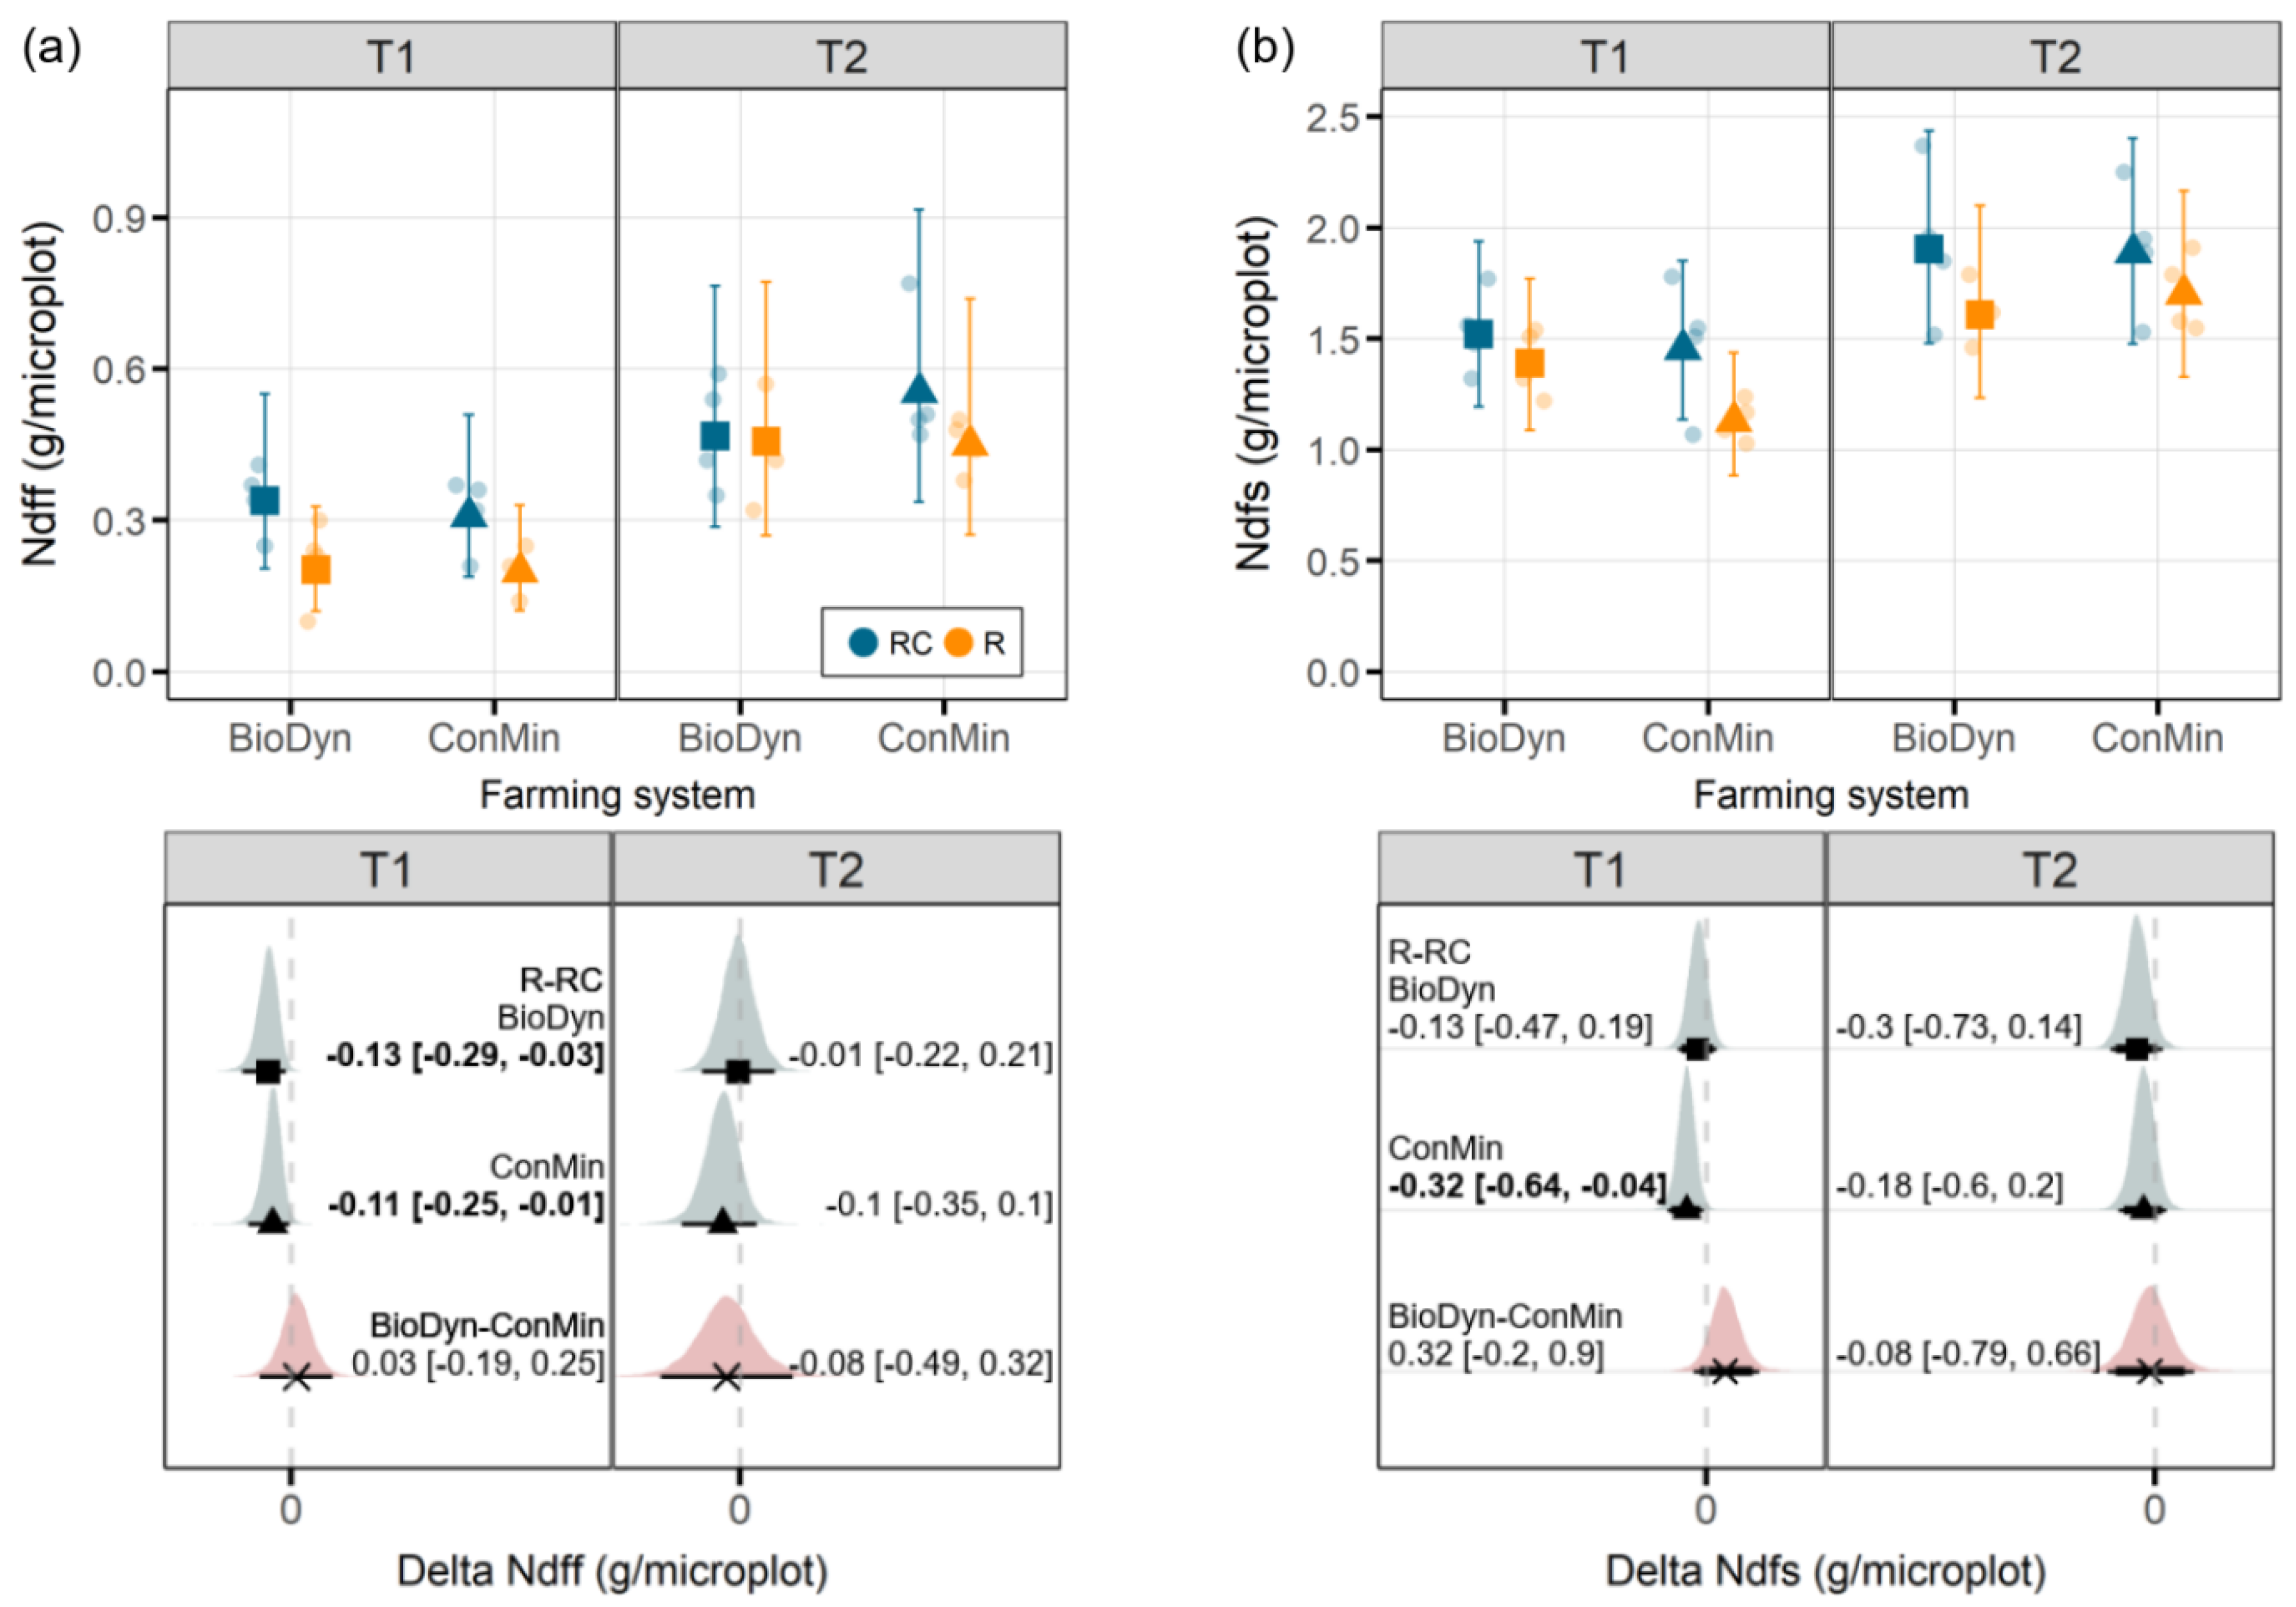
36]. Reduced N mobility in dry soils may also explain the lower Ndff values we observed on T1 in both agricultural systems under drought conditions. On T1, we further found reduced Ndfs values under drought conditions in the ConMin system but not in the BioDyn system. In a previous drought experiment at the same site and with the same crop, we found up to three times more arbuscular mycorrhizal fungi (AMF) under drought conditions in the biodynamic compared to the conventional farming system [
38]. Assuming that similar AMF abundance patterns also characterized the current experiment, we can speculate that plants in the BioDyn system under drought conditions profited from the fungal-mediated transport of N [
39]. In contrast, plants in the ConMin system may have relied mainly on the soil N present in the rooting zone. Such potential differences in AMF abundance may explain why the experimental drought reduced the plant N and Ndfs in the ConMin system but not in the BioDyn system. However, we stress the speculative nature of this explanation, emphasizing that the actual contribution of AMF to the plant N acquisition is hard to quantify [
39] and suggest that the patterns observed may change if investigated at a later stage in the growing season. The absence of a drought effect on the Ndfs in the BioDyn system may further be linked to the higher Ntot values in the BioDyn compared to the ConMin system and, thus, the additional N mineralization from the soil N pool and higher plant N supply prior to the drought.
One of the experiment’s objectives was to explore potential interactions between the farming systems and the experimental drought on the Ndff. Using soils from organic and conventional plots of the DOK trial in a pot experiment and mimicking severe drought conditions, Lori et al. [
17] found higher plant N derived from organic fertilizers in plants grown in soils obtained from an organically managed field compared to a conventionally managed field. Although, in our study, the Ndff on T1 was negatively affected by drought in both farming systems, we did not find a farming system x drought interaction on the Ndff. The absence of an interaction between the farming system and drought on the Ndff in our study may (i) indicate that the farming system plays no significant role in plant N provisioning from organic sources under drought conditions or it may (ii) have been too early in the season for an effect to emerge. At the beginning of the experiment, some of the N incorporated into the plant biomass was probably directly available to plants without undergoing mineralization beforehand. Such plant-available N forms can derive from, e.g., nitrate and small N-containing molecules present in the vacuoles of the plant-based fertilizer that readily hydrolyze or get taken up directly. This assumption is further supported by the N recovery rates in our study (20% at T1 and up to 38% at T2), which seem high compared with those from a previous field experiment in the DOK trial; Bosshard et al. [
18] reported N recovery rates from the application of
15N-labeled sheep manure of 15% after the first growing season. The plant-available fraction of N from the ryegrass could have obscured our ability to detect potential differences in N mineralization and N provisioning between farming systems in the early stages of the experiment. Thus, in future experiments, the mineral N and soluble organic N in the labeled organic material should be determined beforehand.
In summary, our data indicated that the processes related to N turnover and N supply to plants are sensitive to drought and may further be influenced by the farming system. Insights into the underlying mechanisms remain to be explored. In particular, more detailed information on the effects of drought and the agricultural system on microorganisms related to the N cycle and the fate of 15N in mineral N forms and microbes will help us to understand these processes better.
4.5. The Concept of Drought
Here, we measured the SWC in the top 10 cm of the soil profile, because we initially focused on N-cycling microbes, assuming that a topsoil drought would be a relevant stressor. The concept of drought from the perspective of the plants may need to be redefined in future studies. At maturity, 60% of the root system is within 300 mm of the crown, but the vertical root length of wheat can easily reach down to 1 m [
35]; thus, the plant may access water from deep soil layers. The first inspections of the soil profile in the DOK trial did not reveal any structures impeding root development in the uppermost 3 m (Markus Steffens, personal communication). A crop plant more shallowly rooted than wheat may be preferred in future studies and a study site with a low groundwater table. Future studies should also monitor the SWC at high spatial and temporal resolutions. To avoid destructive sampling to determine the SWC between measurement campaigns, soil moisture loggers should be permanently installed at different depths. Ideally, such data should be supplemented with actual measurements of water potentials. Passive rainout shelters depend on a minimum amount of rainfall. However, since the standard rainfall patterns are already changing and one arid summer has been followed by the next one, additional irrigation of the control areas should be considered in future experiments. To separate potential roof artefacts from the pure drought effect, a microplot should also be installed in the open field.
4.6. Potential Additional Analyses
Exploring the effects of climate change on N transformation in an agricultural context is an urgent research need [
40]. Our field experiment is the first to investigate drought effects on plant N provisioning from green manure in organic and conventional farming systems and, thus, in soils with contrasting soil quality. Since torrential rainfall at the beginning of the field study and, later, a general drought fundamentally affected the study, we did not conduct all of the analyses we initially planned; ultimately, the interpretability of the results would have been questionable. However, once acceptable differences in the SWC can be established under field conditions, a more in-depth analysis of the N provisioning potential from organic fertilizer may be carried out. Additional analyses may include the determination of
15N enrichment in different soil N pools, including
15NH
4+,
15NO
3− and microbial
15N [
41], to trace the fate of the organic fertilizer N not recovered in the plant. Several approaches are available to assess the isotopic composition in aqueous samples, including the classical diffusion method [
42,
43] or following Eschenbach et al. [
44].
Proteolysis is the first step of N mineralization from proteinaceous materials [
45], a process that greatly contributes to plant N provisioning from organic fertilizer. During proteolysis, proteins are hydrolyzed into smaller fragments [
45], a process in which extracellular proteolytic enzymes (proteases) secreted by microbes are crucial [
45]. Molecular tools such as quantitative polymerase chain reaction and amplicon-based sequencing allow us to quantify the abundance and diversity of gene regions encoding for extracellular proteases such as alkaline and neutral metallopeptidases, as well as serine peptidases [
46], and to describe the genetic potential of proteolytic communities [
8,
17,
45,
47,
48]. The genetic potential for N mineralization was found to correlate with direct measurements of protease activity [
45,
49,
50], yet not always [
48]. Therefore, direct measurements of the soil extracellular enzyme activity potential should be performed, e.g., by spectrophotometry [
51,
52] or by fluorescence analysis [
53]. It is important to note that diffusion constraints of substrates (e.g., organic N) in dry soils reduce the substrate turnover; this aspect is not adequately reflected in classical protocols, which rely on preparing a soil slurry before a substrate addition. To accurately determine the in-situ activity of soil enzymes in dry soils, adjustments of the classical protocols may be implemented [
54].
We introduced 15N-labeled organic fertilizer to organic and conventional farming systems, since we aimed to explore the role of the known differences in the soil biological quality for plant N supplies from organic fertilizers under drought. In future experiments, the N supply to plants from other organic fertilizer types should also be investigated, e.g., 15N-labelled animal manure, to include a broader range of organic fertilizer types common to both farming systems.


 ,
, 