
Cascade Effect of Nitrogen on Brazilian Soybean Production Chain
by
 , , and
Vanessa Theodoro Rezende
1,* ,
,
Thierry Bonaudo
2 ,
,
Ricardo Barboza Alves
1,
Rafael Araújo Nacimento
1 and
Augusto Hauber Gameiro
1 1
Laboratory of Socioeconomics Analysis and Animal Science, School of Veterinary and Animal Science, University of Sao Paulo, Pirassununga 13635-900, Brazil
2
UMR TETIS, AgroParisTech-Cirad-CNRS-INRAE, 34093 Montpellier, France
*
Author to whom correspondence should be addressed.
Nitrogen 2021, 2(2), 128-138; https://0-doi-org.brum.beds.ac.uk/10.3390/nitrogen2020009
Submission received: 11 March 2021
/
Revised: 27 March 2021
/
Accepted: 29 March 2021
/
Published: 1 April 2021
Abstract
:Soybean is one of the most traded products. Naturally, soy fixes nitrogen through biological symbiosis. Its cultivation transforms natural inert atomic nitrogen into its reactive forms. The advancement of soybean can have environmental impacts, both locally and globally. This study estimated nitrogen flows and their use efficiency in the Brazilian soybean production chain applying material flow analysis. We innovate proposing a new indicator to estimate the “cascade effect of nitrogen” in a framework of 12 years (2007 to 2019). We hypothesized that it is capable to show accumulated nitrogen emissions through the chain. Besides, the method can show the main sources of nitrogen to the environment. The biological fixation was the largest entry. The efficiency in the use of nitrogen was 81% for grain production, and the nitrogen cascade indicator, which represents the ratio of the nitrogen emission in the environment to the total nitrogen available in the product, was only 5.2% in the soybean meal production chain for the year of 2019, with a clear trend of increasing during the period. Thus, Brazil contributes significantly to global nitrogen emissions in the environment since the country is an important producer and player in the world market.
1. Introduction
Nitrogen, despite having provided growth in agricultural and livestock production, is also responsible for adverse effects on the environment with damage to human health and the biodiversity of aquatic and terrestrial ecosystems [1,2,3]. Within the nine planetary boundaries [4], nitrogen, like phosphorus, is already at levels of uncertainty, with great proven losses to the balance of ecosystems [5]. The advancement of food production contributed to the increase in reactive nitrogen emissions to the biosphere, using synthetic fertilizers, biological nitrogen fixation, and management of animal production waste, and burning of fossil fuels [6]. In 2010, the livestock chain contributed approximately 65 Tg of nitrogen to global anthropogenic emissions; these represent 39% of global nitrate emissions, 23% of nitrogen oxide emissions, 60% of ammonia emissions, and 32% of nitrous oxide emissions [7]. Reactive nitrogen means all forms of nitrogen other than gaseous nitrogen (N2), including ammonia, nitrogen oxides, forms of nitrogen loss in waterways, and the nitrogen present in organisms in the form of proteins, amino acids, and other organic forms [3,8]. The increase in reactive nitrogen causes environmental impacts on various scales, local, regional, and worldwide because the amount of reactive nitrogen produced is greater than the capacity of ecosystems to convert it to a non-reactive form. Thus, the excess of nitrogen can then move, transform or accumulate, developing the “cascade effect” of nitrogen [9]. The “cascade effect” represents a dynamic view of the nitrogen cycle, which demonstrates the existing interactions between the evaluated systems and their impacts on the different ecosystems [10]. The cascade also reflects the opening or “linearization” of the nitrogen cycle. An important feature of the cascade is that once it has started, the initial source of reactive nitrogen becomes irrelevant. This is because the forms of reactive nitrogen can convert between them and cause different effects on the atmosphere and terrestrial and aquatic ecosystems [11].
Soy is widely cultivated due to its importance as animal feed (mainly a source of vegetable protein) and the use of its oil for domestic human consumption and the manufacture of biofuels [12]. Brazil is currently the world’s largest producer of soybeans, with 124.8 million tons produced in the 2019/2020 harvest, and is also an important exporter of soybean grains and meal. Between 1977 and 2019, there was an increase in soy production of approximately 12 times and an increase in productivity (per land area) of 2.7 times [13]. This was a consequence of cultivation expansion areas, mainly in the center-west of the country, which has become the region with the highest grain production. In recent years, there has also been an increase in plantations in the Northeast region of the country, which has transformed this region into the new Brazilian agricultural frontier. Due to this expansion, biomes such as the Amazon and the Cerrado suffered impacts and measures such as the “Soy Moratorium” (an agreement between traders and farmers not to grow soy on deforested land) and the “forest code” (the Federal Forest Protection Act) were implemented in an attempt to contain deforestation. In addition to deforestation, soy is also related to land use change in several regions of the country, replacing mainly pasture areas [14].
Changes in land use, deforestation, advances in soy plantations, and the development of agriculture in the country, have contributed to the increase in the anthropogenic use of nitrogen. As an example, biological nitrogen fixation (BNF) in agriculture in 1995 was 3.5 Tg of nitrogen per year in 2002; this value rose to 7.3 Tg per year, representing respectively 70% and 77.6% of the total Brazilian anthropogenic inputs [15]. Therefore, biological fixation represents the largest source of reactive nitrogen in the Brazilian cycle, which thus highlights the importance of soy cultivation in this cycle [15].
Thus, it is necessary to better understand the cascade effect of nitrogen and its consequences for the various ecosystems in which it operates, since this topic is not widely addressed in research and public policies for sustainable development [16]. Current policies have focused on strategies for single elements, without interrelations and connections between the elements and their scales of action [17]. Thus, the objective of this paper is to explore which stages of the Brazilian soybean production cycle have the greatest impact on the nitrogen cycle in addition to estimating the cascade effect of the nitrogen cycle of Brazilian soybeans. For this, the material flow analysis (MFA) methodology [18] was used, with an efficiency indicator for the use of nitrogen [19], and a new indicator was proposed to estimate the cascade effect. With the flows of the Brazilian soy production chain and indicators of nutrient use efficiency and cascade effect of nitrogen, we can answer the question of how much nitrogen this crop needed in all supply chains, and how much of this reactive nitrogen goes to the environment, potentializing impacts on ecosystems. This response can help to improve the management of nutrients and to reduce logistic losses in the soy supply chain in Brazil.
2. Materials and Methods
Data were collected on soybean production in Brazil and its industrial processing into soybean meal in the period from 2007 to 2019. The data were organized into nitrogen inputs and outputs (tons/year), as detailed in Appendix A. Following the MFA methodology, nitrogen balance was carried out in three phases of the production chain: (i) the production of soybean in the field (crop production); (ii) grain storage and trade (cereal unit); and (iii) the production of soybean meal by the processing industry. The balance considered that the nitrogen inputs subtracted by the outputs and stock variation must be equal to zero [19,20].
2.1. Soy Production System Considered in the Model
The technical itinerary for the soybean production used data available at Agribenchmark [21], by the BR1300MT farm, located in the Midwest region of Brazil. This itinerary represents the production system adopted in the Midwest region of Brazil, which is similar to the production systems in the Northeast and North regions of the country, thus representing 58% of the quantity produced by the 2018/2019 Brazilian soybean harvest [13]. The productive system has direct planting (also called “no-tillage farming”), genetically modified seeds, a mechanized system for soil preparation, planting, harvesting, and crop treatments. The liming of the soil is used to correct acidity, with potassium, phosphate, and micronutrient fertilization. The nitrogen supply for crops comes from biological nitrogen fixation, and natural atmospheric deposition. Crop treatments consist of herbicides and fungicides (although our estimates do not consider N in these agrochemicals). Nitrogen emissions from deforestation and changes in land use for soy cultivation were considered. Data on production, productivity, planted area, deforestation and land use change were collected at the state level, in the period from 2007 to 2019. The biomes considered in deforestation were the Cerrado, the Amazon, and the Pampa (Appendix A).
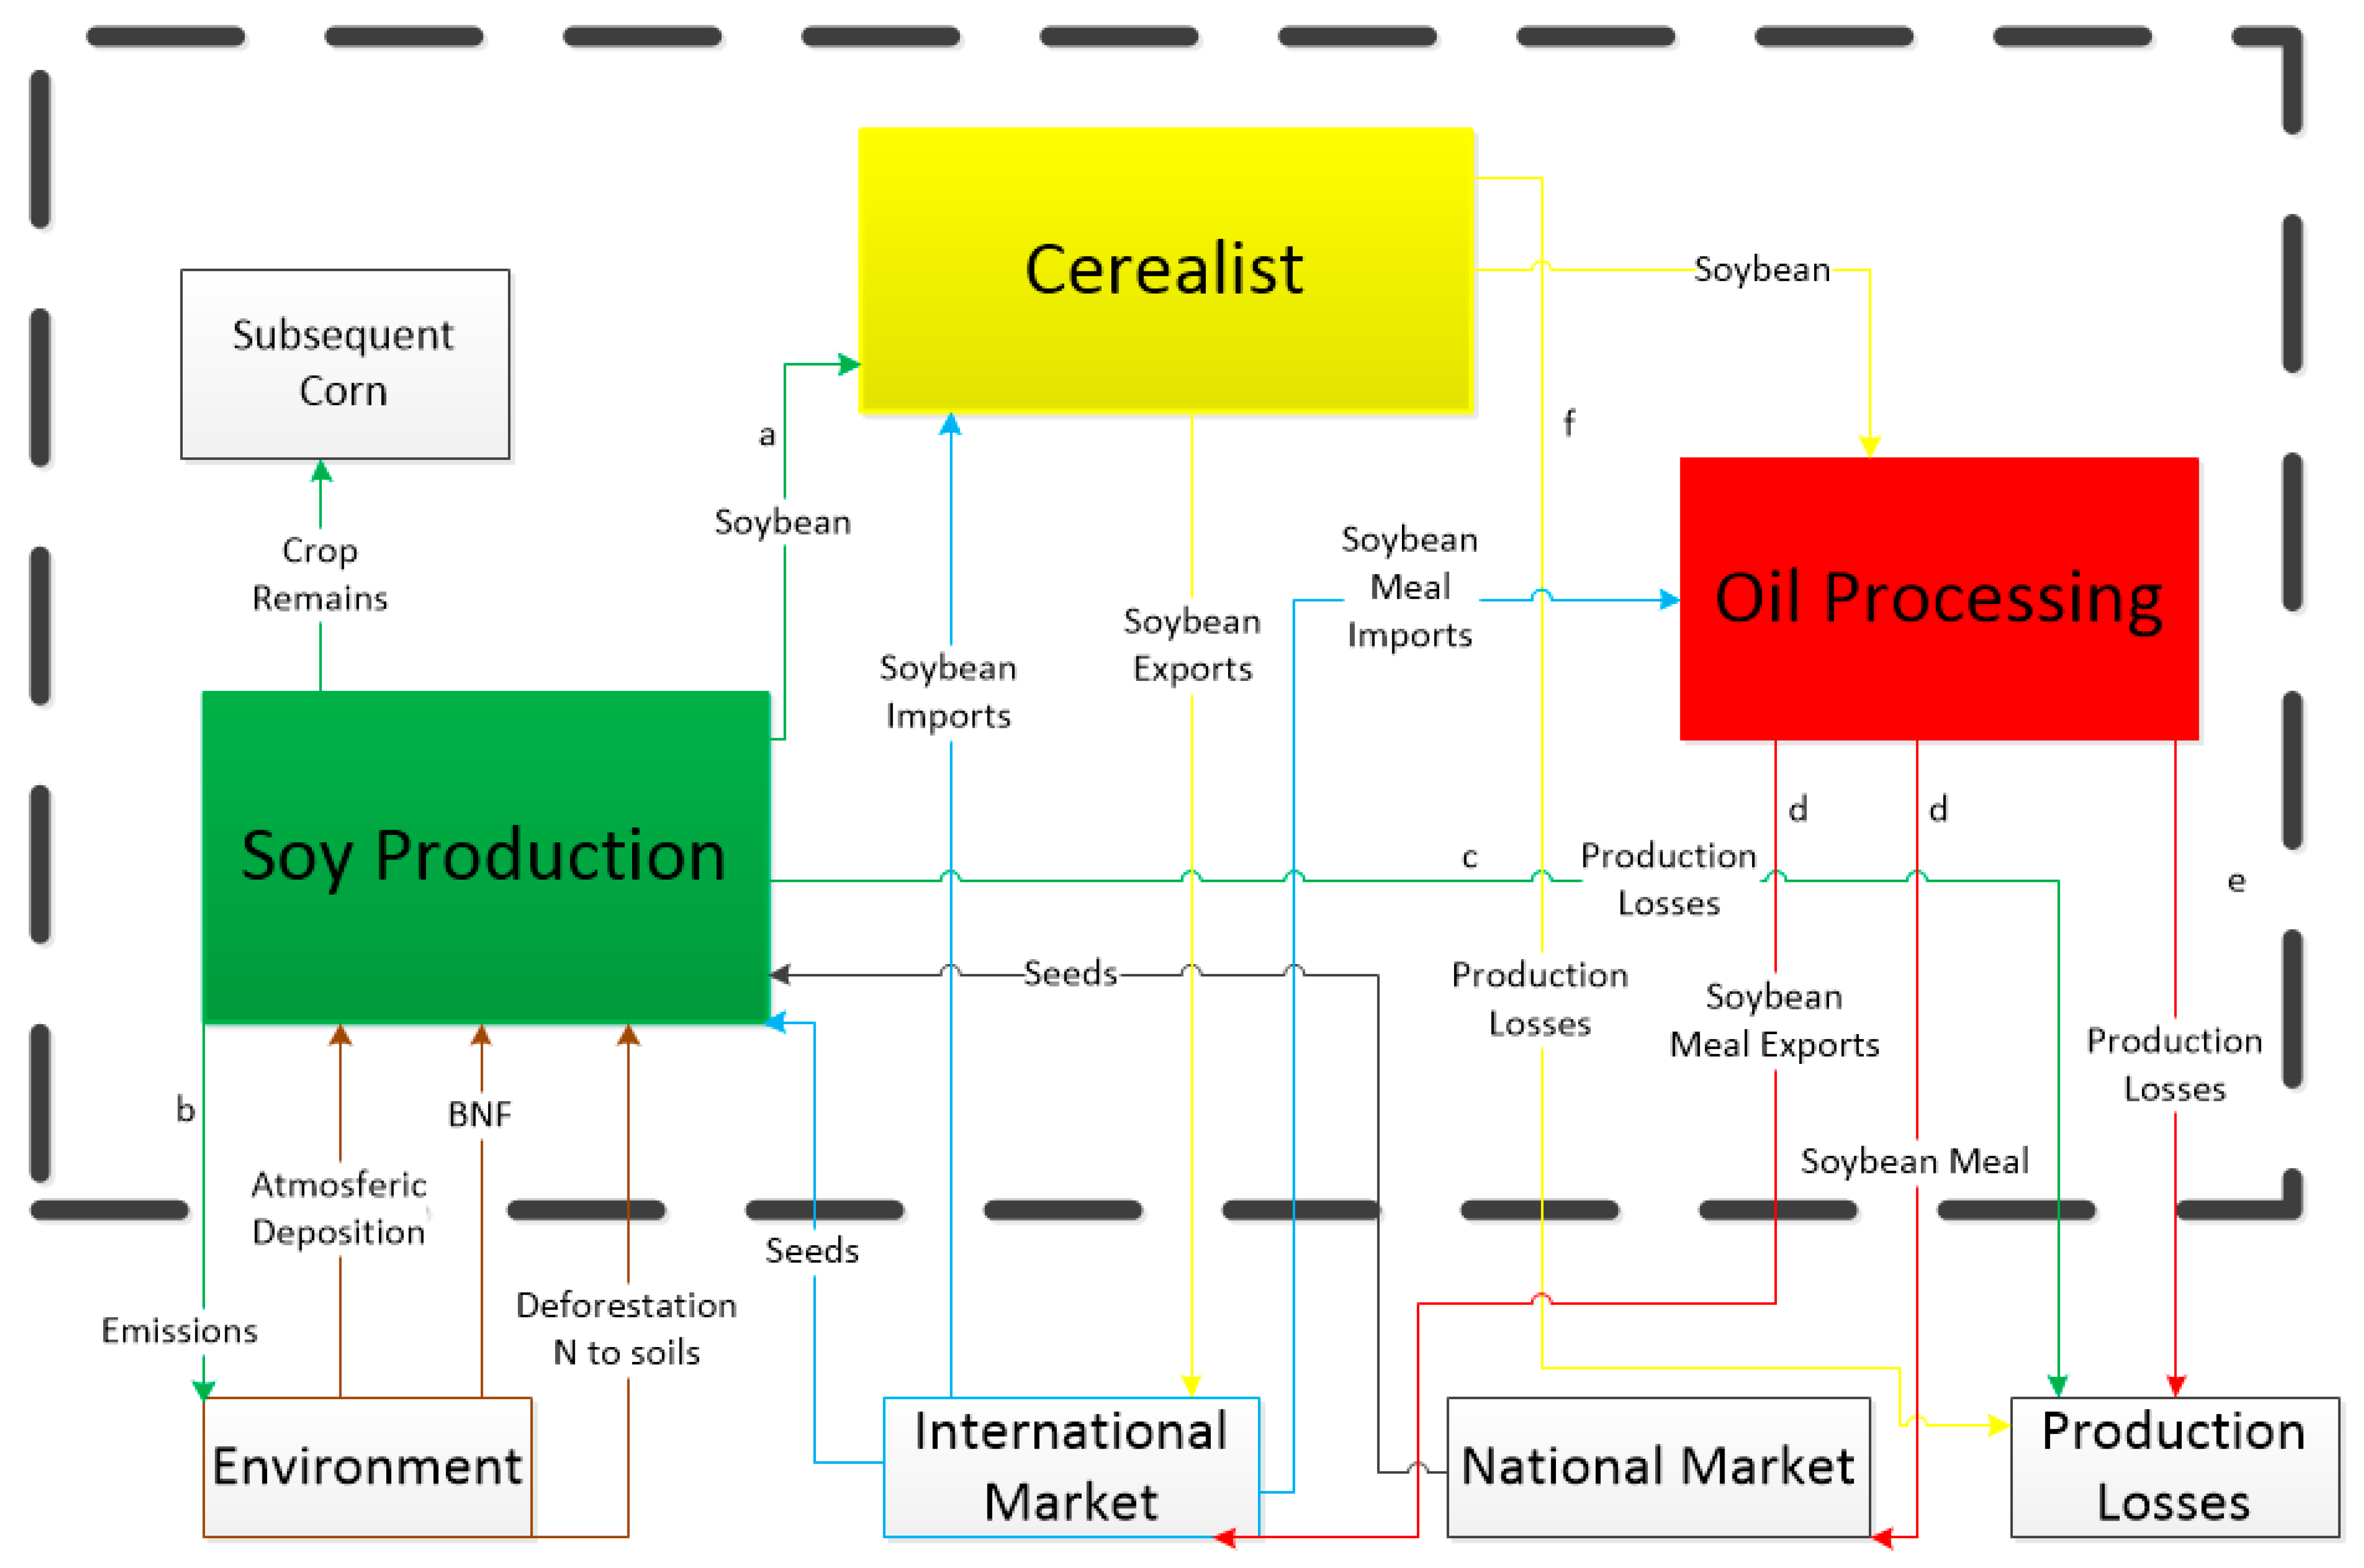
After the soybean harvest, there is a corn production season, called “safrinha” (corn “little harvest season” in portuguese), which was considered in this study as a destination for nitrogen from the remains of soybean culture. After the soybean harvest, the grains are transported to the cereal warehouses where they are dried, stored and opportunely sold. For the production of soybean meal, the data provided by the Brazilian Vegetable Oil Industry Association (ABIOVE) [22] were considered, and the losses arising from transport logistics during the production chain were calculated based on the road network, which represents the main mode of transport used in the country. Figure 1 details nitrogen flows and the production system for Brazilian soy.
2.2. Efficiency Indicators in the Use of Nitrogen and the Cascade Effect
To assess the efficiency of nitrogen use in the different stages of the soybean production cycle, we use the NUE (nitrogen use efficiency) indicator [23], which is calculated by the ratio between the total product harvested in terms of nitrogen content and the nitrogen inputs in the system [19]. Efficiency estimates are essential in studies of production chains since low efficiencies in the use of nutrients are commonly associated with high emissions to the environment [24].
The NUE for agricultural systems has been used in several studies as an indicator to estimate progress in achieving the goals proposed by the Sustainable Development policy and is an indicator accepted and used by 193 member countries of the United Nations General Assembly [25]. In this study, NUE and its evolution were considered in the Brazilian soybean production system, from 2007 to 2019. From the point of view of the nitrogen cycle, the efficiency of the crop phase of a system can be considered as the capacity of conversion of nitrogen added to the soil, fertilizers, animal waste, biological nitrogen fixation, and atmospheric deposition, compared with the amount of nitrogen in the final product [19].
A new indicator is proposed in this study: The Nitrogen Cascade Indicator (NCI), which assesses nitrogen emissions to environment along the production chain (crop, commercialization and processing). For this indicator, it is taken into account that there is a concentration of nitrogen to the environment in each phase of the production cycle. Thus, it is calculated by the ratio between tons of nitrogen made available to the environment, and the amount in tons of useful-product nitrogen. In this article, the products were considered: soybeans and soybean meal. This dimensionless indicator explicitly demonstrates the percentage of emissions sent to the environment of the total nitrogen present in the product to be sold. To calculate it, there was considered emissions to the environment, the flows of which are indicated in Figure 1. There was an NCI for soybean production, which accounts for the flows “b and c” for the environment, and the flow “a” for the product (Figure 1) and an NCI accumulated with emissions to the environment of crop (flows “b” and “c”), commercialization (flow “f”) and processing (flow “e”), and the final product was tons of soybean meal (flow “d”) (Figure 1).
As shown in Figure 1, the tons of nitrogen present in the product considered corresponds to the flows demarcated with the letter “a” and the letter “d”. For the environment, flows with the letter “b”, which aggregate emissions from deforestation and land use change, and the letters “c, e, f”, which correspond to losses related to transport, harvesting, and storage, of grain production, storage, and industrial processing sectors.
3. Results
3.1. Nitrogen Inputs and Outputs in the Brazilian Soybean Production System
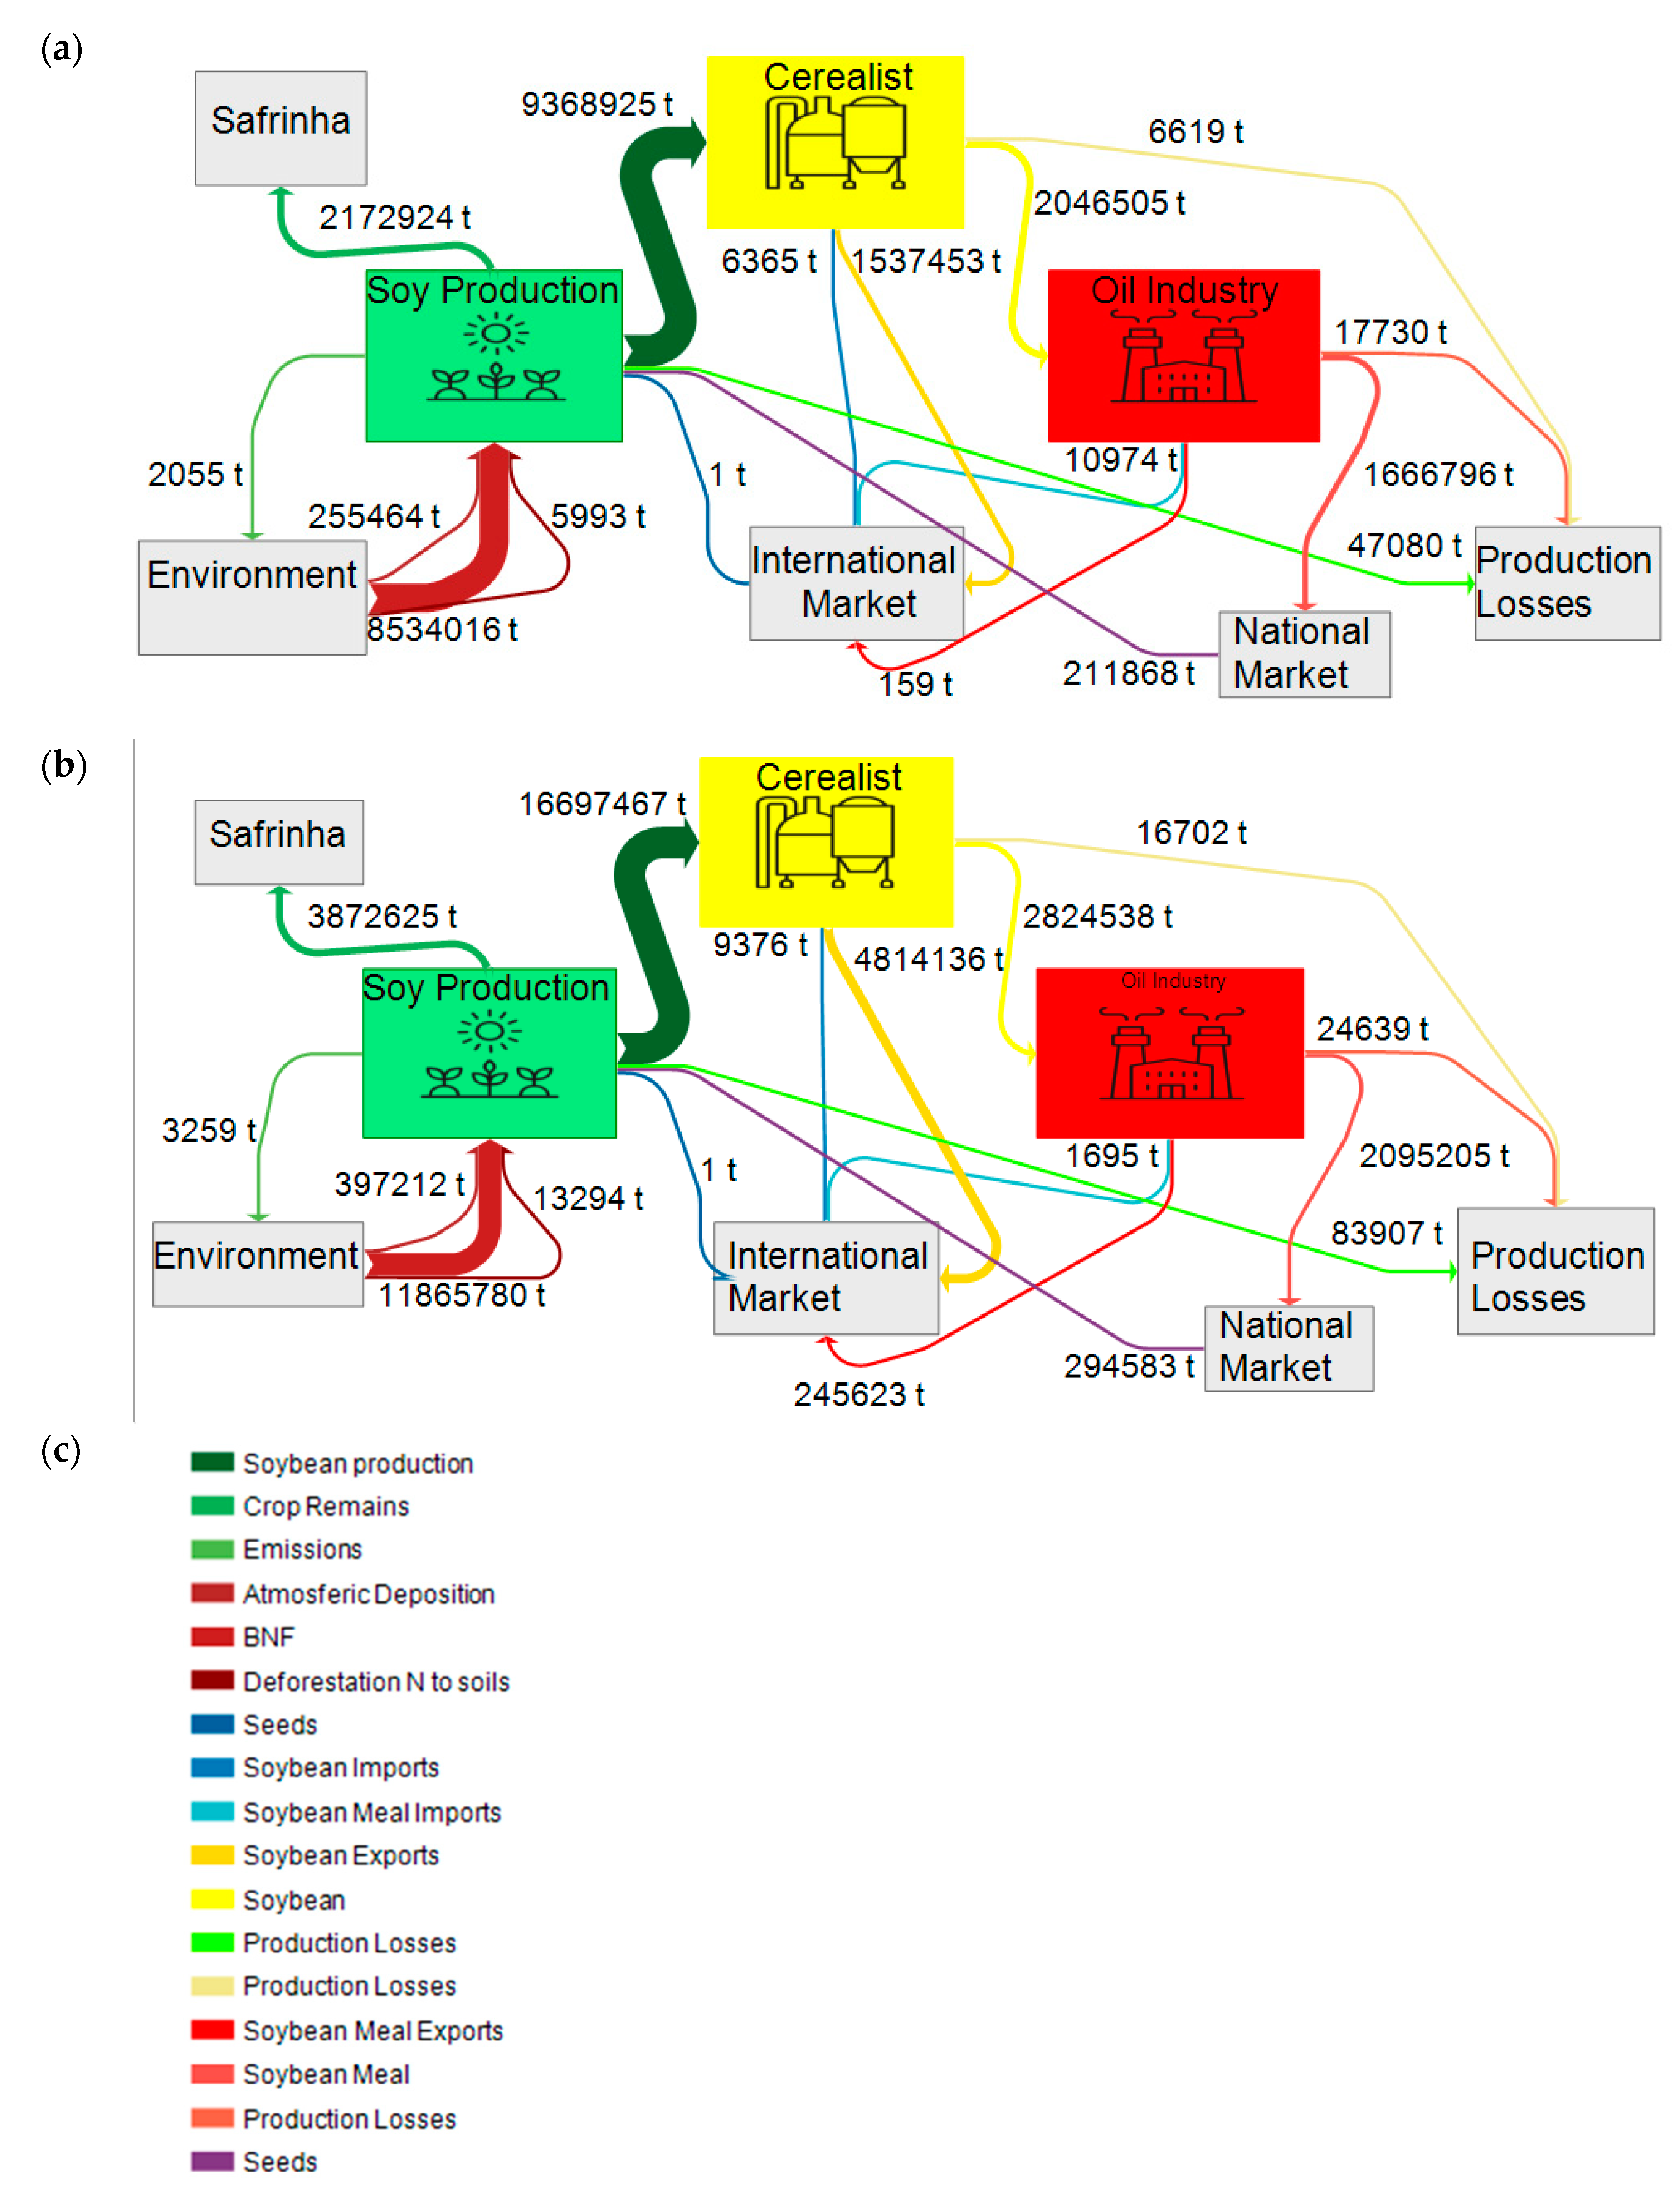
Figure 2 shows the nitrogen flows within the production system (chain). The greatest nitrogen input into the soybean production system was through biological nitrogen fixation (BNF), with an increase of 39% in the 12 years evaluated. This increase in BNF is due to the increase in soybean planted area in the country, which was approximately 47 million hectares in 2007, compared to approximately 66 million hectares in 2019. This increase in the planted area also led to a greater need for inputs such as seeds. Besides this, the increase of areas occurred in forest regions and in areas that were already destined for agricultural production, but with other crops or activities. The largest growth occurred in the Cerrado region, where land use change was larger than the area deforested for soybean planting. Overall, the nitrogen inputs for Brazilian soybean production went from approximately 9 Tg of nitrogen in the year 2007, to about 12 Tg of nitrogen in the year 2019.
Regarding nitrogen outputs, it is observed that soybeans in grains have the highest amount of nitrogen transferred between sectors (or chain links). Regarding the destination of these soybeans, there was a change in the product’s commercialization: in 2007 most of the production was destined for the domestic market, and in 2019, the foreign market corresponded to 63% of the destination of Brazilian production. With this, Brazil consolidates itself as a global exporter of nitrogen, emphasizing the importance of quantifying and optimizing nitrogen flows within the soy and coproduct production system. In the commercialization sector of soybean meal, the same trend is observed with a significant increase in product exports, but still without overlapping domestic consumption. Soybean meal exports increased by more than 3 million tons of product over the 12 years.
Other important outputs which influenced the results of emissions to the environment, were losses related to logistics, harvesting, and storage, with an increase of 75.36% between 2007 and 2019. Since these results are similar to those observed in the literature, which point to the fact that the losses cannot be neglected, since in each phase the losses are decimal, but when seen at the point of the production chain these losses are significant, even more in the grain production where the volume traded is millions of tons [26].
The stock variation within the nitrogen balance of the system showed different results, however in the soybean production sector the stock variation was negative, and in the commercialization and processing stages of the grain, the values were positive. The negative stock variation in the soybean production stage come from the use of soil nitrogen stocks, in addition to possible variations in nitrogen from deforestation and changes in land use. The positive stock variation in the commercialization and processing steps may come from product stock changes from one current year to the next.
3.2. Nitrogen Use Efficiency (NUE) and Nitrogen Cascade Indicator (NIC) on Brazilian Soy Production Chain
The efficiency in the use of nitrogen in crop sector during the study period remained practically stable at around 81%. This stability can be attributed to the fact that there are no significant changes in the management of the crop during the entire study period.
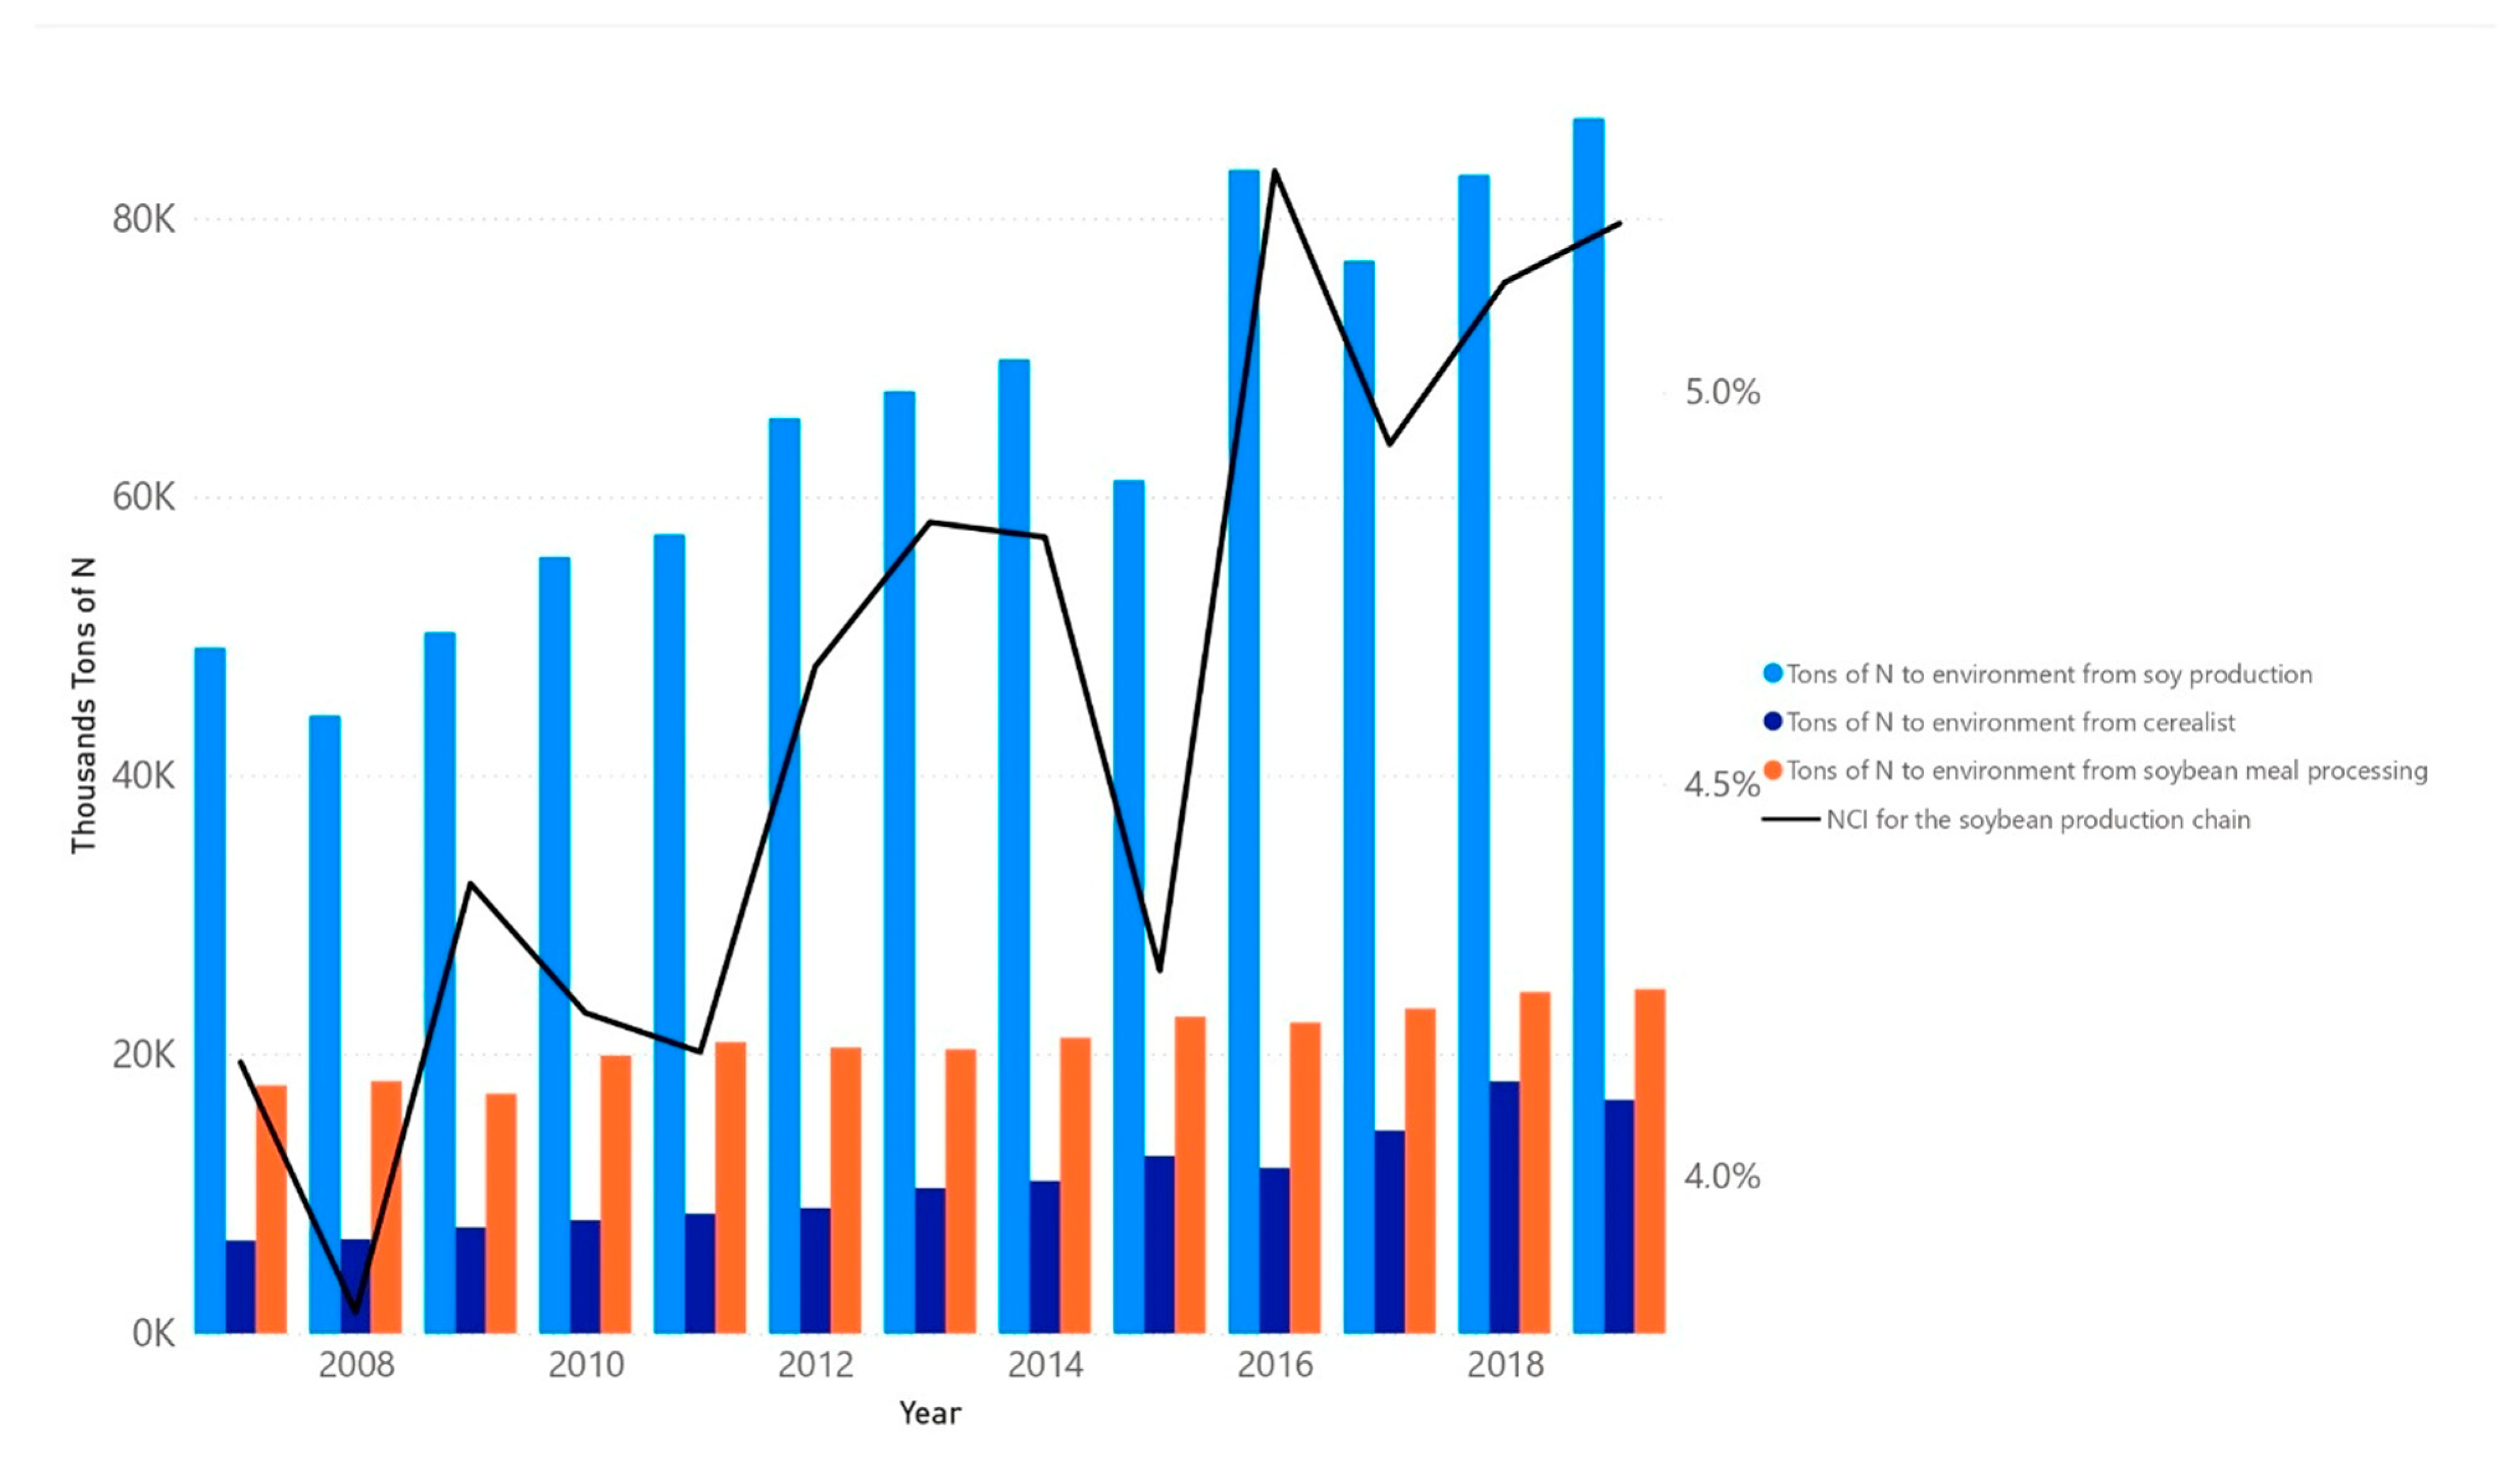
There was a significant increase in emissions to the environment in the three sectors of the study, in which the soybean production stage presented the highest values, around 49 thousand tons in 2007, for about 87 thousand tons in 2019. Despite this, the Nitrogen cascade indicator (NCI) for crop production varied from 0.524% in 2007 to 0.522% in 2019, being almost stable.
Although the NCI in the crop sector showed a slight reduction, the accumulated NCI (that is, the NCI considering the three sectors of the chain) showed values of 4.145% in 2007 and 5.216% in 2019, which emphasizes the necessity of analyzing production systems in the whole chain instead of isolated sectors. The drops in the indicator in the years 2008, 2011, and 2015 highlight the decrease in the productivity of Brazilian soybeans, and the values in these years were, respectively, 2835, 3266, and 3203.38 kg/ha (Figure 3).
4. Discussion
Since the soybean plant is a legume, it was expected that the largest entry of reactive nitrogen in the system would come from biological nitrogen fixation. The value of 11 Tg/N/year in 2019 corresponds to 13% of the maximum inflows of new anthropogenic nitrogen fixed in the atmosphere from agriculture, proposed by Rockström in the concept of planetary boundaries for nitrogen (82 Tg/N/year) [4]. Previous studies have estimated values for biological nitrogen fixation in Brazil of 7.5 Tg/N/year in 2009 [27] and 4.6 Tg/N/year in 2005 [28]. Thus, it can be observed that the increase in soybean planted area contributed to the increase in biological nitrogen fixation and that Brazil contributes with a large percentage to the maximum global nitrogen inputs from agriculture and livestock.
Deforestation and land use change were important in the growth of soy in Brazil during this study period. Measures such as the “Soy Moratorium” in the Amazon biome, which restrict the trade of soybeans from deforested areas, have reduced the conversion of tropical forests to crops, thereby encouraging the displacement of new areas to other biomes, which have environmental legislation that is less rigid, as is the case of the Cerrado. As a result, regions of the so-called MATOPIBA, which correspond to areas in the states of Maranhão, Tocantins, Piauí, and Bahia, are consolidating themselves as the largest expansions in soybean cultivation in recent years [14].
The production of soybeans and soybean meal from Brazil is sold to domestic and foreign markets. In recent years, there has been an increase in exports of these products, which has consolidated Brazil as an important supplier of global protein. The increase in this trade causes an additional increase in anthropogenic reactive nitrogen, which can affect the climate, the biogeochemical cycle of the atmosphere, and the composition of aquatic and terrestrial ecosystems. In 2004, approximately 45 Tg/N out of the total of 187 Tg/N added reactively originated from international trade, with 40 Tg of the 45 produced coming from products derived from soy and meat production [16].
Other studies have also shown negative balances in the assessment of crop systems [28]. This is due to the reduced need for synthetic fertilizers for soybeans since the plant is a legume and the fact that cultivation in a tropical climate has high BNF rates [28]. The second harvest of grains (“safrinha”) transforms this negative stock variation into a positive one, since in this phase, in addition to the use of cultural remains from the previous harvest, large amounts of nitrogen fertilizer are also added.
The efficiency in the use of nitrogen in this study was about 81% for soybean production. Efficiency studies carried out in Latin America found NUE values of 71.1% for crops in soybean-producing countries, and values of 40% for Brazilian crops, these values considered not only soybeans but also corn, wheat, and other crops, which also explains the lower NUE value observed in these studies. Legumes are known to be more efficient in using nitrogen than grasses [19,25].
The NUE points out that Brazil maintains the efficiency of use of the new nitrogen that enters the system [23], despite the increase in production observed in the period, the indicator remained constant. The NCI, which also remained practically constant in the production cycle of soybeans, shows significant increases when analyzed in the production chain until the production of soybean meal. Moreover, in values of tons of nitrogen for the environment both show significant increases, that is, the increase in the consumption of resources and the increase in externalities for the environment grew proportionally more than the productivity gains; this highlights the importance of detailed analyses of the production chain and not just a production cycle [20].
5. Conclusions
The growing advance in soy cultivation in Brazil has made the country a major supplier of global vegetal protein, but this advance influences the global nitrogen cycle, increasing the amount of reactive nitrogen produced by the production chain and increasing nitrogen emissions to the environment. The biological nitrogen fixation is the main nitrogen input of the crop and has undergone exponential increases in recent years; in 2019 it already represented 13% of the total global emissions from agriculture accepted to keep nitrogen within the zone of the uncertainty of the planetary borders. The “cascade indicator” (NCI) seems to be efficient in demonstrating the accumulation of nitrogen suffered between the productive stages of soy and its coproducts in Brazil, pointing out that for 12 years the values of emissions to the environment almost doubled in absolute terms. Therefore, improvements in the production system, with reductions in deforestation, losses from transport, and greater recycling of nutrients are necessary and can contribute to reducing the impacts of this production system on global nitrogen emissions. In addition, studies contemplating production chains instead of isolated production systems are efficient in demonstrating the cascade effect of nitrogen.
Despite the advances, some limitations must be recognized and can serve as inspirations for new studies. The main limitation of this study is the scarcity of detailed and precise official data on emissions and nitrogen flows in the different Brazilian biomes.
Author Contributions
T.B.; A.H.G., thought about the theme of the study. V.T.R. searched for references and data for carrying out the analyzes and organized the data. A.H.G. assisted in the allocation of nitrogen inputs and outputs in the systems and the calculation of indicators. T.B. assisted in the search for references. V.T.R. wrote the article, organized the tables and graphic elements. T.B. and A.H.G. contributed to article writing and research supervision. R.B.A. and R.A.N. contributed to the revision of the text and writing of the article. All authors have read and agreed to the published version of the manuscript.
Funding
This research is part of the first author’s master’s degree in Nutrition and Animal Production, which has a scholarship provided by the National Research Council (CNPq) Brazil, distributed by the Department of Nutrition and Animal Production of the Faculty of Veterinary Medicine and Zootechnics of the University of São Paulo. Process number: 131783/2020-3.
Data Availability Statement
The data presented in this study are available in Appendix A.
Conflicts of Interest
The authors declare no conflict of interest.
Appendix A
Appendix A.1. The Inputs and Outputs Considered in the Nitrogen Balance in the Soybean Production Stage Were
Appendix A.1.1. Inputs
- Atmospheric deposition: Important process of removing nitrogenous compounds and other pollutants from the air to the Earth’s surface, which can occur in the form of wet deposition and dry deposition. The values considered in this study were: for the central and southern region of Brazil: 8 kg of N/ha/year, and for the Amazon region of 4 kg of N/ha/year [29].
- Biological Nitrogen Fixation: Process of transforming nitrogen gas (N2) into structures assimilable by other organisms, especially plants. Value considered in this study 180 kg of N/ha/year [30].
- Planted area and productivity: hectares of soy planted area in Brazil per year. The productivity of Brazilian soybeans per year (kg/ha) [13].
- Need for seeds for planting: Considering that 68.75 kg per hectare of soybean seeds are needed, to guarantee a stand of 250 thousand plants per hectare with 80% germination power and 10% more insertion in the number of seeds in the field for possible losses by pests and errors in sowing [31].
- Importation of seeds for planting: Brazilian import of soybean seeds for planting. Common Mercosur Nomenclature (NCM) considered: 12010010—Soybeans for sowing, 12011000—Soybeans, even crushed, for sowing [32].
- Consumption of national seeds: The difference between the need for seeds for planting and the amount of imported seed.
- New land for planting soybeans: The difference in the planted area from one year to the next was considered as new areas for planting soybeans. They were divided between the biomes: Amazonia, Cerrado, and Pampa. Emissions were calculated considering that 22% of the Cerrado areas came from deforestation, 5% from the Amazon areas, and 8.2% from the areas in the Pampa, and the remainder from conversion from pastures to crops. Nitrogen Emissions to Land Use Change and Deforestation was calculated using the values of 0.75 Kg N/ha for Land Use Change from pastures and Deforestation of Pampa Biome. Values of 3.95 Kg N/ha for Amazon Deforestation and 4.75 Kg N/ha for Cerrado Deforestation [14,22,33,34,35].
Appendix A.1.2. Outputs
- Harvested Soy: Amount of soybeans harvested [13].
- Produced Soy: Amount of grains harvested plus 0.5% losses during harvest.
- Harvest and Transport Losses: Consideration of losses related to road transport from the farm to the grain store and losses during harvest. Value considered, 0.5% [36].
- Crop Remains: Amount of nitrogen present in the leaves and stem of the soybean plant at the time of harvest, estimated at 15 kg of nitrogen for every 1000 kg of soybeans produced per hectare [30].
Appendix A.2. Inputs and Outputs Considered in the Nitrogen Balance in the Grain Storage Stage (Cerealist)
Appendix A.2.1. Inputs
- Harvested Soy: Amount of soybeans harvested [13].
- Soy imports: Soy grain imports considering the following NCM: 12019000—Soy, whether or not ground, except for sowing. 12010090—Other soya beans, whether or not ground [32].
- Initial stock: Quantity of soybeans stored, at the beginning of the current year, in storage units of industries, tradings, cooperatives and cerealists [22].
Appendix A.2.2. Outputs
- Grain Processing: Quantity of soybeans for industrial processing [22].
- Grain exports: Export of soybeans considering the following NCM: 12019000—Soy, whether or not ground, except for sowing. 12010090—Other soya beans, whether or not ground [32].
- Final stock: Quantity of soybeans stored at the end of the current year, in storage units of industries, tradings, cooperatives and cereal producers [22].
- Losses during the process: Losses of grain storage (0.9%), and losses related to transportation to the processing industry or port (0.25%) [36].
Appendix A.3. Inputs and Outputs Considered in the Nitrogen Balance in the Industrial Soybean Processing Stage
Appendix A.3.1. Inputs
- Initial soybean meal stock: Amount of soybean meal stored at the beginning of the current year by the processing sector [22].
- Import of soybean meal: Amount of soybean meal imported by Brazil considering the NCM: 23040010—Flours and pellets, from the extraction of soybean oil. 23025000—Bran, meal and other leguminous residues [32].
- Grains targeted for processing: Amount of soybeans destined for industrial processing [22].
Appendix A.3.2. Outputs
- Export of soybean meal: Amount of soybean meal exported by Brazil, considering the NCM: 23040010—Flours and pellets, from the extraction of soybean oil. 23025000—Bran, meal and other leguminous residues [32].
- Internal consumption of soybean meal: The difference between the amount of soybean meal produced by the industry and the amount of soybean meal exported.
- Final stock: Amount of soybean meal stored at the end of the current year by the processing sector [22].
- Losses during the industrial process: Losses from grain processing and transportation of soybean meal, amount of 1% of losses [36].
References
- Bouwman, A.F.; Beusen, A.H.W.; Billen, G. Human alteration of the global nitrogen and phosphorus soil balances for the period 1970–2050. Glob. Biogeochem. Cycles 2009, 23. [Google Scholar] [CrossRef]
- Lassaletta, L.; Billen, G.; Grizzetti, B.; Anglade, J.; Garnier, J. 50 year trends in nitrogen use efficiency of world cropping systems: The relationship between yield and nitrogen input to cropland. Environ. Res. Lett. 2014, 9, 105011. [Google Scholar] [CrossRef]
- Galloway, J.N.; Cowling, E.B. Reactive Nitrogen and The World: 200 Years of Change. Ambio 2002, 31, 64–71. [Google Scholar] [CrossRef] [PubMed]
- Rockström, J.; Steffen, W.; Noone, K.; Persson, Å.; Chapin, F.S., III; Lambin, E.; Lenton, T.M.; Scheffer, M.; Folke, C.; Schellnhuber, H.J.; et al. Planetary Boundaries: Exploring the Safe Operating Space for Humanity. Ecol. Soc. 2009, 14, 32. [Google Scholar] [CrossRef]
- Rockström, J.; Edenhofer, O.; Gaertner, J.; Declerck, F. Planet-proofing the global food system. Nat. Food 2020, 1, 3–5. [Google Scholar] [CrossRef] [Green Version]
- IPCC. Chapter 6: Carbon and Other Biogeochemical Cycles; IPCC: Geneva, Switzerland, 2013; Volume 5. [Google Scholar]
- Uwizeye, A.; De Boer, I.J.M.; Opio, C.I.; Schulte, R.P.O.; Falcucci, A.; Tempio, G.; Teillard, F.; Casu, F.; Rulli, M.; Galloway, J.N.; et al. Nitrogen emissions along global livestock supply chains. Nat. Food 2020, 1, 437–446. [Google Scholar] [CrossRef]
- Billen, G.; Lassaletta, L.; Garnier, J. A vast range of opportunities for feeding the world in 2050: Trade-off between diet, N contamination and international trade. Environ. Res. Lett. 2015, 10, 025001. [Google Scholar] [CrossRef]
- Galloway, J.N. The global nitrogen cycle: Changes and consequences. Environ. Pollut. 1998, S1, 15–24. [Google Scholar] [CrossRef]
- Peyraud, J.; Cellier, P.; Donnars, C.; Réchauchère, O. Les flux d’azote liés aux élevages. Cultures 2012, 68, 572. [Google Scholar]
- Galloway, J.N.; Aber, J.D.; Erisman, J.W.; Seitzinger, S.P.; Howarth, R.W.; Cowling, E.B.; Cosby, B.J. The Nitrogen Cascade. Bioscience 2003, 53, 341–356. [Google Scholar] [CrossRef]
- Cattelan, A.J.; Dall’Agnol, A. The rapid soybean growth in Brazil. OCL 2018, 25, D102. [Google Scholar] [CrossRef] [Green Version]
- CONAB, Companhia Nacional de Abastecimento. Safra Brasileira de Grãos. Available online: https://www.conab.gov.br/info-agro/safras/graos (accessed on 27 January 2021).
- Rausch, L.L.; Gibbs, H.K.; Schelly, I.; Brandão, A., Jr.; Morton, D.C.; Filho, A.C.; Strassburg, B.; Walker, N.; Noojipady, P.; Barreto, P.; et al. Soy expansion in Brazil’s Cerrado. Conserv. Lett. 2019, 12, e12671. [Google Scholar] [CrossRef]
- Filoso, S.; Martinelli, L.A.; Howarth, R.W.; Boyer, E.W.; Dentener, F. Human activities changing the nitrogen cycle in Brazil. Biogeochemstry 2006, 79, 61–89. [Google Scholar] [CrossRef]
- Galloway, J.N.; Townsend, A.R.; Erisman, J.W.; Bekunda, M.; Cai, Z.; Freney, J.R.; Martinelli, L.A.; Seitzinger, S.P.; Sutton, M.A. Transformation of the Nitrogen Cycle: Recent Trends, Questions, and Potential Solutions. Science 2008, 320, 889–892. [Google Scholar] [CrossRef] [PubMed] [Green Version]
- Xu, Z.; Chau, S.N.; Ruzzenenti, F.; Connor, T.; Li, Y.; Tang, Y.; Li, D.; Gong, M.; Liu, J. Evolution of multiple global virtual material flows. Sci. Total. Environ. 2019, 658, 659–668. [Google Scholar] [CrossRef] [PubMed]
- Zhang, X.; Davidson, E.A.; Zou, T.; Lassaletta, L.; Quan, Z.; Li, T.; Zhang, W. Quantifying Nutrient Budgets for Sustainable Nutrient Management. Glob. Biogeochem. Cycles 2020, 34, e2018GB006060. [Google Scholar] [CrossRef] [Green Version]
- Billen, G.; Lassaletta, L.; Garnier, J. A biogeochemical view of the global agro-food system: Nitrogen flows associated with protein production, consumption and trade. Glob. Food Secur. 2014, 3, 209–219. [Google Scholar] [CrossRef]
- Gameiro, A.H.; Bonaudo, T.; Tichit, M. Nitrogen, phosphorus and potassium accounts in the Brazilian livestock agro-industrial system. Reg. Environ. Chang. 2018, 19, 893–905. [Google Scholar] [CrossRef]
- AgriBenchmark. Cash Crop. Available online: http://www.agribenchmark.org/cash-crop/sector-country-farm-information/country-profiles/brazil.html (accessed on 27 January 2021).
- ABIOVE, Associação Brasileira das Indústrias de Oléos Vegetais. Estatítiscas. Available online: https://abiove.org.br/estatisticas/ (accessed on 27 January 2021).
- Gerber, P.; Uwizeye, A.; Schulte, R.; Opio, C.; De Boer, I.; De Boer, I. Nutrient use efficiency: A valuable approach to benchmark the sustainability of nutrient use in global livestock production? Curr. Opin. Environ. Sustain. 2014, 9–10, 122–130. [Google Scholar] [CrossRef]
- Herrero, M.; Wirsenius, S.; Henderson, B.; Rigolot, C.; Thornton, P.; Havlík, P.; De Boer, I.; Gerber, P.J. Livestock and the Environment: What Have We Learned in the Past Decade? Annu. Rev. Environ. Resour. 2015, 40, 177–202. [Google Scholar] [CrossRef]
- Zhang, X.; Davidson, E.A.; Mauzerall, D.L.; Searchinger, T.D.; Dumas, P.; Shen, Y. Managing nitrogen for sustainable development. Nat. Cell Biol. 2015, 528, 51–59. [Google Scholar] [CrossRef] [Green Version]
- Péra, T.G.; Caixeta-Filho, J.V. Perdas na logística de soja e milho no brasil: Contribuições para o fortalecimento do agronegócio. In Proceedings of the XXI SEMEAD Seminários em Administração, São Paulo, Brazil, 6–8 November 2018. [Google Scholar]
- Herridge, D.F.; Peoples, M.B.; Boddey, R.M. Global inputs of biological nitrogen fixation in agricultural systems. Plant Soil 2008, 311, 1–18. [Google Scholar] [CrossRef]
- Sun, J.; Mooney, H.; Wu, W.; Tang, H.; Tong, Y.; Xu, Z.; Huang, B.; Cheng, Y.; Yang, X.; Wei, D.; et al. Importing food damages domestic environment: Evidence from global soybean trade. Proc. Natl. Acad. Sci. USA 2018, 115, 5415–5419. [Google Scholar] [CrossRef] [PubMed] [Green Version]
- Vet, R.; Artz, R.S.; Carou, S.; Shaw, M.; Ro, C.-U.; Aas, W.; Baker, A.; Bowersox, V.C.; Dentener, F.; Galy-Lacaux, C.; et al. A global assessment of precipitation chemistry and deposition of sulfur, nitrogen, sea salt, base cations, organic acids, acidity and pH, and phosphorus. Atmos. Environ. 2014, 93, 3–100. [Google Scholar] [CrossRef]
- Hungria, M.; Campo, R.J.; Mendes, I.C. Fixação biológica do nitrogênio na cultura da soja. Embrapa Soja 2001, 35, 48. [Google Scholar]
- EMBRAPA. Tecnologias de Produção de Soja—Região Central do Brasil 2014; Sistemas de Produção: Londrina, Brazil, 2014; p. 242. [Google Scholar]
- MDIC, Ministério da Indústria, Comércio Exterior e Serviços. COMEXSTAT-Estatísticas do Comércio Exterior do Brasil. Available online: http://comexstat.mdic.gov.br/pt/home (accessed on 27 January 2021).
- Verchot, L.V.; Davidson, E.A.; Cattânio, H.; Ackerman, I.L.; Erickson, H.E.; Keller, M. Land use change and biogeochemical controls of nitrogen oxide emissions from soils in eastern Amazonia. Glob. Biogeochem. Cycles 1999, 13, 31–46. [Google Scholar] [CrossRef]
- Kuplich, T.M.; Coapone, V.; Costa, L.F.F. O Avanço da soja no bioma Pampa. Boletim Geográfico do Rio Grande do Sul 2018, 31, 83–100. [Google Scholar]
- Bustamante, M.; Medina, E.; Asner, G.; Nardoto, G.; Garcia-Montiel, D. Nitrogen cycling in tropical and temperate savannas. Biogeochemistry 2006, 79, 209–237. [Google Scholar] [CrossRef]
- APROSOJA, Associação dos Produtores de Soja. Cartilha Para Minimizar Perdas. Available online: http://www.aprosoja.com.br/comunicacao/release/aprosoja-lanca-cartilha-para-minimizar-perdas (accessed on 27 January 2021).
Figure 1.
Nitrogen flows on soybean production chain in Brazil from of 2007 to 2019. The colors of the arrows represent the source of the nitrogen flow output. The dotted rectangle represents the boundary of the system considered in this model. BNF stands for biological nitrogen fixation. The letters a, b, c, d, e, f correspond to the flows considered for calculating the nitrogen cascade indicator (NCI).

Figure 2.
Nitrogen flows in the soybean and soybean meal production system in Brazil in tons per year. (a) Flows of nitrogen in 2007. (b) Flows of nitrogen in 2019. (c) Legend of the arrows, the colors correspond to the direction of the flow, being divided into 3 large compartments: Soy production (green), Sector Cerealist (yellow), Processing industry (red). The gray compartments are important sections that supply or are the destination of some of the nitrogen flows, and they are the production of the second grain harvest (“safrinha”), the environment, the international and national market, and losses during the production cycle.

Figure 3.
Nitrogen emissions directed to environment and Nitrogen Cascade Indicator (NCI) for soybean production chain in Brazil, 2007 to 2019.
Figure 3.
Nitrogen emissions directed to environment and Nitrogen Cascade Indicator (NCI) for soybean production chain in Brazil, 2007 to 2019.
Publisher’s Note: MDPI stays neutral with regard to jurisdictional claims in published maps and institutional affiliations. |
© 2021 by the authors. Licensee MDPI, Basel, Switzerland. This article is an open access article distributed under the terms and conditions of the Creative Commons Attribution (CC BY) license (https://creativecommons.org/licenses/by/4.0/).
Share and Cite
MDPI and ACS Style
Rezende, V.T.; Bonaudo, T.; Alves, R.B.; Nacimento, R.A.; Gameiro, A.H. Cascade Effect of Nitrogen on Brazilian Soybean Production Chain. Nitrogen 2021, 2, 128-138. https://0-doi-org.brum.beds.ac.uk/10.3390/nitrogen2020009
AMA Style
Rezende VT, Bonaudo T, Alves RB, Nacimento RA, Gameiro AH. Cascade Effect of Nitrogen on Brazilian Soybean Production Chain. Nitrogen. 2021; 2(2):128-138. https://0-doi-org.brum.beds.ac.uk/10.3390/nitrogen2020009
Chicago/Turabian StyleRezende, Vanessa Theodoro, Thierry Bonaudo, Ricardo Barboza Alves, Rafael Araújo Nacimento, and Augusto Hauber Gameiro. 2021. "Cascade Effect of Nitrogen on Brazilian Soybean Production Chain" Nitrogen 2, no. 2: 128-138. https://0-doi-org.brum.beds.ac.uk/10.3390/nitrogen2020009