Technical-Economic Analysis of a Hybrid Thermal Energy Supply System Based on Renewable Energy Sources †


Abstract
:1. Introduction
- Generate three forms of energy (electricity, heat, and cold) based on a hybrid renewable energy source (geothermal and solar), in which the electricity produced will cover at least the consumption of the thermal energy generation unit (on a yearly basis).
- Fully cover the heating and cooling demand for the target building (TB) using thermal energy produced from 100% renewable energy sources [1].
- The reintegration of the TB into the UPB heat distribution network (UPB DH) to inject the overproduction of heat.
- Develop a modular concept that will ease the process of replication and scaling.
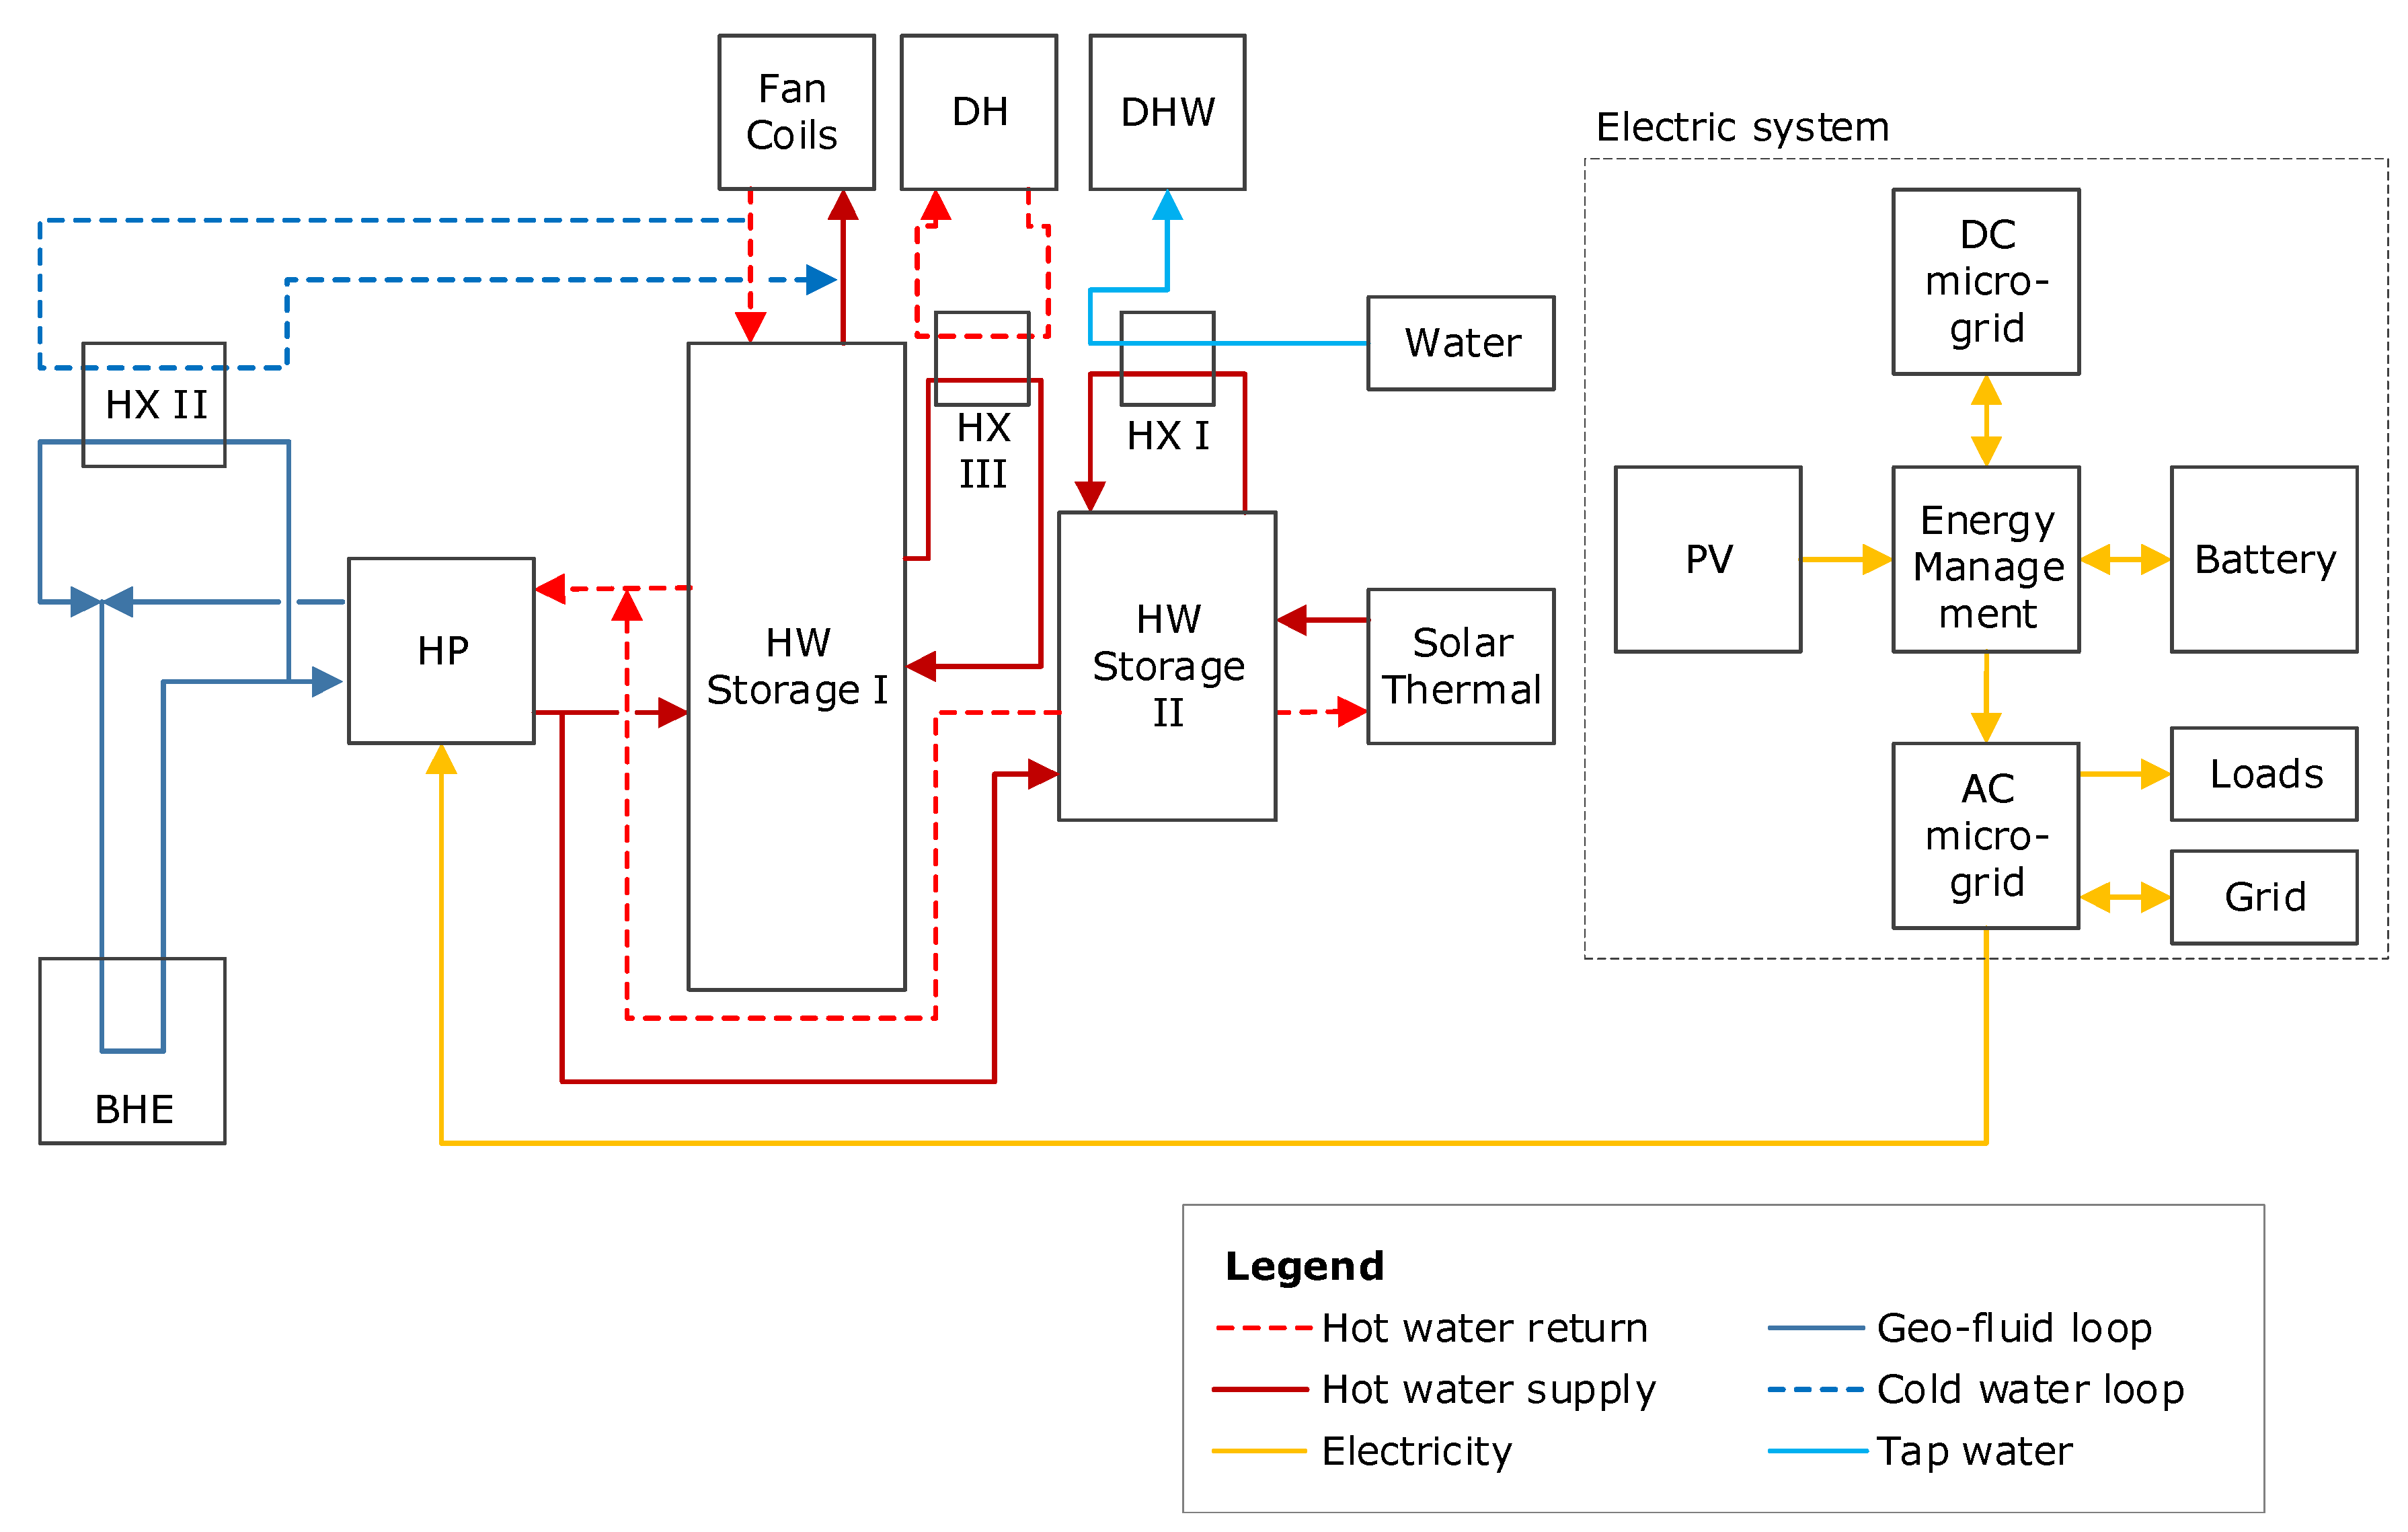
2. Description of Hybrid Thermal Energy Supply System
3. Definitions of Scenarios, Characteristics, and Considerations
- The thermal energy demand of the building
- As a reference, the current heat supply of the building from a local thermal power plant, which uses natural gas, was considered.
- The production of electricity resulting from photovoltaic panels, as well as from PVT, covers a part of the electrical consumption of the thermal scheme, namely the one related to ensuring the necessary heat and cold of the building [5].
- By implementing the new solution, based on renewable sources, the CO2 emissions were reduced both at the level of the building frame and the analysed system, this reduction being directly proportional to the reduction of the consumption of primary resources (saved natural gas) [6].
- The value of CO2 certificates related to reducing the amount of CO2 by implementing the new energy supply solution were considered as revenues, or virtual receipts.
- The share provided by UPB was considered as the value of the investment from its own funds. The difference up to the total value of the investment that the analysed solution implies is considered non-reimbursable from European funds (grants).
- The calculations were performed in two ways:
- The value of the investment was equal to the insured quota from the UPB budget.
- The value of the investment was equal to the total investment costs assumed by the implementation of the new solution.
- By implementing the thermal energy supply solution of the building based on the integration of geothermal-solar systems, it is considered that natural gas saving is achieved both for the building and the centralized heat supply system of UPB (corresponding to the production of heat injected into the system). This economy is quantified economically by the annual saving of expenses with the fuel (natural gas) saved.
- The total annual expenses include both the maintenance and operation expenses related to the solution, as well as the expenses related to the annual electricity consumption, in addition to the production provided by the photovoltaic panels.
- The virtual receipts of “virtual sales” of the entire amount of heat produced by the implementation of the proposed scheme were considered as income.
- The price of the “sold” heat was considered equal to the price in the UPB invoice.
- The virtual receipts of “virtual sales” of the share of the heat produced by the new system, related to the injection into the centralized UPB system, were considered as income.
- It was considered that a natural gas saving is achieved at the level of the building, corresponding to the coverage of the heat demand for its heating. This economy was quantified economically by the annual saving of expenses with the fuel (natural gas) saved.
4. Methodology of Technical-Economic Analysis
4.1. Net Present Value (NPV)
- are the receipts made in the year “i”;
- are the operating expenses for the year “i”, excluding depreciation;
- are the investments made from European non-reimbursable funds (grant) in the year “i” (the investment is made in one year, in the year “1”)
- a is the discount rate considered, and n is the duration of the study. The time period for which the discounted net income was calculated was n = 20 years.
4.2. Internal Rate of Return
- The internal rate of return (IRR) was used to estimate the economic efficiency of each solution proposed and analysed individually. The IRR cannot be used to compare several solutions as it may lead to false conclusions.
- The profitability of a project (solutions) was interpreted in relation to the IRR value, as follows: if the IRR has a unique value (in this analysis, only this situation is taken into account), the project is profitable if a ≥ IRR (the comparison was made with values of the discount rate in the range of 5–10%).
4.3. Payback Period
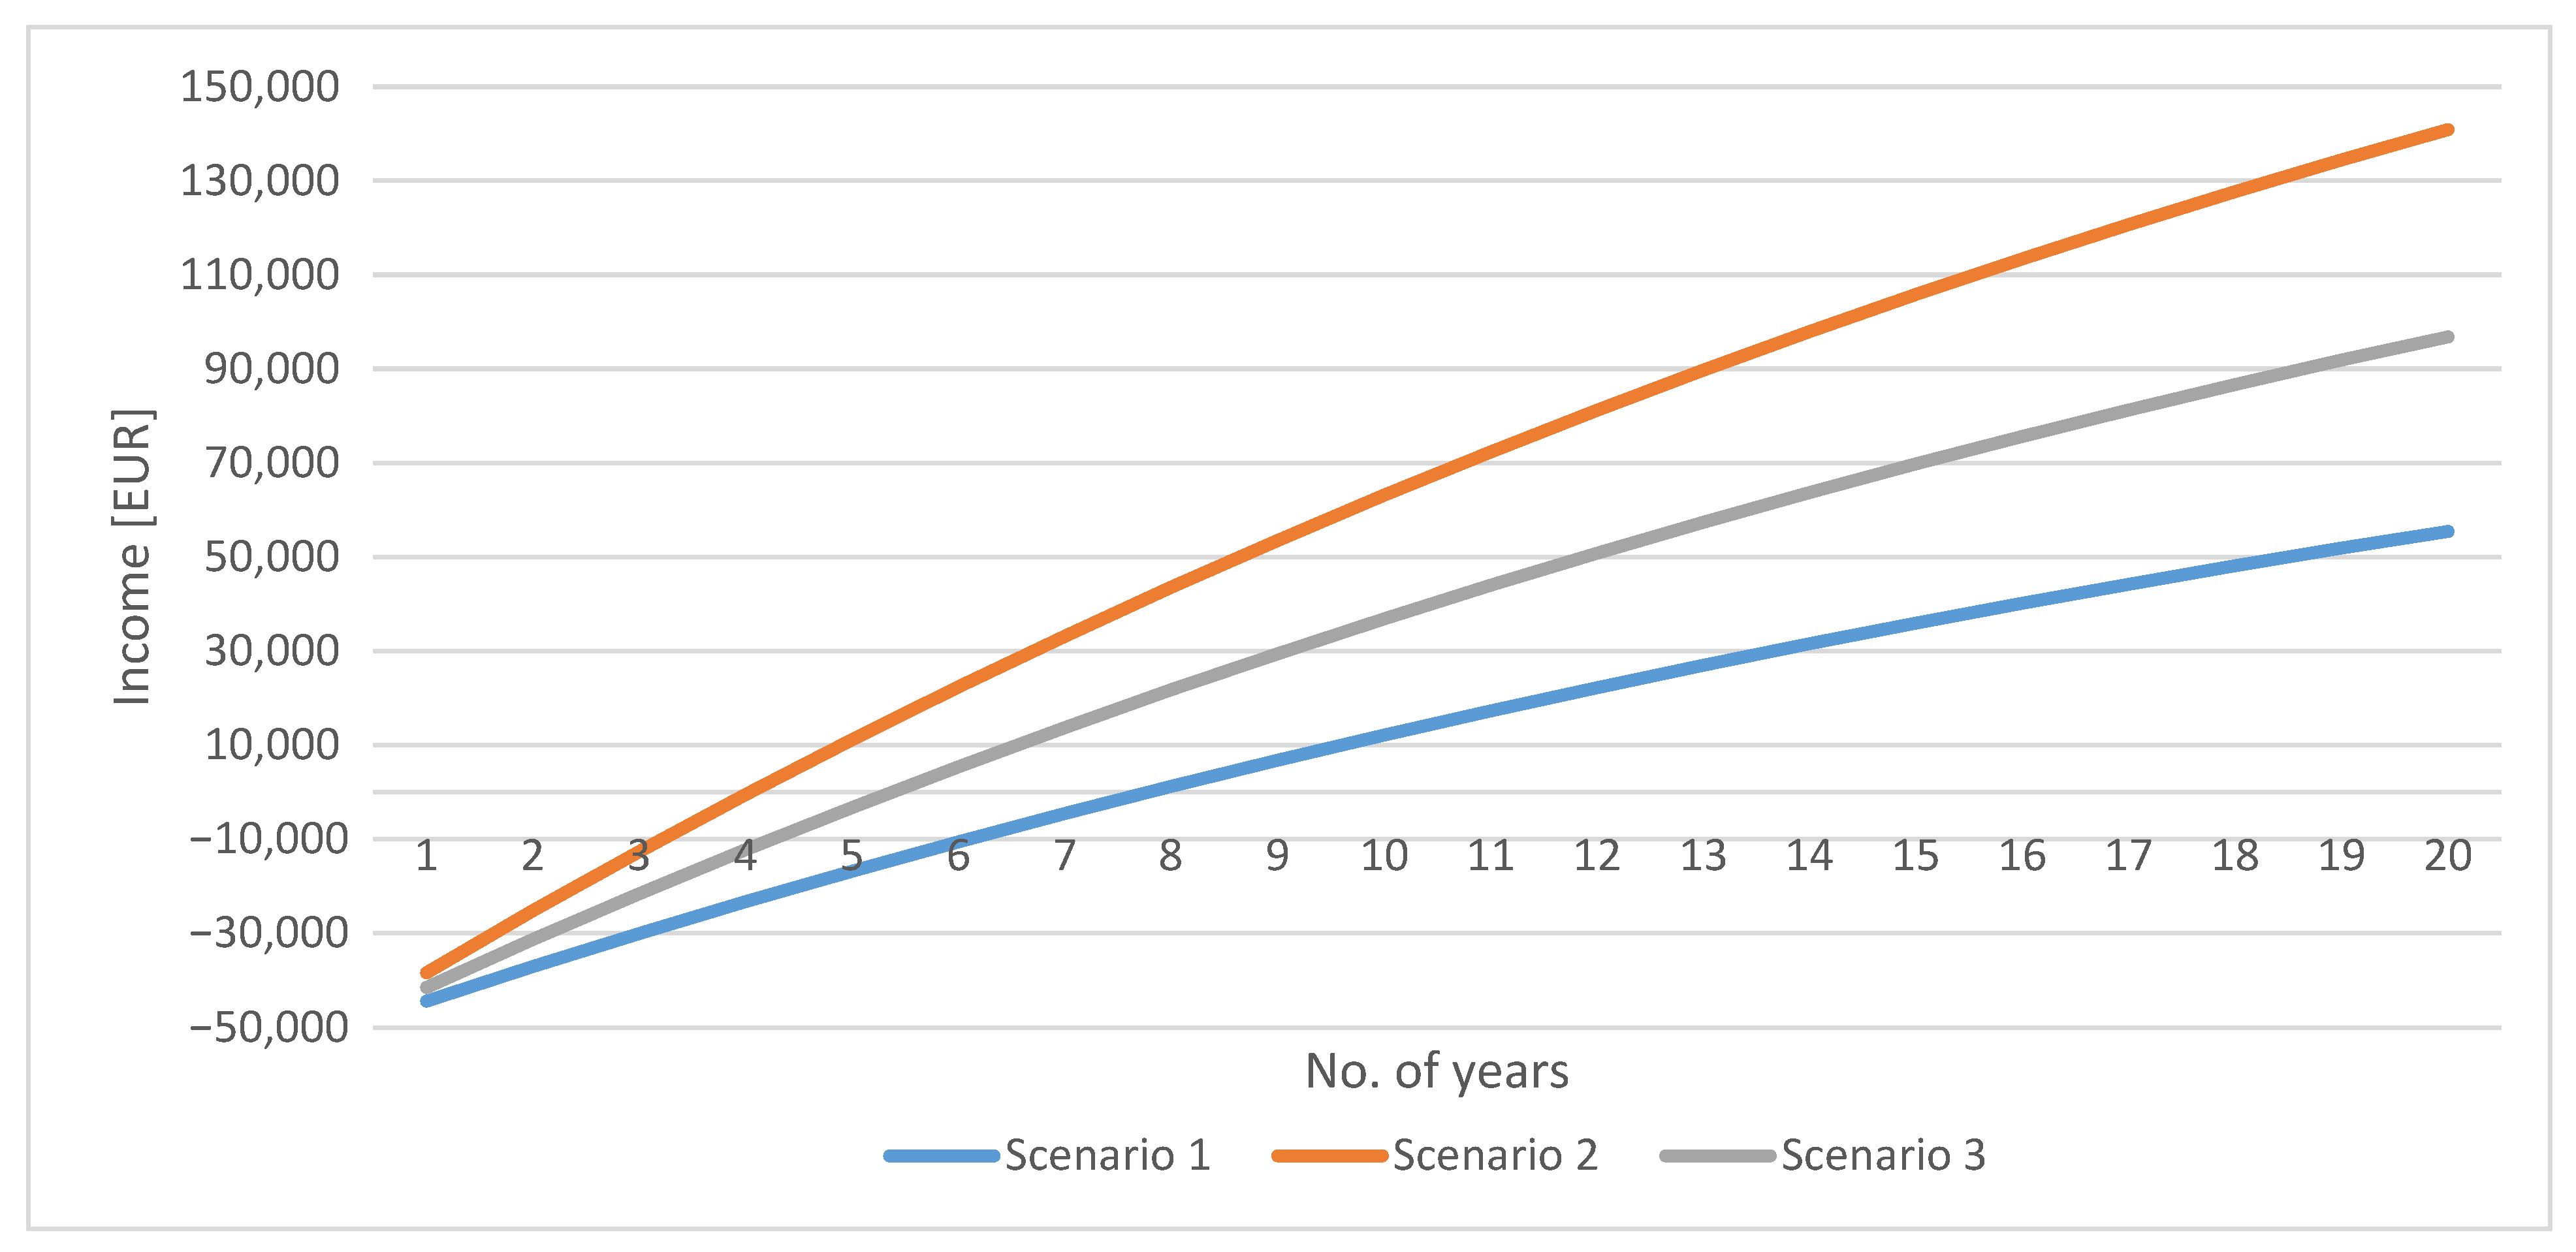
5. Results of the Analysis
- Virtual receipts of annual costs related to “virtual sales” of the entire amount of heat produced by the implementation of the proposed scheme are considered as income.
- The price of the “sold” heat is considered equal to the price in the UPB invoice.
- The value of the investment is equal to the quota provided by the UPB budget.
6. Conclusions and Sensibility Analysis for Optimal Scenario
- NPV < 0
- GPP and PP > analysed system lifetime (20 years)
- IRR < 4%
- NPV > 0
- GPP and PP < analysed system lifetime (20 years)
- IRR > 4%
- discounting rate (4, 6, 8%)
- fuel price (natural gas), (±5, ±10%): to determine the extent to which the decrease in fuel price no longer allows recovery of the investment (pessimistic scenario—the limit of economic profitability of the proposed solution)
- electricity price: ep (±5, ±10%)
- the price of the delivered heat: qp (±5, ±10%)
- the value of CO2 certificates: CO2p (30–35 EUR)
- annual maintenance expenses (biannual growth of ±1%)
- the amount of heat injected into the centralized system
- the fluctuation of the related thermal energy price
- the value of carbon certificates
Acknowledgments
References
- Acciona Engineering. Project Management (Work) Plan, Intezrnal Project Document; Acciona Engineering: Madrid, Spain, 2019. [Google Scholar]
- Acciona Engineering. Pre-Assessment of Demo-Sites, Internal Project Document; Acciona Engineering: Madrid, Spain, 2020. [Google Scholar]
- Ecoheat4cities. Guidelines for Technical Assessment of District Heating Systems. Available online: https://www.euroheat.org/wp-content/uploads/2016/04/Ecoheat4cities_3.1_Labelling_Guidelines.pdf (accessed on 5 July 2012).
- UNE-EN 15603:2008. Energy Performance of Buildings—Overall Energy Use and Definition of Energy Savings. 2008. Available online: https://www.iso.org/standard/56226.html (accessed on 1 January 2020).
- ISO 52000-1:2017. Energy Performance of Buildings—Overarching EPB Assessment. Available online: https://www.iso.org/standard/65601.html (accessed on 1 January 2020).
- Danish Energy Agency. Finding You Cheapest Way to a Low Carbon Future—The Danish Levelized Cost of Energy Calculator; Danish Energy Agency: København, Denmark, 2016. [Google Scholar]
- Athanasovic, V.; Dumitrescu, I.S.; Pătraşcu, R.; Bitir, I.; Minciuc, E.; Alexe, F.; Cenuse, V.; Raducanu, C.; Coman, C.; Constantin, C. Tratat de inginerie termică. District Heating—Cogeneration; Agir, Academia de Ştiinţe Tehnice Publisher: Bucharest, Romania, 2010; ISBN 978–973-720-314–4. [Google Scholar]
- Ea Energy Analyses. Renewable Energy Cost and Benefits for Society (RECABS). Final Technical Report. 2007. Available online: http://iea-retd.org/wp-content/uploads/2011/09/RECABs-final-report.pdf (accessed on 1 January 2020).
- ExternE. External Cost of Energy. Available online: http://www.externe.info/externe_d7/ (accessed on 7 July 2020).
- NREL. Simple Levelized Cost of Energy (LCOE) Calculator Documentation. Available online: https://www.nrel.gov/analysis/tech-lcoe-documentation.html (accessed on 8 July 2020).
- Evaluation Unit DG Regional Policy European Commission. Guide to Cost-Benefit Analysis of Investment Projects; European Union: Luxembourg, 2015. [Google Scholar]
- DOE. Levelized Cost of Energy (LCOE). Available online: https://www.energy.gov/sites/prod/files/2015/08/f25/LCOE.pdf (accessed on 7 July 2020).
- CEZ. Applicable Procedures for Design. Available online: https://www.cez.ro/ckfinder/userfiles/files/cez/despre-noi/cezd/proceduri-aplicabile-pentru-proiectare/metcalculanalindiceficieclucrinvest_rev04.pdf (accessed on 10 July 2020).
- Diaconescu, I.; Pătraşcu, R.; Tuţică, D.; Ionescu, C.; Minciuc, E. Influence of technical and economic factors in the assessment of energy efficiency projects in industry. In Proceedings of the 2019 International Conference on ENERGY and ENVIRONMENT (CIEM), Timişoara, Romania, 17–18 October 2019. [Google Scholar]


| Energy Consumption/Energy Production | UM | Value |
|---|---|---|
| - thermal energy production—heating | MWh | 281.00 |
| - thermal energy consumption—heating | MWh | 127.00 |
| - thermal energy consumption injection—DH | MWh | 154.00 |
| - electricity consumption for cold production | MWh | 4.43 |
| - electricity consumption for production—DHW | MWh | 0.69 |
| - electricity production from PV + PVT | MWh | 50.00 |
| - electricity consumption for building heating (related to GT-S scheme) | MWh | 42.33 |
| - electricity consumption for heat injection (related to GT-S scheme) | MWh | 51.33 |
| - total electricity consumption (related to GT-S scheme) | MWh | 93.67 |
| - reduced CO2 through the GT-S scheme for the building | t/year | 31.88 |
| - reduced CO2 through the GT-S scheme for the network | t/year | 32.00 |
| - building heating gas consumption | MWh/year | 138.00 |
| - combined heat power plant heating gas consumption (equivalent to injection) | MWh/year | 192.50 |
| - total gas consumption | MWh/year | 330.50 |
| Type of Cost [EUR] | Scenario 1 | Scenario 2 | Scenario 3 | |||
|---|---|---|---|---|---|---|
| UPB Investment Share | Total Investment | UPB Investment Share | Total Investment | UPB Investment Share | Total Investment | |
| Total investment [EUR] | 52,000 | 279,747 | 52,000 | 279,747 | 52,000 | 279,747 |
| Specific investment [EUR/kW] | 812.5 | 4371 | 812.5 | 4371 | 812.5 | 4371 |
| Total annual expenses [EUR/year] | −5992 | −5992 | 5609 | 5609 | 765 | 765 |
| Specific expenses [EUR/kW year] | 93.7 | 93.7 | 87.7 | 87.7 | 12 | 12 |
| Sales receipts [EUR/year] | 1916 | 1916 | 19,801 | 19,801 | 11,718 | 11,718 |
| Annual revenue [EUR/year] | 7909 | 7909 | 14,192 | 14,192 | 10,953 | 10,953 |
| Economic Performance Indicator | Scenario 1 | Scenario 2 | Scenario 3 |
|---|---|---|---|
| NPV [EUR] | 55,482 | 140,877 | 96,857 |
| PP [years] | 7.80 | 4 | 5.2 |
| GPP [years] | 6.58 | 3.66 | 4.75 |
| IRR [%] | 14.13% | 27.07% | 20.56% |
| Economic Performance Indicator | Scenario 1 | Scenario 2 | Scenario 3 | |||
|---|---|---|---|---|---|---|
| UPB Investment Share | Total Investment | UPB Investment Share | Total Investment | UPB Investment Share | Total Investment | |
| NPV [EUR] | 55,482 | −172,265 | 140,877 | −86,870 | 96,857 | −130,890 |
| PP [years] | 7.80 | >lifetime | 4 | >lifetime | 5.2 | >lifetime |
| GPP [years] | 6.58 | 35.37 | 3.66 | 19.71 | 4.75 | 25.54 |
| IRR [%] | 14.13% | −5.57% | 27.07% | 0.14% | 20.56% | −2.22% |
| Variable Factor | Solution 1 | |||
|---|---|---|---|---|
| NPV [EUR] | DR [years] | PP [years] | IRR [%] | |
| a [%] | ||||
| 4 | 140,877 | 3.66 | 4 | 27.07 |
| 5 | 124,867 | 3.66 | 4 | 27.07 |
| 6 | 110,784 | 3.66 | 4 | 27.07 |
| ep [EUR/MWh] | ||||
| 100 | 150,966 | 3.48 | 4 | 28.53 |
| 117 | 140,877 | 3.66 | 4 | 27.07 |
| 140 | 127,228 | 3.94 | 4.1 | 25.07 |
| qp [EUR/MWh] | ||||
| 55 | 107,854 | 4.42 | 5 | 22.21 |
| 63.65 | 140,877 | 3.66 | 4 | 27.07 |
| 75 | 184,231 | 2.99 | 3.2 | 33.32 |
| CO2p [EUR] | ||||
| 25 | 136,537 | 3.75 | 4.1 | 26.43 |
| 30 | 140,877 | 3.66 | 4 | 27.07 |
| 35 | 145,218 | 3.58 | 4 | 27.70 |
Publisher’s Note: MDPI stays neutral with regard to jurisdictional claims in published maps and institutional affiliations. |
© 2020 by the authors. Licensee MDPI, Basel, Switzerland. This article is an open access article distributed under the terms and conditions of the Creative Commons Attribution (CC BY) license (http://creativecommons.org/licenses/by/4.0/).
Share and Cite
Pătrașcu, R.; Ionescu, C.; Sandu, M.R.; Ban, D. Technical-Economic Analysis of a Hybrid Thermal Energy Supply System Based on Renewable Energy Sources. Proceedings 2020, 63, 19. https://0-doi-org.brum.beds.ac.uk/10.3390/proceedings2020063019
Pătrașcu R, Ionescu C, Sandu MR, Ban D. Technical-Economic Analysis of a Hybrid Thermal Energy Supply System Based on Renewable Energy Sources. Proceedings. 2020; 63(1):19. https://0-doi-org.brum.beds.ac.uk/10.3390/proceedings2020063019
Chicago/Turabian StylePătrașcu, Roxana, Constantin Ionescu, Mihai Rareș Sandu, and Diana Ban (Tuțica). 2020. "Technical-Economic Analysis of a Hybrid Thermal Energy Supply System Based on Renewable Energy Sources" Proceedings 63, no. 1: 19. https://0-doi-org.brum.beds.ac.uk/10.3390/proceedings2020063019