Stochastic Models of Particle Trajectories in Turbulent Atmosphere Flows by Using the LANGEVIN Equations †

1
Department of Physics, Faculty of Science Tetouan, University Abdelmalek Essaadi, Tetouan 93030, Morocco
2
Department STIC, National School of Applied Sciences at Tetouan, BP 2121, Tetouan 93030, Morocco
*
Author to whom correspondence should be addressed.
†
Presented at the 14th International Conference on Interdisciplinarity in Engineering—INTER-ENG 2020, Târgu Mureș, Romania, 8–9 October 2020.
Proceedings 2020, 63(1), 32; https://0-doi-org.brum.beds.ac.uk/10.3390/proceedings2020063032
Published: 17 December 2020
(This article belongs to the Proceedings of The 14th International Conference on Interdisciplinarity in Engineering—INTER-ENG 2020)
Abstract
:The stochastic behavior of wind speed is a particular characteristic of wind energy production, which affects the degradation mechanism of the turbine, resulting in stochastic charging on the wind turbine. A model stochastic is used in this study to evaluate the efficiency of wind turbine power of whatever degree given fluctuating wind turbulence data. This model is based on the Langevin equations, which characterize, by two coefficients, drift and diffusion functions. These coefficients describe the behavior of the transformation process from the input wind speed to the output data that need to be determined. For this present work, the computation of drift and diffusion functions has been carried out by using the stochastic model to assess the output variables in terms of the torque and power curves as a function of time, and it is compared by the classical method. The results show that the model stochastic can define the efficiency of wind turbine generation more precisely.
1. Introduction
Wind energy has become one of the most encouraging responses to global energy troubles. This is due to recent advances and intense research activities in engineering, meteorology, and physical sciences. However, there are still important difficulties to overcome, such as the following: firstly, the predictability and optimization of power production; and secondly, the high cost of constructing wind turbines by optimizing their control and monitoring [1]. In fact, the devices dedicated to the measure of some load types are expensive. Moreover, the unpredictable manner of wind makes it primordial to place more than one device at each turbine, in order to prevent the loss of load measurement accuracy. The estimation of loads applied to the wind turbine is important to estimate the life expectancy of the turbine. The arrangement of wind speed measurements at different wind turbines was used for generating the torque. This can serve to assess fatigue analysis of the wind turbine and the blades.
The pioneering work of Peinke and Friedrich in 1997 [2] was at the origin of the development of the Langevin approach, which consists of a direct method for extracting the evolution equation of a stochastic series of measurements. Improving the methods necessary for predicting the electrical power produced by wind farms is essential to increase the wind energy contribution to electrical and power production. In this context, several studies were conducted during the last decennary [3,4]. The framework developed by Milan et al. [5] consists of deriving a stochastic differential equation describing the evolution of the torque at one wind turbine. It shows through this method that, using only the load measurements at one single turbine and the set of wind speed measurements, the fatigue loads in any wind turbine within one wind park can be accurately estimated. In another study [6], and in order to establish a new stochastic modeling approach for the wake of a wind turbine, data were generated and analyzed by the turbulence-resolving large-eddy simulation (LES) PALM model. A procedure to derive stochastic wake models from costly computational fluid dynamics (CFD) was also presented. Lind, and her. [7] presented a stochastic approach to model the conversion process operated by a wind energy converter (WEC) used to convert wind fluctuations and wind gusts into electrical power fluctuations and power gusts fed into the grid. The result of the study they conducted shows the effect of turbulence on wind power production, as well as the importance of turbulence research to completely convert more wind energy into electrical networks. A more emphasized and detailed study conducted by the same researchers [8] had as an objective the development of a new stochastic approach in order to describe and remodel the conversion process of a wind farm considering the wind farm as a dynamical system described as a stochastic drift/diffusion model [9]. The Langevin equation was then used and adapted to the current system to model a synthetic signal of power output for any given wind speed/direction signals.
In this study, we carried out a stochastic analysis to model wind fluctuations created by a turbulent wind flow. A Langevin equation-based procedure was used. At that point, the electric power derived from wind was assessed by taking into account the dynamic response of a standard wind turbine under these wind field speed fluctuations. Then, the differential equations of the stochastic model were implemented by using Matlab simulation. The numerical simulation allowed the power variance to be extracted, based on wind velocity. Therefore, we conclude by showing that the results of stochastic modeling and the classical formula used for estimating the power are coherent. However, for reliable prediction of wind energy potential in a given site where wind speed is recorded instantaneously, the stochastic model is suggested. In future work, a comparative study of experimental data will be performed.
2. Features of the Wind Energy Converter Dynamics
One of the biggest issues in wind energy development is to properly estimate the output characterization of the wind turbine. Data estimation is needed to determine the power curve of a given machine. After all, it is certain that the wind speed and the power output are needed. It can also use the wind direction as theory relates the following:
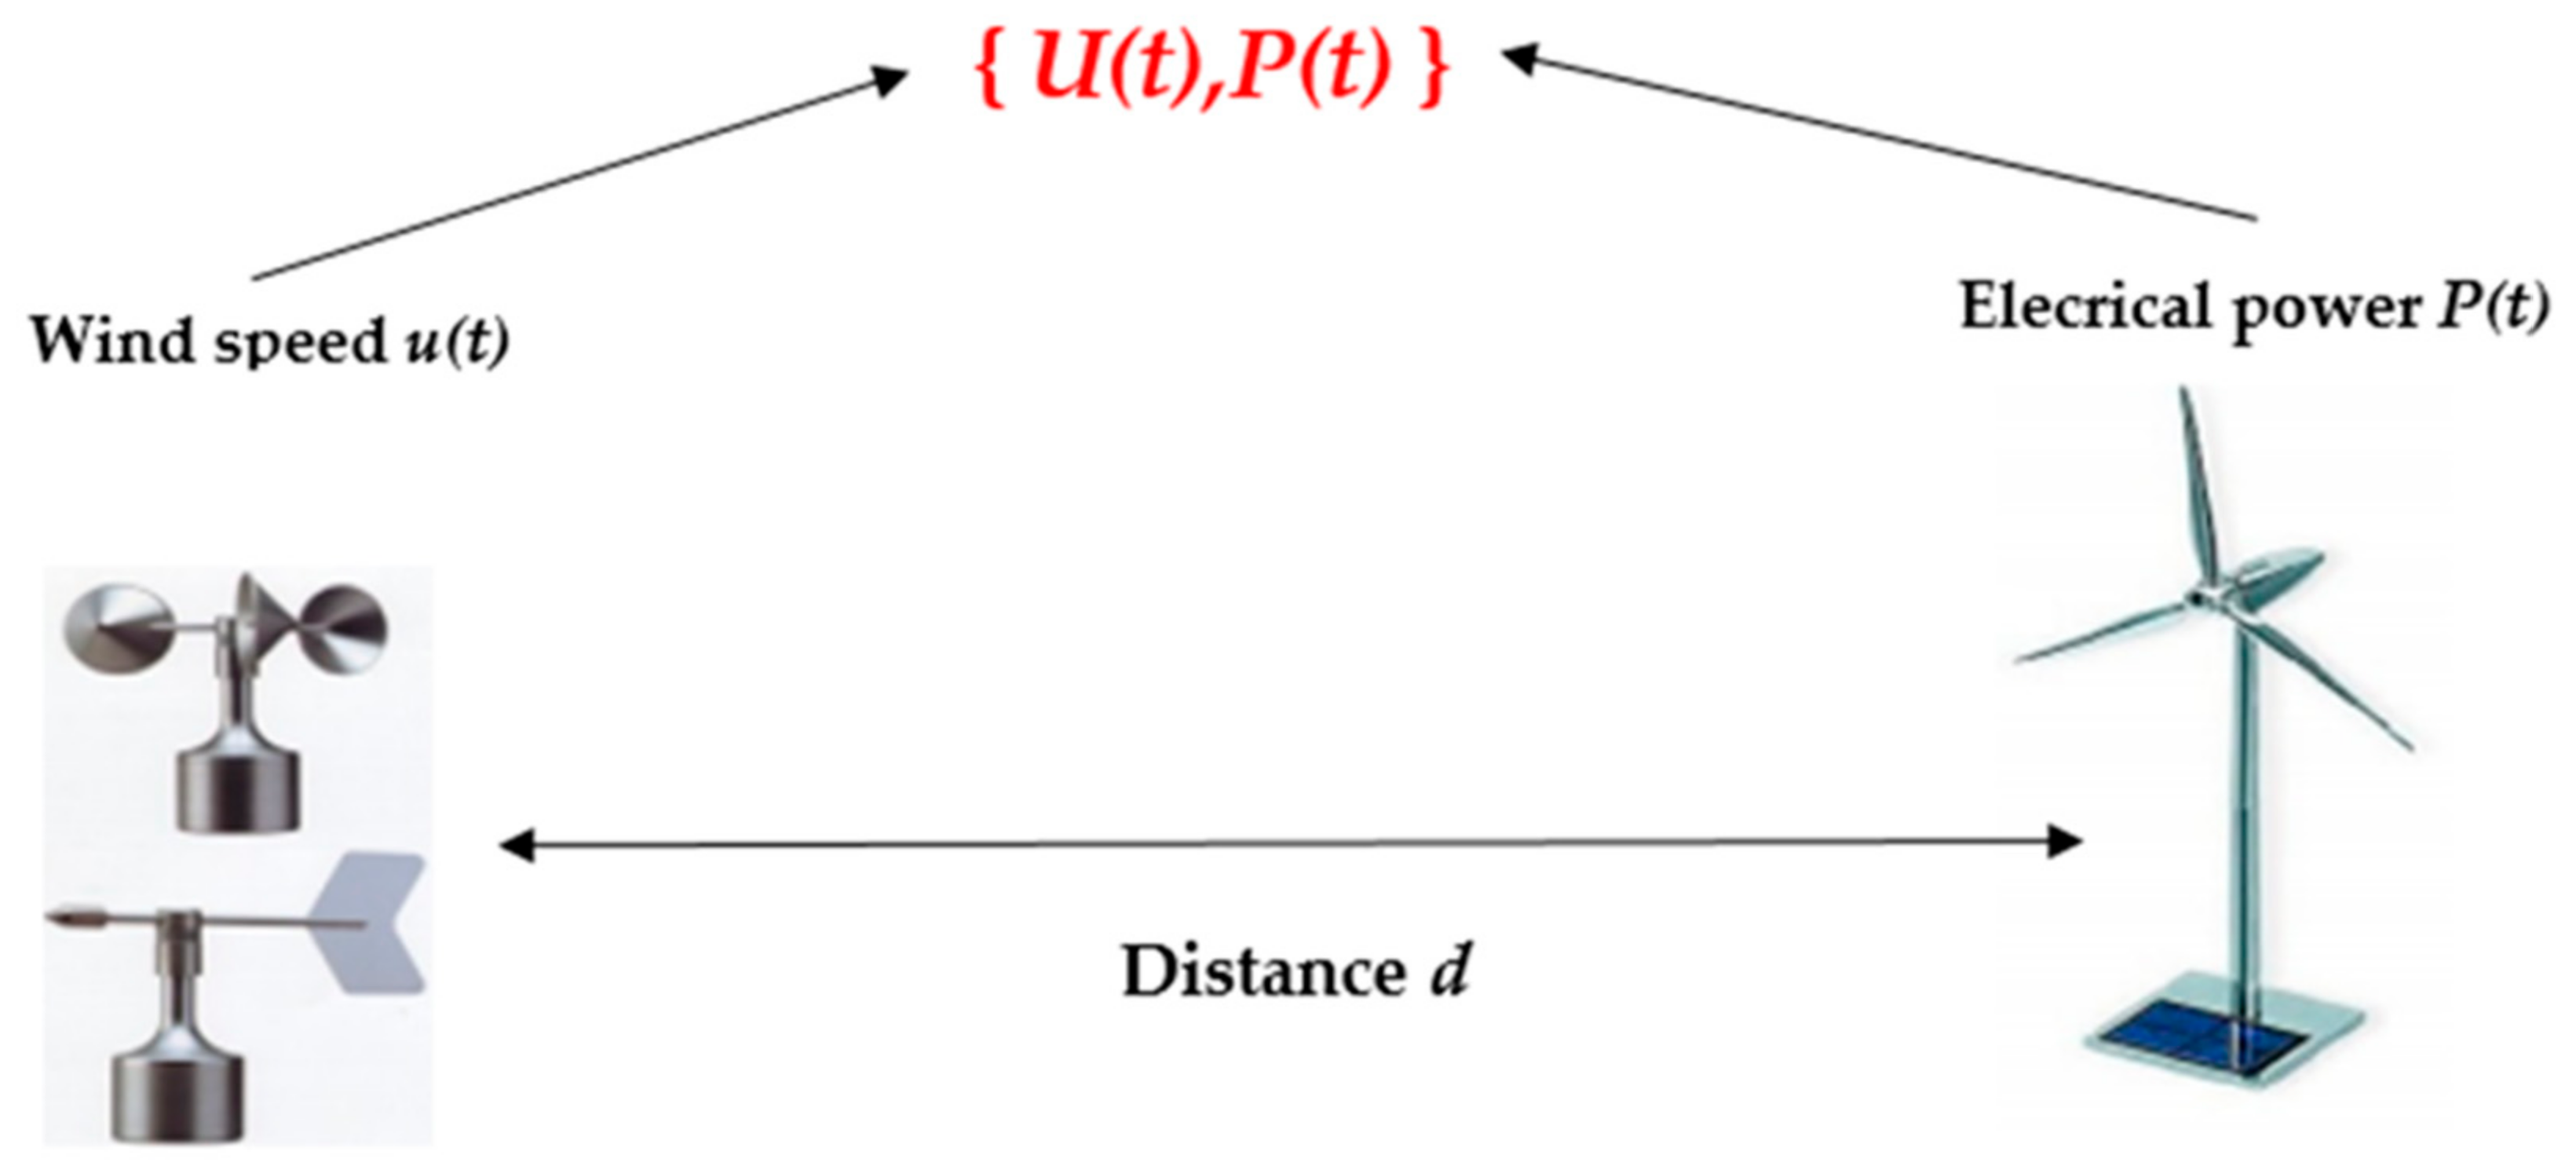
The study of wind is an essential step before any wind turbine installation project. Wind is a variable element and its change can depend on many phenomena, such as temporal phenomena and phenomena related to altitude. Typically, wind speed is measured by using an anemometer, as shown in Figure 1. The most common types are cup anemometers and ultrasonic anemometers. However, these sensors should be used for more than a year to characterize wind farms.
Measure Requirements
To simulate a wind energy converter’s power output properly, the stochastic model must be parameterized. Effective parameters can be derived from a calculation of interest taken out in advance at the WEC.
The variables to be evaluated are the WEC’s simultaneous wind speed u(t) and power output P(t) time signals. The sampling frequency of the time series must be of the order of 1 Hz, as shown in Figure 2.
Over most important features, the irregular tasteful essence of the wind is observed. This reflects the need for high-frequency measurements containing extensive information on the rapid variability, which is not available with the generic ten-minute average measurement technique.
This basically motivated us to study this aspect, as the most important aim to present this method is to model the complex statistics.
For an accurate display of the dynamics of the WEC, the original measurement should be sufficiently long to cover all the necessary wind conditions. Therefore, the wind speed u(t) should be estimated from the mast at hub height approach, as defined in the standard International Electrotechnical Commission power curve. For optimal performance, actual data requirements and corrections as defined in the IEC standard could be applied here [11]. Only the reported data sampling frequency must be in the range of 1 Hz instead of the average of ten minutes specified in the IEC standard.
For that reason, by definition, the stochastic model is applicable to power curve methods, since it attempts to transform wind velocity into power output. This intrinsic possible connection makes it a versatile tool that could be applied to any WEC design showing a clearly defined power curve. The measurement data used in this work contain 100 points, and the frequency takes the value of 25 Hz [12].
3. Mathematical Formulation
3.1. Basic Model
The equation of the kinetic energy of the wind is
The recovered power for a wind turbine is
where represents the power coefficient, indicates the surface swept by the wind turbine (m2), is the air density (1.225 kg/m3), and u represents the wind speed (m/s).
3.2. Stochastic Model
Differential equations are widely used to describe dynamic complex, nonlinear systems. Regardless of the ensemble averages, the focus is only on the instantaneous electric wind turbine power output [13,14,15]. This work covers the analysis stochastic based on a current model for rebuilding the increment statistics of the torque in single wind turbines as a tool for estimating fatigue loads of one wind turbine as well as of its neighbors. The condition of the Langevin equation used here as the model is defined as
where T represents the torque at the wind turbine, u is the wind speed, is a Gaussian, is the correlated white noise, is the drift function, and is the diffusion function.
and , appearing in Equation (3), can be calculated by using a time record of torque by means of the first and second statistical conditional moments, respectively:
where indicates the average over the full time series, whenever takes the value T and wind speed [7].
In order to stochastically model the torque, we use the Langevin Equation (3) referred to above to produce the torque by coordinating wind speed measurements at various wind turbines. It will serve to test wind turbine power performance.
4. Results and Discussion
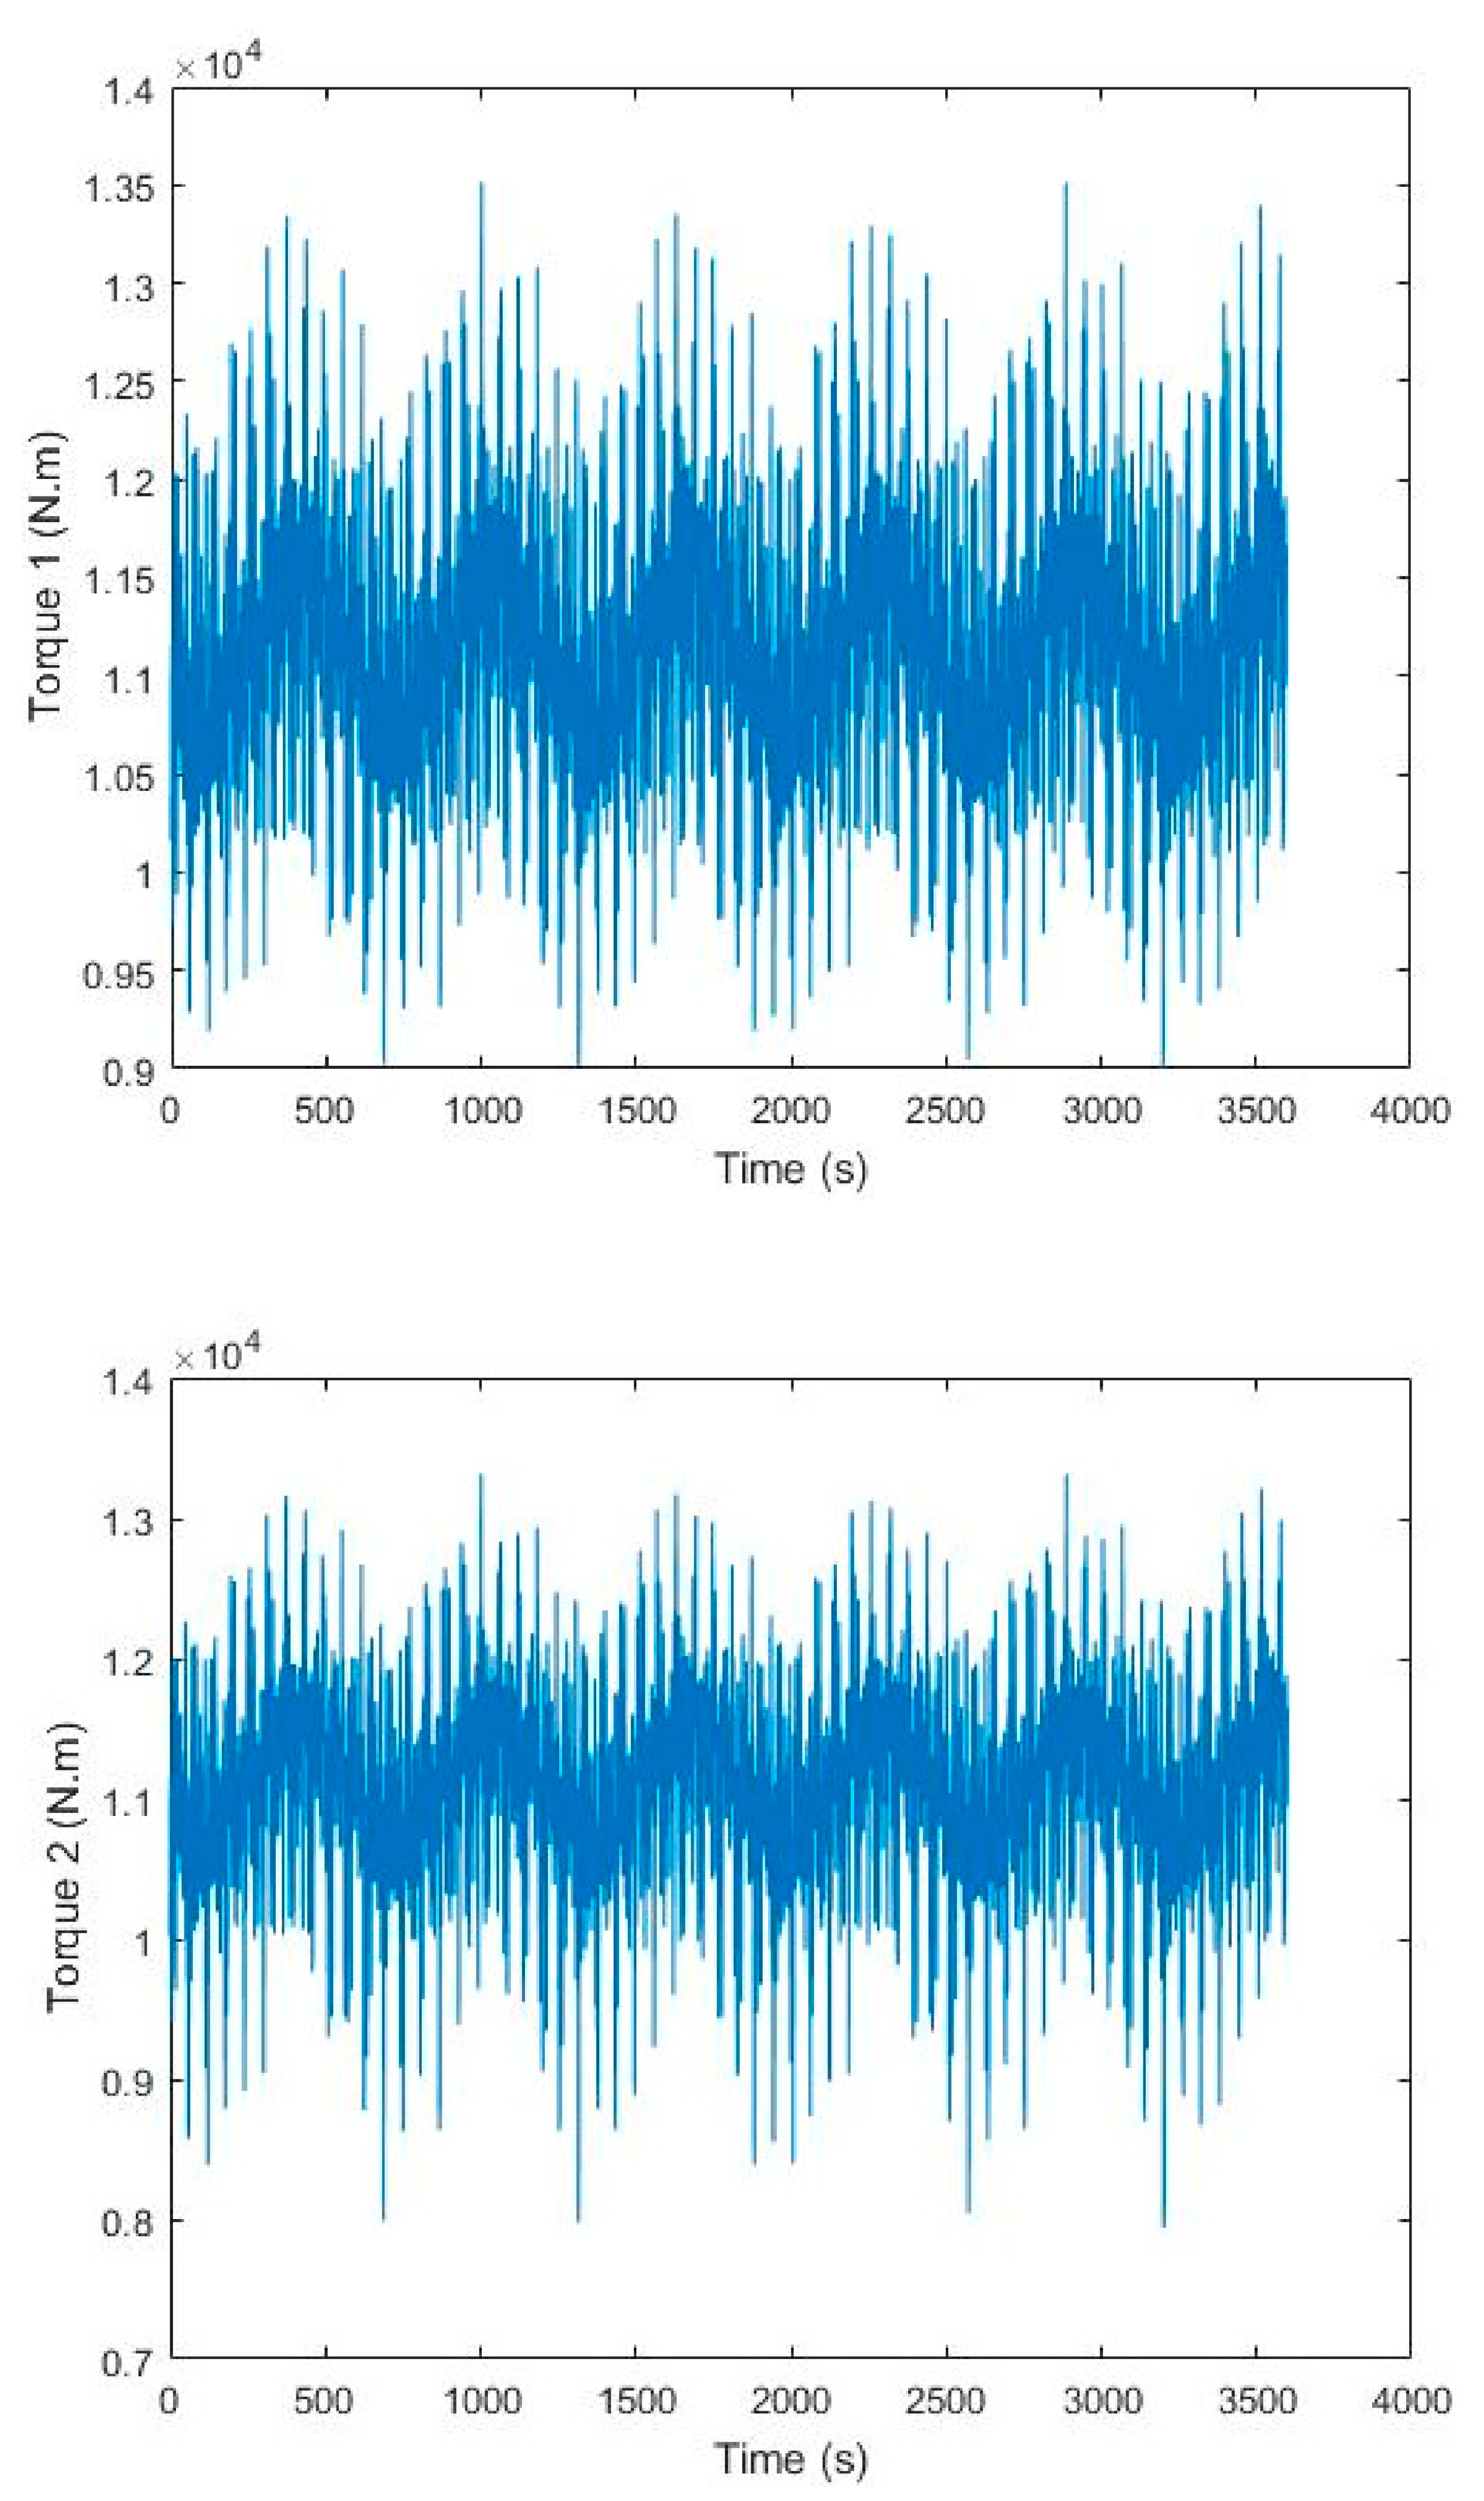
From Figure 3 that represents the values of torque 1 and torque 2 calculated using the classical instantaneous method, the coefficients , , , and are calculated from Equations (4) and (5), respectively. These coefficients are shown in Table 1.
The results obtained by the implemented Equation (3) in the Matlab code using the coefficients indicated in Table 1 are shown in Figure 4. As we can see clearly in Figure 4 (left), which presents the distribution curves of the torque, there is a good coherence between the classical mechanical model (blue line) and the stochastic model that we proposed (red line). This model, as it gives us a large interval of torque values for a single wind speed value, helps us to control, more precisely, the value of the torque and, therefore, the value of the extracted power, which is clearly a significant advantage of using the stochastic model.
We can also see that the torque spectrum has an upper limit, which gives us a more real picture of the wind turbine’s operation. Since wind is very dynamic in nature, the resulting forces are also dynamic in nature. A stochastic approach is proposed not only for modeling, but also for accessing and extracting most of the information available in the torque and power dynamics.
In the operation of the wind turbine, we find that the torque probability density functions are limited to extreme wind speeds, which helps to explain the effect of turbulence on the quality and quantity of aerodynamic torque.
5. Conclusions
This paper had as an objective the development of a stochastic analysis to help predict the capacity of wind energy given the instantaneous records of wind speed. To do so, our approach consists of using a stochastic drift/diffusion model based on the Langevin equation to describe the attraction towards the power curve and the additional turbulent fluctuations, respectively.
This method characterizes wind turbine power curves and torque more accurately and independently of specific parameters of the site such as intense turbulence. This approach can be used to conduct numerical simulation in order to estimate the wind velocity and, therefore, it seems to be fully capable of treating the turbulent field. In addition, it can be used to re-estimate, more reliably, the expected amount of electric energy that is available for a given implementation site in a wind farm. It can be concluded that the stochastic approach can improve the accuracy of the standard determined approach.
With these objectives in mind, we are going to focus on the application of the presented approach in this article on real generated data in our future work.
Conflicts of Interest
The author declare no conflict of interest.
References
- Joaquin, M.A. Curso de Energía Eólica; Universidad de Zaragoza: Zaragoza, Spain, 2009; ISBN 84-95050-07-2. [Google Scholar]
- Friedrich, R.; Peinke, J. Description of a Turbulent Cascade by a Fokker-Planck Equation. Phys. Rev. Lett. 1997, 78, 863–866. [Google Scholar] [CrossRef]
- Bechrakis, D.A.; Deane, J.P.; McKeogh, E.J. Wind resource assessment of an area using short term data correlated to a long term data set. Sol. Energy 2004, 76, 725–732. [Google Scholar] [CrossRef]
- Celik, A.N. Weibull representative compressed wind speed data for energy and performance calculations of wind energy systems. Energy Convers. Manag. 2003, 44, 3057–3072. [Google Scholar] [CrossRef]
- Patrick, M.; Allan, M.; Matthias, W.; Joachim, P. Wind Energy: A Turbulent, Intermittent Resource. In Wind Energy—Impact of Turbulence; Springer: Berlin, Germany, 2014; Volume 2, pp. 73–78. [Google Scholar]
- Bastine, D.; Vollmer, L.; Wächter, M.; Peinke, J. Stochastic wake modelling based on POD analysis. Energies 2018, 11, 612. [Google Scholar] [CrossRef]
- Lind, P.G.; Herráez, I.; Wächter, M.; Peinke, J. Fatigue load estimation through a simple stochastic model. Energies 2014, 7, 8279–8293. [Google Scholar] [CrossRef]
- Milan, P.; Peinke, J. Stochastic modeling and performance monitoring of wind farm power production. J. Renew. Sustain. Energy, 2014; 6. [Google Scholar]
- Cremona, C.; Arnaud, G. Développement d’algorithmes de simulation de champs de vitesse de vent; Laboratoire Centrale des Ponts et Chaussées: Paris, France, 1997; ISBN 2-7208-2620-0. [Google Scholar]
- Patrick, F.; Peinke, J.; Gottschall, J.; Laurent, C.; Patrick, M. The Stochastic Power Curve Analysis of Wind Turbines; University of Oldenburg Institute of Physics: Oldenburg, Germany, 2008. [Google Scholar]
- Milan, P.; Wächter, M.; Peinke, J. Stochastic modeling of wind power production. In Proceedings of the European Wind Energy Conference & Exhibition 2011, EWEC 2011, Brussel, Belgium, 14–17 March 2011; pp. 176–180. [Google Scholar]
- Anahua, E.; Barth, S.; Peinke, J. Markovian power curves for wind turbines. Wind Energy 2008, 11, 219–232. [Google Scholar] [CrossRef]
- Anahua, E.; Barth, S.; Peinke, J. Characterisation of the Power Curve for Wind Turbines by Stochastic Modelling. Wind Energy, 2007; 173–177. [Google Scholar]
- Chen, X.; Li, L.Q.S. Stochastic Evolutions of Dynamic Traffic Flow Modeling and Applications; Springer: Beijing, China, 2015; ISBN 9783662445716. [Google Scholar]
- Rodean, H.C. Turbulent Diffusion as a Stochastic Lagrangian Process; American Meteorological Society: Boston, MA, USA, 1996; Volume 26, ISBN 9781878220233. [Google Scholar]
Figure 1.
Measuring equipment of the wind speed and electrical power [10].
Figure 1.
Measuring equipment of the wind speed and electrical power [10].

Figure 2.
Schematization of the wind speed (right) and power output (left) at a frequency of 1 Hz.

Figure 3.
Representations of torque 1 (line 1) and torque 2 (line 2), which were used to calculate and .
Figure 3.
Representations of torque 1 (line 1) and torque 2 (line 2), which were used to calculate and .

Figure 4.
Representations of the numerical computation power (w) (up) and torque (N.m) (down) curves at a frequency of 25 Hz containing 100 points; the frequency is similar to [12].
Figure 4.
Representations of the numerical computation power (w) (up) and torque (N.m) (down) curves at a frequency of 25 Hz containing 100 points; the frequency is similar to [12].


Table 1.
Coefficients values used as inputs in the Matlab code.
| 1.3829 | 1.7395 × 10⁵ | 1.6116 | 1.9925 × 10⁵ |
Publisher’s Note: MDPI stays neutral with regard to jurisdictional claims in published maps and institutional affiliations. |
© 2020 by the authors. Licensee MDPI, Basel, Switzerland. This article is an open access article distributed under the terms and conditions of the Creative Commons Attribution (CC BY) license (https://creativecommons.org/licenses/by/4.0/).
Share and Cite
MDPI and ACS Style
Qasemy, Y.E.; Achahbar, A.; Khamlichi, A. Stochastic Models of Particle Trajectories in Turbulent Atmosphere Flows by Using the LANGEVIN Equations. Proceedings 2020, 63, 32. https://0-doi-org.brum.beds.ac.uk/10.3390/proceedings2020063032
AMA Style
Qasemy YE, Achahbar A, Khamlichi A. Stochastic Models of Particle Trajectories in Turbulent Atmosphere Flows by Using the LANGEVIN Equations. Proceedings. 2020; 63(1):32. https://0-doi-org.brum.beds.ac.uk/10.3390/proceedings2020063032
Chicago/Turabian StyleQasemy, Youssra El, Abdelfatah Achahbar, and Abdellatif Khamlichi. 2020. "Stochastic Models of Particle Trajectories in Turbulent Atmosphere Flows by Using the LANGEVIN Equations" Proceedings 63, no. 1: 32. https://0-doi-org.brum.beds.ac.uk/10.3390/proceedings2020063032