1. Introduction
Digital image correlation (DIC) is an optical high-resolution data acquisition method and a viable alternative technique to mechanical laboratory measurements of reinforced concrete element deformations. In the field of structural engineering, this technique is used for recording vertical and horizontal displacements, evaluation of changes in strain and crack development. The DIC method has the potential to become an efficient solution for field monitoring [
1,
2].
DIC uses mathematical correlation analysis to examine a digital image captured during a mechanical test on a reinforced concrete element. The principle of the method is to compare an initial reference image with a series of subsequent images of the element after deformation. With computer software, the displacements of the points in the “deformed” images are calculated relative to the initial “non-deformed” reference image [
3]. Different areas, instead of just points, of the element can also be addressed. As a result, an analysis of a full field deformation of the target area can be performed by comparing the initial and final positions of its subareas [
4,
5]. Therefore, one of the main advantages of using an image processing technique is the possibility to monitor the entire element and determine the exact places where the destruction begins [
6].
The provision of a small circular opening through a concrete beam changes the simple beam behavior, producing discontinuity in the normal distribution of stresses, leading to early cracking around the opening and reduction of the ultimate strength. In these types of beams, in some cases the collapse is originated from shear stresses [
7]. The ability to monitor strain development and crack propagation near the opening can provide important information to prevent a sudden collapse.
The main purpose of the study is to perform a comparison between traditional and optical measurements in order to evaluate the efficiency of the DIC technique in recording the vertical displacements, evaluation of changes in strain and crack development of reinforced concrete beams.
2. Materials and Methods
2.1. Materials
The materials used were: cement CEM I 52.5 R, according to SR EN 197-1 [
8]; fly ash originated from Govora Power Station, Romania; limestone filler produced by Holcim Turda Grinding Plant, Romania; natural aggregates with 16 mm maximum size; polyether carboxylates high range water reducer (HRWR), Sika ViscoCrete 20 HE.
2.2. Mix Proportions
Two concrete compositions were designed. One concrete composition was designed with a high volume of fly ash (SCC-CZ). The concrete class of the SCC-CZ composition was C50/60. The other composition was designed with limestone filler addition (SCC-FC), developing a concrete class of C55/67. The mix proportions are detailed in
Table 1.
2.3. Test Specimens
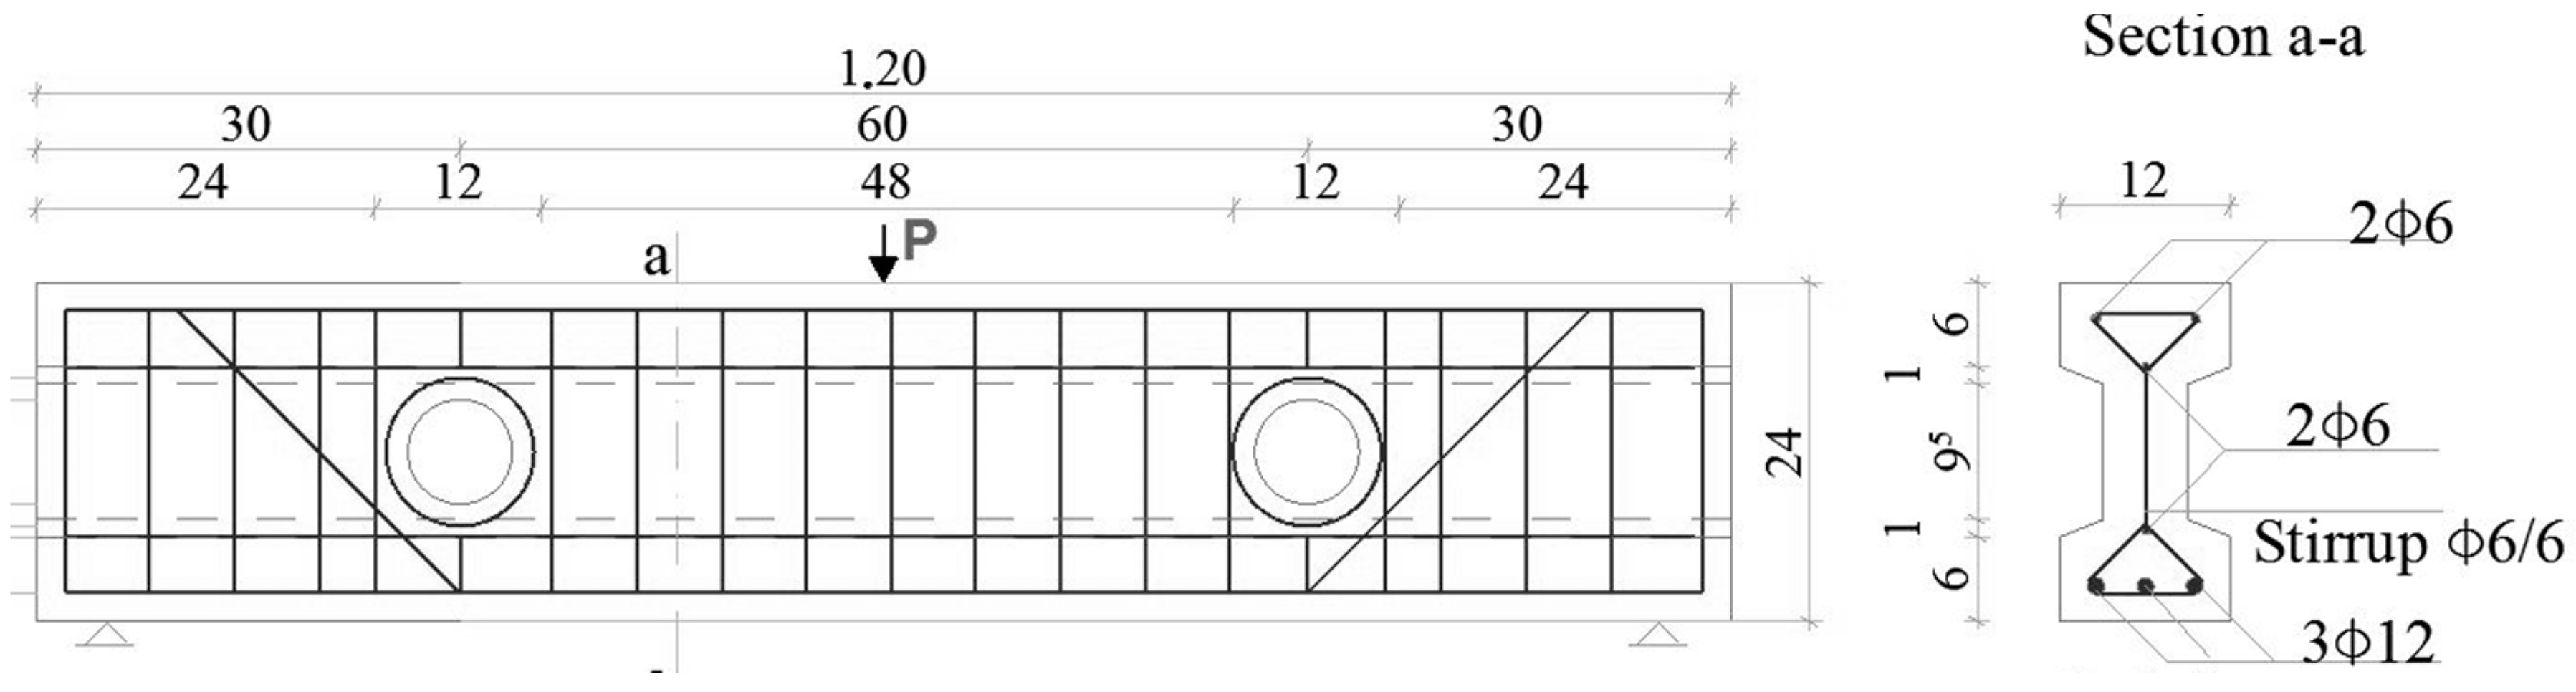
The experimental program analyzed the flexural and shear behavior of two reinforced self-compacting concrete beams with small circular openings with fly ash addition and limestone filler addition, exposed to 100 freeze–thaw cycles. The beams were 1.20 m long with two 75 mm diameter circular openings. The beams had the same cross-sections and reinforcement detailing (
Figure 1).
2.4. Experimental Methods
The beams were cured for 90 days in laboratory conditions (RH = 65 ± 5% and T = 20 ± 2 °C) and then exposed to 100 freeze–thaw cycles (17 days). At the end of the exposure time, the beams were subjected to a 3-point bending test. The beams were tested with a 300 ton hydraulic press and loaded with one concentrated load. The load was gradually applied in 5 kN incremental steps until failure. Cracks at each load increment were marked and mapped (
Figure 2).
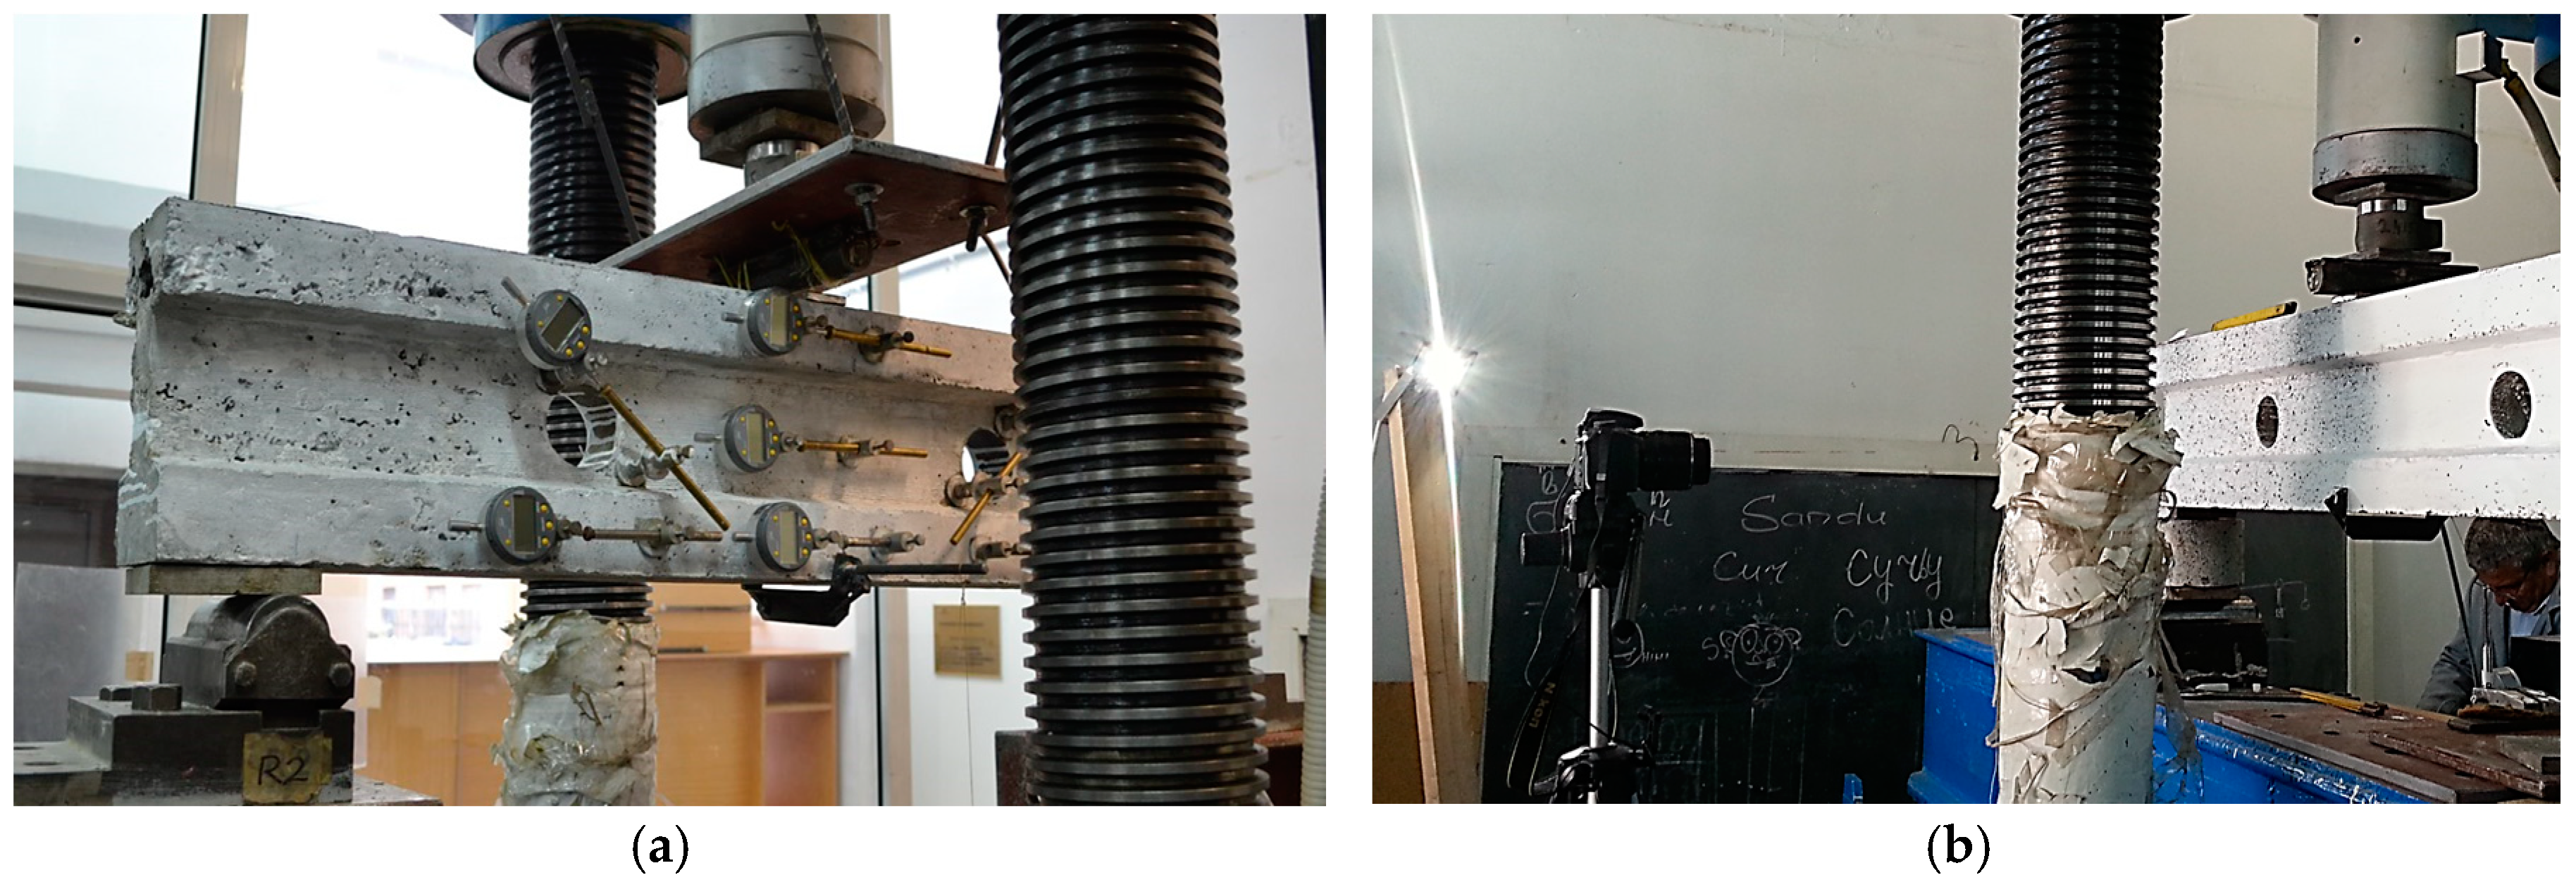
The concrete strain values at mid-span were measured using strain gauges with a 0.001 mm accuracy (
Figure 3a). To measure the mid-span deflection, we used an LVDT (Linear Variable Differential Transformer) displacement transducer connected to a data acquisition system (Spider 8 basic device with 4.8 kHz carrier-frequency technology). The sensor type used was WA 300 mm.
Half of each beam was analyzed with the DIC method. The equipment required to apply the optical method (DIC) consisted of a high-resolution digital camera (NIKON D3100, 14.2-megapixel DX format DSLR Nikon F-mount camera, AF-S DX NIKKOR 18-55mm f/3.5-5.6G VR lens, made in Thailand), computer software for image analysis (GOM Correlate 2016, developed by GOM Metrology, Braunschweig, Germany), white and black paint, and a light source (
Figure 3b).
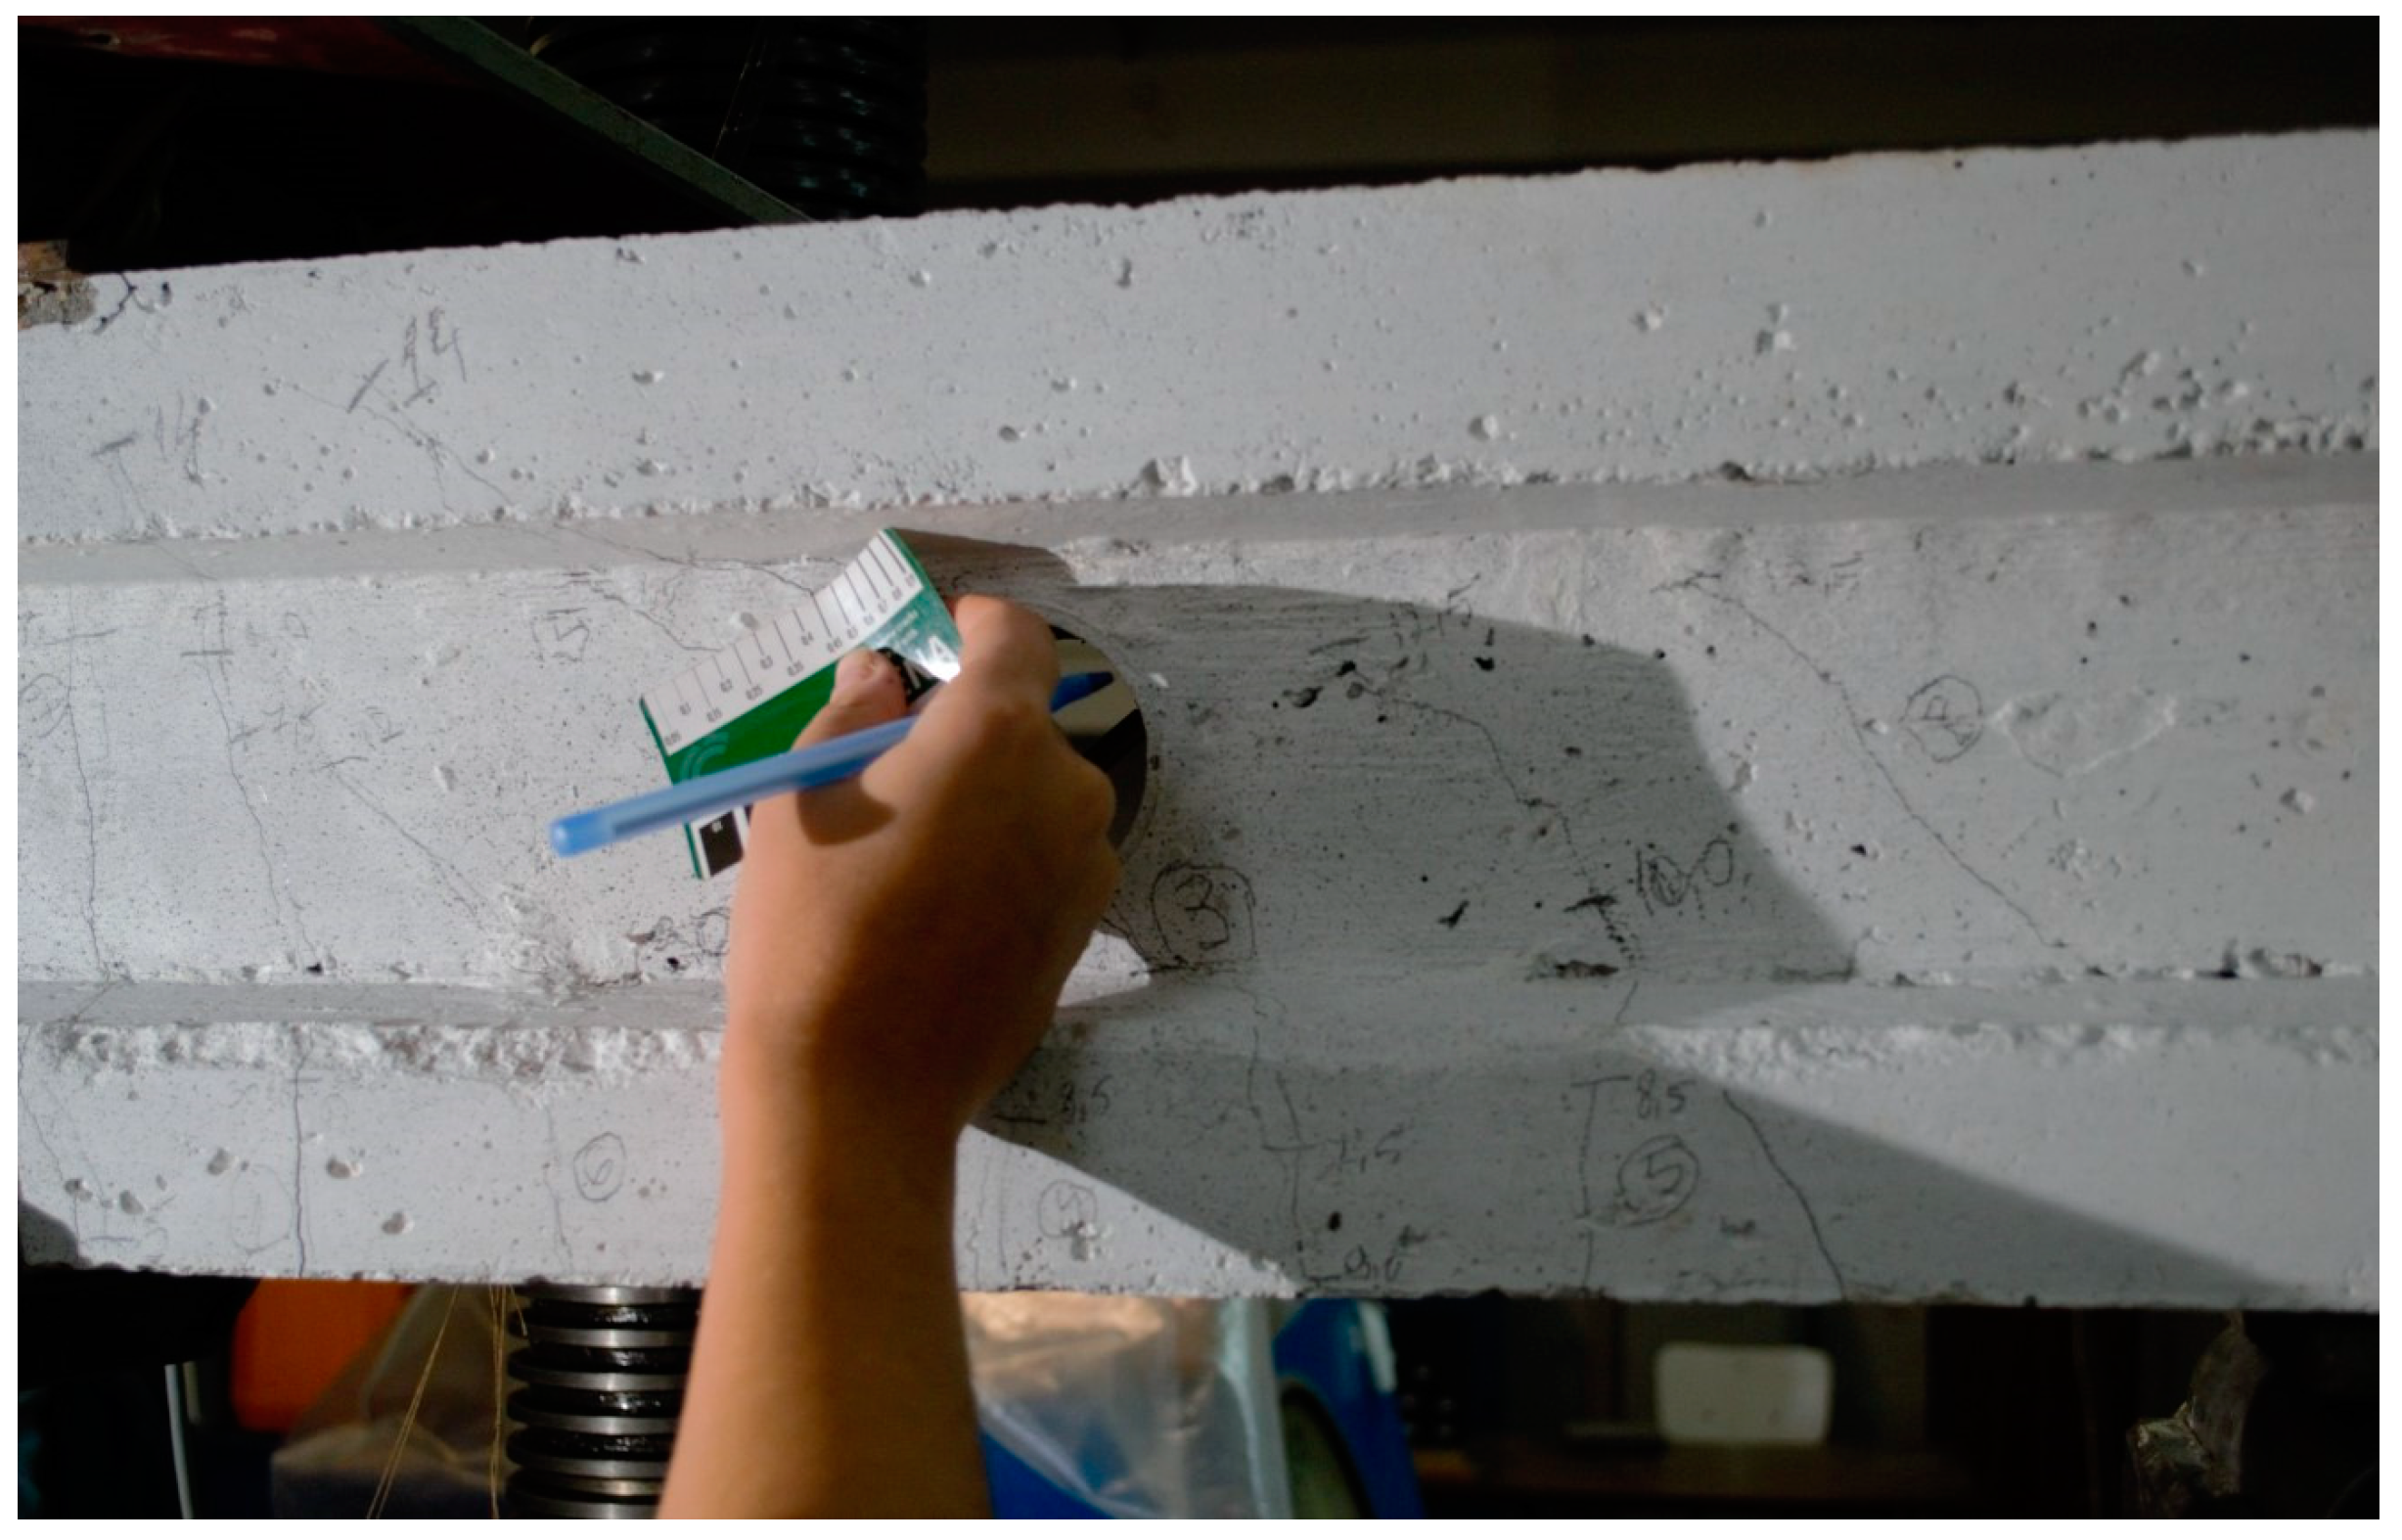
For the success of optical measurements, a good speckle pattern is essential (
Figure 4). For this purpose, a thin layer of white paint (washable paint) was applied on half of the beam surface. When the white paint dried, we applied black matte spray paint (alkyd paint).
The camera was fixed on a tripod with its axis normal to the area of interest. External lighting was directed toward the region of interest to enhance the images. Before starting the test, a reference picture was taken (non-deformed image). While the specimen was subjected to the test, consecutive images were taken (deformed images) until the failure of the beam. The images were analyzed with GOM Correlate 2016 software.
3. Results and Discussion
3.1. Load-Deflection Behavior
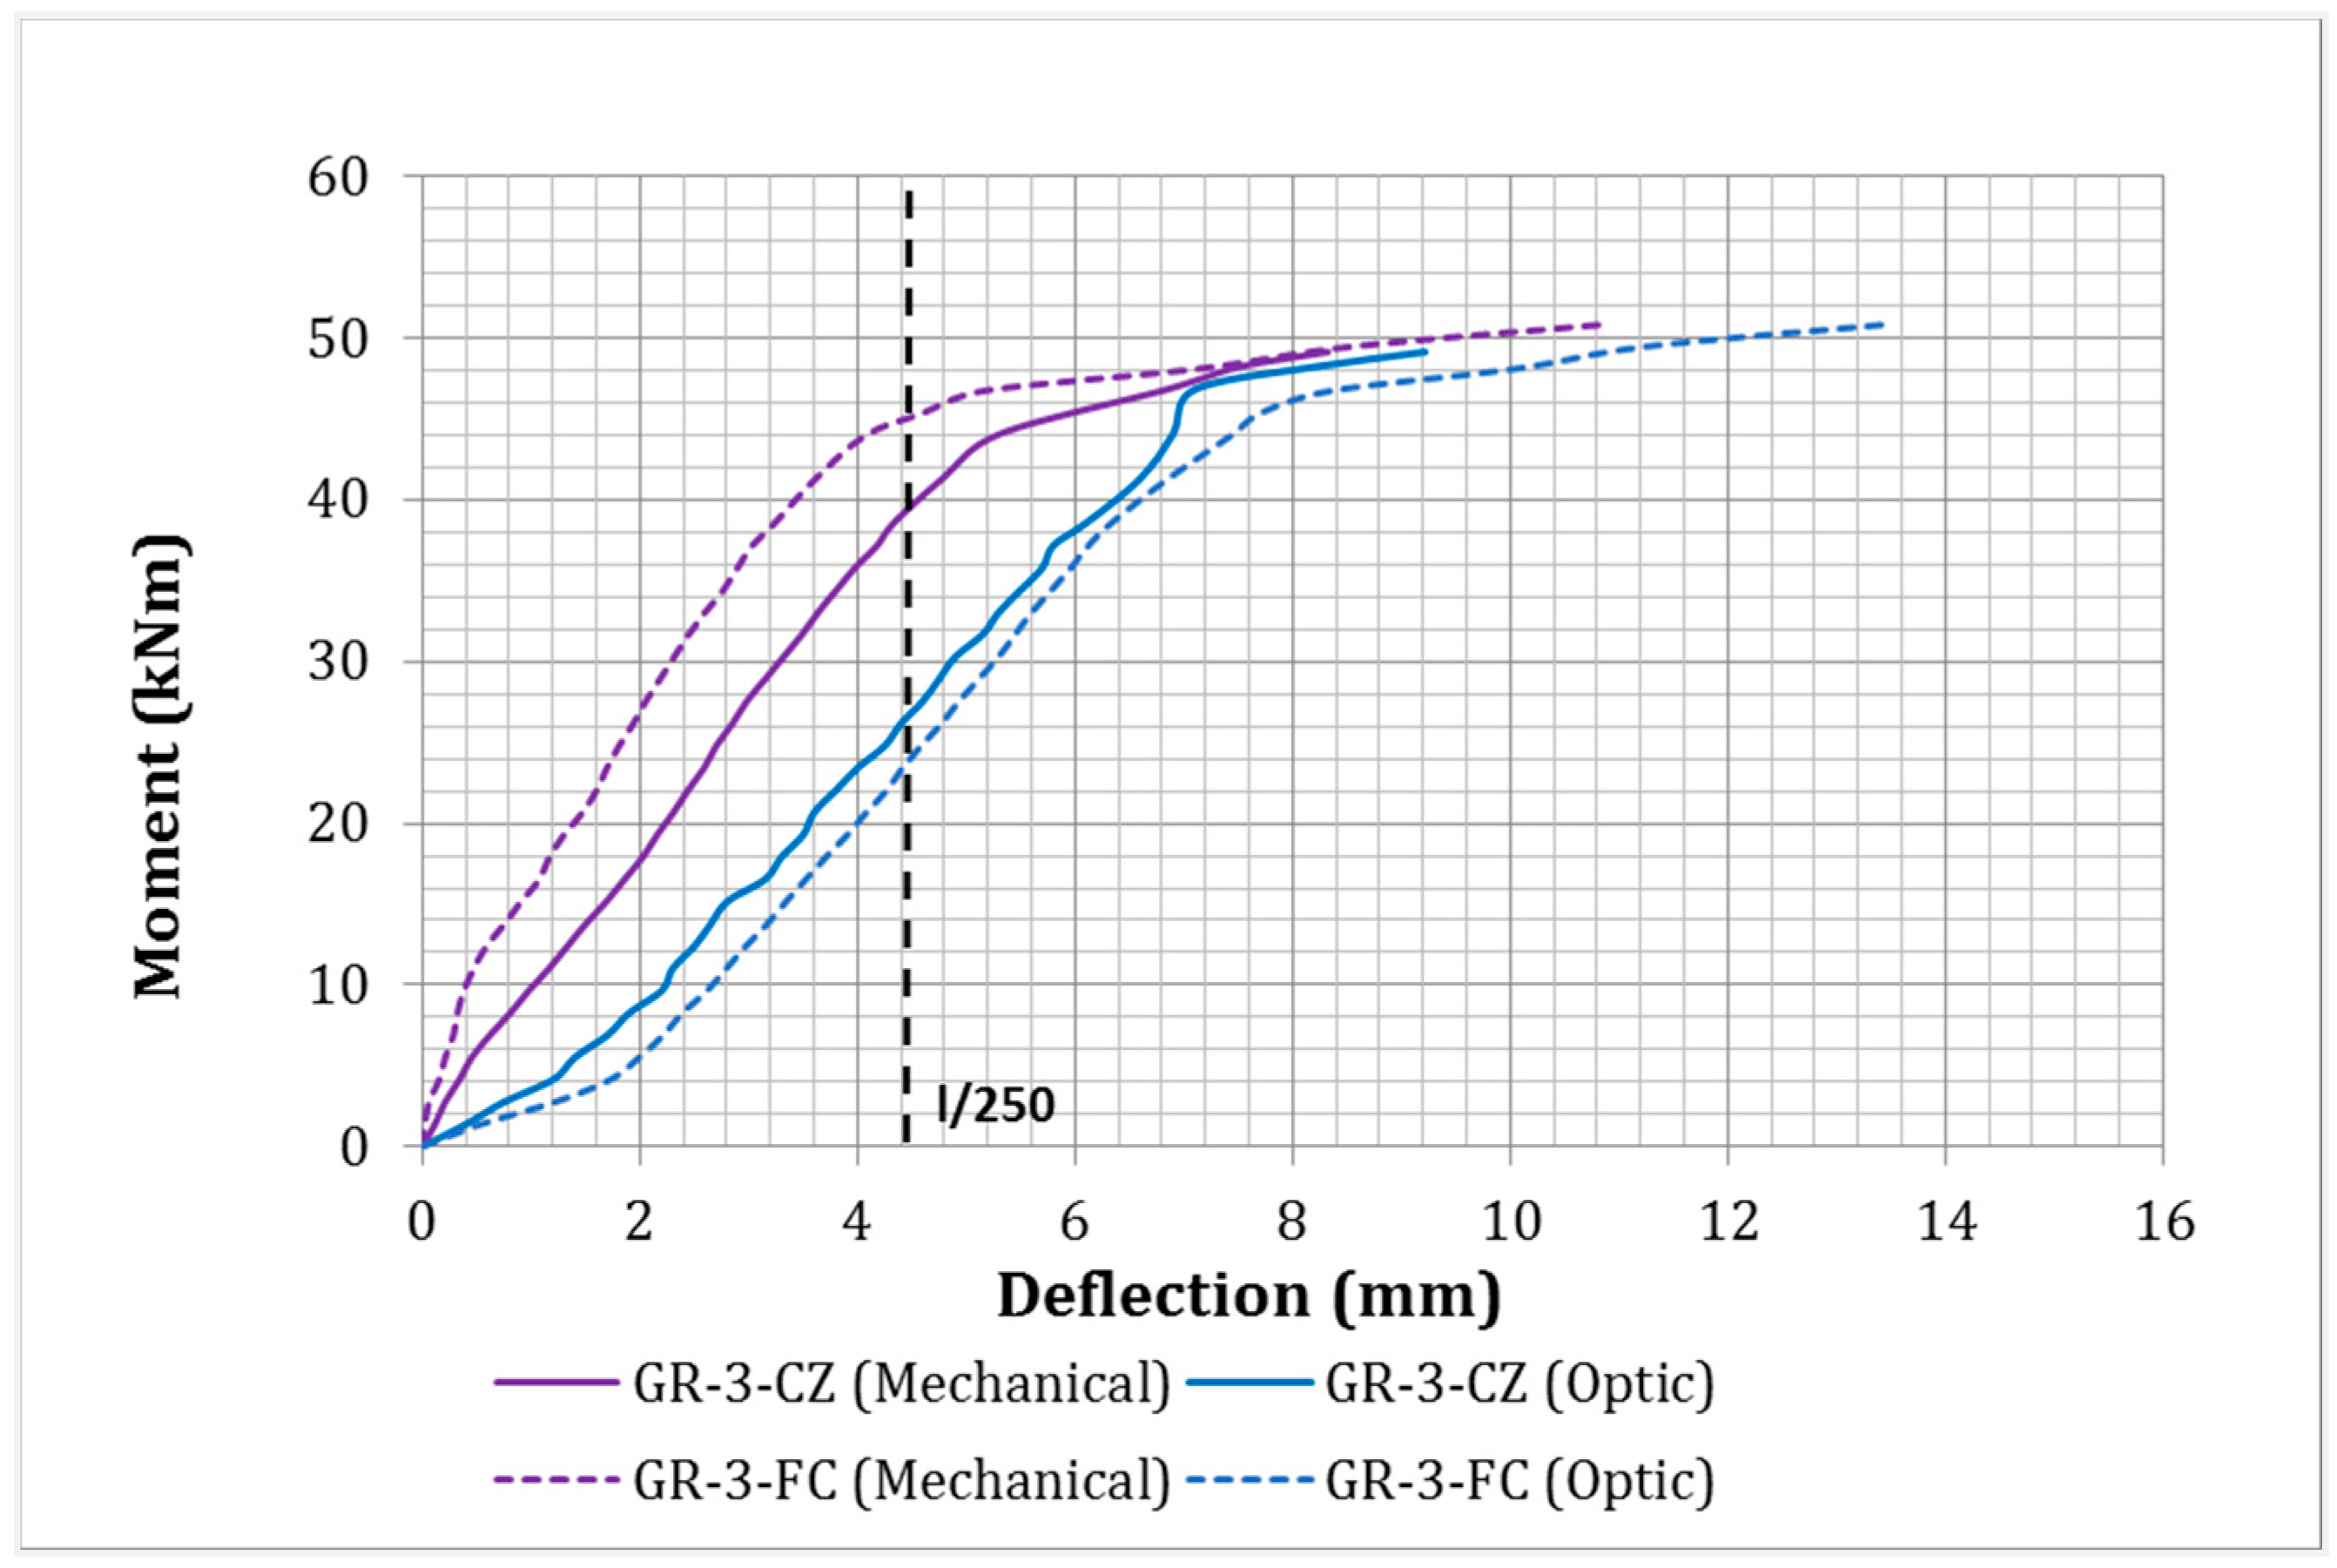
The moment-deflection curves of the fly ash beam (GR-3-CZ) and the limestone beam (GR-3-FC) are presented in
Figure 5. Interpretation of results consisted of comparing the moment-deflection response of each beam according to the mechanical and optical method. In performing a comparison between the two methods used to record the displacement measurements, we noticed some differences. The mid-span deflection of the fly ash beam recorded with the DIC method was around 10% higher than the deflection recorded with the mechanical method. For the limestone beam, the increase was up to 25%. Joshi et al. (2018) performed a comparison between the load-deflection response of steel-fiber-reinforced prestressed concrete beams using DIC analysis and a conventional linear variable transducer. The authors concluded that the results from the DIC analysis showed a close agreement with the mechanical measurements [
9].
A comparison was also performed in order to analyze the influence of using high-volume fly ash addition on the behavior of reinforced concrete beams with web openings exposed to freeze–thaw cycles. The fly ash beam (GR-3-CZ) exhibited a lower ductility and ultimate strength compared with the limestone beam (GR-3-FC) because, as other researchers concluded, the increase in the strength of concrete improves the general behavior of beams with small circular openings [
10]. As well, other studies confirmed that dosages higher than 35% of fly ash decrease the compressive and mechanical strength of concrete [
11,
12].
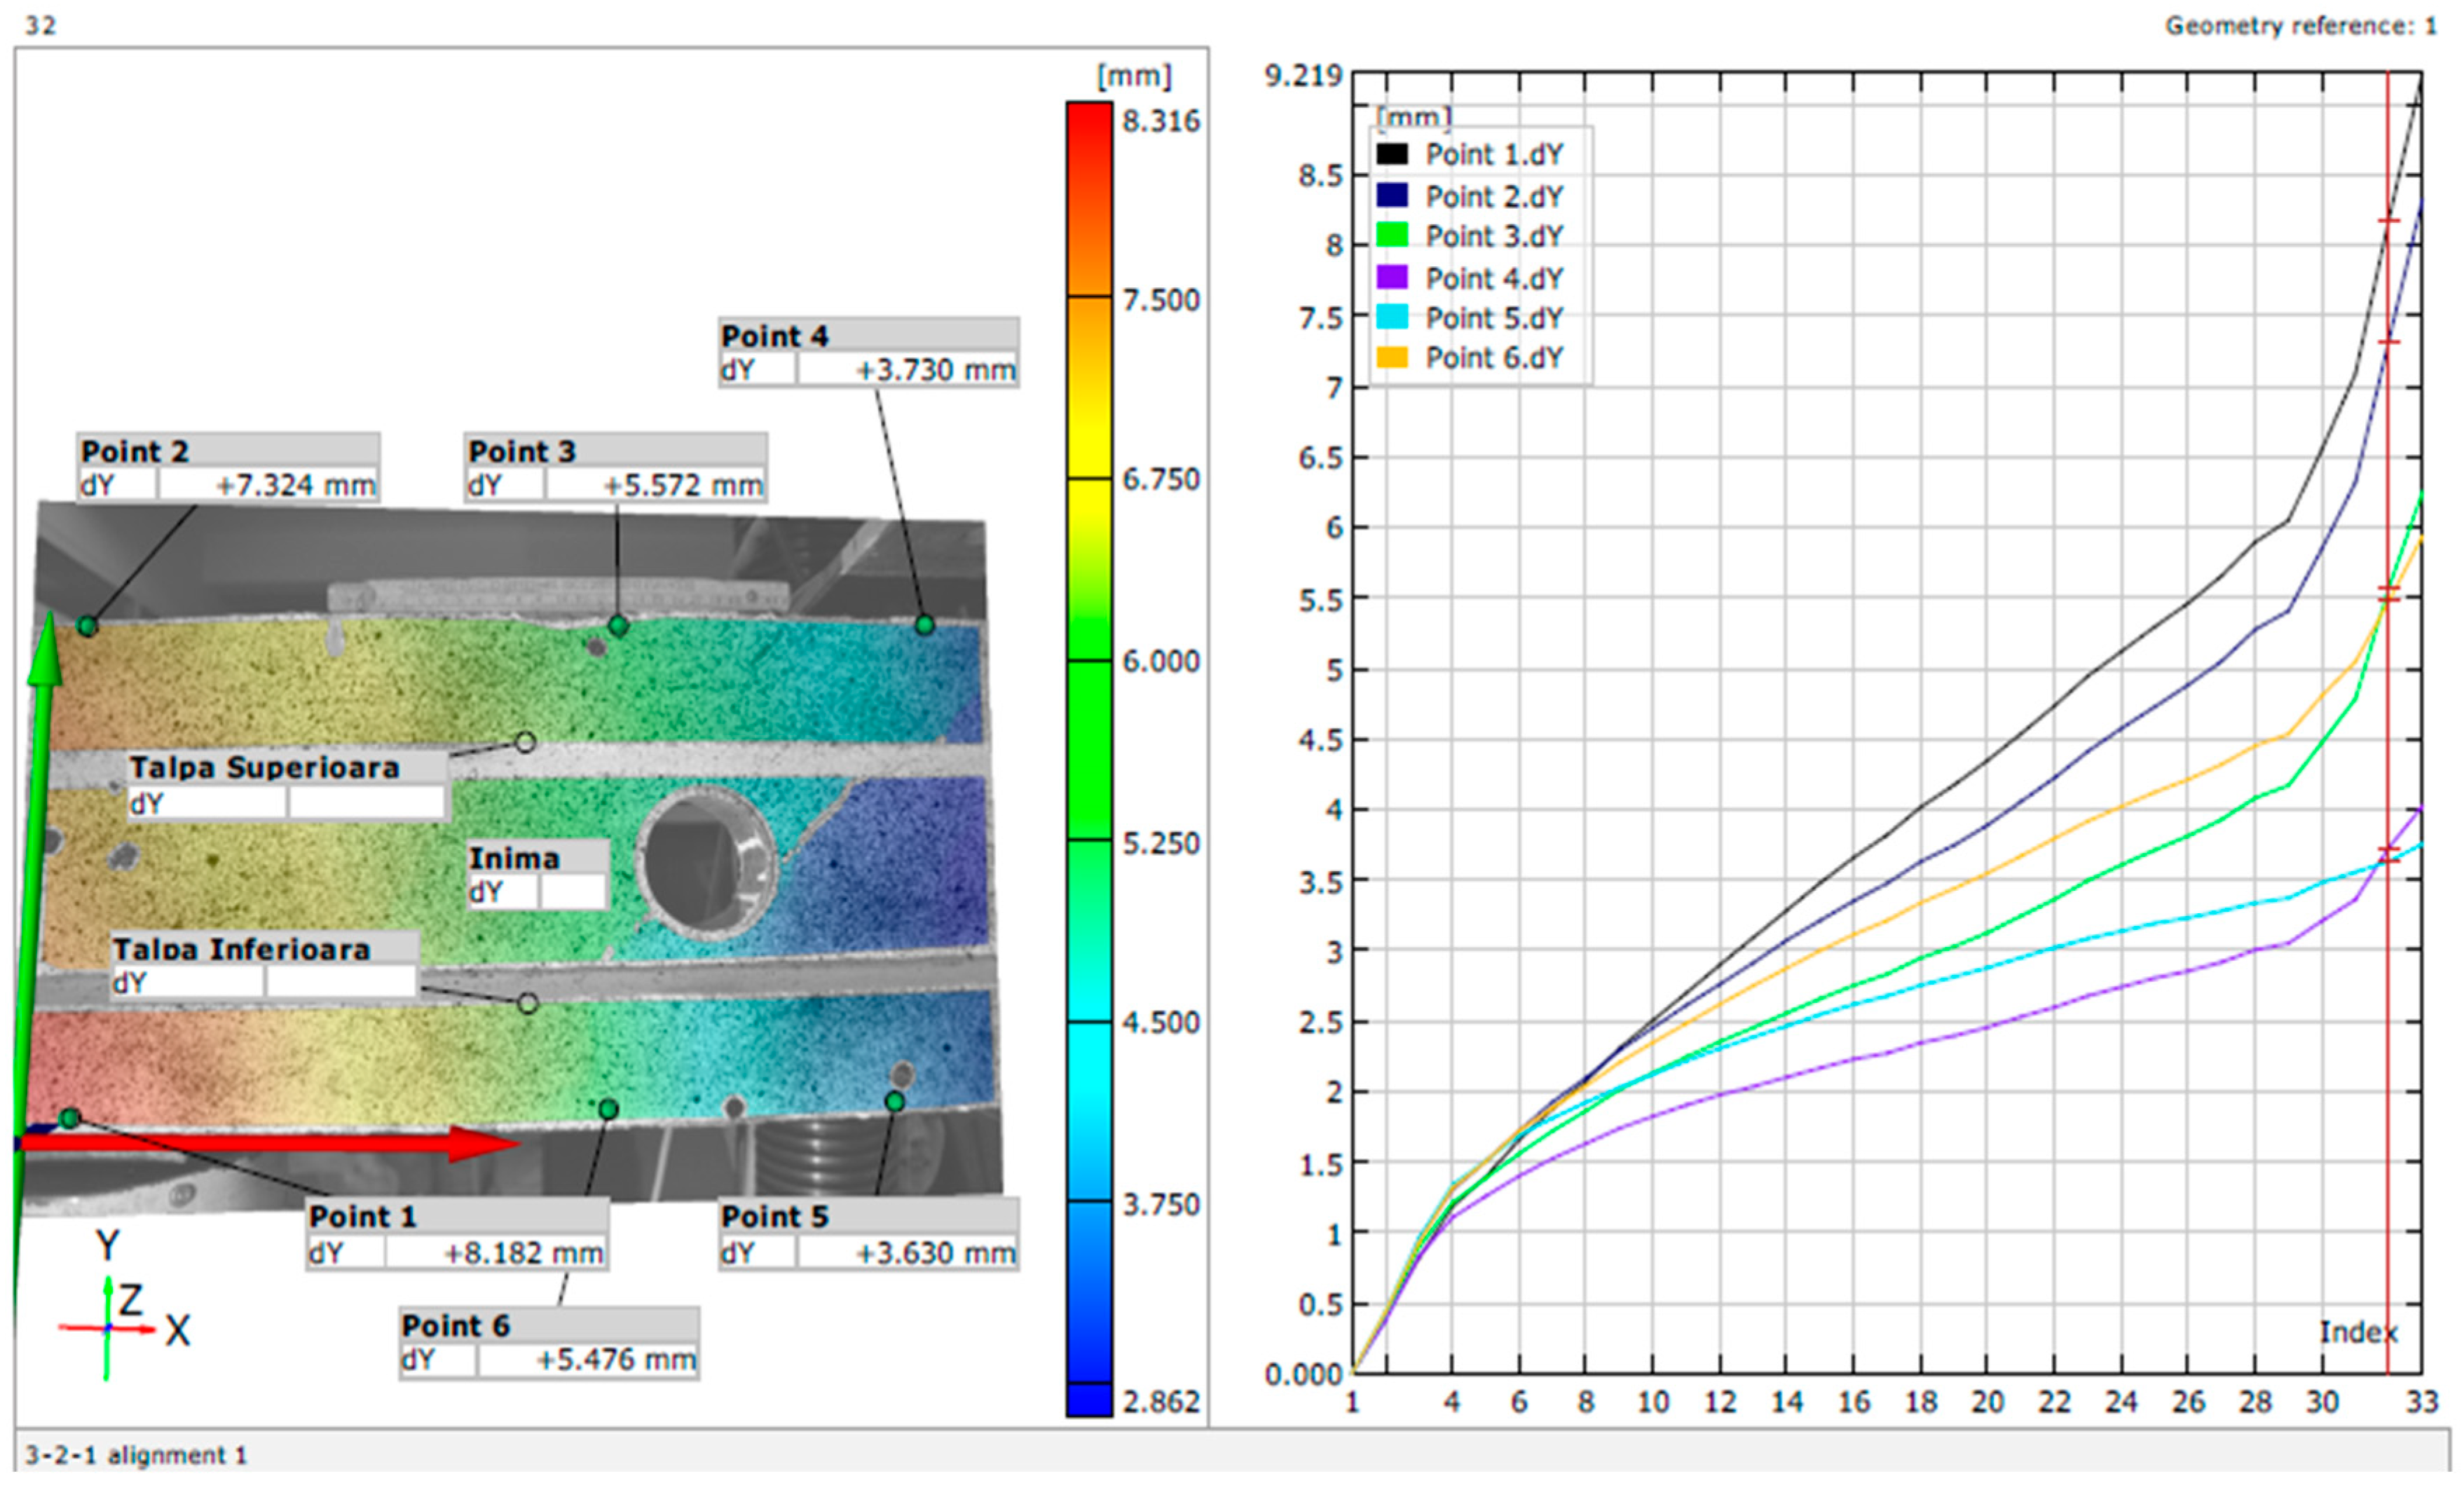
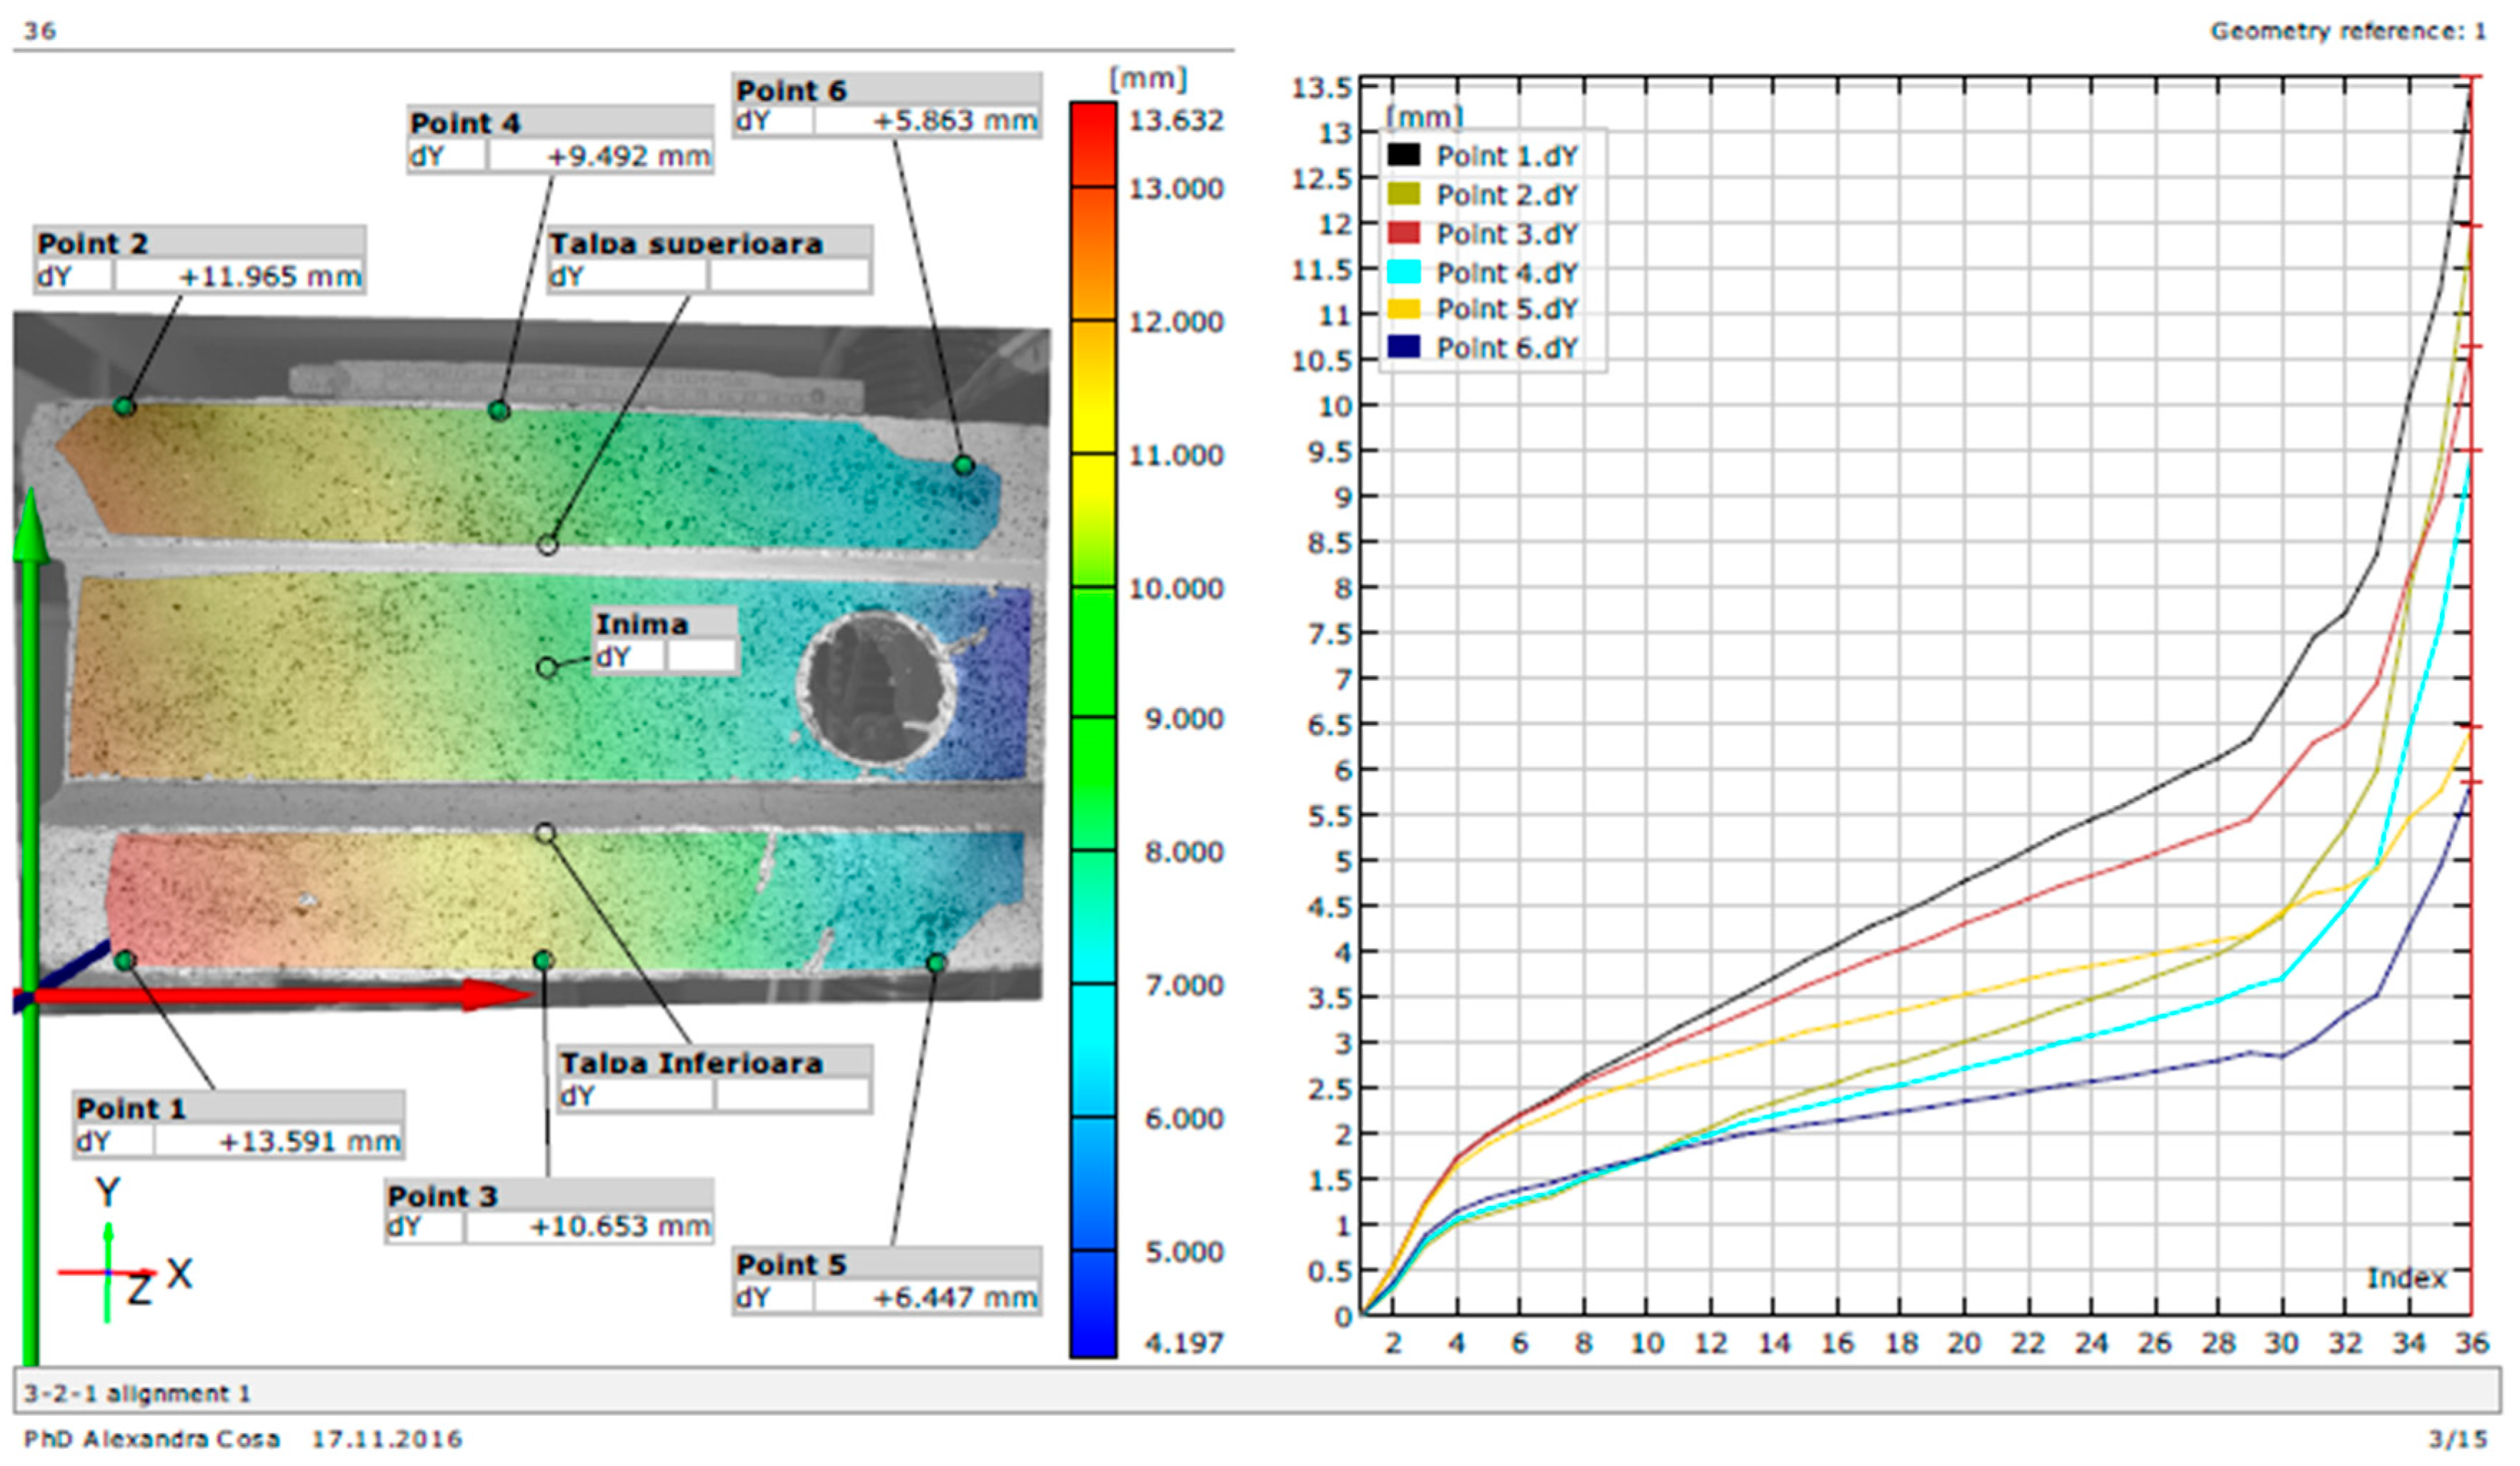
The vertical displacements analyzed with GOM Correlate 2016 software are presented in
Figure 6 and
Figure 7. The vertical displacement of Point 5 describes the mid-span deflection of the analyzed beams using the DIC method.
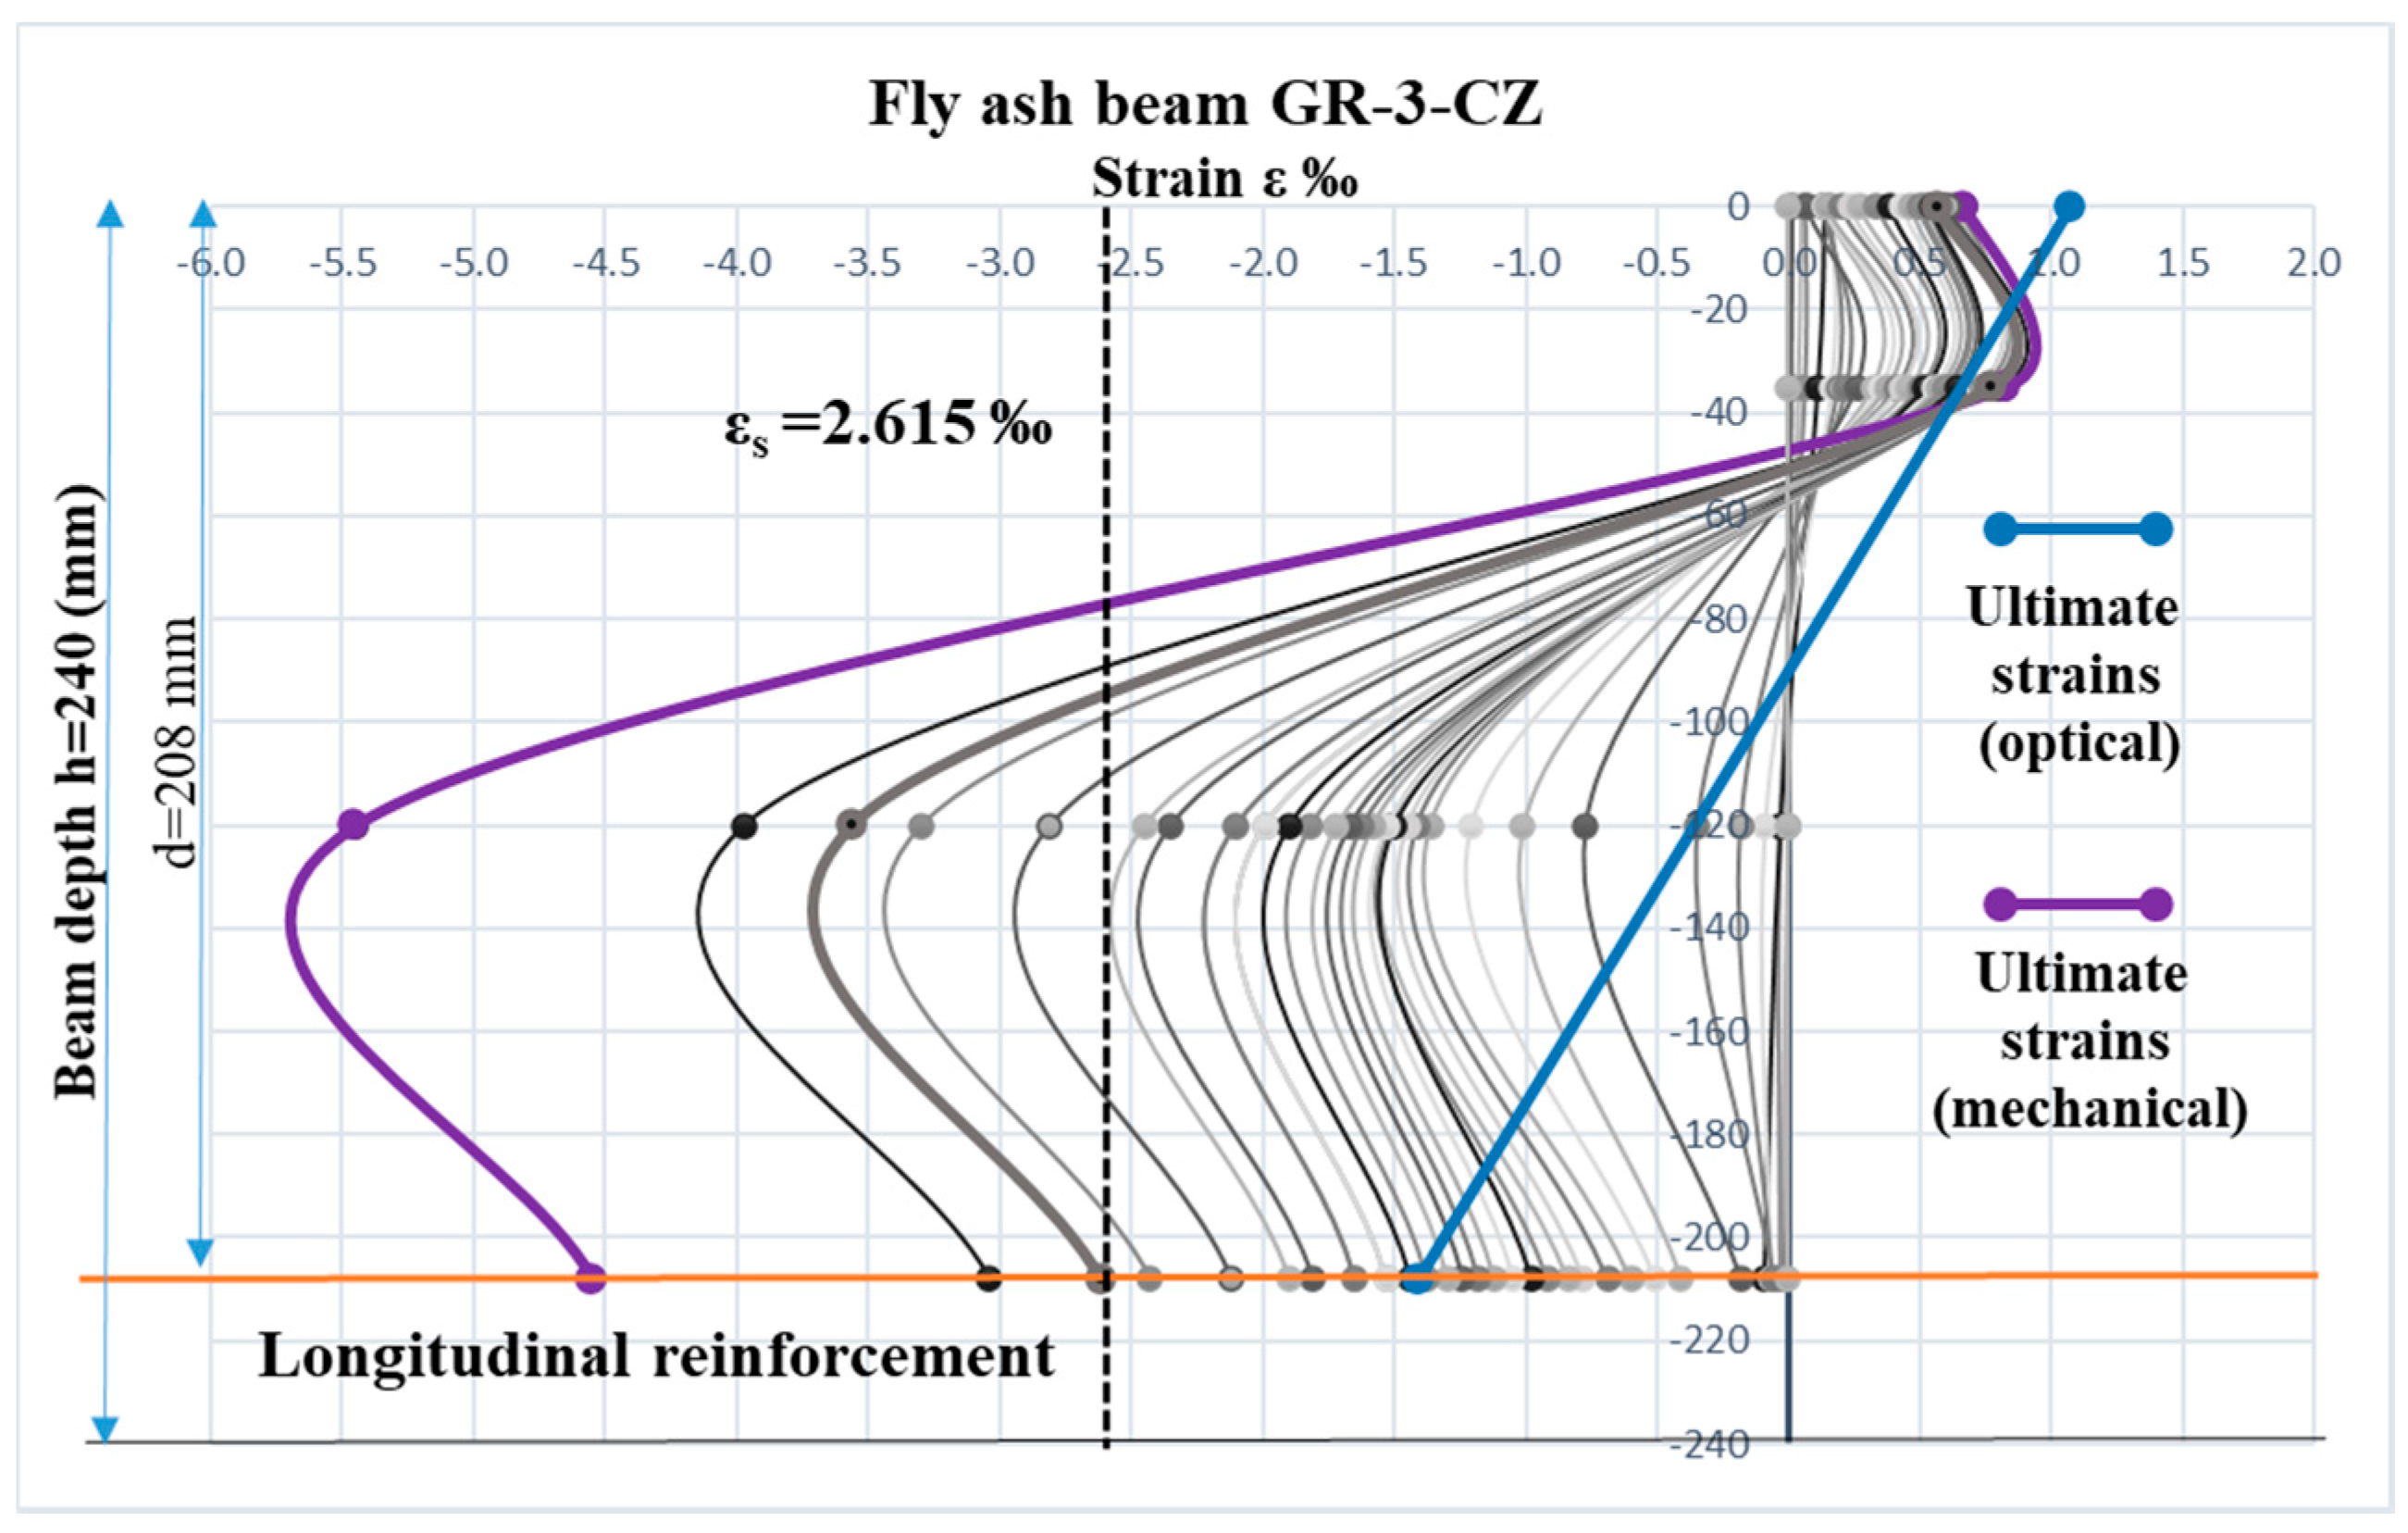
3.2. Strain Distribution
To investigate the flexural behavior of SCC beams we analyzed the experimental strain distribution at mid-span section (
Figure 8 and
Figure 9). For the fly ash beam (GR-3-CZ), the concrete strain at the top of the beam at failure was less than the crushing strain of concrete (3.5‰), the prescript value according to Eurocode 2 [
13]. The limestone beam (GR-3-FC) recorded higher concrete strains at the top of the beam at the time of failure, exceeding the crushing strain of concrete. Strains in the longitudinal bars were higher than the yielding strain of 2.615‰ (experimentally measured), indicating that longitudinal reinforcement yielded before the time of failure. Associating the ultimate strains in the longitudinal bars and the post-peak behavior shown in the load-deflection curves, it could be observed the ductile nature of the limestone beam. Similar results were obtained for beams containing pozzolanic fly ash, showing a less ductile behavior when compared to other beams with different mineral additions [
14].
In the case of concrete strains at the top of the beam, the results obtained using the DIC technique were comparable with the conventional extensometer. The ultimate strains in the longitudinal reinforcement, measured with the DIC method, were around 70% lower, compared with the strains measured with strain gauges. The differences between the values obtained from the two measurement methods could be due to the imprecise location of the analyzed point at mid-span section. The 2D camera used to capture the images can also bring errors in the correlation, like distortion of the lens, as other researchers concluded [
3,
15]. On the other hand, Marcinczak et al. (2019) considered that the DIC method is a good alternative to strain gauges, allowing to determine the most stressed places of the element. Moreover, when using strain gauges, deformations of the element are difficult to clearly analyze because the strain gauge is in a specific, limited place and tends to break at the place of failure crack [
6].
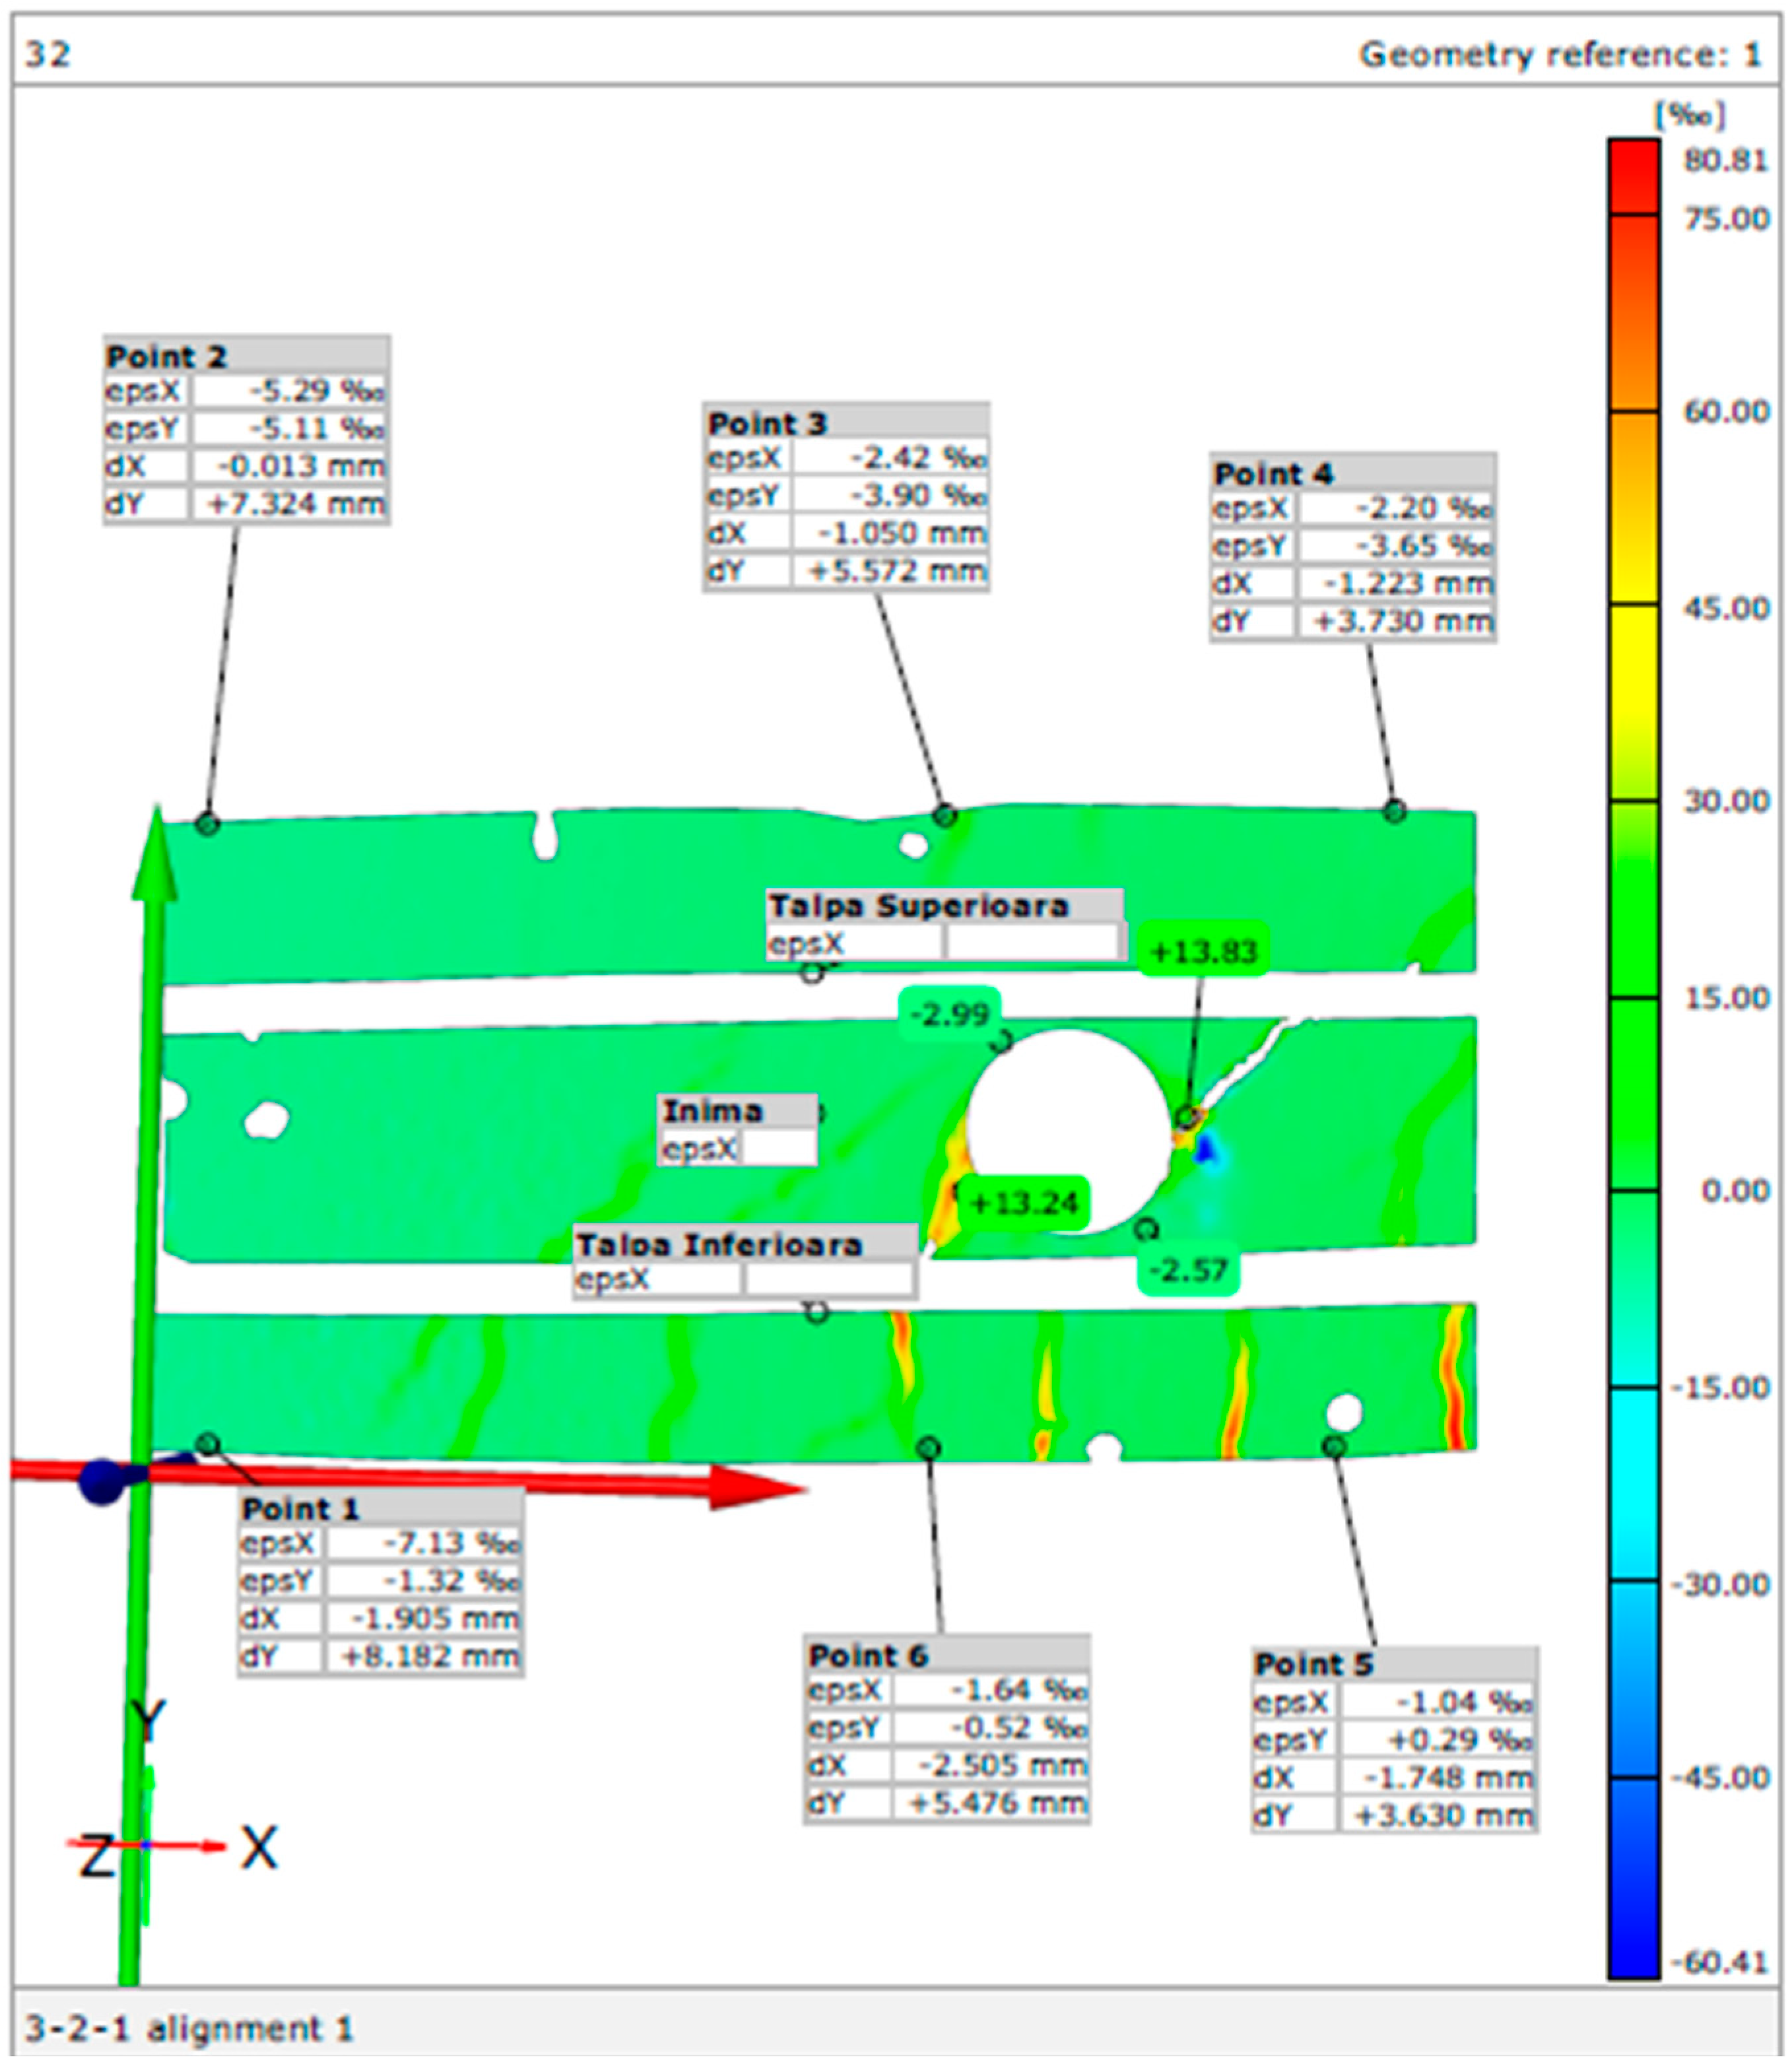
The strains measured with the DIC method and analyzed with GOM Correlate 2016 software are presented in
Figure 10 and
Figure 11.
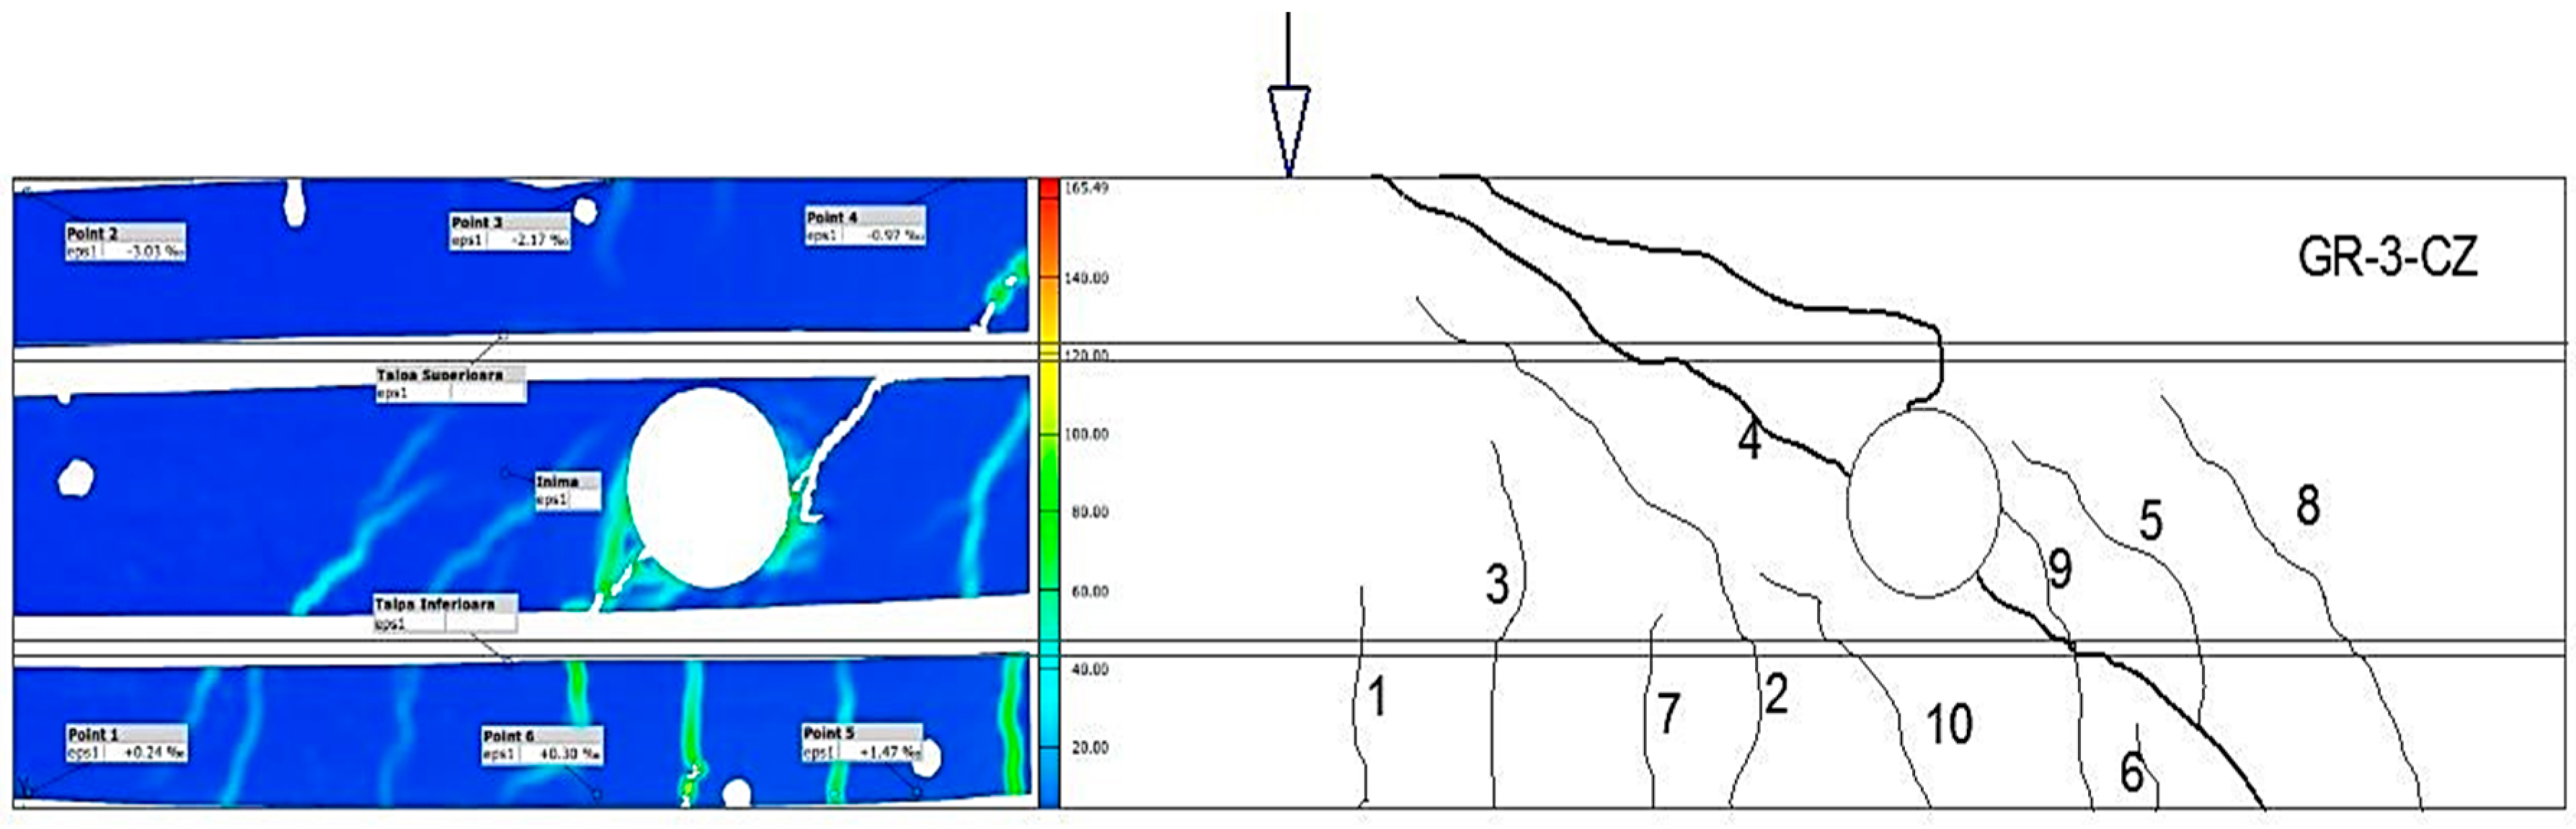
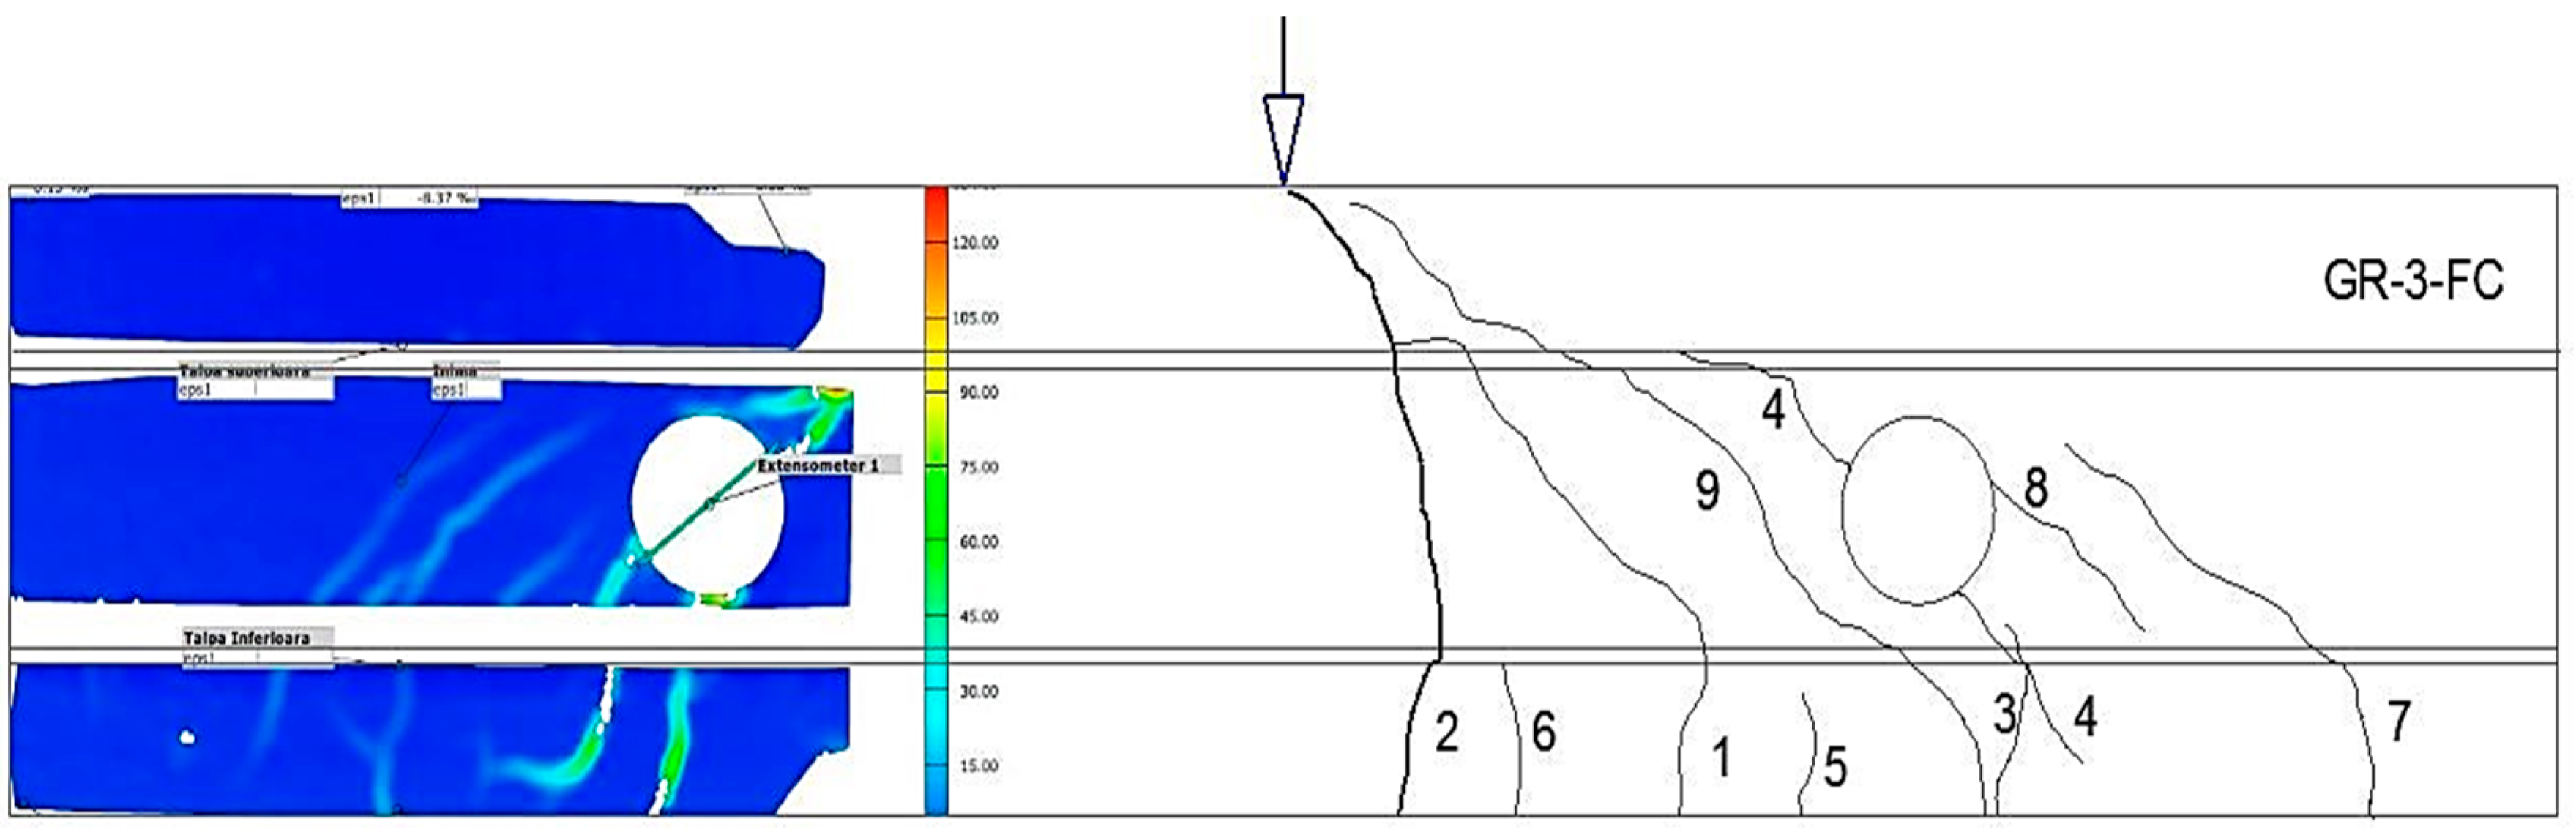
3.3. Cracking Pattern
To provide a comparison between the automated crack mapping obtained with the DIC method and the hand-drawn crack mapping, the longitudinal strain filed from the front face of the beam (left half) and the hand-drawn cracks at ultimate load (right half) are presented in
Figure 12 and
Figure 13.
Both methods indicated that the first crack was a flexural crack and the fourth one was the first shear crack for both tested beams. The beams underwent beam type shear failure, having a ductile flexural behavior up to the ultimate load. As Tambusay et al. (2018) concluded, the longitudinal strain fields obtained from the DIC system are shown to compare well with hand-drawn crack maps [
16].
4. Conclusions
The current study presents a comparison between traditional and optical measurements to evaluate the efficiency of the DIC technique in recording the vertical displacements, evaluation of changes in strain and crack development of reinforced concrete beams. A comparison was also performed in order to analyze the influence of using high-volume fly ash addition on the behavior of reinforced concrete beams with web openings, exposed to freeze–thaw cycles.
Local materials were utilized to create a high-volume fly ash self-compacting concrete with a 63% cement replacement, applicable for the precast industry. For comparison, a similar self-compacting concrete was developed, but with the traditional limestone instead of fly ash.
Analyzing the general behavior of the tested beams, the fly ash beam exhibited a lower ductility and ultimate strength compared with the limestone beam because the increase in the strength of concrete improves the behavior of beams with small circular openings. Freezing and thawing dry cycles without de-icing salts did not majorly affect the self-compacted reinforced concrete beams.
Performing a comparison between the two methods used to record the displacement measurements, the mid-span deflection recorded with the DIC method was up to 25% higher than the deflection recorded with the traditional method.
In the case of concrete strains at the top of the beam, the results obtained using the DIC technique were comparable with the strain gauge measurements, but the ultimate strains in the longitudinal reinforcement, measured with the DIC method, were 70% lower.
The cause of the different values obtained from the two measurement methods could be due to the imprecise location of the analyzed point at mid-span section or the camera used to capture the images, which can bring errors in the correlation, like distortion of the lens.
The authors presented and verified a practical technique for utilizing digital image correlation to measure strain and displacement on a reinforced self-compacted concrete beam with circular openings. The experimental study gives useful information to create a non-contact measurement system that can provide information for field monitoring, but further studies are required to improve the correlation between the traditional and digital measurements.
Author Contributions
Conceptualization, A.C. and B.H.; methodology, A.C. and B.H.; software, B.H.; validation, A.C., B.H., C.N. and Z.K.; formal analysis, B.H.; investigation, A.C. and B.H.; resources, A.C. and B.H.; data curation, A.C. and B.H.; writing—original draft preparation, A.C.; writing—review and editing, A.C., C.N. and Z.K.; visualization, A.C. and C.N.; supervision, Z.K. All authors have read and agreed to the published version of the manuscript.
Funding
This research received no external funding.
Acknowledgments
The authors gratefully appreciate the assistance and the support from the Department of Central Laboratory of the Civil Engineering Faculty, where the experimental program was performed. The paper was developed in the first author’s Ph.D. program in Civil Engineering, Eng. Coșa Alexandra, supervised by Eng. Kiss Zoltan.
Conflicts of Interest
The authors declare no conflict of interest.
References
- Dutton, M. Digital Image Correlation for Evaluating Structural Engineering Materials. Master’s Thesis, Queens University, Kingston, ON, Canada, 2012; p. 122. [Google Scholar]
- McCormick, N.; Lord, J. Digital Image Correlation. Mater. Today 2010, 13, 52–54. [Google Scholar] [CrossRef]
- Cintron, R.; Saouma, V. Strain Measurements with Digital Image Correlation System Vic-2D. System 2008, 106, 1–22. [Google Scholar]
- McCormick, N.; Lord, J. Digital image correlation for structural measurements. Proc. Inst. Civ. Eng. Civ. Eng. 2012, 165, 185–190. [Google Scholar] [CrossRef]
- Fayyad, T.; Lees, J. Application of Digital Image Correlation to Reinforced Concrete Fracture. Procedia Mater. Sci. 2014, 3, 1585–1590. [Google Scholar] [CrossRef]
- Marcinczak, D.; Trapko, T. DIC (Digital Image Correlation) method in the research of RC beams strengthened with PBO-FRCM materials. E3S Web Conf. 2019, 97, 03008. [Google Scholar] [CrossRef]
- Mansur, M.A.; Tan, K.H. Concrete Beams with Openings: Analysis and Design; CRC Press: Boca Raton, FL, USA, 1999. [Google Scholar]
- BS EN 197-1:2011, Cement, Part 1: Composition, Specifications and Conformity Criteria for Common Cements; European Committee for Standardization, British Standard Institution: London, UK, 2011.
- Joshi, S.S.; Thammishetti, N.; Prakash, S.S.; Jain, S. Cracking and Ductility Analysis of Steel Fiber Reinforced Prestressed Concrete Beams in Flexure. ACI Struct. J. 2018, 115, 1575–1588. [Google Scholar] [CrossRef]
- Amiri, J.V.; Hosseinalibygie, M. Effect of Small Circular Opening on the Shear and Flexural Behavior and Ultimate Strength of Reinforced Concrete Beams using Normal and High Strength Concrete. In Proceedings of the 13th World Conference on Earthquake Engineering, Vancouver, BC, Canada, 1–6 August 2004. [Google Scholar]
- Bărbuță, M.; Bucur, R.; Șerbănoiu, A.; Scuturasu, S.; Burlacu, A. Combined effect of fly ash and fibers on propertied of cement concrete. Procedia Eng. 2017, 181, 280–284. [Google Scholar] [CrossRef]
- Rujanu, M.; Bărbuță, M. Influence of Fly Ash Addition on the Compressive Strength of Concrete. In Proceedings of the International Scientific Conference (CIBV 2014), Brașov, Romania, 7–8 November 2014. [Google Scholar]
- BS EN 1992-1:2004 Eurocode 2: Design of Concrete Structures—Part 1-1: General Rules and Rules for Buildings; European Committee for Standardization, British Standard Institution: London, UK, 2004.
- Aulia, T.; Afifuddin, M.; Opirina, L. Bending Capacity Analysis of High-Strength reinforced concrete Beams Using geopolymer Fly Ash and environmentally Friendly Slag as Fine Aggregate Substitution. In Proceedings of the 7th Civil Engineering Conference in the Asian Region (CECAR7), Waikiki, HI, USA, 30 August–2 September 2016. [Google Scholar]
- Butean, C.; Heghes, B. Flexure behavior of a hybrid reinforced concrete beam. Strain correlation between mechanical gauges and optical measurement. Procedia Manuf. 2018, 22, 233–240. [Google Scholar] [CrossRef]
- Tambusay, A.; Suryanto, B.; Suprobo, P. Visualization of Shear Cracks in a Reinforced Concrete Beam using the Digital Image Correlation. Int. J. Adv. Sci. Eng. Inform. Technol. 2018, 8, 573. [Google Scholar] [CrossRef]
| Publisher’s Note: MDPI stays neutral with regard to jurisdictional claims in published maps and institutional affiliations. |
© 2020 by the authors. Licensee MDPI, Basel, Switzerland. This article is an open access article distributed under the terms and conditions of the Creative Commons Attribution (CC BY) license (http://creativecommons.org/licenses/by/4.0/).


