1. Introduction
The philosophy of any company should be the customer first. This statement should be based on the continuous improvement of both the products and the services offered on the market. From here, we can deduce the importance of analysis and customer satisfaction. Research in recent years has deduced several approaches that reflect the assessment of customer satisfaction from different perspectives. Measuring customer satisfaction is one of the most important elements that retain the attention of companies in all fields of the industry [
1]. Customer satisfaction as an indicator involves the entirety of employees of the company with direct connection with customers. It motivates employees to reach the highest standards and to constantly increase labor productivity.
Nowadays, the optimization techniques need some improvement for services and products offered by the manufacturing companies from a sustainable and efficient point of view.
The main purpose of this research was to systematize theoretical concepts of how various aspects of increasing and assessing customer satisfaction in business activities, carried out at the level of society, can be improved. The research objectives were thus:
analysis of the evolution of customer satisfaction,
determining mechanisms for assessing customer satisfaction by applying our own methods in correlation with economic indicators (profit, productivity, cost),
developing and proposing solutions for growth and economic development at the level of society by increasing customer satisfaction based on the results of this research.
Based on these objectives, we have tried to bring a new system to the forefront in the form of an indicator Spc (System of Evaluating Employee Performance Depending on Customer Satisfaction) that includes both classic elements of customer satisfaction and economic elements measuring the activities.
This research is intended to be a relevant research in the field, as no such study has been carried out in the area of customer satisfaction assessment. The main theoretical contribution is the design of a new efficiency measurement indicator, i.e., the Spc. In practical terms, research has a major impact in this area, namely the application of the SIM program (abbreviations from Spc and ITA) translated into the context of a case study: the introduction of a new Spc indicator and a new, innovative ITA method (training, testing of employees, application of knowledge), both components of the SIM program.
The application of these indicators and the method that the authors have ordered has led to increased labor productivity, followed by an increase in the number of contacts taken over by employees, an improvement in the company’s management process, which has been reflected in the increase in the company’s economic and financial indicators, and an improvement in the relationship between employees and customers, leading to an increase in their satisfaction, the reorganization of the employees’ program, which means an increase in staff efficiency, and better control over the operating parameters of each employee, of the entire sector of activity by introducing a SIM program.
These efforts have resulted in an economic indicator: Profit, which is crucial for any market economy society. In the context where the customer is based on any successful economic activity, the focus of the entire analysis of this work was on his satisfaction and how to increase this satisfaction [
2].
In this work, after a theoretical deepening of some elements underlying the creation of the Spc indicator and the ITA method, and a practical implementation of the SIM program, I have come to the conclusion that many aspects of the six Sigma method [
3] generally used in industry also applies to the services sector. Setting goals, implementing a program, continuously educating employees, along with maintaining a professional environment within the company can be successful elements at the company level [
4].
2. Theoretical Background
Our theoretical background for this paper was based on: analysis of the evolution of customer satisfaction, determination of mechanisms for evaluating customer satisfaction by applying our own new and innovative method (Spc) in correlation with economic indicators (profit, productivity, cost), elaboration and proposal of solutions for growth and economic development at company level by increasing customer satisfaction based on the results of this research.
The inductive method was used in this work, and observations made at the level of the commercial service field could be extended to other areas. The analysis and synthesis method was carried out by studying basic concepts that make up different indicators or which form the basis for the formulation of methods and programs. Thus, we are talking about the creation of the Spc indicator based on economic indicators of productivity and cost. It started from the company model that was based on the NRR (Negative Response Rate) indicator and adapted the new indicator, which takes into account contact resolution time, labor productivity, number of contacts resolved and, not least, customer satisfaction. To improve this indicator, we have designed a new method, the ITA method, which refers to employee training, testing and applying knowledge. The employee training process should be a continuous process based on regular testing. The way in which it can apply the theoretical knowledge acquired is diverse, but I have chosen the Mystery Shopper method for this operation. All these activities were carried out under a program called the SIM program, the abbreviation from the Spc indicator, the ITA method and the Mystery Shopper evaluation mechanism.
The ITA method involves training, testing and applying the knowledge accumulated by employees as a result of the process. This method is based on the basic management functions. For the first time in 1916, Henry Fayol [
5] formulated functions as essential qualities of management: provision, organization, command, coordination and control.
Any producer will seek to obtain the lowest possible cost for his product, based on supply and demand [
6]. Even in the services sector, firms will try to reduce costs by making employees work more efficiently. Given the activity of the firm in this study, the market demand for the services provided by the firm is growing. The improvements needed for the work are aimed at the qualitative side of the work, with supply being of a high standard as regards to the services provided [
7].
3. Methodology
Key elements of the Six Sigma method have been applied to support the improvement of this process: definition, measurement, analysis, improvement and control. Combining this method with applying a new employee performance measurement indicator has achieved positive results. This new indicator is Spc. The Spc indicator consists of several elements: average labor productivity (WmL), weighted arithmetic mean of satisfaction (Maps), cost per hour/employee (Cha), average contact resolution time—in minutes (t), total contact sum (∑c). The formula for calculating the indicator shall be in the form:
The Map (weighted arithmetic average of satisfaction) is a way of assessing customer satisfaction after having contacted one of the company representatives. More specifically, the Map is presented in the form of a short questionnaire in which the customer will award from 1 to 5 stars depending on the satisfaction of the service received in connection with the problem resolution.
There has been much discussion on this customer satisfaction tool in the sense that these responses may not fully reflect reality. It is indicated, for the highest performance of the employee’s work, that the Map is as high as possible. This indicator also contributes to the output of the Spc.
Our research has two research hypotheses:
Hypothesis 1 (H1). The current customer satisfaction assessment systems adopted by some companies are not always able to provide an optimal solution for economic growth and development.
Hypothesis 2 (H2). The current stage of evaluation systems and methods requires improvements and adaptations by applying new, innovative methods that take into account other indicators/parameters/aspects/etc.
The case study applied to 32 employees where the Spc indicator was introduced. For the firm, a system of customer satisfaction assessment already exists, namely the NRR. This was a rather subjective instrument because the other aspects of the work carried out were not analyzed.
If within 3 consecutive weeks, the NRR is above the 13% ceiling, the employee will receive a warning, which will inform the employee of the situation and then be allocated a supervisor as a way to help to improve their statistics. Together with the supervisor, they will look at more sensitive cases with negative response so that they can determine the mistakes they made when handling specific cases.
Thus, when a representative receives negative feedback, in practice to restore the NRR to a positive value, 10 positive responses are needed. Of course, getting a customer to respond to feedback can be a problem, because the vast majority of customers do not attach too much importance to this assessment service. By assessing employees, an attempt is made to improve the quality of the services provided by the company. Of course, employees are in continuous personal development, with each employee having 30 min a day for training, provided with training material.
We present, in
Table 1, an example of the starting dates for calculating the Spc indicator, with the business of employees within the company, and with the activity going on in practice on 2 levels: chat and phone. We have the percentages of how much each of these elements represents in the work done. The average productivity of a factor shall be the ratio of output obtained to the quantity consumed in that production factor. In other words, productivity is determined as the ratio between the results obtained and the efforts made to achieve them.
The short-term analysis of the behavior of the producer in relation to one of the production factors shows the variation in productivity of this factor and the relationship between production, average productivity and marginal productivity. Work efficiency is usually identified with labor productivity [
8]. The disutility attributed to work explains why—in line with the gradual increase in physical labor productivity, resulting from technological innovation and a higher volume of capital—there has generally been a reduction in working hours [
9].
The Maps element has a direct influence on the Spc indicator and is directly proportional. It is normal when a customer’s satisfaction increases and the positive result is also increasing. Another important element of Spc calculation is cost.
Cost was described in the light of the company’s own indicator of NRR. 34% of the employees were in the red zone, i.e. the NRR was more than 13%, which, in the company’s view, was outside the target area. This is the starting point with the ITA method and the Spc indicator. In this case, those employees who have not fulfilled their fair share are monitored by following, if the situation is not remedied, to be dismissed.
4. Results
In December 2018, the implementation and testing of the SIM program, named after the initials of the three elements—the Spc indicator, the ITA method and the Mystery Shopping evaluation site—was started. The objective of this program is primarily to develop the company across all sectors. This will aim to increase employee performance, increase labor productivity, increase company economic indicators, increase customer satisfaction, etc. This was the decision that this program should be applied to the entire company. This program was started from the idea that customer satisfaction is an effective indicator, but not sufficient. This should take into account employee productivity, hourly cost per employee, time to resolve a contact, i.e., the whole issue of resolution and satisfaction that is being taken into account to increase the efficiency of the activity.
In this abovementioned respect, I believe that the Spc indicator is best placed to meet these requirements. This indicator consists of all of these elements presented: It takes into account both customer satisfaction and other indicators needed to achieve the efficiency required to perform an economic activity. The application of the ITA method started by identifying the elements pursued in the action. That is, it started with the training of personnel. To start the training work, a few questionnaires were implemented from which some elements were derived. First, around 60% of the respondents indicated that the satisfaction with monthly pay was low. In particular, these employees were disturbed by the fact that the monthly fee was influenced by customer satisfaction. In this regard, some issues were discussed in the training process about the customer’s perception of the company’s promises. Some employees promised different services to customers without knowing whether they could be performed, how long they were started or when they were implemented. Employees were also informed about the company’s design, objectives, and how the company wants to be seen in the customer’s eyes. The major problem on the part of employees was the degree of disagreement with the customer satisfaction assessment model applied at the company level.
This training has sought to educate employees to move from a fast-based system with a strong focus on the intuitive side—often impulsive—to a reflective, contemplative system with a strong emphasis on empathy—which really listened to the customer, to understand his needs, and ready for continuous improvement.
Testing is the second element/step of the ITA method, which is an assessment method that involves measuring and assessing the effects of training quantitatively following the performance over time. This monitoring was carried out for 3 months. While in January, the percentage of employees who had difficulties in doing business reached 31%, i.e., the Spc indicator fell below 0.10 points for them, the percentage of employees with a score below 0.10 dropped to 9.38% in the following month (
Table 2).
The third element of the ITA method was the application of knowledge. The application of the knowledge was made by the “spy” (Mystery Shopper) method. This is also the last phase of the completion of the SIM program.
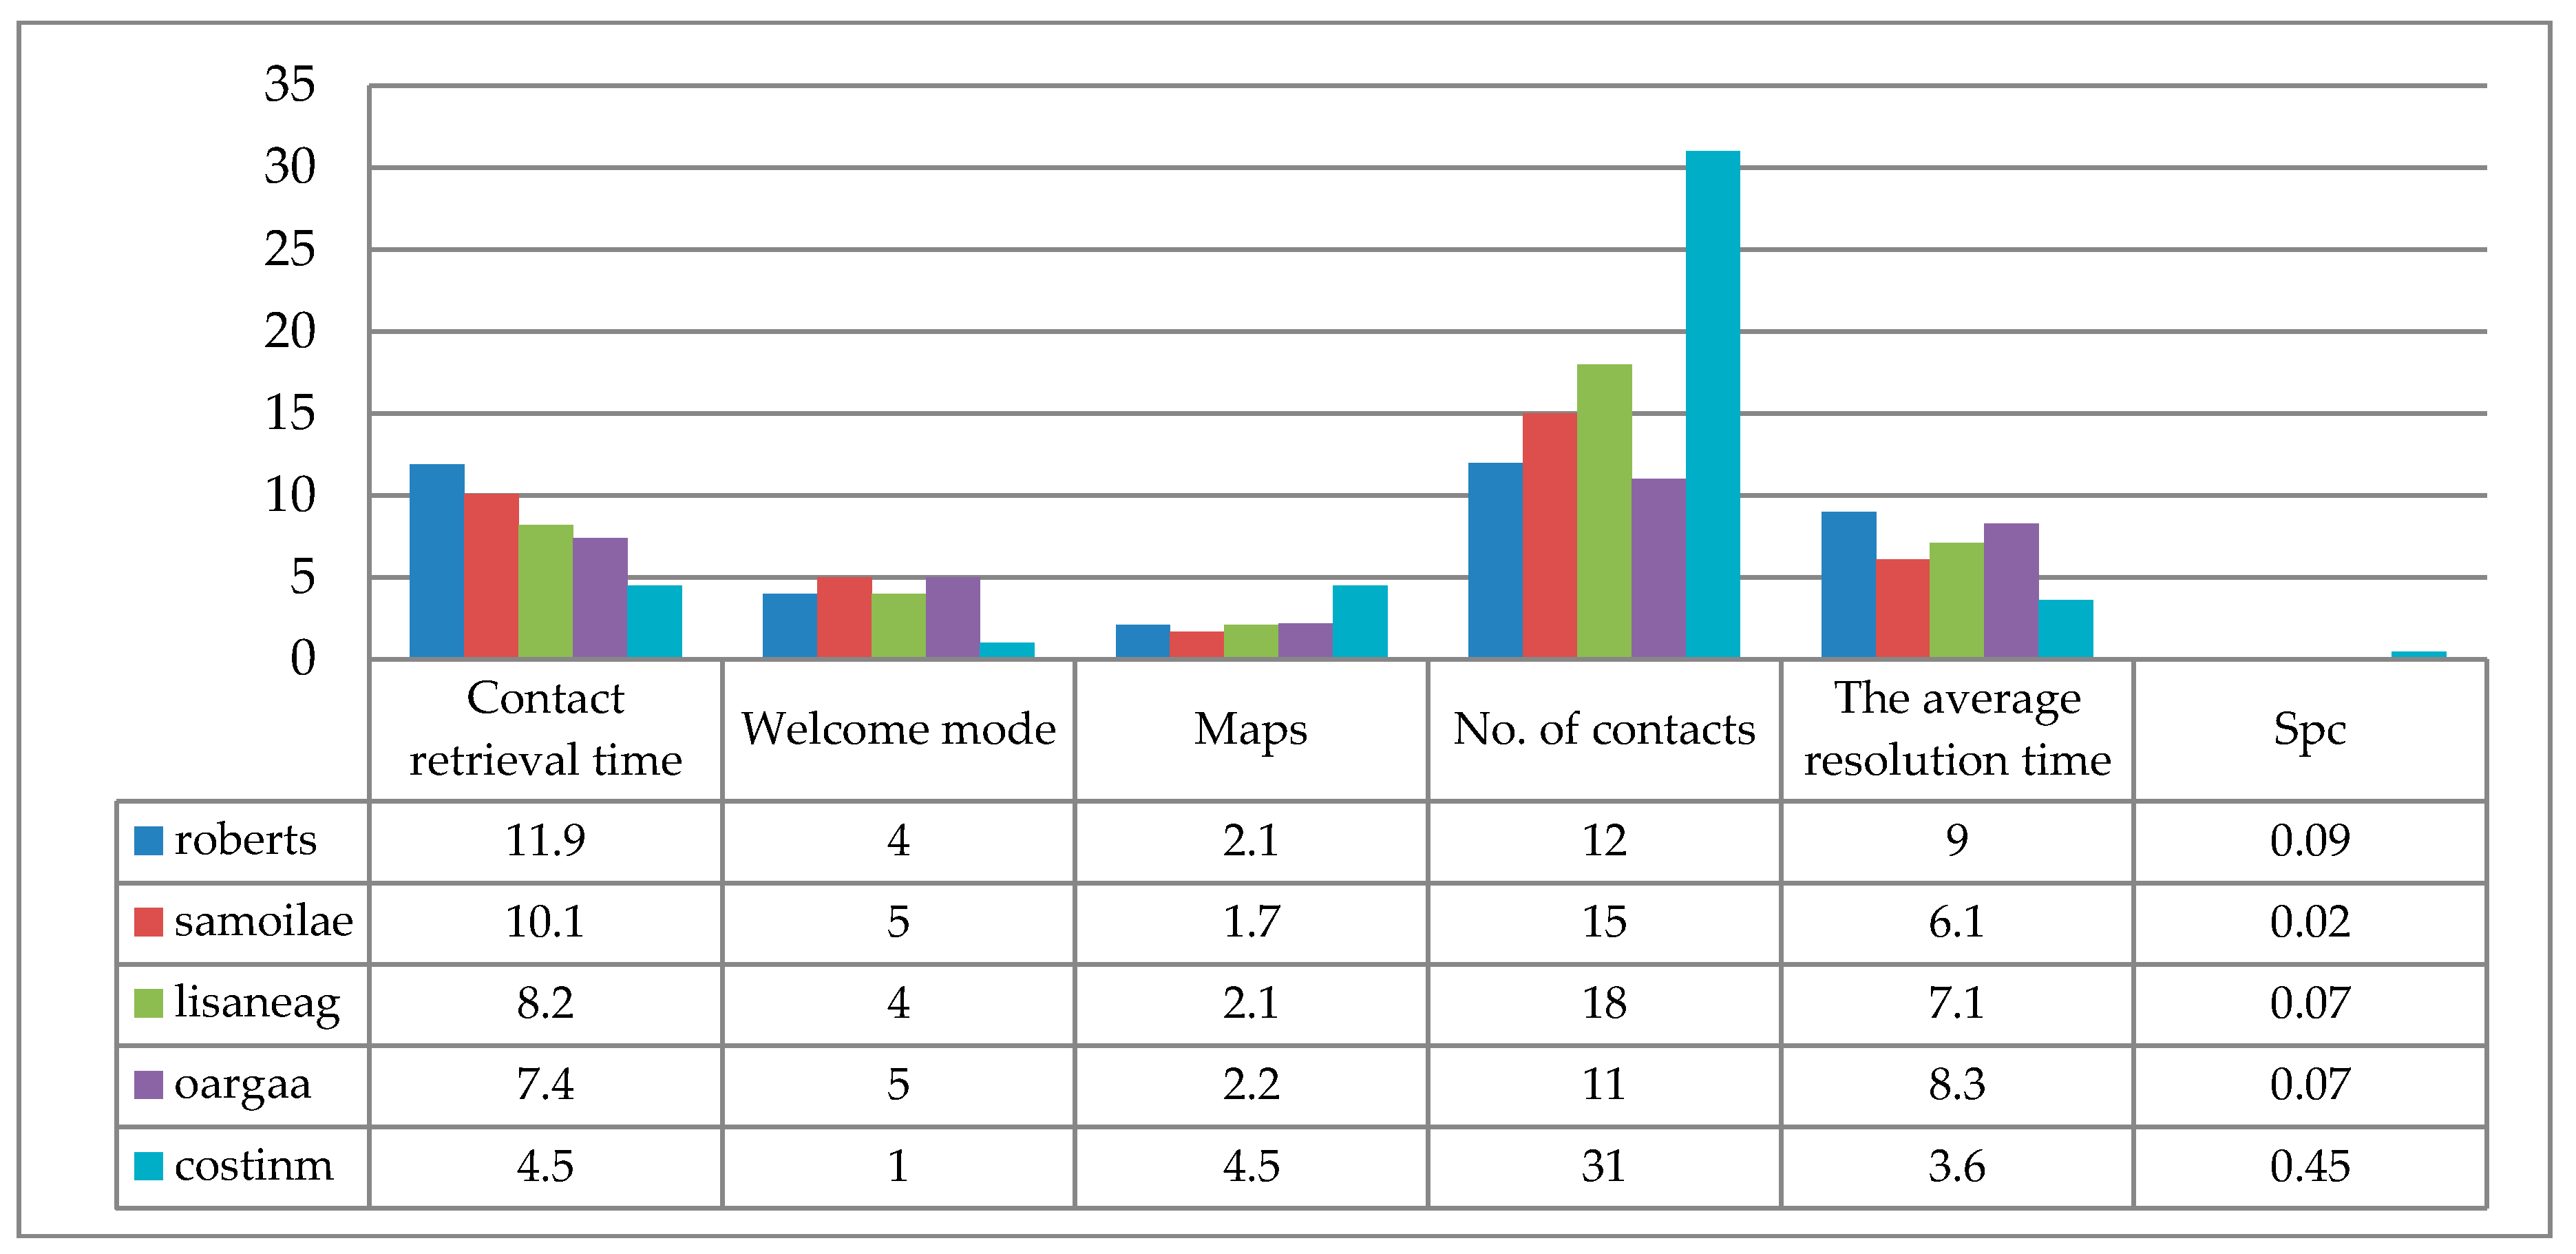
Each agent in the MS assessment was tested across several sectors: First, the response time of the contact retrieval was analyzed: the customer welcome, the weighted arithmetic mean of satisfaction, the number of contacts resolved, and the average time taken to resolve the problem. It can be seen, in
Table 3, how the lowest Spc indicator has the most problems in the rest of the items analyzed.
For example, the
giurgiui agent had the average reaction time at contact acquisition greater than 12.1 s. If we were to analyze against
the Spc indicator, it can be seen that this agent has the lowest score of 0.02 points (
Figure 1).
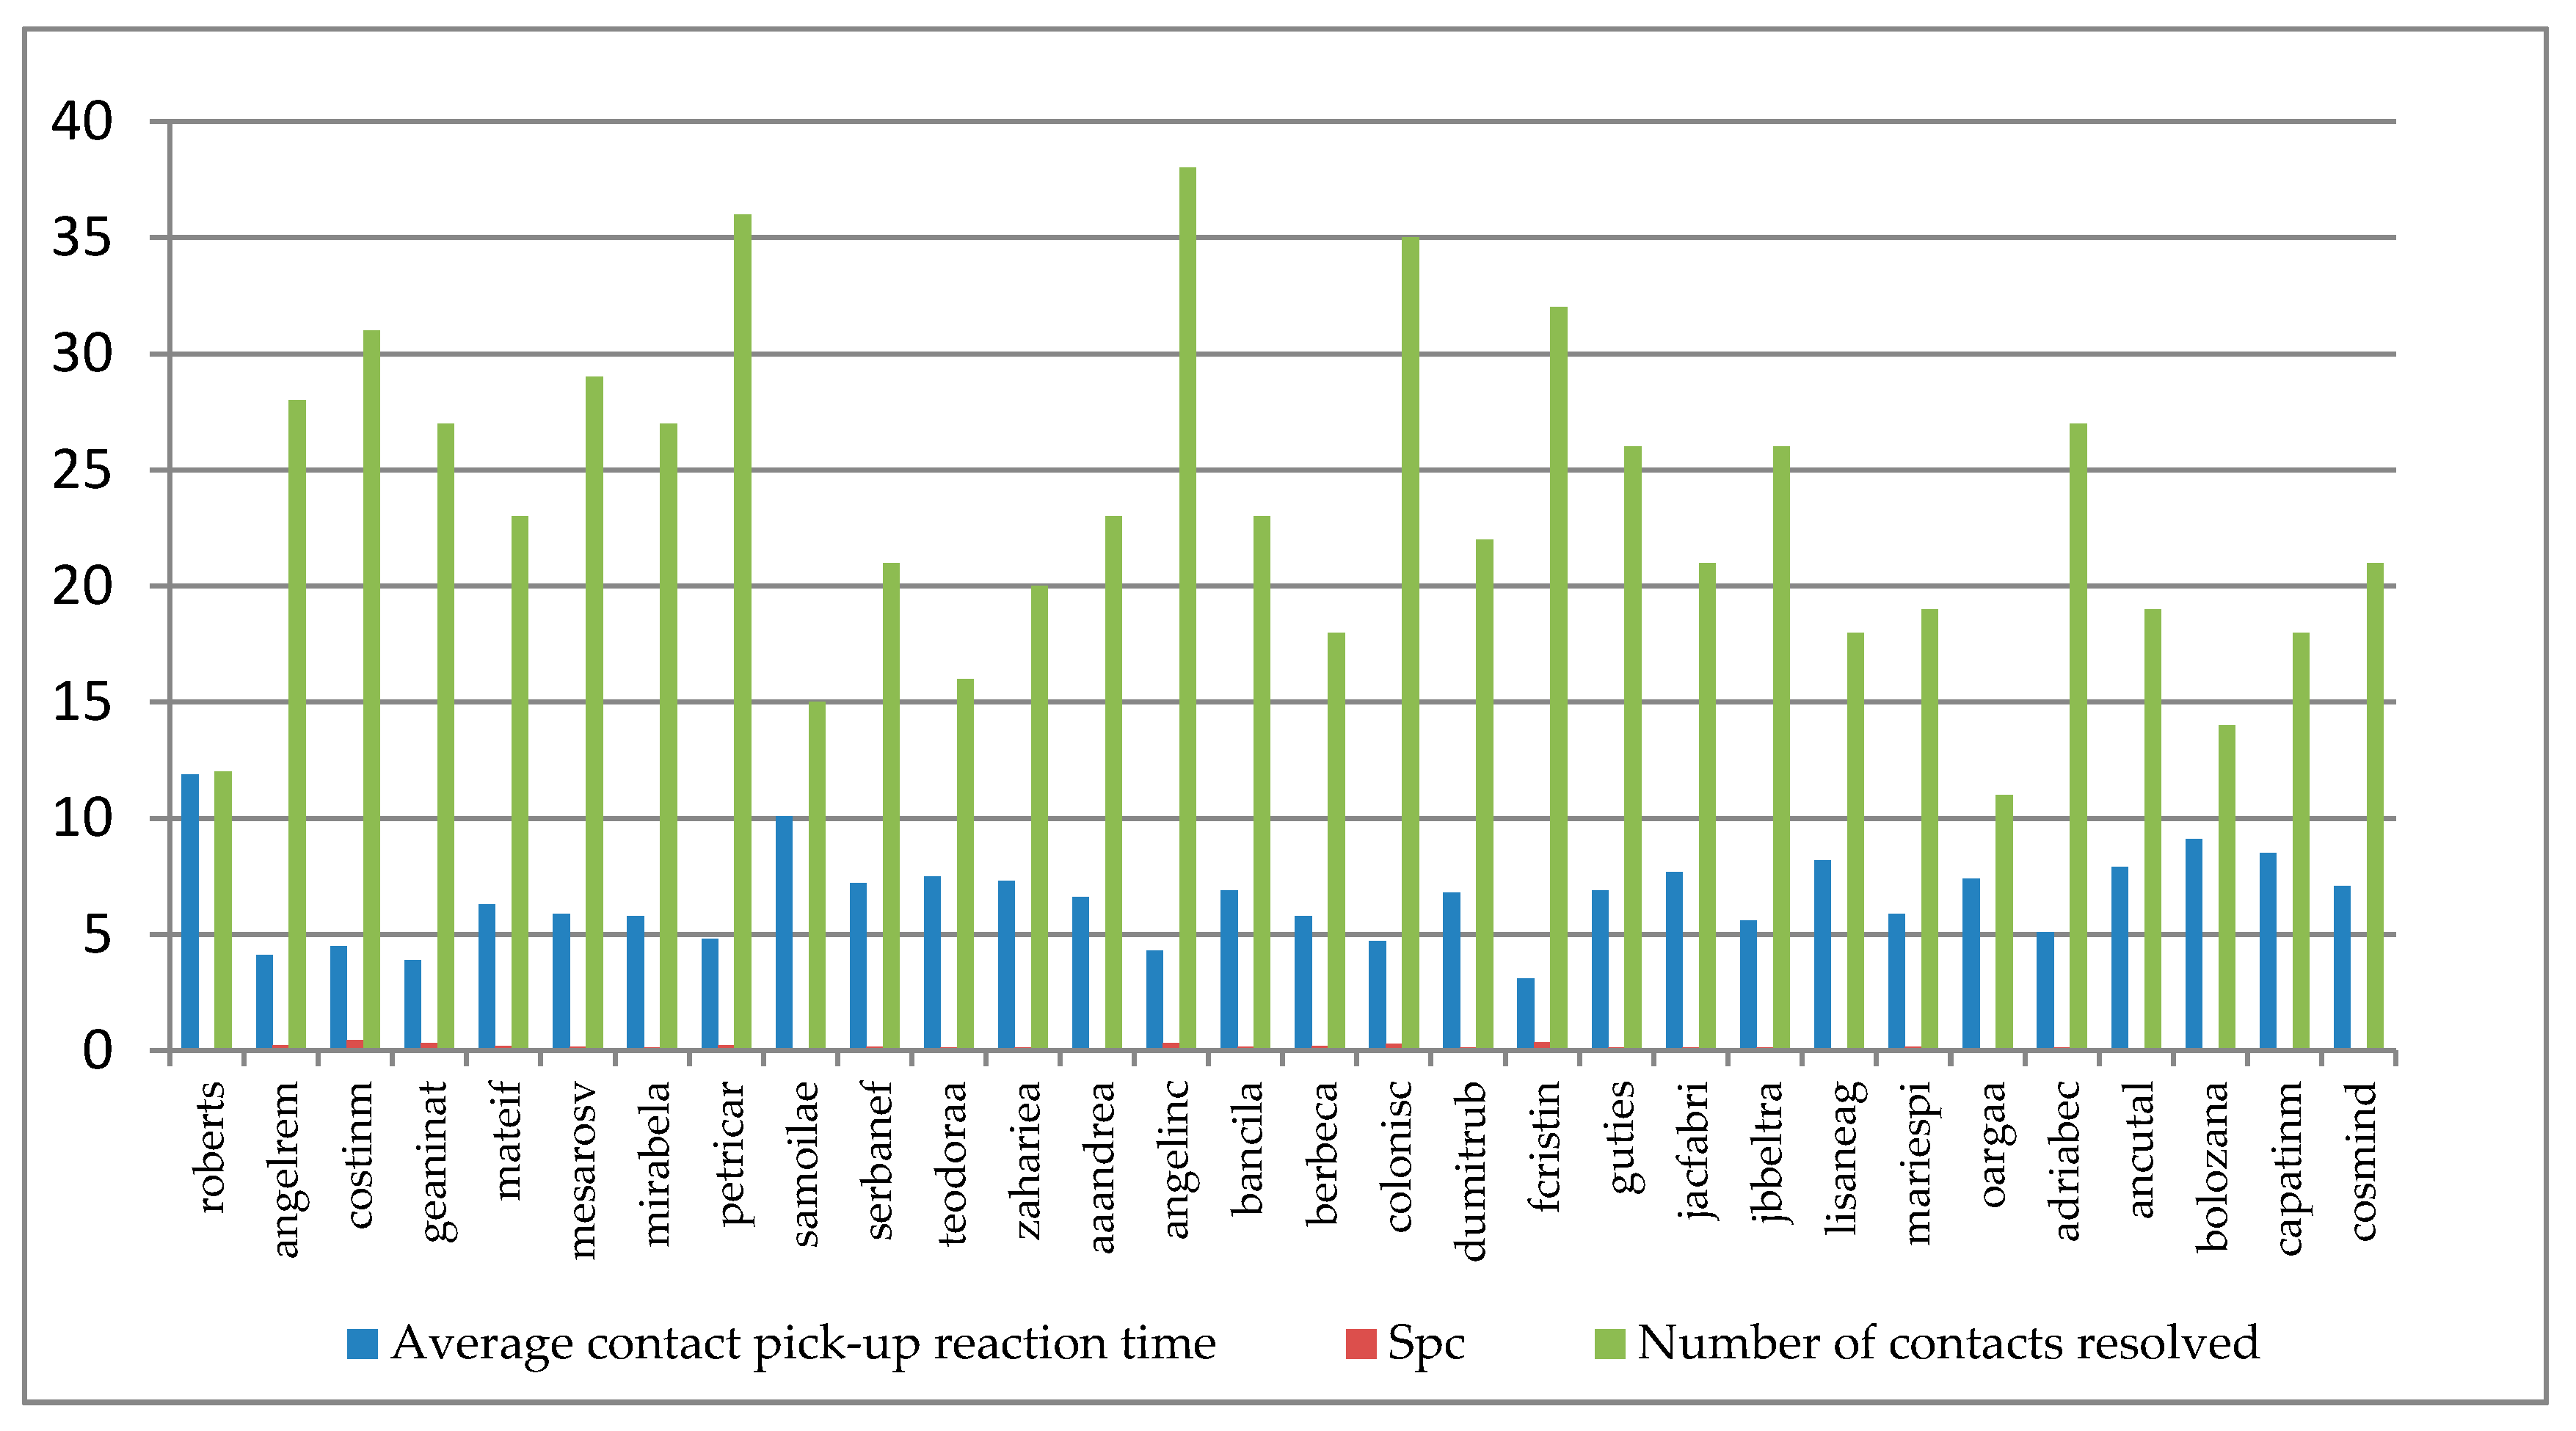
The same agent obtained, by applying the MS method, the average of how to welcome the customer as unsatisfactory, and, in terms of productivity, he also has less than 20 contacts, which places him in the weak area; this also because the average contact resolution time is 7.1 min per contact. When the agent has an average high contact resolution time, the number of contact retrieval is reduced. These correlations can be seen in
Figure 2.
5. Discussions
This research was done by analyzing the situations and ways in which response times are reduced when dealing with contacts, especially those with high media. Why did some employees have the average time to react to take such high contacts? It seems that, in the case of the company analyzed in this work, there is an aversion to risk. This experiment revealed that only 3 out of the 32 employees were willing to take the risk. It follows that a narrow framework would prevent the managers of firms from achieving maximum efficiency, as employees do not take risks. Perhaps a solution to this problem would be if groups of 8 people were formed, with the Spc indicator being taken as the average of the 8 employees, without individuality.
This MS method applied within the company has managed to bring, to the forefront, all these aspects which, in December, contributed to the reduction in the efficiency of the company’s staff. These evaluations have resulted in several problems that have been addressed. If we were to look at the changes that occurred over the 3 months individually, we can see, for example, the Spc for Roberts increased from 0.09 points in January to 0.17 points in March. While the resolution time of a contact was not reduced by keeping it to 10 min per contact, the other indicators have undergone various changes, i.e., labor productivity has increased and customer satisfaction has increased.
At company level, as a whole, total employee productivity increased and the number of contacts taken over since January 2019 increased (
Table 4).
Thus, in January 2019, compared to December 2018, for example, the total number of contacts taken over by employees increased by 2.73%; in February 2019, the number of contacts increased by 25% compared to December 2018.
As a result of the application of the SIM program within the company, economic efficiency has undergone some changes. Between December 2018 and May 2019, the economic and financial situation of the firm was presented in the following manner (
Table 5).
If we were to look at the economic situation of the firm, we can see that the turnover of the company in December 2018 compared to January 2019 is down by −1.25%. Looking at the other economic indicators in the same range, it can be seen that the profit is also down by −1.63%; also, a positive thing is that we have a decrease in costs, but overall, the situation is not exactly positive. For example, the commercial rate and the rate of return are decreasing.
6. Conclusions
With the start of the implementation of the SIM program within the firm, there have been some visible changes both in the human resources sector and in the economic and financial sector. As regards to the economic efficiency indicator of output factors, it is on the increase that aspect is good, the higher the economic efficiency of the firm.
With regard to the rate of return indicator, which is the ratio between the profit achieved and total costs, we can say that it is growing steadily, which strengthens the claim that the SIM program has been really successful. The relative change in the rate of return is the most pronounced in February, in which it increased from January by 12.22 percentage points. The same trend is also the rate of trade which is also on the rise from one month to the next.
As a conclusion of the case study, we can infer that there is risk aversion [
10] on the part of employees due primarily to their fears of failing or losing their jobs. A solution to improving business at the firm level would be to apply the ITA method consistently, along with the Spc indicator, and also to group the way employees are assessed. As a result, it has been noted that to reduce the risk of employee aversion, a solution would be to set up groups of 8 employees so that the analysis results are no longer individual but group.
The main objective of applying the six Sigma method is to improve and increase business activity in companies by reducing defects and increasing productivity [
11]. Many of the principles underlying this method are also found in the SIM program used in this work. The very operating mechanism of the Spc indicator is developed on the application model of the six Sigma method. The implementation of this program aims at improving the results in terms of customer satisfaction, while at the same time, improving the results of the indicators presented.
In the case of the study presented, economic and financial indicators can be seen as increasing, which shows a positive aspect of the company’s economic situation. The increase in the number of contacts taken at company level is clear to add productivity. From the point of view of the Spc indicator, it can be said that customer satisfaction has been continuously increasing according to the analysis carried out.


