Studies on the Use of ISO 7730 in Romanian Companies †

Department of Industrial Engineering and Management, “George Emil Palade” University of Medicine, Pharmacy, Science and Technology of Târgu Mureş, 540142 Târgu Mureş, Romania
†
Presented at the 14th International Conference on Interdisciplinarity in Engineering—INTER-ENG 2020, Târgu Mureș, Romania, 8–9 October 2020.
Proceedings 2020, 63(1), 63; https://0-doi-org.brum.beds.ac.uk/10.3390/proceedings2020063063
Published: 14 January 2021
(This article belongs to the Proceedings of The 14th International Conference on Interdisciplinarity in Engineering—INTER-ENG 2020)
Abstract
:This paper aims to identify how the ISO 7730 Standard is perceived by manufacturing companies in Romanian industry. This paper aims to integrate the details of the ISO 7730 Standard into the research related to the level of comfort in manufacturing companies with high heat emissions. Furthermore, we hope to identify how the indices provided in the ISO 7730 Standard can influence the productivity and quality indicators in production.
1. Introduction
Indoor air quality (IAQ) plays a major role in terms of employee health and comfort. Labor productivity can be disturbed by polluted environmental conditions and indoor air quality. In this article, we highlight the main factors that affect the daily productivity of employees in the workplace, without taking into consideration factors such as the effects of noise and lighting in large urban areas, previous health issues, personality, socio-economic status, and eating habits.
A company’s main objective should be related to raising awareness by assessing signs, such as health implications, workers’ complaints, absenteeism, and low productivity. The complexity of a real environment makes it very difficult to assess the impact of a single parameter on human performance; however, providing a superior environment can be an effective way to increase productivity [1]. Previous studies provide evidence that the quality of the environment influences the incidence of acute respiratory diseases, allergies, asthma, and disease symptoms.
Complaints from Dutch office workers have increased since the 1970s, when new office equipment and arrangements were implemented, such as new spatial concepts (open plan offices), advanced control equipment, and new materials. Table 1 presents the three acceptable perspectives of IAQ.
Reports on holiday leave in Ireland and the UK show that most cases of leave among employees in public administration offices happen due respiratory problems that may be the result of IAQ [3].
The purpose of this paper derives from a previous study by the author [4], and consists in understanding the ISO 7730 Standard and identifying if Romanian companies know this standard, if they apply it, and if they consider that thermal conformity indicators influence the quality and quantity of their production.
Thus, the methodology used was based on a bibliographic study of the ISO 7730 Standard, followed by an investigation on a sample of 40 companies from Romania.
These companies have productive fields of activity, with heat release, in the automotive, metallurgy, and chemical industries, as well as industries in which thermal treatments are performed on metallic materials. Only 17 companies responded to our request, and the research was based on the interview method. The conclusions of the research are included in this paper.
2. How to Better Understand the Standard ISO 7730
The International Standard ISO 7730 was developed in order to measure and analyze the moderate and extreme conditions to which humans are exposed.
The thermal balance of the human body is obtained when internal heat production in the body is equal to the loss of heat to the environment. The main factors that influence this balance are physical activity, clothing, and the parameters: air temperature, mean radiant temperature, air velocity, and air humidity. When these parameters have been estimated and measured, the thermal sensation of the body can be predicted by calculating predicted mean vote (PMV).
PMV is intended for a large group of people exposed to the same environment.
It is applied in order to check if the given thermal environment complies with the comfort criteria and to establish requirements for different levels of acceptability, as shown in Table 2.
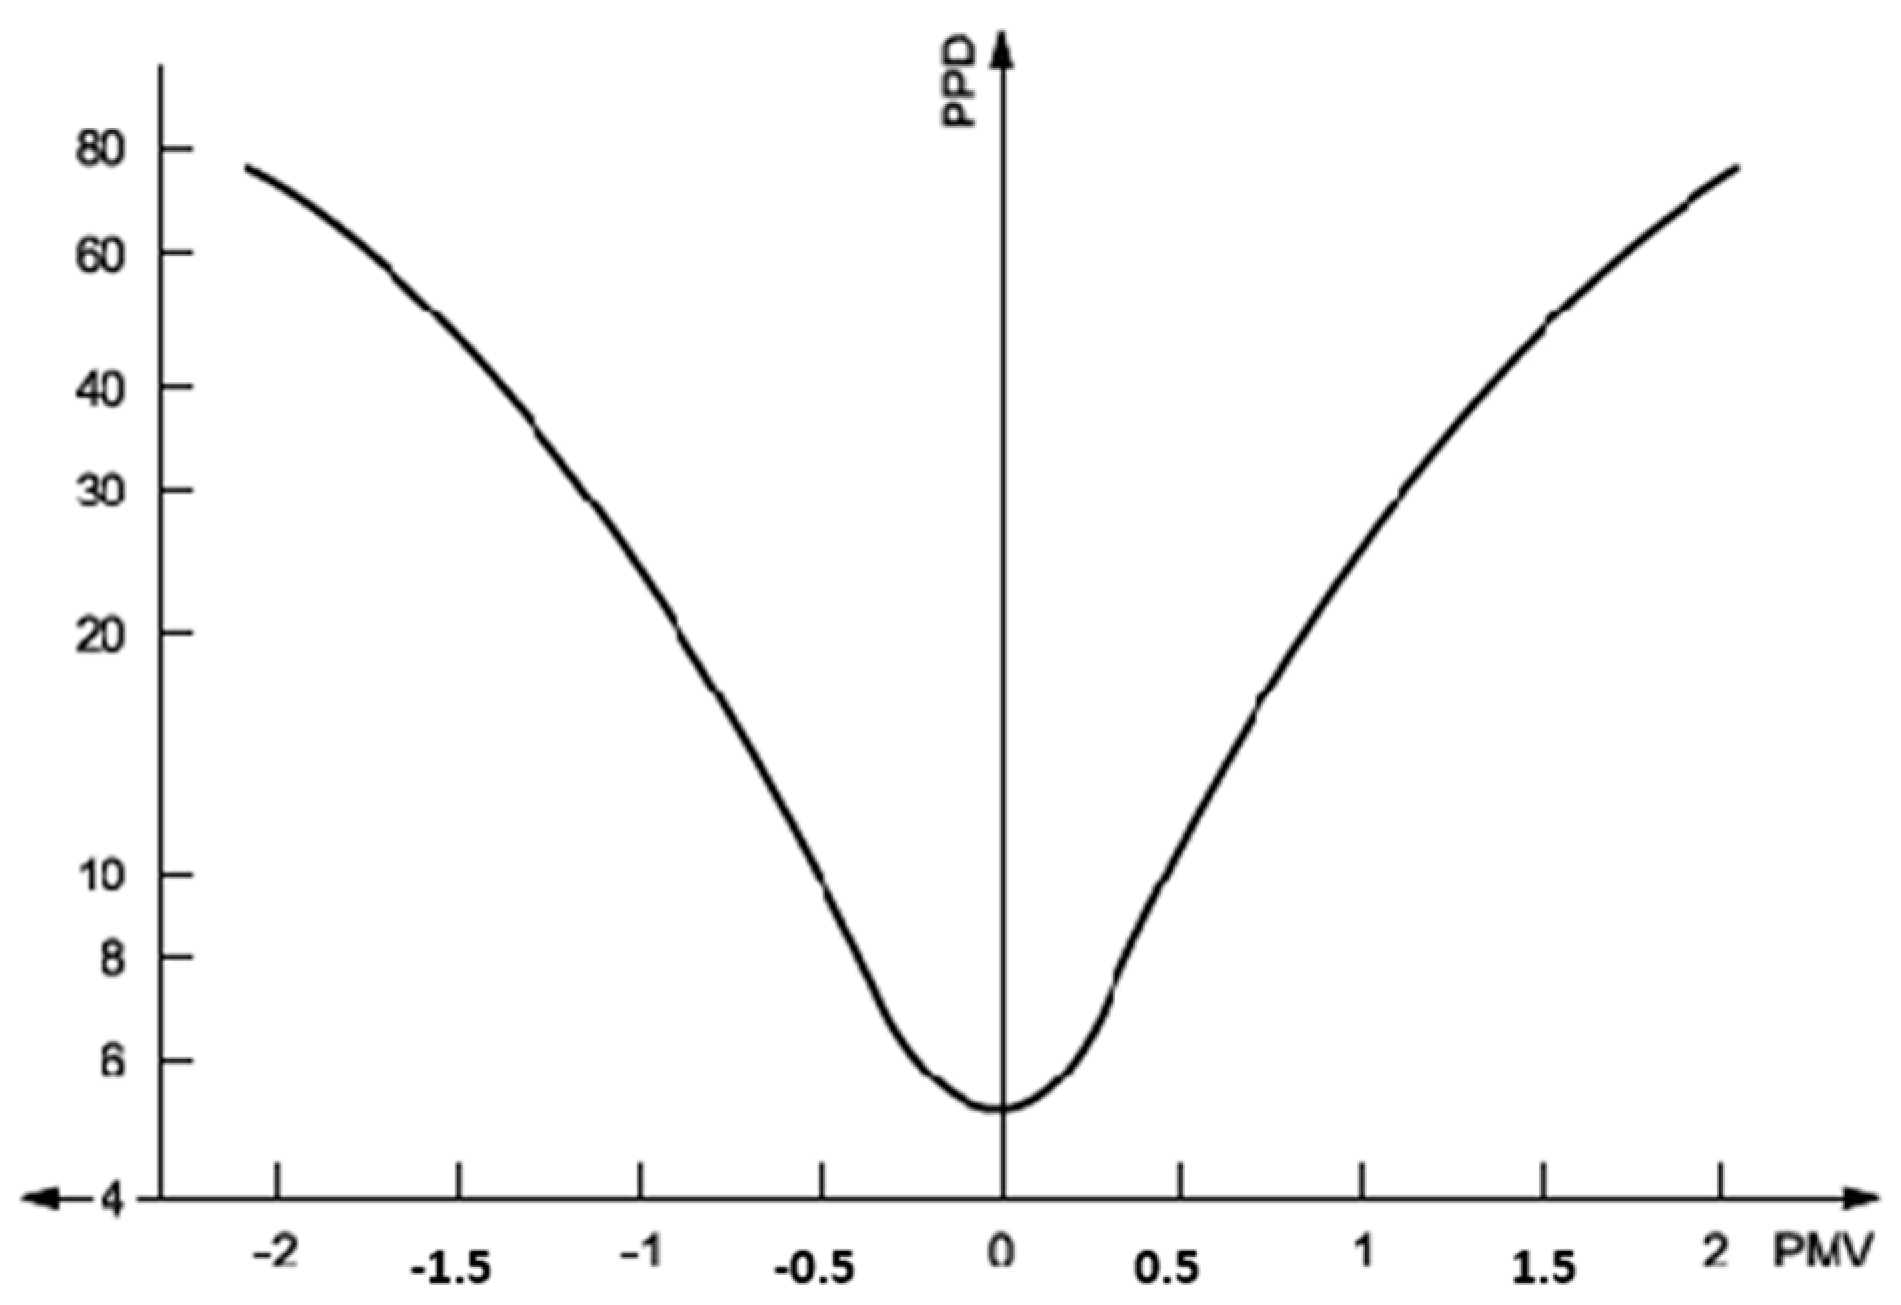
The predicted percentage dissatisfied (PPD) index establishes a quantitative prediction (the number of thermal dissatisfied persons among a large group of people). The rest of the group will feel thermally neutral, slightly warm, or slightly cool. It can be calculated after the PMV value is determined as in (3):
PPD = 100 − 95 × exp(−0.03353 × PMV4 − 0.2179 × PMV2),
PMV and PPD express warm and cold discomfort for the body as a whole, and the Figure 1 shows the connection of these two indicators.
Thermal discomfort can also be caused by unwanted local/particular cooling or heating of the body. People with a sedentary activity are more sensitive than those who have a higher level of activity. The most common local discomfort factors are radiant temperature asymmetry (cold or warm surfaces), draught (defined as a local cooling of the body caused by air movement), vertical air temperature difference, and cold or warm floors [5].
Thermal comfort is that condition of mind that expresses satisfaction with the thermal environment. As a result of local or national priorities, technical developments, and climatic regions, these tools (PMV, PPD, the draught model, and the relations between these) may be used to determine different ranges of environmental parameters for the evaluation and design of the thermal environment [6].
Nonsteady State
The thermal environment is often in a nonsteady state. There are three types of nonsteady state conditions that are often present: temperature cycles, temperature drifts or ramps, and transients.
Long-term evaluation of the general thermal comfort conditions.
Different categories of general comfort may be specified as ranges for the PMV–PPD, as shown in Table 3.
If these criteria are to be met, including extreme situations, the heating and/or cooling capacity of any heating, ventilation, air-conditioning (HVAC) installation should be relatively high. Economic and/or environmental considerations can lead to acceptable limited time intervals during which the PMV will be allowed to stay outside the specified ranges.
Using computer simulations or measurements, comfort conditions are often tested during longer periods for different types of building and/or HVAC design. The need here is to specify a characteristic value for the long-term comfort conditions for the comparison of designs and performance.
In determining the acceptable range of operative temperature according to this International Standard, a clothing insulation value that corresponds to the local clothing habits and climate should be used.
In warm or cold environments, there is often an influence due to adaptation. Apart from clothing, other forms of adaptation, such as body posture and decreased activity, which are difficult to quantify, can result in the acceptance of higher indoor temperatures. People used to working and living in warm climates can more easily accept and maintain a higher work performance in hot environments than those used to colder climates.
3. Conclusions Regarding the Use of the Standard in the Romanian Production
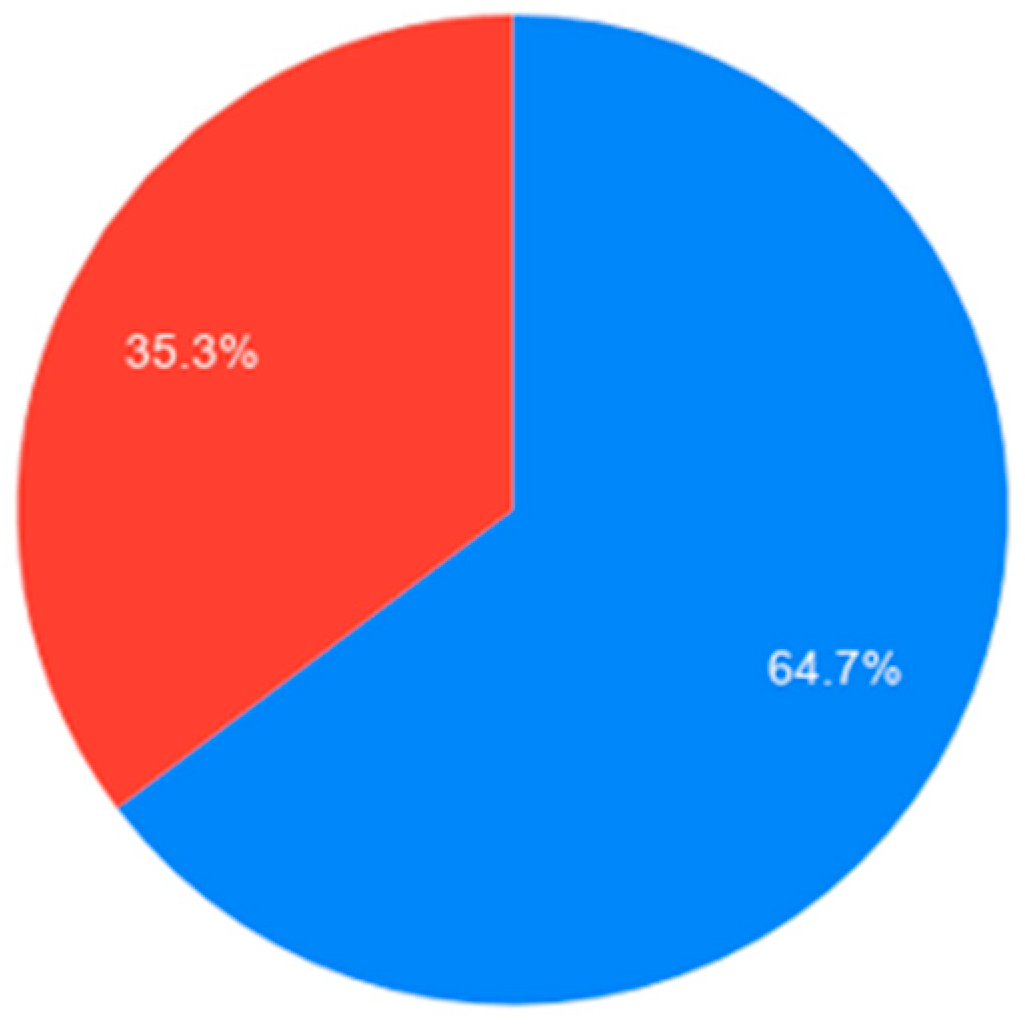
Because knowing the standard is very important to understanding the indicators of thermal comfort, I asked the production managers if they knew about the ISO 7730 Standard. Figure 2 shows that a significant percentage of these engineers were aware of the existence of this standard; however, there were some who did not have information about the ISO 7730 Standard. This means that in these areas, there was potential for improving thermal comfort, if we assume that knowing the standard is a starting point for monitoring these indicators.
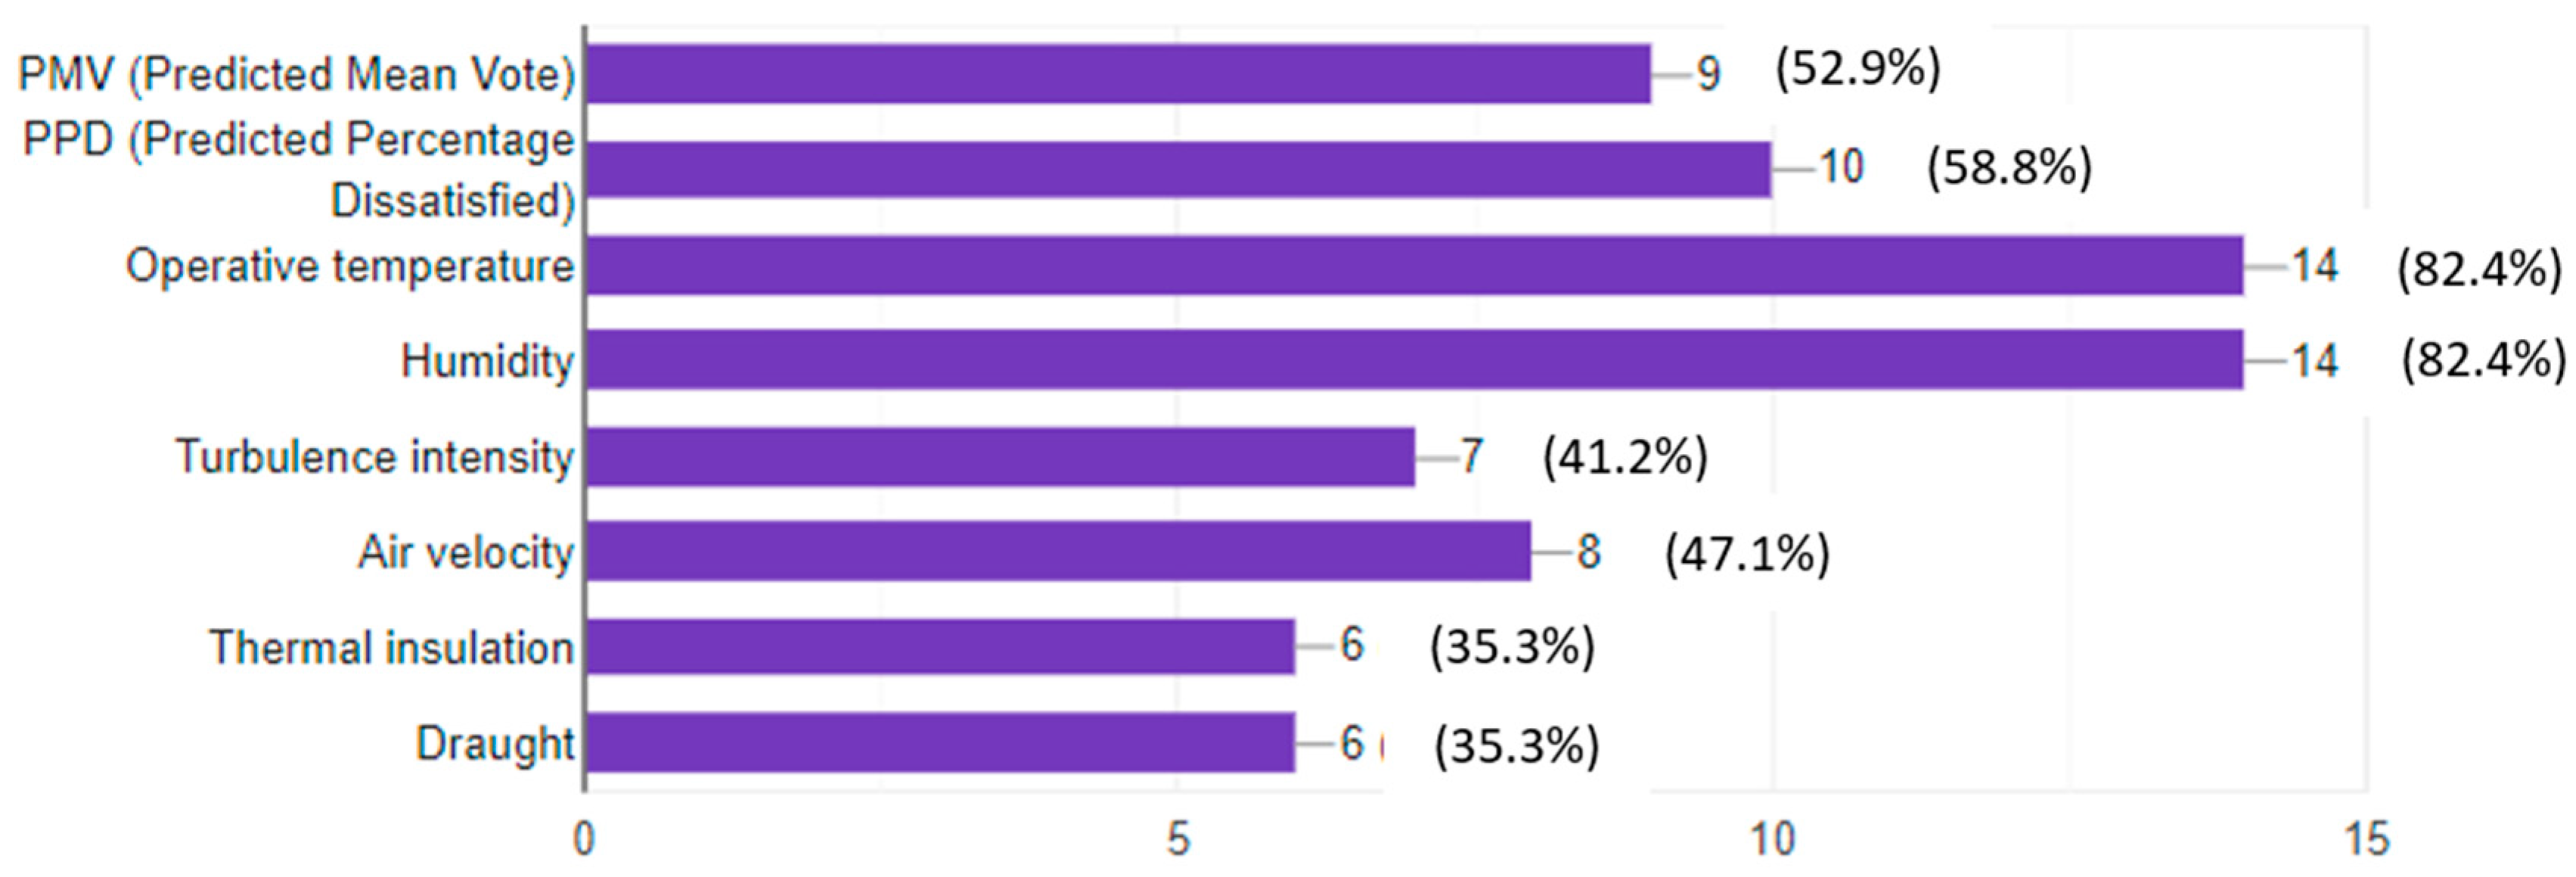
The most important indicators for measuring a given thermal environment, which meet the comfort criteria, are PMV, PPD, operative temperature, humidity, turbulence intensity, air velocity, thermal insulation, and draft. The designated managers from the companies I contacted for this research acknowledged that they were familiar with only some of these indicators. Thus, as shown in Figure 3, the best known indicators, and probably those that are the easiest relatively to monitor, were operative temperature and humidity; the least known indicators were thermal insulation, draught, and turbulence intensity.
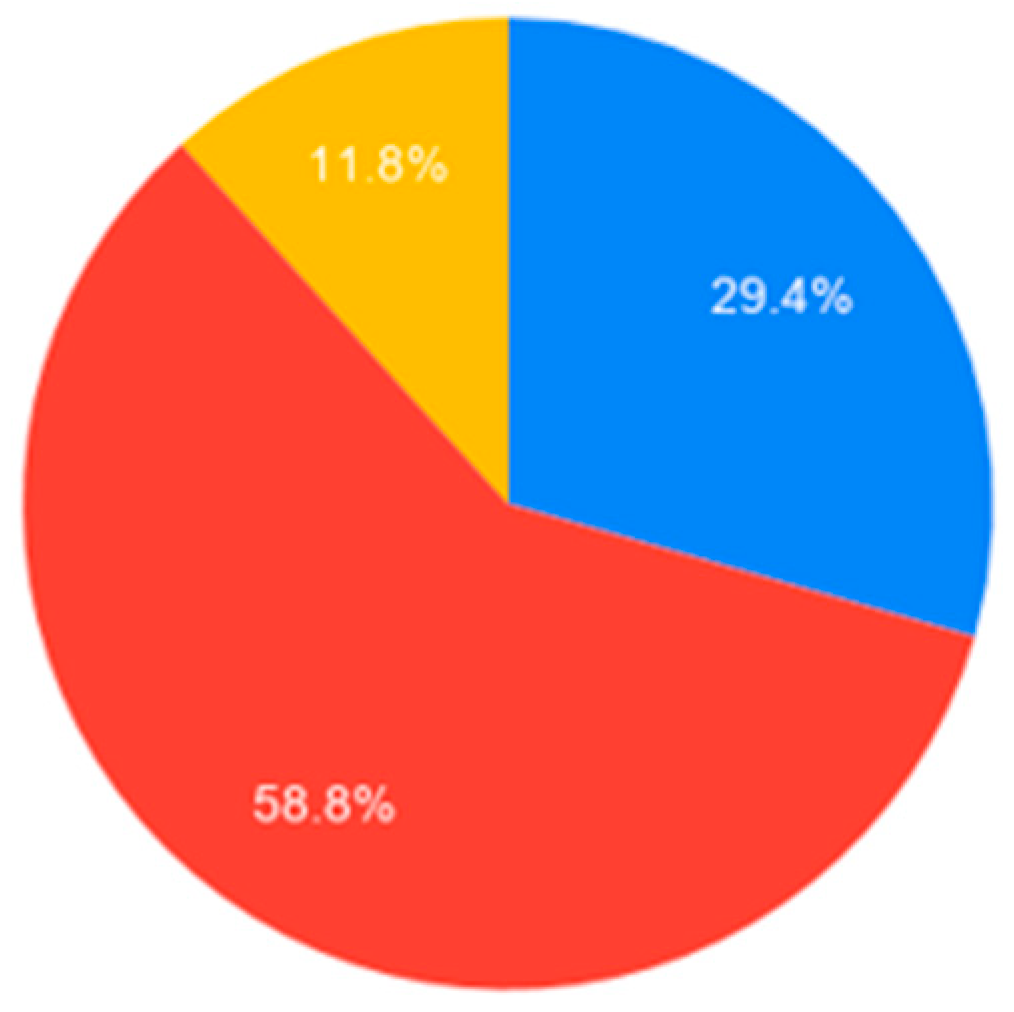
Given the results in Figure 3, I talked to the people responsible for the ergonomic part of the employees’ activity and asked if they considered that the indicators included in the ISO 7730 Standard influenced their productivity as well as the quality of production. Opinions changed as the discussions progressed, and this led me to believe that these interviews were more methods of raising awareness of the importance of these indicators. Thus, as shown in Figure 4, an extremely small percentage did not consider thermal comfort indicators to be able to influence their production, but only 58.8% were convinced of this. The present research has a significant role in demonstrating that in the future, the level of thermal comfort in the production halls has a direct influence on the quality indicators in production, in which the labor force is relatively important.
The reasons companies do not monitor thermal comfort indicators are complex, multiple, and depend on the management, financial support, the measuring tools (or lack of), responsibility, and other factors. We hope that these depend only on ignorance and the influence that these indicators have on financial losses due the poor quality of production in spaces with inappropriate thermal comfort being misunderstood. Thus, as a result of the multitude of reasons, Figure 5 clearly shows that very few companies are interested in monitoring the indicators in the ISO 7730 Standard.
4. Conclusions
IAQ research shows that low indoor air quality significantly reduces productivity and performance among employees. In the future, there is a need to raise awareness of the work environment, especially in developing countries, as it may pose a major health hazard [7].
A healthy and safe environment includes listening and evaluating employees’ complaints about the low or high temperature, humidity, and health symptoms that occur during office work. Defining a performance measurement system for public and private organizations that will provide accurate data, as well as an IAQ protocol that will promote the rapid assessment of IAQ issues is the future of employee-friendly jobs. Employers need to focus on creating healthy jobs and reducing productivity losses caused by low indoor air quality [8].
Funding
This research was funded by the University of Medicine, Pharmacy, Science and Technology “George Emil Palade” of Târgu Mureș Research Grant number 293/1/2020.
References
- Mendell, M.J.; Adams, R.I. The challenge for microbial measurements in buildings. Int. J. Indoor Environ. Health 2019, 29, 523–526. [Google Scholar] [CrossRef] [Green Version]
- ISO 7730:2005. Ergonomics of the Thermal Environment. Available online: https://www.iso.org/standard/39155.html (accessed on 1 November 2015).
- Seguel, J.; Merrill, R.; Seguel, D.; Campagna, A.C. Indoor Air Quality. Am. J. Lifestyle Med. 2017, 11, 284–295. [Google Scholar] [CrossRef]
- Bucur, M. Studies on the Need to Monitor IAQ Indicators in the Production Hall With Microclimate with Heat Release—Study on Companies from Mures County. Acta Marisiensis Ser. Technol. 2020, 17, 53–57. [Google Scholar] [CrossRef]
- Isoda, N.; Tsuzuki, K.; Yoshioka, M. Importance of floor surface temperature in maintaining thermal comfort for people sitting directly on the floor. In Proceedings of the 10th ICEE, Fukuoka, Japan, 23–27 September 2002; pp. 821–824. [Google Scholar]
- Toftum, J.; Melikov, A.; Tynel, A.; Bruzda, M.; Fanger, P.O. Human response to Air, Movement-Evaluation of ASHRAE’s Draft Criteria (RP-843). HVAC R Res. 2003, 9, 187–202. [Google Scholar] [CrossRef]
- Ole Fanger, P. Indoor Air Quality in the 21st Century: Search for Excellence. Indoor Air 2000, 10, 68–73. [Google Scholar] [CrossRef] [PubMed]
- Ceravolo, L.S.; Mirakovski, D.; Polenakovik, R.; Ristova, E.; Sovreski, Z. Indoor Air Quality (IAQ) as a Parameter Affecting Workplace Productivity. Air Pollut. Health 1998, 10, 101–126. [Google Scholar]
Figure 1.
Predicted percentage dissatisfied (PPD) as a function of predicted mean vote (PMV) [2].
Figure 1.
Predicted percentage dissatisfied (PPD) as a function of predicted mean vote (PMV) [2].

Figure 2.
Have you heard about ISO 7730?

Figure 3.
Which of the following indicators are you familiar with?

Figure 4.
Do you think that these indicators could influence the quality of your production?

Figure 5.
Would you be interested in monitoring the air quality in your production workspace?


Table 1.
The three acceptable perspectives of indoor air quality (IAQ) [2].
Table 1.
The three acceptable perspectives of indoor air quality (IAQ) [2].
| Point | Sensation |
|---|---|
| Building properties | No complaints, there are no requirements for ventilation, there is no polluting activity |
| US Environmental Protection (EPA)/Public health perspective | Minimizing toxin exposure, irritations, there are no adverse health effects, there are no comfort complaints |
| Building employees | Clean, dry, good ventilation, thermal comfort, there are no unfamiliar or unacceptable odors |
Table 2.
Seven-point thermal sensation scale [2].
Table 2.
Seven-point thermal sensation scale [2].
| Point | Sensation |
|---|---|
| +3 | Hot |
| +2 | Warm |
| +1 | Slightly warm |
| 0 | Neutral |
| −1 | Slightly cool |
| −2 | Cool |
| −3 | Cold |
Table 3.
Categories of thermal environment [4].
Table 3.
Categories of thermal environment [4].
| Category | Thermal State of the Body as a Whole | Local Discomfort | ||||
|---|---|---|---|---|---|---|
| PPD % | PMV | DR % | PD % Caused by Vertical Air Temperature Difference | PD % Caused by Warm or Cold Floor | PD % Caused by Radiant Asymmetry | |
| A | <6 | −0.2 < PMV < +0.2 | <10 | <3 | <10 | <5 |
| B | <10 | −0.5 < PMV < +0.5 | <20 | <5 | <10 | <5 |
| C | <15 | −0.7 < PMV < +0.7 | <30 | <10 | <15 | <10 |
Publisher’s Note: MDPI stays neutral with regard to jurisdictional claims in published maps and institutional affiliations. |
© 2021 by the author. Licensee MDPI, Basel, Switzerland. This article is an open access article distributed under the terms and conditions of the Creative Commons Attribution (CC BY) license (http://creativecommons.org/licenses/by/4.0/).
Share and Cite
MDPI and ACS Style
Bucur, M. Studies on the Use of ISO 7730 in Romanian Companies. Proceedings 2020, 63, 63. https://0-doi-org.brum.beds.ac.uk/10.3390/proceedings2020063063
AMA Style
Bucur M. Studies on the Use of ISO 7730 in Romanian Companies. Proceedings. 2020; 63(1):63. https://0-doi-org.brum.beds.ac.uk/10.3390/proceedings2020063063
Chicago/Turabian StyleBucur, Mihaela. 2020. "Studies on the Use of ISO 7730 in Romanian Companies" Proceedings 63, no. 1: 63. https://0-doi-org.brum.beds.ac.uk/10.3390/proceedings2020063063