Ways to Increase the Efficiency of Production Activity through the Active Involvement of the Human Factor †


Department of Management, “George Emil Palade” University of Medicine, Pharmacy, Science and Technology of Târgu Mureș, 38 Gheorghe Marinescu, 540139 Târgu Mureș, Romania
†
Presented at the 14th International Conference on Interdisciplinarity in Engineering—INTER-ENG 2020, Târgu Mureș, Romania, 8–9 October 2020.
Proceedings 2020, 63(1), 74; https://0-doi-org.brum.beds.ac.uk/10.3390/proceedings2020063074
Published: 26 January 2021
(This article belongs to the Proceedings of The 14th International Conference on Interdisciplinarity in Engineering—INTER-ENG 2020)
Abstract
:This paper aims to present ways to streamline production by implementing methods of analysis and continuous improvement of an important company in the Romanian car market, based on technology which produces various components, especially car wiring used by many manufacturers of important cars. The production and processes within the company are designed from a lean and ergonomic point of view, taking into account the latest trends specific to the field. Supported by the company’s management, the continuous improvement activity, along with the basic methods, enjoys the involvement of all employees, trained in this process by various means. Employee involvement is not just about decision-making on the part of the staff, but starts with simple operators, who are encouraged and motivated to express their ideas for improvement and get involved in their implementation.
1. Introduction
Technological progress has streamlined the production process, lowered costs and put the human factor in difficulty—employees have always had to adapt to new technologies or change their specialization. The production line, machines and equipment of any kind that have brought a certain level of automation or computers and mobile devices are some of the most recent stages of technological progress in business. Beyond automation, there are also technologies that support employees and can fully contribute to employee efficiency.
The production company must represent the image of a well-oiled machine, perfectly organized and controlled in order to meet customer expectations. By choosing a suitable production management system, everything that happens in the factory can be found in real time, and you can intervene to adjust different production lines or solve any problems that may arise [1]. Once the production operations are automated, the quality level of the operations and products can be measured and tracked even during the manufacturing process, thus ensuring the automatic archiving of information in the system.
A modern system that supports communication and data transfer can improve the accuracy of information and visibility on all production processes, so as to reduce costs and respect delivery data [2]. Reducing manufacturing defects, order preparation time and operating with a minimum required stock synchronized with production are other elements that lead to lower costs, all of which can be achieved through the use of an efficient production management system.
A production management system can lead to a more efficient workflow, due to the reduction of human errors and the maximum use of resources. At the same time, it improves the accessibility of data that support better decision-making, increases quality standards, increases production efficiency and makes better use of equipment whose maintenance is automatically planned and managed [3].
Consequently, a system for production management provides real-time knowledge of the situation in the production area, allowing for immediate action when the situation requires adjustments. The improper management of production challenges often leads to irreparable situations.
This paper aims to present ways to streamline production by implementing methods of analysis and continuous improvement of an important company in the Romanian car market, based on technology which produces various components, especially car wiring used by many manufacturers of important cars. The production and processes within the company are designed from a lean and ergonomic point of view, taking into account the latest trends specific to the field. Supported by the company’s management, the continuous improvement activity, along with the basic methods, benefits from the involvement of all employees, trained in this process by various means. Employee involvement is not just about decision-making on the part of the staff, but starts with simple operators, who are encouraged and motivated to express their ideas for improvement and get involved in their implementation.
2. Theoretical Foundations
In order to have an overview of performance at a given time and to be able to analyze the evolution, it is necessary to monitor some key performance indicators, called in the business environment Key Performance Indicators (KPI). For the departments in which mainly automated activities are identified, it is necessary to introduce a performance indicator that reflects reality as fully as possible. One such indicator is Overall Equipment Efficiency (OEE) [3]. In order to be determined, it is necessary to establish a system that collects production data that allows for the calculation of the OEE, which has become the main performance indicator of the production department.
The OEE provides a measurement method that gives a correct perspective of the performance of the equipment. The OEE also shows where opportunities for improvement can be identified.
The parameters to be followed in the calculation of the OEE are:
- availability—takes into account the time lost with the stops;
- performance—takes into account the speed losses, in particular, and represents the ratio between the quantity of parts that should have been produced in the time interval (theoretical quantity) and the realized quantity (real quantity);
- quality rate—takes into account the quality losses and is calculated as the ratio between the number of compliant parts and the total number of parts made.
The OEE provides three numbers that are useful and individual as the situation changes and help to visualize performance in simple terms—a very practical simplification [4].
Studies conducted worldwide show the following level of performance (Table 1), achieved by some of the most famous companies:
The needs for developing economic performance also refer to improving the skills of the human factor [5] in areas such as work organization, design–sizing–measurement–control–improvement–process management in companies, quality management [6], change management, risk management, project management, etc., with direct consequences on labor productivity [7] and performance competitiveness.
Whether it is a design process or an execution process, or whether it seeks to apply a technical or a non-technical process, the presence of the human factor is found in all, being substantially conditioned by its possibilities and interests. The successful initiation and development of activities within the company depends, to an overwhelming extent, on the degree to which the human factor is understood, motivated and coordinated, the only resource endowed with the ability to know and overcome its own limits [8].
3. Materials and Methods
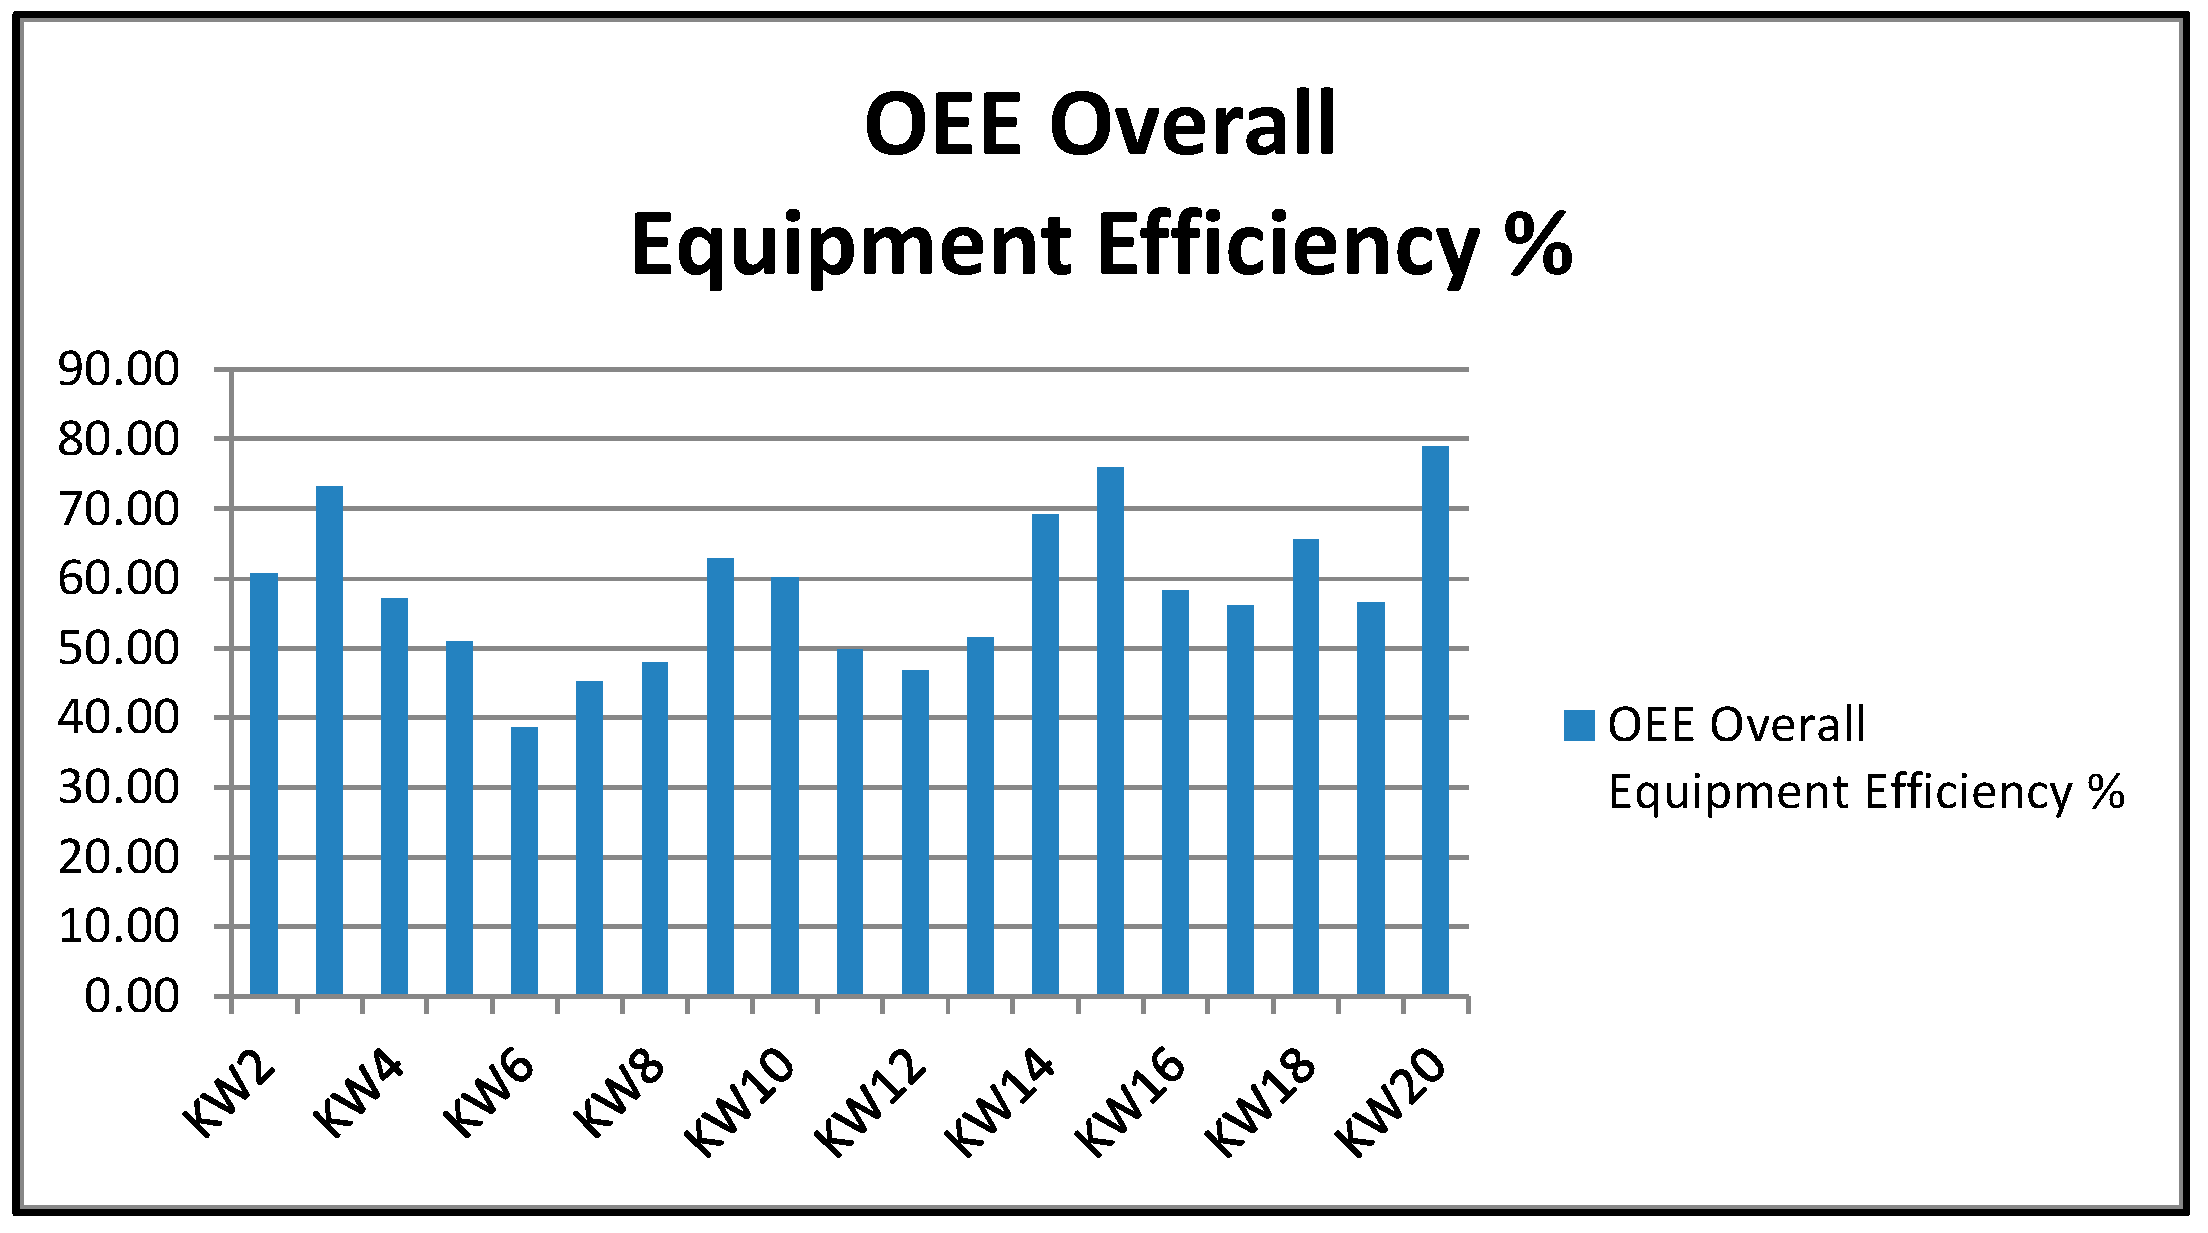
Based on the data collected at the level of the production department, the OEE was calculated in the first 20 weeks of 2016, obtaining an average of 58.21% (Figure 1). Compared to the global performance at that time, the possibilities for improvement were significant, and actions were required to increase the efficiency of the production activity.
Consequently, the management team set as a major objective the efficiency of the production activity by improving the OEE to 80% by the end of 2016 and 85% by the end of 2017.
In order to achieve the objective proposed in the company, a series of methods for continuous improvement of the production activity were taken into account and implemented.
4. Results
4.1. Analysis of Disturbing Factors
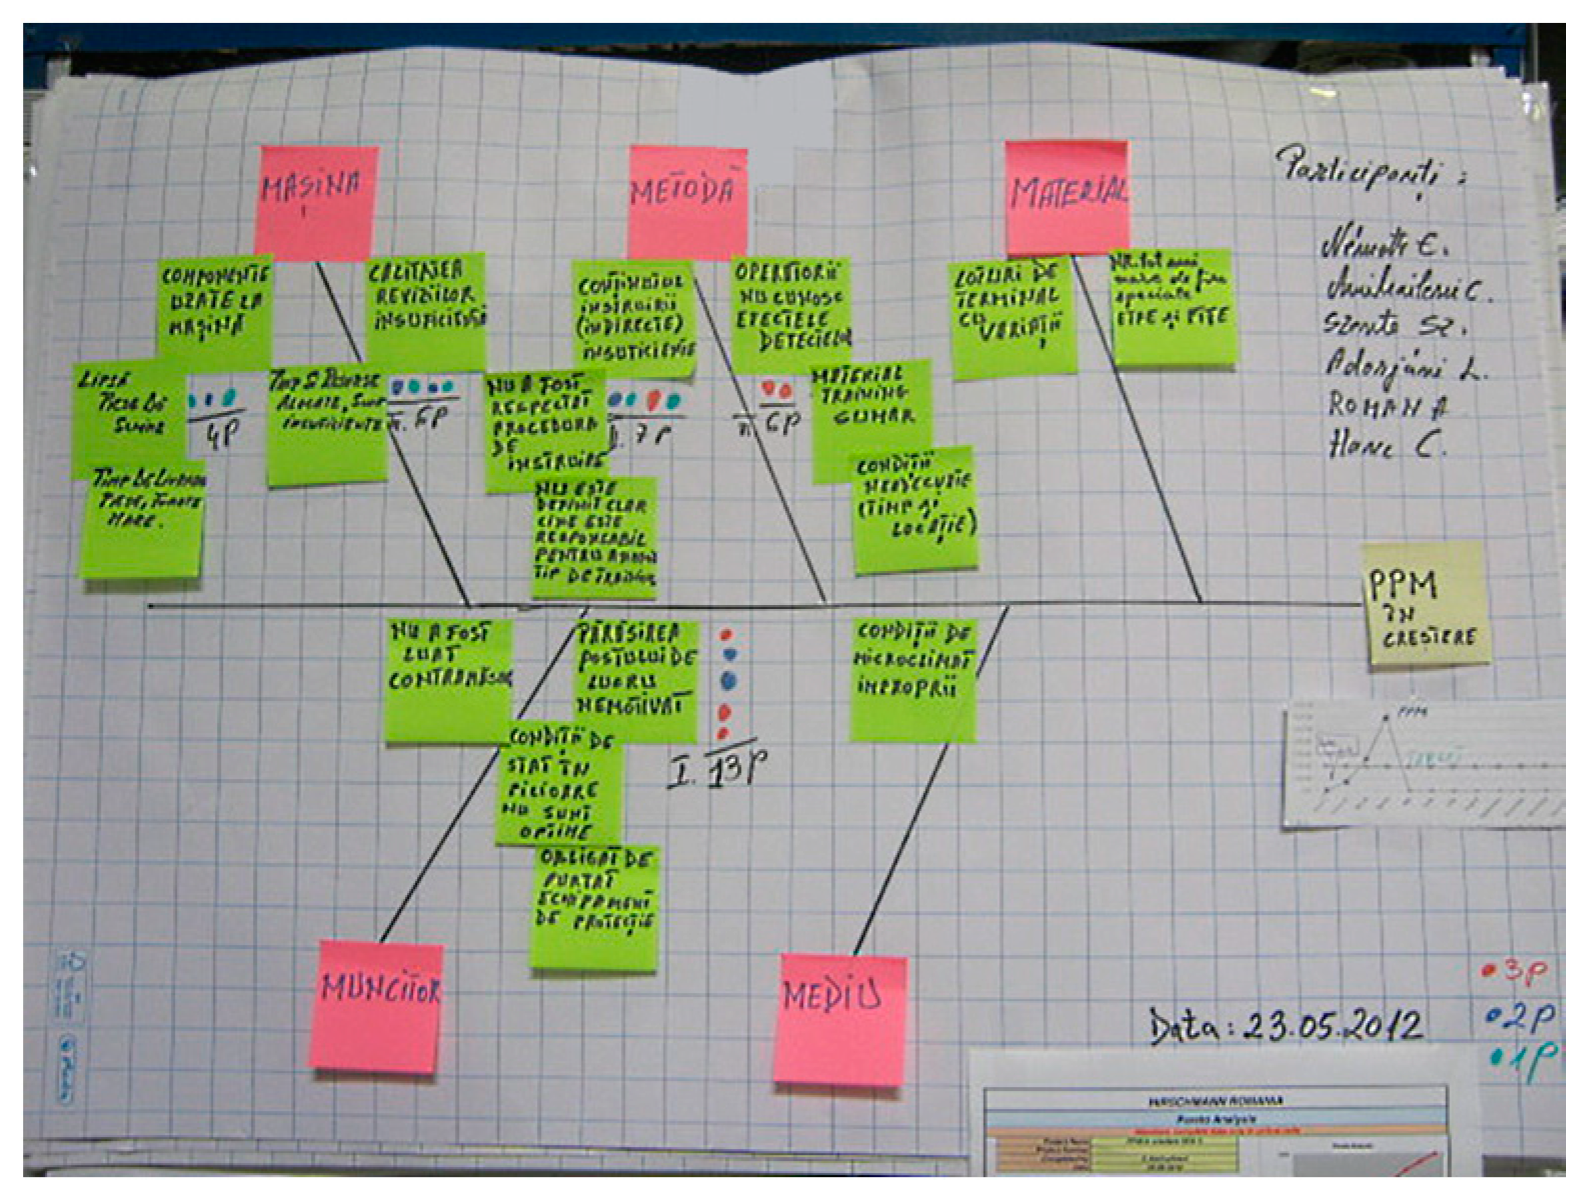
In order to improve all the factors that contribute to the evolution of the OEE, an analysis of the production department was carried out by the management team by making an Ishikawa Diagram. The analysis revealed the following causes:
- Machine: applicators with technical problems, wires attached to the pull rollers, loosening of the applicator discs while running;
- Method: cutting rules too high, unknown process parameters, long times to change products, wrong entries in the collection forms, incorrectly saved programs;
- Material: long threads;
- Worker: ignorance of the role of parameters by the operator, process parameters not observed, machine left unattended, programs not used by operators, when switching from long wires to short wires parameters remain set to minimum, incorrectly completed data leading to calculation errors;
- Environment: no cause was found.
The causes with significant impact were analyzed by the method of “5 Why?” to get to the root cause and be able to take action. For each case, up to 5 “why?” questions were asked.
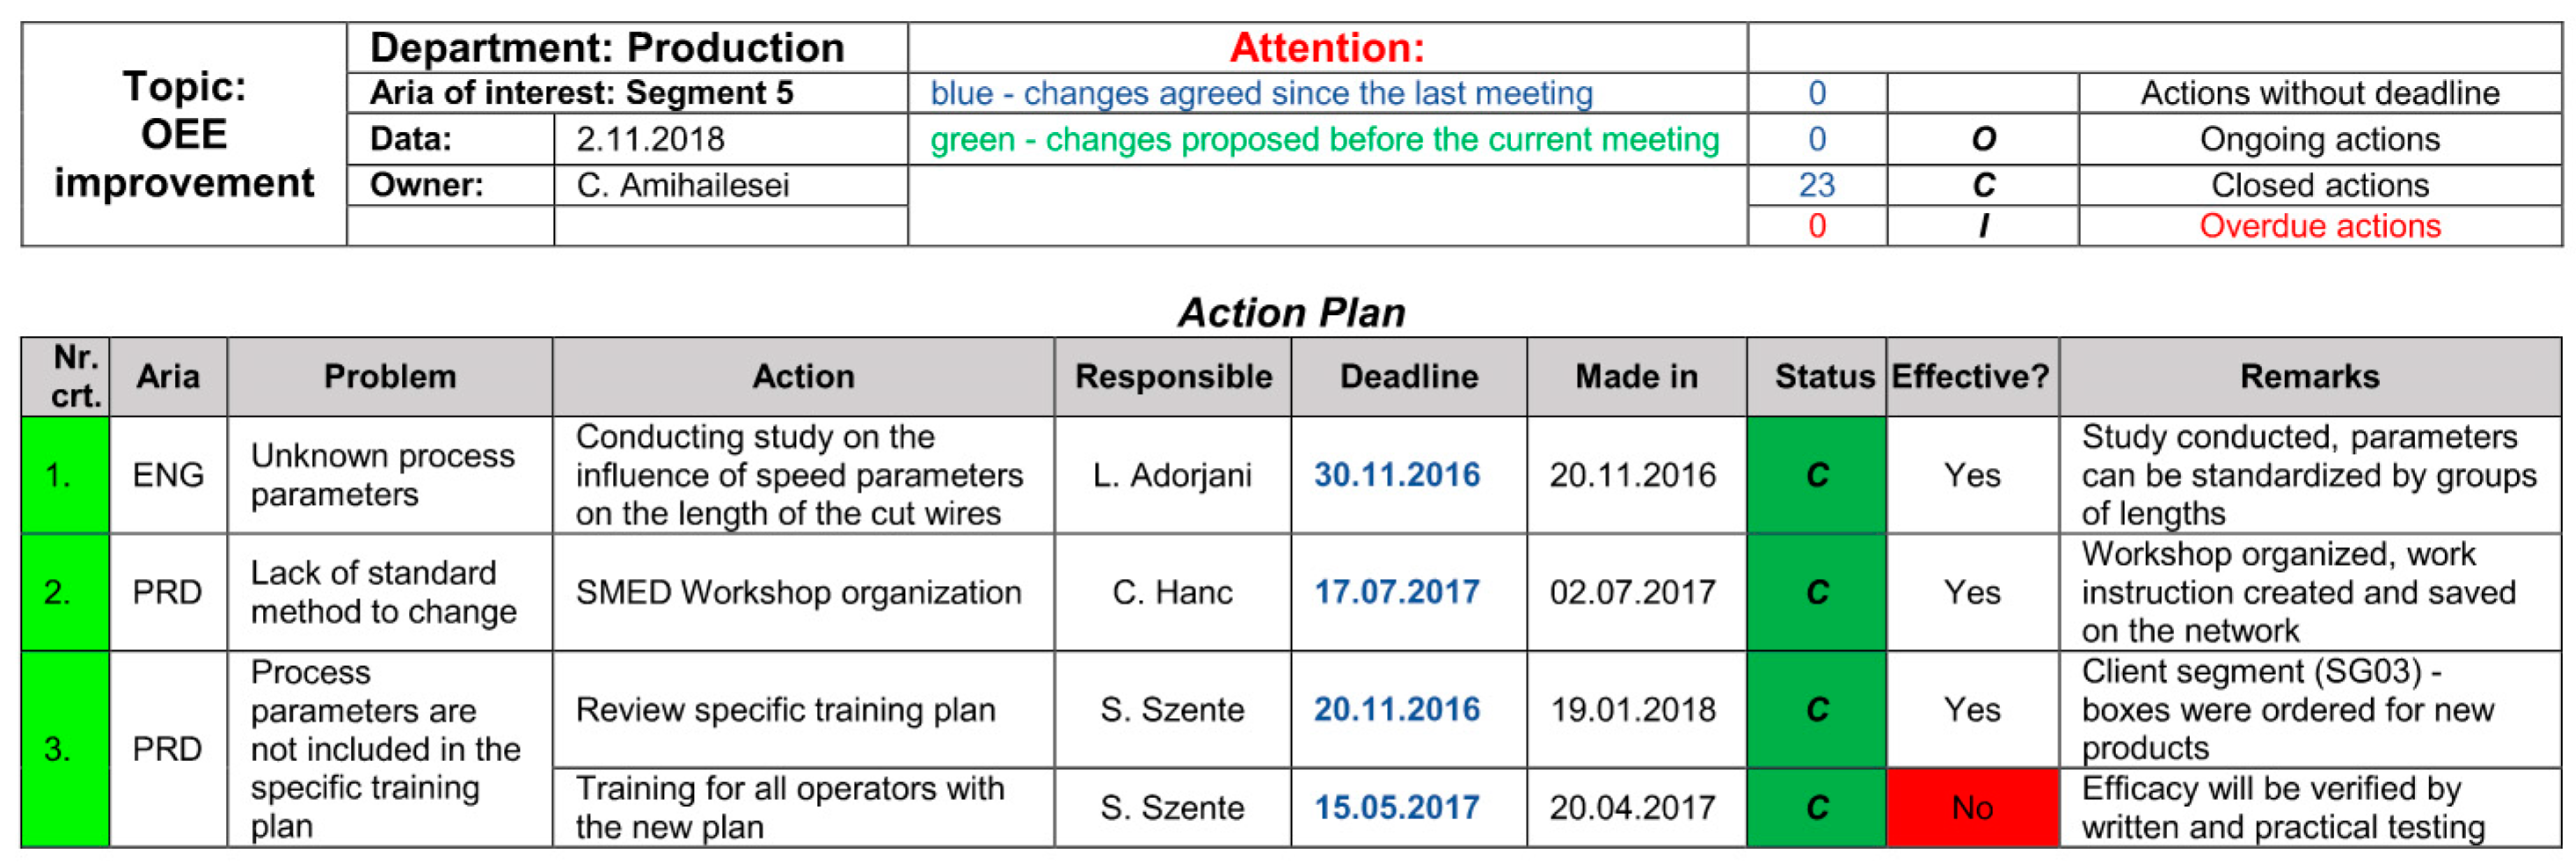
For the identified causes, actions were taken, each being assigned to a team member, with a deadline. In order to assign actions and monitor the situation, an Action Plan (Figure 2) was used, which allowed for the creation of graphs and monitoring actions (e.g., degree of closure of actions, distribution by areas, etc.) [9].
4.2. Reducing Change Times: Pareto Analysis, SMED Method
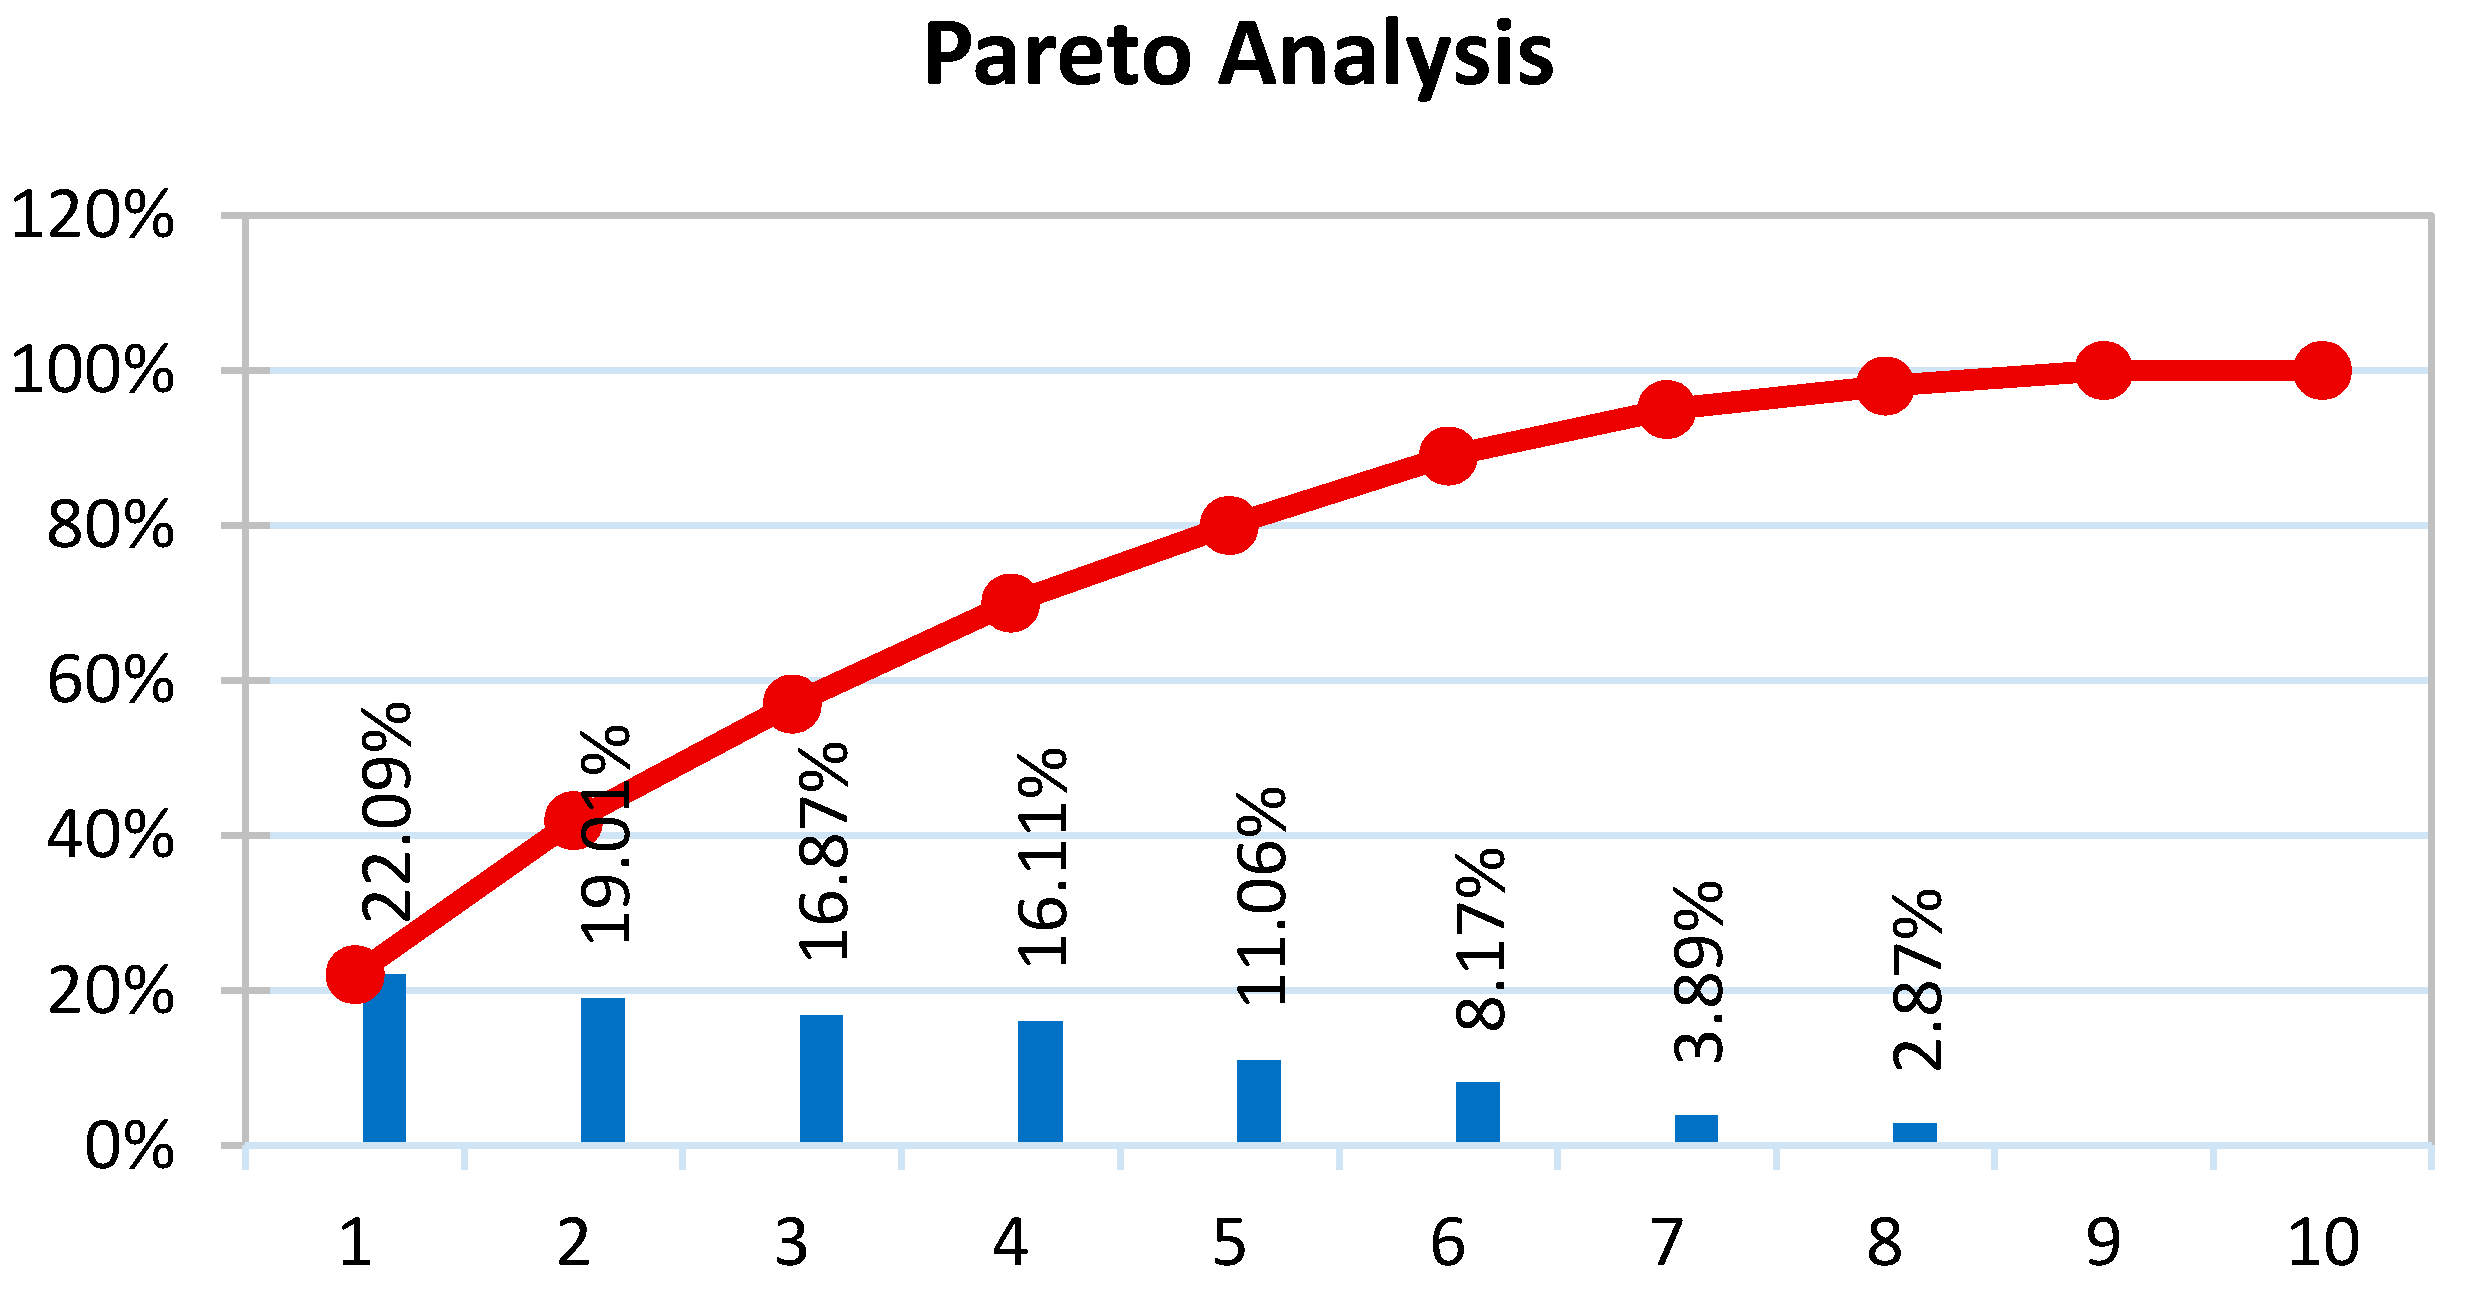
Data on machine downtimes were analyzed using the Pareto Diagram. Thus, the main causes identified were product changes and settings. Figure 3 shows that product changes are responsible for 22.09% of the total downtime, which causes an average of 70 h of downtime per week for all cars.
In order to reduce product change times, the SMED Method (Single Minute Exchange of Die) was also applied, the aim of which was to improve the method of changing tools/products so that the times when the machine does not produce are as short as possible. This method was then standardized.
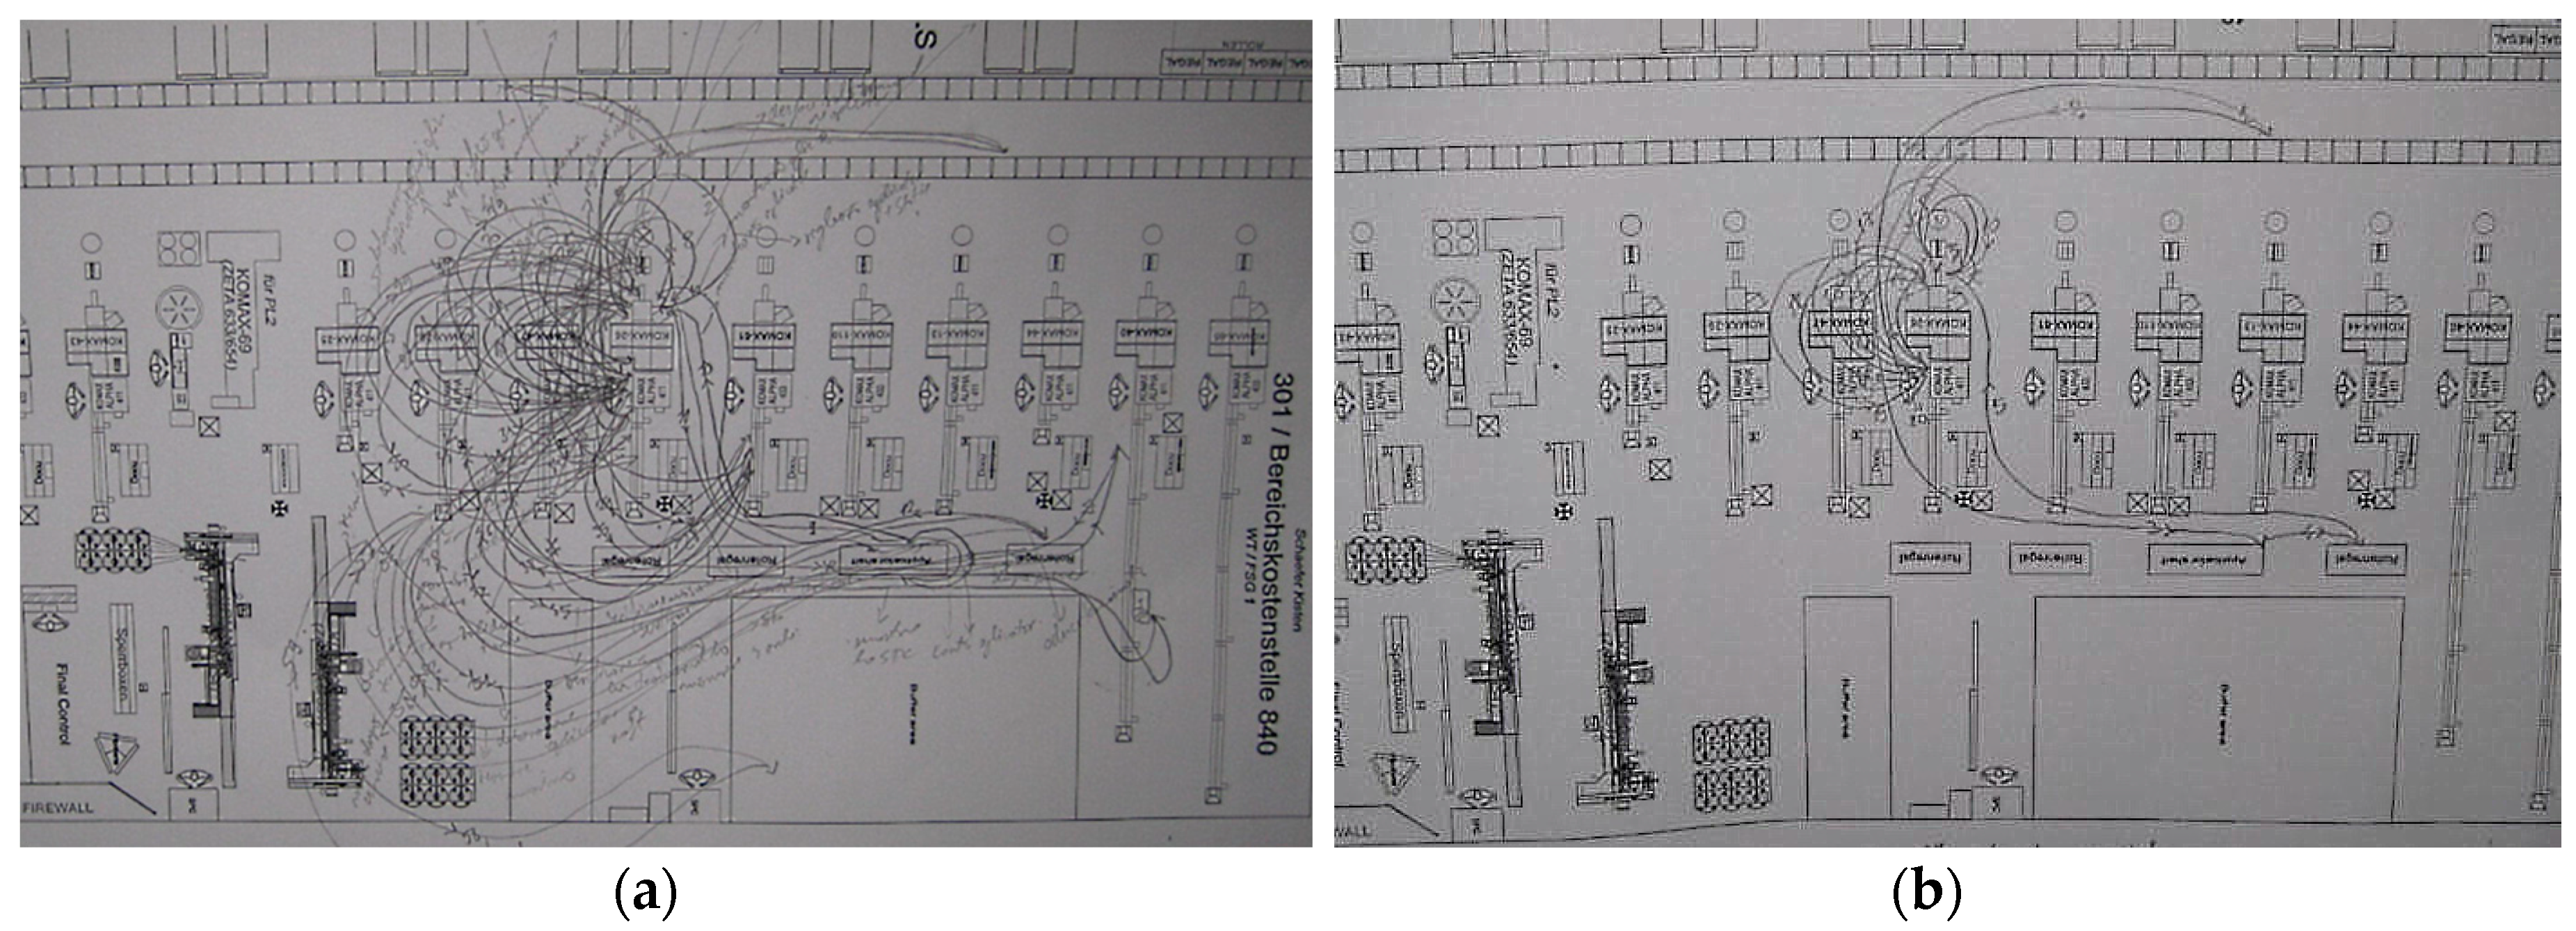
The process of changing tools and materials on the machine to achieve a new part of the product was filmed for further analysis, because in real time certain aspects can escape observation. Moreover, all the movements of the operator in the change process were plotted using “Spaghetti Diagram” (Figure 4a).
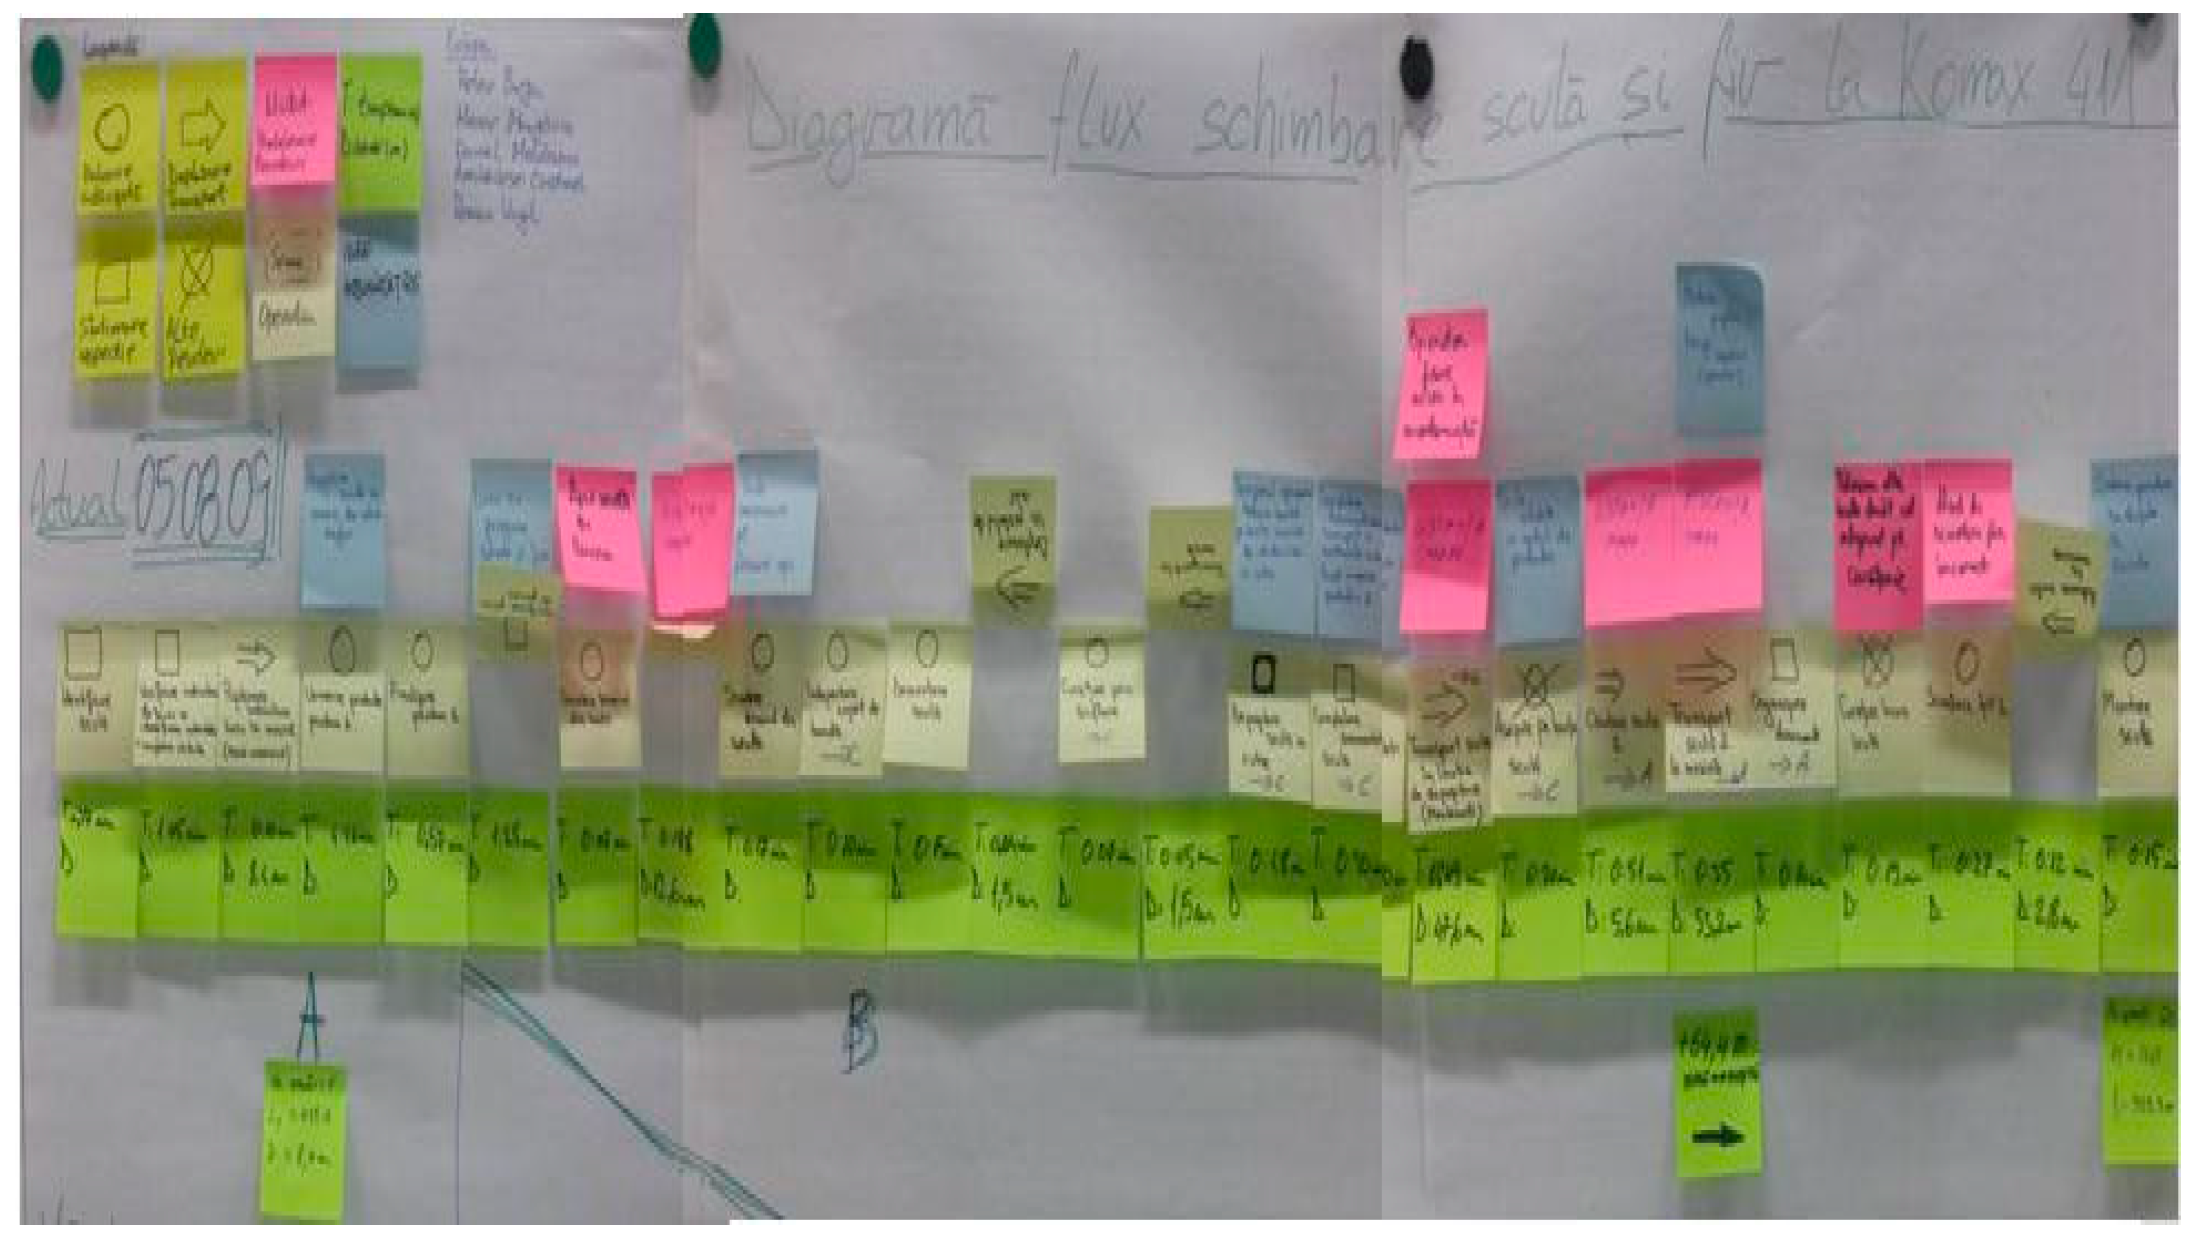
After analyzing the filming of the process, a map of the value of the process was made—Value Stream Mapping (VSM), in which each movement, action or verification was quantified in meters and seconds (Figure 5). The internal operations (performed while the car is stationary) were also delimited from the external ones (performed while the machine was producing).
The principle of Eliminate, Combine, Rearrange and Simplify (ECRS) was applied on VSM: each process step was analyzed, and unnecessary process steps were eliminated, operations that could be done at the same time were combined, the location of the tools was moved closer to the operator and difficult operations have been simplified. All operations that that did not require the machine to be stopped were performed either before the machine was stopped or after the machine was started.
4.3. Improving the Technical Condition of Machines: Autonomous Maintenance
In order to reduce unplanned maintenance times (machine failures), the concept of “Autonomous Maintenance” has been implemented, making the machine operator responsible for a series of checks, cleaning, lubrication and tightening, performed regularly, in order to eliminate the causes leading to machine failures and to provide specialized maintenance personnel with the time needed to carry out Preventive Maintenance activities.
Thus, the points that require daily verification were identified for each machine, and an Autonomous Maintenance form was created. Based on this, the operator performs daily checks and, depending on the situation, cleans, tightens or lubricates the machine parts. In order for the operators to be able to carry out these checks, it was obvious that they needed to be trained on the functional aspects of the machines.
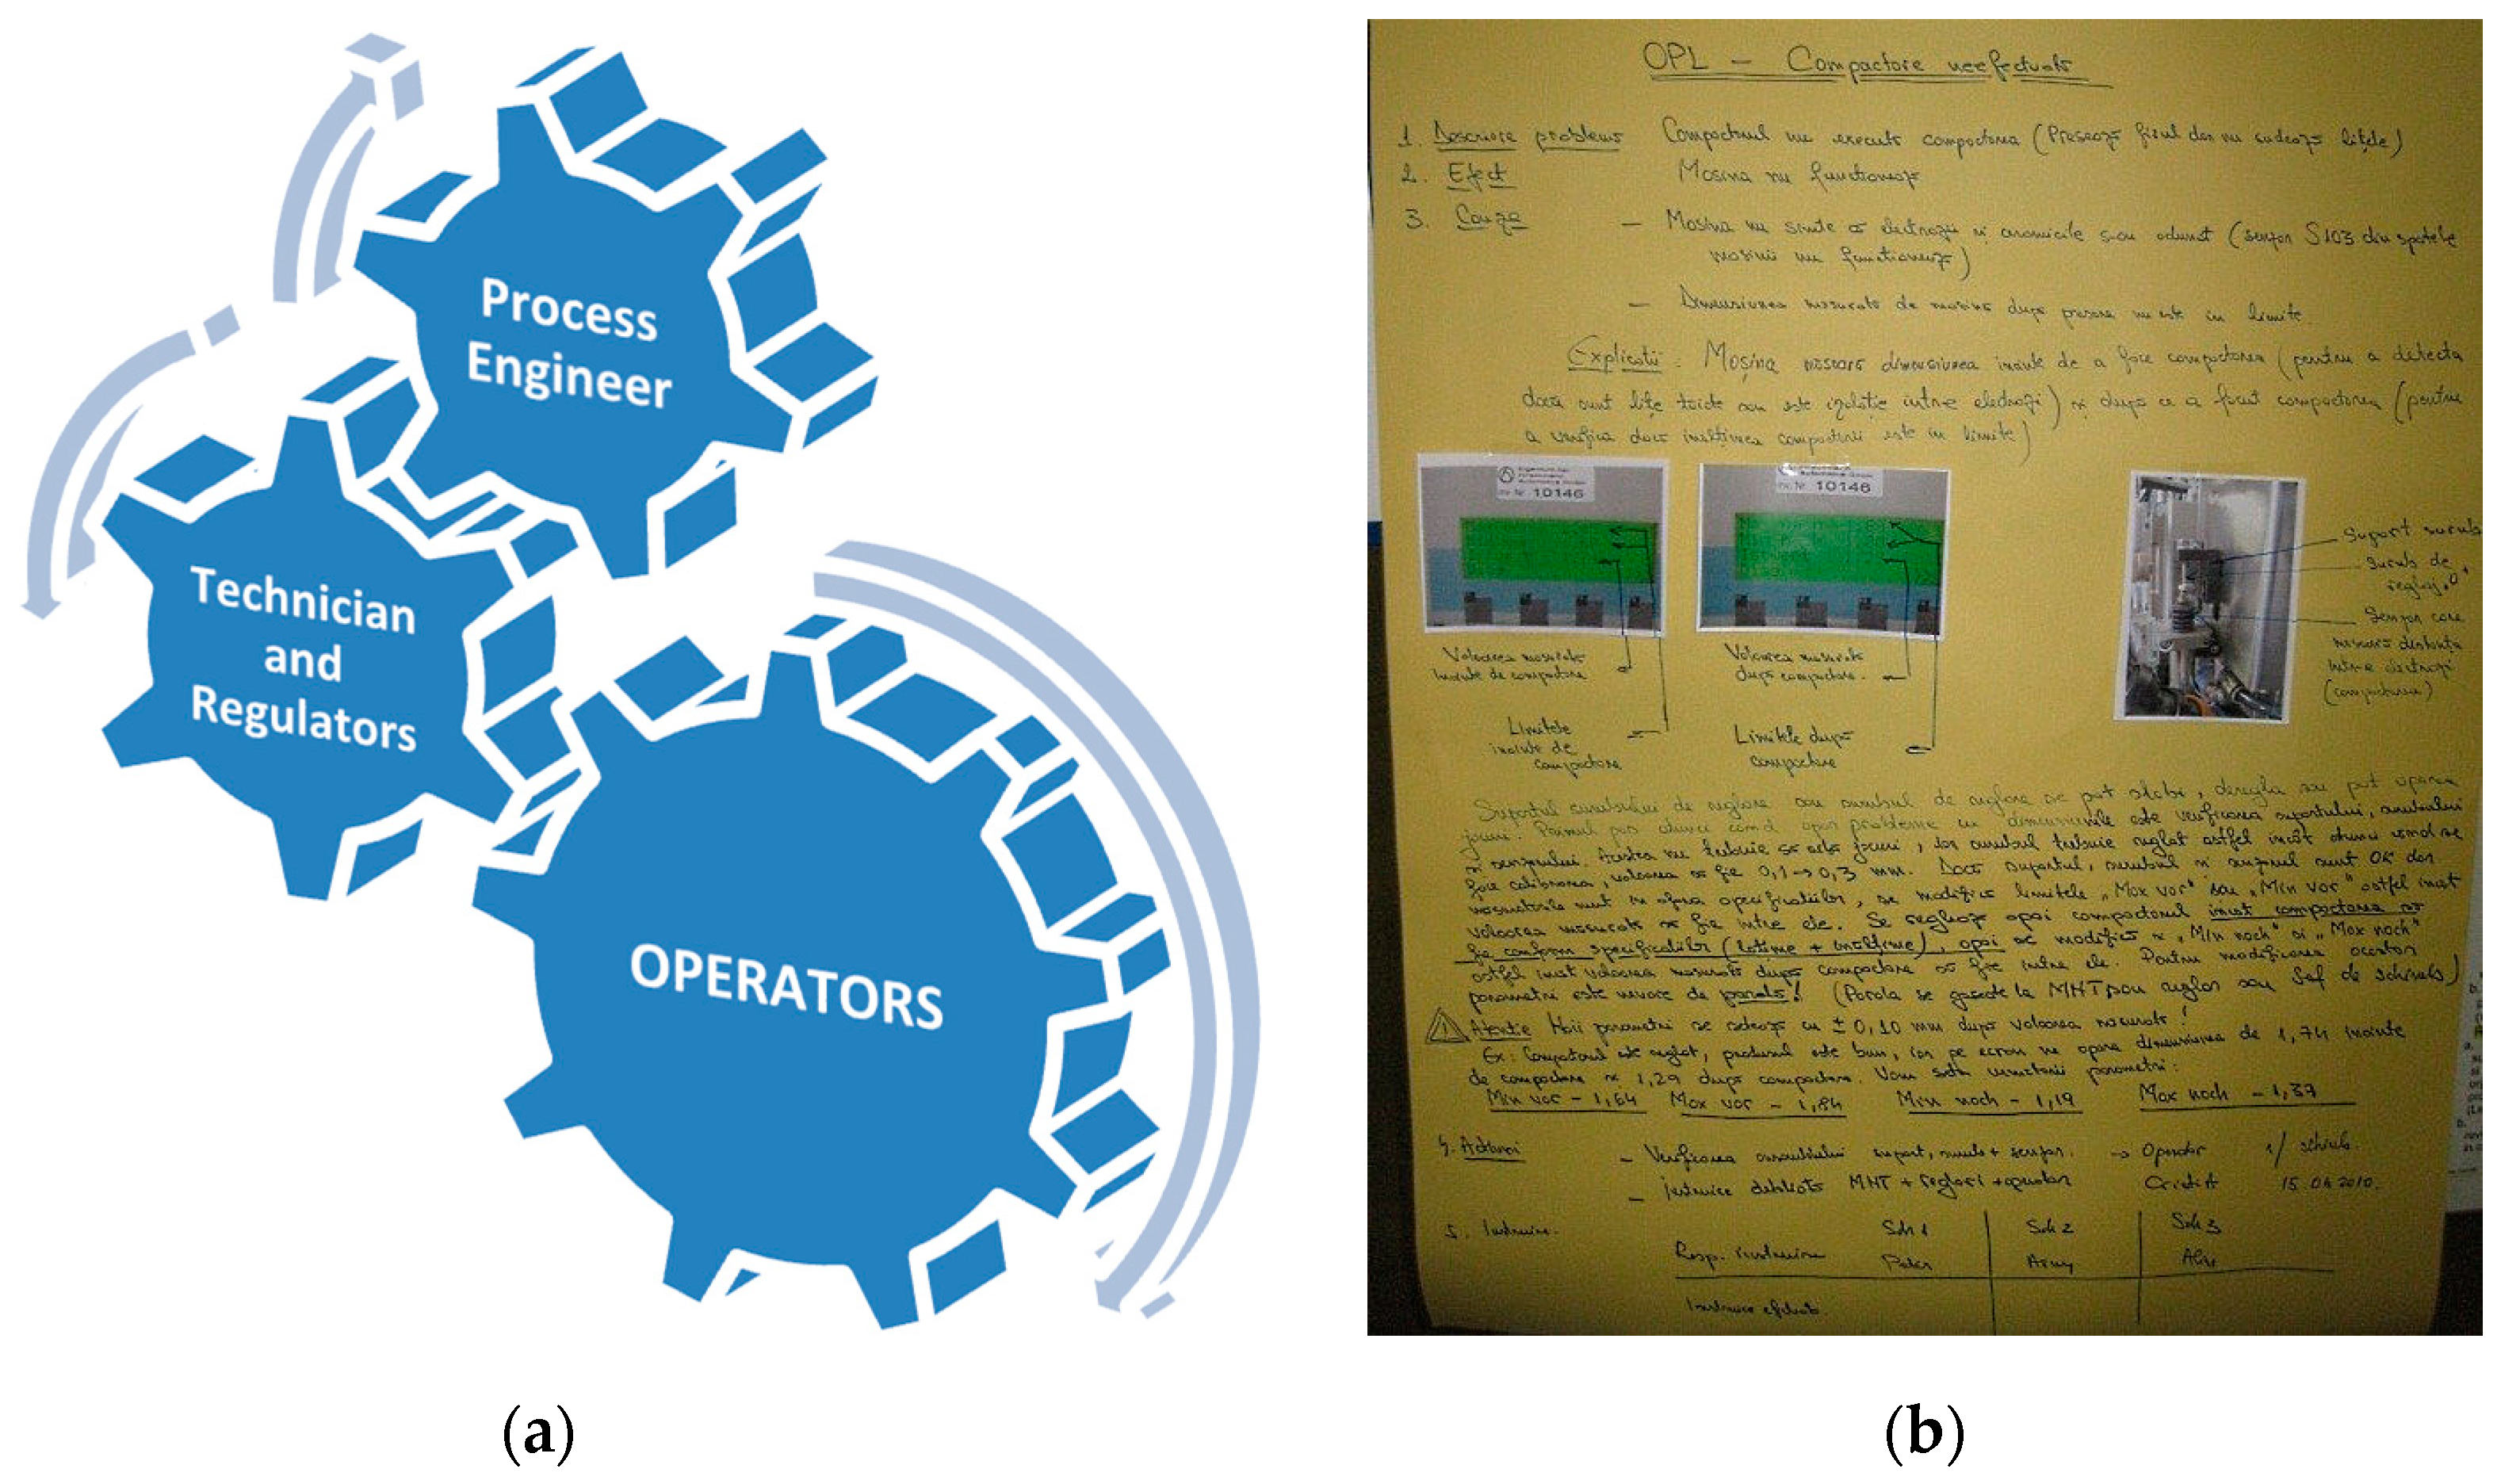
An intensive training program was started within the department [10], the transfer of knowledge being done hierarchically, according to a weekly schedule in which the Process Engineer trains the Technician and the Regulators, and they in turn train the operators (Figure 6a).
The information was grouped into thematic modules and presented in Power Point and on flipcharts. Where necessary, they were presented practically, on machines in production. Topics included both general concepts (5 Senses, Mechanical Assemblies, Lubrication, Pneumatics) and specific concepts of the machines on which the operators were working (Principles of operation, Cutting process, Crimping process, Tinning process, Critical parameters and their influence, etc.).
Following the remediation of some problems with machines, a One-Point Lesson (OPL) was created to standardize knowledge. It was originally made on the flipchart and contained the following required fields: Problem Description, Effect, Causes, Corrective/Preventive Actions, Trained People, Suggestive Photos. This OPL was presented to all those involved, explaining what the initial problem was, what effects it had on the machine, process or product, why this problem occurred and what actions to correct and prevent the recurrence of the problem were taken. An example of OPL made on paper is shown in Figure 6b. Subsequently, an Access database was created that allows the creation, distribution, storage and electronic management of these OPLs.
4.4. Reducing Quality Losses Due to Human Error
The waste rate is composed of technological waste and non-compliant products. The main cause of the appearance of products made incorrectly is human error (wrongly set dimensions, mixed material, etc.).
Non-compliant products, expressed in pieces of non-compliant products per million products, were monitored. The results were reported monthly, and for deviations from the limit or unfavorable evolution analyses were performed and actions taken (Figure 7).
The actions applied after these analyses required both managerial and leadership skills, because they were focused not on the application of measures to sanction mistakes, but on the involvement of operators in the strategy “0 Defects” and their motivation in the desire to achieve product quality.
Some of the actions proposed and aimed at motivating operators to implement compliant products were:
- awarding the operator with the best quality performances;
- monthly ranking with the evolution of mistakes on work shifts;
- introduction for two days in the retraining activity of operators with repeated mistakes;
- entrusting the operator with the reprocessing of the non-compliant product.
5. Discussion
Following the actions taken to improve the three parameters of the OEE (Availability, Performance and Quality), the company managed to maintain a growing evolution of the OEE throughout 2017, repeatedly exceeding the proposed target of 87% by the end of the year (Figure 8).
The OEE not only provides a number, but also an overview of the situation, through its parameters. From the representation of the averages of the indicators for 2017 (Figure 9) it is possible to determine if the situation is the ideal one or if it deserves to be improved.
The OEE not only reached the set target, but significantly exceeded it, with an average of 87, 74% in 2018 and 94.36% in the first four months of 2019. Consequently, the effects of the continuous improvement actions carried out were visible in the evolution indicators at the level of the first semester of 2019.
6. Conclusions
Today, important technologies are on the verge of making a major impact in production processes and the work environment. Thus, a company will need its own high innovation capacity, because without this element, even if it makes great efforts to capitalize on the material and human resources at its disposal, it will lag behind in terms of quality.
The profound changes in the composition of modern production systems will affect both the technical basis and the methods and techniques of management, organization and quality assurance. The performance of a production company, its ability to adapt to the rigors of the competitive market, to fully meet its requirements and at the same time to maximize its profit are dependent on investments in new technologies and in retraining people, as well as the effectiveness of their use.
This will considerably increase the role of human resources, which, at all levels, will have to face completely new problems regarding the continuous improvement of the production process and manufactured products.
Funding
This research received no external funding.
References
- Wang, L.; Liu, P.; Jiang, S.Q.; Xue, Y.M.; Wang, K.; Li, X.N. Production Management System for Small and Medium Sized Manufacturing Enterprises. In Proceedings of the 2018 IEEE International Conference on Industrial Engineering and Engineering Management (IEEM), Bangkok, Thailand, 16–18 December 2018; pp. 685–689. [Google Scholar]
- Ameziane, F. An information system for building production management. Int. J. Prod. Econ. 2000, 64, 345–358. [Google Scholar] [CrossRef]
- Phogat, S.; Gupta, A.K. Identification of problems in maintenance operations and comparison with manufacturing operations. A review. J. Qual. Maint. Eng. 2017, 23, 226–238. [Google Scholar] [CrossRef]
- OEE.com. OEE Made Easy by Vorne. Free Resources and Fresh Perspectives on OEE. Master the Art and Science of OEE. Available online: https://www.oee.com/#; https://www.oee.com/world-class-oee.html (accessed on 17 July 2020).
- Calabria, F.A.; de Melo, F.J.C.; de Albuquerque, A.P.G.; Jeronimo, T.D.; de Medeiros, D.D. Changing the training paradigm for learning: A model of human capital development. Energy Environ. 2018, 29, 1455–1481. [Google Scholar] [CrossRef]
- Pop, L.D. Study on Creating a Simplified Model of Quality Management System in a SME from the Central Region of Romania. Procedia Technol. 2016, 22, 1084–1091. [Google Scholar] [CrossRef] [Green Version]
- Pop, L.D.; Nagy, E. Measuring System Optimization to Increase Productivity. Procedia Eng. 2017, 181, 1036–1042. [Google Scholar] [CrossRef]
- Blaga, P.; Boer, J. Increasing human resource efficiency in the production process. Procedia Technol. 2014, 12, 469–475. [Google Scholar] [CrossRef] [Green Version]
- Blaga, P.; Boer, J. Human resources, quality circles and innovation. Procedia Econ. Financ. 2014, 15, 1458–1462. [Google Scholar] [CrossRef] [Green Version]
- Blaga, P. Evaluating models of the human resources training programs. Rev. Manag. Econ. Eng. I 2015, 14, 702–711. [Google Scholar]
Figure 1.
Evolution of the overall equipment efficiency (OEE) in the first months of 2016.

Figure 2.
Action Plan.

Figure 3.
Pareto analysis of causes of stopping.

Figure 4.
Spaghetti Diagram: (a) Spaghetti Diagram in the initial stage; (b) Spaghetti Diagram in the final stage.
Figure 4.
Spaghetti Diagram: (a) Spaghetti Diagram in the initial stage; (b) Spaghetti Diagram in the final stage.

Figure 5.
Value Stream Mapping (VSM).

Figure 6.
Autonomous Maintenance: (a) The process of knowledge transfer; (b) One-Point Lesson.

Figure 7.
Analysis of the deviation from the allowed limit.

Figure 8.
The evolution of the OEE in 2017 compared to the proposed objective.

Figure 9.
OEE factors in 2017.


Table 1.
World Class Overall Equipment Efficiency.
| OEE Factors | World Class OEE |
|---|---|
| Availability | 90.0% |
| Performance | 95.0% |
| Quality | 99.0% |
Source: Vorne Industries, 2020 [4].
Table 2.
Results obtained after applying the methods.
| Factor | Before | After | Gain |
|---|---|---|---|
| Distance traveled [m] | 429 | 151 | 284% |
| Total number of operations [pcs] | 59 | 20 | 295% |
| Of which internal operations [pcs] | 33 | 11 | 300% |
| Total time [min] | 49.27 | 17.43 | 283% |
| From which internal time [min] | 39.25 | 11.23 | 350% |
Publisher’s Note: MDPI stays neutral with regard to jurisdictional claims in published maps and institutional affiliations. |
© 2021 by the author. Licensee MDPI, Basel, Switzerland. This article is an open access article distributed under the terms and conditions of the Creative Commons Attribution (CC BY) license (http://creativecommons.org/licenses/by/4.0/).
Share and Cite
MDPI and ACS Style
Blaga, P. Ways to Increase the Efficiency of Production Activity through the Active Involvement of the Human Factor. Proceedings 2020, 63, 74. https://0-doi-org.brum.beds.ac.uk/10.3390/proceedings2020063074
AMA Style
Blaga P. Ways to Increase the Efficiency of Production Activity through the Active Involvement of the Human Factor. Proceedings. 2020; 63(1):74. https://0-doi-org.brum.beds.ac.uk/10.3390/proceedings2020063074
Chicago/Turabian StyleBlaga, Petruta. 2020. "Ways to Increase the Efficiency of Production Activity through the Active Involvement of the Human Factor" Proceedings 63, no. 1: 74. https://0-doi-org.brum.beds.ac.uk/10.3390/proceedings2020063074