Examining Technology Acceptance in Least-Developed Countries: The Case of ZESA †


1
Near East University ,Faculty of Economics and Administrative Sciences, Computer Information Systems Program, TRNC Mersin 10, 99138 Nicosia, Cyprus
2
Baskent University, Faculty of Commercial Science, Department of Management Information Systems, TR 06790 Ankara, Turkey
*
Author to whom correspondence should be addressed.
†
Presented at the 7th International Management Information Systems Conference, Online, 9–11 December 2020
Proceedings 2021, 74(1), 3; https://0-doi-org.brum.beds.ac.uk/10.3390/proceedings2021074003
Published: 3 March 2021
(This article belongs to the Proceedings of The 7th International Management Information Systems Conference)
Abstract
:In this study, Zimbabwe Electricity Supply Authority (ZESA), which is the only electricity producer and supplier of public grid products (prepaid meters, mobile payment) in Zimbabwe, was evaluated according to the Technology Acceptance Model (TAM) for perceived usefulness, perceived ease of use and attitude toward using technology. The objective of the study was to examine consumers’ technology acceptance of ZESA’s new technology-dependent products. In this context, an online survey was conducted with 262 participants. The results obtained in the study were in parallel with the theory. In addition, consumers from different ages and educational backgrounds were able to purchase their electricity tokens without difficulty.
1. Introduction
The electricity sector in Southern Africa has been developing in terms of infrastructure and technology over the past decade. The region has been tackling problems such as load shedding, high operational costs and debts to neighboring countries, to mention a few. The companies have devised ways to alleviate such problems, which include alternate energy sources, partnerships with neighboring countries and product innovations. The fast-changing and developing technological advancement has provided organizations with a base for innovations. Organizations have developed various technologies that are helping consumers to live their lives with more convenience. More so in the service sector, organizations have been working to continuously provide products and innovations that ensure their customers’ satisfaction. Of interest is the rate of response to feedback of organizations and how it influences future product and service innovations [1]. The value of a new product introduced by an organization is determined by the buy-in of the consumer.
Zimbabwe Electricity Supply Authority (ZESA) is a state-owned company whose task is to generate, transmit and distribute electricity in Zimbabwe [2]. ZESA embarked on product innovations that consisted of prepaid meters and mobile-payment options. This study explores the level of technology acceptance or lack thereof, as well as the contributing factors, for these innovations.
It is the purpose of this study to use the tenets of flow theory to examine technology acceptance. The study explores consumer response to innovations that will contribute to both the company, since it formulates new strategies, as well as to research, since it introduces a new view of the strategy.
1.1. ZESA Products
Product innovation can be defined as the introduction or improvement of goods and services by an organization for the benefit of consumers. Electricity companies in Southern Africa have, in recent years, introduced new goods and services that include prepaid meters and automatic meter reading. Due to the high cost of remuneration for the meter-reading staff, the Northern Namibia Regional Electricity Distributor (NORED) [3] implemented an automatic meter-reading system for its postpaid customers.
Owing to the same high remuneration cost for the meter readers, ZESA adopted a system of estimated billing. Meter readers were deployed to certain areas on a monthly rotation, and the places that they could not visit were billed as estimates based on previous bills and usage in the area. However, more often than not, the estimated bills were very high in comparison with the actual bills, and ZESA received constant numerous complaints about this type of billing. As a response to this customer feedback, ZESA introduced a new product in August 2012 in the way of prepaid meters. There was a good customer buy-in because customers were then able to manage their consumption, and consequently their electric bills. The product innovation was also very beneficial to ZESA because it forced defaulters to pay their bills, as a certain percentage of their former unpaid bills were deducted from their token every time they purchased one. Although the customers were for the most part happy about the new prepaid meters, a problem arose from the constant purchasing of tokens; namely, long queues at banking halls. ZESA partnered with a number of service providers to increase the convenience of purchasing tokens and reduce the frequency of queuing. In October 2016, in partnership with Afrosoft [4], a technology company, ZESA offered its customers a mobile application that allowed them to purchase their tokens on their phones at their own convenience.
In the early 2000s, research focused more on online banking and online-transaction acceptance. Researchers including [5,6,7,8,9,10] found corresponding results that attributed online-transaction choices by organizations to two main reasons. First, there was a large cost reduction due to the reduced number of service staff needed to render services to consumers. Second, efficiency and convenience was increased for both the organizations and consumers, as there was a reduced occurrence of human error. For these reasons, most organizations have supported the development of online or mobile methods for their products, including ZESA.
1.2. Technology Acceptance
Technology acceptance refers to the extent to which individuals adopt and incorporate a new technology into their daily practice [9]. If a new technology can manage to tackle consumer complaints and needs, therefore creating customer satisfaction, then the technology is considered to be successful. The technology acceptance model attributes the behavioral intention of adopting a new technology to variables such as perceived usefulness, perceived ease of use, and perceived enjoyment [11,12]. According to TAM, perceived usefulness (U) has a substantial influence on the acceptance of the technology. Davis et al. pointed out that, “The perceive usefulness of a technology is the extent to which an individual perceives that employing this technology assists them or enhances their performance on a given task” [13]. Thus, our first hypothesis is as follows:
Hypothesis 1 (H1).
There is a positive correlation between U and attitude toward using technology.
Flow theory is a cognitive activity process whereby an individual carrying out an activity is completely engrossed in a sensation of invigorated concentration, complete participation and gratification in the process of the activity. Csikszentmihalyi described flow as a state in which the individual is engrossed in an activity so much so that everything else seems to not to matter, and the activity becomes so enjoyable that the individual will carry on engaging in it even if it costs then immensely, for the pure sake of engaging in it [14].
Perceived ease of use (E) has the lowest level of difficulty in the learning and continued use of a new technology [11]. According to flow theory, the constant usage of the Internet and information systems may produce more creativity, and in turn, technology acceptance. Thus the second hypothesis is as follows;
Hypothesis 2 (H2).
There is a positive correlation between E and attitude toward using technology.
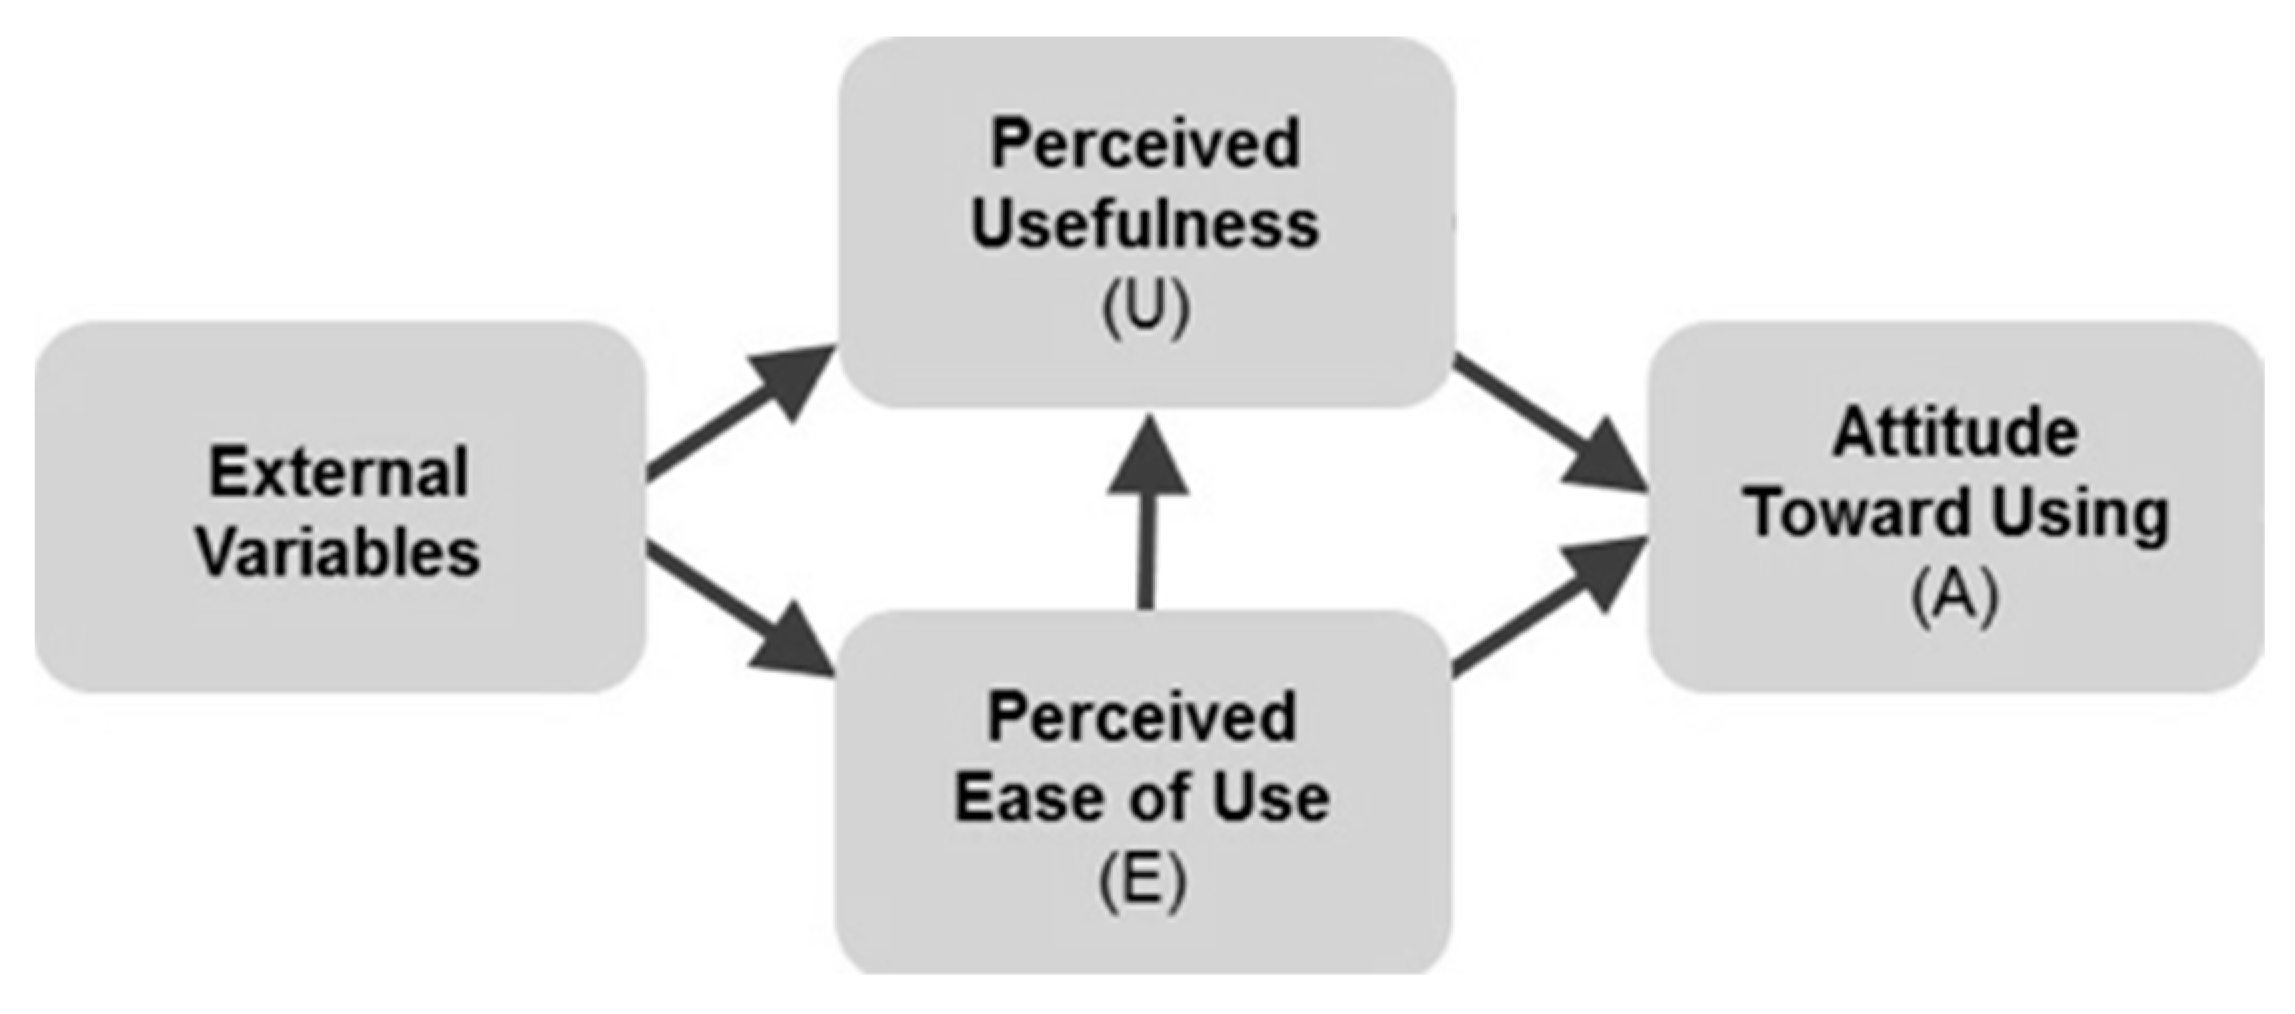
The research model created within the framework of the above hypotheses is as follows (Figure 1):
2. Materials and Methods
The data that were intended to be obtained from this research were numerical. The research therefore made use of quantitative research design because of the nature of the data that the study aimed to attain and analyze. The study was cross-sectional because the research examined correlational data and not causal data [15].
The sample consisted of 262 participants. Owing to the fact that ZESA is the only electricity provider, the whole population of Zimbabwe was the population, therefore random sampling was plausible.
Employing the use of SurveyMonkey [16], we created a questionnaire adopted from the TAM questionnaire [17]. The questionnaire was then distributed through email, Facebook, Instagram and Snapchat to acquire as many random participants as possible. The link to the questionnaire included a brief description of the study in order to acquire informed consent. The cover page also informed the participants that their participation was both voluntary and anonymous. The participants were not rushed into answering the questionnaire so as to remove any biases; however, this contributed to the low sample size: 173 participants were acquired through SurveyMonkey, and 89 participants were acquired through physical questionnaires. We took into consideration the participants that were not frequent Internet users.
The technology acceptance model questionnaire was adapted from [17] and comprised four sections; namely, demographics, perceived usefulness, perceived ease of use and attitude toward using technology. All the questions except for demographics were measured on a 7-point Likert scale.
3. Analysis and Results
The data were analyzed using the Statistical Package for the Social Sciences software, version 22.0 (SPSS). In the data-analysis section of the study, first a reliability analysis was performed in order to understand the internal consistency of scales. According to the results of the reliability analysis, it was concluded that the scales were reliable when the value of α > 0.70 was taken as basis (Table 1).
Table 2 shows the demographic information for the dataset. The largest number of participants were between the ages of 35 and 44 (31.3%), followed by the 25–34 age group (30.5%), then the participants who were 45–54 (13.4%), then the participants who were 55–64 years (12.2%), then participants who were the age of 18–24 (10.3%), and finally 4 individuals who were 65 years and over (1.55%). These results suggest that in Zimbabwe, the most frequent Internet users are between the ages of 25 and 44. This age group includes the better part of the Zimbabwean workforce, and therefore further suggests that having Internet access at work increases the frequency of Internet usage.
More than half of the participants were female (64.9%), while 35.1% of the sample were male (Table 3). These findings suggest that females are more frequent users of the Internet than males.
The levels of education of the participants are given in Table 4, and they demonstrates that more than half of the sample had graduated from university (58.4%).
In the next step, a correlation analysis was carried out to test the statistical significance of the interaction between variables (Table 5). As a result of the correlation analysis performed, it was determined that there were statistically mutual correlations between all variables. It was determined that there was no statistically significant relationship between only the education variable and the perceived usefulness and perceived ease of use variables.
In the last stage of our study, a regression analysis was carried out to test the hypotheses. As mentioned regarding the research model, the effects of perceived usefulness and perceived ease of use on the variable of attitude toward using technology was tested. In this context, the regression analysis would produce results whether our hypotheses were verified or not. As a result of the regression analysis, it was determined that both variables had a significant effect on the variable of attitude toward using technology. At the same time, demographic variables were used as control variables in our study, and a second regression was performed (see Model 2 in Table 6). According to the results of the regression analysis, both models were significant. In addition, when the R-squared values were examined, it was seen that the dependent variable explained the variance at a high level (76.2% and 77.6%). The results obtained were in parallel with the theory.
4. Discussion and Conclusions
Although ZESA has no competitors in Zimbabwe, it has introduced new products with its investment in digitalization required by the current age. Thus, it not only increased the satisfaction of the consumers, but also reduced the workload of the employees due to the investment in the information system. In this context, the acceptance by consumers of two technology-dependent products launched by ZESA, the mobile application offering mobile-payment facility and prepaid meters, is explained by TAM. The two hypotheses we included in the study were accepted:
H1: There was a positive correlation between U and attitude toward using technology. The results suggested that consumers were more inclined to accept a new technology if the product increased convenience for them. The new products were more convenient in terms of monitoring electricity usage and avoiding estimated bills, which might be more than actual bills. Second, due to the cash crisis as well as long queues at banking halls, mobile transactions increased convenience for the consumers.
H2: There was a positive correlation between E and attitude toward using technology. The results also demonstrated a significant relationship between perceived ease of use and attitude toward using technology. Consumers from different ages and educational backgrounds were able to purchase their electricity tokens without difficulty, and this led to technology acceptance.
Our study has contributed to flow theory by cumulatively adding elements of marketing and consumer behavior; namely, technology acceptance, to the theory’s initial cognitive-psychology perspective.
Author Contributions
Conceptualization, the study examines consumers’ technology acceptance of ZESA’s new technology-dependent products; methodology, an online survey was conducted with 262 participants to test TAM model; software, SPSS. All authors have read and agreed to the published version of the manuscript.
Funding
This research received no external funding.
Informed Consent Statement
Informed consent was obtained from all subjects involved in the study.
Conflicts of Interest
The authors declare no conflict of interest.
References
- Ryals, L.; Knox, S. Cross-functional issues in the implementation of relationship marketing through customer relationship management. Eur. Manag. J. 2001, 19, 534–542. [Google Scholar] [CrossRef]
- Zimbabwe Electricity Supply Authority. Available online: https://en.wikipedia.org/wiki/Zimbabwe_Electricity_Supply_Authority (accessed on 10 August 2020).
- Northern Namibia Regional Electricity Distributor. Available online: http://www.nored.com.na/ (accessed on 10 August 2020).
- Afrosoft. Available online: https://afrosoft.co.zw/ (accessed on 10 August 2020).
- Karjaluoto, H.; Mattila, M.; Pento, P. Factors underlying attitude formation towards online banking in Finland. Int. J. Bank Mark. 2002, 20, 261–272. [Google Scholar] [CrossRef]
- Waite, K.; Harrison, T.J. Consumer expectations of online information provided by bank websites. J. Financ. Serv. Mark. 2002, 6, 309–322. [Google Scholar]
- Bradley, L.; Stewart, K. The diffusion of online banking. J. Mark. Manag. 2003, 19, 1087–1109. [Google Scholar]
- Gerrard, P.; Cunningham, J.B. The diffusion of Internet banking among Singapore consumers. Int. J. Bank Mark. 2003, 21, 16–28. [Google Scholar] [CrossRef]
- Karjaluoto, H.; Pikkarainen, K.; Pikkarainen, T.; Pahnila, S. Consumer acceptance of online banking. Internet Res. 2003, 14, 224–235. [Google Scholar]
- Mukherjee, A.; Nath, P. A Model of Trust in Online Relationship Banking. Int. J. Bank Mark. 2003, 21, 5–15. [Google Scholar] [CrossRef]
- Succi, M.J.; Walter, Z.D. Theory of user acceptance of information technologies: An examination of health care professionals. In Proceedings of the 32nd Annual Hawaii International Conference on Systems Sciences, 1999, HICSS-32, Abstracts and CD-ROM of Full Papers, Maui, HI, USA, 5–8 January 1999; IEEE: Piscataway, NJ, USA, 1999; p. 7. [Google Scholar]
- Scherer, R.; Siddiq, F.; Tondeur, F. The technology acceptance model (TAM): A meta-analytic structural equation modeling approach to explaining teachers’ adoption of digital technology in education. Comput. Educ. 2019, 128, 13–35. [Google Scholar] [CrossRef]
- Davis, F.D. Perceived usefulness, perceived ease of use and user acceptance of information technology. MIS Q. 1989, 13, 319–340. [Google Scholar] [CrossRef]
- Csikszentmihalyi, M. Flow: The psychology of optimal experience. J. Leis. Res. 1990, 24, 93–94. [Google Scholar]
- Saunders, M.; Lewis, P.; Thornhill, A. Research Methods for Business Students; Pearson Education Limited: Harlow, UK, 2016. [Google Scholar]
- Survey Monkey. Available online: https://www.surveymonkey.com/ (accessed on 1 July 2020).
- Heijden, H. User Acceptance of Hedonic Information Systems. MIS Q. 2004, 28, 695–704. [Google Scholar] [CrossRef]
Figure 1.
Research model.


Table 1.
Reliability analysis and description.
| Scales | Mean | St. Deviation | Cronbach α Scores |
|---|---|---|---|
| Perceived Ease of Use | 1.67 | 0.81 | 0.79 |
| Perceived Usefulness | 2.06 | 1.18 | 0.71 |
| Attitude Toward Using | 2.29 | 1.76 | 0.85 |
Table 2.
Demographic characteristics of participants: age.
| Frequency | Percent | Valid Percent | Cumulative Percent | ||
|---|---|---|---|---|---|
| Valid | 18–24 | 27 | 10.3 | 10.4 | 10.4 |
| 25–34 | 80 | 30.5 | 30.8 | 41.2 | |
| 35–44 | 82 | 31.3 | 31.5 | 72.7 | |
| 45–54 | 35 | 13.4 | 13.5 | 86.2 | |
| 55–64 | 32 | 12.2 | 12.3 | 98.5 | |
| 65+ | 4 | 1.5 | 1.5 | 100.0 | |
| Total | 260 | 99.2 | 100.0 | ||
| Missing | System | 2 | 0.8 | ||
| Total | 262 | 100.0 | |||
Table 3.
Demographic characteristics of participants: gender.
| Frequency | Percent | Valid Percent | Cumulative Percent | ||
|---|---|---|---|---|---|
| Valid | Female | 170 | 64.9 | 64.9 | 64.9 |
| Male | 92 | 35.1 | 35.1 | 100.0 | |
| Total | 262 | 100.0 | 100.0 | ||
Table 4.
Demographic characteristics of participants: education level.
| Frequency | Percent | Valid Percent | Cumulative Percent | ||
|---|---|---|---|---|---|
| Valid | Graduated from primary school | 1 | 0.4 | 0.4 | 0.4 |
| Graduated from high school | 55 | 21.0 | 21.2 | 21.5 | |
| Graduated from university | 153 | 58.4 | 58.8 | 80.4 | |
| Some graduate school | 20 | 7.6 | 7.7 | 88.1 | |
| Completed graduate school | 31 | 11.8 | 11.9 | 100.0 | |
| Total | 260 | 99.2 | 100.0 | ||
| Missing | System | 2 | 0.8 | ||
| Total | 262 | 100.0 | |||
Table 5.
Correlation analysis.
| 1 | 2 | 3 | 4 | 5 | |
|---|---|---|---|---|---|
| 1. Age | 1 | ||||
| 2. Education | 0.261 ** | 1 | |||
| 3. Perceived Usefulness | 0.219 ** | −0.079 | 1 | ||
| 4. Perceived Ease Of Use | 0.282 ** | −0.091 | 0.649 ** | 1 | |
| 5. Attitude Toward Using Technology | 0.198 ** | −0.153 * | 0.569 ** | 0.755 ** | 1 |
* The correlation was significant at the 0.05 level. ** The correlation was significant at the 0.01 level.
Table 6.
Regression analyses.
| Independent and Control Variables | Model 1 | Model 2 |
|---|---|---|
| Standardized Coefficients (Beta) | Standardized Coefficients (Beta) | |
| 1. Age | - | 0.005 ** |
| 2. Education | - | −0.090 |
| 3. Perceived Usefulness | 0.136 ** | 0.130 ** |
| 4. Perceived Ease Of Use | 0.667 ** | 0.0661 ** |
| 5. Attitude Toward Using Technology | ||
| F | 172,672 | 86,286 |
| R2 | 0.762 | 0.776 |
| ΔR2 | 0.581 | 0.587 |
| Model ANOVA (Sig.) | 0.000 | 0.000 |
** The correlation was significant at the 0.01 level.
Publisher’s Note: MDPI stays neutral with regard to jurisdictional claims in published maps and institutional affiliations. |
© 2021 by the authors. Licensee MDPI, Basel, Switzerland. This article is an open access article distributed under the terms and conditions of the Creative Commons Attribution (CC BY) license (https://creativecommons.org/licenses/by/4.0/).
Share and Cite
MDPI and ACS Style
Dumbura, A.; Özkoç, E.E. Examining Technology Acceptance in Least-Developed Countries: The Case of ZESA. Proceedings 2021, 74, 3. https://0-doi-org.brum.beds.ac.uk/10.3390/proceedings2021074003
AMA Style
Dumbura A, Özkoç EE. Examining Technology Acceptance in Least-Developed Countries: The Case of ZESA. Proceedings. 2021; 74(1):3. https://0-doi-org.brum.beds.ac.uk/10.3390/proceedings2021074003
Chicago/Turabian StyleDumbura, Audrey, and Esma Ergüner Özkoç. 2021. "Examining Technology Acceptance in Least-Developed Countries: The Case of ZESA" Proceedings 74, no. 1: 3. https://0-doi-org.brum.beds.ac.uk/10.3390/proceedings2021074003