Article

Thermal and Multispectral Remote Sensing for the Detection and Analysis of Archaeologically Induced Crop Stress at a UK Site

1
School of Geosciences, University of Edinburgh, Alexander Crumb Brown Road, Edinburgh EH9 3FF, UK
2
Historic Environment Scotland, John Sinclair House, 16 Bernard Terrace, Edinburgh EH8 9NX, UK
3
Scotland’s Rural College (SRUC), Rural Economy, Environment and Society, Peter Wilson Building, King’s Buildings, West Mains Road, Edinburgh EH9 3JG, UK
4
NERC Field Spectroscopy Facility, University of Edinburgh, James Hutton Road, Edinburgh EH9 3FE, UK
*
Author to whom correspondence should be addressed.
Submission received: 14 August 2020 / Revised: 21 September 2020 / Accepted: 22 September 2020 / Published: 24 September 2020

Abstract

:
In intensively cultivated landscapes, many archaeological remains are buried under the ploughed soil, and detection depends on crop proxies that express subsurface features. Traditionally these proxies have been documented in visible light as contrasting areas of crop development commonly known as cropmarks. However, it is recognised that reliance on the visible electromagnetic spectrum has inherent limitations on what can be documented, and multispectral and thermal sensors offer the potential to greatly improve our ability to detect buried archaeological features in agricultural fields. The need for this is pressing, as ongoing agricultural practices place many subsurface archaeological features increasingly under threat of destruction. The effective deployment of multispectral and thermal sensors, however, requires a better understanding of when they may be most effective in documenting archaeologically induced responses. This paper presents the first known use of the FLIR Vue Pro-R thermal imager and Red Edge-M for exploring crop response to archaeological features from two UAV surveys flown in May and June 2019 over a known archaeological site. These surveys provided multispectral imagery, which was used to create vegetation index (VI) maps, and thermal maps to assess their effectiveness in detecting crop responses in the temperate Scottish climate. These were visually and statistically analysed using a Mann Whitney test to compare temperature and reflectance values. While the study was compromised by unusually damp conditions which reduced the potential for cropmarking, the VIs (e.g., Normalised Difference Vegetation Index, NDVI) did show potential to detect general crop stress across the study site when they were statistically analysed. This demonstrates the need for further research using multitemporal data collection across case study sites to better understand the interactions of crop responses and sensors, and so define appropriate conditions for large-area data collection. Such a case study-led multitemporal survey approach is an ideal application for UAV-based documentation, especially when “perfect” conditions cannot be guaranteed.

Graphical Abstract

1. Introduction

Remote sensing is a long-established non-intrusive method of archaeological survey and documentation, making significant contributions to site discovery and archaeological understanding [1,2]. In agricultural landscapes, this work relies heavily on observation of variegation and contrast in crops to reveal otherwise buried archaeological sites. The relationship between subsurface archaeological features and overlying vegetation has been recognised for many years and is seen in agricultural fields. Here, differences in soil depth, caused by natural landforms as well as anthropogenic features such as ditches, cause cropmarking, especially in dry conditions where moisture and nutrient supply are reduced [3,4,5,6,7].
While most cropmarks have traditionally been observed in the visible electromagnetic spectrum, there is increasing interest in new technologies that collect information outside the visible range, such as multispectral and thermal imagers [8,9,10]. This is driven both by technological developments and archaeological imperatives. Cheaper, more portable sensors undoubtedly encourage uptake, while the proliferation of relatively affordable UAV platforms to take sensors aloft brings imaging within the reach of more researchers [11]. In some areas, a pattern of diminishing returns has been noted in the outputs from a traditional visible spectrum archaeological survey [12,13] encouraging the exploration of other forms of imaging to extend opportunities for detection. Whilst multispectral and hyperspectral imaging has been shown to have great advantages in crop stress detection [14,15], there are mixed results using thermal imagery as a detection method. This highlights the need for further exploration [10,16,17,18], especially to better understand when large area data collections are most likely to produce good returns. For this type of experimentation, UAV-mounted sensors documenting discrete case study areas are highly cost-effective. The study reported on here is based around an MSc student dissertation that forms part of a research project, between Historic Environment Scotland (HES) and the School of Geosciences, University of Edinburgh, to better understand the conditions under which non-visible imaging can be most effective, and so guide the deployment of large area imaging.
The need for these developments is pressing, as buried archaeological sites in arable landscapes are under active threat from deep ploughing, soil drainage, and subsoiling [16,19,20].

1.1. Detecting Crop Response beyond the Visible Electromagnetic Spectrum

The relationships between variable soil depth, sometimes a product of archaeological features, soil characteristics, nutrient supply, weather conditions, and crop development are complex. However, for archaeological purposes, this can be simplified to the potential for buried features to be expressed through crop proxies in the right conditions, with, for example, luxuriant growth above buried ditches and stunted stressed crops above compacted surfaces such as buried roads and walls. Traditional aerial methods of cropmark detection have relied on an observer to identify the contrast between regions of crops that are and are not affected by archaeology, either from the air during reconnaissance or in optical imagery. Clearly, the direct transfer of this established methodology to the nonvisible, for the purposes of this study multispectral and thermal imaging, requires different approaches.
The use of multispectral imagery for mapping buried archaeological remains is well established [21], exploiting reflected spectral regions such as near-infrared (NIR ~700 to 1100 nm) and red-edge (~700 nm) for detection of features [7,9,22,23,24]. While multispectral imagery can show crop responses as a true colour (TC) image, false colour composites (FCC) and vegetation indices (VIs) are widely used as an effective way of showing contrasts in vegetation health. They are, however, often criticised for being applied without proper consideration of the properties on which they are formulated [6,17].
The success of VIs to visualise crop responses has depended on the climatic conditions at the time surveys were undertaken [17,25,26,27]. Studies have shown that the simple ratio (SR) VI is one of the most effective VIs whereas the normalised difference vegetation index (NDVI) is not particularly effective in visualising crop responses for archaeological purposes [17,25]. Indeed, while VIs have been shown to be effective in specially designed test sites in a study from Cyprus, which has an arid climate [6], it is less clear how applicable they are to real-world arable fields or in other climatic conditions [17]. Therefore, it is important to assess their effectiveness in the temperate and wet climate of Scotland.
The impacts of subsurface archaeological features on soil and crops can also include variation in surface temperature, which can be detected and recorded using thermal imagers [9,10,16,28,29,30] or even visually in differential frost and snowmelt. The recognition that archaeological features can retain and re-emit thermal infrared radiation (TIR) at a different rate to their surroundings under certain conditions has prompted the use of thermal imagers in archaeological prospection since the 1970s, though high-cost and low-resolution has been a problem until relatively recently [10,30,31]. Prior studies have utilised thermal data collected via satellite and aerial platforms with varying degrees of success [16,18,32,33], though most of these studies have been performed over bare ground because vegetation cover masks the effects that underlying archaeological features may have on surface temperature [9]. However, one sign of stress in crops is increased surface temperature, which shows the potential for a temperature-related crop proxy for an underlying feature inducing stress [31].

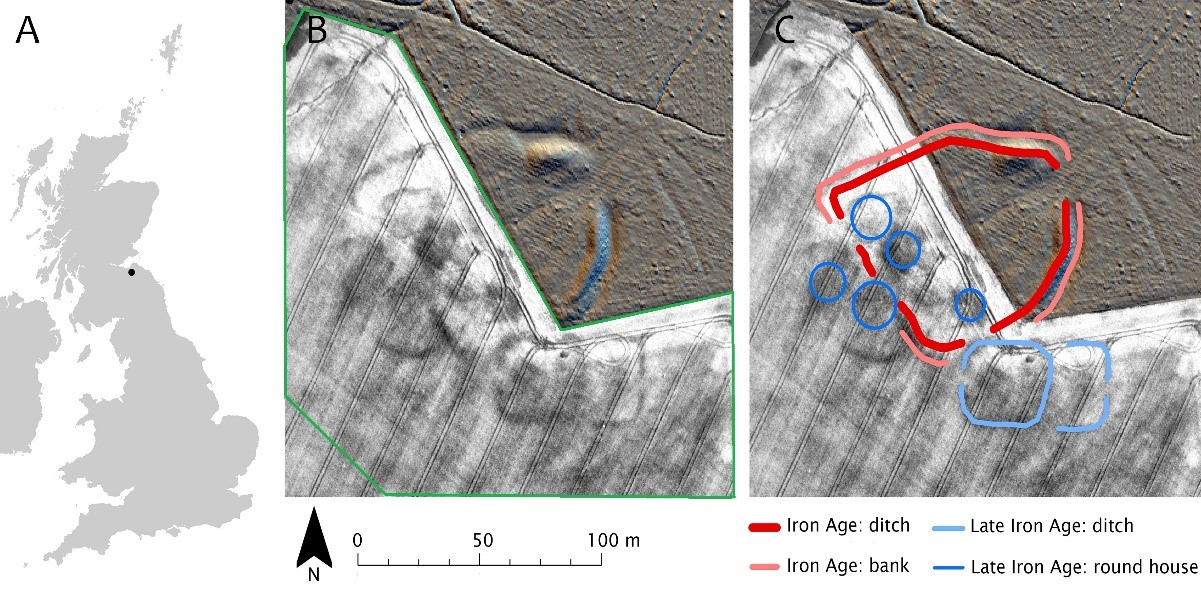
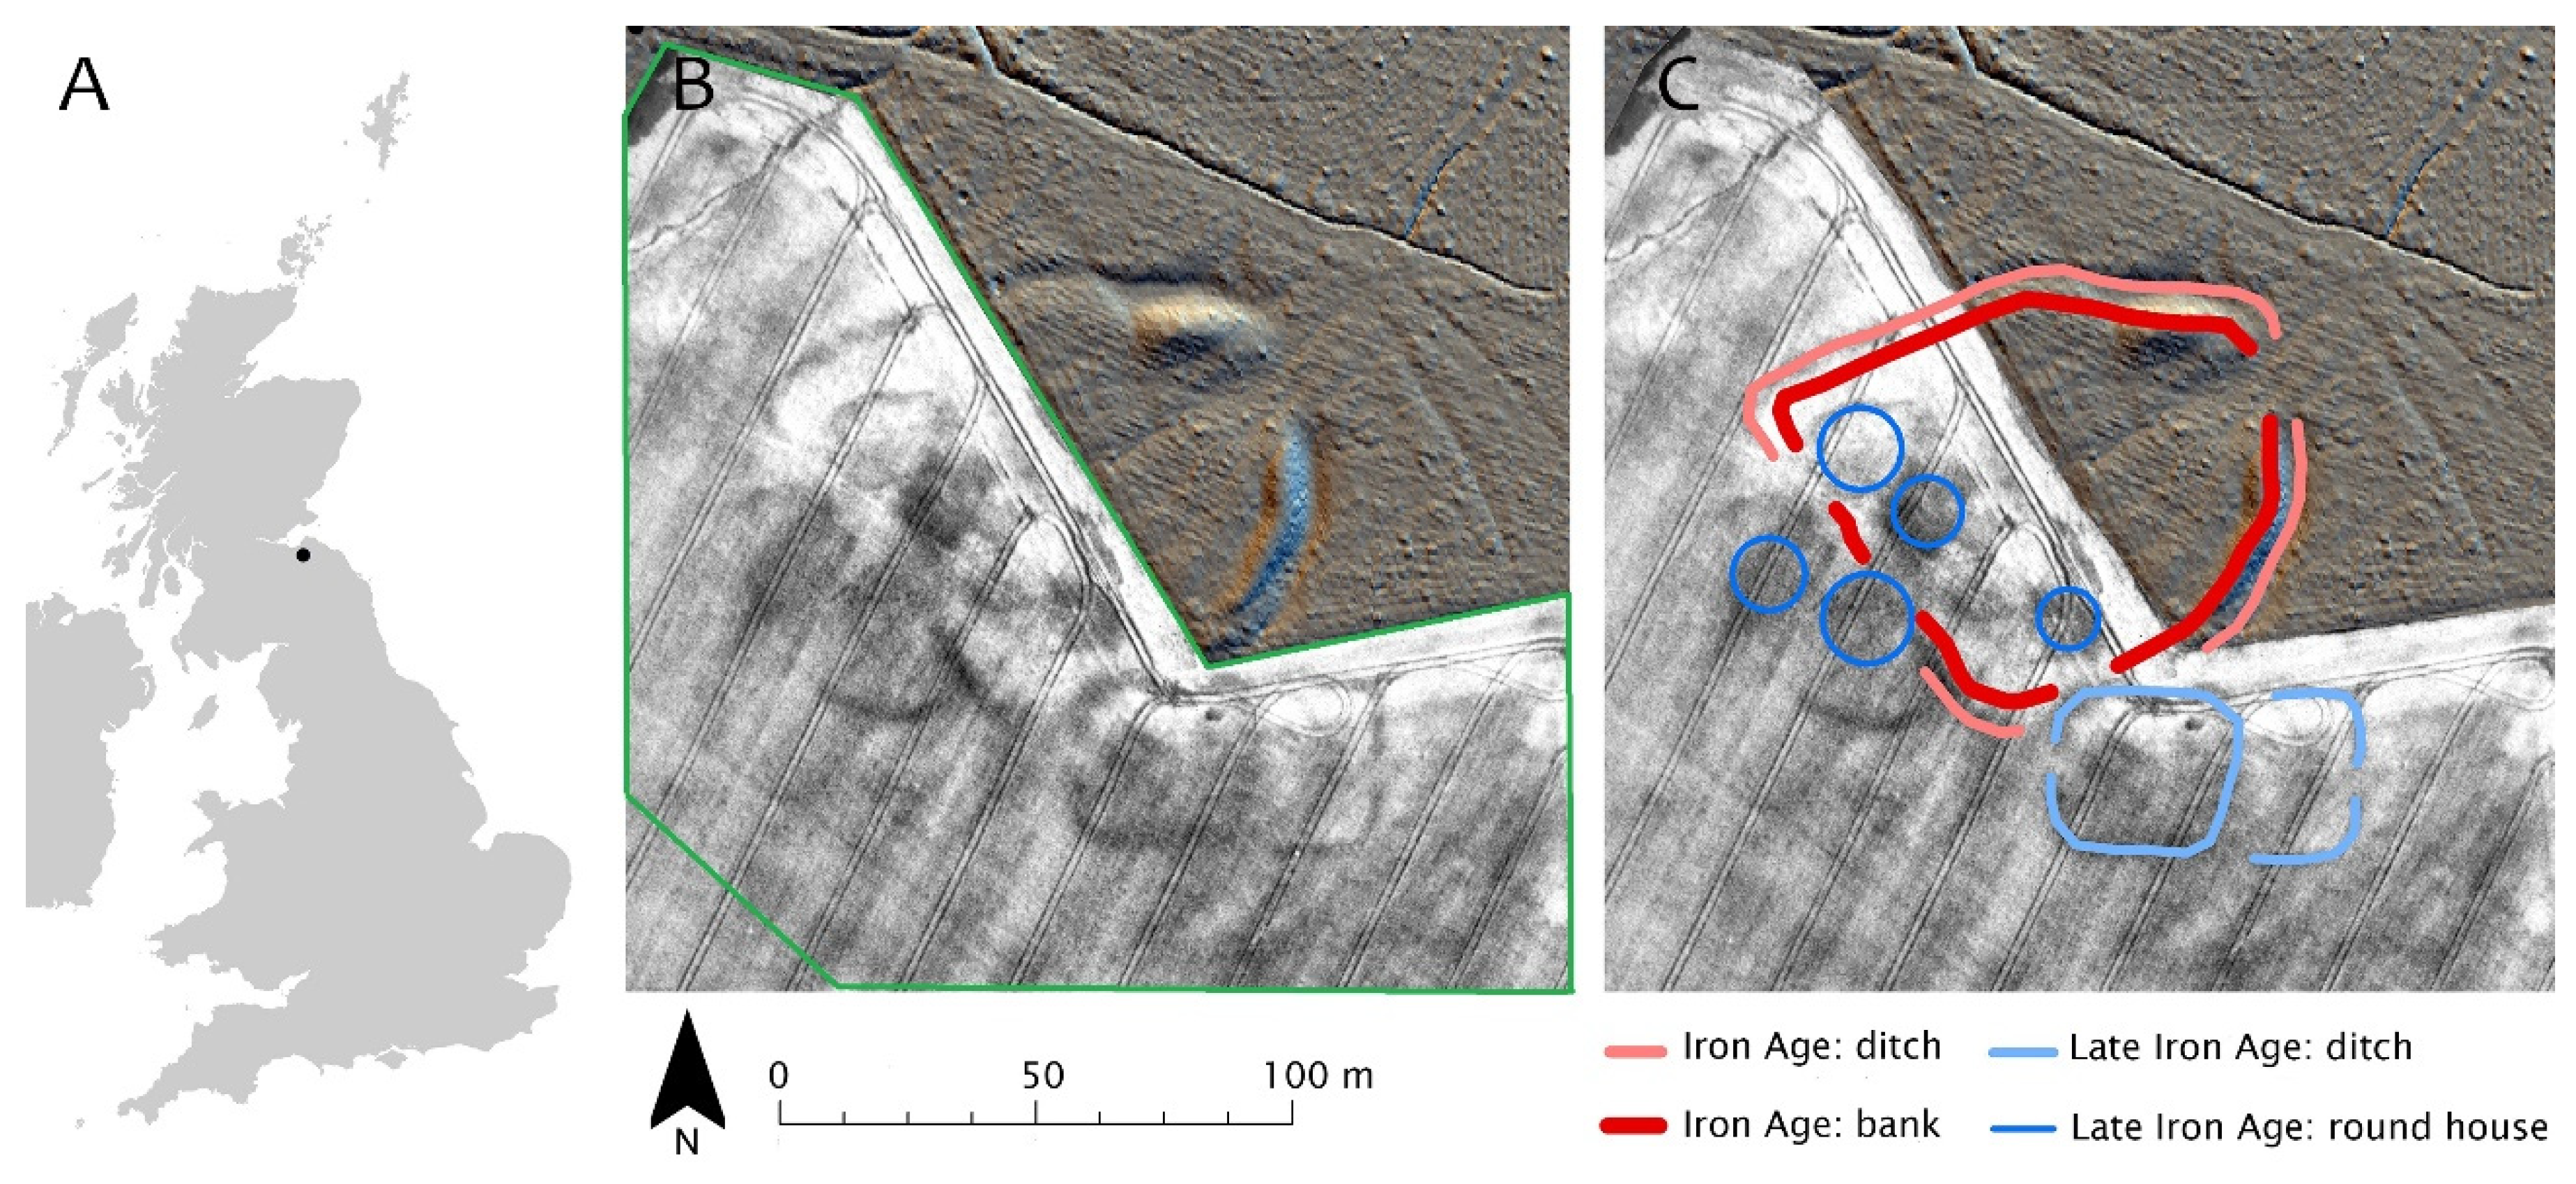
1.2. A Case Study in South-East Scotland

Within the framework of the HES/Geosciences research project to better understand the conditions under which non-visible imaging can be most effective, a case study area was selected to explore the utility of the thermal data from an FLIR Vue Pro-R, set alongside multispectral data from the MicaSense RedEdge-M sensor and a Parrot Sequoia, to detect crop stress due to buried archaeological features over the early growing season.
The study site (HES 2020; latitude: 55°52′58.52″ N, longitude: 2°50′47.52″ W) is an archaeological monument first recorded in the mid-19th century as an earthwork, in a region where most sites are now known as cropmarking discovered during aerial reconnaissance [34,35]. During the 20th century, the northern and eastern part of the site was partially afforested, while the southern and western portions, which form the focus of this study, were largely levelled by ploughing and were under a spring barley (Hordeum vulgare) crop at the time of the investigation. This portion of the site has been recorded as archaeological cropmarking on 18 July 1994 and 22 August 1996, which revealed ditches and other negative features. Combining the evidence indicates that the site comprises a complex of Iron Age settlement, with at least three distinct phases of occupation. A roughly oval settlement bounded by a bank and external ditch is probably of mid-1st millennium BC date (Figure 1A), while a rectilinear enclosure which impinges on part of the earlier enclosure (Figure 1B) most likely dates to later in the 1st millennium BC, with occupation extending to the early centuries AD [12]. The scatter of possible roundhouses (Figure 1C) may date to the early centuries AD and appear to have been built over the earlier enclosure.

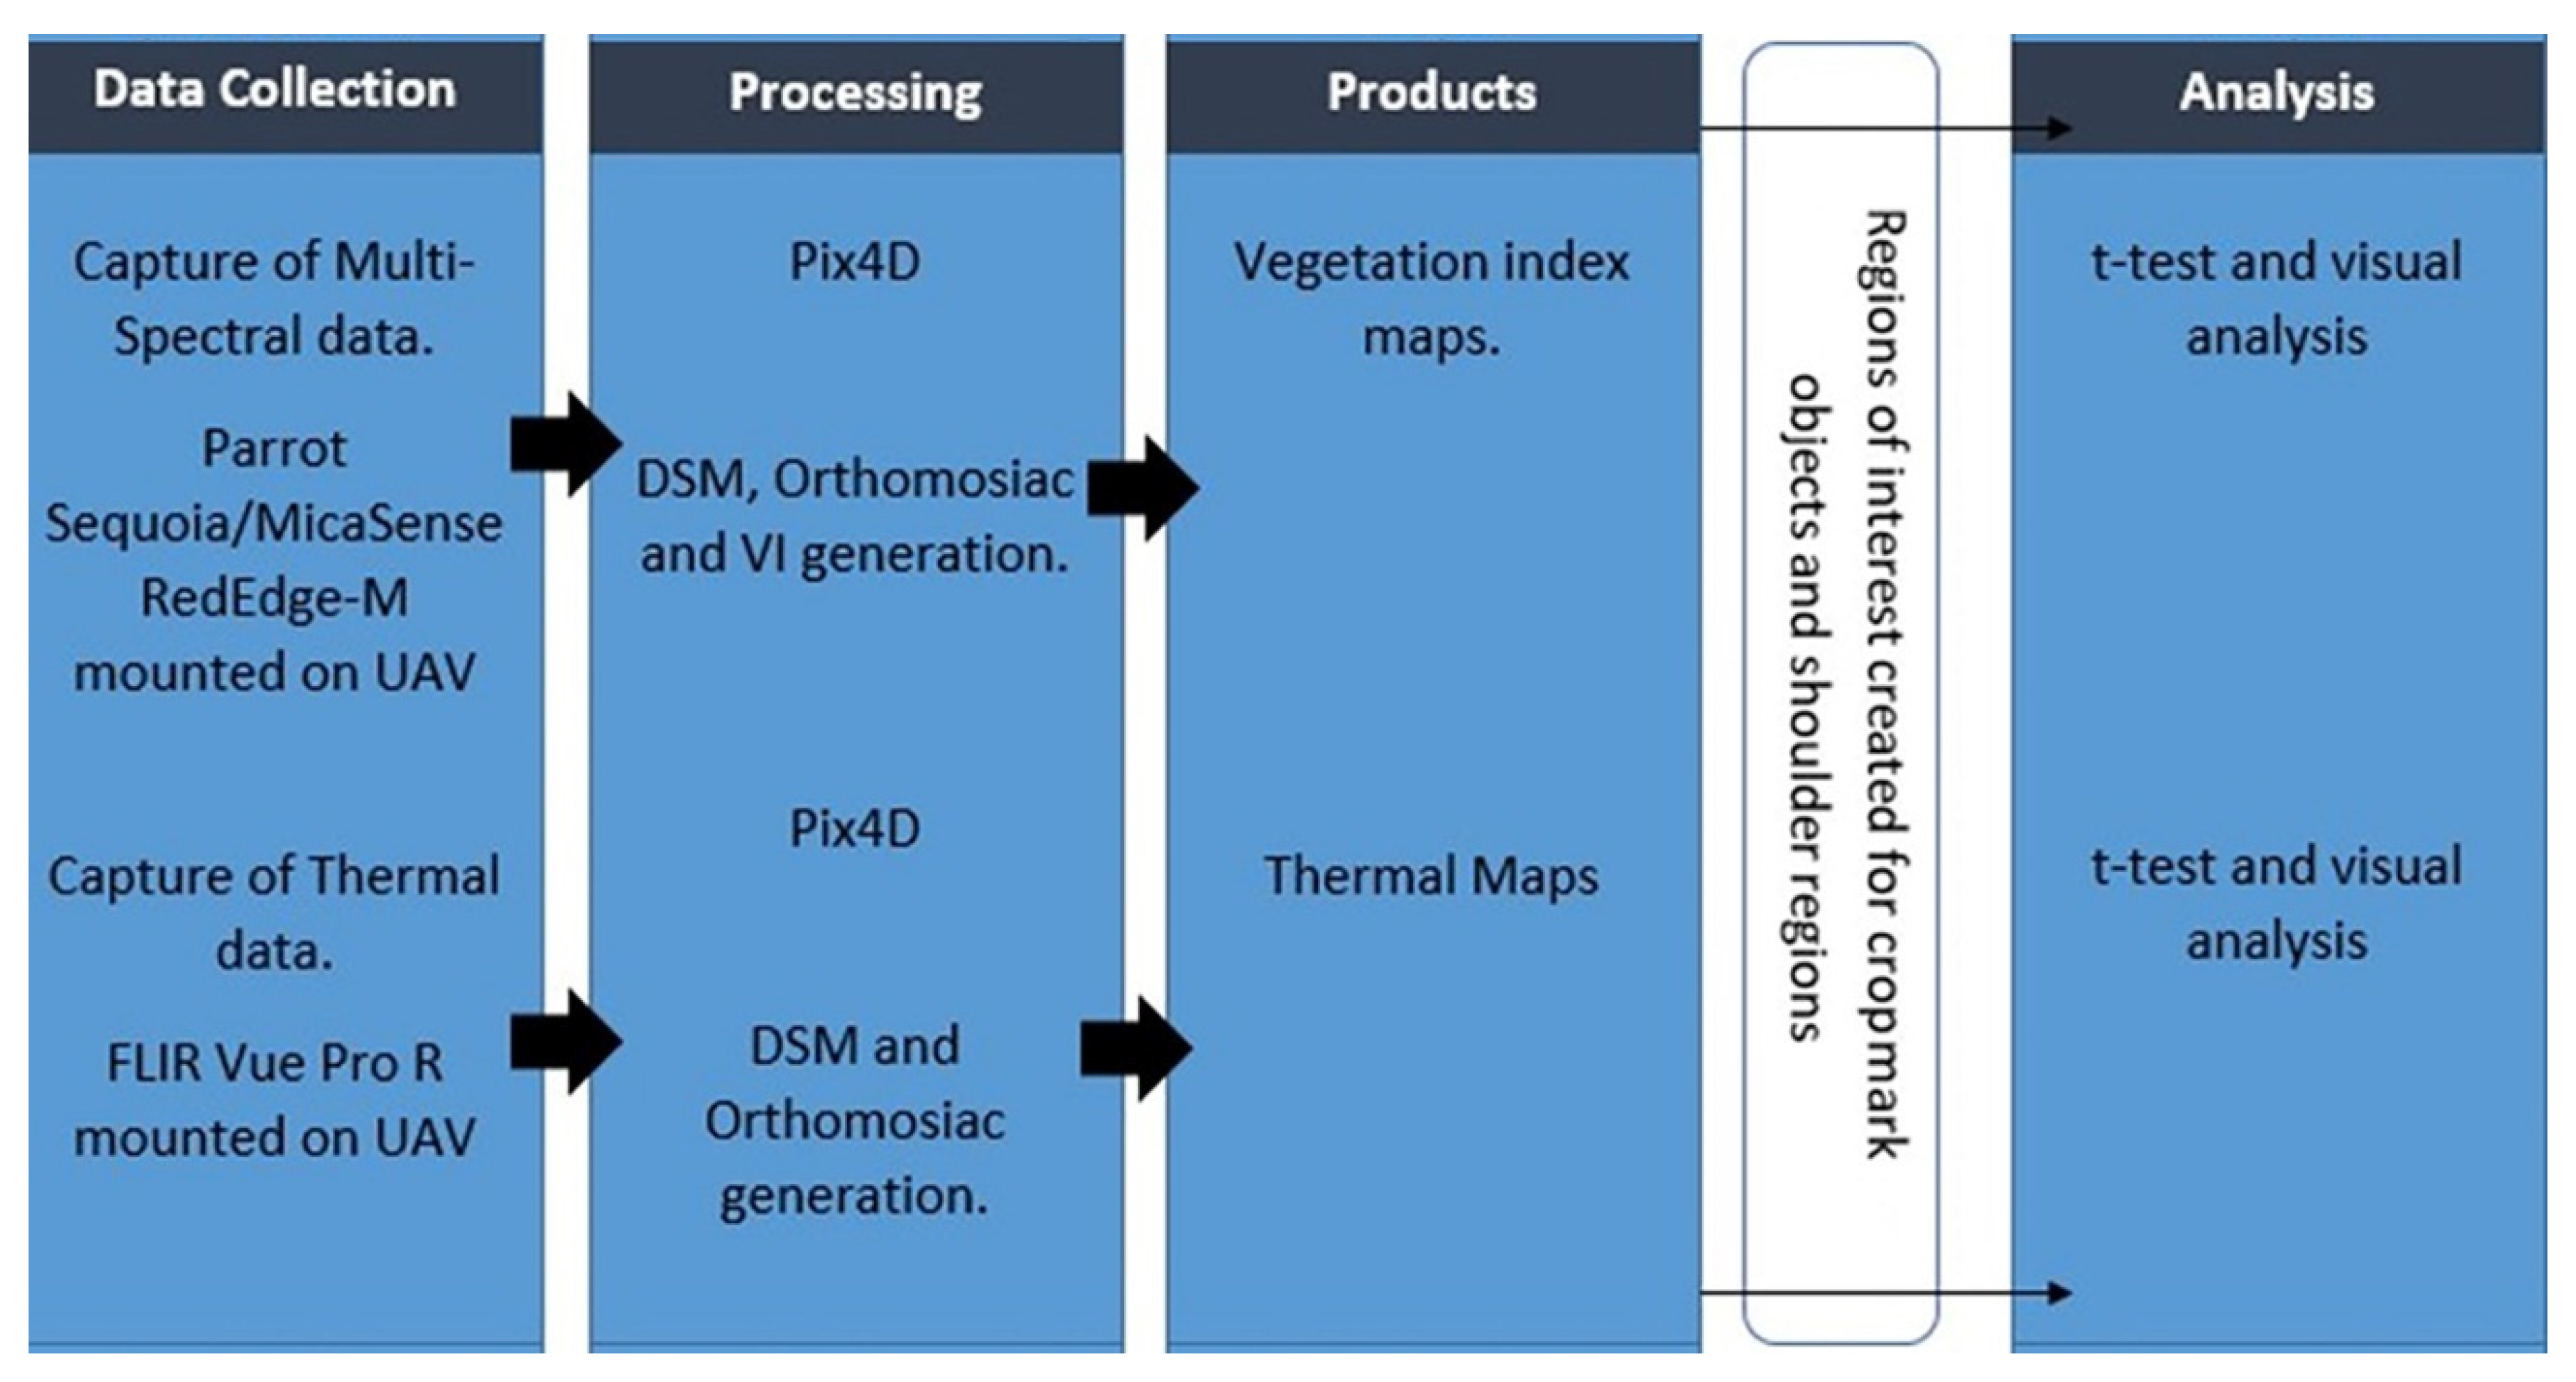
2. Materials and Methods

Within the broad framework outlined above, the detailed objectives of this study are to assess the utility of the FLIR Vue Pro-R for detecting crop responses to underlying features, and how the thermal data compares with VIs generated from multispectral data. The workflow is presented below and depicted in Figure 2.

2.1. Data Collection: Thermal and Multispectral Data

Surveys were conducted on 24 May 2019 and 26 June 2019. On both dates, the FLIR Vue Pro-R was deployed for thermal acquisition, and while a MicaSense RedEdge-M multispectral sensor was used on 24 May. Equipment failure meant that the June survey utilised a Parrot Sequoia multispectral sensor. The Sequoia was selected as it was the most spectrally similar to the RedEdge-M. The platform for the May survey was a custom-built Vulcan Octocopter UAV, whilst the June survey used a DJI Matrice 100.
The Pro-R thermal imager detects the amount of TIR being emitted by objects with images stored as a radiometric JPEG with calibrated temperature data embedded in each pixel [10]. The RedEdge-M is a five-band multispectral sensor [36], while the Sequoia has four multispectral bands and an RGB camera, which was not utilised in this study [37]. A sunlight sensor and downwelling light sensor (DLS) were used in conjunction with the Sequoia and RedEdge-M, respectively to measure ambient light for radiometric calibration.
For the May survey, Mission Planner autopilot software [38] in conjunction with the Pixhawk 2.1 autopilot hardware and Arducopter Firmware was used (version 3.5.5). The June survey, undertaken in two missions, utilised DJI Ground Station Pro mission planning software. Flight altitude and speed for both surveys were designed to provide a good overlap and resolution (Table 1). Multispectral images of calibrated reflectance panels were taken prior to each flight for use in radiometric calibration during processing.

2.2. Image Processing

Images of calibration panels taken at the start and end of each flight were used in conjunction with a downwelling sunshine sensor, providing measured reflectance factors and irradiance. These were used in Pix4D to radiometrically calibrate the multispectral images. Within Pix4D, the calibration panels were manually identified, and the reflectance value was calculated. The radiometrically calibrated images were then used to create an orthomosiac of the study area. The thermal images were processed using the Ag Multispectral standard template. As with the multispectral data the thermal images collected were processed using Pix4D. The Therma Camera advanced processing template was utilised to create thermal orthomosaic temperature maps of the study site for each flight date.

2.3. Vegetation Index Mapping

A suite of vegetation indices was explored, based on previous archaeological work [17,26] and created in Pix4D to assess the presence of crop stress (Table 2). The availability of wavelengths from the RedEdge-M and Sequoia were considered. Due to the relatively narrow bandwidths of both sensors (10 to 40 nm), both narrowband and broadband indices were applicable.
The VIs and thermal maps were clipped in ArcMap (version 10.6.10) to remove areas of woodland and grassland, and imported into ENVI (version 5.5). From an archaeological mapping of cropmarking recorded on aerial photographs taken in 1994 (Figure 1), two classification regions were created. Firstly, “features” for areas interpreted as ditches and roundhouses and, secondly, “shoulder” for adjacent areas (Figure 3), taking a method successfully applied in a similar earlier study [17]. In this case, the definition of feature areas is for ditches or otherwise deeper regions of soil, such as the interiors of possible roundhouses, which are the most frequent types of remains recorded as cropmarking in Scotland. It is worth noting that such cropmarking generally reveals the larger buried features and that excavation of the site would most likely reveal many more buried features. This has a direct bearing on the selection of shoulder regions, which may well lie over buried, but perhaps slight, features that are not visible in the cropmarking. Thus, the shoulder regions include areas that lie within the interiors of roundhouses, along the lines of the likely lines of ploughed down banks (e.g., top left, and within the square enclosure), as well as areas that are unlikely to have any remains (bottom right). Thus, the shoulders are used to characterise those areas that have not formed visible cropmarking, and so represent the most pronounced buried features—this seems unavoidable in the absence of direct knowledge of what other features may be buried under the topsoil but are not visible as a cropmarking. Regions of interest were created and used to export pixel information into Microsoft Excel for each VI and thermal map to perform statistical analysis.

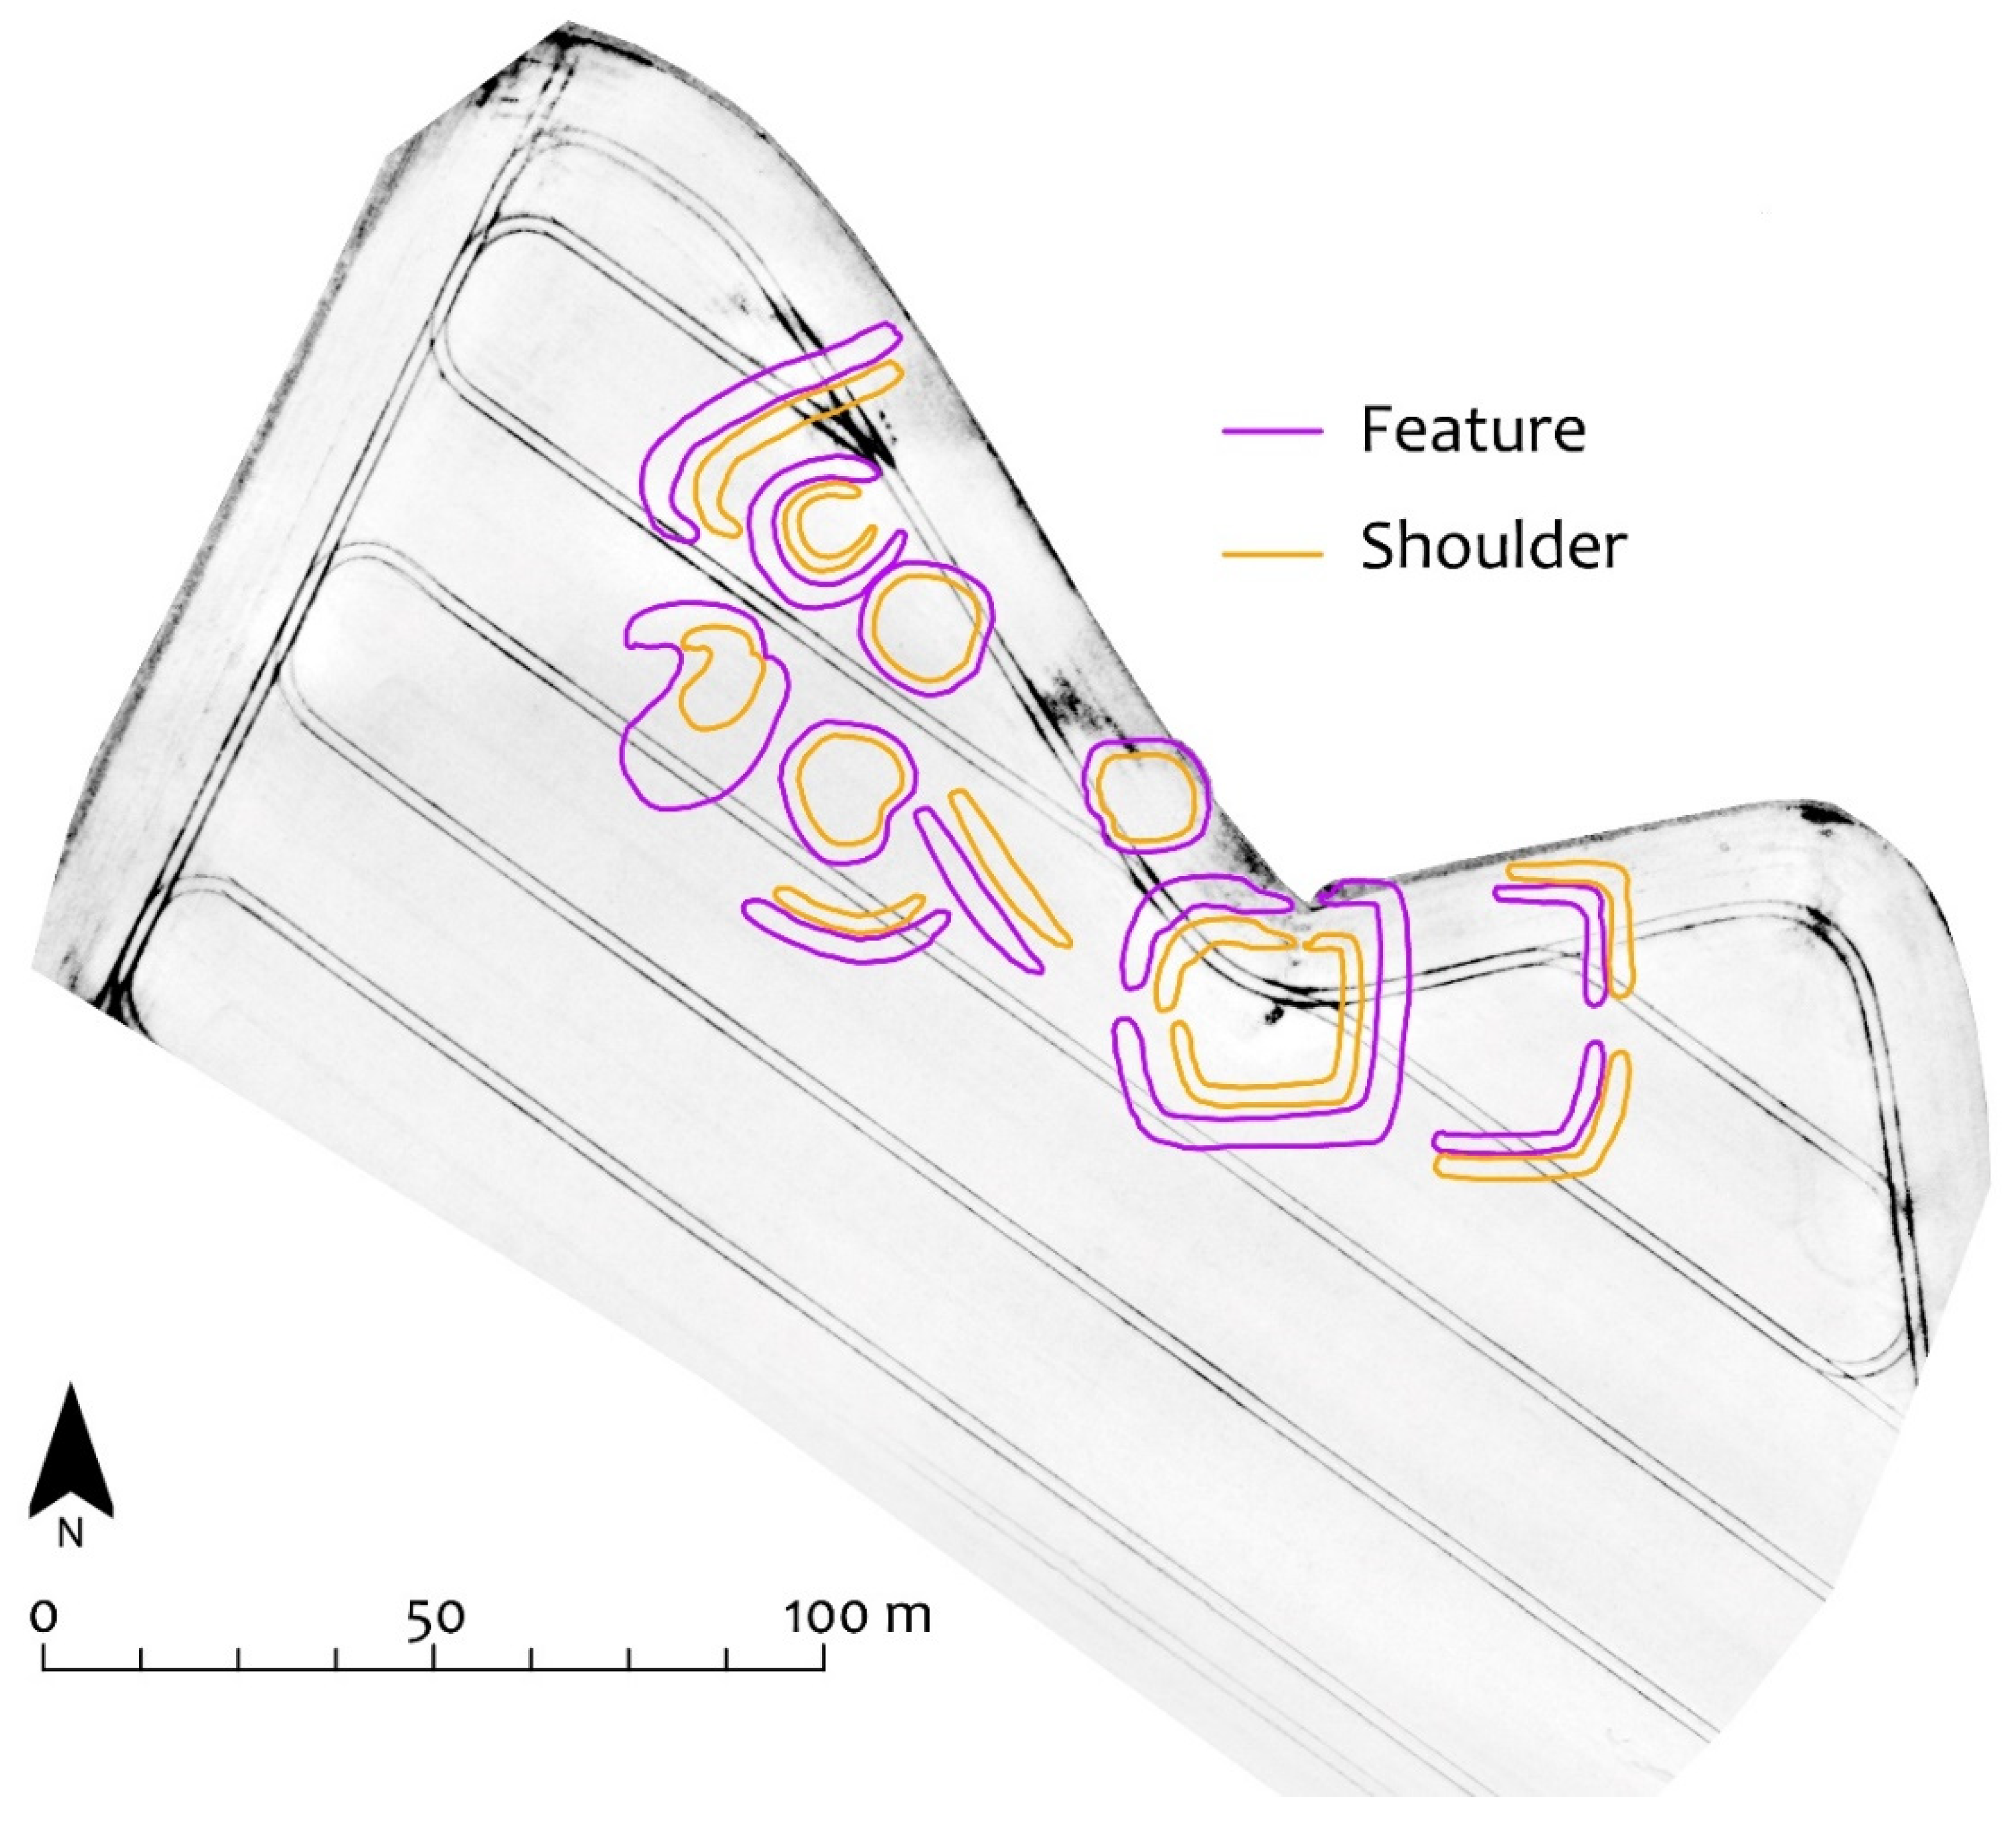
2.4. Statistical Analysis

All data analysed were first tested for normality using the Shapiro–Wilk test. The data were found to be non-normal, and thus a Mann–Whitney U test was performed to test for significance between the paired feature and shoulder regions on mean spectral reflectance, and mean temperatures within these regions. The feature region was grouped and compared with its shoulder region as a comparison group.

3. Results

The results are discussed in turn, beginning with the multispectral data and continuing to the thermal.

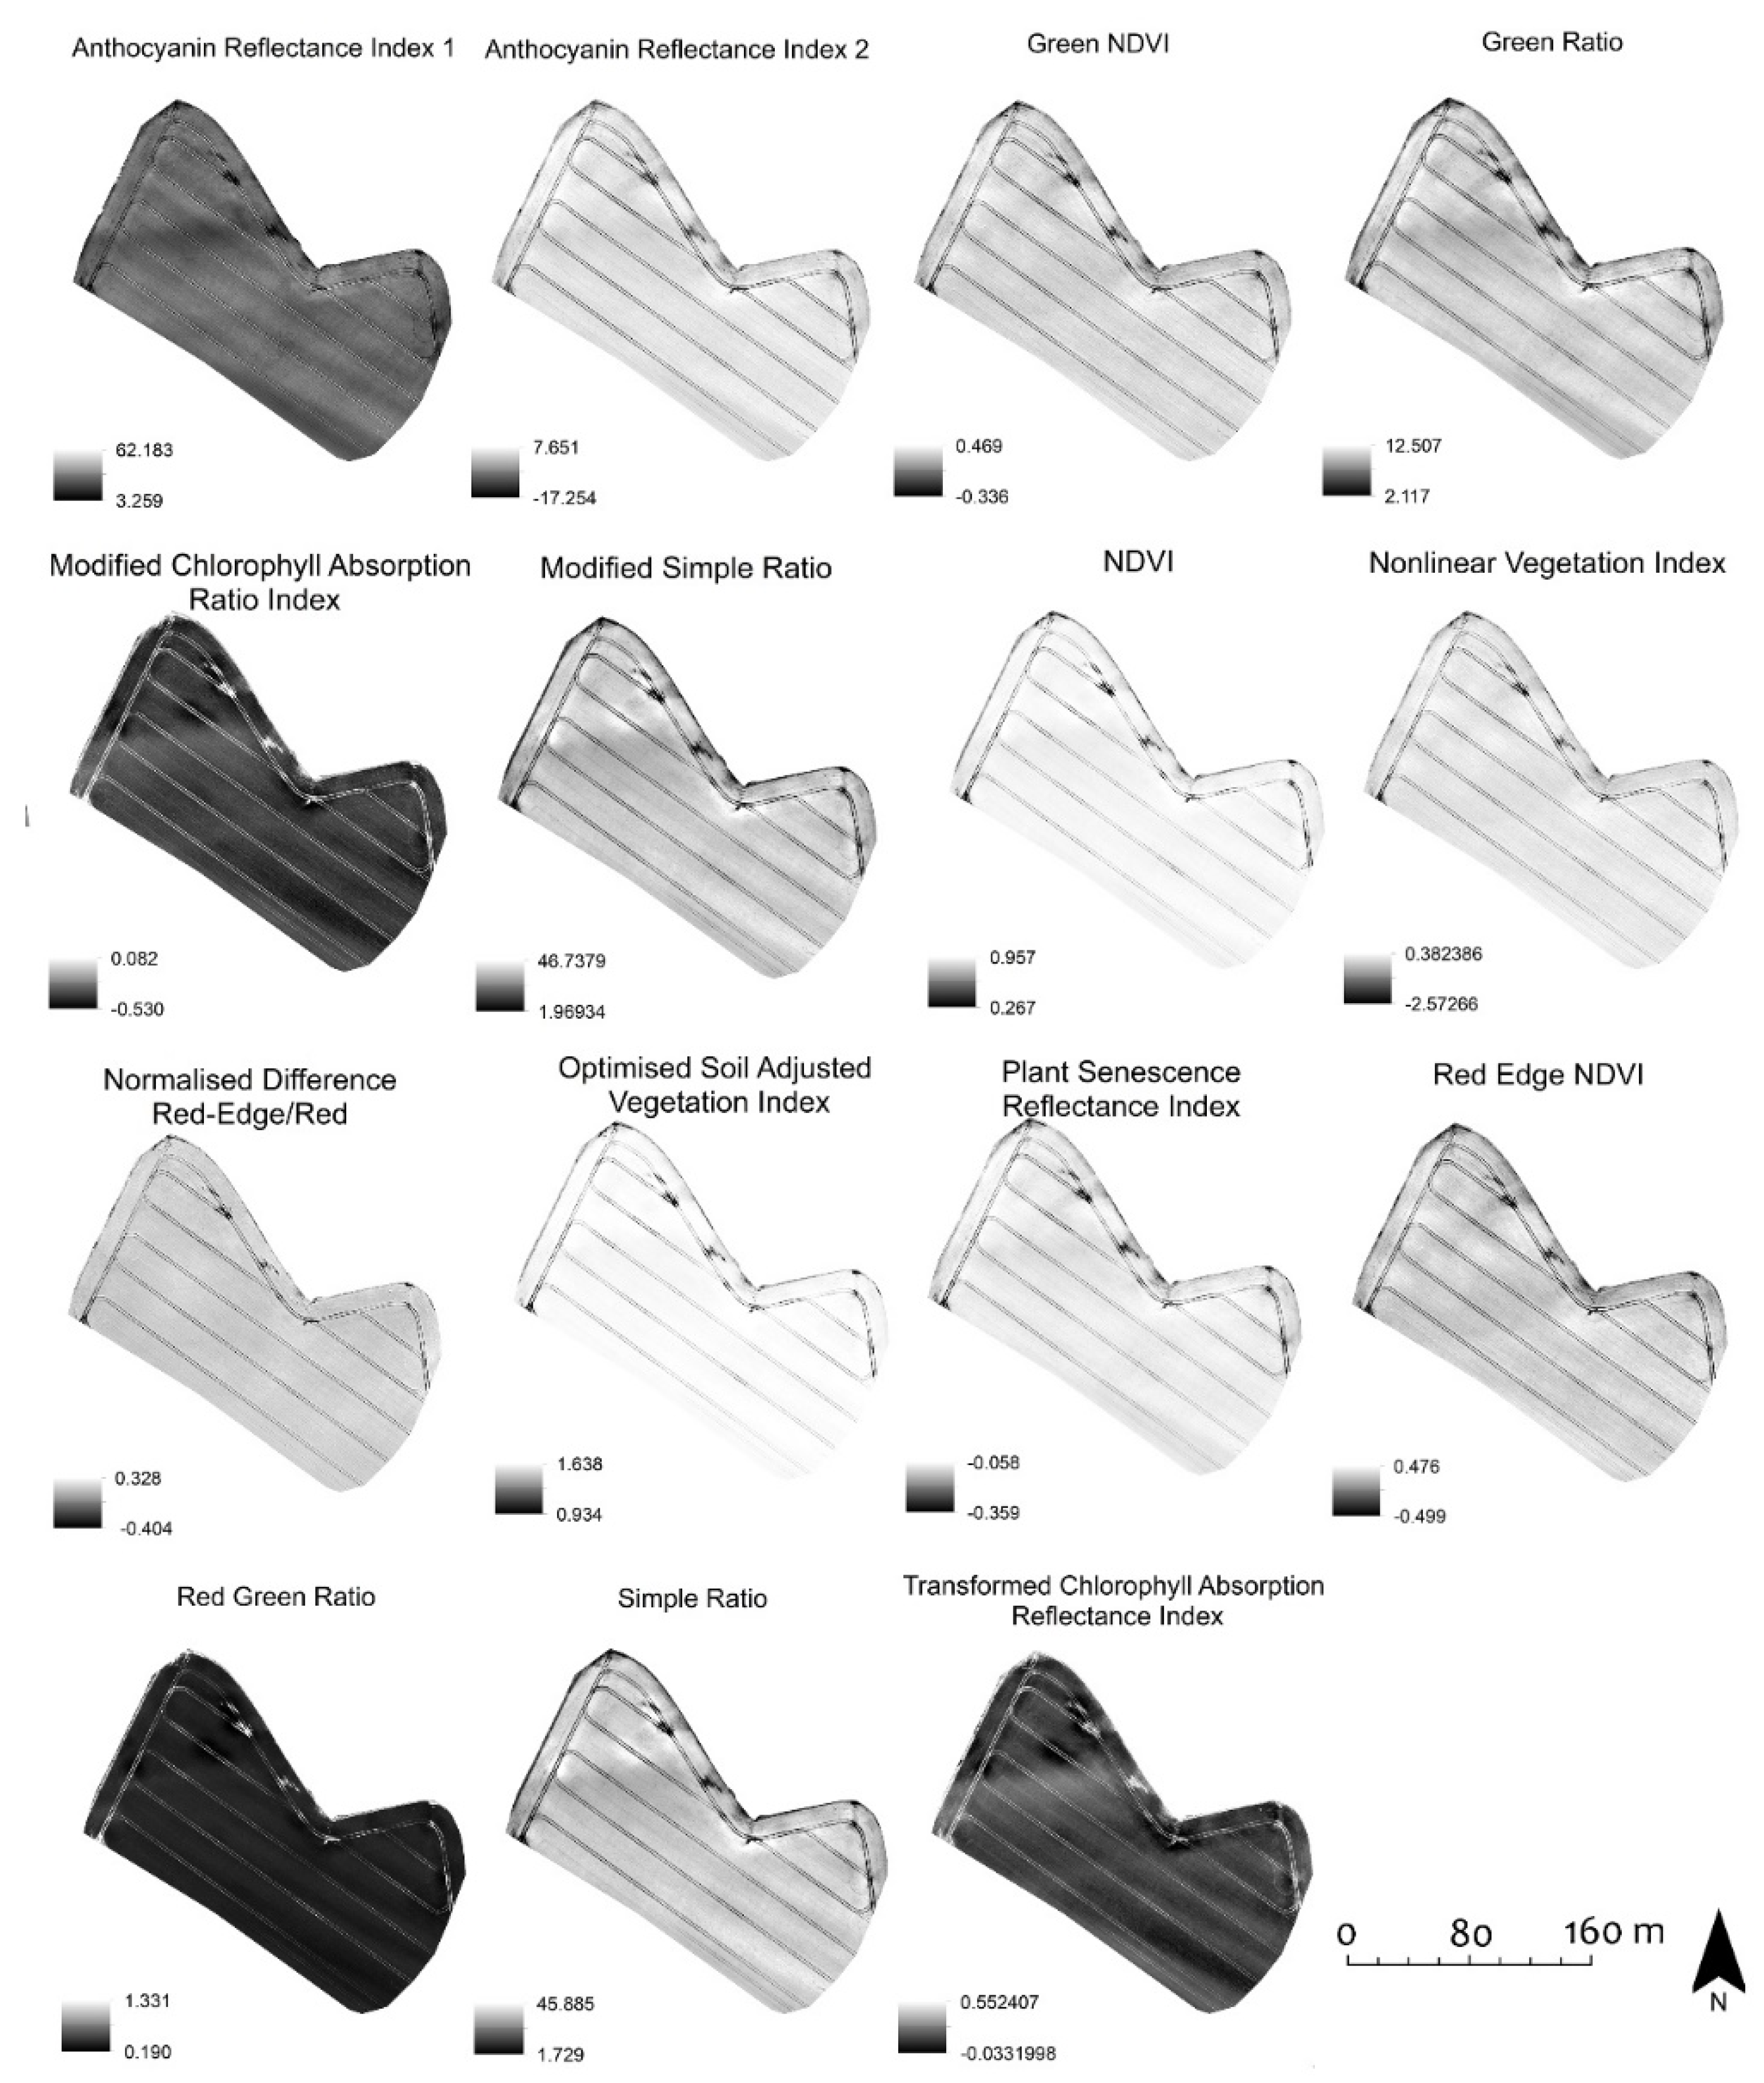
3.1. Multispectral Results: Vegetation Index Maps

All VI maps for the 24 May survey (Figure 4) and that undertaken on 26 June (Figure 5) were visually analysed for evidence indicative of buried archaeological features. While there were no visible archaeological features in either survey, a change in VIs between the two surveys can be seen. ARI1 reduces and OSAVI increases from May to June, due to the crops being in a later stage of their phenological cycle. This can also be seen by a change in mean reflectance in the feature region across the two surveys, e.g., NDVI increases from 0.573 to 0.742 in the feature region (Table 3), showing that the vegetation has improved in vigour by 26 June. However, some VIs (e.g., GRVI) do not show much of a change between the surveys. Comparing the two thermal maps (Figure 6), it is possible to see fluctuations in temperature across the field on both survey dates. Due to these initial visualisations being inconclusive in archaeological feature detection, a Mann Whitney test was performed on all maps.

3.2. Multispectral Results: Statistical Analysis

Differences in mean reflectance between the feature and shoulder regions within and between both surveys were present for all VIs (Table 3). For May, there is very little difference in NDVI values whilst the NDVI values increase for June to 0.742 for the feature and 0.698 for the shoulder.
The SR did not successfully identify any differences in crop stress across the image set with very similar values for the feature and shoulder regions (e.g., 25.793 and 25.635, respectively for May and 22.522 and 22.387 for feature and shoulder, respectively, in June).
The Mann–Whitney test was performed to determine if there were any significant differences in the mean temperatures and reflectances. However, no VI successfully detected a significant difference in the image set across both surveys, with only ARI1 in May and NDVI, OSAVI, and TCARI in June having successfully detected significant differences in crop stress between the shoulder and feature regions (Table 3). Overall, the results for crop stress detection for the VI maps were inconclusive, showing no concrete evidence of crop response to the buried archaeological features.

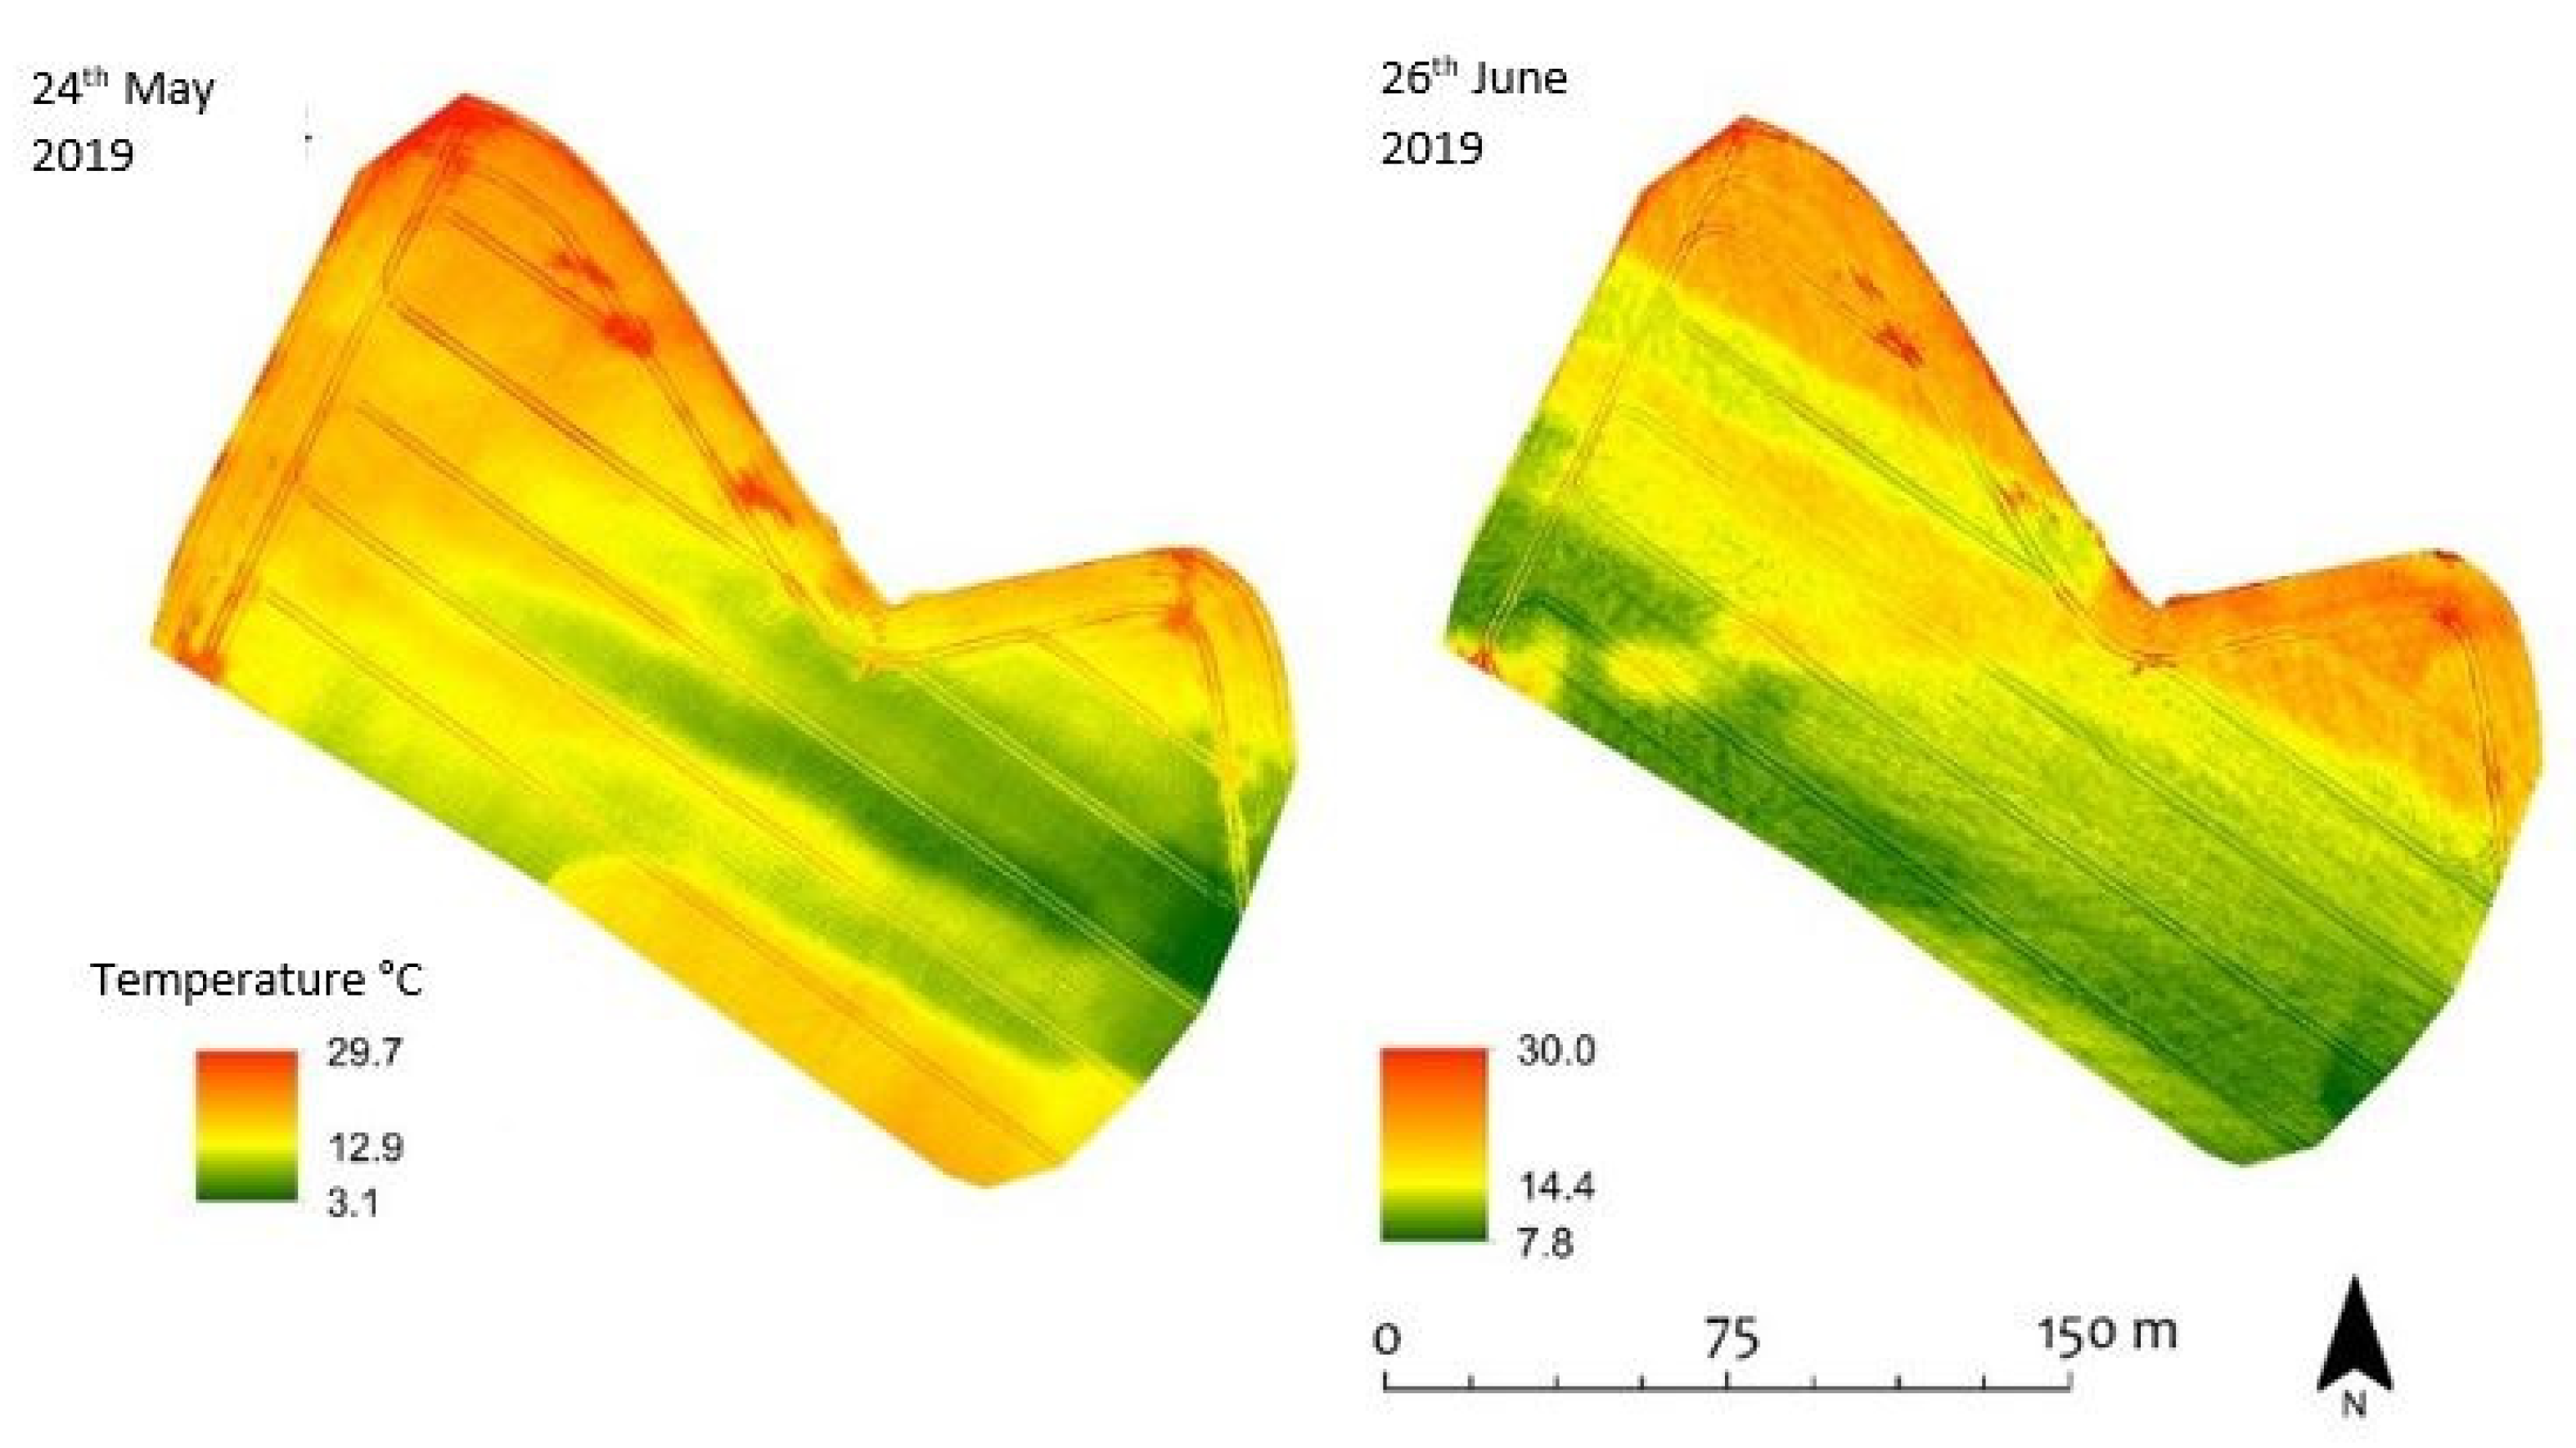
3.3. Thermal Results

There is a clear temperature change across the site within and between surveys, with the north side of the field having a generally higher temperature than the south (Figure 6). The highest temperature was 29 °C and the lowest 3.1 °C in the initial survey. The average temperature increases in the second survey with the highest temperature rising to 30 °C and the lowest temperature rising to 7.8 °C. However, whilst there is no visible direct response to the buried archaeological features in either thermal map (Figure 6), there is a relatively small difference in mean temperature between the feature and shoulder regions (Table 4). The difference is only 0.270 °C and 0.380 °C for May and June, respectively. There is also a temperature difference between surveys with the feature region rising from 15.360 °C to 16.992 °C.
Overall, no temperature change that can be attributed to archaeologically induced crop stress was found. It should be noted that the timings of the thermal surveys were not optimal, and this will have affected the results. The wind and air temperature on the day of capture could also have impacted the results of the scan, and the temperature fluctuations in Figure 6 could be due to wind at the time of flight. Across the results presented, there was no statistically significant difference in mean surface temperature between the feature and shoulder regions in the image sets. However, there is clear temperature variation across the imaged area, and these may relate to differences in underlying soil depth, as well as the influence of the stand of trees that fringe the north side of the study area.

4. Discussion

The direct relevance of this study to the assessment of the effectiveness of the sensors used for detecting archaeologically induced crop responses proved limited. Largely, this is attributed to the damp and relatively cool conditions that characterised 2019 [42], opposite to the dry and warm conditions more likely to produce crop stress [3]. For May, the mean temperature was below the long-term average, and it was wet, with above-average rainfall and below average sunshine [43]. June was also wet in south-east Scotland where the study area is located [44]. These climatic factors likely combined to minimise crop stress throughout the season.
Time of day can also affect archaeologically induced crop responses with the pre-dawn and post-sunset times being the most effective [18]. Both thermal surveys were conducted in the early afternoon, which could have affected the results as the stable weather conditions during the morning may have allowed enough time for the crop across the site to equalise in temperature [29]. This possible equalisation of temperature is seen when comparing temperature differences, with the mean temperature difference between regions only being 0.270 °C and 0.380 °C for 24 May and 26 June respectively. The results of this study highlight slight differences in temperature between the feature and shoulder regions during both surveys. However, there was not a large enough difference to determine if the subsurface features had an impact on crop surface temperature.
Whilst the Vue Pro-R captures calibrated temperature data in the imagery pixels [45], the limitation of the use of thermal cameras such as the Vue Pro-R is that they are highly sensitive to changes in their internal temperature. These can be greater than the thermal energy given off by the object being monitored, thus causing a skew in results [46]. Previous studies on an FLIR Vue Pro 640 found that the cameras automated non-uniformity correction could not correct for these internal effects [46]. Further studies should investigate how these issues can be counteracted, such as the use of an external cooling system to keep the camera a uniform temperature during the flight period. Furthermore, environmental factors such as ambient humidity and temperature of the surrounding environment can affect the temperature measurements. These factors may be addressed by the algorithms in radiometric cameras and associated software, though it is not guaranteed that they are fully accounted for, so may impact the final output [46].
Another factor that affects archaeologically induced crop responses detection is crop type. It has been shown previously that thermal imagery may be able to detect cropmarking better in crops that give poor returns in the reflected region of the electromagnetic spectrum, such as potatoes [16]. The same study also showed that the identification of cropmarks in wheat was more successful than barley [16]. At the time of the survey, the field contained barley, which could have affected formations within the crop. To further assess the Vue Pro-R’s ability to detect cropmarks, it should be utilised in a study that compares cropmark formation in multiple crop types during the same growing season.
The performance of the chosen indices shows considerable variability, between May and June, and this may be linked to the stages of crop development. Previous studies have shown that the spectral reflectance characteristics of crops varies naturally throughout its phenological cycle (Moriarty et al., 2018). These changes in reflectance depend on the structural properties of the crop such as leaf area and biochemical properties like chlorophyll levels [47]. Since these changes across the growing cycle could have had an impact on which VIs performed best during each survey, further studies should use more than two survey dates in order to determine which VIs provide the best cropmark detection properties across the growing season.
A secondary aim of this study to assess the effectiveness of VIs proved partially successful. In the May survey data, ARI1 showed some success in identifying stress between the feature and shoulder regions, while for June NDVI, OSAVI, and TCARI also proved useful in this regard. However, unsurprisingly, given the wet and cool conditions that characterised 2019, the multispectral data did not prove useful in detecting archaeologically induced cropmarking. This is a reminder of the profound impact that year to year climatic variation has on the formation of archaeologically induced crop responses [7,8,9,12,48]. The aim to compare the effectiveness of thermal imagery and multispectral VIs in an archaeological context proved impossible due to the factors outlined above, though the statistical testing on the VIs showed promise in detecting crop stress outside the range of direct human observation.
At face value, these are perhaps disappointing results, but they highlight the difficulties of developing and testing survey approaches in challenging environments. One of the great potential benefits of small unmanned platforms is the ability to sense the same scene at a high temporal frequency, with turn-around times of only a few minutes achievable. This approach can be used to establish diurnal or seasonal patterns, and potentially to derive additional information about the properties of the surface, for example by mapping and quantifying the spatial variability of thermal inertia, which may be indicative of variation in underlying drainage and soil composition which would be highly relevant to studies in this field. This study was unfortunately unable to fully explore such techniques due to a very limited number of flights, imposed by a combination of short-term availability of the airborne system and highly variable weather conditions with only a short period of uniform illumination over the target area. Future studies should certainly consider the deeper development of such approaches, but the importance of uniform illumination in such cases is worthy of note, in that this can occur infrequently in certain climatic zones, and experimental planning would need to factor in sufficient flexibility and resources to allow a reasonable chance of obtaining a suitable weather window.
Furthermore, while undertaking such testing in “ideal conditions” where variables can be tightly controlled is, of course, desirable, that is not realistic in the “real world”. This is especially true in Scotland where the year to year, and month to month or week to week, variability in climatic conditions is significant. For example, over the period from 1976 to 2014, the average summer (June to August) rainfall for eastern Scotland varied from about 100 mm to just over 400 mm, producing conditions for archaeological cropmark formation that ranged from excellent to entirely unproductive [12,49]. This variability highlights the desirability to have the capacity for single-year rapid acquisitions when planning multi-year programmes and how dependent these are on the vagaries of the weather. In this respect, our study demonstrates the cost-effectiveness of a UAV-based survey approach to such research, which would have been prohibitively expensive without such a platform. While the study has demonstrated the utility of the FLIR Vue Pro-R on a UAV platform, it is recognised that further work is warranted and the benefits to archaeological research should be explored.

5. Conclusions

In this study aiming to assess the effectiveness of thermal and multispectral VI imagery in the detection of archaeologically induced crop stress a FLIR Vue Pro-R, MicaSense RedEdge-M and Parrot Sequoia were utilised. This is the first known example of the Vue Pro-R and RedEdge-M being used for such an application. While the wet and cool weather conditions which are less than ideal conditions for crop stress to manifest prevailed during the study and compromised the archaeological outputs from the project, the UAV-based methodology and sensors utilised proved fit for this experimental purpose.
The overall research question within which this study is situated, that of how to assess the best conditions for the acquisition of large area multispectral and thermal data, remains a major challenge. Clearly further studies are required, especially those that can marshal multiple sensors and multi-temporal data collection (e.g., [50]). For Scotland, while prevailing climatic conditions and extremely variable weather patterns will always be difficult to mitigate, further extension of this study could include more surveys during the early growing season to take in more bare-earth conditions, and surveys that span multiple years. A UAV-based exploration of the capabilities of the broadening range of highly portable sensors to address these research questions is shown to be a highly cost-effective approach, especially in dealing with the challenges of the real world, usually less than ideal, deployments.

Author Contributions

Conceptualization, C.J.N. and D.C.; methodology, K.J., C.J.N., and T.W.; formal analysis, K.J.; investigation, K.J. and C.J.N.; resources, T.W., J.G., A.G., and S.G.P.; writing—original draft preparation, K.J.; writing—review and editing, ALL; visualization, K.J. and D.C.; supervision, C.J.N.; project administration, C.J.N. All authors have read and agreed to the published version of the manuscript.

Funding

This research received no external funding.

Conflicts of Interest

The authors declare no conflict of interest.

References

  1. Barber, M. A History of Aerial Photography and Archaeology: Mata Hari’s Glass Eye and Other Stories; Historic England: Swindon, UK, 2011. [Google Scholar]
  2. Crawford, O.G.S. Air survey and archaeology. Geogr. J. 1923, 61, 342–360. [Google Scholar] [CrossRef]
  3. Evans, R.; Jones, R.J.A. Crop marks and soils at two archaeological sites in Britain. J. Archaeol. Sci. 1977, 4, 63–76. [Google Scholar] [CrossRef]
  4. Evans, R. Crop patterns recorded on aerial photographs of England and Wales: Their type, extent and agricultural implications. J. Agric. Sci. 1990, 115, 369–382. [Google Scholar] [CrossRef]
  5. Verhoeven, G.J.J.; Doneus, M. Balancing on the borderline—A low-cost approach to visualise the red-edge shift for the benefit of aerial archaeology. Archaeol. Prospect. 2011, 18, 267–278. [Google Scholar]
  6. Agapiou, A.; Alexakis, D.D.; Hadjimitsis, D.G. Spectral sensitivity of ALOS, ASTER, IKONOS, LANDSAT and SPOT satellite imagery intended for the detection of archaeological crop marks. Int. J. Digit. Earth 2012, 7, 351–372. [Google Scholar] [CrossRef]
  7. Agapiou, A.; Lysandrou, V.; Lasaponara, R.; Masini, N.; Hadjimitsis, D.G. Study of the variations of archaeological marks at Neolithic site of Lucera, Italy using high-resolution multispectral datasets. Remote Sens. 2016, 8, 723. [Google Scholar] [CrossRef] [Green Version]
  8. Agapiou, A.; Hadjimitsis, D.G.; Alexakis, D.D. Development of an image-based method for the detection of archaeological buried relics using multi-temporal satellite imagery. Int. J. Remote Sens. 2013, 34, 5979–5996. [Google Scholar] [CrossRef]
  9. Agudo, P.U.; Pajas, J.A.; Pérez-Cabello, F.; Redón, J.V.; Lebrón, B.E. The potential of drones and sensors to enhance detection of archaeological cropmarks: A comparative study between multi-spectral and thermal imagery. Drones 2018, 2, 29. [Google Scholar] [CrossRef] [Green Version]
  10. Thomas, H. Some like it hot: The impact of next generation FLIR Systems thermal cameras on archaeological thermography. Archaeol. Prospect. 2017, 25, 81–87. [Google Scholar] [CrossRef]
  11. Campana, S. Drones in archaeology. State-of-the-art and future perspectives. Archaeol. Prospect. 2017, 24, 275–296. [Google Scholar] [CrossRef]
  12. Cowley, D. The Traprain Environs in a Regional Perspective. In The Traprain Law Environs Project—Fieldwork and Excavations 2000–2004; Haselgrove, C., Ed.; Society of Antiquaries of Scotland Monograph: Edinburgh, UK, 2009; pp. 205–223. [Google Scholar]
  13. Cowley, D. Aerial photography and reconnaissance for archaeology in the 21st century: Achievements and challenges. Archeol. Aerea Xi 2019, 17, 9–15. [Google Scholar]
  14. Doneus, M.; Verhoeven, G.; Atzberger, C.; Wess, M.; Ruš, M. New ways to extract archaeological information from hyperspectral pixels. J. Archaeol. Sci. 2014, 52, 84–96. [Google Scholar] [CrossRef] [Green Version]
  15. Agapiou, A.; Alexakis, D.; Sarris, A.; Hadjimitsis, D.G. Evaluating the potentials of Sentinel-2 for archaeological perspective. Remote Sens. 2014, 6. [Google Scholar] [CrossRef] [Green Version]
  16. Caldwell, A.E. Application of remote sensing in archaeology: A study of crop mark detection using airborne thermal infrared imagery in the Heslerton Parish Project area, Vale of Pickering, North Yorks, UK. Infrared Spaceborne Remote Sens. VIII 2000, 4131, 185–193. [Google Scholar]
  17. Moriarty, C.; Cowley, D.C.; Wade, T.; Nichol, C.J. Deploying multispectral remote sensing for multi-temporal analysis of archaeological crop stress at Ravenshall, Fife, Scotland. Archaeol. Prospect. 2018, 26, 33–46. [Google Scholar] [CrossRef] [Green Version]
  18. Šedina, J.; Housarová, E.; Raeva, P. Using RPAS for the detection of archaeological objects using multispectral and thermal imaging. Eur. J. Remote Sens. 2019, 52, 182–191. [Google Scholar] [CrossRef] [Green Version]
  19. Department for Environment, Food and Rural Affairs (DEFRA). The Management of Archaeological Sites in Arable Landscapes, Project Code: BD1701, CSG15, Final Project Report Issue 2. Available online: Randd.defra.gov.uk/Document.aspx?Document=BD1701_3901_FRP.pdf (accessed on 23 July 2019).
  20. Ralston, I.; Dunwell, A. The Management of Cropmark Archaeology in Lowland Scotland: A Case Study from the Lunan Valley; Historic Scotland Inspectorate Research Report; Angus: Edinburgh, UK, 2008. [Google Scholar]
  21. Traviglia, A. MIVIS hyperspectral sensors for the detection and GIS supported interpretation of subsoil archaeological sites. In Proceedings of the 34th Conference on Digital Discovery: Exploring New Frontiers in Human Heritage, CAA, Fargo, ND, USA, April 2006; pp. 287–299. [Google Scholar]
  22. Cavalli, R.M.; Colosi, F.; Palombo, A.; Pignatti, S.; Poscolieri, M. Remote hyperspectral imagery as a support to archaeological prospection. J. Cult. Herit. 2007, 8, 272–283. [Google Scholar] [CrossRef]
  23. Verhoeven, G. Near-Infrared Aerial Crop Mark Archaeology: From its Historical Use to Current Digital Implementations. J. Archaeol. Method Theory 2012, 19, 132–160. [Google Scholar] [CrossRef]
  24. Hadjimitsis, D.G.; Papadavid, G.; Agapiou, A.; Themistocleous, K.; Hadjimitsis, M.G.; Realis, A.; Michaelides, S.; Chrysoulakis, N.; Toulis, L.; Clayton, C.R.I. Atmospheric correction for satellite remotely sensed data intended for agricultural applications: Impact on vegetation indices. Nat. Hazards Earth Syst. Sci. 2010, 10, 89–95. [Google Scholar] [CrossRef] [Green Version]
  25. Aqdus, S.A.; Hanson, W.S.; Drummond, J. The potential of hyperspectral and multispectral imagery to enhance archaeological cropmark detection: A comparative study. J. Archaeol. Sci. 2012, 39, 1915–1924. [Google Scholar]
  26. Bennett, R.; Welham, K.; Hill, R.A.; Ford, A.L.J. The application of vegetation indices for the prospection of archaeological features in grass-dominated environments. Archaeol. Prospect. 2012, 19, 209–218. [Google Scholar] [CrossRef]
  27. De Guio, A. Cropping for a Better Future, Vegetation Indices in Archaeology. In Detecting and Understanding Historic Landscapes; Chavarria Arnau, A., Reynolds, A., Eds.; SAP: Rosemead, CA, USA, 2015; pp. 109–152. [Google Scholar]
  28. Gade, R.; Moeslund, T.B. Thermal cameras and applications: A survey. Mach. Vis. Appl. 2014, 25, 245–262. [Google Scholar] [CrossRef] [Green Version]
  29. Cool, A.C. Aerial Thermography in Archaeological Prospection: Applications and Processing. Master’s Thesis, University of Arkansas, Fayetteville, AR, USA, May 2015. [Google Scholar]
  30. Casana, J.; Wiewel, A.; Cool, A.; Hill, A.C.; Fisher, K.D.; Laugier, E.J. Archaeological Aerial Thermography in Theory and Practice. Adv. Archaeol. Pract. 2017, 5, 310–327. [Google Scholar] [CrossRef] [Green Version]
  31. Khanal, S.; Fulton, J.; Shearer, S. An overview of current and potential applications of thermal remote sensing in precision agriculture. Comput. Electron. Agric. 2017, 139, 22–32. [Google Scholar] [CrossRef]
  32. Lasaponara, R.; Masini, N. Detection of archaeological crop marks by using satellite QuickBird multispectral imagery. J. Archaeol. Sci. 2007, 34, 214–221. [Google Scholar] [CrossRef]
  33. Pascucci, S.; Cavalli, R.M.; Palombo, A.; Pignattie, S. Suitability of CASI and ATM airborne remote sensing data for archaeological subsurface structure detection under different land cover: The Arpi case study (Italy). J. Geophys. Eng. 2010, 7, 183–189. [Google Scholar] [CrossRef]
  34. Cowley, D.C. Creating the cropmark archaeological record in East Lothian, southeast Scotland. In Prehistory without Borders: Prehistoric Archaeology of the Tyne-Forth Region; Crellin, R., Fowler, C., Tipping, R., Eds.; Oxbow: Oxford, UK, 2016; pp. 59–70. [Google Scholar]
  35. Cowley, D.C.; Hale, D.N.; Hunter, F.; Macleod, K.H.J. Survey in the Traprain Law Environs Project Area. In The Traprain Law Environs Project—Fieldwork and Excavations 2000–2004; Haselgrove, C., Ed.; Society of Antiquaries of Scotland Monograph: Edinburgh, UK, 2009; pp. 11–21. [Google Scholar]
  36. MicaSense RedEdge-MTM Multispectral Camera, User Manual. Available online: https://support.micasense.com/hc/en-us/article_attachments/115004168274/RedEdge-M_User_Manual.pdf (accessed on 31 July 2020).
  37. Parrot Sequoia User Guide. Available online: https://parrotcontact.parrot.com/website/user-guides/sequoia/sequoia_user_guide.pdf# (accessed on 18 July 2019).
  38. Mission Planner Overview. Available online: https://ardupilot.org/planner/docs/mission-planner-overview.html (accessed on 18 July 2019).
  39. Light Use Efficiency. Available online: https://www.harrisgeospatial.com/docs/LightUseEfficiency.html (accessed on 18 July 2019).
  40. Narrowband Greenness. Available online: https://www.harrisgeospatial.com/docs/NarrowbandGreenness.html#Modified2 (accessed on 18 July 2019).
  41. Dry or Senescent Carbon. Available online: https://www.harrisgeospatial.com/docs/DrySenescentCarbon.html#plant_senescence_reflectance_index (accessed on 18 July 2019).
  42. Climate Summaries. Available online: https://www.metoffice.gov.uk/research/climate/maps-and-data/summaries/index (accessed on 1 August 2019).
  43. UK Monthly Climate Summary: May 2019. Available online: https://www.metoffice.gov.uk/binaries/content/assets/metofficegovuk/pdf/weather/learn-about/uk-past-events/summaries/uk_monthly_climate_summary_201905.pdf (accessed on 19 July 2020).
  44. UK Monthly Climate Summary: June 2019. Available online: https://www.metoffice.gov.uk/binaries/content/assets/metofficegovuk/pdf/weather/learn-about/uk-past-events/summaries/uk_monthly_climate_summary_201906.pdf (accessed on 19 July 2020).
  45. Flir Vue. Available online: https://www.flir.co.uk/products/vue-pro-r/ (accessed on 4 August 2020).
  46. Kelly, J.; Kljun, N.; Olsson, P.; Mihai, L.; Liljebad, B.; Weslien, P.; Klemedtsson, L.; Eklundh, L. Challenges and best practices for deriving temperature data from an uncalibrated UAV thermal infrared camera. Remote Sens. 2019, 11, 567. [Google Scholar] [CrossRef] [Green Version]
  47. Agapiou, A.; Hadjimitsis, D.G.; Alexakis, D.D. Evaluation of broadband and narrowbad vegetation indices for the identification of archaeological crop marks. Remote Sens. 2012, 4, 3892–3919. [Google Scholar] [CrossRef] [Green Version]
  48. Gojda, M.; Hejcman, M. Cropmarks in main field crops enable the identification of a wide spectrum of buried features on archaeological sites in Central Europe. J. Archaeol. Sci. 2012, 39, 1655–1664. [Google Scholar] [CrossRef]
  49. Met Office. Available online: https://www.metoffice.gov.uk/research/climate/maps-and-data/uk-and-regional-series (accessed on 5 September 2020).
  50. Carmona, J.A.S.; Quirós, E.; Mayoral, V.; Charro, C. Assessing the potential of multispectral and thermal UAV imagery from archaeological sites. A case study from the Iron Age hillfort of Villasviejas del Tamuja (Cáceres, Spain). J. Archaeol. Sci. Rep. 2020, 31, 102312. [Google Scholar]
Figure 1. (A) The location of the case study site in eastern Scotland. (B) Composite image comprising airborne laser scanning data-derived hillshade visualisation showing the surviving earthworks in the afforested ground (top) and the cropmarks recorded on 18 July 1994 (bottom) with the area imaged by the present study outlined in green. Note that the cropmarking is most effective in documenting the ditches and other negative features. (C). Interpretative mapping of the main visible archaeological features. Airborne laser scanning data = Scottish Public Sector LiDAR: contains public sector information licensed under the Open Government Licence version 3.0. Aerial photograph = C28264: © Historic Environment Scotland.
Drones 04 00061 g001
Figure 2. Flow chart of the different processing stages from data collection through to analysis.
Drones 04 00061 g002
Figure 3. Regions defined for cropmark analysis overlaid on the NDVI map from the 26 June 2019.
Drones 04 00061 g003
Figure 4. Single-band vegetation indices created for the initial survey on 24 May 2019. Showing minimum and maximum reflectance values.
Drones 04 00061 g004
Figure 5. Single-band vegetation indices created for the survey on 26 June 2019. Showing minimum and maximum reflectance values.
Drones 04 00061 g005
Figure 6. Thermal maps of the study area showing temperature changes across the region.
Drones 04 00061 g006
Table 1. Information on flight altitude, speed, overlap, and resolution for the three sensors used in the two surveys. The May survey was undertaken at 13:27 and June survey at 14:37.
SensorAltitude of Flight (m)Speed (ms−1)Side Overlap (%)Front Overlap (%)Pixel Resolution (cm)
MicaSense RedEdge-M60575754.1
FLIR Vue Pro-R (flight 1)60572727.8
Parrot Sequoia60570706.0
FLIR Vue Pro-R (flight 2)60580608.0
Table 2. Vegetation indices created from multispectral data, including equations and details on each index (multiple sources: [6,7,17,26,27,39,40,41]).
Vegetation IndexAbbr.EquationApplication
Normalised Difference Vegetation IndexNDVI ρ NIR ρ RED ρ NIR + ρ RED Normalised difference of green leaf scattering in the NIR band and chlorophyll absorption in the Red band. Measured through a normalised ratio ranging from −1 to 1.
Green Normalised Difference Vegetation IndexGNDVI ρ NIR ρ Green ρ NIR + ρ Green Modification of the NDVI that is more sensitive to chlorophyll concentration.
Red Edge Normalised Difference Vegetation IndexRENDVI ρ NIR ρ Red   Edge ρ NIR + ρ Red   Edge Modification of the NDVI that uses reflectance measurements in the Red Edge to look for changes in vegetation health.
Normalised
Difference RedEdge/Red
NDRER ρ Red   Edge   ρ Red ρ Red   Edge + ρ Red Modification to the NDVI that utilises the red edge information instead of the NIR reflectance to look for changes in vegetation health.
Simple RatioSR ρ NIR ρ Red The ratio of green leaf scattering in the NIR band and chlorophyll absorption in the red band.
Modified Simple
Ratio
MSR ( ρ N I R ρ R e d ) 1 ( ρ N I R ρ R e d ) + 1 A combination of SR and renormalised NDVI, which improves sensitivity to vegetation characteristics.
Green Ratio Vegetation IndexGRVI ρ NIR ρ Green This is a modification to SR that is sensitive to the rate of photosynthesis.
Red Green Ratio
Index
GRVI ρ Red ρ Green An indicator of leaf production and stress. Traditionally uses the mean of all red bands divided by the mean of all green bands, but in this instance modified to use the single red and single green band.
Modified
Chlorophyll
Absorption Ratio
Index
MCARI ( ρ Red   Edge   ρ Red ) 0.2 ( ρ Red   Edge ρ Green ) ρ Red   Edge ρ Red Indicates the relative abundance of chlorophyll present in leaves, it is adjusted to minimise soil background effects. The red edge, red and green reflectance values for the Sequoia and RedEdge-M were substituted for the traditional narrowband wavelengths.
Transformed Chlorophyll Absorption Reflectance IndexTCARI 3 [ ( ρ Red   Edge ρ Red ) 0.2 ( ρ Red   Edge ρ Green ) ( ρ Red   Edge ρ Red ) ] Indicates the relative abundance of Chlorphyll, however, it is affected by the reflectance of the underlying soil. The red edge, red and green reflectance values for the Sequoia and RedEdge-M were substituted for the traditional narrowband wavelengths.
Nonlinear Vegetation IndexNLI ρ N I R 2 ρ R e d ρ N I R 2 + ρ R e d A modification to NDVI that emphasises the linear relationships with vegetation parameters.
Plant Senescence
Reflectance Index
PSRI ρ Red ρ Green ρ NIR Used to look at the ratio of bulk carotenoids to chlorophyll to study vegetation stress (. The red and green reflectance values for the Sequoia and RedEdge-M were substituted for the traditional narrowband wavelengths.
Optimised Soil
Adjusted
Vegetation Index
OSAVI 1.5 ( ρ NIR ρ Red ρ NIR + ρ Red + 0.16 A variation of the NDVI that reduces the effect of soil reflectance in areas of patchy vegetation cover using standardised values.
Anthocyanin Reflectance Index 1ARI1 1 ρ G r e e n 1 ρ R e d   E d g e Measures stress in vegetation through sensitivity to anthocyanin content. The green and red edge reflectance values for the RedEdge-M and the Sequoia were substituted for traditional narrowband wavelengths.
Anthocyanin Reflectance Index 2ARI2 ρ N I R [ 1 ρ G r e e n 1 ρ R e d   E d g e ] A modification to the ARI1, with an increase in sensitivity to anthocyanin content. The green and red edge reflectance values for the Sequoia and RedEdge-M were substituted for traditional narrowband wavelengths.
Table 3. The Mann–Whitney results for the single-band VIs created from multispectral imagery the from first survey (24 May 2019) and the second survey (26 June 2019).
Vegetation IndexMeanDifference in Mean Valuesp-Value
FeatureShoulder
Anthocyanin Reflectance Index 110.9569.6351.321<0.01
NDVI0.7420.6980.044<0.001
Optimised Soil Adjusted Vegetation1.4491.4020.047<0.001
Transformed Chlorophyll Absorption Reflectance Index0.2540.2110.043<0.001
Table 4. Statistical results for the thermal imaging data.
SurveyMean Temperature (°C)Difference in Meanp-Value
FeatureShoulderTemperature (°C)
24 May15.36015.6300.2700.528
26 June 16.99217.3720.3800.266

