1. Introduction
Object detection and tracking have become well-known resources worldwide mainly because they have a large variety of applications [
1]. For instance, they can be used for the recognition of people or cars crossing a given area. These aspects will certainly be necessary to achieve the driving of autonomous vehicle in urban areas. Object detection and tracking can also be helpful in other applications like precision agriculture, which will be highlighted in the present paper. Surveillance of a plantation before harvesting is a rather complicated task that is often done empirically. However, the yield will strongly depend on the number of mature plants during a long period of time. Plant theft represents an enormous problem that plantation owners face. It is therefore necessary to develop techniques for monitoring the plants in a given field. It would be useful to be able to continually check the growth of the plants, as well as to verify if some plants have been stolen. This generally happens on large plantations, which are more difficult to monitor.
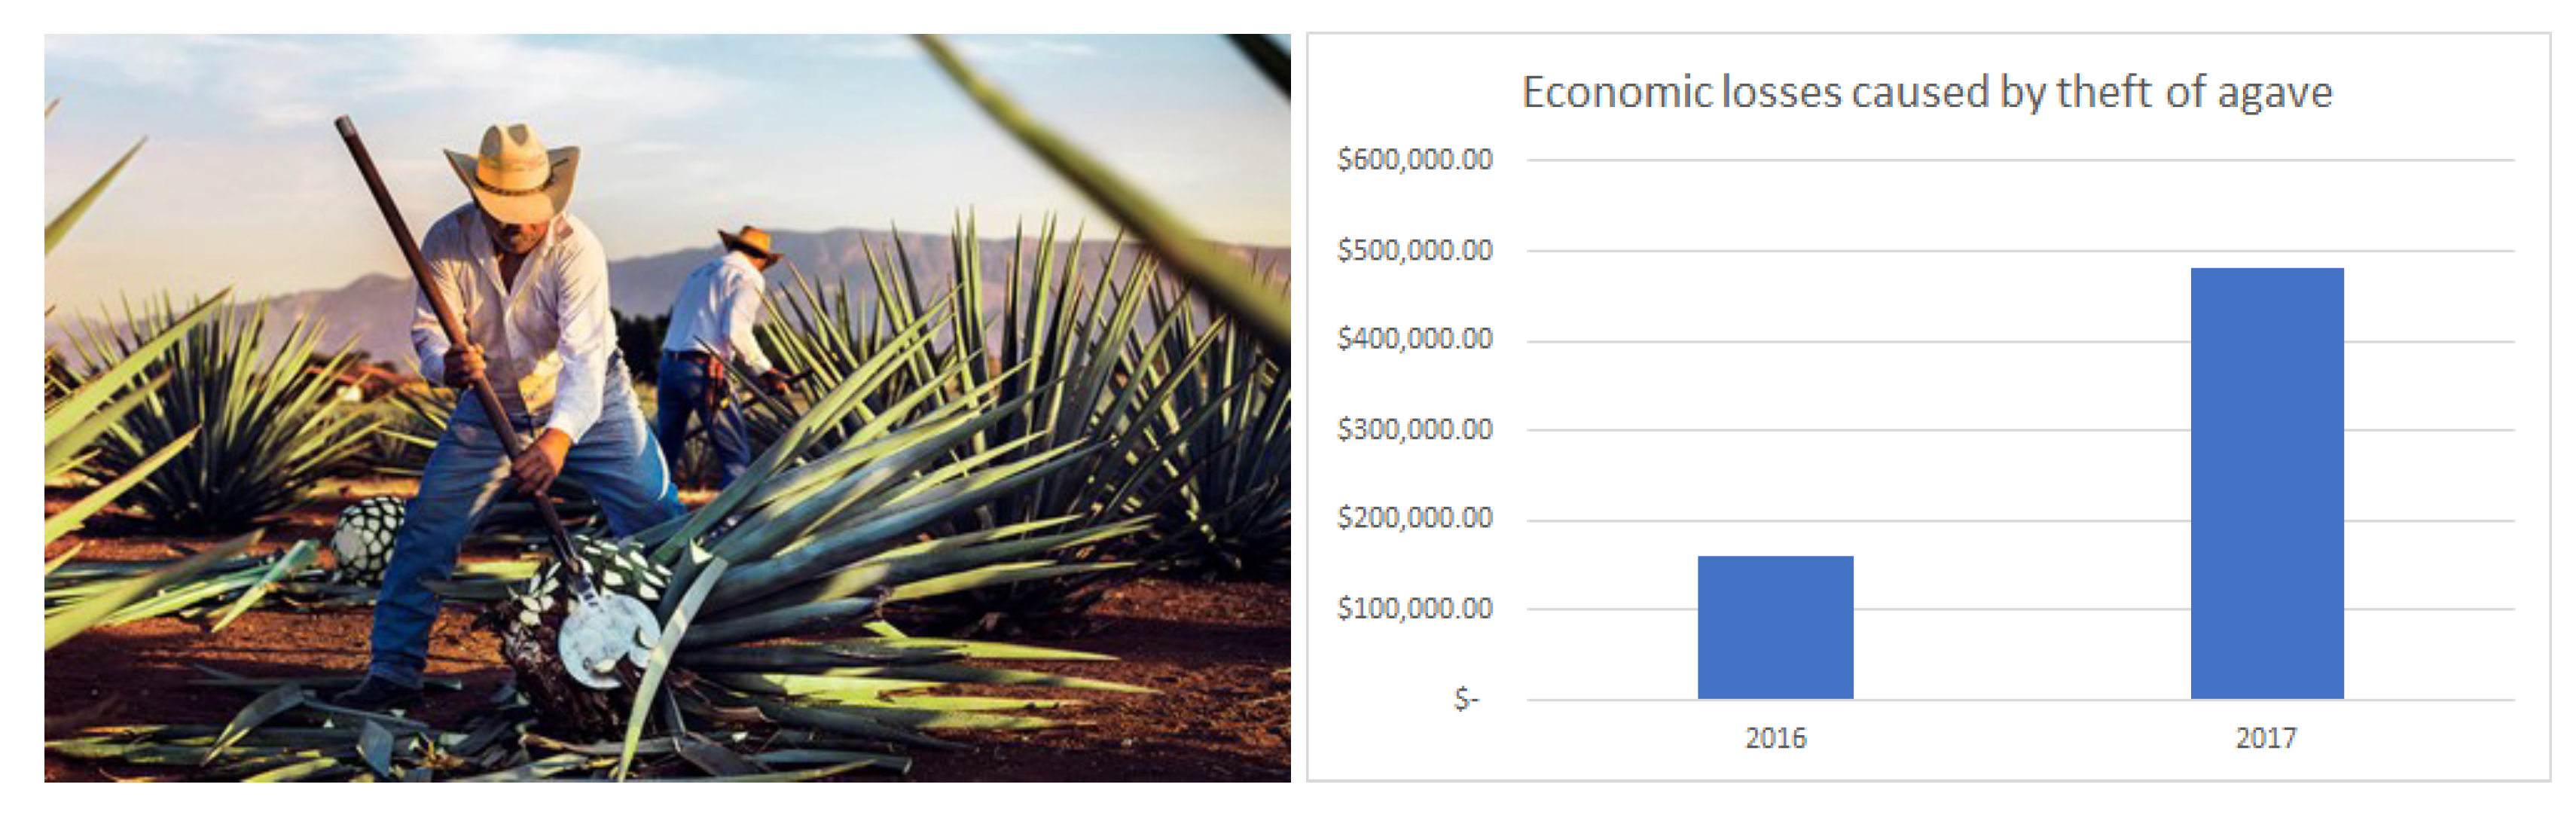
The present paper deals with the agave plant, an endemic species of Mexico, which in recent years has seen a severe security crisis in its production due to increasing demand. In recent years, the theft of these plants in Mexico has been on the rise. According to the Tequila Regulatory Council (TRC) [
2], in 2016, there were thefts registered for 193 tons of blue agave, which is equivalent to losses for the producers of almost three million Mexican pesos (around 160,000 USD). For the year 2017, this amount tripled. An additional problem is that thieves often steal mature plants and replace them with immature plants, making it more difficult to fully detect all thefts. Agave is mainly used for the production of tequila and mezcal, and its maturing process is very long: the plant should be in the field at least eight years and sometimes up to 15 years [
3]. In addition, its harvesting process involves the cutting of the entire plant (
Figure 1). This means unfortunately that it is only harvested once for each time it is planted. This fact justifies the need to protect them from theft as much as possible.
In order to solve this important problem, the present paper proposes a technological solution that involves the use of an unmanned aerial vehicle. The UAV performs two main functions, which are monitoring the plantations to help decrease the number of robberies and counting plants in a location of the product that can be harvested. Both tasks are supported with image processing algorithms and artificial intelligence on board. We have witnessed in recent years a growing interest in applying UAVs to improve production in agriculture, as will be detailed below. It has then become very common to employ UAVs to collect data in order to have general information on plantations’ conditions. The sensors onboard a UAV are constantly improved so that they are lighter and provide more precise measurements.
There are different configurations for UAVs, and each one offers different features. Within the recent literature, we find the work of [
4], which describes the advantages and disadvantages of the two main configurations, which are fixed wing and multirotor. One of the conclusions of this work is that fixed-wing vehicles offer a longer flight time, but require a higher altitude due to the speed at which they travel. On the other hand, multirotors have greater advantages for low-altitude flights, but the flight duration decreases with respect to fixed-wing aircraft. Since the main objective is to be able to count agave with accuracy, we will require an aircraft that flies at low altitude, and this would also open the possibility of tracking the furrows that are formed and could be used as a reference for navigation. The aircraft should have onboard sensors to perform this function. Therefore, it follows that the best option is a multirotor platform. We will therefore perform flights using multiple rotors to collect the necessary data. The flights should be planned in advance following some rules and considerations as described in [
5]. The paths that are formed between the rows of agave are considered as furrows, and these are generally parallel to each other and parallel to the rows of agave. Recent developments have been published concerning computer vision with applications in the field of agriculture [
6,
7,
8].
The work reported in [
6] deals with the detection of tobacco plants. They used a three phase algorithm. In order to reduce the false detections, they first separated the tobacco zones from the non-tobacco zones, which was carried out by separating the soil from the green plants by using the RGB value in the image. However, sometimes, there are areas that appear with the wrong classification, and to solve this problem, we have to take into account real situations that appear frequently. In fact, this technique was used as the first step to detect agave plants. The color value was also used to separate the plant from the ground and used the plant silhouette obtained from this segmentation. Another inspection algorithm based on segmentation was developed in [
7]. The segmentation was performed for palm trees and decomposed the aerial images into two classes taking into account that some images may include clouds and unknown vegetation. This reinforces the idea that it is useful to have a validation phase. In our case, we do not expect to have images with clouds because we propose a low altitude flight. However, the problem of agave leaves crossing has to be faced.
In recent years, deep learning has proven to be one of the best options for detecting objects. Since we are interested in detecting plants, it is relevant to review works in the area of precision agriculture. Among the most relevant, we can find the following works. Kitano’s work in [
9] is interesting since corn plants were detected at different stages during their growth using deep learning. This work performed segmentation of the images, separating the ground from the green zone. Since Kitano required measurements when the plant size was small, this required prototypes that could fly at low altitudes. The detection of tomato plants was reported in [
10] using deep learning. Interestingly enough, the training images contained virtual images. This means that a computer randomly generated virtual images to deal with the problem of occlusion and the detection of tomatoes that were not so ripe. YOLO is a tool that has been used lately, offering good results in conjunction with other algorithms, as can be seen in [
11,
12]. The former presented a 3D reconstruction of trees to be able to use the data in afforestation processes. The later considered counting tasks using the detection of insects and could be considered as future work.
Another detection algorithm for palm trees was proposed by [
13]. In this article, two neural networks were combined to improve the detection. One neural network was devoted to detecting large palm trees’ fine details, while the other neural network was devoted to detecting coarser details. In our case, we are not using two neural networks, but two algorithms for detecting the center of the agave plant are instead used to improve the detection. The term crop deep was introduced by [
14], which is a neural network capable of detecting and differentiating 31 types of fruits and vegetables for agricultural applications. This was used to have an estimate of how many images are required to perform a good detection. On average, one-thousand images are required to train a detection algorithm. In [
15], an algorithm was proposed that deals with the detection of palm trees using deep learning. The authors studied the case of having a sliding window, which will also be used in our case. The problem of multiple detections was present, i.e., the same plant could be detected twice or three times. To solve this problem, the centers of the candidate windows were detected, and a minimum distance between the centers was defined. This ensured having only a single detection. In our case, we use the same technique since the agave plants can be too close to each other.
An interesting detection algorithm was also proposed in [
16] for palm trees using deep learning. The authors analyzed high resolution orthomosaics. They initially defined zones to perform the detection. They recommended that the zones overlap each other a little in order to avoid losing important information. In the present paper, we follow the main metrics proposed in [
17] for deep learning in the field of precision agriculture. Another interesting research area is the detection of fruits inside the tree since there could exist cases where two objects overlap each other, and it may happen that only one is taken into account. Similar situations happen in other works that are mentioned below. Therefore, it is important to analyze how to deal with the problem of overlapping, but with a different plant. Fruit detection was recently discussed in [
18] for the case of apple detection using deep learning. In general, fruit counting is a complicated task, as can be seen in [
19] for the detection of peaches and [
20] for counting mango in the trees. These articles recommend using first texture segmentation before applying fruit detection.
Some researchers use more specific hardware for acquiring and treating multi-spectral images, like in [
21,
22,
23,
24]. These specific sensors can be used also for reforestation, as mentioned in [
25]. In [
26,
27], a LiDAR sensor was implemented in addition to the artificial vision algorithm. There is also literature in the area of monitoring, which can be found in [
9,
10,
26,
27,
28], which include counting elements of processes. Images taken from UAV’s were used as orthomosaics or orthoimages in [
29,
30,
31], which described their uses in agriculture. Concerning the specific species case studied in this work, there is another species that has a similar form. The oil palm tree’s (Elaeis guineensis) top view is similar to the agave plant. This similarity is meaningful for the present work. Papers dealing with palm detection can be found in [
7,
13,
14,
15,
16]. The researcher in [
32] dealt also with palm detection and used HOG features, which can be considered an old technique, but offers advantages in detecting some textures. In [
33], different techniques and sensors for acquiring properties of plants were analyzed, and the properties of imaging with different sensors were studied in [
34].
Having reviewed the previous works, two main objectives are set, which are to design a UAV that can recognize a particular plant in real time and apply an artificial vision algorithm that is accurate enough to perform the detection correctly.
2. Materials and Methods
2.1. Plots’ Analysis
The present paper aims at developing an autonomous plant detection technique to be applied in real environmental conditions. To achieve this objective, the data used to train our deep learning algorithm must be taken from the place where they will be applied. Orthomosaics from real agave plantations are used as raw material to learn about the graphic environment that we are expected to have.
The soils in this area are usually clayey, permeable, rich in iron, and have a pH varying from 6.0 to 8.5. Temperature ranges between C and C during the day. The average humidity is 60%. At night, the temperature can decrease to C. An important fact is that this plant is greatly affected by low temperatures (less than C).
2.2. Data Collection
These orthomosaics correspond to three hectares (7.5 acres) of agave plantation area close to Guadalajara City, Mexico (20 N 102 W). Images were taken from an altitude of 600 m above sea level and 50 m with respect to the ground. A DJI Phantom 3 was used to take the images with an FC300S camera. The images were taken with a camera having a focal length f of 4 mm, and therefore, the scale f/H is equal to 1:12,500. The images were taken on 15 May 2018 between 13:38 and 13:55 local time. The temperature was , and the sky was 65% cloudy. Solar noon occurred in that period of time at 12:48, and the average wind speed was 9.2 km/h(4.9676 kt) in the (WSW) west-southwest direction, between to . Images were taken from the top view of the plant and capturing as many characteristics of the plant as possible. Shadows may certainly affect the image by hiding some of its characteristics. For that reason, we performed the flight close to solar noon (12:48). However, to make the detection more robust, images were also taken at different times with different light intensities. The light intensity varied depending on the hour of the day the images were taken. Nevertheless, light intensity varied mainly because of clouds moving and creating shadows on the Earth’s surface. The light intensity variation affects the detection procedure, but shadows affect it the most. The software used for the orthomosaic creation was Drone Deploy 3D Mapping.
2.2.1. Image Dataset
The dataset used for this project was a joint work with the Drones Mexico Company, which is a Mexican company whose main service consists of aerial photography. The company was responsible for providing aerial images of agave plantations and some images known as orthomosaics.
An orthomosaic image is created from several shots of an area; the images taken are stitched to create a complete image of the photographed area of interest. This orthoimage usually covers the entire parcel and cannot be covered in a single photo. This orthoimage contains the necessary information on the plantation, and it is possible to obtain it with images taken at a certain altitude.
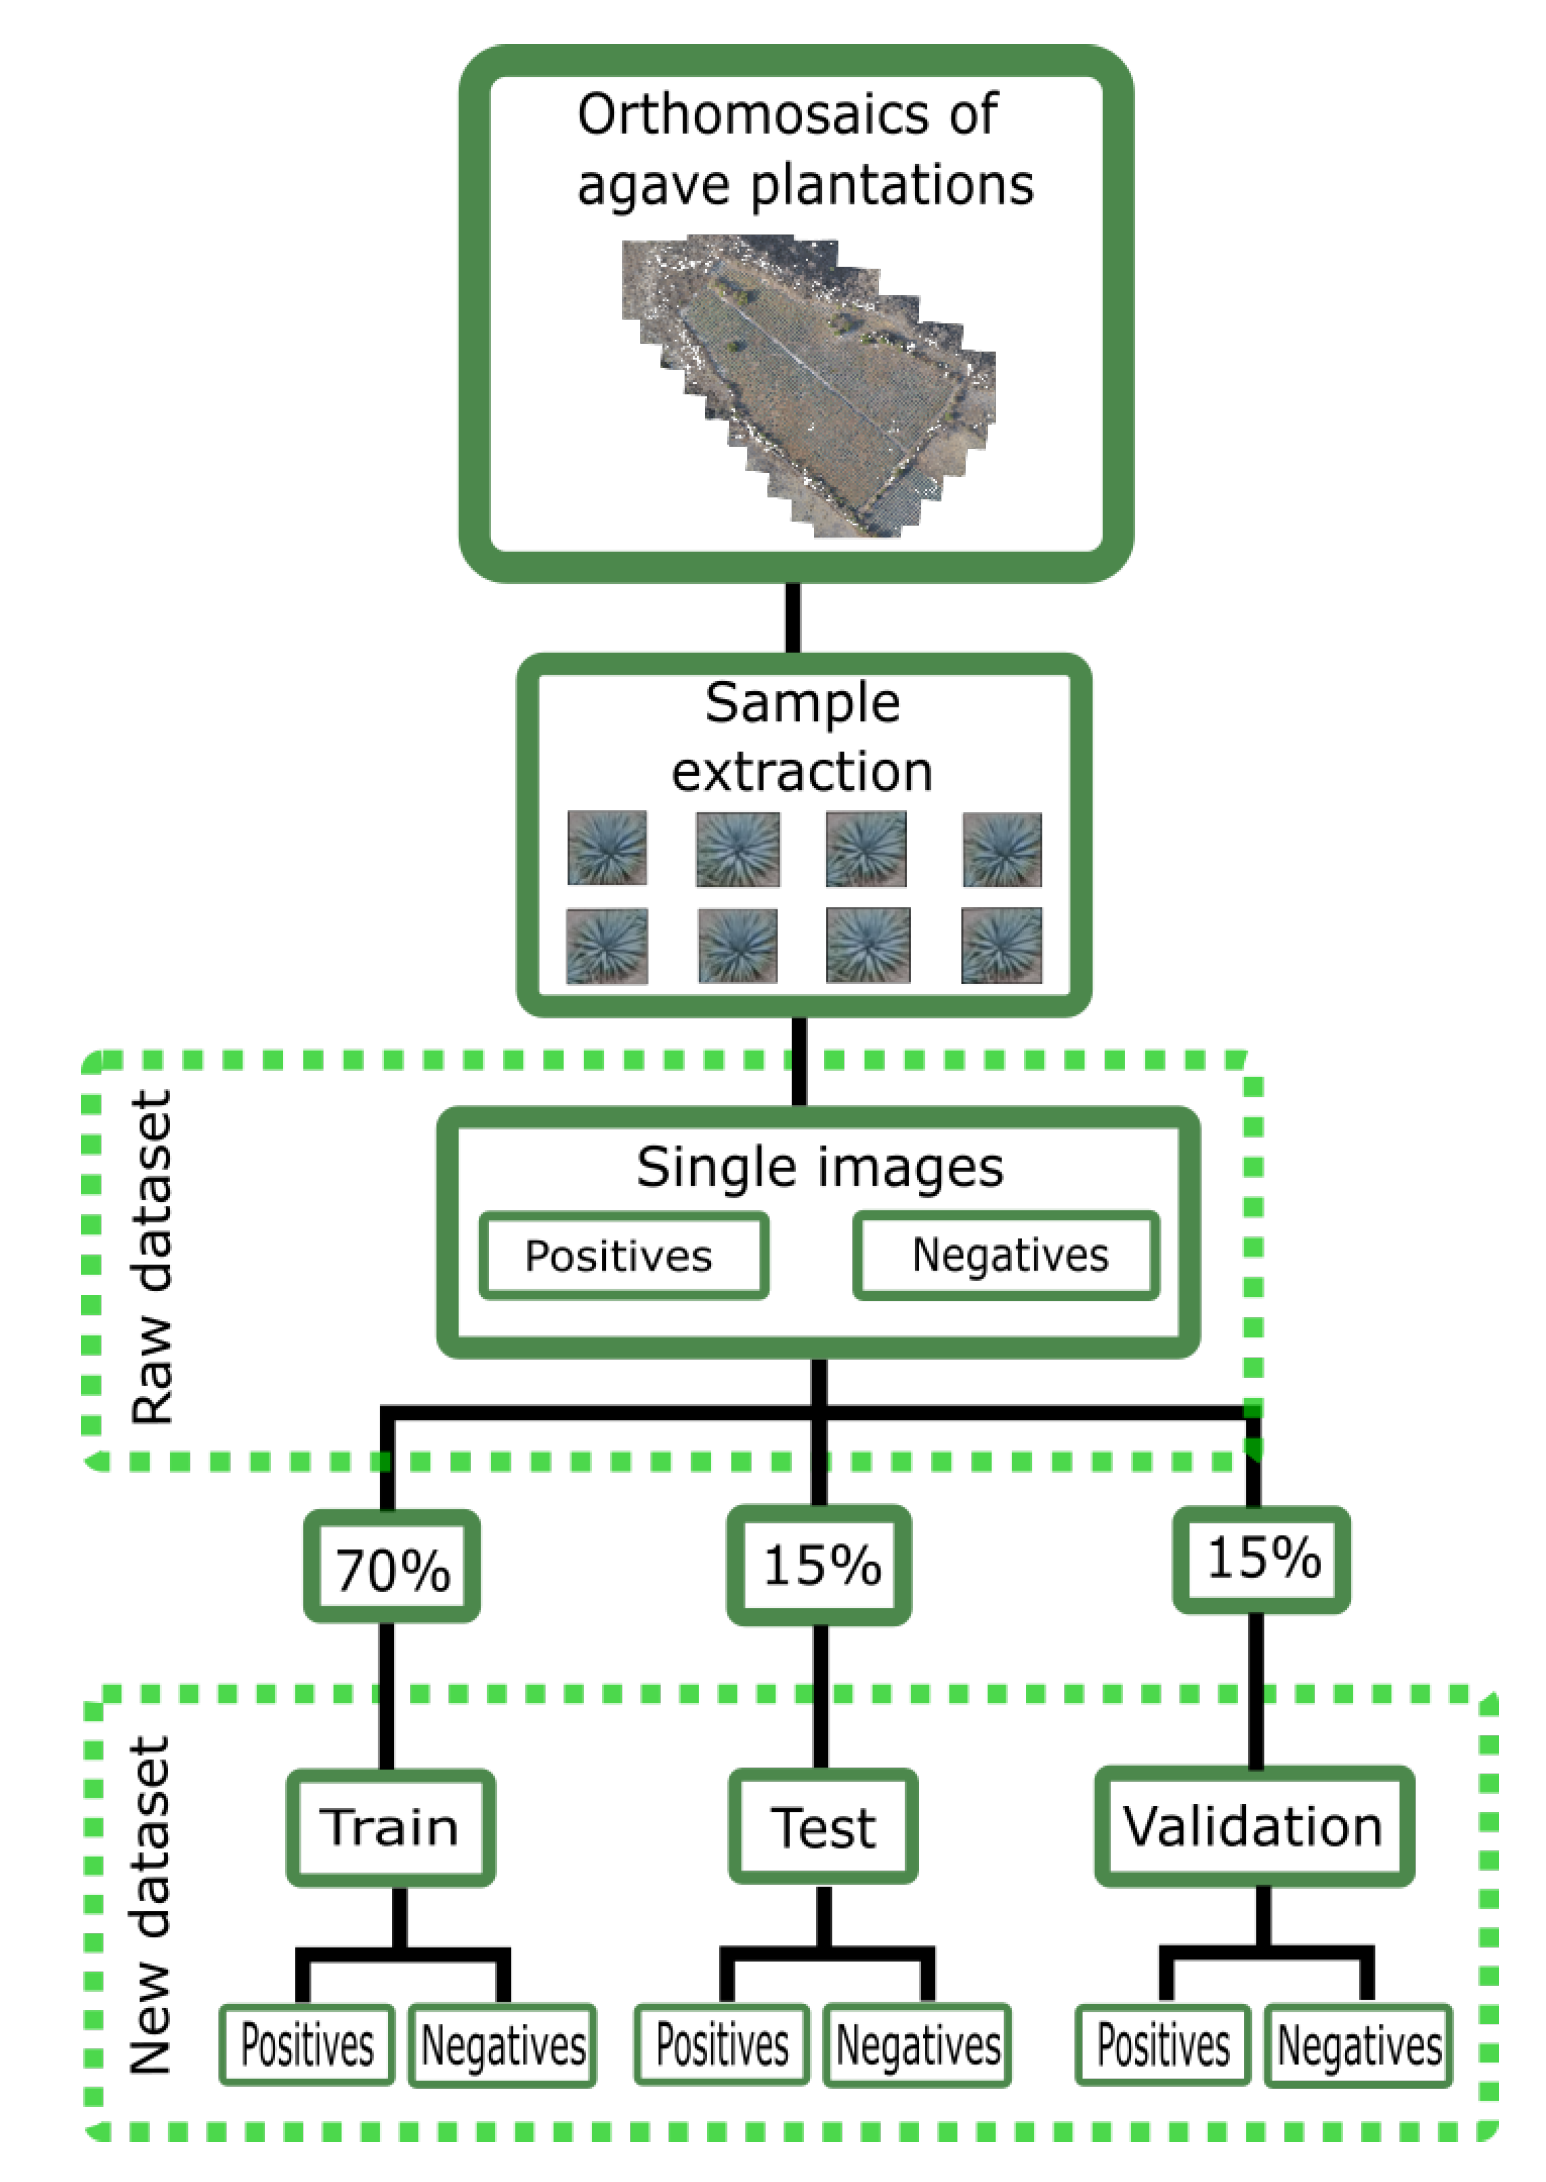
The agave plant used for tequila production is native to Mexico, and to date, there was no database of individual plants from top view images. Therefore, it was necessary to create a new dataset for this work. Aerial images from real agave plantations were used and cropped into single images of agave plants. Images were chosen from small to large plants, and a montage was created from them in a single picture with fixed dimensions of 50 × 50 pixels.
The entire dataset contained two classes: the first class was for images of a single agave plant, and the second class contained extracts from the surrounding area where there were no agave plants like soil and other plants. The first class is called “positives”, and the second one is called “negatives”. Each class has 1000 images. Before initiating the training process, it is necessary to separate each class into 3 stages: 70% for training, 15% for validation, and 15% for testing. The distribution of the new and raw dataset is shown in
Figure 2.
2.2.2. Furrow Sensing for Navigation
We assumed that the plantation area, which was covered by the drone’s image, contained enough information to carry out the detection algorithm. Notice that this cannot be obtained by merely increasing the drone’s altitude since the quality of the image will be degraded since images taken from a higher altitude reduce the definition of the agave leaves. Thus, it is recommended to perform a flight along the land to be inspected by tracking the furrows.
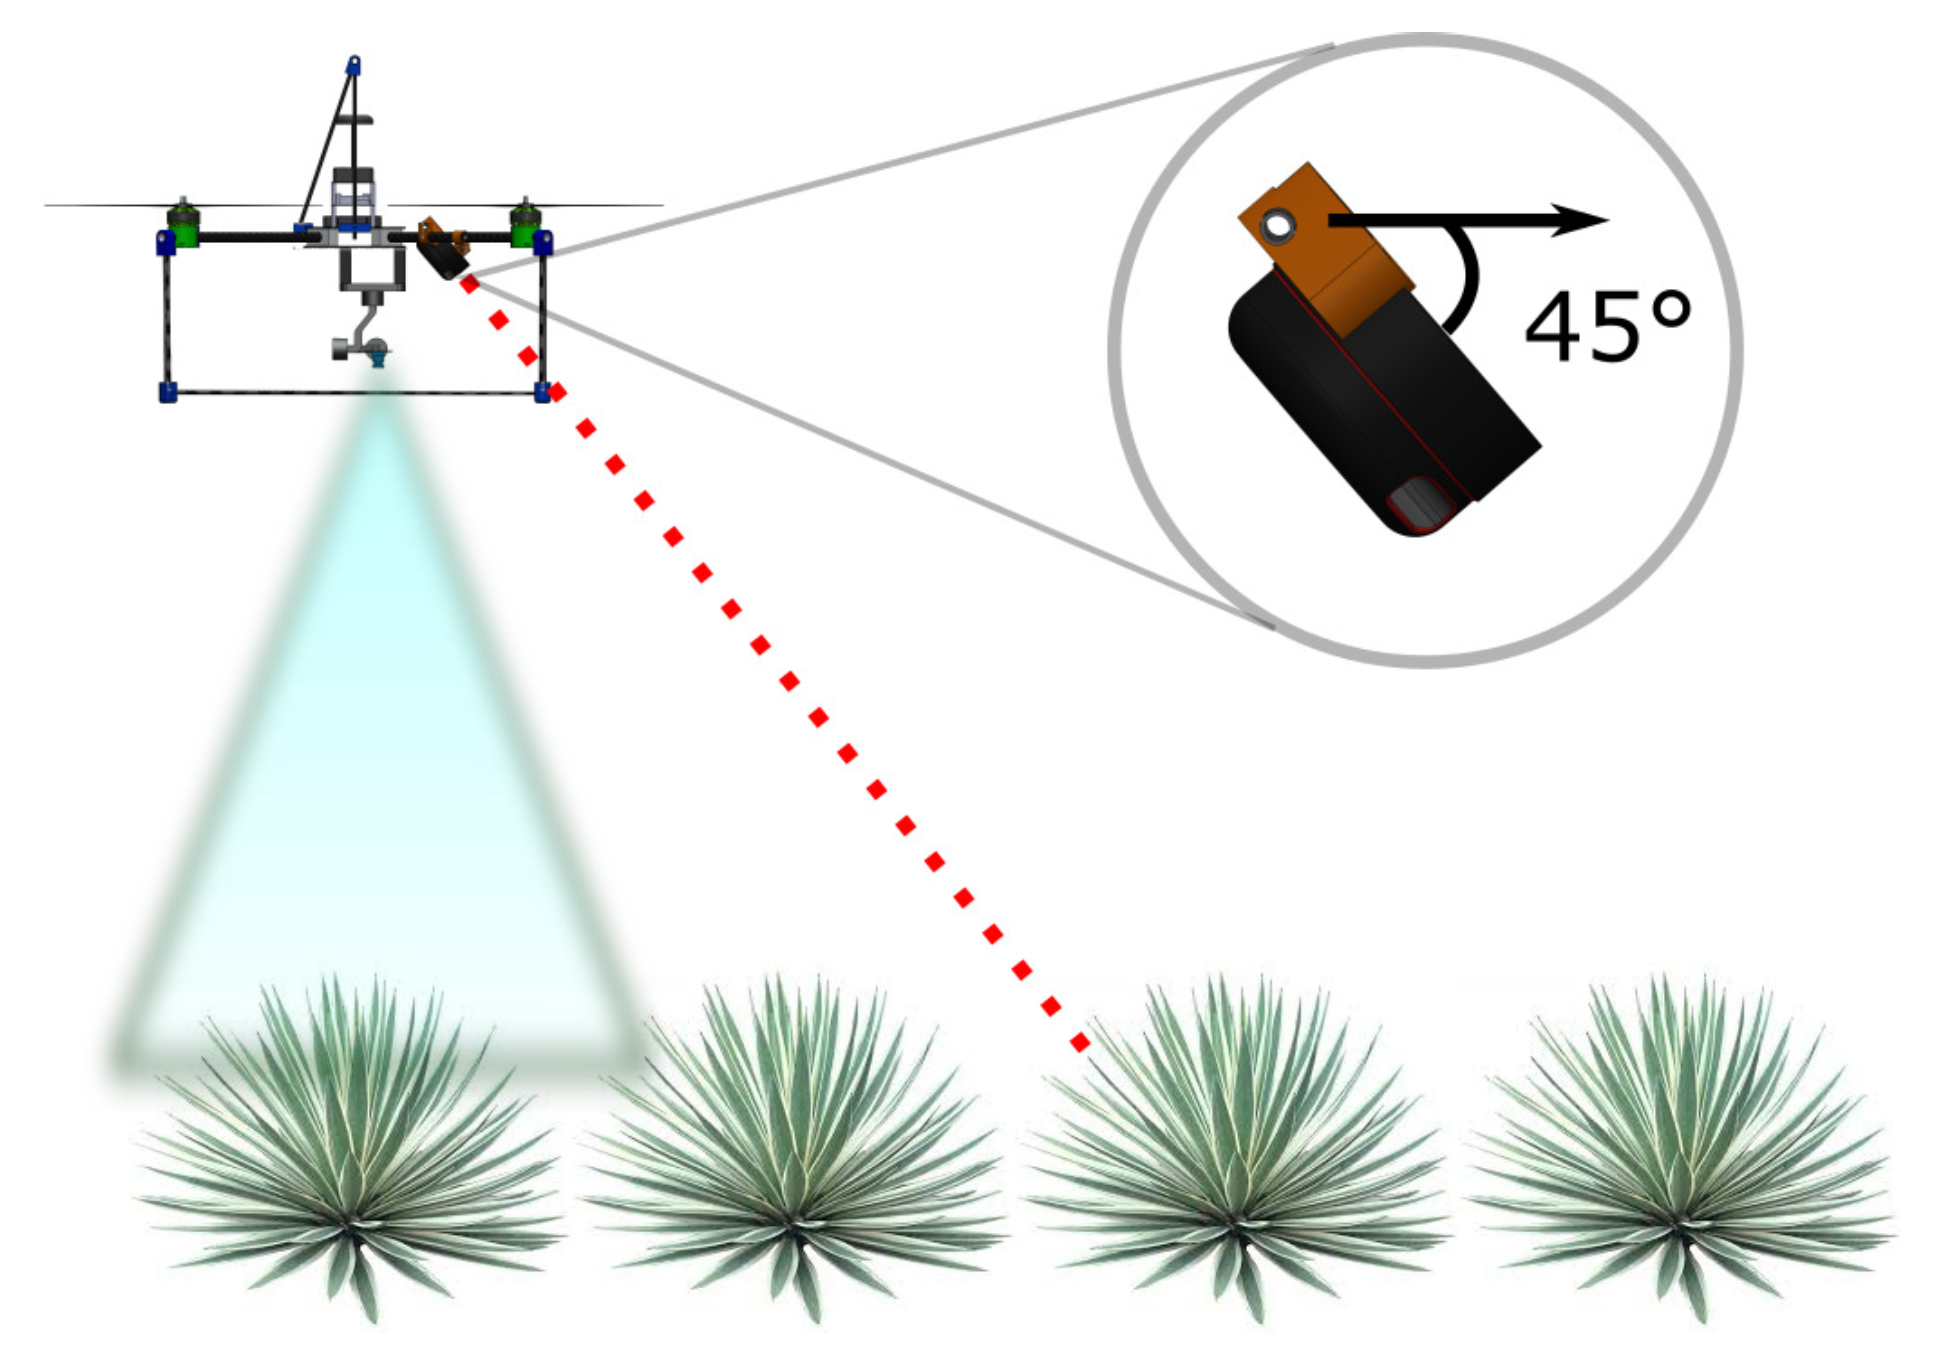
The process began by localizing the furrows with respect to the vehicle to be able to track them. In the furrow detection, we did not use an artificial vision algorithm since the vision system was devoted to the detection and counting of the plant. To achieve these tasks, the camera needed to be oriented downwards. The furrow was instead detected by using a rotary laser sensor, which was located in the front of the UAV.
It is essential to notice that when the laser sensor’s pitch and roll angles were zero, i.e., when the bottom of the sensor was completely parallel to the ground, the information provided by the laser sensor was not useful to detect furrows. Therefore, a pitch angle was selected so that the sensor would obtain more useful information, as shown in
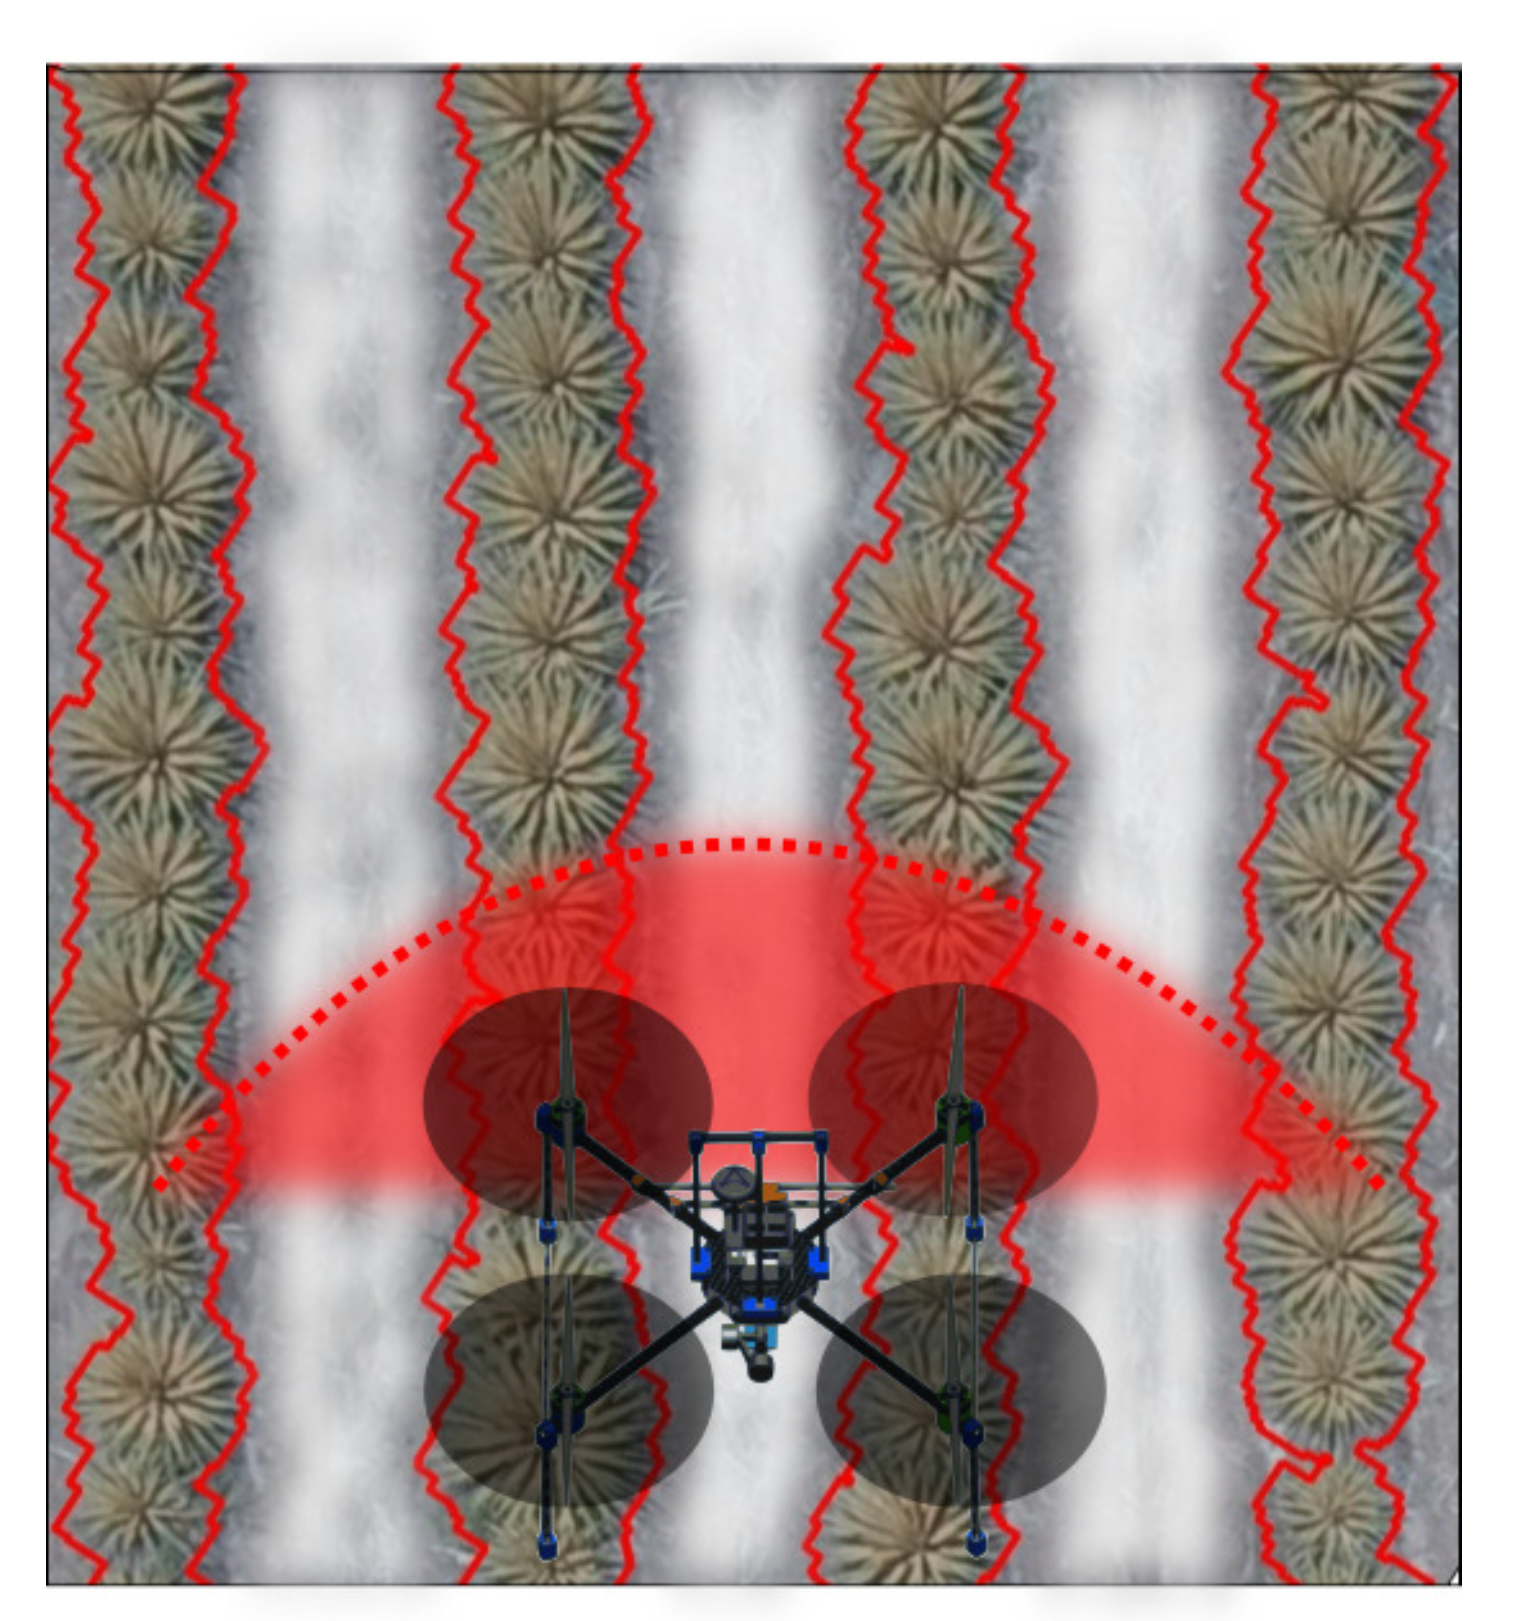
Figure 3. It is important to notice that the spaces between the furrows could be detected and followed. This information is important for navigation and can be rendered more accurate by using the GPS signal. The height can also be used to detect the lateral furrows, as shown in
Figure 4.
The detection of the plant can be extended to detect several furrows and thus be able to change from tracking one furrow to another in a more natural way. To achieve this, the height of the flight must be increased so that three rows are fully detected. A criterion for detecting the edges of the plants was used, as shown in
Figure 4.
2.3. Aerial Platform
Given the aim of the project, there does not exist a commercial platform that has enough sensors to correctly perform the required monitoring task. Therefore, a platform was designed to carry out the surveillance objective. The vehicle had the required sensors for navigation and tracking of furrows, as well as for detecting and counting.
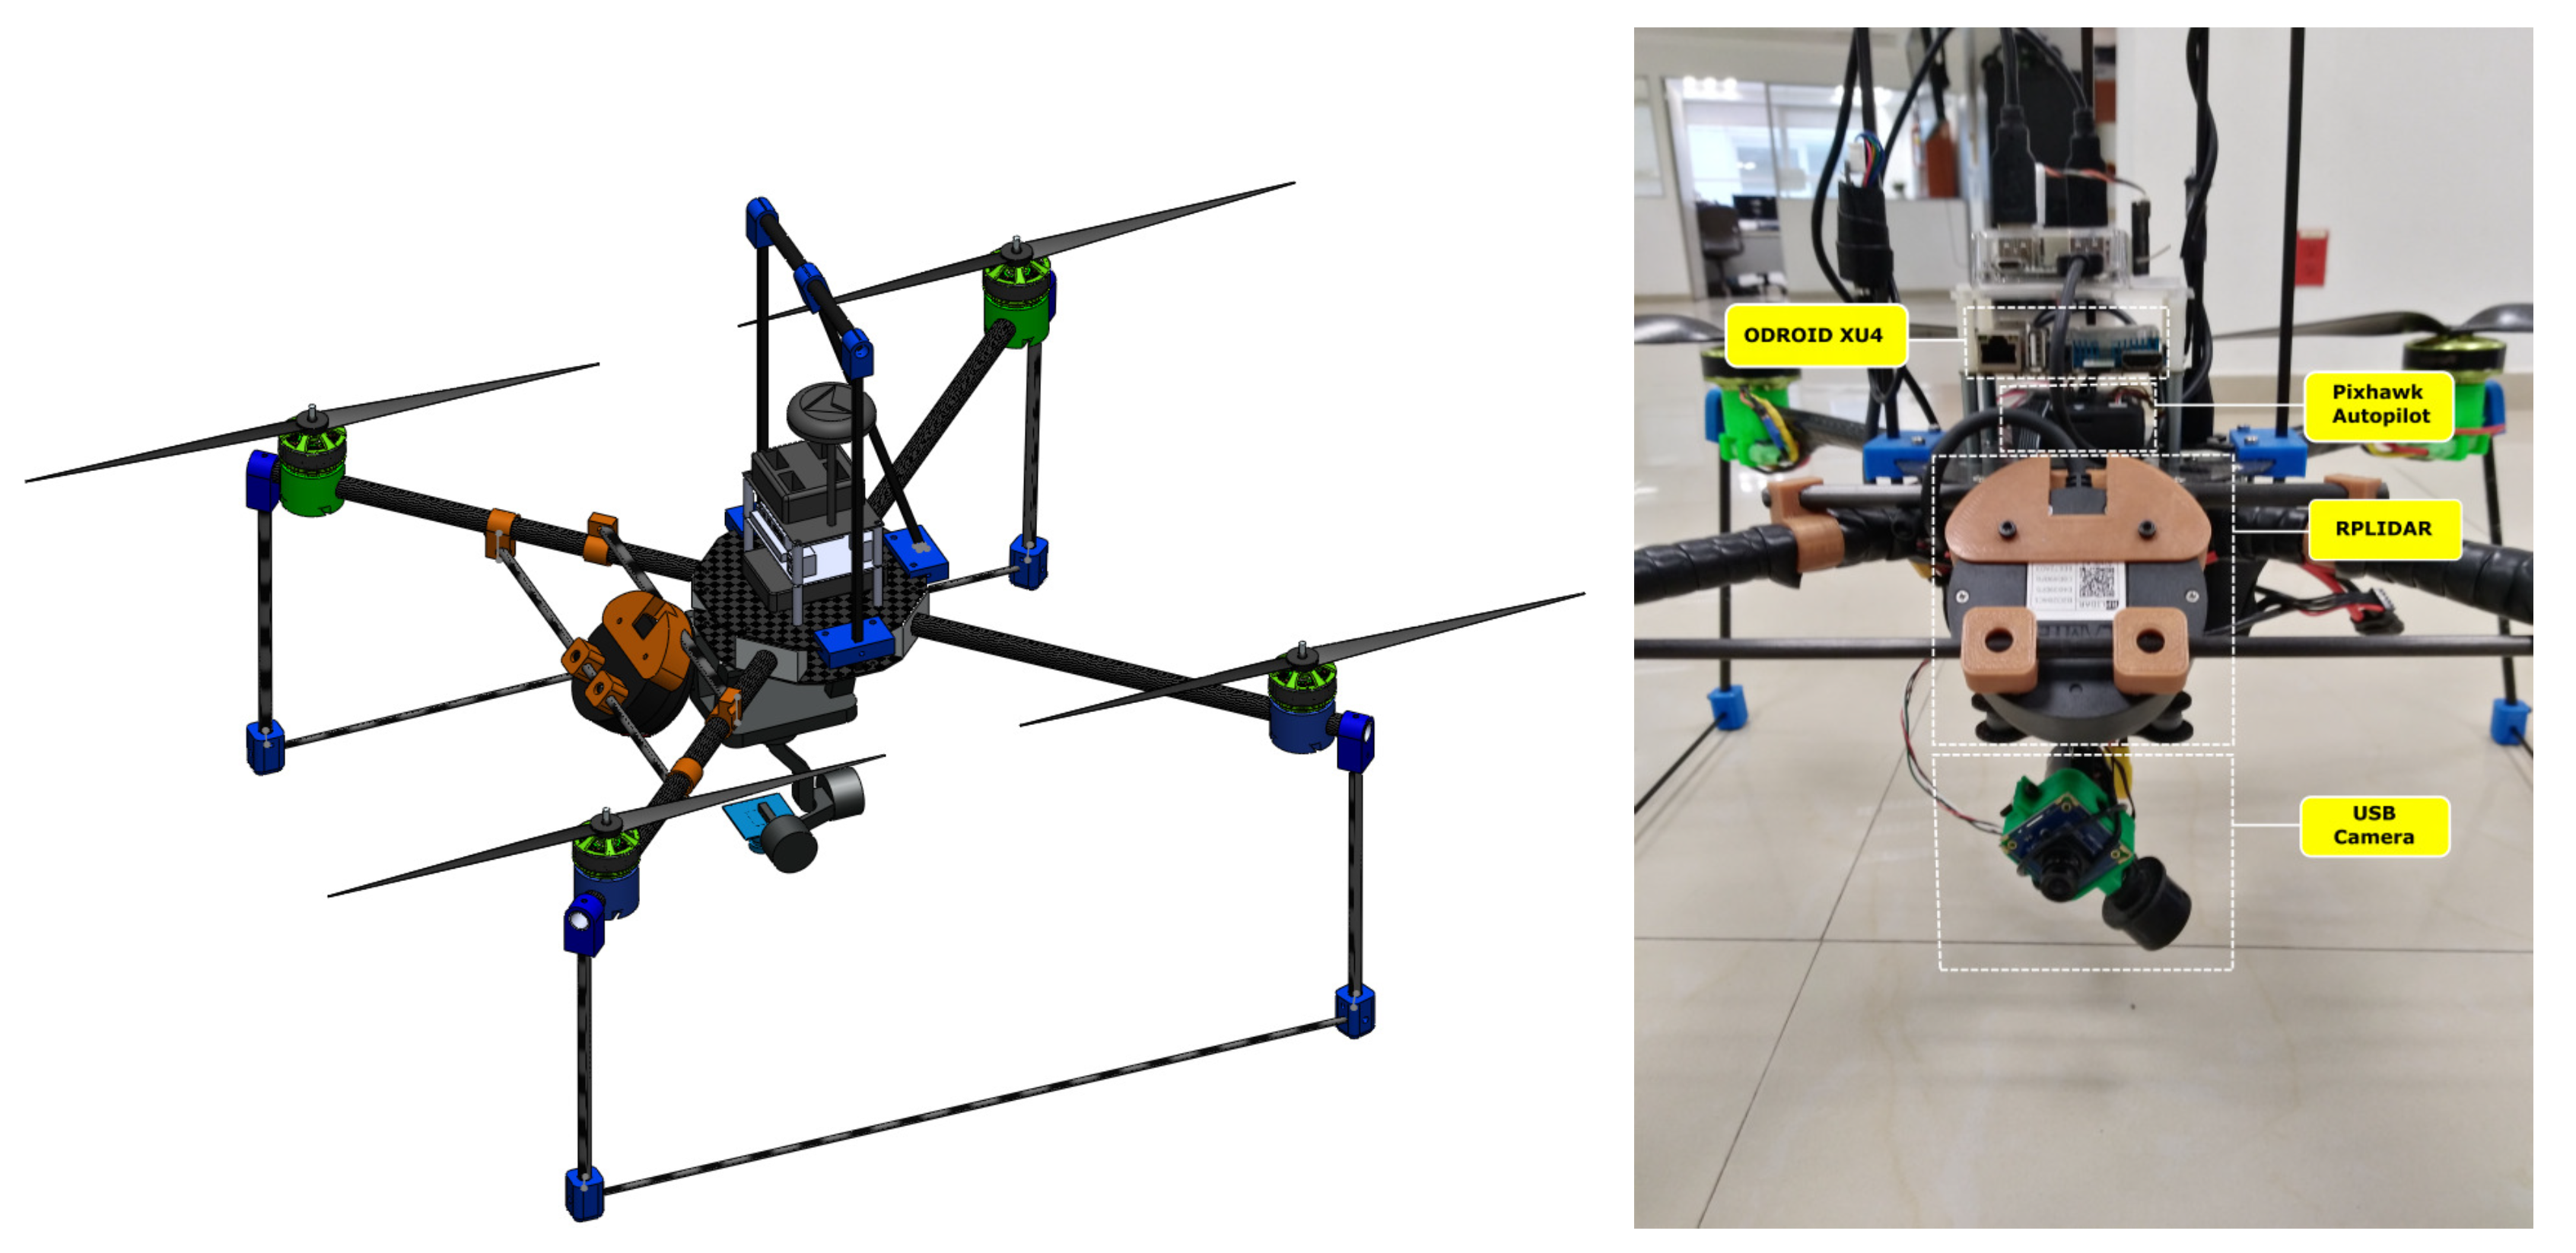
The experimental platform consisted of a multirotor in X configuration formed by a structure of carbon fiber of 50 cm long and 50 cm wide. The frame was driven by four brushless motors of 340 kV with propellers of 30 cm of carbon fiber. The Pixhawk autopilot with GPS was used for the stabilization of the aircraft (
Figure 5). An embedded computer was used to process the heaviest data with a free licensed operating system. In order to have more flexibility, the system included OpenCV libraries of image processing and the ROS robotic communication system, which performed communication and transmission of data between sensors and actuators.
The platform was equipped with several sensors; a rotary laser sensor RPLidar A2 was installed in the front, and a USBFHD01M USB camera mounted on a 3-axis gimbal was installed underneath the UAV. The prototype was equipped with a powerful computer, which had an Odroid XU4 with 4 Gb of RAM. A Lipo battery from 4 s to 5000 mA powered the platform. The entire system had a weight of 3.5 kg; an overview of the system is presented in
Figure 5.
The position of each sensor depends on the function it will perform. The RPLidar sensor was placed in the front so that potential obstacles could be detected. Furthermore, this sensor was tailed
to detect also obstacles under the drone. It can also be used to detect borders when performing low altitude flights. Underneath, the platform had a camera mounted in a 3-axis gimbal to cover all the area under the drone to detect the largest number of objects covering the most significant amount of area. The sensor’s position can be seen in
Figure 5.
2.4. Convolutional Neural Network
Deep learning has been recently applied to achieve object detection. In the area of machine learning, Convolutional Neural Networks (CNNs) are being used in computer vision since they can be employed for learning patterns and textures. CNN achieves these features by computing a convolution over a set of images. The patterns’ information is extracted by hidden layers formed by the convolutional and pooling layers. The last layers are then densely connected to perform the classification task. The size of the output depends on the number of classes involved. For this work, the CNN proposed was focused on a bi-class detection problem.
There are several approaches in deep learning such as R-CNN, Fast R-CNN, YOLO, etc., which solve the problem of “how” and “where” to search for the objects. Different kinds of windows are chosen to make the process faster and better when the view is complex, and when it is difficult to extract the information from the background. However, agave offers symmetric silhouettes from the top view. Thus, as will be seen in the next section, it could be useful to separate the agave plants’ background to make the detection process more precise.
2.4.1. Haar Cascade Classifier
The Haar cascade classifier is an object detection algorithm based on the concept of features called Haar-like features proposed by Viola and Jones. The Haar-like feature considers rectangular regions in a window, then sums the pixel intensities in each region, and calculates the difference between these sums.
This difference is then used to categorize subsections of an image. Let us consider an image database with human faces. The position of these rectangles is defined with respect to a detection window that acts like a bounding box to the target object. This algorithm is a machine learning based approach where a cascade function is trained from a large set of positive and negative images. The algorithm has four stages:
- 1.
Haar feature selection
- 2.
Creating integral images
- 3.
AdaBoost training
- 4.
Cascading classifiers
The training was performed with the tools provided by the OpenCV libraries for the generation of the file, which will be used by the detection program. Notice that pre-marking was done so that the objective was specified in every image. This was done for all the positive images that will be used. Samples of the marked images were created and then included as a training parameter along with the negative images; 20 training stages were enough for 2000 samples. The detection process can be manually tuned by a scaled factor once the image is obtained, and the best value for this example of agave detection was found to be 1.1.
2.4.2. CNN Architecture Proposed
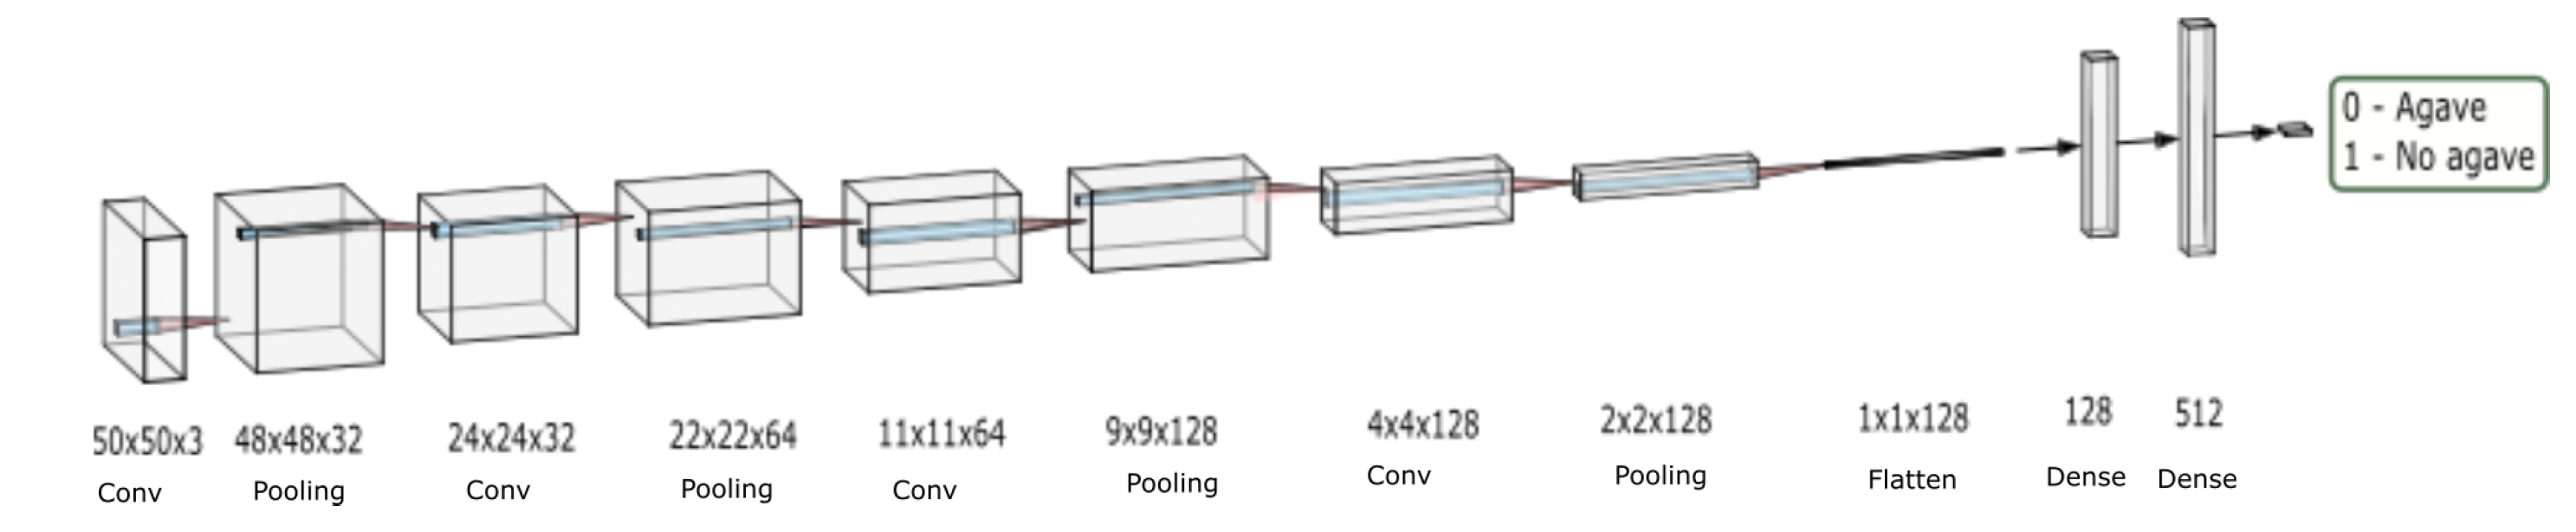
The CNN architecture was formed by four convolutional layers and four pooling layers. These layers are interspersed with each other, followed by a flatten layer and two dense layers. A scheme of the architecture is shown in
Figure 6. Two classes are considered for training: “agave” and “no agave”, according to the dataset. With the created dataset, the training stage in the proposed architecture achieved 95% accuracy in training and 93% in the validation process.
2.4.3. Metrics
To measure detection performance and compare both methods, it is necessary to calculate the following metrics:
where
TP is the number of True Positive detections i.e., detections where a plant was detected and indeed corresponded to a real plant; FP is the number of False Positives, i.e., detections where a plant was detected but did not correspond to a plant; and
FN corresponds to the number of real plants that were omitted as detections. “Precision”, “Recall”, and “
” are the most common metrics to measure the effectiveness of visual detection algorithms. “Precision” or PPV (Positive Predicted Value) (Equation (
1)) measures the percentage of the correct detections. “Recall” or TPR (True Positive Rate) (Equation (
2)) measures the sensibility from the entire positive class, including true and false; the “Recall” shows the correct percentage. “
” (Equation (
3)) is a metric commonly used to measure the performance of the classifier in a general way since it combines “Precision” and “Recall”, and a high score will only be obtained if both the “Recall” and the “Precision” are high.
2.5. Detection Method
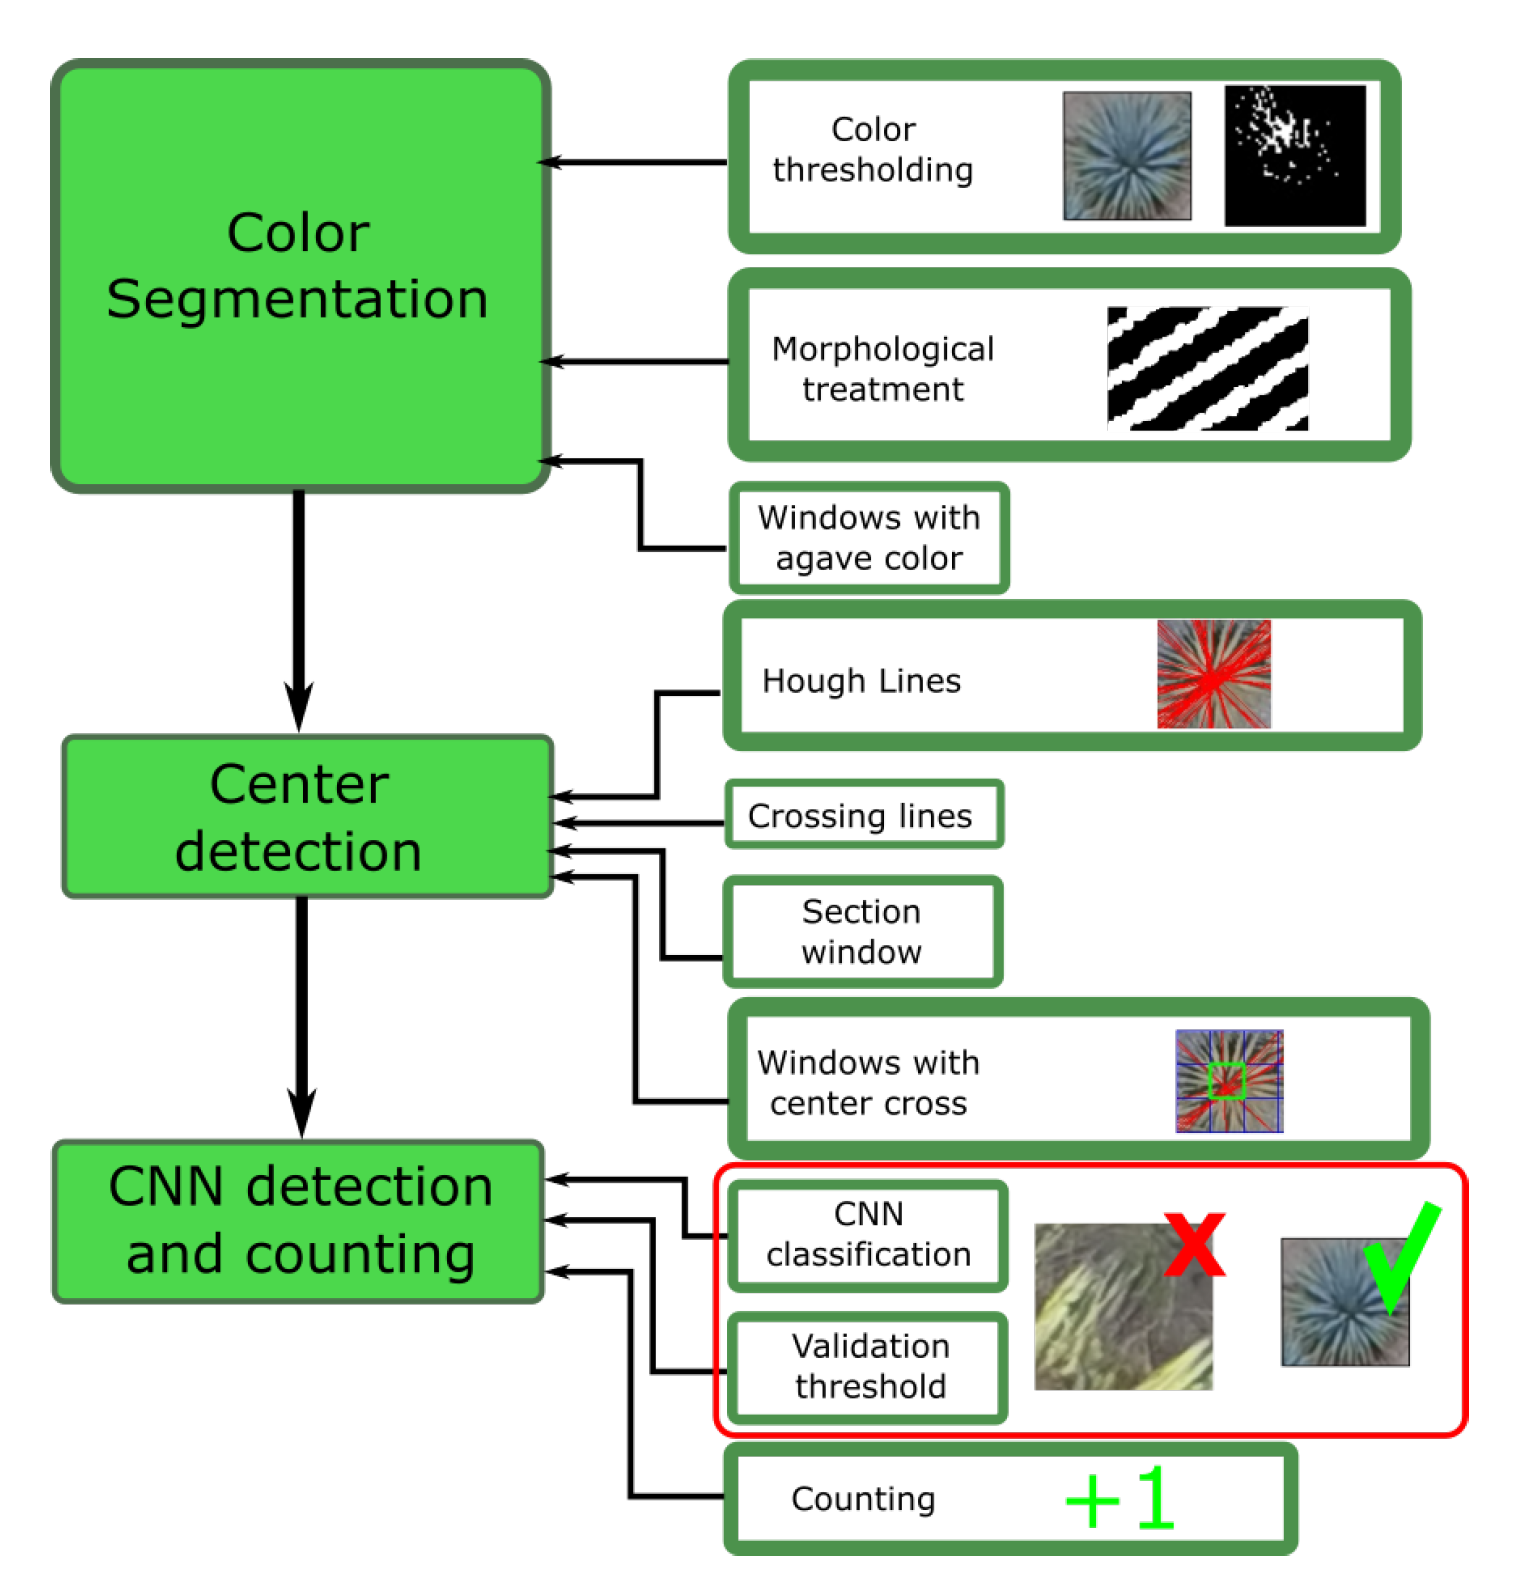
The detection method proposed in this work consists of three main stages that work sequentially. The output of one stage is the input of the next stage so that in the end, there is a count of the agave detected within an image. Each stage, in turn, has threads that help the stage be carried out correctly. A general outline of this method can be seen in
Figure 7.
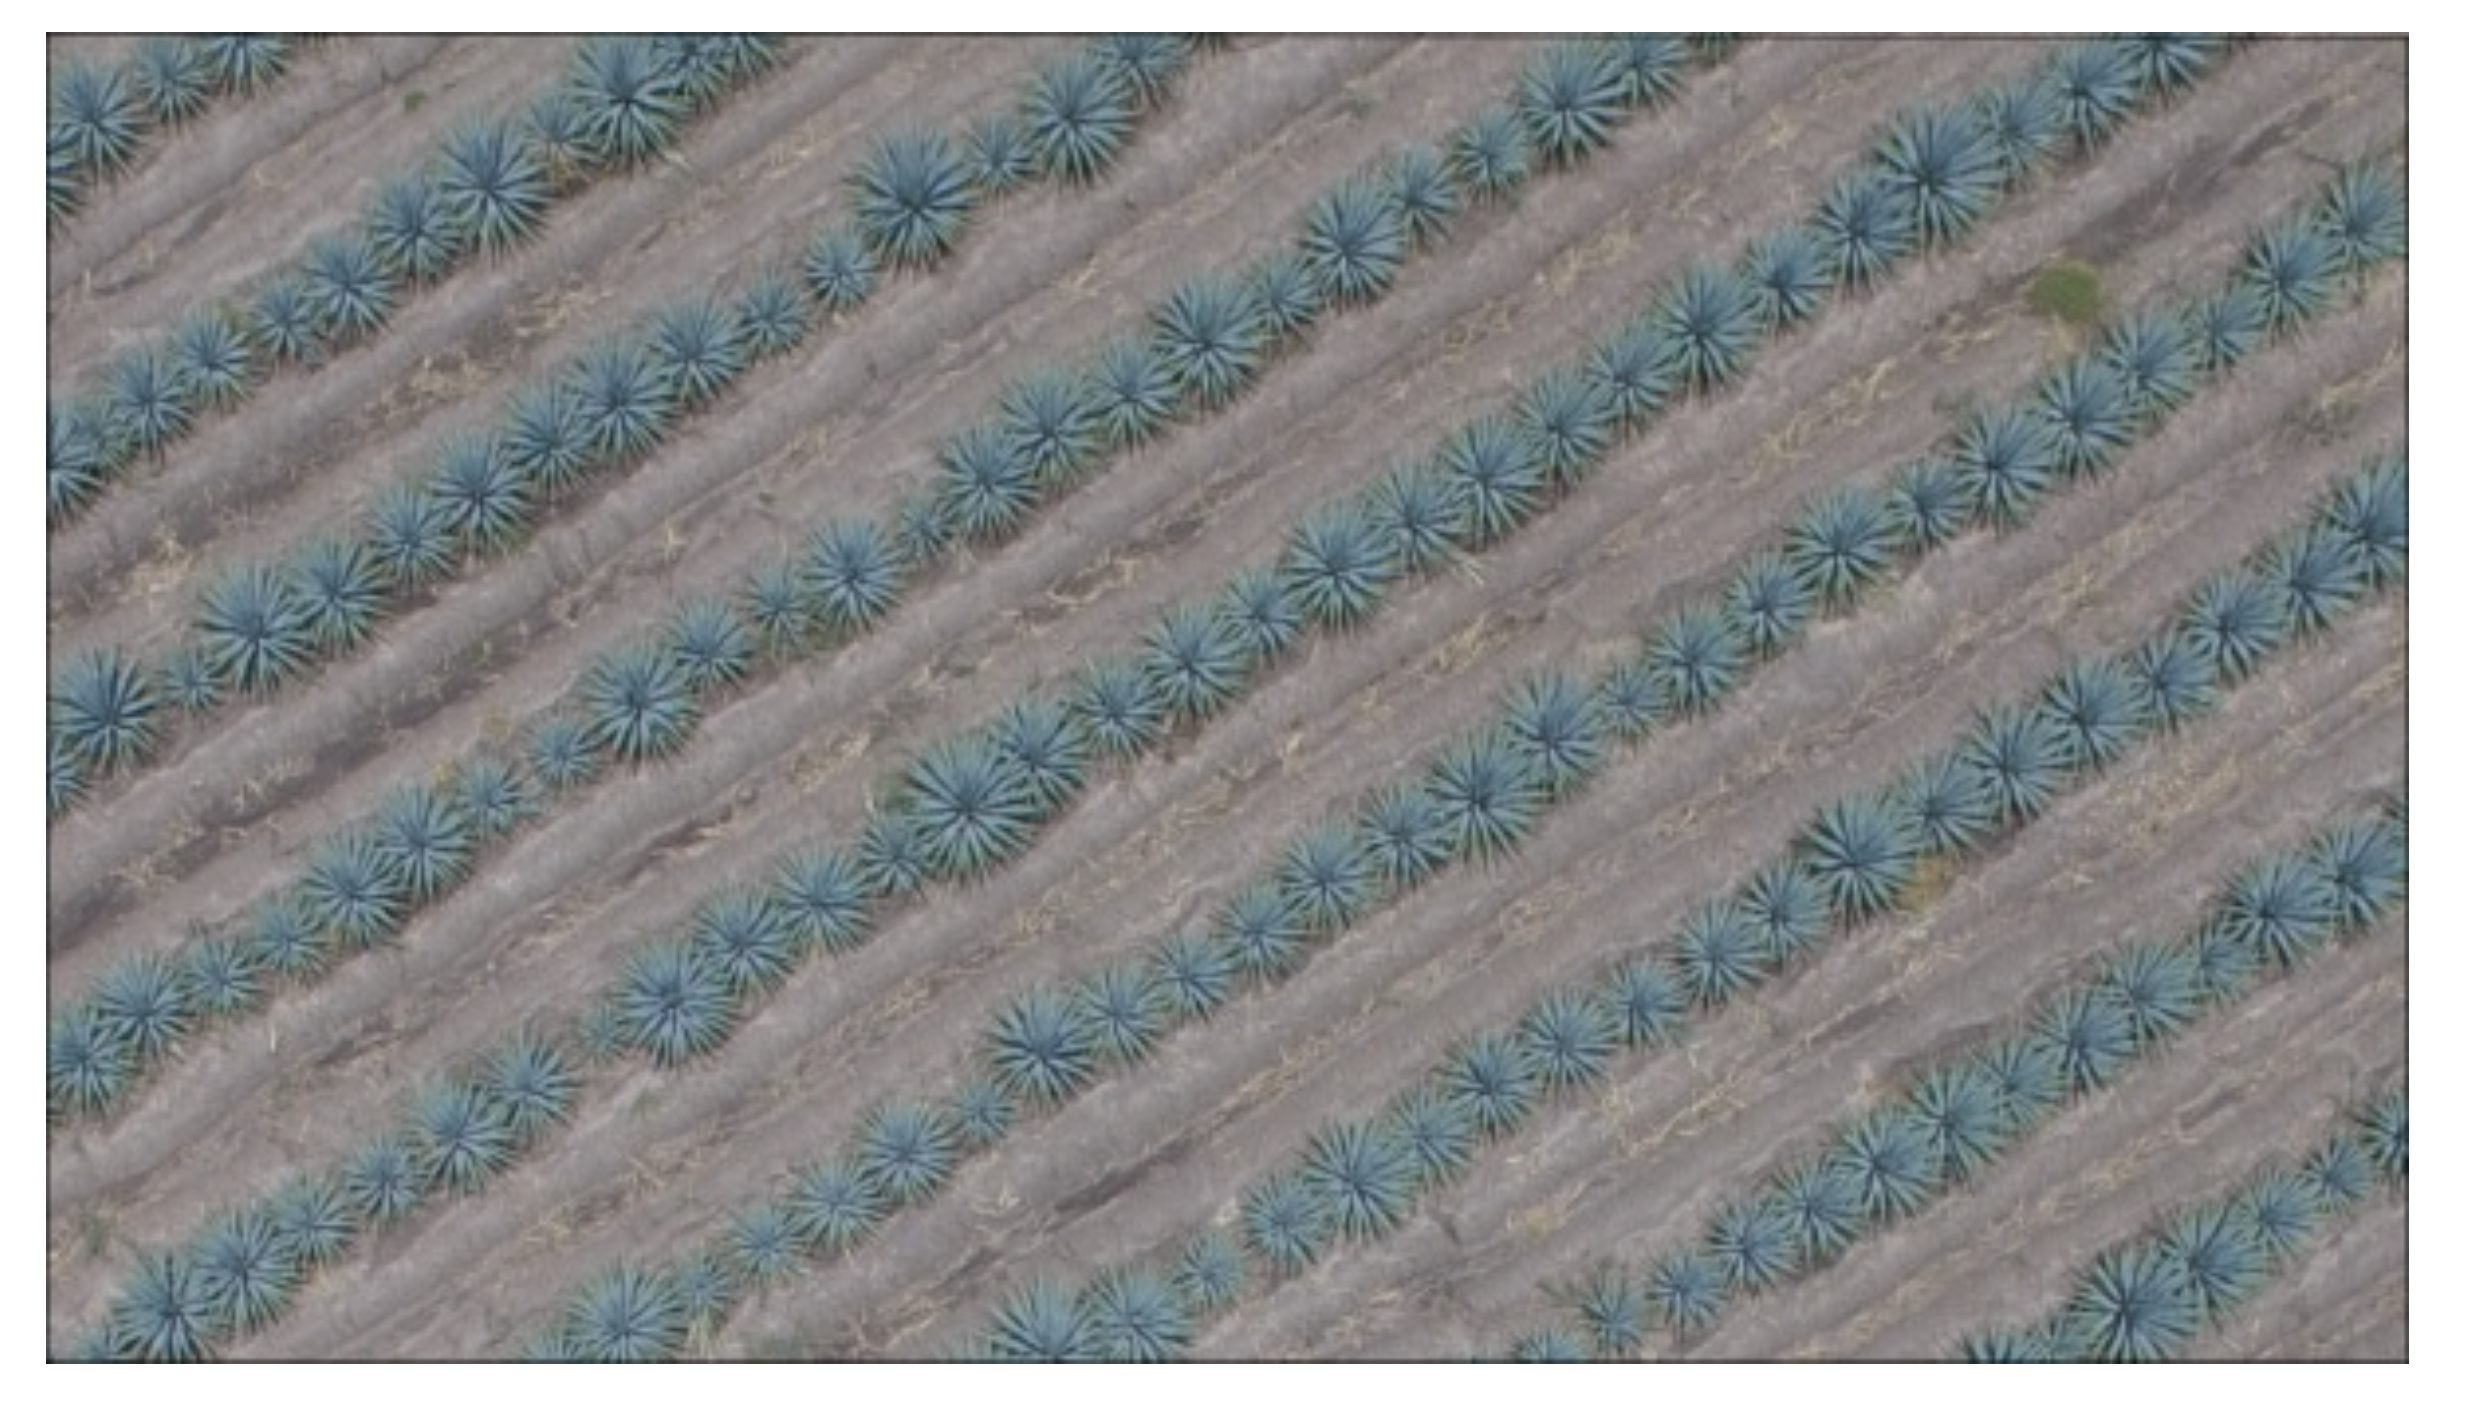
It should be mentioned that the proposed method is focused on the detection of agave using the information on the shape and the graphic properties of this plant.
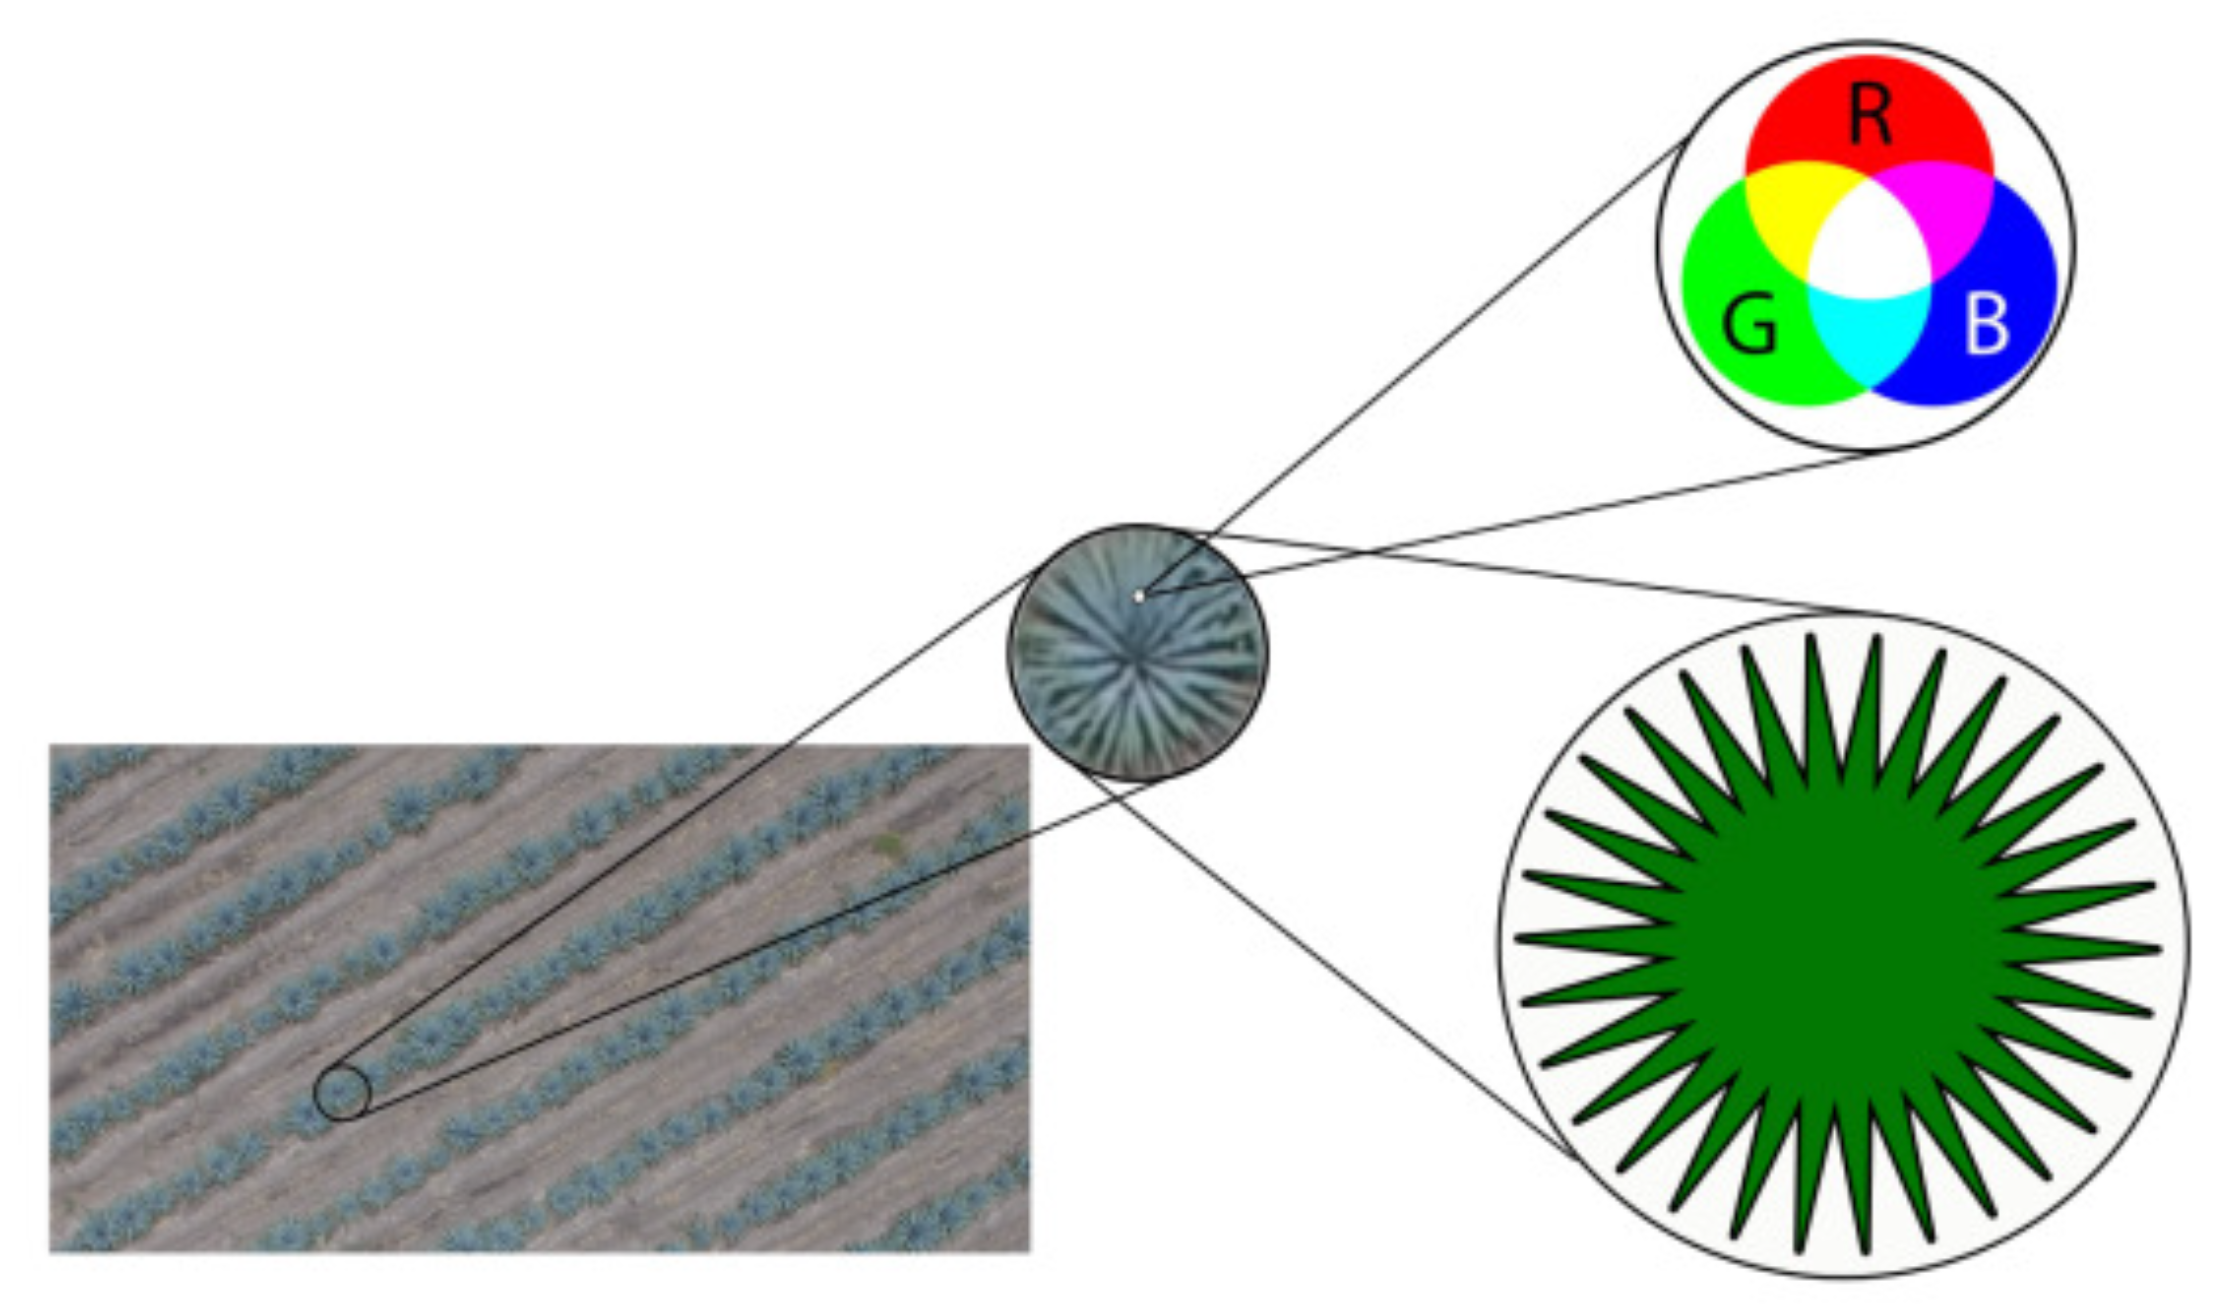
Figure 8 shows an aerial shot, which will be used to achieve an accurate detection.
2.5.1. Color Segmentation
The first phase of this method is responsible for segmenting, within the image, the areas where agave plants could be located by searching for their color value in the RGB format. For this purpose, the first thing that is done is to carry out a thresholding process to be able to cover the different shades of color of the stalks that this specific plant presents. The thresholding values are in
Table 1:
Then, it searches in the image for the pixels that match these values, and the pixels that correspond to the color of the agave leaves are obtained. The next step is to transform it into a binary format to obtain a better visualization. The resulting image contains the agave leaves in white and everything else in black.
This binary image shows the shape of each agave that is used for the next stage. However, first, we use the binary image to segment the agave area and transform it into a windows format to identify individual plants. To do this, the first step is to apply morphological image treatment to the binary image. With this process, we get a better view from the area of interest, and we can set the location for a window. We define a window of 50 × 50 pixels, and we slide it along the entire image, then we save the windows, which contain a large part of the agave area inside. We chose this size because it fit only one single plant.
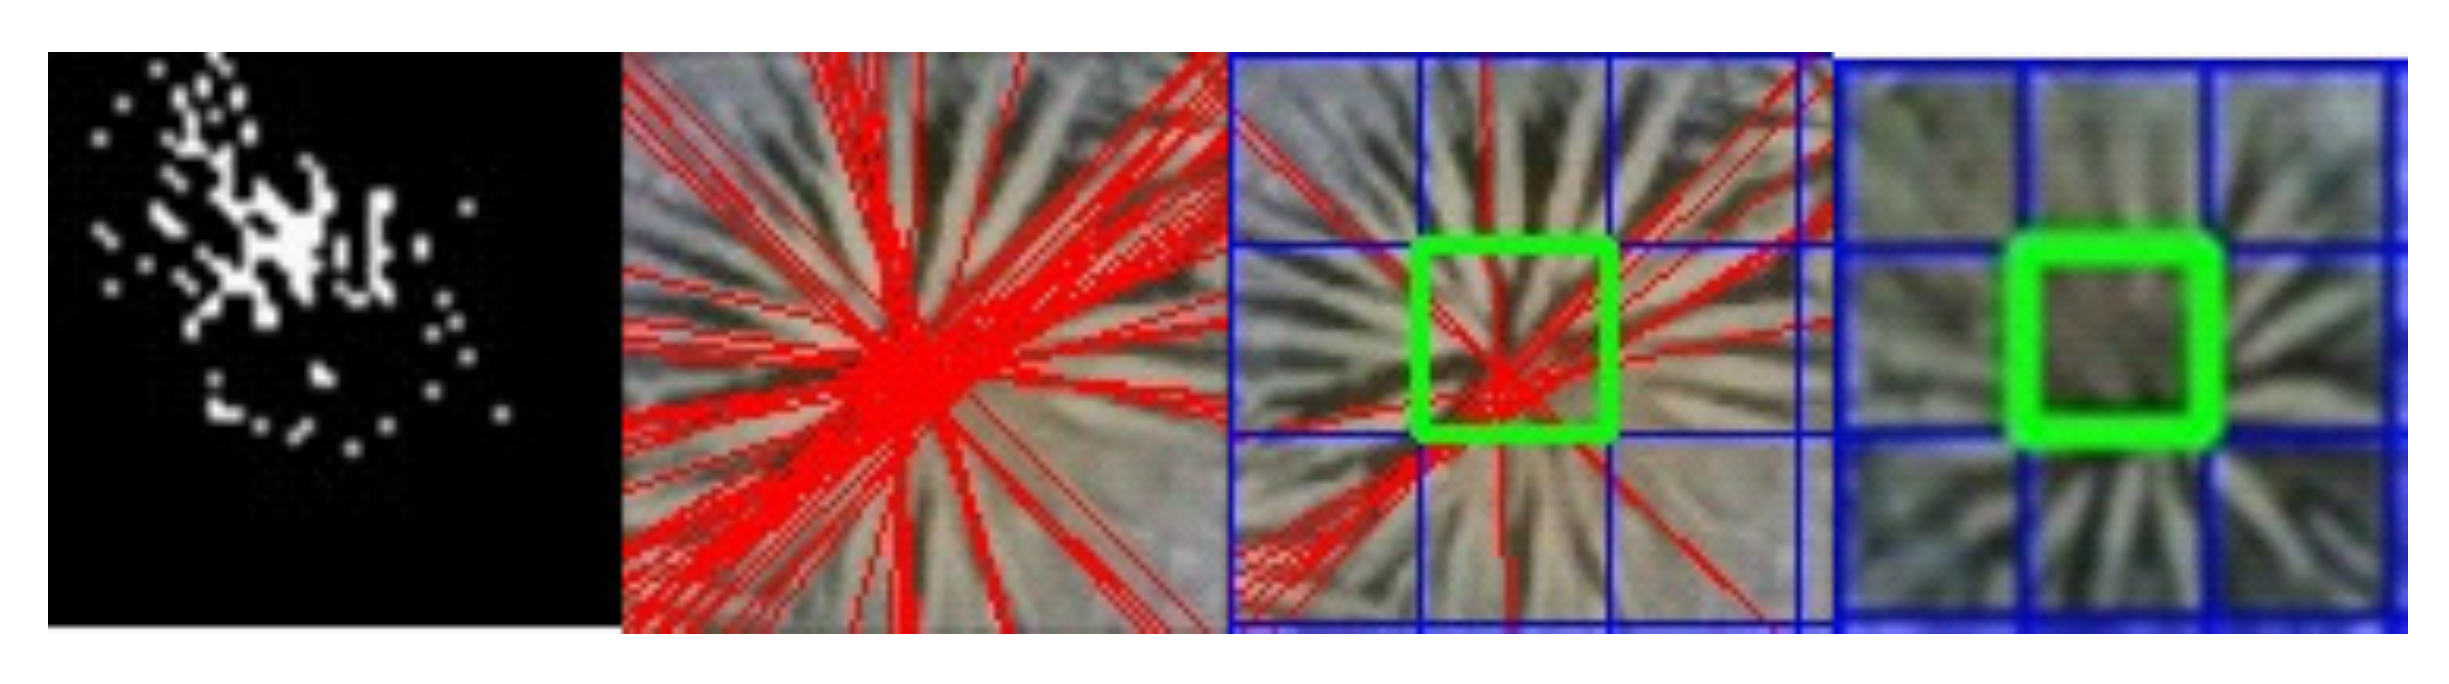
2.5.2. Center Detection
Once the size of the plant in pixels has been defined, the problem is reduced to differentiating plants individually. Therefore, this second phase takes advantage of the visual pattern presented by the top view of the agave to be able to separate them. This view provides a shape similar to a star with multiple peaks, so we seek to find the particular graphic characteristics of this figure within the image, as was done with the RGB values’ part in the previous step.
The particular features that are sought are the lines that form the leaves of the agave. These lines tend to cross in the center of the plant. Therefore, Hough line detection is used for each of the windows from the previous step and applied to the binary image without dilation. Indeed, in this image, the lines that form the leaves are better appreciated, since, in the front, they are completely lost since the entire area is highlighted homogeneously.
There exist a minimum number of lines to be found in the window. If the window satisfies this requirement, it can be considered as a potential agave window. The next step is to divide the window into cells and calculate in which cell the lines overlap. In order to create a criterion to separate one agave plant from another one, it is considered that each plant has one core. This core corresponds to a zone where the lines overlap. Using this criterion, the windows having lines that overlap in the central cell are considered to be one “agave” window; see
Figure 9.
When obtaining the candidate windows, we are faced with the fact that several windows can fit the same plant, obtaining multiple detections from the same plant. This is due to the window size that was taken into account for the detection and justifies the choice of the size of 50 × 50 pixels. In order to avoid missing a plant, it was decided to take the most extensive possible measure that we could have. The last step of this stage consists of generating a heat map. A heat map has the same size as the original image, but each area’s weight is a function of the amount of overlapping in that area; this avoids detecting the same plant several times.
The heat map is created (
Figure 9), and the values are added up so that the brightest points correspond to the center area of the plant. From this point, a single window is created centered at the highlighted point. This is repeated for all the windows, and new candidate windows are obtained. These windows are the output of this stage and the input of the next stage.
2.5.3. Detection and Counting Using a CNN Technique
The windows obtained in the previous stage are then evaluated with the classifier to compute the probability that it belongs to the class called “agave”. If the probability is greater than 0.8, we consider that the window is an “agave” window. By performing the same procedure through all the candidate windows, we obtain the estimated number of plants corresponding to the number of windows.
This part is carried out because the detection phase of agave centers is susceptible to false detections. Indeed, since the detection is based on line crossing when the plants are too large, we could have also line crossing between the stalks of agave, which does not correspond to the plants’ center. This phase confirms that there is actually only a single plant per window.
Figure 10 shows one of the images tested for this work, and it corresponds to an area similar to that used to create the dataset. The picture contains around 130 plants that were counted manually to compare against the experimental result. It takes into account only 130 plants since that is the number of plants that is completely visible inside the image. The plants that are excluded on edges of the images are omitted.
3. Results
Experimental tests were carried out using sections of orthomosaics with a personal computer to show graphically how the agave detection and counting performed.
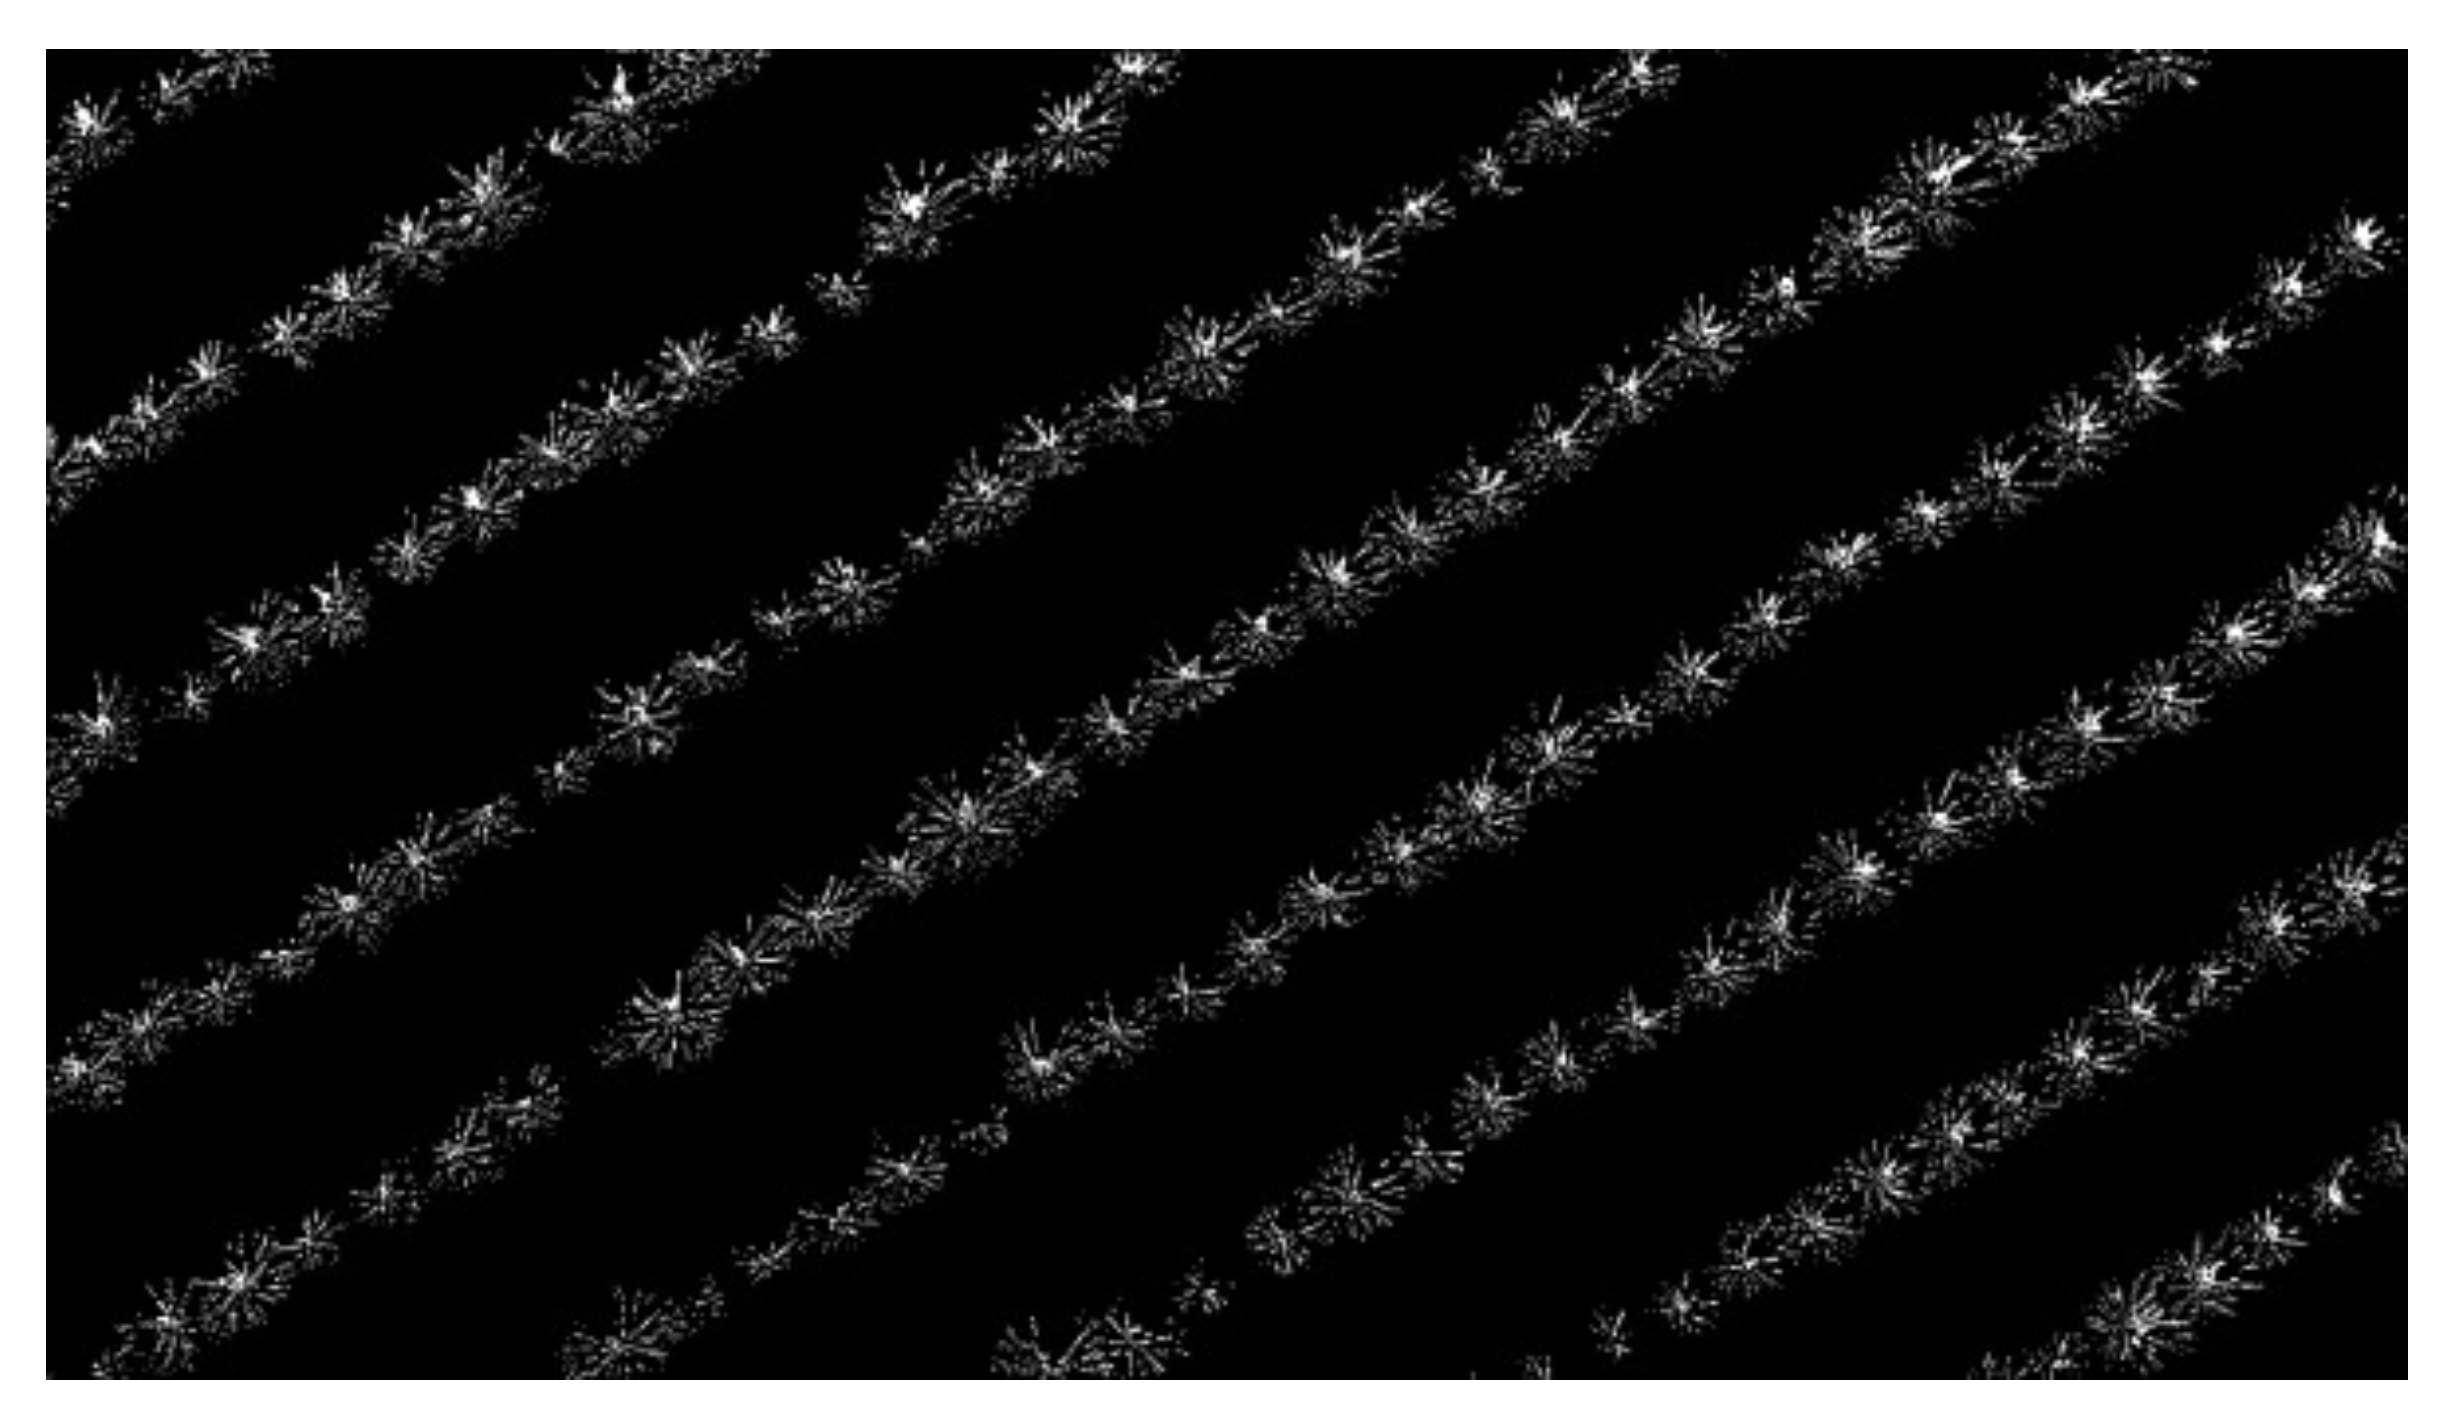
As a result of the first stage, a binary map of the test image was obtained (see
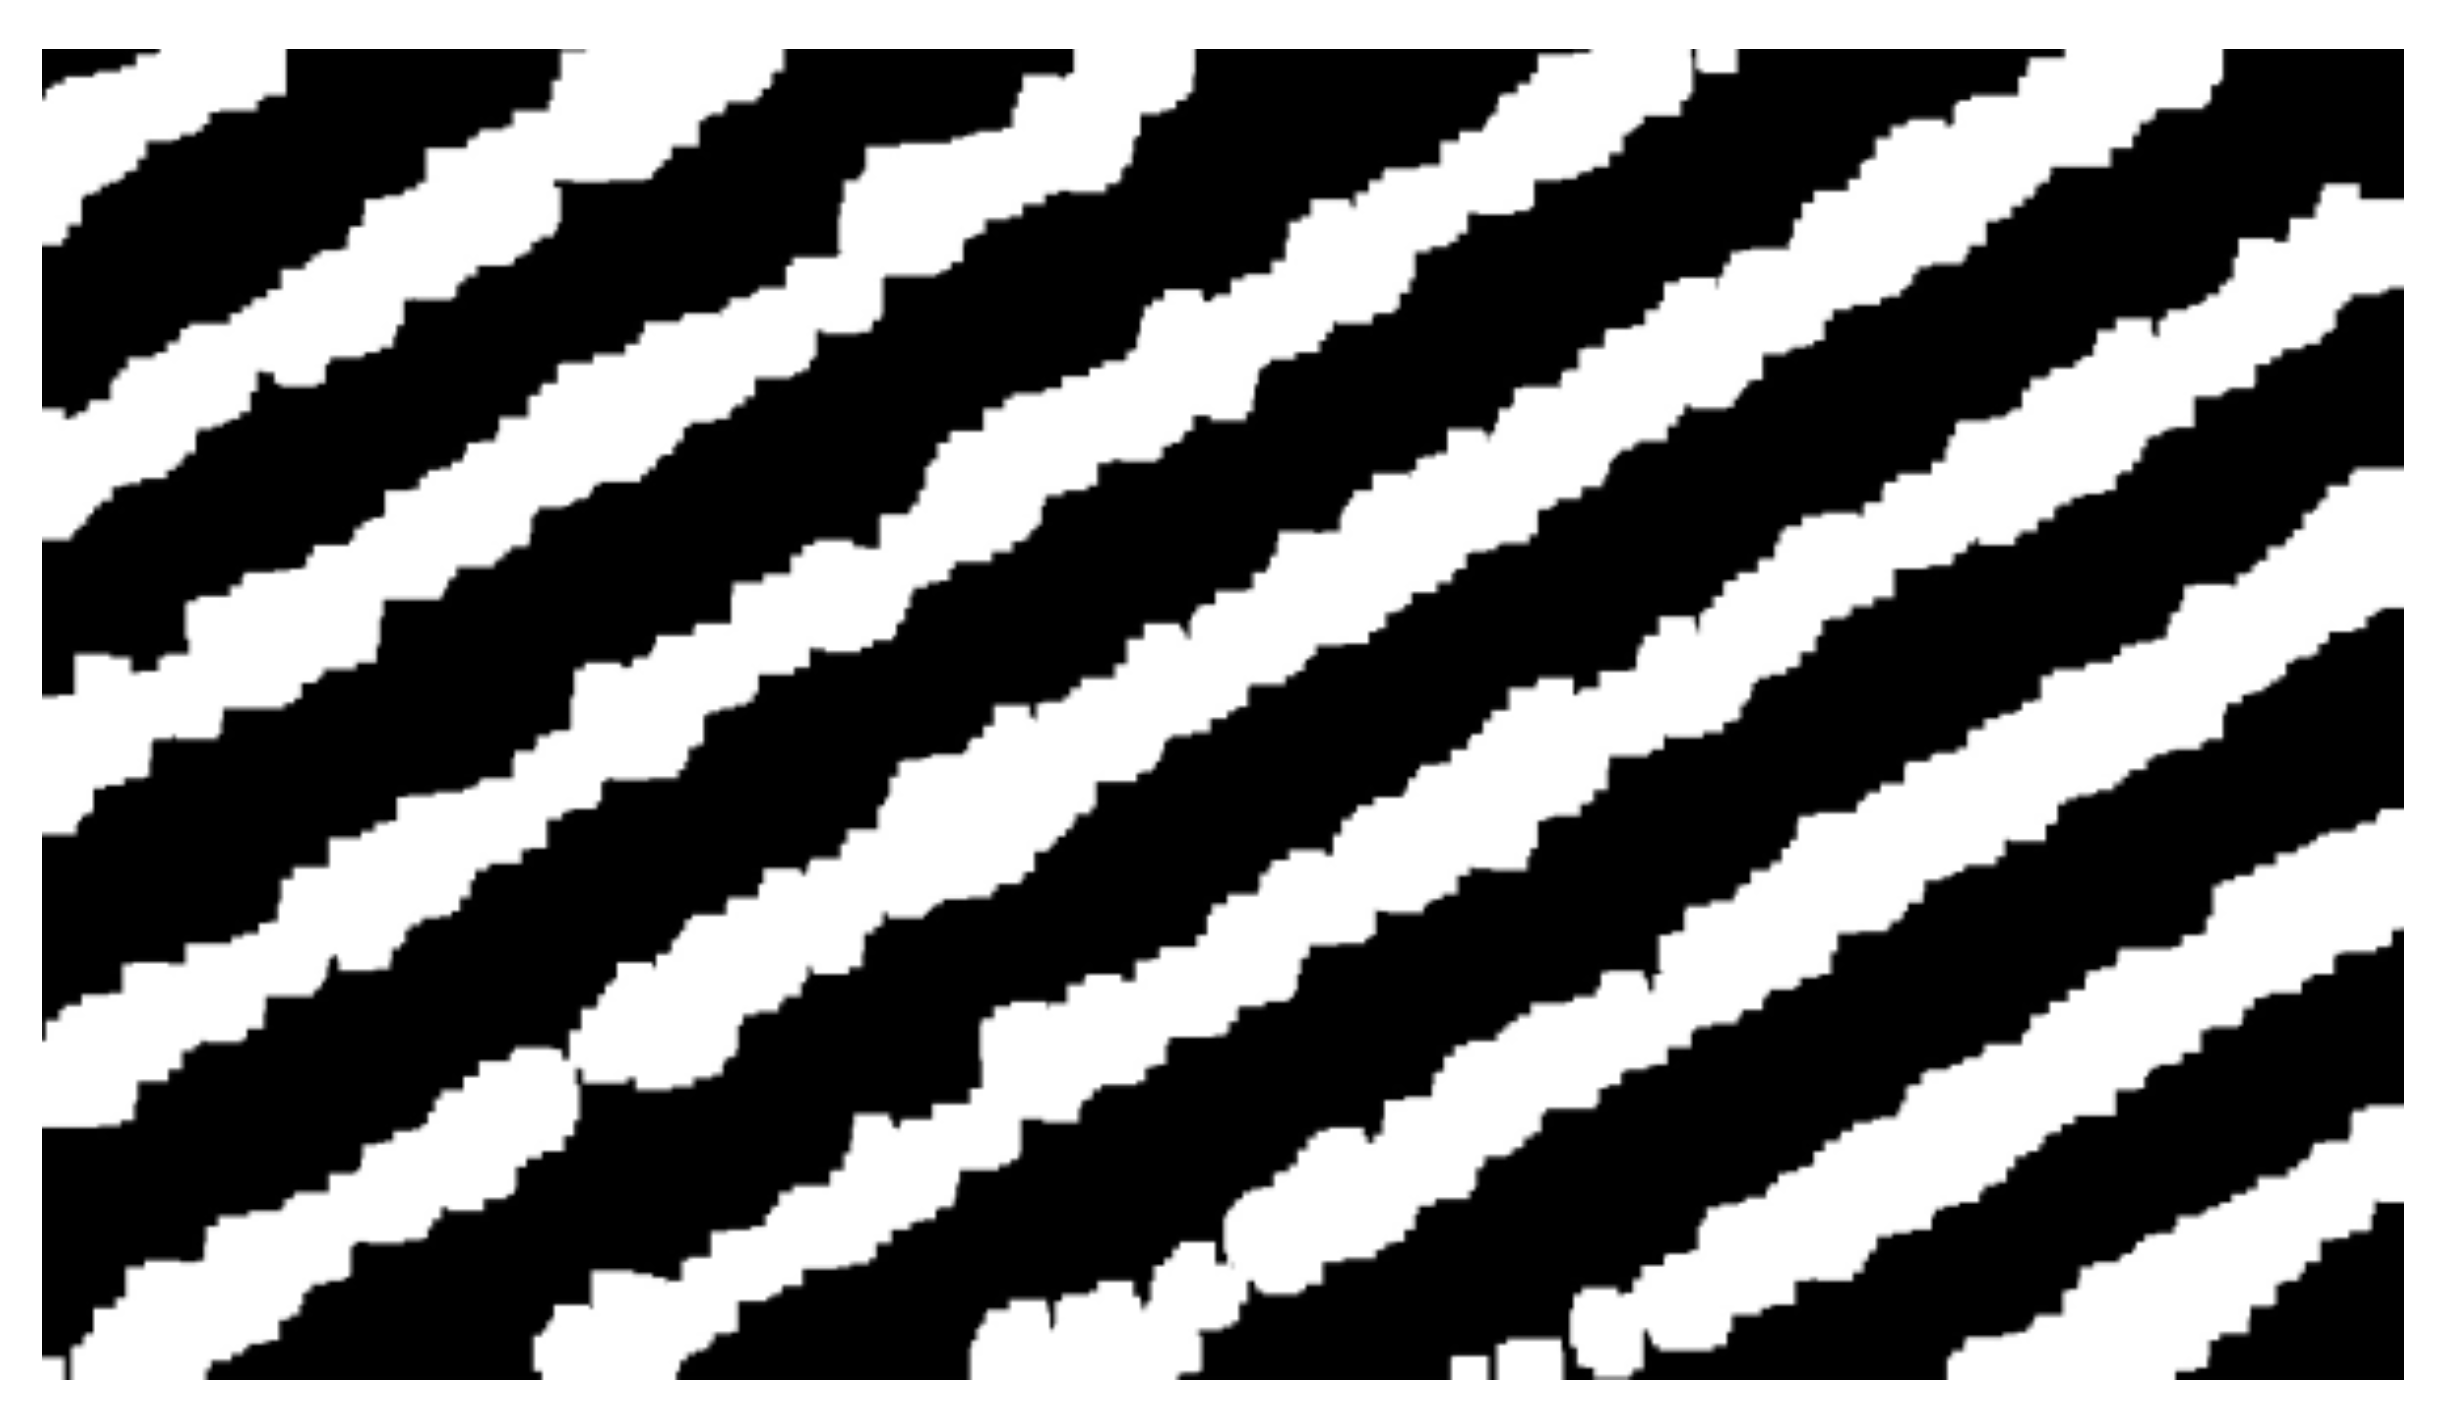
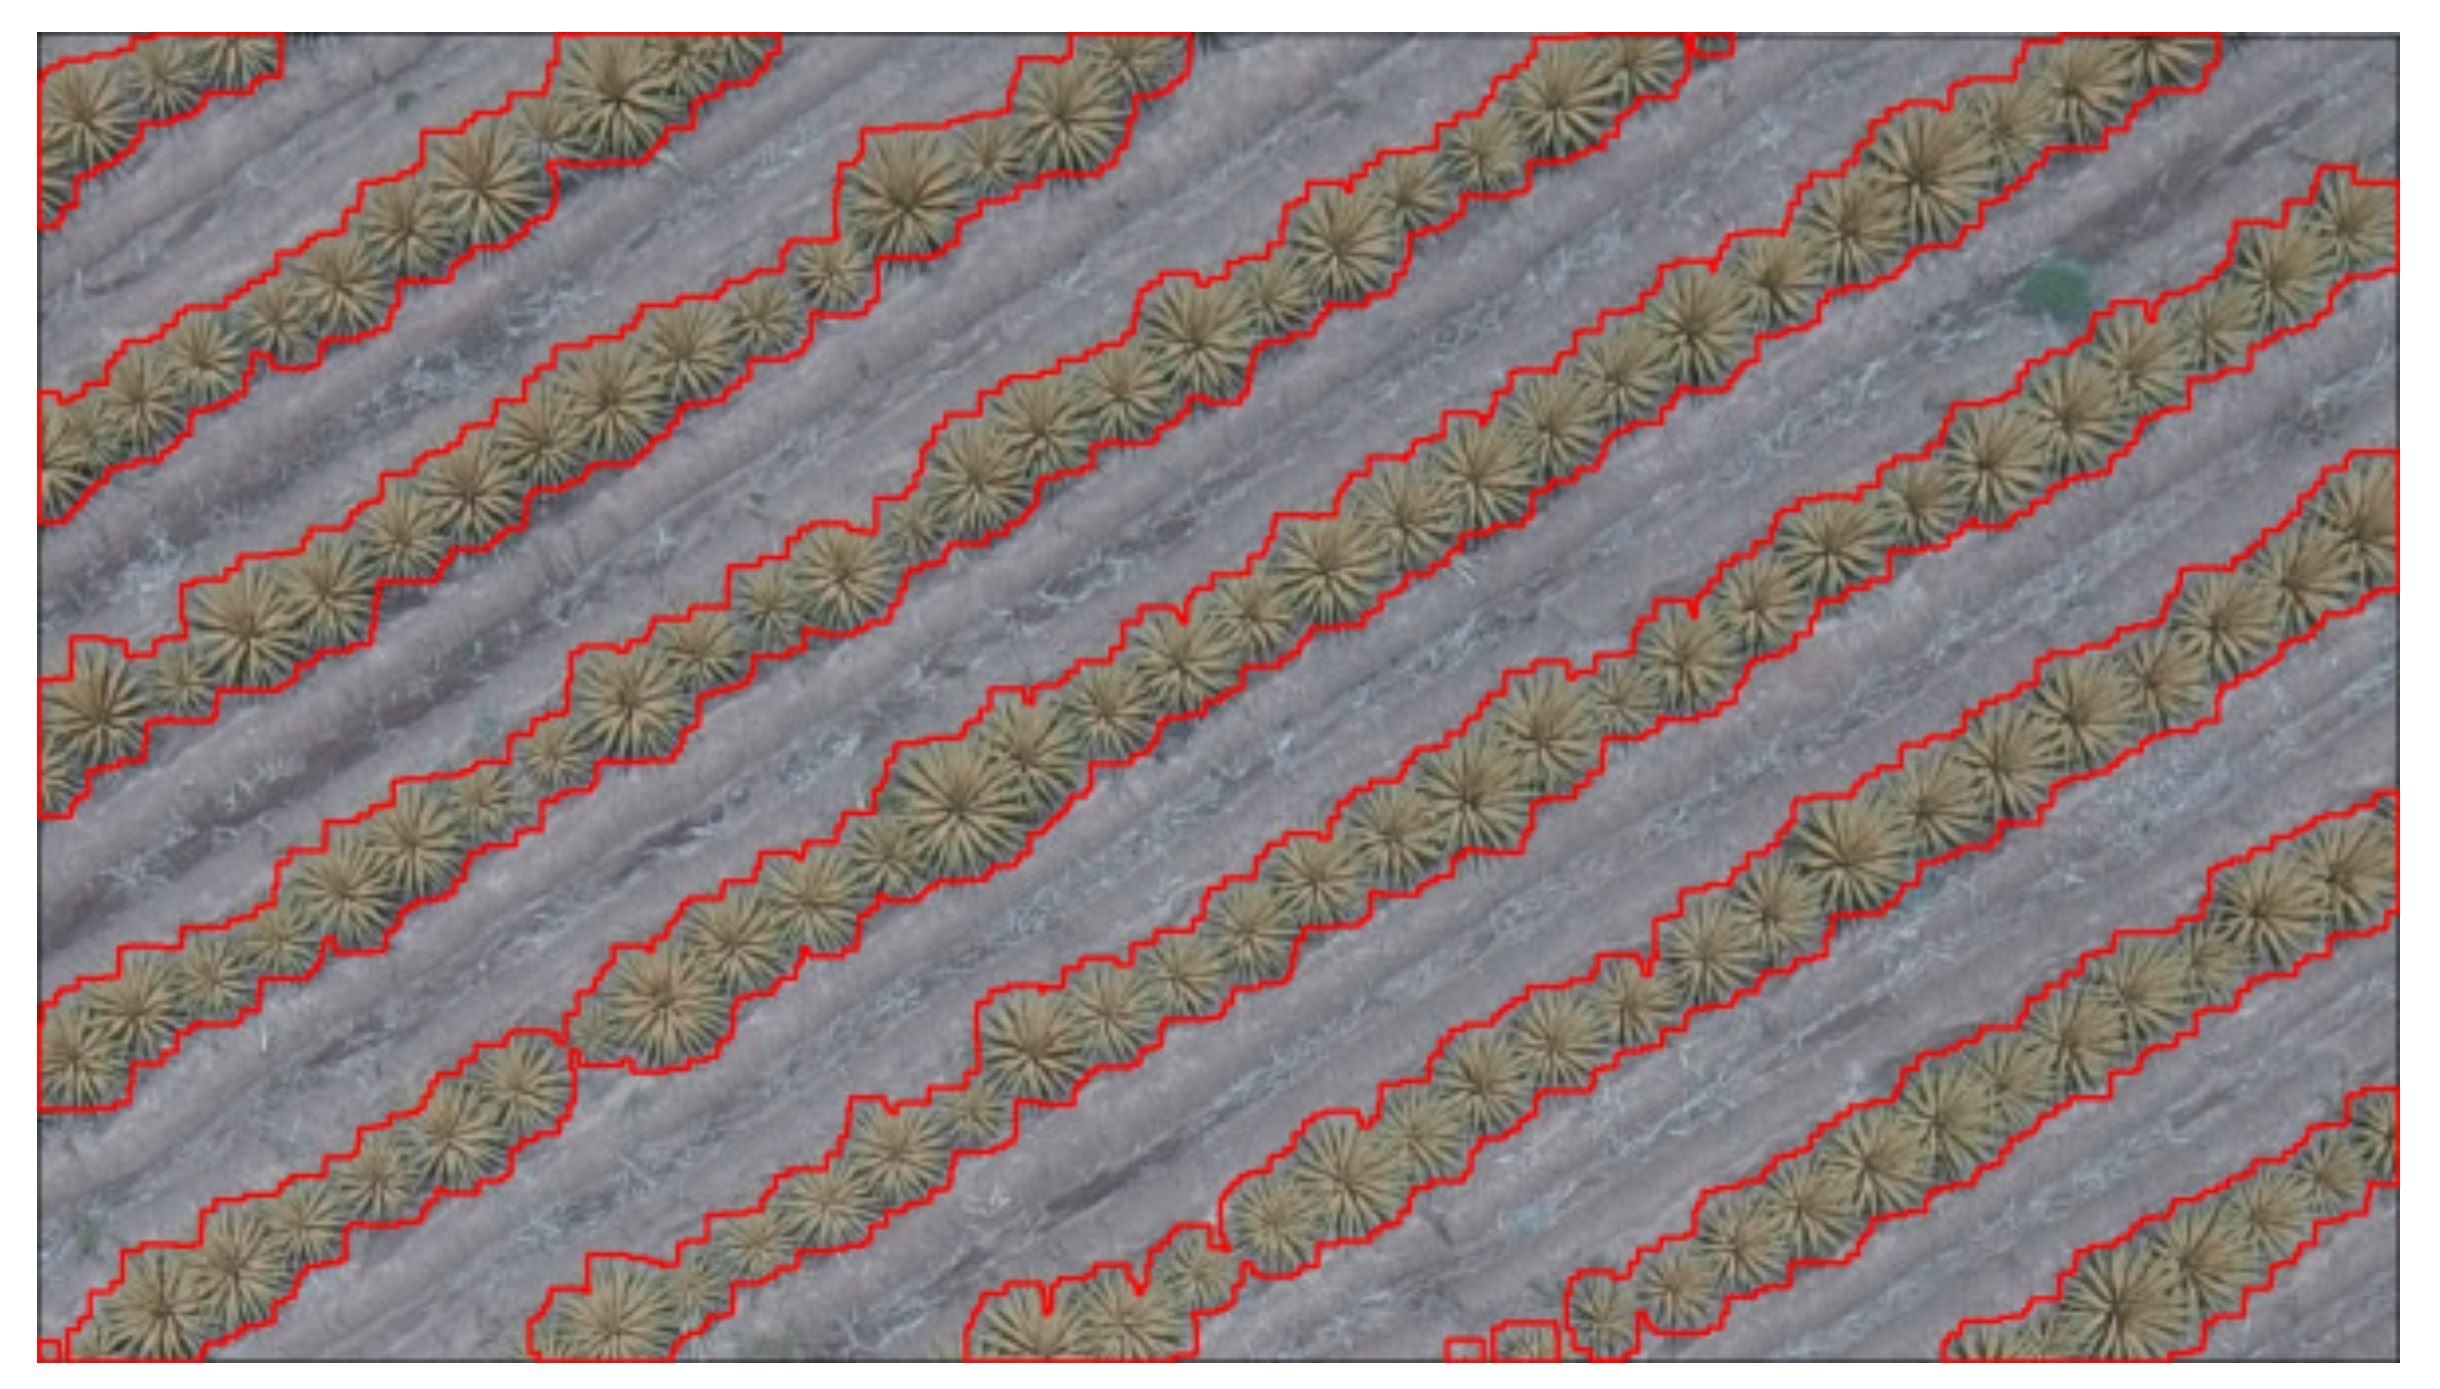
Figure 11). This result was used in the next steps of this stage and the center detection stage as well. The process continued by applying morphological treatment in order to mark the agave area. Then, applying three rounds of dilation on the binary image, the image shown in
Figure 12 was obtained, which corresponds to the agave area, and as can be seen in
Figure 13, the highlighted area fits correctly with the contour of the plants.
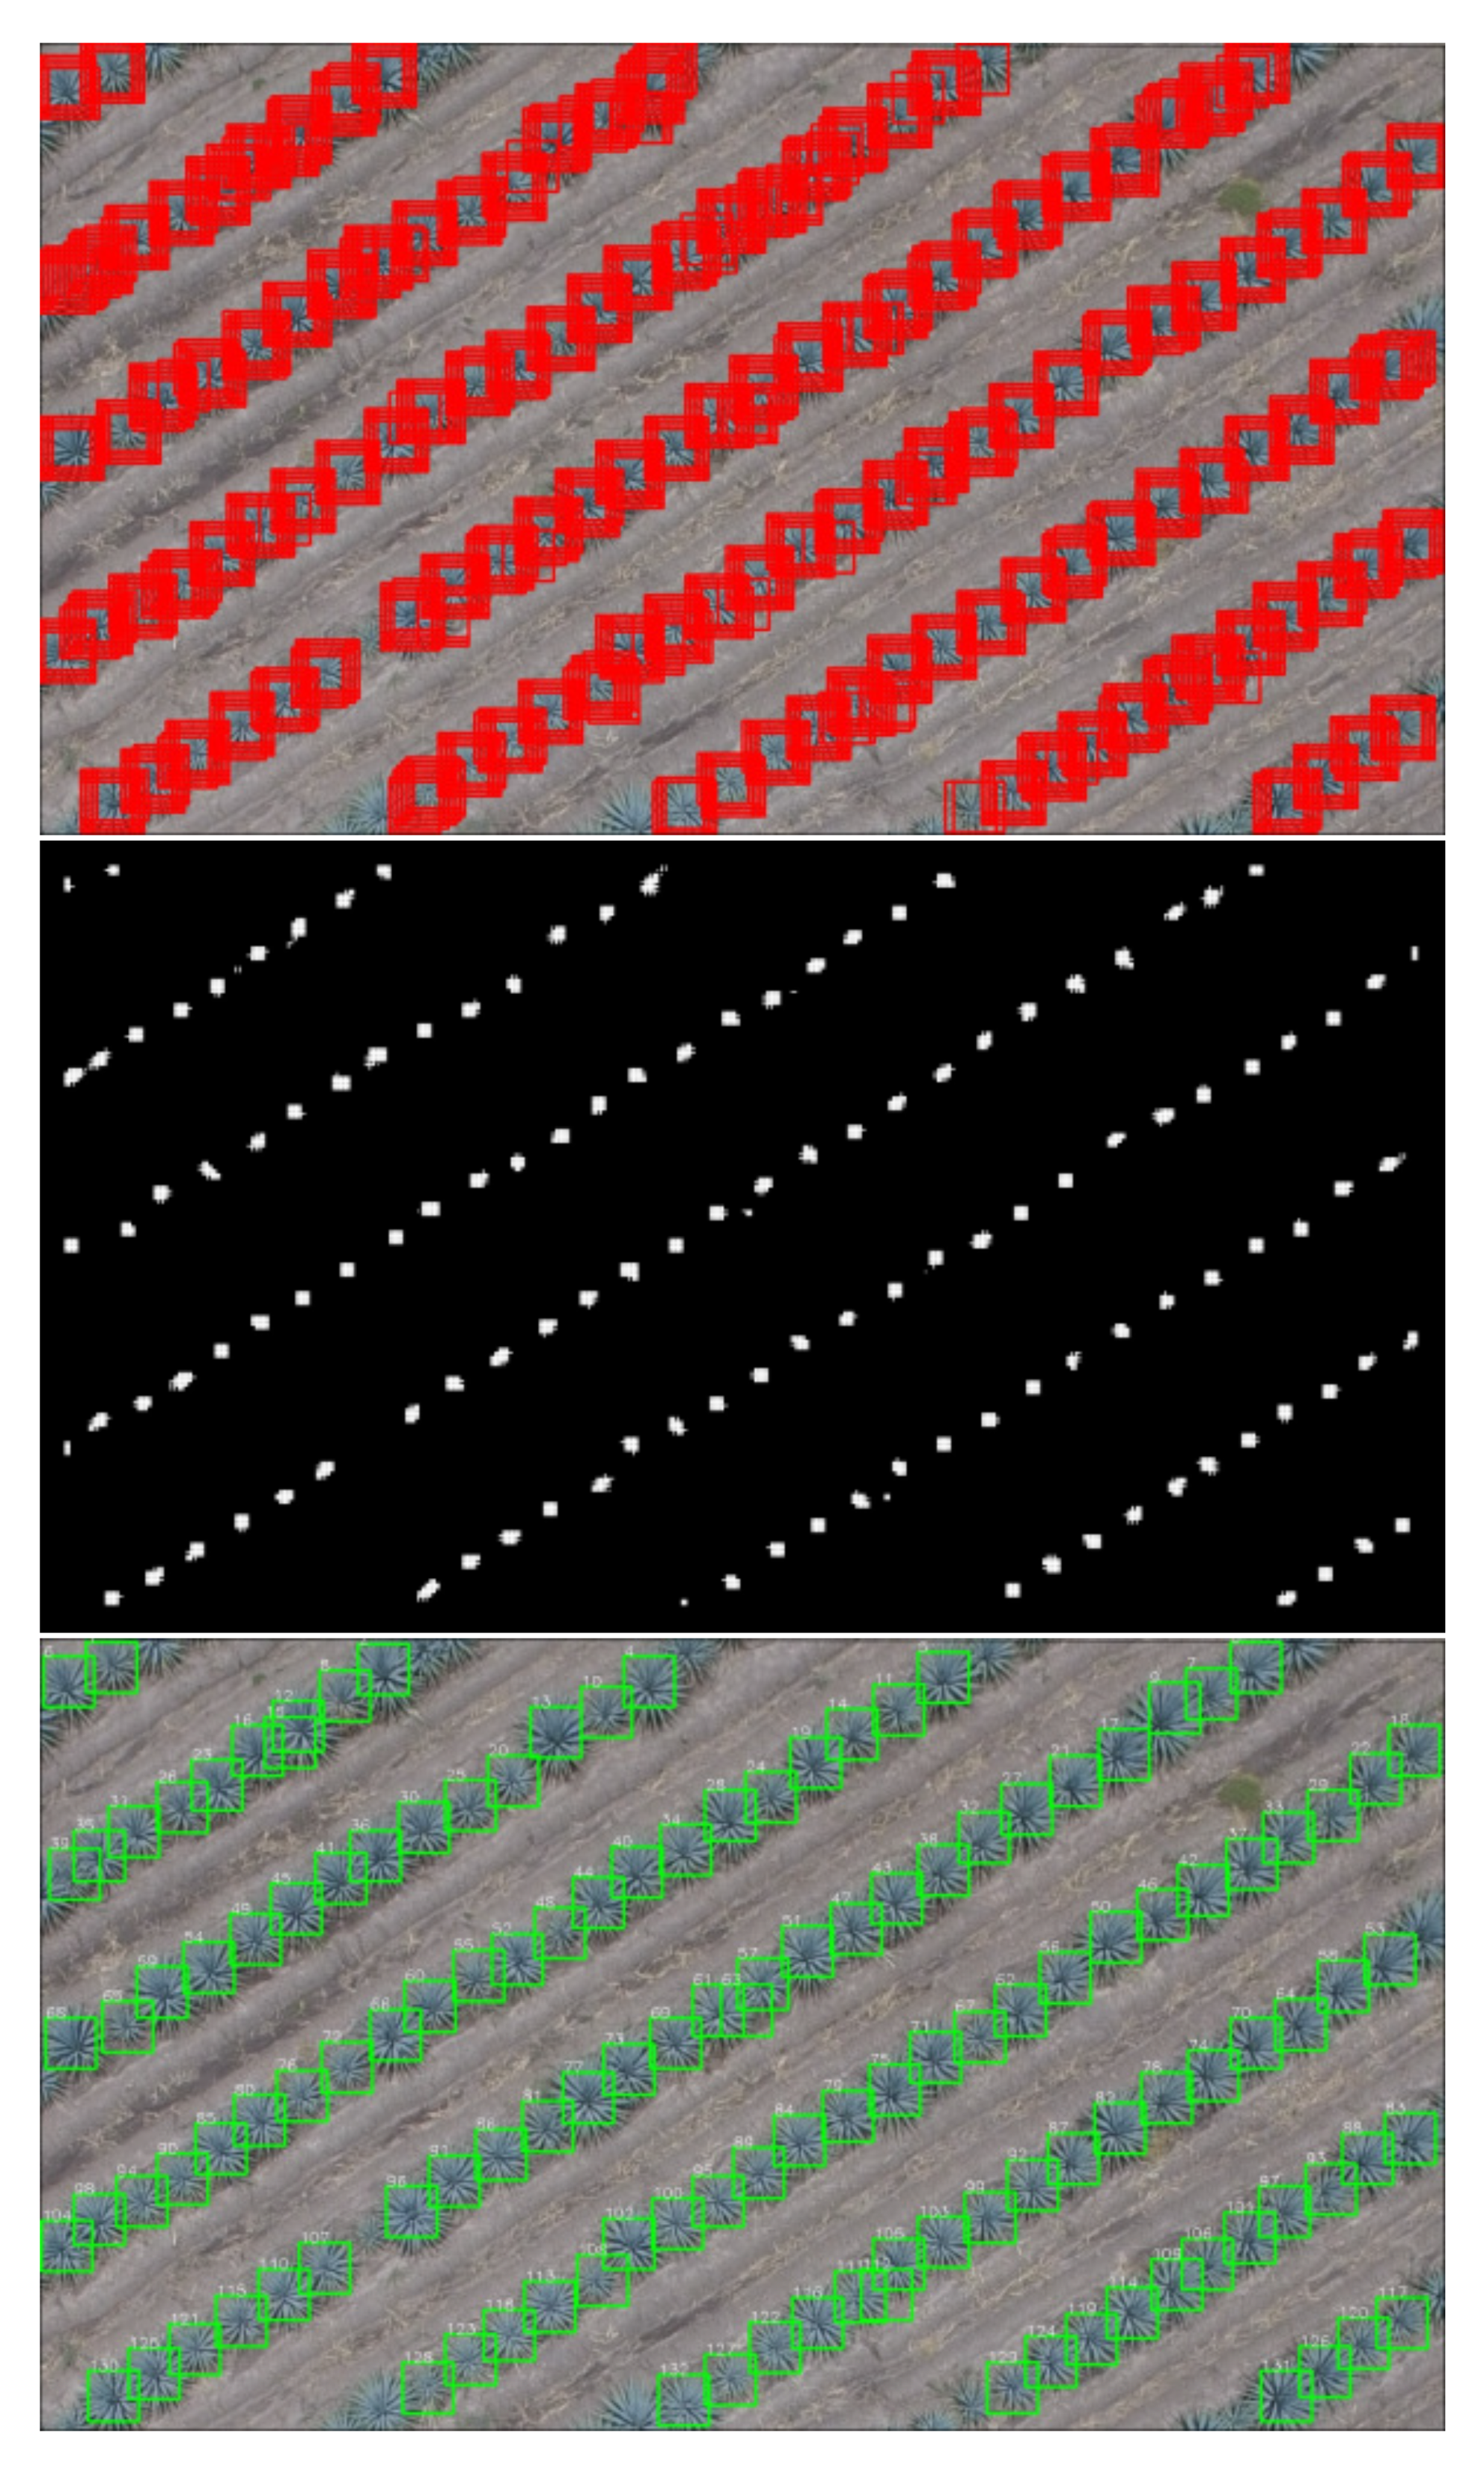
The windows that fit in the highlighted area are passed as the input of the next stage. In each window, an agave center is detected, and the corresponding candidate windows are obtained, as shown in
Figure 14.
This step may give more than one detection for each plant. This issue is solved by applying the heat map procedure and obtaining the center position of each agave plant (
Figure 14).
Based on the detected center, a window is chosen for each center. At this stage, it is possible to make a first count of the plants, but as can be seen in
Figure 14, false detections are shown due to the crossing of the leaves.
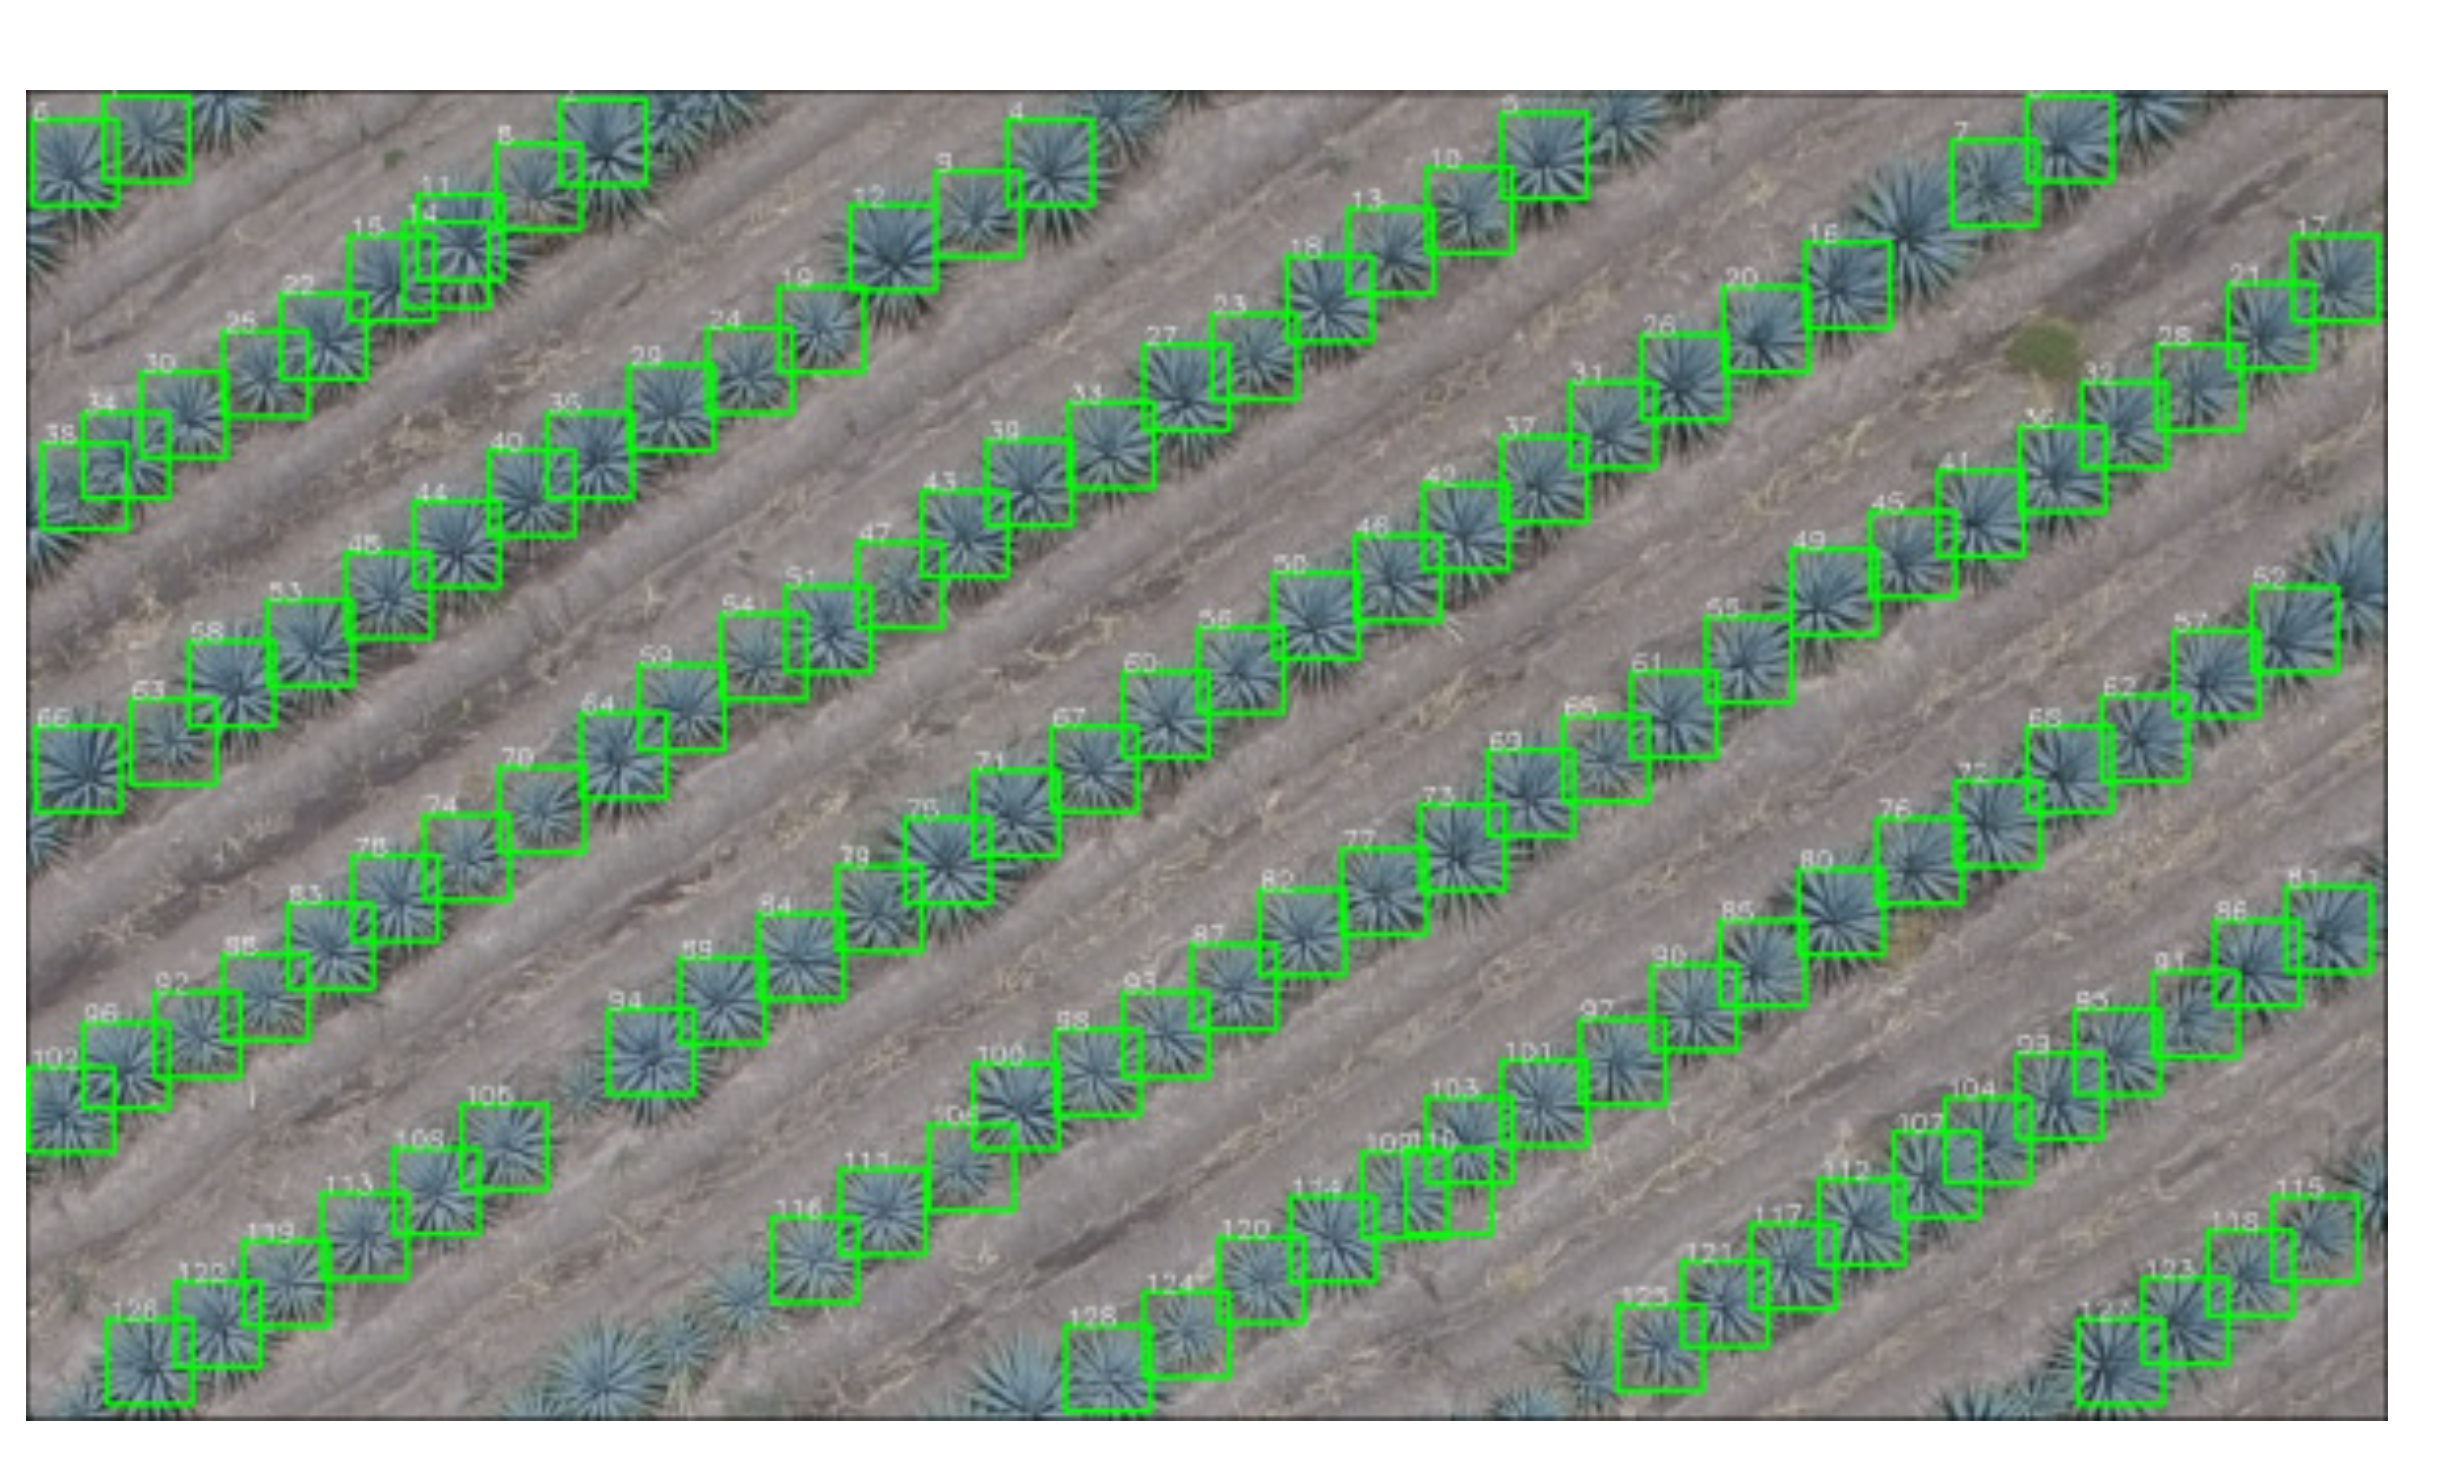
A CNN algorithm is then applied to the candidate windows obtained in the previous step. The CNN will detect if the candidate is or not a single real “agave” plant, as can be seen in
Figure 15. Then, the false detections from the previous step disappear. Nevertheless, a few correct detections (about 2%) also disappear, but the number is not significant. In the final step, all windows are verified as “agave” plants. In this particular case, the procedure counted 128 plants.
In the verification stage, a true detection rate of 0.98 was obtained for this algorithm. In order to compare the performance with other methods, a Haar classifier was applied to the same image, and the true detection rate was smaller than that the CNN. This comparison is shown in
Table 2.
We chose the Haar classifier for comparison purposes because it is known to be a lighter algorithm that can run on several small and light devices using OpenCV. When dealing with flying platforms, the weight of the hardware becomes an aspect of high relevance.
4. Discussion of the Results
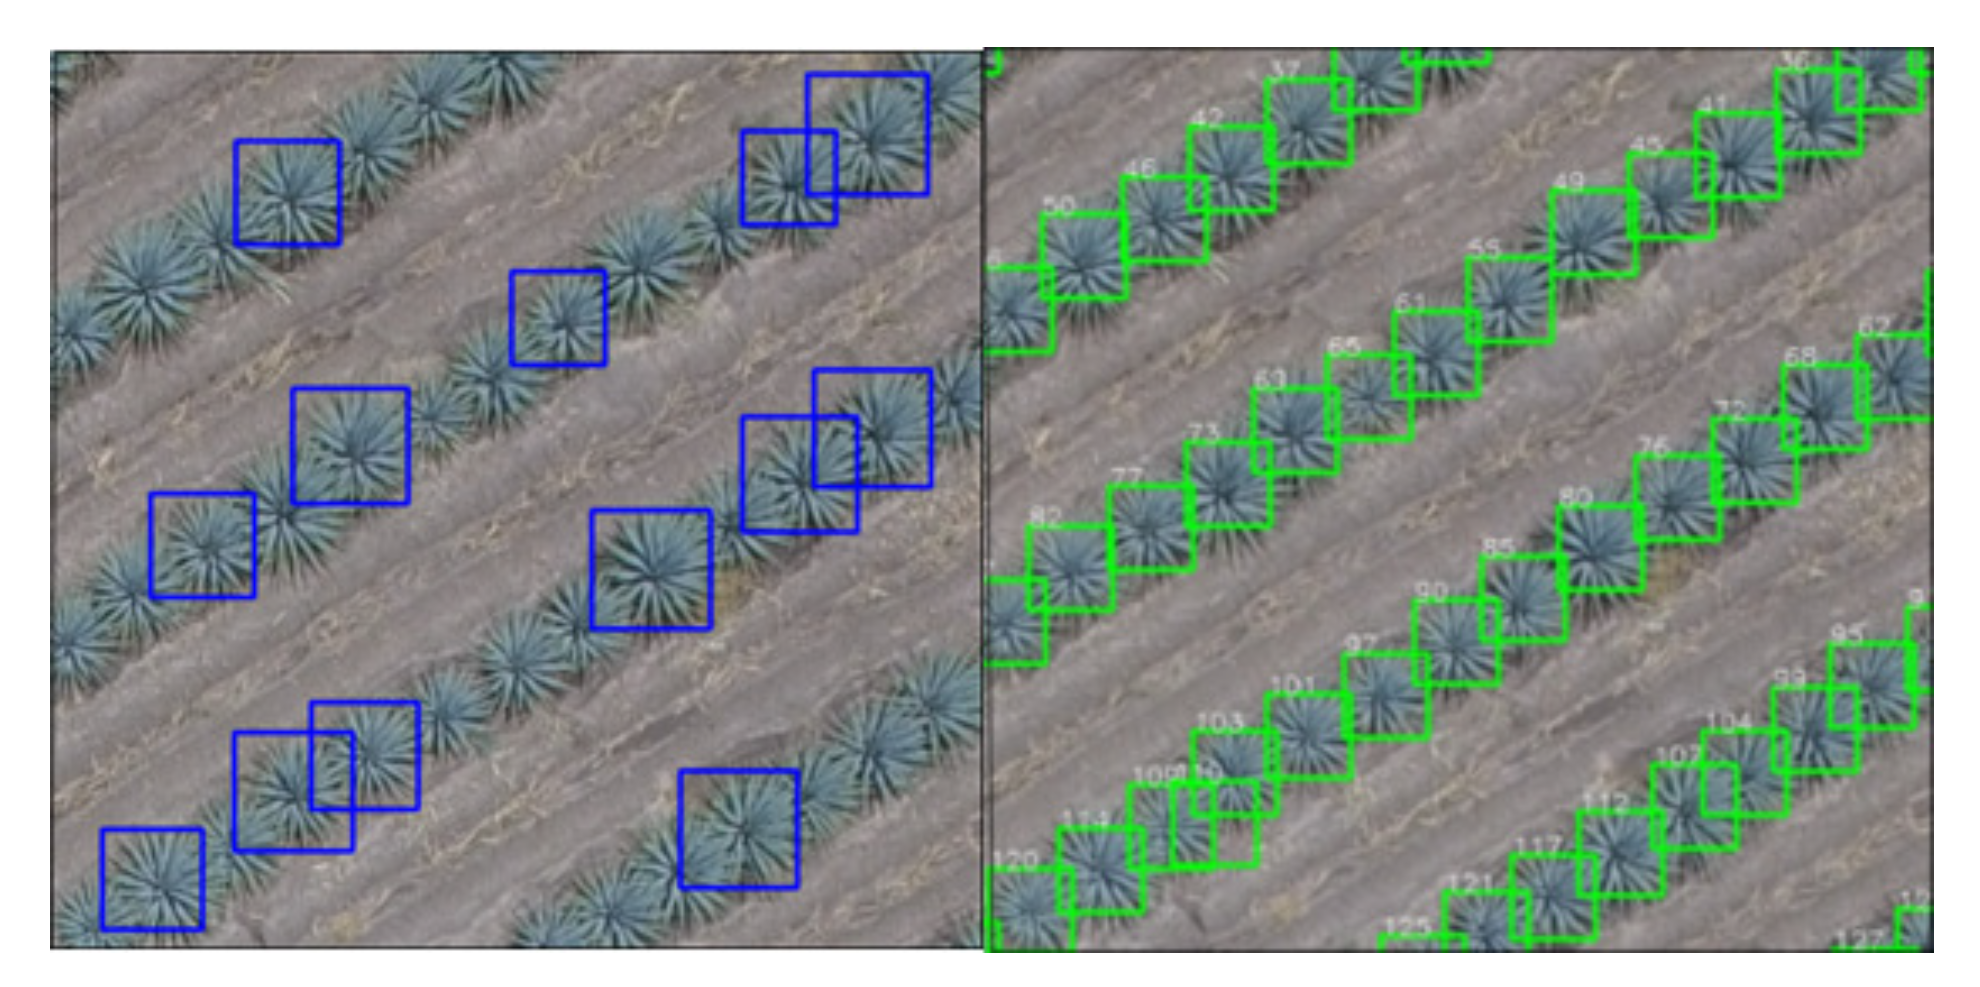
From the observed results, it can be said that unlike most of the works cited in the Introduction, this work focused on solving a social problem with a technological solution. Detection and counting results with the precision shown can be interpreted as a sign that it is possible to take this work even further. As future work, we plan to extend our study also to detect the age of the plant and detect if it is ripe and ready to be harvested, and thus inform the farmer of the location of the plant. Notice that very promising results can be achieved by designing a method that uses tools that are simple and more widely known than more sophisticated detection algorithms. However, other approaches for detecting agave can be tried in the future as the end-to-end methods such as YOLO. Comparison of the proposed approach with respect to the YOLO method could be interesting and could improve processing speed with a similar accuracy. The Haar classifier is a universal tool that has been included in OpenCV for a long time, and the training is faster, which simplifies the increasing of the number of tests and could be programmed on a greater number of embedded systems. Despite this, the proposed method is not perfect; as we can see in
Figure 16, it still has some false positives. This means that there are aspects to be improved.
Spectral cameras could have been used to improve the detection task. However, since this technology has to be available for farmers, we preferred not to use spectral cameras, which would have increased the price of the prototype. In addition, during the experiments, it was noticed that the pre-processing improved the detection level. The pre-processing eliminates those areas where there are no plants. Therefore, the detection processing with the neural network is lightened since the search is performed in a smaller window.
The proposed method is accurate, but on the contrary, it has a high computing cost because of all the stages that are included. The proposed method still fails sometimes to detect a plant. This problem can be solved by increasing the number of positive training images.
The proposed algorithm could also be improved by adding images of younger and smaller agave plants. Another improvement could be obtained by adding images with different lighting taken at different times of the day and in different weather conditions.

 ,
, 


