Ears in the Sky: Potential of Drones for the Bioacoustic Monitoring of Birds and Bats


1
University Rennes 2 LETG (CNRS UMR 6554), Place du Recteur Henri Le Moal, CEDEX, 35043 Rennes, France
2
TERRA Teaching and Research Centre, Gembloux Agro-Bio Tech, University of Liège, 2 Passages des Déportés, 5030 Gembloux, Belgium
*
Author to whom correspondence should be addressed.
Drones 2021, 5(1), 9; https://0-doi-org.brum.beds.ac.uk/10.3390/drones5010009
Submission received: 31 December 2020
/
Revised: 22 January 2021
/
Accepted: 23 January 2021
/
Published: 26 January 2021
Abstract
:In the context of global biodiversity loss, wildlife population monitoring is a major challenge. Some innovative techniques such as the use of drones—also called unmanned aerial vehicle/system (UAV/UAS)—offer promising opportunities. The potential of UAS-based wildlife census using high-resolution imagery is now well established for terrestrial mammals or birds that can be seen on images. Nevertheless, the ability of UASs to detect non-conspicuous species, such as small birds below the forest canopy, remains an open question. This issue can be solved with bioacoustics for acoustically active species such as bats and birds. In this context, UASs represent an interesting solution that could be deployed on a larger scale, at lower risk for the operator, and over hard-to-reach locations, such as forest canopies or complex topographies, when compared with traditional protocols (fixed location recorders placed or handled by human operators). In this context, this study proposes a methodological framework to assess the potential of UASs in bioacoustic surveys for birds and bats, using low-cost audible and ultrasound recorders mounted on a low-cost quadcopter UAS (DJI Phantom 3 Pro). The proposed methodological workflow can be straightforwardly replicated in other contexts to test the impact of other UAS bioacoustic recording platforms in relation to the targeted species and the specific UAS design. This protocol allows one to evaluate the sensitivity of UAS approaches through the estimate of the effective detection radius for the different species investigated at several flight heights. The results of this study suggest a strong potential for the bioacoustic monitoring of birds but are more contrasted for bat recordings, mainly due to quadcopter noise (i.e., electronic speed controller (ESC) noise) but also, in a certain manner, to the experimental design (use of a directional speaker with limited call intensity). Technical developments, such as the use of a winch to safely extent the distance between the UAS and the recorder during UAS sound recordings or the development of an innovative platform, such as a plane–blimp hybrid UAS, should make it possible to solve these issues.
1. Introduction
The entire earth system is undergoing tremendous changes, leading scientist to define a new ecological era called the Anthropocene, characterized by massive biodiversity loss as a result of human activities [1]. The Millennium Ecosystem Assessment reported a current species extinction rate up to 1000 times higher than background rates and forecasted a future rate 10 times superior to the current one [2]. The threatened status given to about 30% of the species assessed by the International Union for Conservation of Nature (IUCN) in the past decade [3] represents further evidence of this serious biodiversity loss. These losses lead to the alteration of several ecosystem services [4] and, therefore, have detrimental impacts on humanity. In this context, it is essential to carry out proper wildlife surveys to highlight any suspicious population decline and to target endangered species in order to plan appropriate conservation measures.
Some taxa have substantial ecological contributions (e.g., pests control and seed dispersal), such as in the case of both bats and birds [5,6]. Population monitoring provides indispensable information to conservation actions with the goal of preserving the benefits of such populations’ functions within their ecosystems. Conventional methodologies to estimate abundance or to determine the species richness of these taxa are mainly based on acoustics. Examples include point-count and line-transect sampling, which are the most frequently applied methods for bird census [7,8]. Bats are also monitored through acoustic techniques. For instance, censuses by passive and active ultrasonic recordings are often deployed in the context of environmental impact assessments [9,10].
Some innovative techniques such as the use of drones—also called unmanned aerial vehicles/systems (UAV/UAS)—or remotely piloted aircraft systems (RPAS) are revolutionizing the way future environmental monitoring can be performed [11]. Numerous publications document the development of environmental monitoring using UASs in a wide range of topics, e.g., wildlife damage assessment [12], precision agriculture [13], and grazing [14,15]. The potential of UAS-based wildlife census using imagery is now well established for terrestrial mammal or birds [16] but also in marine environments [17]. In certain situations, its accuracy might be greater than traditional census technique [18]. However, drone imagery monitoring is obviously less suitable for non-conspicuous species (e.g., species hidden in trees and shrubs, or small species). This issue could be solved with bioacoustics for acoustically active species such as bats and birds. Audio recording systems offer a wide range of benefits in comparison with picture recording systems. They are lighter, more energy efficient, and collect data more compactly [19]. Moreover, audio recordings confer additional advantages over active field listening processes, such as multiple listening opportunities [20], consultation by numerous skilled analysts [21], data collection independent of the observers’ expertise level [22], and automatic species identification [23]. For example, Celis-Murillo et al. [24] showed that acoustic recordings provide higher probability detections for songbirds in tropical areas than point counts. Consequently, the combination of a UAS and a recording device seems to be a promising innovative technique. UAS bioacoustic monitoring could be used for less accessible areas, such as high canopies, large wetlands, or cliffs. UASs may also be able to increase the range of monitoring because they can move more easily over longer distances than field operators.
To date, the only peer-reviewed study that can be found on the feasibility of counting songbirds using a UAS in the USA was conducted by Wilson et al. [21]. They suspended a ZOOM H1 Handy Recorder 8 m below a DJI Phantom 2 and tested this equipment under controlled and in vivo conditions. With playback of bird recordings, they found no significant influence of UAS flight altitudes (28, 48, and 68 m) on detections, and detection radii were similar to those of standard point counts. In the field, they found a comparable number of birds per UAS and standard counts. Species richness and abundance were nevertheless underestimated by UAS counts, notably for low-frequency singing species and very abundant species. They concluded that UASs associated with bioacoustic technologies could become a valuable new surveying tool to study songbirds and even other vocal groups. Little literature can be found on the bioacoustic monitoring of bats using UASs. To date, Kloepper and Kinniry [25] investigated the subject in a very specific context. They studied the echolocation signals from Tadarida brasiliensis during group flight and cave re-entry by combining UAS recordings with thermal infrared imagery analysis.
In this context, this study proposes a methodological framework to assess the potential of UASs in bioacoustic surveys of birds and bats, based on the work of Wilson et al. [21], extended to the ultrasound UAS recordings of bats. The first objective is to evaluate potential negative impacts of the sounds emitted by the UAS operation in relation to the sounds of interest (both audible and ultrasound ranges). The second objective is to evaluate the quality of UAS bioacoustic recordings in terms of detection probability of broadcasted bioacoustic sound (detection rate and effective detection radius).
2. Material and Methods
2.1. Experimental Setup
Trials were conducted between 1:30 p.m. and 6:00 p.m. mid-April 2018 in a two-hectare meadow in Belgium (Henri-Chapelle, 50°40′17″ N, 5°56′54″ E). Weather conditions were dry and sunny (temperature around 20–25 °C, wind speed < 15 km/h).
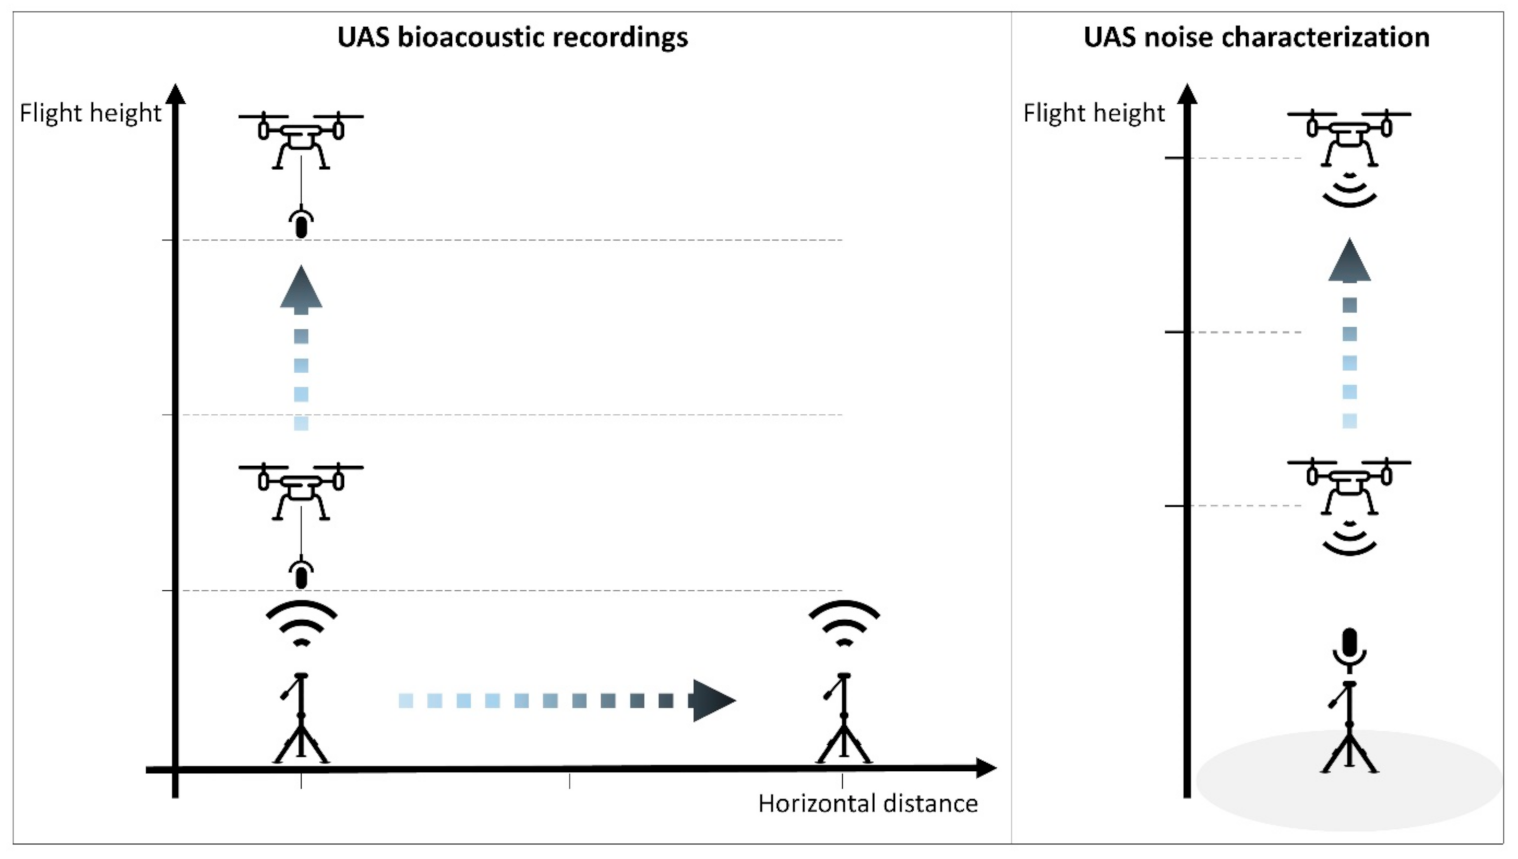
This study proposes a methodological framework that emulates traditional stationary point-count sampling, as described by Buckland et al. [26] with a UAS onboarding a recording device. The general setup was based on a quadcopter UAS (DJI Phantom 3 Pro) hovering while a speaker played acoustic signals of different groups of species: birds (audible range) and bats (ultrasound range). Automated sound recorders were hung below the UAS with an 8-m nylon line in order to decrease the noise of the propellers and motors. This length is the same as that proposed by Wilson et al. [21] for UAS recordings of songbirds. This length was also justified by specific analysis further explained in Section 2.2. UAS Noise Characterization”. As a growing distance between the UAS and the sound source could enable more operational application, the impact of the distance (horizontal and vertical) on the effective detection radius (EDR) was tested following similar protocols developed for ground-based passive recordings [27,28]. This was performed by recording sounds for different horizontal and vertical (flight height) distances (see Figure 1). In this case, the speaker device was moved rather than the recording UAS. This choice allowed for the avoidance of time-consuming in-flight movements and adjustments to reach the desired horizontal distance with the UAS.
Considering the fact that the detection probability decreases non-linearly with distance to the sound source, non-linear increments for the tested distance were chosen. This hypothesis was based on Equation (1), which describes the decrease in sound level between two collinear points. When considering two recording points whose distance from the sound source is distance2 and distance1, the sound level at point 2 (dBdistance2) that decreases between can be evaluated with Equation (1) if all of the points are collinear.
Following Equation (1), every time the distance doubles, a sound level decrease of 6 dB is expected [29]. Wilson et al. [21] showed that bird playbacks were not detected beyond 90 m; thus, the following horizontal distance modalities were chosen for the recording of bird sounds: 0, 5, 10, 20, 40, and 80 m. Regarding the flight height, the same values used by Wilson et al. [21] were kept: 20, 40, and 60 m. As higher-frequency signals spread less far than lower-frequency human audible ones, smaller horizontal and vertical increments for the bat trial were chosen: 0, 2.5, 5, 10, 20, and 40 m for horizontal distances and 5, 10, 15, and 20 m for the flight height.
For both birds and bats trials, control recordings were performed by recordings at ground level (human operator holding the UAS recorder) to better understand the effect of the UAS on detectability.
2.1.1. Playing and Recording Sounds
Birds
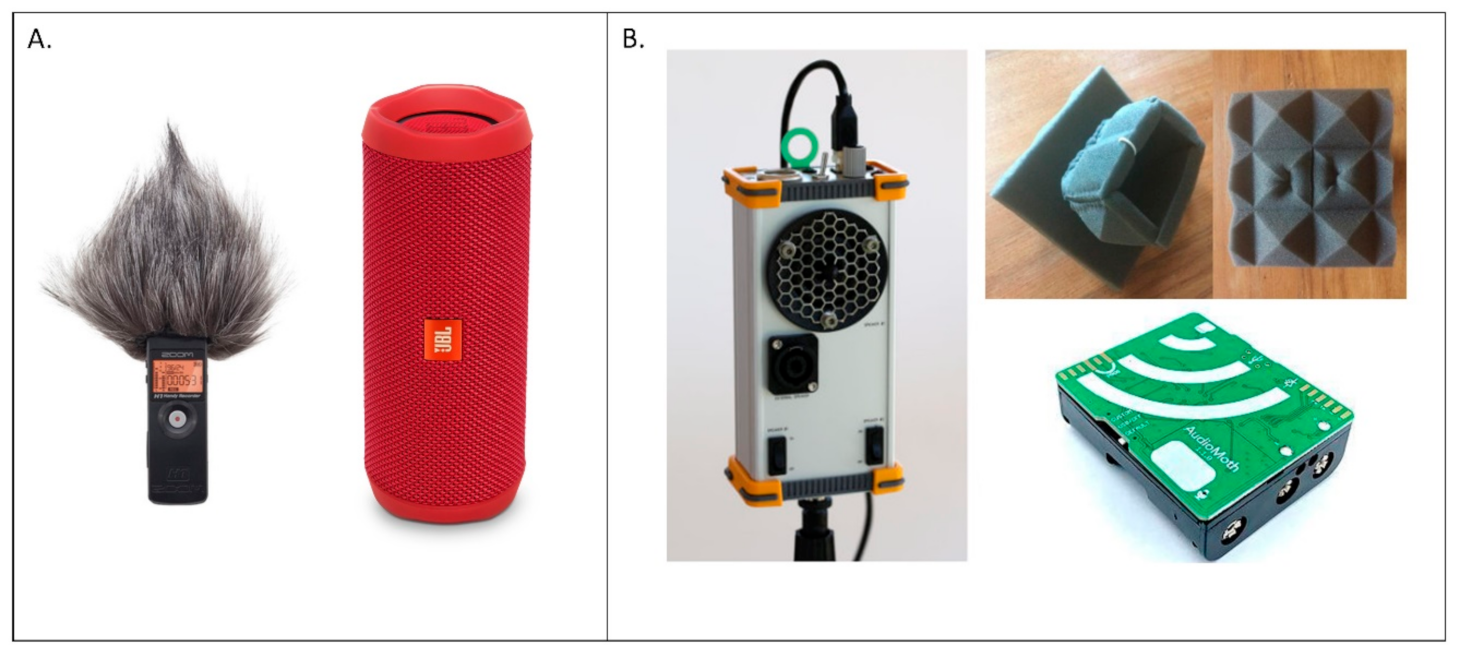
Bird vocalizations are mostly emitted in the audible range (20 Hz to 20 kHz), which allows the use of a classical recorder and speaker. The ZOOM H1 Handy Recorder was selected for its multiple attributes that ensure the repeatability of the approach. Indeed, it is lightweight (88 g, including batteries), compact (44 × 136 × 31 mm3), low-cost (<EUR 90), and includes a built-in cardioid microphone, guaranteeing a good sound recording from the ground while minimizing drone noise. It was also used by Wilson et al. [21]. For all the tests, the ZOOM H1 Handy Recorder was equipped with its hairy windscreen (WSU-1), and the low-cut filter was switched on, both to reduce wind noise and low frequency whirring sounds from the UAS (see Figure 2A). Files were recorded in 24-bit WAV format with a sampling rate of 44.1 kHz. Bird songs were broadcast through a JBL Flip 4 wireless loudspeaker (output power = 2 × 8 W; frequency response = 70 Hz to 20 kHz) connected via Bluetooth to a smartphone. The skyward-facing speaker was raised 1.5 m above the ground with a tripod.
Because UAS-based monitoring especially targets hard-to-access areas, such as forest canopies or wetlands, a set of nine European bird species that can be found in wooded or wet environments was chosen: Eurasian wren (Troglodytes troglodytes), sedge warbler (Acrocephalus schoenobaenus), common reed bunting (Emberiza schoeniclus), common blackbird (Turdus merula), Eurasian blackcap (Sylvia atricapilla), common chaffinch (Fringilla coelebs), song thrush (Turdus philomelos), goldcrest (Regulus regulus), and common wood pigeon (Columba palumbus). Besides the habitat criterion, this selection was also performed in order to cover a representative sample of the in vivo sound variability in terms of frequency and intensity. For instance, the goldcrest has a weak and high-pitched song, whereas the common wood pigeon’s song is low frequency.
To be consistent with the vocalization intensity of each bird species, the soundtracks’ sound pressure level (SPL) was measured at 1 m with a sound level meter (frequency range = 31.5 to 8500 Hz; measuring range = 30 to 130 dB; accuracy = ±1.5 dB) and adjusted to avoid clipping with the use of both Audacity 2.2.1.0 opensource software (www.audacityteam.org) and speaker volume according to Brackenbury [30]: Eurasian wren = 90 dB, sedge warbler = 80 dB, common reed bunting = 78 dB, common blackbird = 87 dB, Eurasian blackcap = 88 dB, common chaffinch = 86 dB, song thrush = 100 dB, goldcrest = 75 dB. Because no references were found for an SPL for the common wood pigeon, it was approximated at 90 dB.
As the propagation of sound depends on meteorological parameters [31], the experimentation was repeated three times for every species × altitude × distance modality on three different days. For each repetition, bird sounds (song, call, or alarm call) were randomly drawn with replacement out of a preselection process. Due to its specific behavior, the soundtracks for common wood pigeon was exclusively composed of songs. The latter was formed on the basis of three to five good-quality Belgian recordings from the open xeno-canto database (https://www.xeno-canto.org/): at least three songs + one or two call(s) and/or one or alarm call(s). This action also allowed us to take into account the variability of the different acoustic signals produced by the same species or between individuals. With Audacity, all soundtracks were cut to keep a thirty-second duration playback, and some were adjusted to mitigate interferences of other species.
Bats
Bats produce ultrasonic signals (>20 kHz), hence the necessity of using a specific recorder and speaker. AudioMoth is designed as a low-cost open-source environmental acoustic logger for biodiversity and environmental monitoring, which can record both the audible range and full spectrum ultrasound (https://www.openacousticdevices.info/audiomoth). This sensor was mainly selected because it is small (58 × 48 × 15 mm3), light (80 g, including batteries), and inexpensive (EUR 43), thereby making it perfect to be deployed by UASs. It has already been successfully used in various bioacoustics studies [32,33]. For all of the experimentations, AudioMoth recording gain and sample rate were customized on medium and 384 kHz, respectively, via the AudioMoth configuration software. To improve the quality of the recordings, a foam microphone insulation casing with a 26 kg/m3 density pyramid foam (see Figure 2) was designed. Bat calls were played by an Avisoft UltraSoundGate Player BL Pro 2 mounted on a one-meter tripod and connected via a USB cable to a laptop. This transmitter is a full-featured ultrasound playback unit for luring bats and comprises a dual speaker system emitting between 1 and 125 kHz (http://www.avisoft.com/usg/usgplayerblpro.htm). During these trials, the ultrasound playback unit was only powered from the USB interface of the computer, thereby delivering an output power of 1.5 W corresponding to a maximum SPL of 100 dB at 10 cm. Volume was configured on the playback software and on the unit itself so as to maximize the sound level and to avoid clipping (distortion).
UAS surveys might be useful for recording high-flying bat species and/or those that can be found in forest canopies. In accordance with these criteria, five European bat species were selected: noctule (Nyctalus noctula), serotine (Eptesicus serotinus), barbastelle (Barbastella barbastellus), common pipistrelle (Pipistrellus pipistrellus), and Natterer’s bat (Myotis nattereri). Following the same approach used for birds, this selection was also performed while considering a gradient of bat signals (i.e., pattern, frequency, pulse duration, and inter-pulse interval (IPI). For example, the call of Natterer’s bat is characterized by a steep frequency modulation (FM) with an initial frequency at 15 kHz, a terminal frequency at 135 kHz, and a frequency of maximum energy (FME) at 43 kHz, whereas the noctule emits quasi-constant frequency (QFC) with an FME at 20 kHz [34]. The sound level of some bat calls can reach up to 110–135 dB at 10 cm [35,36], but the signal power is variable among species. For instance, the calls of the noctule are loud, whereas the calls of Natterer’s bat are quite weak [34]. Unfortunately, as the literature does not provide any SPLs for the selected species, the output volume of the speaker was maximized while avoiding clipping in order to emit signals near 100 dB at 10 cm.
Bats emit two kinds of calls: echolocation calls and social calls [35]. The former serve as a means of representing the space in which the bats can move around and hunt, while the latter serve as intraspecific communication. Usually, social calls are emitted at lower frequencies than echolocation calls. Indeed, for a sound wave to cross an obstacle in its path, the diameter of the obstacle must be smaller than the wavelength. Therefore, the higher the frequency—and, thus, the shorter the wavelength— the greater the probability of hitting an obstacle whose dimensions block this sound. In addition, the type of environment, temperature, air humidity, and wind influence the sound attenuation proportionally to the frequency. As a result, low frequencies dissipate less quickly and allow communication over a longer distance [29]. The common pipistrelle’s and noctule’s social calls are often met on the field and were added to the playlist.
Like the bird experimentation, there were three repetitions to take into account when examining sound propagation variability because of parameters such as temperature, humidity, and atmospheric pressure. Moreover, there are also variations between the calls of the same species. Indeed, bats adapt their signals to optimally visualize their environment. In closed habitats, the signal will always move on to a frequency modulation and, in open habitats, the quasi-constant frequency component increases. The inter-pulse interval can also be smaller in closed habitats to improve the resolution. However, good-quality bat calls are very difficult to obtain; hence, the same soundtracks were used for each repetition (see Supplementary Materials for soundtracks sources). All of the soundtracks were amplified (avoiding clipping) and adjusted with Raven Lite 2.0 free software (www.ravensoundsoftware.com) to obtain a five-second duration playback.
2.1.2. Identification of UAS Bioacoustic Recordings
Birds
The recordings were first filtered to attenuate UAS noise by means of the “noise reduction” effect on the Audacity software. The adjustment of the parameters was carried out through a trial-and-error approach, resulting in the following values: 16, 13, and 8 for “noise reduction”, “sensitivity”, and “frequency smoothing”, respectively. This operation guaranteed better listening comfort while preserving unaltered birdsongs. They were then randomly numbered in Excel to be analyzed by two experienced birdwatchers. Two experts performed the identification rather than one because bird song recognition depends on personal skills. The experts listened to each recording and associated them with one or several species (sometimes there were real bird interferences). All the recordings were checked to ensure that no real bird calls were recorded when bird calls from the same species were simultaneously broadcasted. The identifications of “real” bird calls (not broadcast) could then be safely removed. At the end of the process, all the broadcasted sounds could be binary labelled as “detected” or “not-detected”.
Bats
Primarily, bat call sequences were randomly numbered in Excel to remove the possibility of being influenced by the knowledge of distance, altitude, and species/call patterns. Subsequently, they were directly classified by one expert in bat bioacoustics as “detected” (identifiable tracks) or “not detected” (non-identifiable tracks) on the basis of the spectrograms. External experts were not used for identification as it was based on objective and more repeatable spectrogram analysis criteria: signal shape, IPI, FME, and minimum and maximum frequencies. Recordings of Natterer’s bat that were not identifiable to the species level were classified as “Myotis sp.”. The Myotis classification thus grouped together all of the identifiable Natterer’s bat recordings at the species level or only at the genus level. At the end of the process, all the broadcasted sounds could be binary labelled as “detected” or “not-detected”.
2.2. UAS Noise Characterization
Because noises due to the UAS itself (propellers, motors, etc.) or its movements (wind) are suggested to hinder UAS bioacoustic recording quality, the recording devices were distanced from the UAS with a nylon line. A specific UAS experimental survey was carried out in order to evaluate the radius of the impact and the origin of the sounds (i.e., noise) emitted by the UAS operation in relation to the targeted sounds (see right panel of Figure 1). Knowing how far and how strong these acoustics impacts are justifies the operational choice of the nylon length used to distance the recorder from the UAS. Both bird and bat recorders were mounted on a one-meter tripod, while the quadcopter was ascending above it meter by meter, starting at 1 m from the recorders up to 45 m. Each 1-m step was marked with a whistle blow. The spectrograms from the recordings were visually inspected with the Raven Lite 2.0 to characterize the sound emitted by the UAS itself in relation to the tested sounds in both audible and ultrasound ranges. The noise characterization ultrasound trial was repeated with and without the foam insulation casing to test its efficiency.
2.3. Testing UAS Bioacoustic Recordings
For the statistical analysis, the variations of detectability depending on the expert (recordings of birds) and flight height (birds and bats recordings) were tested. Chi-square tests were used to evaluate the impact of the expert identifying the recordings of birds. The impact of UAS flight height was evaluated with logistic regressions models linking the probability of detection (i.e., the probability of the played soundtrack to be correctly identified with the UAS recording) with the flight height.
In the specific context of wildlife census, the effective detection radius (EDR) can be considered as the sensitivity of the sensor [37,38]. The EDR is the distance from the point-count station for which the number of individuals missed within it is equal to the number of individuals detected beyond it [26], and it is obtained according to Equation (2):
where w is the maximum distance of detection and p is the detection probability as processed in Equation (3):
where g(x) is the detection probability function and x is the distance between the observer and the recorded species.
The probability function was fitted following logistic regression linking the distance between the recorder and the point source with the real detection probability (proportion of recordings detected). The EDRs were then estimated for each species and for each tested flight height. The EDR was also estimated for the control recordings, performed from the ground without any UAS noise.
3. Results and Discussions
3.1. UAS Noise Characterization
3.1.1. Acoustic Characterization and Radius of Impact
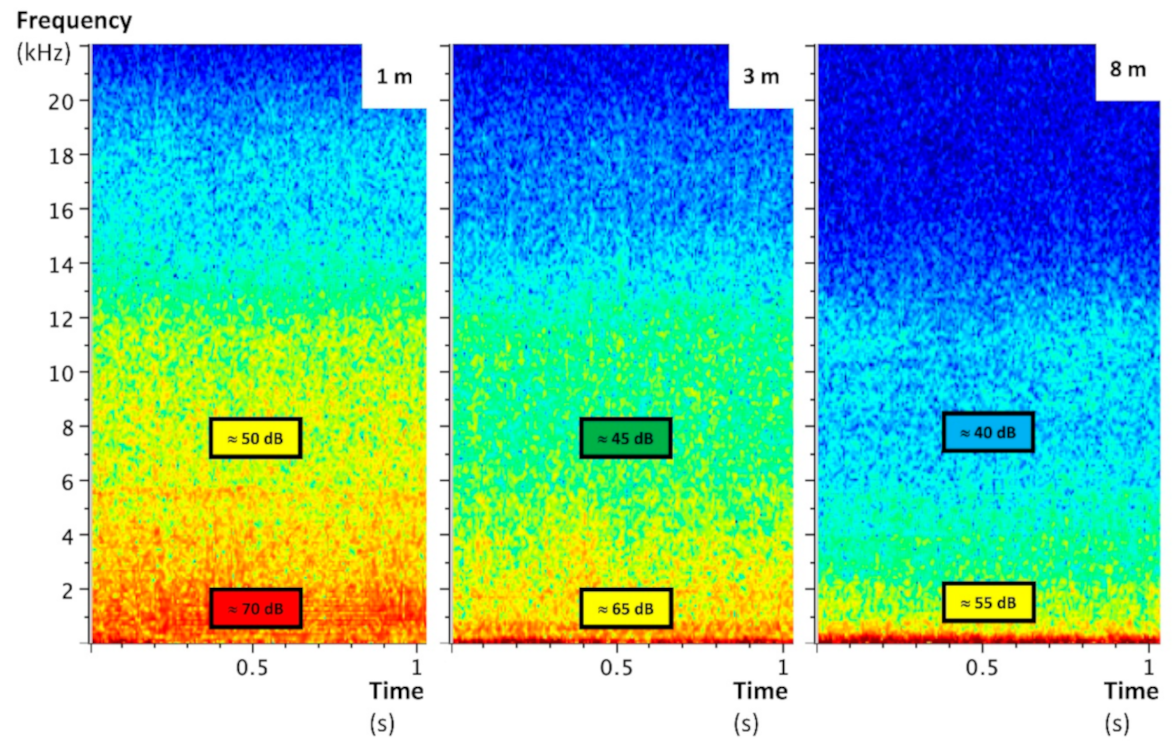
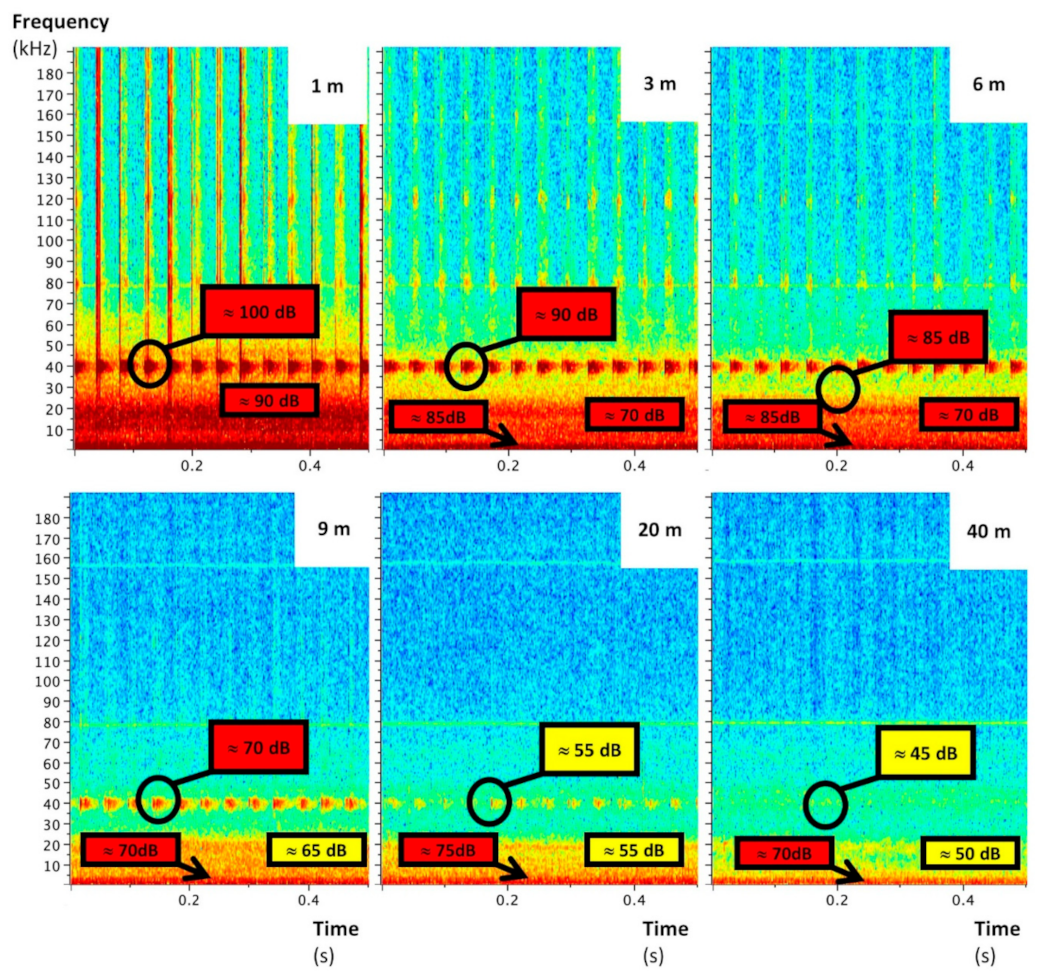
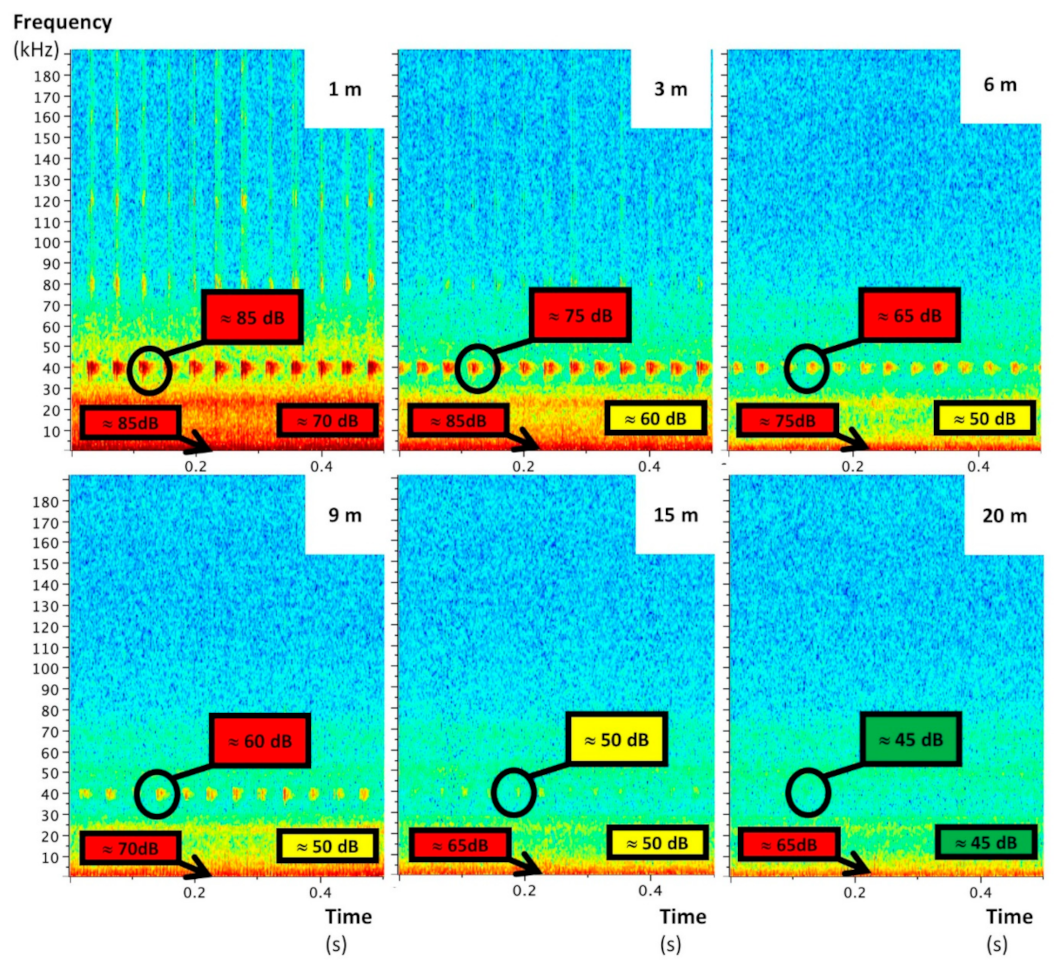
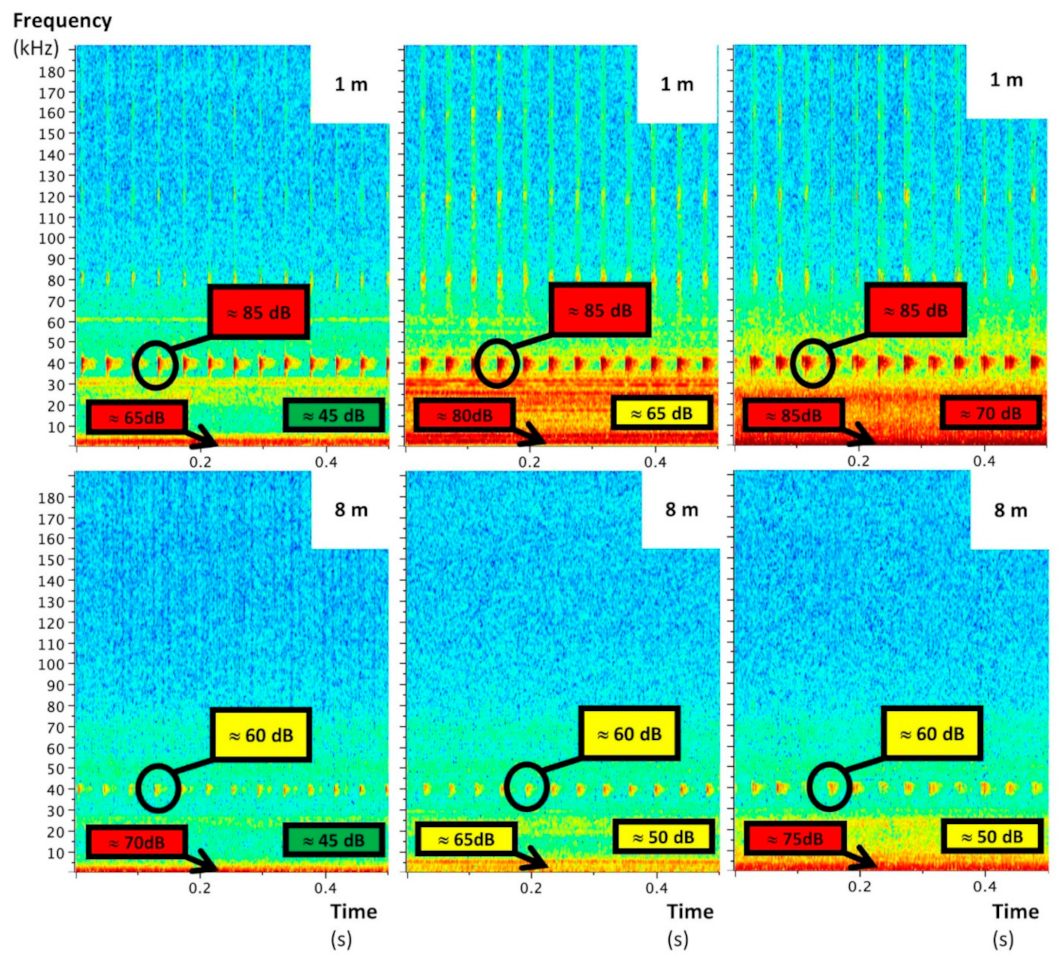
The UAS emitted mainly low-frequency noise whose sound level decreased with the distance to stabilize at around 55 dB from 7 m (Figure 3). This sound level is quite close to that of an outdoor environment without particular noise (around 45 dB). Significant ultrasounds—also decreasing with distance—were delivered by the UAS too (Figure 4, Figure 5 and Figure 6). They are characterized by a maximal frequency of about 45 kHz and a minimal frequency of about 35 kHz, with transmission of three pulsations per second. Without acoustic insulation on the microphone, noise volumes at 6 m were 85, 70, and 85 for low, medium, and high frequencies, respectively (Figure 4), which are similar to those found at 1 m with the acoustic foam casing (Figure 5). The distance at which UAS noise becomes low was reduced from 40 to 20 m with insulation (Figure 4 and Figure 5). This result clearly advocates the benefits of recorder isolation.
In terms of experimental design and the setting of the nylon length, the results suggest that an 8 m nylon length would be suitable for audible UAS recordings. If the ultrasonic spectrograms suggested an increase in the nylon length of up to 20 m or at least 15 m (Figure 5), the nylon length was kept to 8 m for safety reasons (UAS stability during operation). This was used for all of the UAS recordings of the trial.
3.1.2. Identifying the Noise Origin of the UAS
The ultrasounds UAS noise did not come from the motors and/or the propellers, because they were already emitted when the UAS was powered up without starting the motors (Figure 6). Their sound level as well as their pattern did not change when the motors were running, but the sound level was around 85 dB at 1 m and decreased to 60 dB at 8 m. Consequently, the nylon line length had a great impact on this specific interference.
The electronic speed controllers (ESCs) were identified as the most probable source of this noise. The ESCs allow the high-frequency conversion from direct current to alternating current to generate motor motion. If motors and ESCs are mainly responsible for the recorded noise over short distances (≤1 m), propellers have a more significant influence on noise than motors for higher distances, especially under the 10 kHz range (+10 dB) (Figure 6). Thus, other propeller designs might reduce these acoustic interferences.
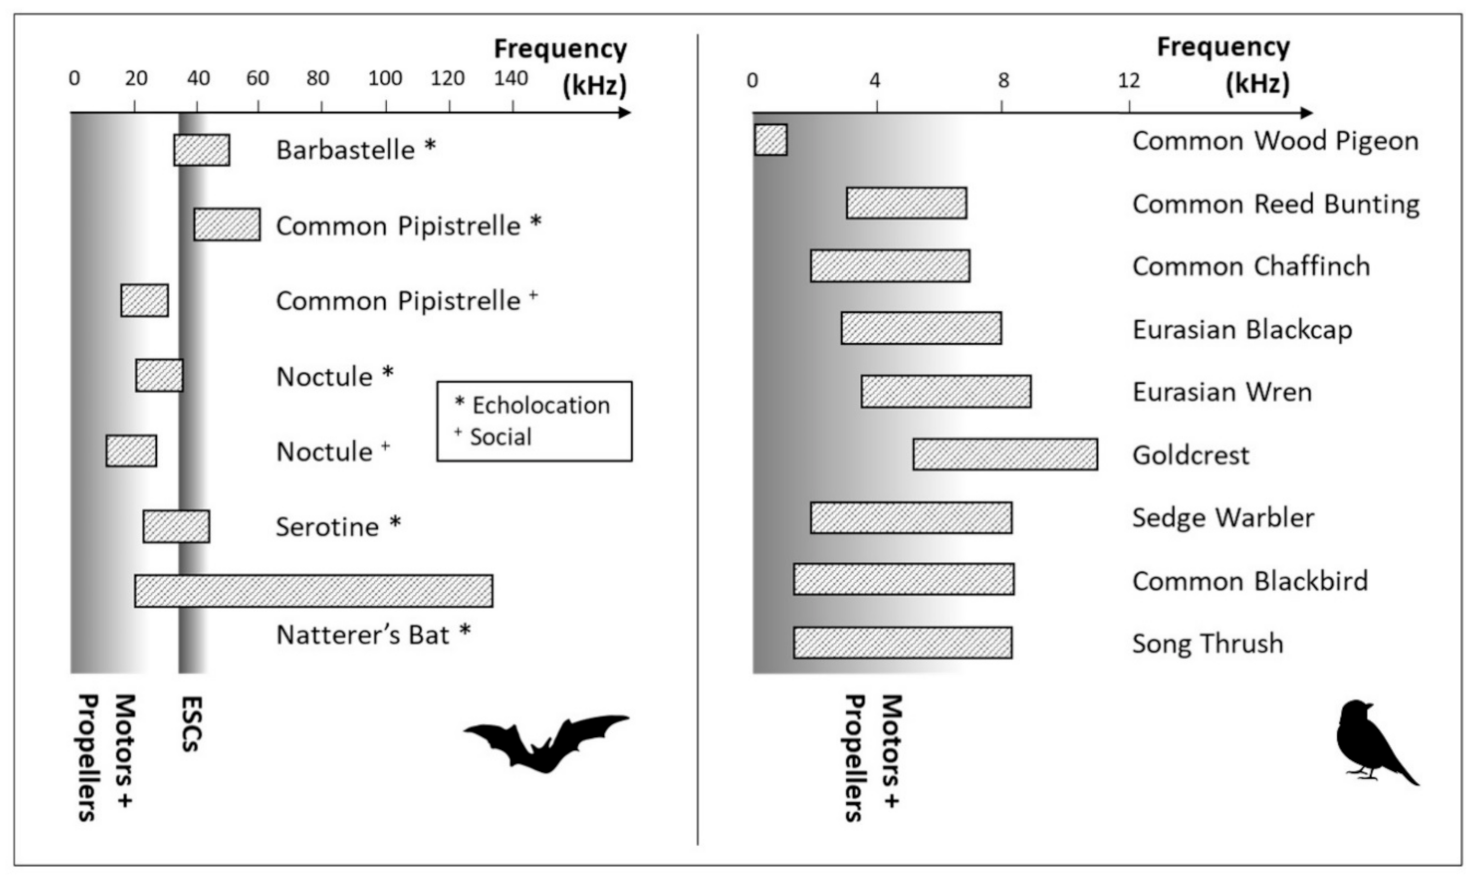
These highlighted noises could mask the acoustic signals of certain species (Figure 7). Wilson et al. [21] showed that bird species with a low-frequency song could be heavily masked by UAS noise. The common wood pigeon, which has a very low-frequency song, was no exception to this rule, but UAS noise had less effect on the alteration of acoustic signals for the other selected species. For bats, three of the selected species (barbastelle, serotine, and Natterer’s Bat) emitted calls whose frequency range partially passes through the ESC noise band (Figure 7). This was a real issue for the barbastelle, whose typical 35–41 kHz alternating signals in steep FM was completely overlapping with the ESC noise. Nevertheless, serotine’s flat FM signals combined with an FME of around 25–27 kHz and the very wide range of frequencies of Natterer’s bat calls allowed the identification of these two species.
3.2. UAS Bioacoustic Monitoring of Birds
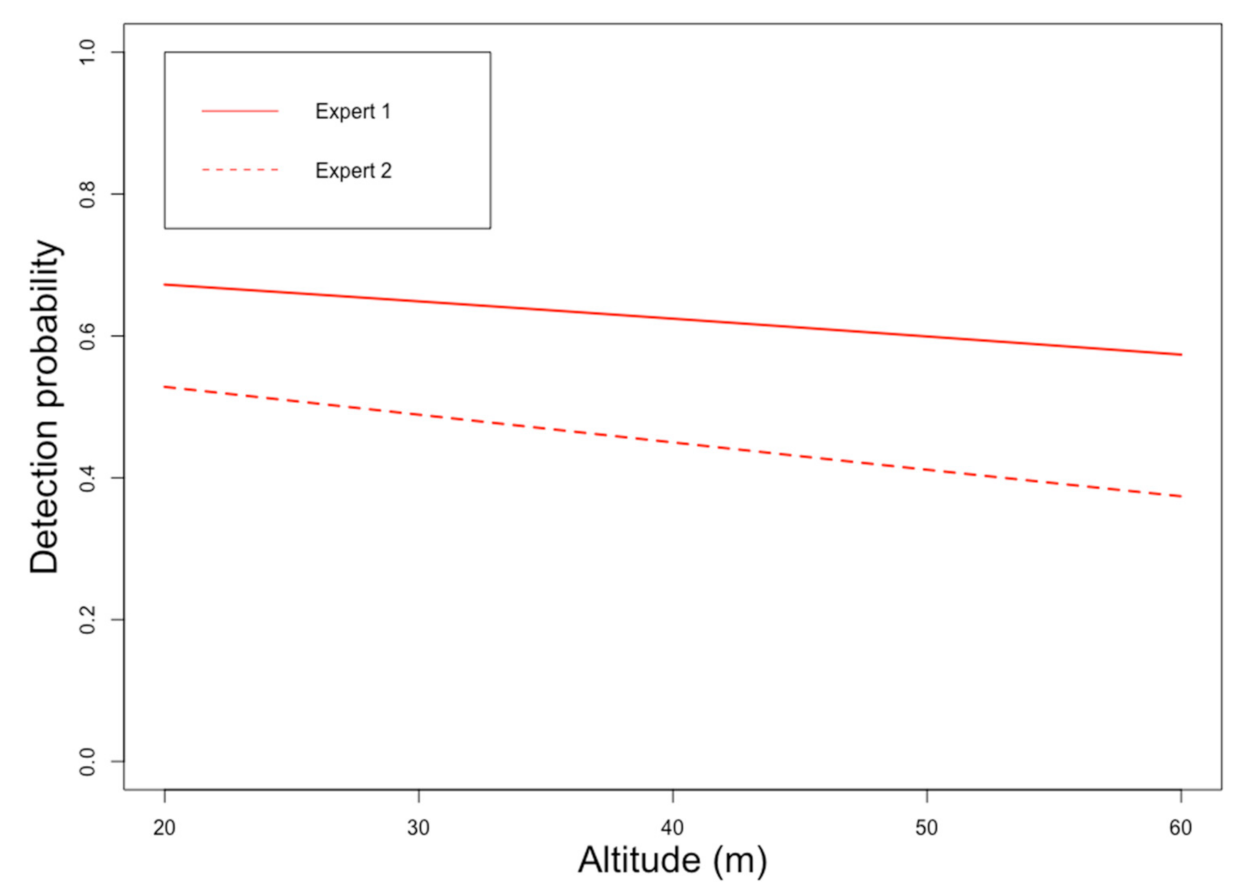
A very highly significant difference in overall detection rate between the two bird experts was highlighted (Chi-square test p-value < 0.01), meaning that detectability is expert sensitive and is relative to their personal skills (i.e., ability to hear and identify a bird sound). Nevertheless, the logistic regression curves for both experts show a stable detectability (all bird species) between the three tested UAS flight heights.
There were significant differences in detectability for some species between the control recordings (ground recording, no UAS noise) and UAS recordings, especially for expert 2 (Table 1, left panel). When the UAS-only recordings were considered, there was no more significant difference in terms of detectability (Table 1, right panel and Figure 8) for the different flight heights tested.
On the basis of these results, the EDR was computed for each expert while considering two groups: “control” for an altitude of 0 and “UAS” for flight heights of 20, 40, and 60 m.
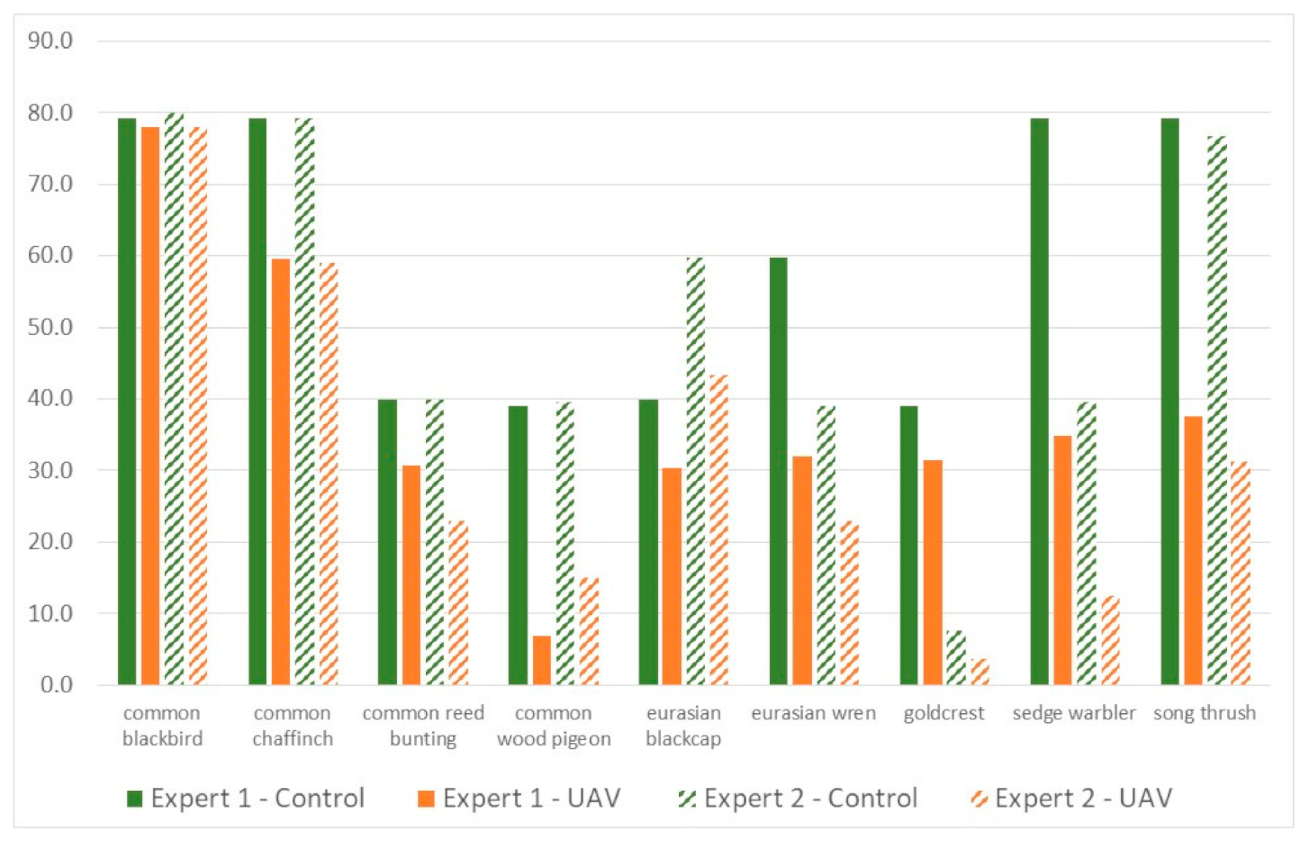
Figure 9 highlights the fact that the overall EDRs were lower for UAS-based recordings than for ground-based control recordings, but the common blackbird, common chaffinch, common reed bunting, Eurasian blackcap, and goldcrest EDR were, at most, 20% smaller for at least one of the two experts (Figure 9). The vocalizations of the common wood pigeon, Eurasian wren, sedge warbler, and song thrush were thus more affected by UAS interferences. For instance, the sedge warbler EDR fell from 79.2 to 34.9 m for UAS recordings analyzed by expert 1 (−56%).
Much lower sensitivity to UAS noise in terms of detectability was expected for birds with loud songs, such as the song thrush and Eurasian wren, the loudest species in the selection (respectively 100 and 90 dB). Nevertheless, these cases cannot be generalized to all loud singers because the common blackbird has acoustic features very close to the song thrush (Figure 7) and its song was, in general, not affected by UAS noise. However, identification of bird songs is not exclusively based on pitch and volume; musicality, trills, nasality, voice breaks, and polyphony are other important criteria to take into account, as suggested by Constantine [39]. The identification of some specific song patterns was surely more influenced by the UAS noise, making the EDR species dependent. Of course, the highest ground-based EDRs were mostly from loud species. For both experts, the control EDR of the common wood pigeon was twice as large as that of the UAS. Considering the overlap between its song and the UAS noise (Figure 7), an important impact on the detectability with UAS recordings was highlighted. However, even the EDR from ground recordings was low compared to the other loud species. These relatively small EDRs were associated with the quality of the played soundtracks as well as their recordings with the microphone’s low cut filter.
EDR differences were also found between experts, as suggested by the chi-square test (Table 1). For certain species, this difference was important. The goldcrest’s EDR was three times smaller for expert 2 than for expert 1 (Table 1). This discrepancy can be linked to the ability to hear the high-frequency song of this species, which declines with age [40]. In fact, expert 1 was in his twenties, while expert 2 was over 55 years of age. Playing calls or alarm calls for species like the sedge warbler could also be a reason for this divergence. In fact, calls are often less specific than songs and thus need more advanced personal skills to be identified.
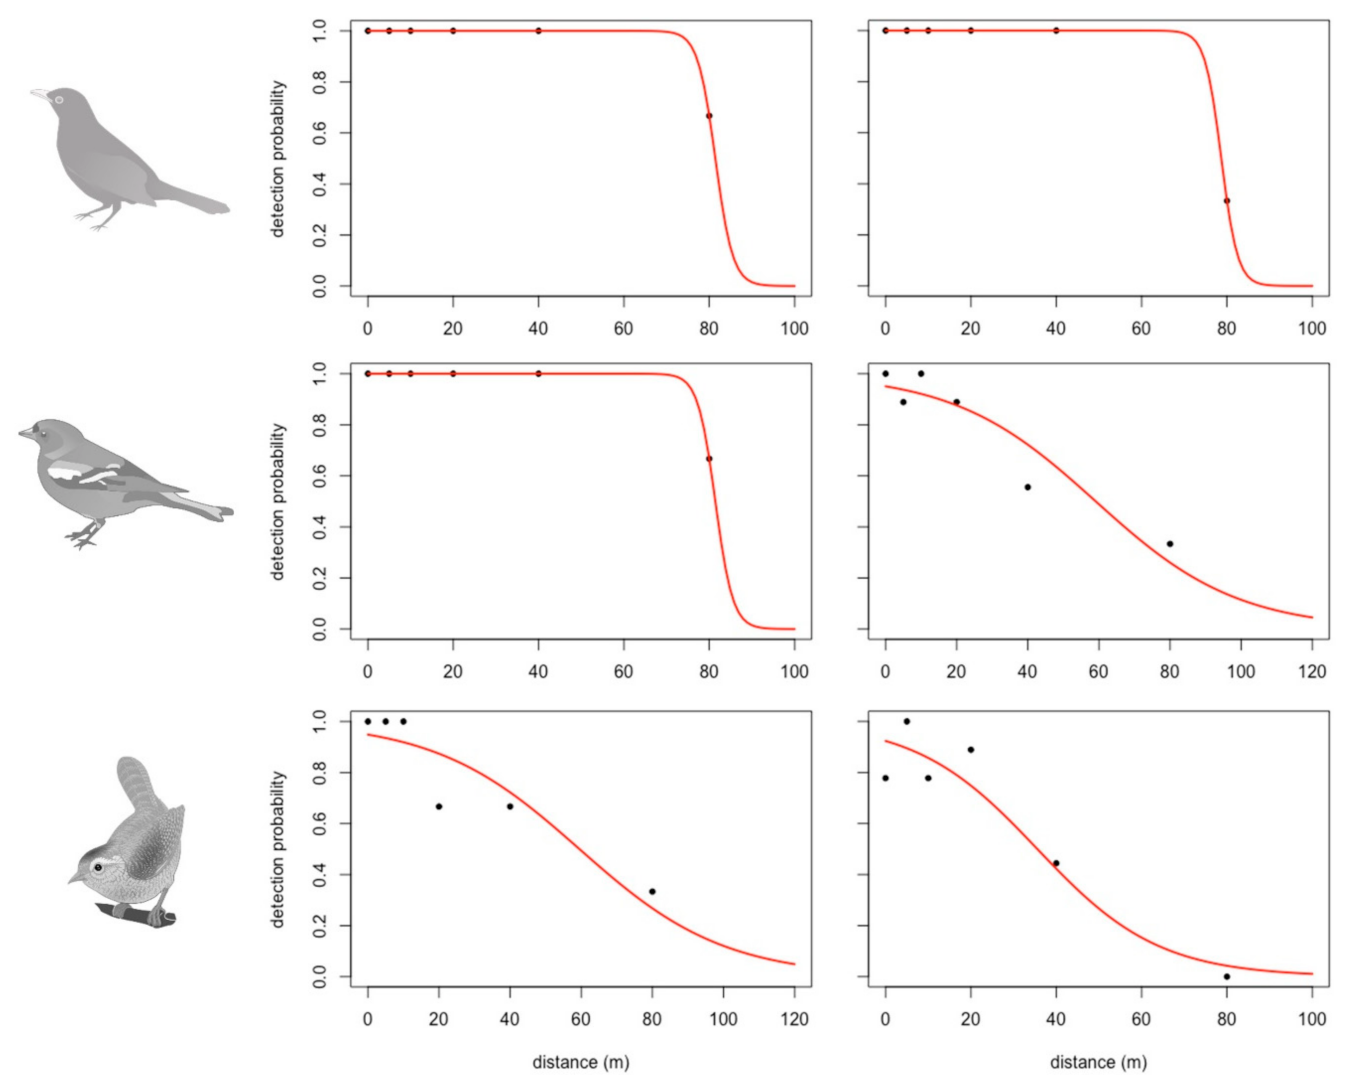
EDR estimates provided good insight on the distance where individuals are the most likely to be detected but not on the possible maximal distances of detection. This information was provided by the logit model linking the detection probability to the horizontal distance. All the fitted logistic regressions are available by species, by expert, and by group (UAS vs. control) in Supplementary Materials. As an example, the fitted probability detection curves for the control and the UAS group (expert 1) for the common blackbird, common chaffinch, and Eurasian wren are plotted in Figure 10. The probability detection functions for the control group (ground recordings) were all built on the basis of a 100 percent detection rate at 0 m. The common blackbird and common chaffinch could have been potentially detected beyond experimental distances by both experts from the control ground recordings as well as the UAS recordings (Figure 10). UAS detection probability curves were rarely built on the basis of a 100 percent detection rate.
3.3. UAS Bioacoustic Monitoring of Bats
The logistic regression curves in Figure 11 show that detectability decreases (all species) with increasing flight height, with or without the control (i.e., ground/no UAS) recordings. Such results clearly suggest that small variations in flight altitude can greatly impact bat call detection.
Detectability depended significantly on flight altitude for all bat species considered individually, even without the control ground recordings (p-value < 0.05; Table 2). This was also true for low-frequency echolocation calls (e.g., Noctule) or social calls whose propagation distance was higher. Thus, the choice of UAS flight height when monitoring is a key factor in the detection of bats. For example, an effective vertical detection of less than 10 m underneath the forest canopy should be considered if the recorder is suspended just above the treetops (detectability > 0.5; Figure 11). This statistical dependency of detectability on flight height was certainly due to the propagation properties of ultrasound on one hand but, on the other hand, also due to the experimental setup itself (i.e., the orientation of the ultrasound speaker). Indeed, the cylindrical shape of the bird loudspeaker caused the emission of bird songs to be more omnidirectional. The beam width of the calls transmitted by the ultrasonic speaker was considerably limited (horizontal emissions). Nevertheless, this hypothesis should not be interpreted as a bias in the experimental setup because sonar calls of bats can be highly directional on the field, especially when either the frequency or emitter size is high [36].
On the basis of these observations, further comparisons of mean detections in relation to the different UAS flight heights were made with one-way analysis of variance (ANOVA) in order to make groups of altitudes for EDR estimates, keeping the control ground recordings apart.
The ANOVA showed a significant effect of altitude on detectability (p-value < 0.05). Detectability at a flight heights of 5 and 20 m was significantly different, and this was almost true for flight heights of 5 and 15 m (Table 3). Pairwise comparisons provided three distinct groups: flight heights of 5, 10, and 15, and 20, which were kept for EDR calculation by adding the control (ground) recordings.
All of the fitted detection probability regression models are available for the four groups in Supplementary Materials. The overall detection rate of bat sound was over 60% at the ground level recordings and dramatically fell between 0 and 38.9% at a height of 20 m (Table 4). The EDRs were considerably lower for the UAS-based recordings than for the ground-based control recordings. Globally, the EDR was halved between the control recordings and those acquired at a flight height of 5 m, except for the serotine, whose EDR only declined from 18.3 to 17.3 m (Table 4). This decrease is even more marked at a higher flight height. As expected, the barbastelle and the Natterer’s bat were no longer identifiable when the UAS was recording at any flight altitude due to the important overlap between their call and the UAS noise (Figure 7). The latter was still effectively detectable as well as Myotis species but only at a height of up to 5 m. In fact, steep FMs, which are characteristic of the genus, were still observable, but very high frequencies were quickly and strongly attenuated, thereby reducing the very wide bandwidth typical of Myotis nattereri.
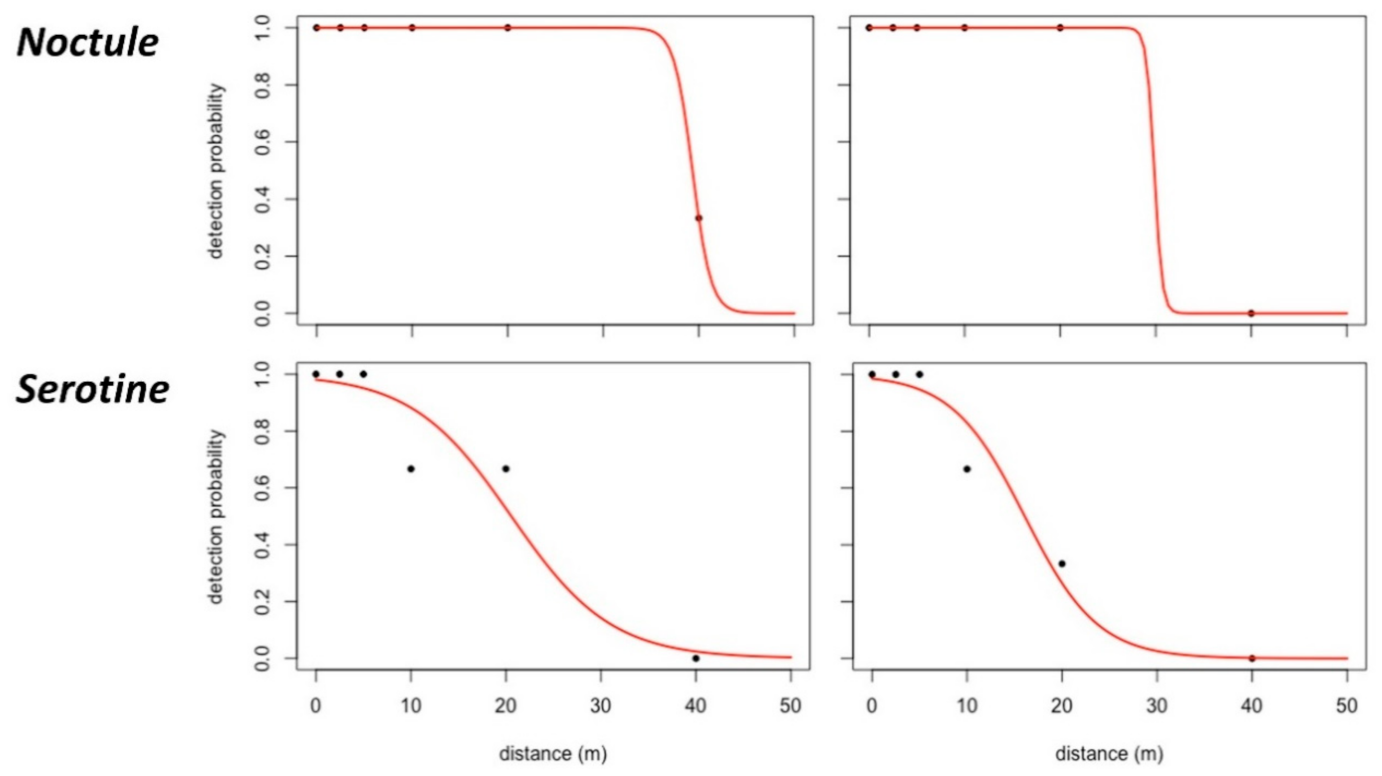
Social calls were effectively detected at further distances than echolocation calls, with or without using the UAS: +5.4 m for the noctule and +22.5 m for the common pipistrelle at ground level (control recordings in Table 4). This result suggests that low-frequency ultrasonic signals, such as the noctule’s echolocation and social calls or the common pipistrelle’s social calls, have a greater detection range than high-frequency ultrasonic signals. In general, the EDRs were smaller than expected based on existing scientific references. As an illustration, calls of the noctule can be recorded up to nearly 150 m with traditional methods [34], but the maximum EDR found for this species was only around 35–40 m for control recordings (Table 4 and Figure 12) and even smaller for UAS recordings (Figure 12). Detection of the social calls from the common pipistrelle was still possible at a horizontal distance of 20 m and a flight height of 5 m.
These results show an underestimation of the EDR by the approach, regardless of the presence or absence of UAS noise. Firstly, the experimentations were partially disturbed by the speaker power, which limited call intensity. Transmitted soundtracks never exceeded a sound level of 100 dB at 10 cm, thus limiting the effective detection radius of certain loud species such as the noctule. Secondly, trials were conducted during the daytime to avoid real bat interferences. “Daytime vertical temperature profiles typically create refractive regimes that impose more severe limits on maximum range of detection” [19]. Moreover, the relative humidity in the air is also higher at night, and because sound attenuation decreases when moisture increases [31], sounds propagate further and faster during the nighttime. It should therefore be appropriated to retry the same tests with a more powerful speaker, measurement, and adjustment of call sound levels in conjunction with reality, as well as even higher quality soundtracks (because sound level is directly dependent to soundtrack quality) to confirm this underestimation.
All the fitted detection probability regression models are available for the four groups in Supplementary Materials. The fitted detection probability models were mostly built with the detection rate at null horizontal distance for the UAS-based recordings below 100%. This was probably due to the directionality of the ultrasound transmitted by the speaker (cone shape) combined with the sound level, which provided better detection rates at small distances over 0 m (2.5 and 5 m). Indeed, a certain distance was needed for the acoustic signals to reach the microphone efficiently overhead. The ground-based recordings were clearly not affected by this phenomenon, because, for any horizontal distance, the microphone was always in the trajectory of the transmitted signal.
Finally, the EDR results highlight the deficiencies and pitfalls of the UAS-based recordings of bats, such as the restricted detection range, the sensitivity to call frequencies, and the inability to detect all species (the barbastelle, for example). Nevertheless, bioacoustic bat recordings with and without UAS noise were not conducted at the same vertical distance from the speaker. If this methodology was used in real-world conditions, the UAS device may be able to detect more individuals than the ground recorder for some higher altitude species.
4. Conclusions
This study offers one of the first insight about how UAS recording could be used for bioacoustic monitoring of birds and bats. A methodological workflow was proposed that can be straightforwardly replicated in other contexts to test the impact of other UAS bioacoustic recording in relation to the targeted species and the specific UAS design. While the potential was obvious for the bioacoustic monitoring of birds, the results are more moderate for bats, as a clear overlap between the sounds emitted by the UAS electrical speed controllers and some bat calls was highlighted.
Depending on the species, effective bird detection radii under controlled conditions were between 40 and 70 m for Wilson et al. [21] and roughly between 10 and 70 m for this study. The maximal values are the same, but some of the studied species were not detected as well as others. The gap between these minima can be partially explained by the difference among the selected species, which was higher in terms of SPL. In this study, the SPL range between the loudest and the quietest birds was about 15 dB, while it was 6 dB for Wilson et al. [21].
As bat echolocation ultrasounds have a lower propagation range, the potential of the UAS to move closer to bats flying over hard-to-reach high height areas (e.g., forest canopies) is important. Nevertheless, this study showed that horizontal and vertical distances had a more substantial impact on the detection of bat ultrasounds compared to the detection of the audible sounds of birds. Nevertheless, the study design (hardware setup) was highlighted as an important factor. This issue could be further overcome by technological development (e.g., a quieter UAS or higher quality microphones) as well as an innovative recording strategy. Such a strategy could be inspired by new recording techniques, such as the use of a winch unwinding a wire when the UAS is hovering, the combination of bioacoustic recordings with other UAS sensors (for example, thermal infrared imagery) [25], or the use of three-dimensional models derived from UAS visible imagery [41].
The quadcopter noise characterization tests showed a pronounced overlapping of bat calls with ESC noise. The development of a sound insulation system for this component of the UAS improved the UAS recording quality as well as the number of detectable species, such as the barbastelle. However, propeller and motor noises were not negligible for both birds and bats. This is why the continuous development of quieter drones (including quadcopters) will enable the use of this technology to carry out bioacoustic surveys in the near future. Blimp UASs [42] or plane–blimp hybrid UASs such as the Plimp (www.plimpairships.com) could revolutionize bioacoustic monitoring by drastically reducing the noise while maintaining a decent action range that is superior to conventional multicopters.
Supplementary Materials
The following are available online at https://0-www-mdpi-com.brum.beds.ac.uk/2504-446X/5/1/9/s1: Table S1: Sources of the bat soundtrack selection used for each repetition. All the tracks were adjusted to obtain a five-second duration playback; Figure S1: Fitted probability detection curves (red line) and observed detection probability for the control and the UAS group (expert 1) for the common blackbird (Turdus merula) (expert 1); Figure S2: Fitted probability detection curves (red line) and observed detection probability for the control and the UAS group (expert 1) for the common blackbird (Turdus merula) (expert 2); Figure S3: Fitted probability detection curves (red line) and observed detection probability for the control and the UAS group (expert 1) for the Eurasian blackcap (Sylvia atricapilla) (expert 1); Figure S4: Fitted probability detection curves (red line) and observed detection probability for the control and the UAS group (expert 1) for the Eurasian blackcap (Sylvia atricapilla) (expert 2; Figure S5: Fitted probability detection curves (red line) and observed detection probability for the control and the UAS group (expert 1) for the common chaffinch (Fringilla coelebs) (expert 1); Figure S6: Fitted probability detection curves (red line) and observed detection probability for the control and the UAS group (expert 1) for the common chaffinch (Fringilla coelebs) (expert 2); Figure S7: Fitted probability detection curves (red line) and observed detection probability for the control and the UAS group (expert 1) for the goldcrest (Regulus regulus) (expert 1); Figure S8: Fitted probability detection curves (red line) and observed detection probability for the control and the UAS group (expert 1) for the goldcrest (Regulus regulus) (expert 2); Figure S9: Fitted probability detection curves (red line) and observed detection probability for the control and the UAS group (expert 1) for the reed bunting (Emberiza schoeniclus) (expert 1); Figure S10: Fitted probability detection curves (red line) and observed detection probability for the control and the UAS group (expert 1) for the reed bunting (Emberiza schoeniclus) (expert 2); Figure S11: Fitted probability detection curves (red line) and observed detection probability for the control and the UAS group (expert 1) for the sedge warbler (Acrocephalus schoenobaenus) (expert 1); Figure S12: Fitted probability detection curves (red line) and observed detection probability for the control and the UAS group (expert 1) for the sedge warbler (Acrocephalus schoenobaenus) (expert 2); Figure S13: Fitted probability detection curves (red line) and observed detection probability for the control and the UAS group (expert 1) for the song thrush (Turdus philomelos) (expert 1); Figure S14: Fitted probability detection curves (red line) and observed detection probability for the control and the UAS group (expert 1) for the song thrush (Turdus philomelos) (expert 2); Figure S15: Fitted probability detection curves (red line) and observed detection probability for the control and the UAS group (expert 1) for the common wood pigeon (Columba palumbus) (expert 1); Figure S16: Fitted probability detection curves (red line) and observed detection probability for the control and the UAS group (expert 1) for the common wood pigeon (Columba palumbus) (expert 2); Figure S17: Fitted probability detection curves (red line) and observed detection probability for the control and the UAS group (expert 1) for the Eurasian wren (Troglodytes troglodytes) (expert 1); Figure S18: Fitted probability detection curves (red line) and observed detection probability for the control and the UAS group (expert 1) for the Eurasian wren (Troglodytes troglodytes) (expert 2); Figure S19: Fitted probability detection curves (red line) and observed detection probability for the barbastelle (Barbastella barbastellus) echolocation calls—control ground recordings; Figure S20: Fitted probability detection curves (red line) and observed detection probability for Natterer’s bat (Myotis nattereri) echolocation calls—control ground, 5 m and 10–15 m recordings; Figure S21: Fitted probability detection curves (red line) and observed detection probability for the noctule (Nyctalus noctula) echolocation calls—control ground, 5, 10–15, and 20 m recordings; Figure S22: Fitted probability detection curves (red line) and observed detection probability for the noctule (Nyctalus noctula) social calls—control ground, 5, 10–15, and 20 m recordings; Figure S23: Fitted probability detection curves (red line) and observed detection probability for the common pipistrelle (Pipistrellus pipistrellus) echolocation calls—control ground, 5 and 10–15 m recordings; Figure S24: Fitted probability detection curves (red line) and observed detection probability for the common pipistrelle (Pipistrellus pipistrellus) social calls—control ground, 5, 10–15, and 20 m recordings; Figure S25: Fitted probability detection curves (red line) and observed detection probability for the serotine (Eptesicus serotinus) echolocation calls—control ground, 5, 10–15, and 20 m recordings.
Author Contributions
Conceptualization, A.M. and S.B.; methodology, A.M. and S.B.; formal analysis, S.B.; data curation, S.B.; writing—original draft preparation, A.M. and S.B.; writing—review and editing, A.M., S.B. and P.L.; supervision, A.M. and P.L. All authors have read and agreed to the published version of the manuscript.
Funding
This research received no external funding.
Institutional Review Board Statement
Not applicable.
Informed Consent Statement
Not applicable.
Data Availability Statement
Data sharing not applicable.
Acknowledgments
The authors would like to thank the Plecotus group of the nature conservancy association Natagora for providing logistical and scientific support during the bat trial. These trials would not have been possible without the help of Cédric Geerts for the UAS operations and the help of two birdwatching experts, Jean-Philippe Lefin and Gaëtan Kleijnen, who performed the identification of bird sounds. This research was carried out following the work completed by a group of students: Gauthier Deschamps, Chloé Zordan, and Deborah Nardese. The authors wish to express their gratitude to them.
Conflicts of Interest
The authors declare no conflict of interest.
References
- Johnson, C.N.; Balmford, A.; Brook, B.W.; Buettel, J.C.; Galetti, M.; Guangchun, L.; Wilmshurst, J.M. Biodiversity Losses and Conservation Responses in the Anthropocene. Science 2017, 356, 270–275. [Google Scholar] [CrossRef]
- United Nations. Ecosystems and Human Well-Being; Island Press: Washington, DC, USA, 2005; Volume 5. [Google Scholar]
- IUCN. The IUCN Red List of Threatened Species. Version 2020–1; IUCN: Gland, Switzerland; Cambridge, UK, 2020. [Google Scholar]
- Cardinale, B.J.; Duffy, J.E.; Gonzalez, A.; Hooper, D.U.; Perrings, C.; Venail, P.; Narwani, A.; Mace, G.M.; Tilman, D.; Wardle, D.A.; et al. Biodiversity Loss and Its Impact on Humanity. Nature 2012, 486, 59–67. [Google Scholar] [CrossRef] [PubMed]
- Kasso, M.; Balakrishnan, M. Ecological and Economic Importance of Bats (Order Chiroptera). Int. Sch. Res. Not. 2013, 2013. [Google Scholar] [CrossRef] [Green Version]
- Şekercioğlu, Ç.H.; Daily, G.C.; Ehrlich, P.R. Ecosystem Consequences of Bird Declines. Proc. Natl. Acad. Sci. USA 2004, 101, 18042–18047. [Google Scholar] [CrossRef] [PubMed] [Green Version]
- Buckland, S.T. Point-Transect Surveys for Songbirds: Robust Methodologies. Auk 2006, 123, 345–357. [Google Scholar] [CrossRef]
- Gregory, R.D.; Gibbons, D.W.; Donald, P.F. Bird Census and Survey Techniques. Bird Ecol. Conserv. 2004, 17–56. [Google Scholar]
- Sugai, L.S.M.; Silva, T.S.F.; Ribeiro, J.W., Jr.; Llusia, D. Terrestrial Passive Acoustic Monitoring: Review and Perspectives. BioScience 2019, 69, 15–25. [Google Scholar] [CrossRef]
- Walters, C.L.; Collen, A.; Lucas, T.; Mroz, K.; Sayer, C.A.; Jones, K.E. Challenges of using bioacoustics to globally monitor bats. In Bat Evolution, Ecology, and Conservation; Springer: Berlin/Heidelberg, Germany, 2013; pp. 479–499. [Google Scholar]
- Anderson, K.; Gaston, K.J. Lightweight Unmanned Aerial Vehicles Will Revolutionize Spatial Ecology. Front. Ecol. Environ. 2013, 11, 138–146. [Google Scholar] [CrossRef] [Green Version]
- Michez, A.; Morelle, K.; Lehaire, F.; Widar, J.; Authelet, M.; Vermeulen, C.; Lejeune, P. Use of Unmanned Aerial System to Assess Wildlife (Sus Scrofa) Damage to Crops (Zea Mays). J. Unmanned Veh. Syst. 2016, 4, 266–275. [Google Scholar] [CrossRef] [Green Version]
- Bebronne, R.; Michez, A.; Leemans, V.; Vermeulen, P.; Dumont, B.; Mercatoris, B. Characterisation of fungal diseases on winter wheat crop using proximal and remote multispectral imaging. In Precision Agriculture’19; Wageningen Academic Publishers: Cambridge, MA, USA, 2019; pp. 415–421. [Google Scholar]
- Michez, A.; Philippe, L.; David, K.; Sébastien, D.; Christian, D.; Bindelle, J. Can Low-Cost Unmanned Aerial Systems Describe the Forage Quality Heterogeneity? Insight from a Timothy Pasture Case Study in Southern Belgium. Remote Sens. 2020, 12, 1650. [Google Scholar] [CrossRef]
- Michez, A.; Lejeune, P.; Bauwens, S.; Herinaina, A.A.L.; Blaise, Y.; Castro Muñoz, E.; Lebeau, F.; Bindelle, J. Mapping and Monitoring of Biomass and Grazing in Pasture with an Unmanned Aerial System. Remote Sens. 2019, 11, 473. [Google Scholar] [CrossRef] [Green Version]
- Linchant, J.; Lisein, J.; Semeki, J.; Lejeune, P.; Vermeulen, C. Are Unmanned Aircraft Systems (UAS s) the Future of Wildlife Monitoring? A Review of Accomplishments and Challenges. Mammal Rev. 2015, 45, 239–252. [Google Scholar] [CrossRef]
- Seymour, A.; Dale, J.; Hammill, M.; Halpin, P.; Johnston, D. Automated Detection and Enumeration of Marine Wildlife Using Unmanned Aircraft Systems (UAS) and Thermal Imagery. Sci. Rep. 2017, 7, 1–10. [Google Scholar] [CrossRef] [PubMed] [Green Version]
- Hodgson, J.C.; Mott, R.; Baylis, S.M.; Pham, T.T.; Wotherspoon, S.; Kilpatrick, A.D.; Raja Segaran, R.; Reid, I.; Terauds, A.; Koh, L.P. Drones Count Wildlife More Accurately and Precisely than Humans. Methods Ecol. Evol. 2018, 9, 1160–1167. [Google Scholar] [CrossRef] [Green Version]
- Fristrup, K.M.; Clark, C.W. Acoustic Monitoring of Threatened and Endangered Species in Inaccessible Areas; Cornell University: Ithaca, NY, USA, 2009. [Google Scholar]
- Frommolt, K.-H.; Tauchert, K.-H. Applying Bioacoustic Methods for Long-Term Monitoring of a Nocturnal Wetland Bird. Ecol. Inform. 2014, 21, 4–12. [Google Scholar] [CrossRef]
- Wilson, A.M.; Barr, J.; Zagorski, M. The Feasibility of Counting Songbirds Using Unmanned Aerial Vehicles. Auk Ornithol. Adv. 2017, 134, 350–362. [Google Scholar] [CrossRef]
- Klingbeil, B.T.; Willig, M.R. Bird Biodiversity Assessments in Temperate Forest: The Value of Point Count versus Acoustic Monitoring Protocols. PeerJ 2015, 3, e973. [Google Scholar] [CrossRef] [Green Version]
- Aide, T.M.; Corrada-Bravo, C.; Campos-Cerqueira, M.; Milan, C.; Vega, G.; Alvarez, R. Real-Time Bioacoustics Monitoring and Automated Species Identification. PeerJ 2013, 1, e103. [Google Scholar] [CrossRef] [Green Version]
- Celis-Murillo, A.; Deppe, J.L.; Ward, M.P. Effectiveness and Utility of Acoustic Recordings for Surveying Tropical Birds. J. Field Ornithol. 2012, 83, 166–179. [Google Scholar] [CrossRef] [Green Version]
- Kloepper, L.N.; Kinniry, M. Recording Animal Vocalizations from a UAV: Bat Echolocation during Roost Re-Entry. Sci. Rep. 2018, 8, 1–6. [Google Scholar] [CrossRef]
- Buckland, S.T.; Anderson, D.R.; Burnham, K.P.; Laake, J.L.; Borchers, D.L.; Thomas, L. Introduction to Distance Sampling: Estimating Abundance of Biological Populations; Oxford University Press: Oxford, UK, 2001. [Google Scholar]
- Pérez-Granados, C.; Bota, G.; Giralt, D.; Albarracín, J.; Traba, J. Cost-Effectiveness Assessment of Five Audio Recording Systems for Wildlife Monitoring: Differences between Recording Distances and Singing Direction. Ardeola 2019, 66, 311–325. [Google Scholar] [CrossRef]
- Rempel, R.S.; Francis, C.M.; Robinson, J.N.; Campbell, M. Comparison of Audio Recording System Performance for Detecting and Monitoring Songbirds. J. Field Ornithol. 2013, 84, 86–97. [Google Scholar] [CrossRef]
- Tupinier, Y. L’univers Acoustique Des Chiroptères d’Europe; Société linnéenne de Lyon: Lyon, France, 1996. [Google Scholar]
- Brackenbury, J. Power Capabilities of the Avian Sound-Producing System. J. Exp. Biol. 1979, 78, 163–166. [Google Scholar]
- Snell-Rood, E.C. The Effect of Climate on Acoustic Signals: Does Atmospheric Sound Absorption Matter for Bird Song and Bat Echolocation? J. Acoust. Soc. Am. 2012, 131, 1650–1658. [Google Scholar] [CrossRef]
- Hill, A.P.; Prince, P.; Snaddon, J.L.; Doncaster, C.P.; Rogers, A. AudioMoth: A Low-Cost Acoustic Device for Monitoring Biodiversity and the Environment. HardwareX 2019, 6, e00073. [Google Scholar] [CrossRef]
- Hill, A.P.; Prince, P.; Piña Covarrubias, E.; Doncaster, C.P.; Snaddon, J.L.; Rogers, A. AudioMoth: Evaluation of a Smart Open Acoustic Device for Monitoring Biodiversity and the Environment. Methods Ecol. Evol. 2018, 9, 1199–1211. [Google Scholar] [CrossRef] [Green Version]
- Arthur, L.; Lemaire, M. Les Chauves-Souris de France Belgique Luxembourg et Suisse; BIOTOPE: Mèze, France, 2009. [Google Scholar]
- Fenton, M.B.; Grinnell, A.D.; Popper, A.N.; Fay, R.R. Bat Bioacoustics; Springer: Berlin/Heidelberg, Germany, 2016; Volume 54. [Google Scholar]
- Jakobsen, L.; Brinkløv, S.; Surlykke, A. Intensity and Directionality of Bat Echolocation Signals. Front. Physiol. 2013, 4, 89. [Google Scholar] [CrossRef] [PubMed] [Green Version]
- Yip, D.; Leston, L.; Bayne, E.; Sólymos, P.; Grover, A. Experimentally Derived Detection Distances from Audio Recordings and Human Observers Enable Integrated Analysis of Point Count Data. Avian Conserv. Ecol. 2017, 12, 11. [Google Scholar] [CrossRef] [Green Version]
- Sólymos, P.; Matsuoka, S.M.; Bayne, E.M.; Lele, S.R.; Fontaine, P.; Cumming, S.G.; Stralberg, D.; Schmiegelow, F.K.; Song, S.J. Calibrating Indices of Avian Density from Non-Standardized Survey Data: Making the Most of a Messy Situation. Methods Ecol. Evol. 2013, 4, 1047–1058. [Google Scholar] [CrossRef]
- Constantine, M. The Sound Approach to Birding: A Guide to Understanding Bird Sound; The Sound Approach: Poole, UK, 2006. [Google Scholar]
- Tucker, J.; Musgrove, A.; Reese, A. The Ability to Hear Goldcrest Song and the Implications for Bird Surveys. Br. Birds 2014, 107, 232–233. [Google Scholar]
- Wilson, S.J.; Hedley, R.W.; Rahman, M.M.; Bayne, E.M. Use of an Unmanned Aerial Vehicle and Sound Localization to Determine Bird Microhabitat. J. Unmanned Veh. Syst. 2020. [Google Scholar] [CrossRef]
- i Badia, S.B.; Pyk, P.; Verschure, P.F. A Biologically Based Flight Control System for a Blimp-Based UAV. In Proceedings of the 2005 IEEE International Conference on Robotics and Automation, Barcelona, Spain, 18–22 April 2005; pp. 3053–3059. [Google Scholar]
Figure 1.
Left: the hovering unmanned aerial vehicle (UAS) is recording sounds played by a speaker located on the tripod on the ground. The UAS hovers up and down to test several flight heights, while the speakers are moved to test the different horizontal distances.
Figure 1.
Left: the hovering unmanned aerial vehicle (UAS) is recording sounds played by a speaker located on the tripod on the ground. The UAS hovers up and down to test several flight heights, while the speakers are moved to test the different horizontal distances.

Figure 2.
Recorders and speakers used for the trials. (A) ZOOM H1 Handy Recorder equipped with a hairy windscreen (WSU-1). (B) Avisoft UltraSoundGate Player BL Pro 2, AudioMoth recorder and insulation casing with a 26 kg/m3 density pyramid foam (casing = 6 × 8 × 7 cm; top = 13 × 15 cm).
Figure 2.
Recorders and speakers used for the trials. (A) ZOOM H1 Handy Recorder equipped with a hairy windscreen (WSU-1). (B) Avisoft UltraSoundGate Player BL Pro 2, AudioMoth recorder and insulation casing with a 26 kg/m3 density pyramid foam (casing = 6 × 8 × 7 cm; top = 13 × 15 cm).

Figure 3.
Raven Lite spectrograms of quadcopter audible noises at several vertical distances, recorded by the ZOOM H1 Handy Recorder. The reduction of the UAS noise becomes clear from 8 m, the distance used as the nylon length for the UAS recordings.
Figure 3.
Raven Lite spectrograms of quadcopter audible noises at several vertical distances, recorded by the ZOOM H1 Handy Recorder. The reduction of the UAS noise becomes clear from 8 m, the distance used as the nylon length for the UAS recordings.

Figure 4.
Raven Lite spectrograms of quadcopter ultrasonic noises at several vertical distances (1 to 40 m), recorded by the AudioMoth without the insulation casing.
Figure 4.
Raven Lite spectrograms of quadcopter ultrasonic noises at several vertical distances (1 to 40 m), recorded by the AudioMoth without the insulation casing.

Figure 5.
Raven Lite spectrograms of quadcopter ultrasonic noises at several vertical distances (1 to 20 m), recorded by the AudioMoth with the insulation casing.
Figure 5.
Raven Lite spectrograms of quadcopter ultrasonic noises at several vertical distances (1 to 20 m), recorded by the AudioMoth with the insulation casing.

Figure 6.
Raven Lite spectrograms of quadcopter ultrasonic noises at 1 and 8 m (i.e., the nylon line length used for UAS bioacoustic recordings), recorded by the AudioMoth with the insulation casing. Left side = UAS on and motors switched off, middle = motors running without propellers, right side = motors running with propellers.

Figure 7.
UAS noise in both audible and ultrasound ranges in relation to the sounds of interest. The greyscale color gradient symbolizes the reduction of UAS noise intensity.
Figure 7.
UAS noise in both audible and ultrasound ranges in relation to the sounds of interest. The greyscale color gradient symbolizes the reduction of UAS noise intensity.

Figure 8.
Logistic regression curves for the effect of altitude (all bird species). Besides significant differences between the experts in terms probability of detection, the logistic regression curves show, for both experts, a stable detectability across flight height.
Figure 8.
Logistic regression curves for the effect of altitude (all bird species). Besides significant differences between the experts in terms probability of detection, the logistic regression curves show, for both experts, a stable detectability across flight height.

Figure 9.
Effective detection radius (EDR) computed for bird species (UAS and control groups) using the “Distance” R package and the regression approach based on the observation of expert 1.
Figure 9.
Effective detection radius (EDR) computed for bird species (UAS and control groups) using the “Distance” R package and the regression approach based on the observation of expert 1.

Figure 10.
Fitted probability detection curves (red line) and observed detection probability for the control (ground recording, no UAS) and UAS group (expert 1) for the common blackbird, common chaffinch, and European wren. For these species, the curves highlight potential detection outside the tested horizontal distances. All the fitted detection curves are available in Supplementary Materials for both the expert and the groups (UAS and control recordings).

Figure 11.
Logistic regression curves for the effect of altitude on overall bat species detectability, calculated with and without the control (ground/no UAS) bioacoustic ultrasound recordings.
Figure 11.
Logistic regression curves for the effect of altitude on overall bat species detectability, calculated with and without the control (ground/no UAS) bioacoustic ultrasound recordings.

Figure 12.
Detection probability functions of the noctule and serotine (echolocation calls) on the basis of ground recordings (left) and UAS recordings at a flight height of 5 m.
Figure 12.
Detection probability functions of the noctule and serotine (echolocation calls) on the basis of ground recordings (left) and UAS recordings at a flight height of 5 m.


Table 1.
Chi-square tests of independence (p-value) for differences in detection between several UAS altitudes, and thus for each expert. p-values below 0.05 are in bold character.
Table 1.
Chi-square tests of independence (p-value) for differences in detection between several UAS altitudes, and thus for each expert. p-values below 0.05 are in bold character.
| All Recording (UAS + Control) | UAS Only | |||
|---|---|---|---|---|
| Species | p-Value Expert 1 | p-Value Expert 2 | p-Value Expert 1 | p-Value Expert 2 |
| Common blackbird | 0.6279 | 0.3035 | 0.5698 | 0.5698 |
| Common chaffinch | 0.3497 | 0.2026 | 0.7251 | 0.492 |
| Common reed bunting | 0.3335 | 0.002408 | 0.5664 | 0.09275 |
| Common wood pigeon | 3.231 × 10⁻⁶ | 5.133 × 10⁻⁵ | 0.1054 | 0.4235 |
| Eurasian blackcap | 0.1718 | 0.2741 | 0.3926 | 0.9285 |
| Eurasian wren | 0.3535 | 0.02517 | 0.348 | 0.09558 |
| Goldcrest | 0.6471 | 0.04819 | 0.7227 | 0.05697 |
| Sedge warbler | 0.009072 | 7.7 × 10⁻⁶ | 0.595 | 0.358 |
| Song thrush | 0.3497 | 0.01959 | 0.7251 | 0.2212 |
Table 2.
Chi-square tests of independence (p-value) for the difference in detection between several UAS altitudes. NA means that there was no detection at all. p-values below 0.05 are in bold.
Table 2.
Chi-square tests of independence (p-value) for the difference in detection between several UAS altitudes. NA means that there was no detection at all. p-values below 0.05 are in bold.
| All Recordings | UAS Recordings | ||
|---|---|---|---|
| Call Type | Bat Species | p-Value (n = 90) | p-Value (n = 72) |
| Echolocation | Barbastelle | 3.398 × 10⁻¹⁰ | NA |
| Common pipistrelle | 4.427 × 10⁻⁶ | 0.00084 | |
| Natterer’s bat (Myotis) | 3.195 × 10⁻⁶ | NA (0.0005318) | |
| Noctule | 6.927 × 10⁻⁵ | 0.000501 | |
| Serotine | 2.838 × 10⁻⁵ | 0.0002368 | |
| Social | Common pipistrelle | 1.612 × 10⁻⁵ | 0.00034 |
| Noctule | 0.0001306 | 0.00648 |
Table 3.
Multiple comparisons of bat detectability means regarding altitude using Tukey’s method. p-values below 0.05 are in bold.
Table 3.
Multiple comparisons of bat detectability means regarding altitude using Tukey’s method. p-values below 0.05 are in bold.
| Combination | Estimate | Std. Error | t Value | Pr(>|t|) |
|---|---|---|---|---|
| 10–5 | −11.81 | 13.65 | −0.865 | 0.8226 |
| 15–5 | −33.33 | 13.65 | −2.441 | 0.0923 |
| 20–5 | −37.48 | 13.65 | −2.745 | 0.0483 |
| 15–10 | −21.51 | 13.65 | −1.576 | 0.4083 |
| 20–10 | −25.66 | 13.65 | −1.879 | 0.2595 |
| 20–15 | −4.15 | 13.65 | −0.304 | 0.9900 |
Table 4.
Comparison of overall detection rate (det., %) and the EDR for bats calls recorded over different flight heights.
Table 4.
Comparison of overall detection rate (det., %) and the EDR for bats calls recorded over different flight heights.
| 0 m (Control) | 5 m | 10 and 15 m | 20 m | ||||||
|---|---|---|---|---|---|---|---|---|---|
| Call Type | Bat Species | Det. (%) | EDR (m) | Det. (%) | EDR (m) | Det. (%) | EDR (m) | Det. (%) | EDR (m) |
| Echolocation | Barbastelle | 61.1 | 9.90 | 0.0 | 0.0 | 0.0 | 0.00 | 0.0 | 0.00 |
| Common pipistrelle | 61.1 | 9.90 | 38.9 | 4.15 | 5.6 | 1.42 | 0.0 | 0.00 | |
| Myotis | 66.7 | 5.00 | 44.4 | 0.00 | 11.1 | 0.00 | 0.0 (0.0) | 0.00 | |
| Noctule | 88.9 | 15.80 | 83.3 | 4.45 | 63.9 | 3.59 | 27.8 | 0.00 | |
| Serotine | 72.2 | 38.97 | 66.7 | 20.00 | 33.3 | 15.84 | 5.6 | 5.72 | |
| Social | Common pipistrelle | 77.8 | 17.48 | 72.2 | 15.80 | 27.8 | 6.32 | 16.7 | 6.88 |
| Noctule | 100.0 | 29.86 | 83.3 | 19.48 | 66.7 | 5.73 | 38.9 | 4.35 | |
Publisher’s Note: MDPI stays neutral with regard to jurisdictional claims in published maps and institutional affiliations. |
© 2021 by the authors. Licensee MDPI, Basel, Switzerland. This article is an open access article distributed under the terms and conditions of the Creative Commons Attribution (CC BY) license (http://creativecommons.org/licenses/by/4.0/).
Share and Cite
MDPI and ACS Style
Michez, A.; Broset, S.; Lejeune, P. Ears in the Sky: Potential of Drones for the Bioacoustic Monitoring of Birds and Bats. Drones 2021, 5, 9. https://0-doi-org.brum.beds.ac.uk/10.3390/drones5010009
AMA Style
Michez A, Broset S, Lejeune P. Ears in the Sky: Potential of Drones for the Bioacoustic Monitoring of Birds and Bats. Drones. 2021; 5(1):9. https://0-doi-org.brum.beds.ac.uk/10.3390/drones5010009
Chicago/Turabian StyleMichez, Adrien, Stéphane Broset, and Philippe Lejeune. 2021. "Ears in the Sky: Potential of Drones for the Bioacoustic Monitoring of Birds and Bats" Drones 5, no. 1: 9. https://0-doi-org.brum.beds.ac.uk/10.3390/drones5010009