1. Introduction
In the last hundred years, a total of six epidemics have swept the world, including the latest epidemic caused by the SARS-CoV-2 virus. At the end of World War I, in 1918, the Spanish flu caused a pandemic. On a scale of 1 to 5 showing the mortality rate of epidemics, this was classified as the most severe, category 5, as more than 2 percent of cases resulted in death. From January 1918 to December 1920, the Spanish flu infected just over a quarter of the world’s population at that time, 500 million people. The mortality has been put at least 17 million, but pessimistic estimates record the deaths of 50 or even 100 million people [
1]. Almost exactly 100 years after Spanish flu, we face the sixth pandemic, caused by the SARS-CoV-2 virus, commonly known as COVID-19 or novel coronavirus. At the moment, more than 165 million people are infected while mortality exceeds 3.5 million all over the world [
2].
To overcome the difficulties caused by pandemic, we should evaluate any alternative technique to confront the new coronavirus. Drones, as the most dynamically developing part of the aviation industry, can be a very special tool in the hand of experts fighting against this pandemic. Drones have been effectively used in the past for a vast number of applications including, among others, area monitoring [
3,
4,
5], special logistic support [
6,
7,
8,
9], and spraying pesticide [
10,
11]. None of these applications, including the latter, have been developed or tailored for pandemic use. Thus, although some initiatives for developing drones to cope with the new coronavirus have already been identified [
12,
13,
14,
15,
16,
17,
18,
19], it seems that the parameters that impact their effectiveness have not been appropriately studied as yet.
One of the main features of managing any kind of pandemic is that authorized organizations suffer from a lack of resources to manage the situation in an optimized way. The situation can be the same as in the case of disasters [
20]. In the case of a pandemic, we focus mainly on the overloaded work or insufficient capacity of hospitals, ambulances, and medical services; however, partner organizations, police, civil protection, or even government agencies can also fall into insufficient service. Experts must focus on higher effectiveness when managing the pandemic, meaning that they should use any new tools, facilities, or methods that could help to mitigate the lack of resources mentioned above.
Smaller drones may be suitable for observation, while larger ones may even be used for agricultural spraying. The use of drones for agricultural purposes is currently the most dynamically developing application [
21,
22], so the appropriate tools are available in almost all countries. Experience has shown that disinfectant is applied in the same way as spray liquid used in agriculture [
12,
13,
14]; flying above a given area at a specified altitude and speed with the set fluid flow, the disinfectant is delivered to the surface by means of a pump (
Figure 1). The anchor points of good practice have been determined by virologists, such as the amount of disinfectant required per unit area, in the case of concentrating the mix rate, the required degree of coverage, and perhaps the frequency of spraying in the same area [
23,
24].
At the moment of writing this manuscript, only one detailed scientific publication on using drones for spraying disinfectant liquids against new coronavirus has been identified [
19]. This work made flights with one specific drone in three different areas and measured the coverage in three different flight altitudes. The approach of this study was practical, focused on the operational use of the drone and giving specific examples. The present study provides a theoretical approach to point at the maximum potential of using drones in disinfection missions.
It is worth mentioning further scientific papers developing systems to make COVID-19 pandemic management more professional. The research of Kumar et al. [
15] focused on drone-based networked systems, including the possibility of drone usage for spraying disinfectant. In this study was observed an area of 2 km radius sprayed in 10 min; however, there was no relevant data regarding the conditions. The work of Alsamhi et al. [
16] gave framework and proposed a system to use multi-drones in decentralized ways. In this research, drone usage for spraying disinfectant was also mentioned; however, there was no detailed information for the practice. There was much relevant information regarding sanitization in the paper of Khan et al. [
17], who referred to the work of Singla [
18]. In the latter work, as only one option, an area of 100,000 m
2 was covered by 16 l disinfectant using a drone. Based on this, the authors concluded that there is no standard procedure for spraying disinfectant by drone in order to optimize the mission and that only observed examples from practice can be found.
On the other hand, independently from the technology, the massive use of disinfectants poses potential risks not just to urban wildlife but even to humans. Nabi et al. [
24] collected many negative examples that happened in urban ecosystems, and Khan et al. [
17] drew attention to problems for humans. Based on these works, sprayed disinfectants should be effective enough against COVID-19; however, as little disinfectant as possible should be used to reduce the potential health risk. This paper helps to find this balance with drone-related parameters.
In this work, the potential of using drones for spraying disinfectant liquid to fight against the COVID-19 pandemic is examined. The aim of the present work was to study the effect of three drone-related parameters, the flow rate of the sprayed disinfectant liquid, the flight speed, and the flight altitude during the mission, on the effectiveness of the disinfection operation. For all three parameters, the study calculated five values that can be implemented in practice.
The manuscript is organized as follows:
Section 2 describes the materials and methods, where both the requirements of effective disinfectant coverage and the parameters influencing effectiveness are presented. For the calculation, a 3D matrix was created in which the optimal surface coverage of disinfectant was presented by the influencing parameters, that is, flow rate, flight speed, and flight altitude.
Section 3 depicts the results of the calculations in tables and with 3D functions.
Section 4 focuses on discussion and topics suggested for further research.
Section 5 briefly summarizes the results.
2. Materials and Methods
2.1. Adequacy of Drone Spraying
Immediate adaptation of the agricultural application seems simple and effective, but in order to increase future efficiency, it is necessary to develop a protocol for the procedure. In literature, the size of the disinfected area varies depending on the quality of the spraying and the performance of the drone used and ranges between 10 and 40 hectares per day [
12,
13]. This value is of the same order of magnitude as in agricultural application. The type and synthesis of the disinfectant substances also varies. The one mostly adopted is a chlorine-containing chemical with a mixing ratio of 1 to 3% [
12,
13], but other substances have been proposed as well: alcohol, bleach, and a peroxide, the composition of which is not known exactly [
14]. There are platforms where substances like bleach and alcohol have also been officially suggested as options for decontamination [
23,
24,
25,
26]. Based on the above, it can be seen that the composition of the disinfectant fluids used is different, not uniformly defined.
Based on reports and published evaluations, there are no direct data about the required value of surface coverage [
23,
25,
26,
27,
28,
29]; however, according to personal consultation with a virologist [
30], it is not the amount of disinfectant applied per unit area that is important, but the ability to form a full coverage by a thin or film-like layer, if possible. The authors found that this can be verified by the work of Khan et al. [
17], which gave an overview of the disinfection processes and the materials used. Complete coverage of the surface can be achieved by various methods, e.g., by wiping, which creates a very thin film layer with thickness expressed in nanometers [
28,
29]. Cleaning and disinfection are recommended for smaller rooms; e.g., for offices, the method of wiping with disinfectant liquid is also recommended by the authorities [
27]. Therefore, the effectiveness of this method is accepted by practice as appropriate for the case of COVID-19.
Creating a cohesive film layer by using drone spraying means using the free falling of droplets, which is obviously a more complex process than the wiping method. When spraying with a drone, the number of drops falling on the unit surface, the size of the droplets, the characteristics of the liquid (e.g., surface tension), the surface roughness, the flight parameters, and the effect of the wind must be taken into account. Moreover, humidity, evaporation intensity, and air and surface temperature also influence the efficiency of disinfection. In this work, only the impact of the flight parameters and the flow rate were evaluated as key elements for effectiveness, while the rest of the parameters were considered as stable and ideal. That is, the study assumed that there is no wind that blows the droplets, there is no evaporation reducing the sprayed amount of liquid, and when the droplets come to the surface, they spread out so that they cover the entire surface. In this way, we could determine the theoretically achievable optima, which must be taken into account with a safety factor.
The behavior of thin liquid layers on surfaces and the conditions of droplet dispersal have been studied by several authors, based on which it can be proved that the thickness of the film layer can be formed in nanometer dimensions [
17,
31,
32,
33,
34,
35,
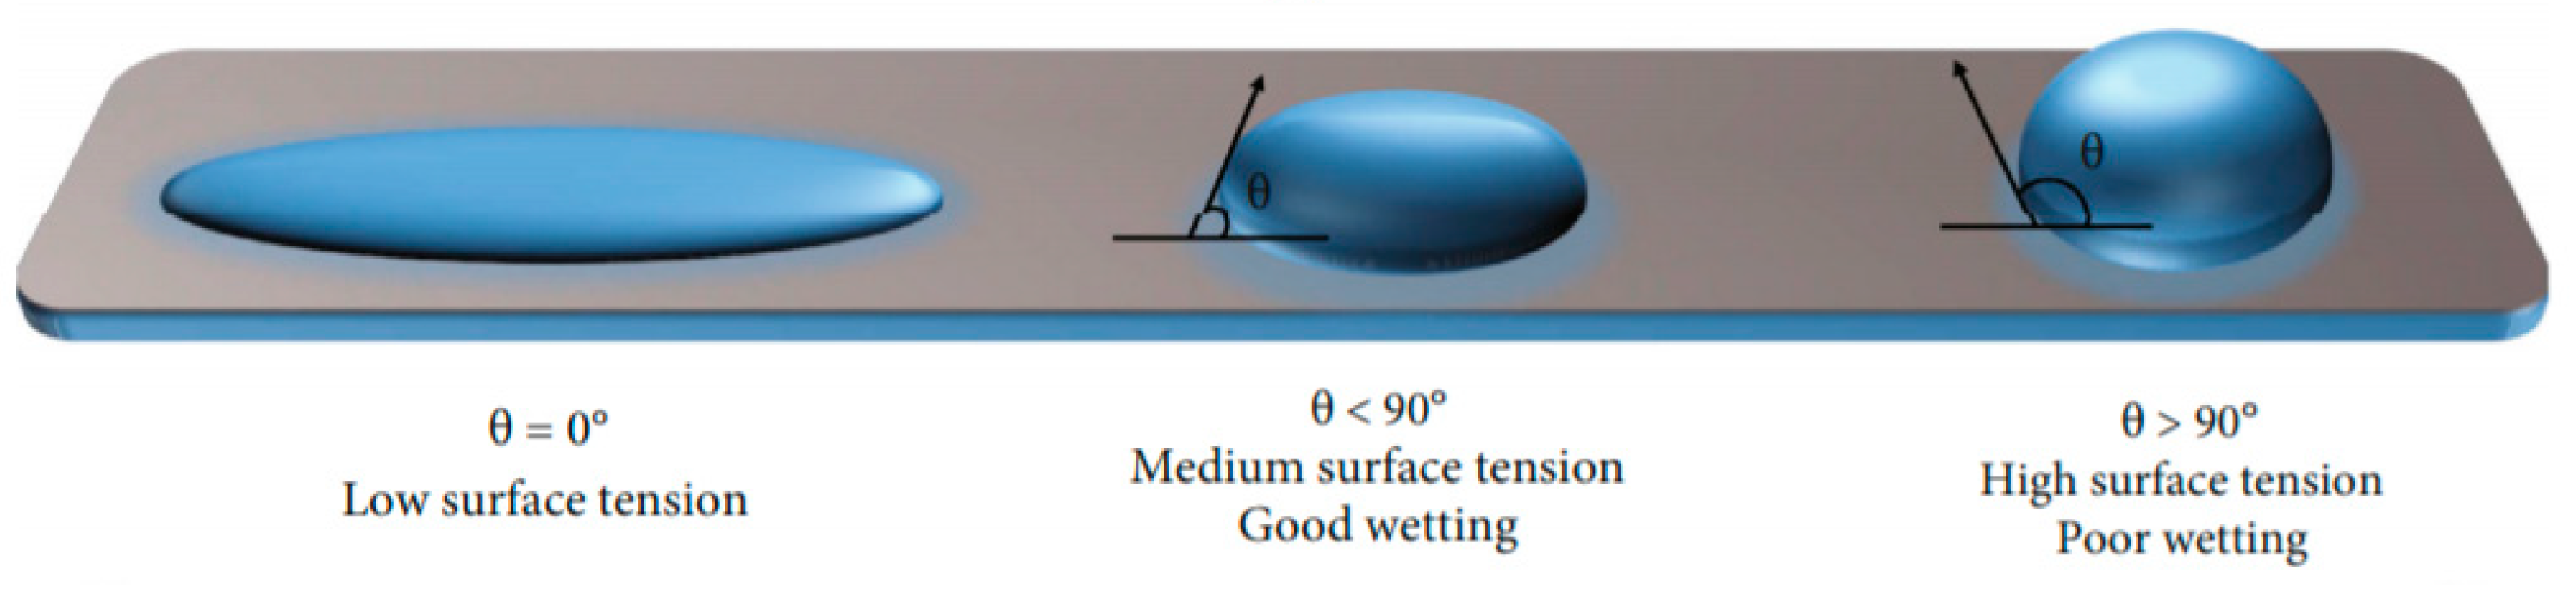
36]. In the case of wiping, the thickness of the film layer is obviously thinner than when examining the spontaneous spreading of the droplets, so the results of the latter are also acceptable as a base of good practice for drone spraying. Based on the above, our task with drone spraying is to create a film layer at least as thick as can be formed by wiping. The thickness of the cohesive film layer that can be formed by wiping is influenced by a number of factors, e.g., the characteristics of the fluid, the degree of surface tension, and the roughness and shape of the surface (
Figure 2). The unit of the molecular diameter of water is 0.317 nm. The recommended thickness of the film layers varies from 50 [
37] to 100 nm [
31]. The size of COVID-19 virus ranges from 100 to 500 nm [
38]. In this work, the minimum size of the COVID-19 virus, i.e., 100 nm, was considered for the effective requirement of layer thickness when spraying with drones. In this case, the layer thickness requirement exceeds the diameter of 300 water molecules.
Based on the practice of agricultural spraying and the authors’ own tests and experience, achieving full coverage is not always feasible. Although the droplet size of the disinfectant emitted by the nozzle is very small, usually less than 300 µm, the average droplet density at a flight altitude of 1.5 m can be less than 200 pcs/cm
2, and the surface coverage is sometimes only approx. 12%. Although this initial coverage ratio can be considered low, it should be taken into account that with the help of a surface tension-reducing additive, the coverage ratio can be multiplied [
32,
33,
34,
35,
36]. After the liquid comes to the surface, the droplets spread on the surface, reaching a multiple of their previous diameter size and losing their initial shape due to the surface tension-reducing additive. With this spread, individual droplets can hopefully come into contact with each other and provide a film-like complete coverage of the surface. This is also confirmed by the everyday practice of agricultural application, as partial cover is not allowed in order to prevent or stop the spread of infections.
As the flight altitude increases, the width of the sprayed surface increases too; thus, the rate of surface coverage logically must show a decreasing trend. At the recommended flight altitude for agricultural applications, that is, about 3–5 m, the width of the effectively sprayed surface is approx. 7 m, but in the case of precision agriculture applications it reduces to 4.5 m [
14].
Based on drone spraying experiments against the new coronavirus, Gonzalez-Jorge at al. recommended a flight altitude of 3 m [
19]. The study provided real flight-test data through experimental approaches; however, this paper focuses on data that can be achieved in an optimal case by varying flight parameters and liquid flow.
In this study, based on practical experience to date, we assumed that different disinfectant fluids may be used, but the reasons for this were not investigated. However, different disinfectant fluids obviously also have different disinfectant effectiveness [
17]; therefore, it was assumed that different amounts per unit area would need to be applied depending on the characteristics of the fluid. The required amounts of different disinfectant fluid were determined by a specialist, a virologist. The pilot of the drone must perform the spray task in such a way as to ensure the specified amount per unit area, taking into account the other influencing factors, especially the flight parameters.
2.2. Drone-Related Parameters Influencing Effectiveness
For spraying on a flat surface, there are three drone-related parameters influencing effectiveness. Two parameters related to flight and one to disinfectant should be considered: in the case of flight, the flight speed and flight altitude, and in the case of disinfectant, the amount of liquid sprayed by the drone. Maintaining the previous assumption, droplets falling to the surface spread out and result in complete (or acceptable by virologist) coverage.
2.2.1. Effect of the Flow Rate of the Disinfectant Fluid
The drone carries a liquid that is usually a special mixture of water and disinfectant concentrate. The ratio of the components of an effective disinfectant must be determined by a virologist. This data is not directly related to flight parameters but indirectly influences them, because the effectiveness of the disinfectant solution is certainly influenced by both the uniformity of the surface coverage and the amount of solution per unit area. Higher effectiveness requires less disinfectant per unit area, and perhaps the rate of required coverage can be less than total in the case of highly effective disinfectant.
The amount of disinfectant liquid sprayed per unit time can be considered directly as a drone-related parameter. A fundamental limitation of any settings is that the nozzles to be used will have been optimized for the requirements of agricultural spraying. Thus, both the minimum and maximum fluid flow per minute are limited. Due to the dynamically spreading application of agricultural drones, it is accepted that the scattering pattern with the formed nozzles is sufficiently uniform and, in any case, suitable for agricultural application. In order to increase effectiveness—in the case of long, straight flight sections—the aim is to maximize the liquid flow, because if liquid flow is maximized, either the flight speed, the flight altitude, or both can be increased simultaneously. Of course, there can be a number of barriers to increasing efficiency, which can be technical, geographical, or even safety related in nature. For example, spraying above a very varied surface, such as in urban areas where there are different obstacles like trees, columns, or pylons, can limit the choice of flight altitude and flight speed. The former is important to avoid collisions, the latter to maintain the maneuverability of the drone.
In line with previous research, the amount of liquid flow was determined with several different values for the calculations: at the lowest value with the minimum effective amount (1 L/min) assumed on previous practice, and at the upper value with the maximum flow capacity of drone pumps usually used onboard (5 L/min—DJI Agras T16, TTA M6E-X). Based on the above, in this study, the examined fluid flow values were between 1 and 5 L/min in steps of 1 L/min.
2.2.2. Effect of the Flight Speed
Rotary wing drones are able to hang at the same point; in that case, the speed is zero. Maximum speed depends on the type of drone; however, in practice, agriculture pilots usually do not use higher speed than 50 km/h. Flight speed (
v) is the quotient of distance (Δ
d) and time (Δ
t), as Formula (1) shows.
Flow rate (
Q) is the mass of special liquid (Δ
m) that moves in a certain amount of time (Δ
t), as Formula (2) shows.
Coverage level (C) is the quotient of the mass of liquid (Δ
m) and the size of area (Δ
A) sprayed on as Formula (3) shows.
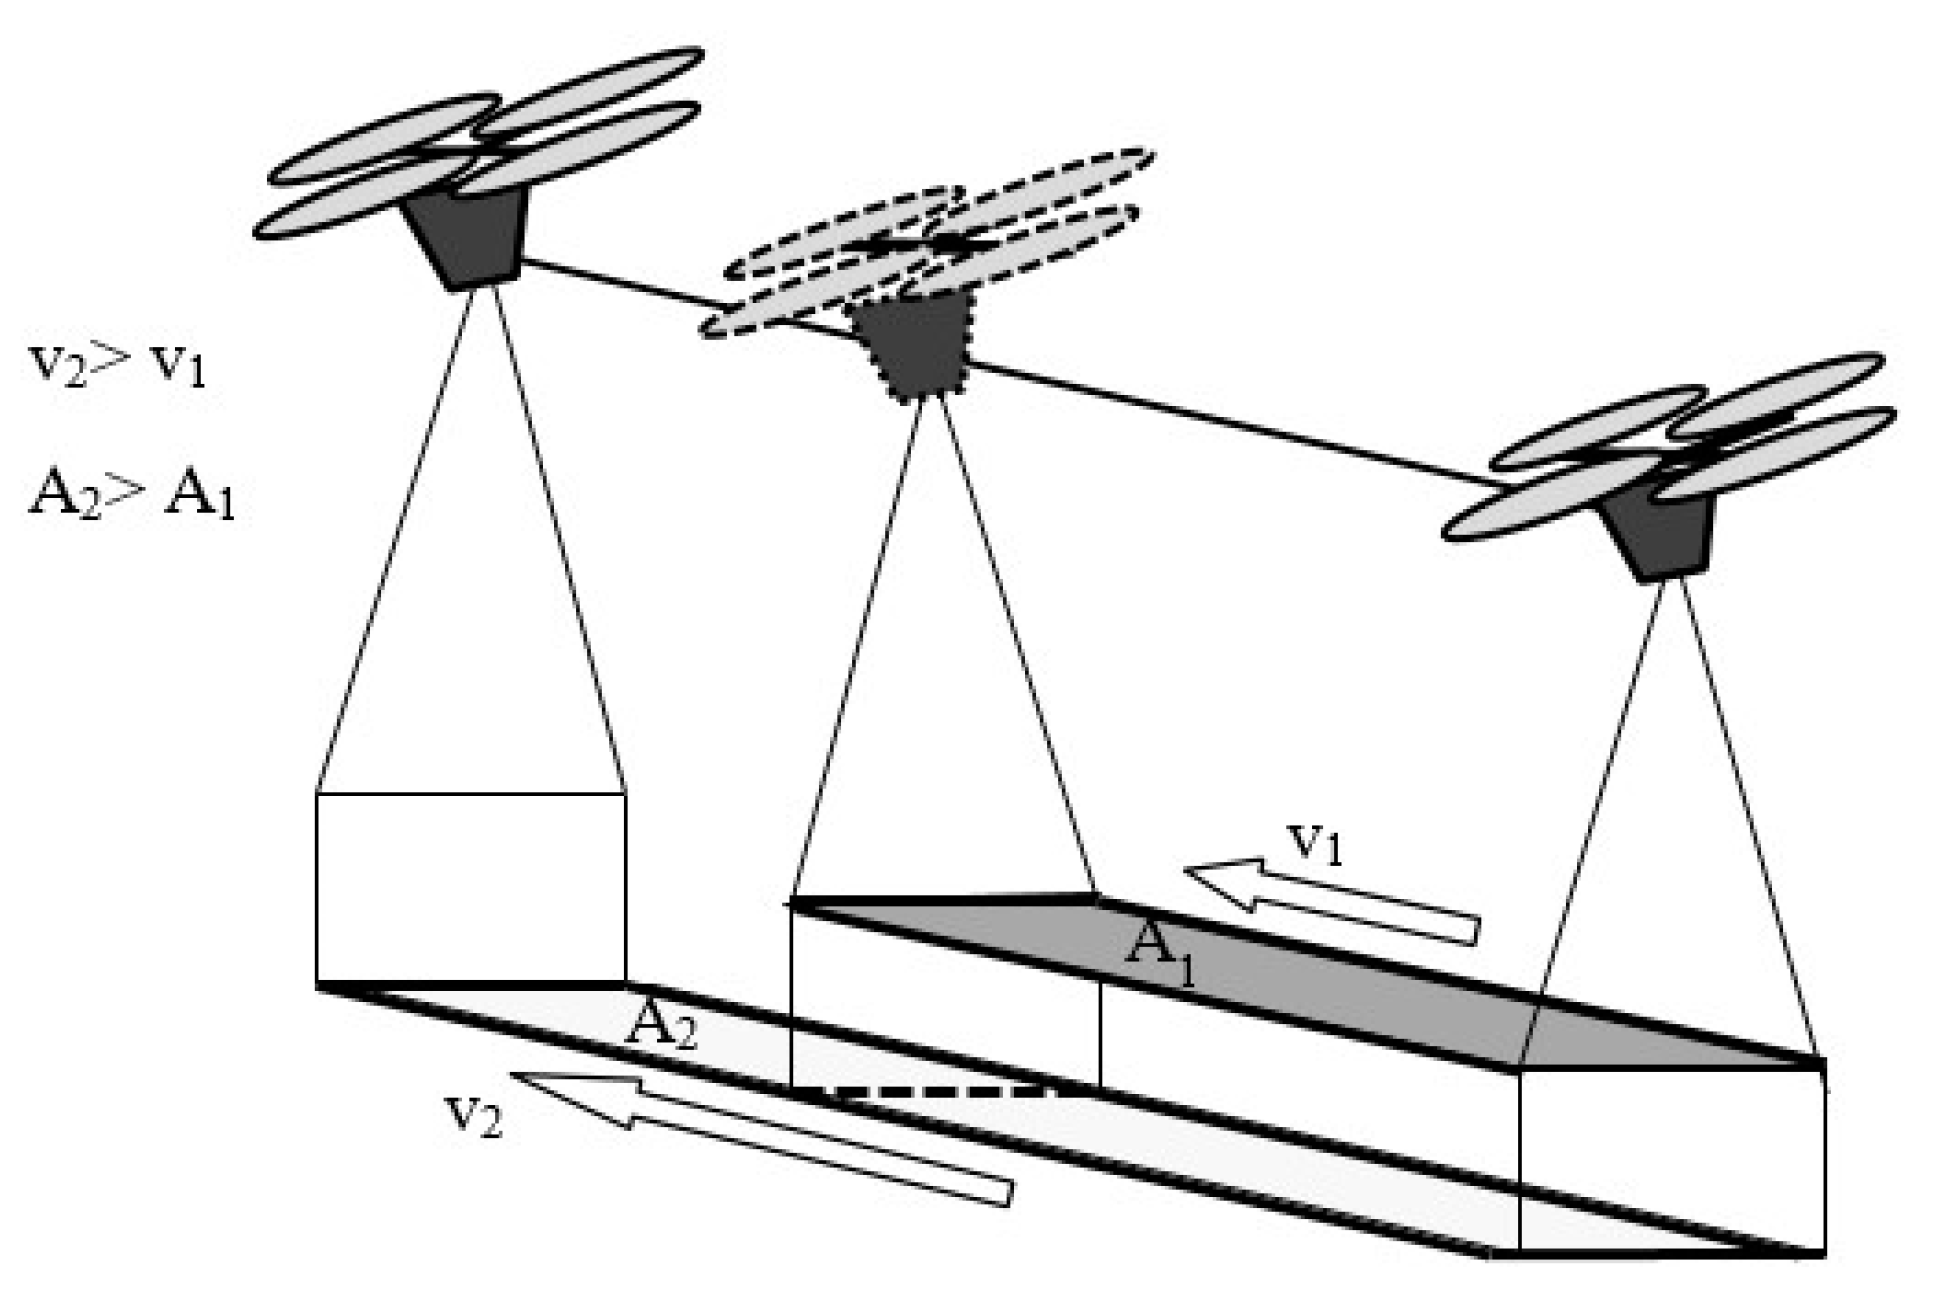
During a flight mission, the drone sprays the liquid to cover a strip (Δ
A) with disinfectant. The strip width is constant, so the sprayed size (Δ
A) depends on its length, which is related to the flight speed (
v). This means that instead of the flight path (Δ
d), the covered strip (Δ
A) can be considered in Formula (1), as shown in Formula (4).
By rearranging Formulas (2)–(4), the relationship in Formula (5) can be obtained; this expresses that the coverage level (
C) is directly proportional to the flow rate (
Q) but inversely proportional to the flight speed (
v).
Higher flight speed means both longer flight distance and a longer sprayed strip. Considering a constant flow rate of the fluid released by the drone, the coverage level reduces. The relationship in (5) is demonstrated by
Figure 3.
Based on the above, the flight speed fundamentally determines the effectiveness of the spray application, so examining this is inevitable. It is logical that when increasing the flight speed, the size of the disinfected area also increases, so in terms of area size the goal is to achieve as high a flight speed as possible. At the same time, however, with other conditions unchanged (same flight altitude, same amount of emissions), higher flight speeds reduce the amount of disinfectant liquid per unit area. The speed can only be increased as long as the required amount of disinfectant on the surface can be satisfied.
In this study, the flight speed was calculated with 5 different values, preferably in equal divisions. The lowest value was stated as approx. twice of the average pedestrian speed, while the upper was the maximum value normally used for spraying in agriculture. Based on these values, flight speeds between 10 and 50 km/h in steps of 10 km/h were used for the calculations.
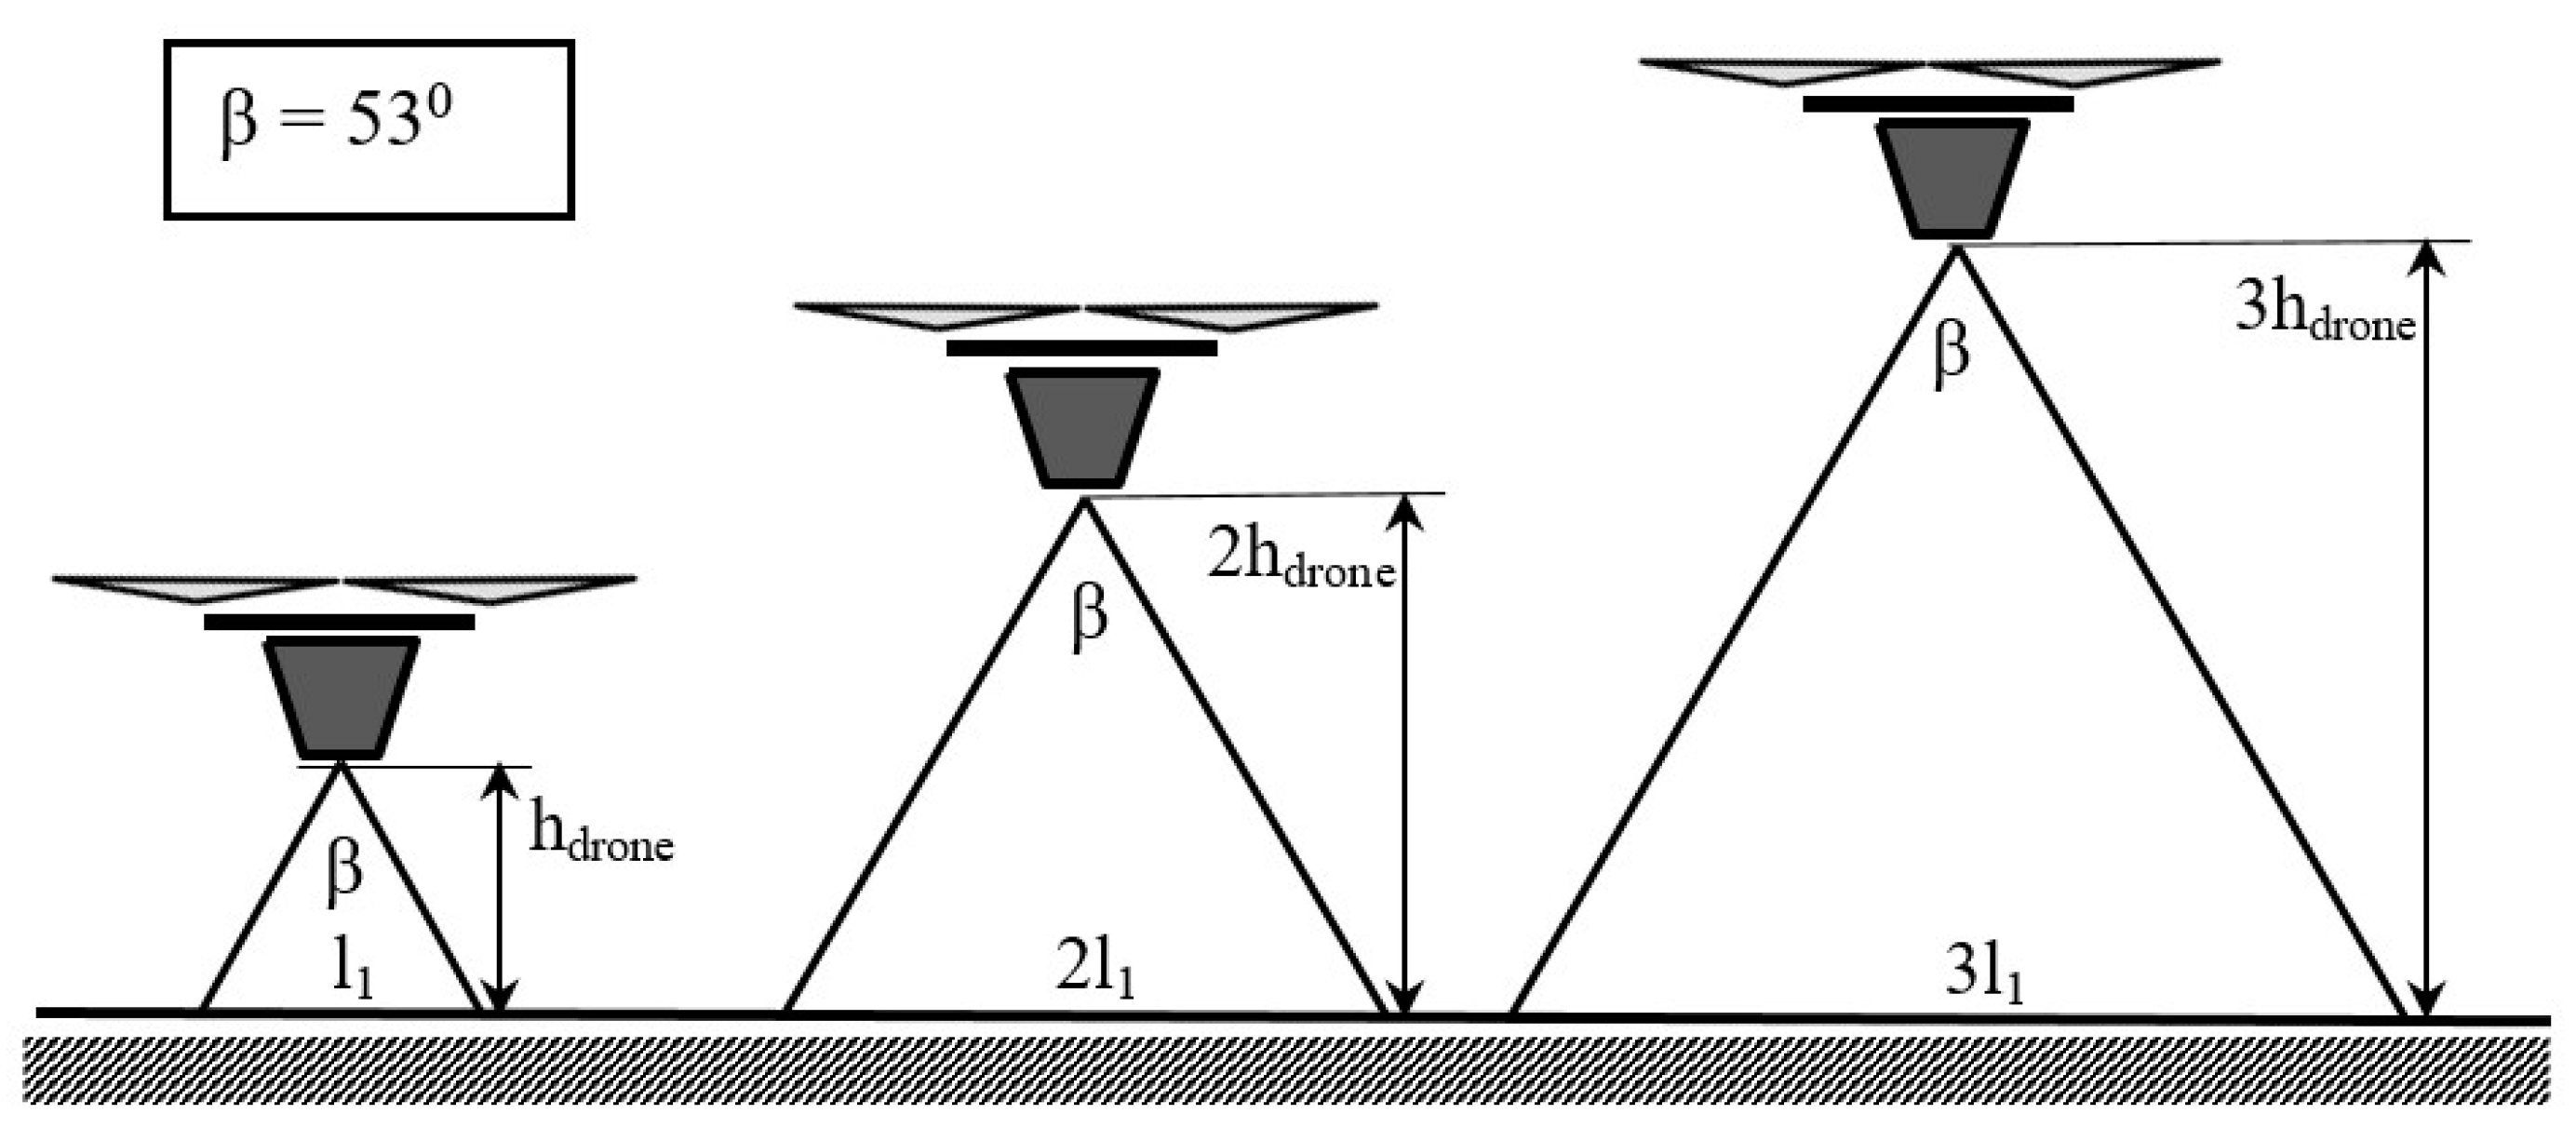
2.2.3. Effect of the Flight Altitude
The emission of the drone was assumed to be point-like, and the spray angle of the nozzle was assumed to be 53 degrees, which is not far from agricultural practice. With these values, at low flight altitudes (≤5 m), we obtain a spreading width approximately as wide as the flight altitude, i.e., 1 m wide at a flight altitude of 1 m and 5 m wide at flight altitude of 5 m. In this case, a linear relationship is obtained between the flight altitude and the width of the covered strip. Doubled flight altitude results in doubled width of the covered strip, but the coverage level falls to half. This logic can be seen in
Figure 4.
In light of this discussion, flight altitude also fundamentally affects effectiveness. It is logical that as the altitude increases, the size of the sprayed surface also increases, so the goal is to achieve the highest possible altitude in order to increase the effectiveness. However, as previously discussed for flight speed, the altitude cannot be increased arbitrarily, as the amount of disinfectant solution per unit area may reduce below the threshold required to achieve a sufficient disinfectant effect.
In this study, the flight altitude was calculated with 5 different values, preferably in equal divisions, giving the minimum and maximum heights effectively used for precision agriculture spraying at both the lower and upper values. Therefore, the examined altitude values were between 1 and 5 m in steps of 1 m.
2.3. Spray Coverage 3D Matrix for Disinfectant Effectiveness
It can be seen that the different previously discussed elements determine the effectiveness collectively. Though physically independent of each other, they strongly influence each other.
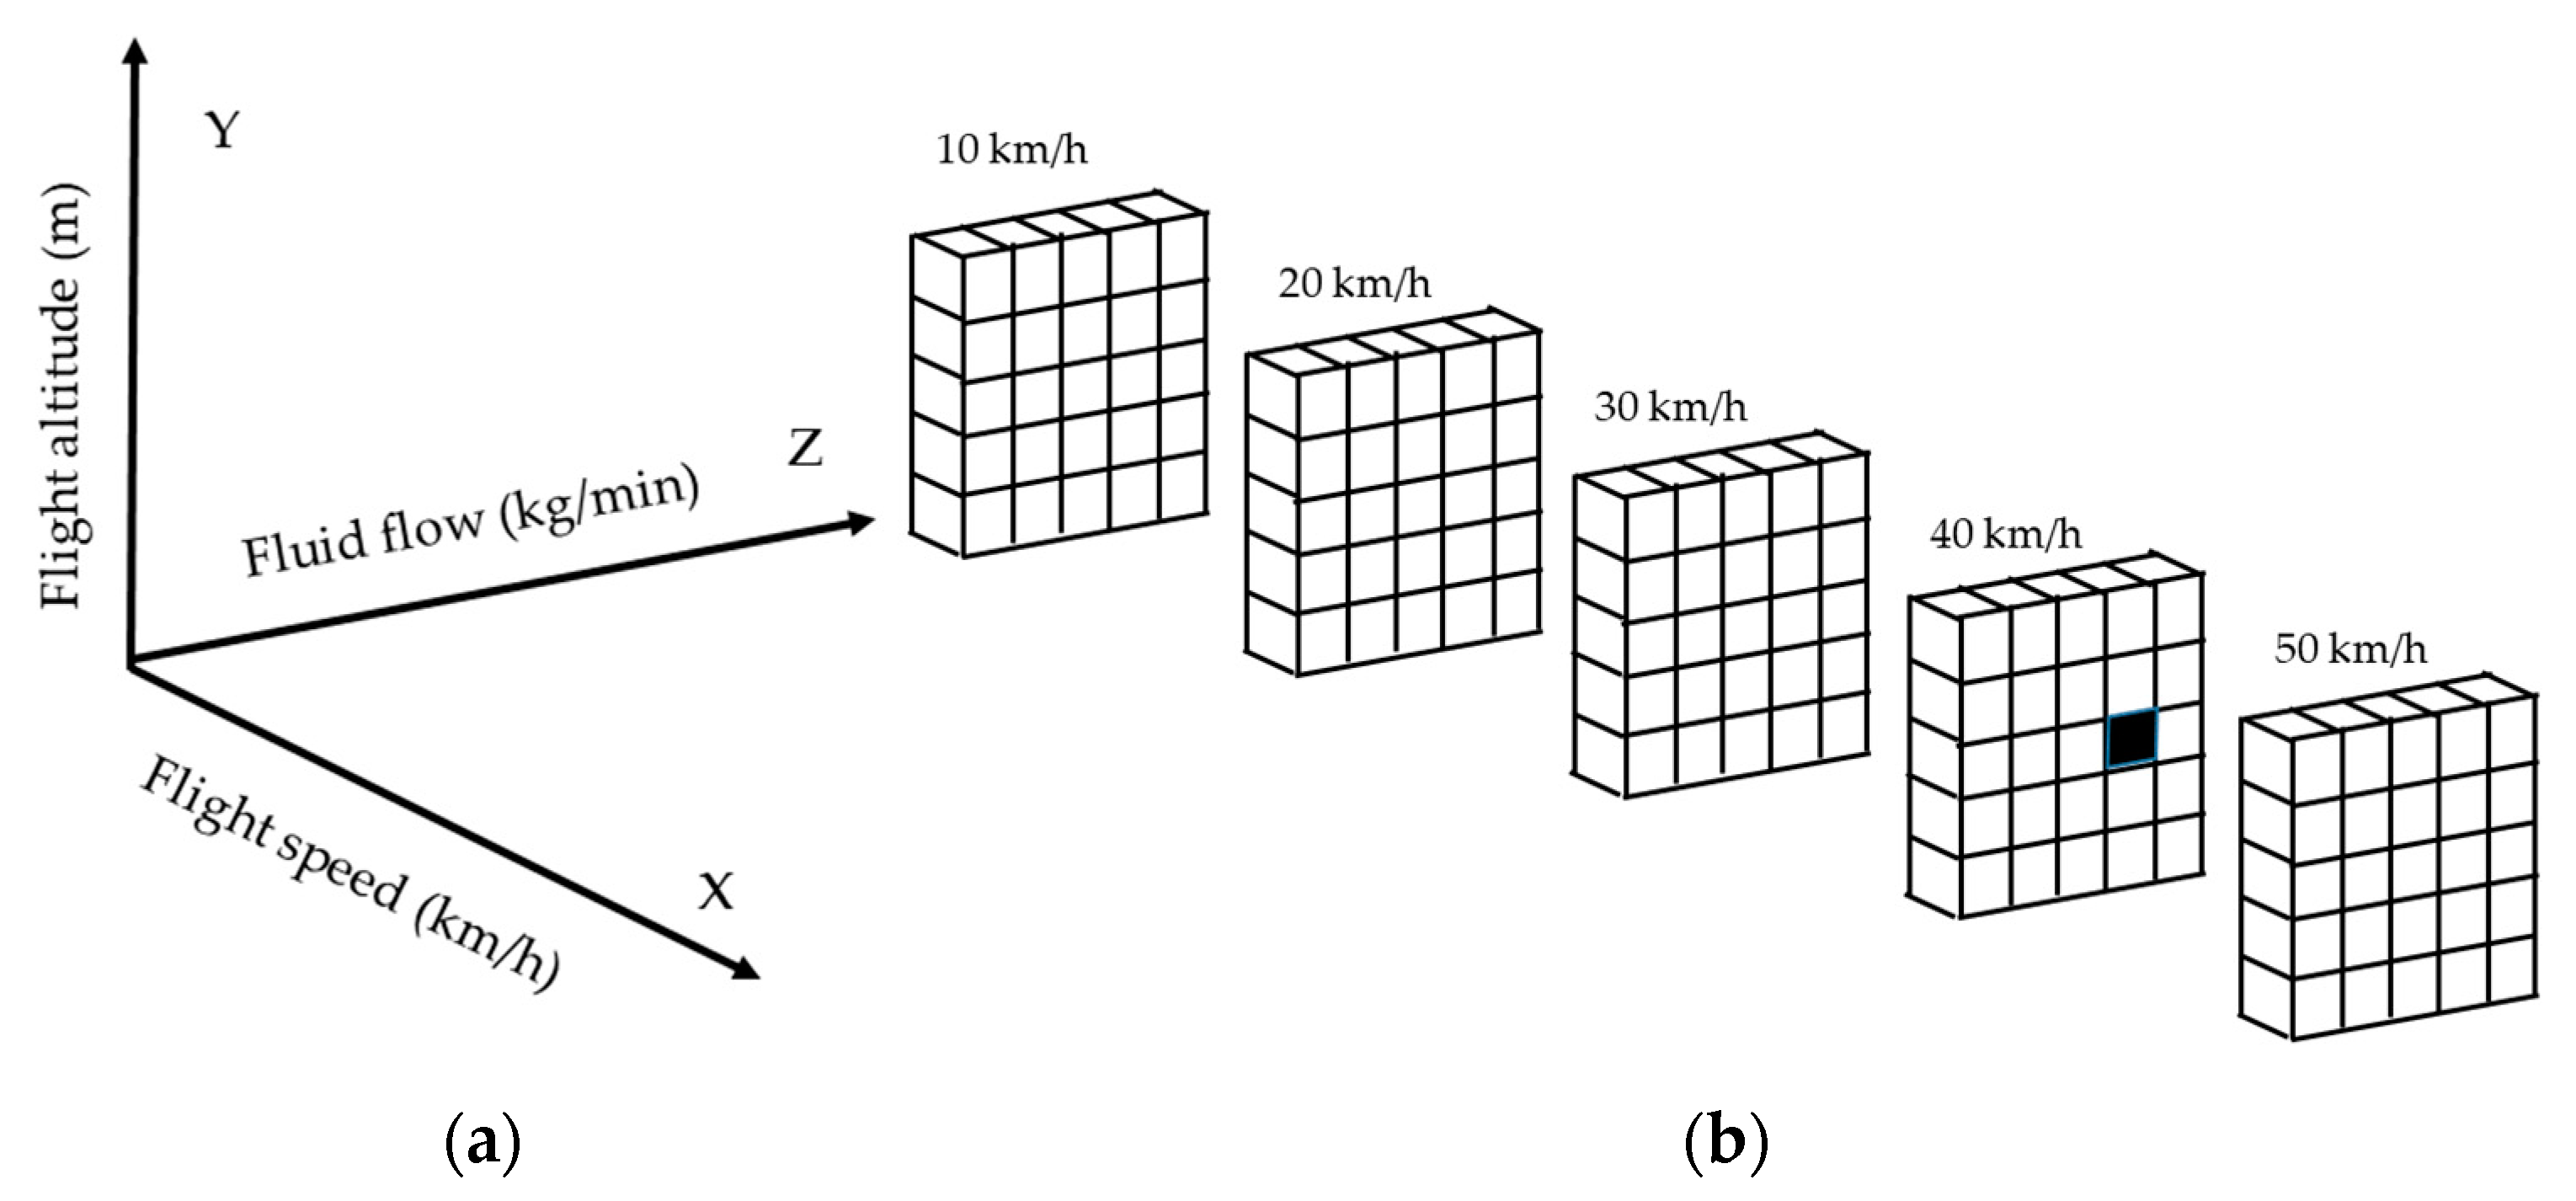
The elements of the measured data have 3 parameters, the flight speed, the flight altitude, and the quantity of emission during the unit time, that is, the liquid flow. We used the notation “V” for the series of speed values, so it has the form: V10–V20–V30–V40–V50. We used “A” to denote the series of altitude, so the form of the series is: A1–A2–A3–A4–A5. We used “Q” to denote the series of fluid flow, so as before, the form of the series is: Q1–Q2–Q3–Q4–Q5.
The notations “V”, “A”, and “Q” can refer to axes usually known as “
x”, “
y”, and “
z” (
Figure 5a), and based on this, the measured data can be the first five divisions of the series. Based on the above, the element of the measured data of the liquid flow of 1 L/min at a speed of 10 km/h at 1 m altitude is denoted by V10A1Q1, while that of the element of the measured data of the fluid flow of 4 L/min at a speed of 40 km/h at 3 m altitude is V40A3Q4, as shown at
Figure 5b. The measurement markings are visibly simple, and the flight and liquid flow parameters associated with the data are easy to code and to decode.
To calculate with the above parameters, a 3D matrix can be created containing 5 × 5 × 5 = 125 data, as shown in
Figure 6. In the case of test flights, we recommended that the number of flights should be significantly reduced by choosing the correct order of testing. As we were looking for the effective part of the above matrix, it was worth beginning with the flights with a presumably acceptable disinfectant effect and then determining the further flight order accordingly as long as the results served the purposes of the research. Logically, it is obvious that all flights served results; however, in order to reduce time and costs, flights that did not provide relevant results could be omitted.
2.4. Evaluation of Coverage Level
This research helps to determine whether the sprayed disinfectant is present on the surface in the right amount and with the right coverage and appropriate distribution. Based on this, matrix notations can have two evaluated values.
In the first case, when examining the sprayed liquid quantity, we can give the value of the coverage amount (quantitative assessment—g/m2) or the appropriateness of its effect (qualitative assessment—Y/N).
In the other case, when determining the degree of coverage, we can do the same. We can specify the coverage ratio (quantitative rating—%) or whether the virologist considered it as acceptable or not (qualitative rating—Y/N).
Obviously, flight protocols can be accepted only on those elements for which both values were acceptable, e.g., V30A2Q4—12Y or V30A2Q4—YY (if 12 g/m2 is acceptable to a person skilled in the pandemic). The former is more useful for virologists and experts; the latter is more useful for drone pilots performing flights.
Based on the matrix, it can also be concluded that when the coverage level is no longer adequate, by further increasing the flight parameters and decreasing the fluid flow, only worse coverage values are obtained. When the values are still just right, that means the effectiveness limit of the application. At coverage values below the limit, the effectiveness of disinfection will certainly improve, but we must take into account that disinfectants pose a risk to both the environment, wildlife, and human health [
24], so it is advisable to use as little of it as possible.
Based on the above, spraying is most effective if the appropriate level of disinfection is achieved, but the environmental and health risks remain as low as possible. This is obviously a kind of balance between benefits and disadvantages and can even, under given conditions, mean efficiency in terms of economy, although in this moment this is not a very important issue in dealing with a pandemic.
3. Results
Matrix data were determined by correlating the disinfectant fluid value of unit area to the flight speed values calculated as a function of flight altitude and fluid flow.
With the data of surface coverage, the layer thickness can also be calculated; for example, 10 g/m2 coverage level means 10 µm layer thickness. The maximum and minimum thickness values are expressed at each table compared to the minimum requirement of acceptable layer thickness and the safety rate.
In the tables, some values can be obtained by using different flight parameters. With the data of surface coverage and the size of tank installed on board, we can calculate the area that can be sprayed by each drone mission. This study takes into account a 10 L tank capacity (e.g., TTA M6E-1) and points out the minimum and the maximum area that can be disinfected. Mission time and total flight distance for optimal cases can also be calculated at each table. In the case of other tank sizes, capacity data in the tables remain the same (coverage level—g/m2); however, mission time, flight distance, and size of the sprayed area can be easily converted. Mission time is also obviously determined by the capacity of the battery.
The change in the values of the table is also shown by a 3D function. The scaling of the 3D functions is the same in all cases, so the change in surface coverage can be compared graphically depending on the selected flight speed. The coverage levels were marked with the same shades in each case. Comparing the 3D functions graphically greatly helps to understand the change in effectiveness depending on drone-related parameters.
Though the authors have adopted the experiences of agricultural drone applications, it has to be confirmed again, all data is optimal and based on calculations. Further research is required that is detailed at the end of the discussion.
3.1. Results of 10 km/h Flight Speed
The optimum amount of disinfectant liquid per unit area, expressed in g/m
2 at a flight speed of 10 km/h, as a function of flight altitude and fluid flow per minute, with tabulated values and graphical representation, are shown in
Table 1 and
Figure 7.
Each table, including this first one, contains 5 × 5 = 25 data. In this series, the maximum coverage level is 30 g/m
2, while the minimum is 1.2 g/m
2. It can be seen that the dynamic of data shows an exponential change on the axis of flight altitude and a linear change on the axis of fluid flow (
Figure 7). The data of coverage levels (g/m
2) can be transformed to a layer thickness (µm); in this series, the maximum coverage level is a 30 µm thick layer, and the minimum is a 1.2 µm thick layer. The same coverage level can be obtained with different variations of the parameters; a 6 g/m
2 coverage level, that is, a 6 µm thick layer, is available at codes of V10A1Q1, V10A2Q2, V10A3Q3, V10A4Q4, and V10A1Q1. In this series, the 25 data comprise 19 different coverage levels.
In case of 30 g/m2 coverage with 10 L tank capacity, an area of 333 m2 can be disinfected; however, with 1.2 g/m2 coverage, the area is 8333 m2. Mission time in the first case (speed = 10 km/h, altitude = 1 m, flow rate = 5 kg/min) is 2 min; during this time, the total flight distance is 333 m. Mission time in the other case (speed = 10 km/h, altitude 5 m, flow rate = 1 kg/min) is 10 min; during this time, the total flight distance is 1666 m.
Comparing the layer thickness to the minimum size of the COVID-19 virus, that is, 100 nm [
33], shows that in this case the layer thickness has an advantage of at least 12 and at most 300 times.
3.2. Results of 20 km/h Flight Speed
The optimum amount of disinfectant liquid per unit area, expressed in g/m
2 at a flight speed of 20 km/h, as a function of flight altitude and fluid flow per minute, with tabulated values and graphical representation, is shown in
Table 2 and
Figure 8.
In this series, the maximum coverage level is 15 g/m
2, while the minimum is 0.6 g/m
2. The characteristic curve of the data in
Figure 8 shows an exponential change on the axis of flight altitude and a linear change on the axis of fluid flow; however, the dynamic is lower than in
Figure 7. The data of coverage levels transformed to layer thickness ranges from a maximum of 15 µm to a minimum of 0.6 µm. As with
Table 1, the same coverage level in
Table 2 can be obtained with different variations of the parameters; 3 g/m
2 coverage level, that is, a 3 µm thick layer on the surface, is available five times. In this series as in the last, the 25 data comprise 19 different coverage levels.
In case of 15 g/m2 coverage with a 10 L tank capacity, a drone area of 666 m2 can be disinfected; however, with 0.6 g/m2 coverage, the area is 16,666 m2. Mission time in the first case (speed = 20 km/h, altitude = 1 m, flow rate = 5 kg/min) is 2 min as before (10 km/h); however, during this time, the total flight distance is 666 m. Mission time in the other case (speed = 20 km/h, altitude 5 m, flow rate = 1 kg/min) is 10 min; during this time, the total flight distance is 3333 m.
Comparing the layer thickness to the size of the COVID-19 virus shows that the layer thickness has an advantage of at least 6 and at most 150 times.
3.3. Results of 30 km/h Flight Speed
The optimum amount of disinfectant liquid per unit area, expressed in g/m
2 at a flight speed of 30 km/h, as a function of flight altitude and fluid flow per minute, with tabulated values and graphical representation, is shown in
Table 3 and
Figure 9.
In this series, the maximum coverage level is 10 g/m
2, while the minimum is 0.4 g/m
2. The characteristic curve of data follows the previous ones with lower dynamics (
Figure 9). The data of coverage level transformed to layer thickness ranges from a maximum of 10 µm to a minimum of 0.4 µm. The same coverage levels can also be obtained from
Table 3; the 2 g/m
2 coverage level, that is, a 2 µm thick layer, is also available five times. In this table as in
Table 1 and
Table 2, 19 different coverage levels can be found.
In case of 10 g/m2 coverage with a 10 L tank capacity, a drone area of 1000 m2 can be disinfected; however, with 0.4 g/m2 coverage, the area increases to 25,000 m2. Mission time in the first case (speed = 30 km/h, altitude = 1 m, flow rate = 5 kg/min) is 2 min as in the previous cases (10 km/h and 20 km/h); however, during this time, the total flight distance is 1000 m. Mission time in the other case (speed = 30 km/h, altitude 5 m, flow rate = 1 kg/min) is 10 min; during this time, the total flight distance is 5000 m.
It can be seen that flight time is always 2 min at the highest flow rate and 10 min at the lowest flow rate. This is logical because 10 L disinfectant with 1 to 5 kg/min flow rates result from 10 to 2 min mission times.
Comparing the layer thickness to the size of the COVID-19 virus shows that the layer thickness has an advantage of at least 4 and at most 100 times.
3.4. Results of 40 km/h Flight Speed
The optimum amount of disinfectant liquid per unit area, expressed in g/m
2 at a flight speed of 40 km/h, as a function of flight altitude and fluid flow per minute, with tabulated values and graphical representation, is shown in
Table 4 and
Figure 10.
In this series, the maximum coverage level is 7.5 g/m
2, while the minimum is 0.3 g/m
2. The characteristic curve of the data follows the previous ones with a lower dynamic (
Figure 10). The data of coverage level transformed to layer thickness ranges from a maximum of 7.5 µm to a minimum of 0.3 µm. The same coverage levels in
Table 4 are seen in the series; 1.5 g/m
2 value means 1.5 µm layer thickness.
Here, 19 different coverage levels can also be found, which is the same at each table. This is logical because of the symmetry of the data selected, from 1 to 5, both in case of flow rate and flight altitude. The spray angle, 53 degrees, also shows a kind of symmetry, as the width of the sprayed area is equal to the altitude.
In case of 7.5 g/m2 coverage with a 10-liter tank capacity, an area of 1333 m2 can be disinfected; however, with 0.3 g/m2 coverage, the area increases to 33,333 m2. Mission time in the first case (speed = 40 km/h, altitude = 1 m, flow rate = 5 kg/min) is 2 min as usual; however, during this time, the total flight distance is 1333 m. Mission time in the other case (speed = 40 km/h, altitude 5 m, flow rate = 1 kg/min) is 10 min; during this time, the total flight distance is 6666 m.
Comparing the layer thickness to the size of the COVID-19 virus shows that the layer thickness has an advantage of at least 3 and at most 75 times.
3.5. Results of 50 km/h Flight Speed
The optimum amount of disinfectant liquid per unit area, expressed in g/m
2 at a flight speed of 50 km/h, as a function of flight altitude and fluid flow per minute, with tabulated values and graphical representation, is shown in
Table 5 and
Figure 11.
In this series, the maximum coverage level is 6 g/m
2, while the minimum is 0.24 g/m
2. The characteristic curve of the data follows the previous ones with the lowest dynamic (
Figure 11). The data of coverage level transformed to layer thickness ranges from a maximum of 6 µm to a minimum of 0.24 µm. The same coverage levels in
Table 5 are displayed in the series, where 1.2 g/m
2 corresponds to 1.2 µm layer thickness.
In case of 6 g/m2 coverage with a 10 L tank capacity, an area of 1666 m2 can be disinfected; however, with 0.24 g/m2 coverage, the area increases to 41,666 m2. Mission time in the first case (speed = 50 km/h, altitude = 1 m, flow rate = 5 kg/min) is 2 min as usual; however, during this time, the total flight distance is 1666 m. Mission time in the other case (speed = 50 km/h, altitude 5 m, flow rate = 1 kg/min) is 10 min; during this time, the total flight distance is 8333 m.
This latest mission requires the most energy; however, agriculture drones with about 20–25 min potential flight time can perform this mission even if the required maneuvers are ignored here.
Comparing the layer thickness to the size of the COVID-19 virus shows that the layer thickness has an advantage of at least 2.4 and at most 60 times.
4. Discussion
From the values in the matrix, it can be seen that by changing the parameters, the surface volume of the disinfectant fluid varies within quite wide limits. The highest value (30 g/m2) is reached at low flight speed (10 km/h), low flight altitude (1 m), and high fluid flow (5 L/min). The lowest value is achieved at high flight speed (50 km/h), high flight altitude (5 m), and low fluid flow (0.24 g/m2). Between the smallest and largest surface coverage, the difference is approx. 125 times. From this, it can be concluded that the drone pilot can change the amount of surface coverage in a rather wide spectrum by changing the flight parameters as well as the fluid flow. This allows different disinfectant fluids with different properties to be applied to the surface in an amount that ensures effective disinfection.
It can also be seen from the values of the matrix that a given amount of surface volume can often be achieved with several parameters. For example, 2 g/m
2 can be achieved with all speeds, heights, and fluid flows (V10A3Q1, V20A3Q2, V40A3Q4, V50A3Q5, and five cases in
Table 3).
To justify the effectiveness of drone application, the amount of disinfectant liquid on the surface must be converted to the thickness of the film-like layer covering the surface. The highest value, the liquid volume of 30 g/m2, ideally means that the uniform film layer is 30 µm thick, while the lowest value, the liquid volume of 0.24 g/m2, represents a thickness of 240 nm. It is natural that the difference in thickness is the same as the difference in mass, which is approx. 125 times.
It can be inferred that a uniform film layer of almost any thickness, even a few nm thick, that results in an effective disinfection is sufficient. Nonetheless, the thickness of 100 nm can surely be considered as acceptable based on the work of others [
26,
32]. Based on this, in an optimal case, even the smallest obtained value should be sufficiently effective on a smooth, even surface.
It is obvious that in nature we rarely find a smooth surface where with a given coverage, e.g., 240 g/m2, we can create the ideal disinfectant coating, in this case a uniform film layer with a thickness of 240 nm. Due to the shape variations, waviness, and roughness of surface materials, we have reason to assume that the thickness of the film layer from droplets will not develop optimally. The purpose of drone spraying is to make a smooth surface coverage of at least 100 nm thickness on all points of the surface. If drone spraying can provide this requirement on all points of the surface, or at least in a ratio that is acceptable by experts, the drone application is effective. For this, we have a safety margin of 2.4 times at the lowest value and 300 times at the highest. To determine the minimum level of safety factor, the authors propose further research.
With the data of surface coverage and the size of tank installed on board, we can calculate the area that can be sprayed. In case of 30 g/m2 coverage with a 10 L tank capacity (e.g., TTA M6E-1), an area of 333 m2 can be disinfected; however, with 0.24 g/m2 coverage, the maximum disinfected area is more than 4 hectares (41,667 m2). This seems excessive in practice. Mission time for the optimal case can also be calculated. In the first case (speed = 10 km/h, altitude = 1 m, flow rate = 5 kg/min), the total flight distance is 333 m, and the flight time of the mission with one full tank is 2 min (120 s). In the last case (speed = 50 km/h, altitude = 5 m, flow rate = 1 kg/min), the total flight distance is 8,333 m, and the flight time is 10 min (600 s). Naturally, all data is optimal and based on theoretical calculation.
There are some factors that can cause problems, so further research is required, such as the determination of the minimum level of safety factor as aforementioned. Another problem is the evaporation of the disinfectant liquid. One question is, what is the rate of evaporation during the spray? Another is, how long does the disinfectant remain in the liquid phase on the surface? Naturally, evaporation depends on humidity, and the effect can be varied. However, in the case of lower coverage rates, it can significantly influence mission effectiveness. Practice shows that after wiping a surface, it becomes dry again in a very short time. Water, as the predominant part of chlorine-based disinfectant, evaporates quickly depending on many factors; however, temperature and humidity are surely the most important of these factors. In case of high temperature and/or in low humidity, the safety factor must surely be higher than in normal case. To determine the effect of evaporation, the authors propose further research.
Another problem is wind, which can move the small-size droplets from the required space after release. Even if this can be a significant problem, it can be assumed that the rotor wind of the drone is strong enough to force droplets to touch the surface. Naturally, the phenomenon of spray drift is an existing problem; therefore, it is required to examine or adapt the experiences of precise agriculture.
5. Conclusions
The main purpose of the research was to study the effect of three drone-related parameters, the flow rate of the sprayed disinfectant liquid, the flight speed, and the flight altitude, on the effectiveness of a disinfection operation.
As research results, for the first time, a 3D matrix was created containing 125 data to illustrate and demonstrate the complexity of the interdependent examination. With this matrix, end-users can code and decode the calculated data.
Afterwards, the data of the matrix were calculated by the drone-related parameters, and the changes in data were illustrated by the functions of surface coverage. The results show that by changing the parameters, the amount of disinfectant per unit area can be given within quite wide limits (30–0.24 g/m2). Based on the coverage value, the average thickness of the disinfectant can also be calculated as well as the flight distance and the sprayed area. Although the results raise many new questions, they can help end-users to identify adequate flight parameters and manage and optimize missions depending on different disinfectant liquids.
There are some factors that can cause problems, so further research is required, such as the determination of the minimum level of safety factor and the evaporation rate of the disinfectant liquid. Another problem is that the wind that can move the small-size droplets from the required space after release.
Based on the above, using drones for spraying disinfection liquid for fighting against COVID-19 pandemic can be a good option. However, further research and practical experience is required to achieve the best possible practice.


