
Moving People Tracking and False Track Removing with Infrared Thermal Imaging by a Multirotor


School of ICT Eng., Daegu University, Gyeongsan 38453, Korea
Drones 2021, 5(3), 65; https://0-doi-org.brum.beds.ac.uk/10.3390/drones5030065
Submission received: 31 May 2021
/
Revised: 16 July 2021
/
Accepted: 19 July 2021
/
Published: 20 July 2021
(This article belongs to the Special Issue Advances in Civil Applications of Unmanned Aircraft Systems)
Abstract
:Infrared (IR) thermal imaging can detect the warm temperature of the human body regardless of the light conditions, thus small drones equipped with the IR thermal camera can be utilized to recognize human activity for smart surveillance, road safety, and search and rescue missions. However, the unpredictable motion of the drone poses more challenges than a fixed camera. This paper addresses the detection and tracking of people through IR thermal video captured by a multirotor. For object detection, each frame is first registered with a reference frame to compensate for its coordinates. Then, the objects in each frame are segmented through k-means clustering and morphological operations. Falsely detected objects are removed considering the actual size and the shape of the object. The centroid of the segmented area is considered the measured position for target tracking. The track is initialized with two-point differencing initialization, and the target states are continuously estimated by the interacting multiple model (IMM) filter. The nearest neighbor association rule assigns the measurement to the track. Tracks that move slower than the minimum speed are terminated at the proposed criteria. In the experiments, three videos were captured with a long-wave IR band thermal imaging camera mounted on a multirotor. In the first and second videos, eight pedestrians on a pavement and three hikers on a mountain on winter nights were captured, respectively. In the third video, two walking people with complex backgrounds were captured on a windy summer day. The image characteristics vary between videos depending on the climate and surrounding objects, but the proposed scheme shows the robust performance in all cases; the average root mean squared errors in position and velocity are obtained as 0.08 m and 0.53 m/s, respectively for the first video, 0.06 m and 0.58 m/s, respectively for the second video, and 0.18 m and 1.84 m/s, respectively for the third video. The proposed method reduces false tracks from 10 to 1 in the third video.
1. Introduction
Multirotor drones are widely used in many applications [1]. The multirotor can hover from a fixed position or fly as programmed while capturing video from a distance. This capture is cost-effective and does not require highly trained personnel.
A thermal imaging camera produces an image by detecting infrared (IR) radiation emitted by objects [2,3]. Because the thermal imaging camera uses the objects’ temperature instead of their visible properties, no illumination is required, and consistent imaging day and night is possible. Thermal images also pass through many visible obscurants, such as smoke, dust, haze, and light foliage [4]. The long-wavelength (LW) IR band (8–14 μm) has less atmospheric attenuation and most of the radiation emitted by the human body is included in this band [5]. This allows a LWIR thermal imaging camera to detect human activity day and night. The multirotor equipped with a thermal imaging camera can be used for search and rescue missions in hazardous areas as well as security and surveillance [6,7]. It is also useful for many applications such as wildlife monitoring, agricultural and industrial inspection [8,9]. However, compared to visible light images, the image resolution is smaller and thermal images do not provide texture and color information. The image quality can be varied by the climate and surrounding objects. Moreover, the unpredictable motion of the platform poses more challenges than a fixed camera [10]. Thus, suitable intelligent image processing is required in order to overcome the shortcomings of aerial thermal imaging and retain its advantages.
There is an increasing number of studies for people detection using thermal images captured by a drone [11,12,13,14,15], although there have been no studies for people tracking with the same configuration. The temperature difference was estimated using the spatial gray level co-occurrence matrix [11], but humans were captured at a relatively short distance. In [12], a two-stage hot-spot detection approach was proposed to recognize a person with a moving thermal camera, but the dataset was not obtained from the drone. In [13], an autonomous unmanned helicopter platform was used to detect humans with thermal and color imagery. Human and fire detection was studied with optical and thermal sensors from high altitude unmanned aerial vehicle images [14]. However, in [13] and [14], thermal and visual images were used together for detection. The multi-level method was applied to the thermal images obtained by a multirotor for people segmentation [15].
Non-human object tracking from drones using a LWIR band thermal camera can be found in [16,17]. In [16], a boat is captured and tracked with the Kalman filter and a constant velocity motion model. A colored-noise measurement model was adopted to track a small vessel [17]. However, in [16,17], a fixed-wing drone capable of maintaining stable flight was used at sea, which is high detection and low false alarm environment.
Human detection and tracking using stationary thermal imaging cameras have been studied in [18,19,20,21,22]. A contour-based background-subtraction to extract foreground objects was presented [18]. A local adaptive thresholding method performs the pedestrian detection [19]. In [20], humans and animals were detected in difficult weather conditions using YOLO. People were detected and tracked from aerial thermal view based on the particle filter [21]. The Kalman filter with the multi-level segmentation was adopted to track people in thermal images [22]. Various targets in a thermal image database were tracked by the weighted correlation filter [23].
Multiple targets are simultaneously tracked by estimating their kinematic state such as position, velocity, and acceleration [24]. The interacting multiple model (IMM) estimator using multiple Kalman filters has been developed [25] and successfully applied to track multiple high maneuvering targets [26]. Recently, multiple moving vehicles were successfully tracked by a flying multirotor with a visual camera [27]. Data association, which assigns measurements to tracks, is also an important task for tracking multiple targets in a cluttered environment. The nearest neighbor (NN) measurement–track association is the most effective in computing and has been successfully applied to precision target tracking [27,28,29].
This paper addresses moving people detection and tracking with IR thermal video captured by a multirotor. First, considering the unstable motion of the drone, the global matching is performed to compensate the coordinate system of each frame [30], then each frame of the video is analyzed through k-means clustering [31,32] and morphological operations. Incorrectly segmented areas are eliminated using object size and shape information based on squareness and rectangularity [33,34]. In each frame, the centroid of the segmented area is considered the measured position and input to the next tracking stage.
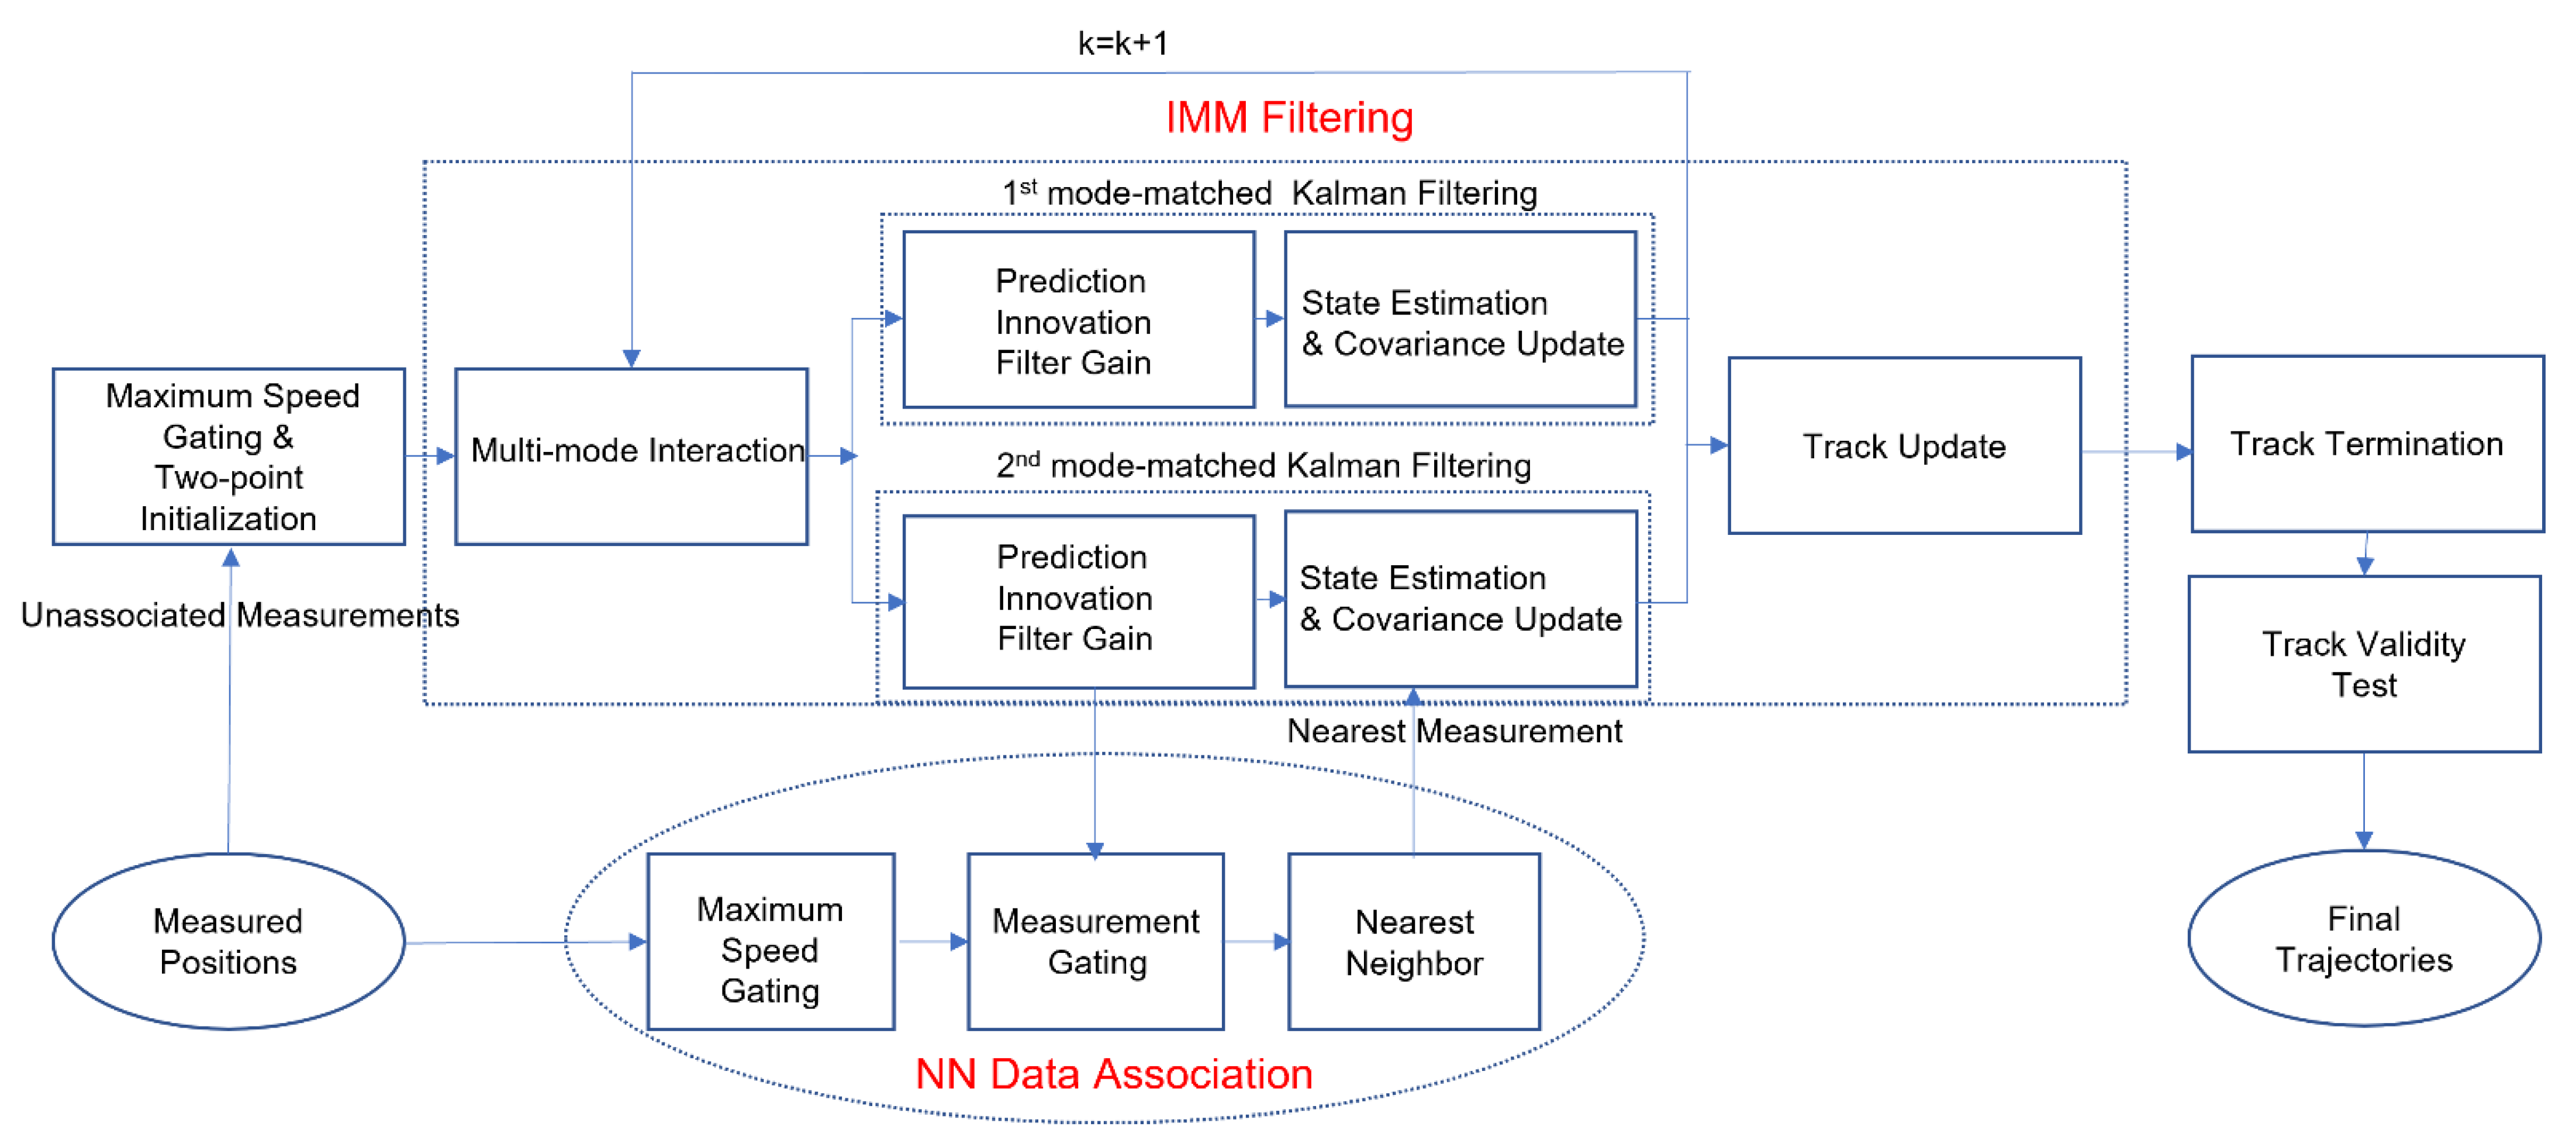
The tracking is performed by the IMM filter to estimate the kinematic state of the target. The track is initialized by the two-point differential initialization following the maximum speed gating. For measurements to track associations, the speed and position gating process is applied sequentially to exclude measurements outside the validation region. Then, the NN association assigns the closest valid measurements to tracks. The track is terminated if either of the two criteria is satisfied. One criterion is the maximum number of updates without a valid measurement and the other criterion is the minimum speed of the target. Even a stationary object can establish tracks because of the drone’s turbulence. The minimum target speed was set to eliminate false tracks caused by stationary objects in heavy false alarm environments. Finally, a validity test is performed to check the continuity of the track [27]. Figure 1 shows a block diagram of detecting and tracking people with thermal video captured by a multirotor.
In the experiment, a drone hovering from a fixed position captures three IR thermal videos. The thermal camera operates in the LWIR band, which is suitable for detecting objects on surfaces. The first and second videos (Videos 1 and 2) were captured on a winter night from an altitude of 30 m and 45 m, respectively. A total of eight people walk or run for 40 s in Video 1 and three hikers walk, stand, or sit in the mountains for 30 s in Video 2. They were covered with leaves in Video 2. The third video (Video 3) was captured on a windy summer day from an altitude of 100 m. Two people walk in a complex background for 50 s. The average detection rates are about 91.4%, 91.8%, 79.8% for Videos 1–3, respectively. The false alarm rates are 1.08, 0.28, and 6.36 per frame for Videos 1–3, respectively. The average position and velocity root mean square error (RMSE) are calculated as 0.077 m and 0.528 m/s, respectively for Video 1, 0.06 m, and 0.582 m/s, respectively for Video 2, and 0.177 m and 1.838 m/s, respectively for Video 3. Three segmented tracks are generated on one target in Video 3, but the number of false tracks is reduced from 10 to 1 by the proposed termination scheme. A two-stage scheme of detection and tracking has been proposed and successfully applied to various thermal videos. To the best of my knowledge, this is the first study to track people with a thermal imaging camera mounted on a small drone.
The rest of the paper is organized as follows. Object detection based on k-means clustering is presented in Section 2. Target tracking with the IMM filter and the track termination criteria is described in Section 3. Section 4 demonstrates the experimental results. The conclusion follows in Section 5.
2. People Detection in Thermal Images
This section describes object detection in IR thermal images. The human detection in IR images consists of coordinate compensation between the reference frame and other frames, k-means clustering, morphological operations, and false alarm removing based on the size and shape of the target. The coordinates are corrected to compensate for unstable motion of the platform. The global matching between two frames is performed by minimizing the sum of absolute difference (SAD) as follows,
where I1 and Ik are the first and the k-th frame, Sx and Sy are the image sizes in the x and y directions, respectively, and NK is the total number of frames. The coordinates of the frame Ik are compensated by . Then, the k-means clustering is performed to group the pixels in each frame into multiple clusters to minimize the following cost function:
where Nc is the number of clusters, Cj is the pixel set of the j-th cluster, and μj is the mean of pixel intensities in the j-th cluster. The pixels in the cluster with the largest mean are labeled as areas of alternate (white) objects that produce a binary image. The morphological operations, closing (dilation and erosion) is applied to the binary image. The dilation filter connects fragmented areas of one object. The erosion filter removes very small clutters and recovers the dilated boundary. Finally, the object area is tested for size and two shape properties. One is the ratio between the minor and major axes of the basic rectangle, which measures squareness, and the other is the ratio between the object size and the basic rectangle size, which measures rectangularity [33,34]. The basic rectangle is defined as the smallest rectangle that includes the object. Therefore, four parameters are utilized to eliminate false alarms: maximum (θmax) and minimum (θmin) size of the basic rectangle in the imaging plane, the minimum squareness, and the minimum rectangularity. Figure 2 illustrates object imaging and a basic rectangle with its major and minor axes. The selection process for the number of clusters and the four parameters will be described in Section 4.
3. Multiple Target Tracking
A block diagram of multiple target-tracking is shown in Figure 3. Each step of the block diagram is described in the following subsections.
3.1. System Modeling
The kinematic state of a target is assumed to follow a nearly constant velocity (NCV) motion. The uncertainty of the process noise, which follows the Gaussian distribution, controls the kinematic state of the target. The discrete state equation for multiple targets is as follows
where is the state vector of target t at frame k, xt(k) and yt(k) are positions in the x and y directions, respectively; vtx(k) and vty(k) are velocities in the x and y directions, respectively; T denote the matrix transpose, NT(k) is the number of targets at frame k, Δ is the sampling time, and v(k) is a process noise vector, which is Gaussian white noise with the diagonal covariance matrix. The covariance of the process noise is set differently for each IMM filter mode as where M is the number of modes of the IMM filter. The measurement vector for target t consists of the positions in the x and y directions. The measurement equation is as follows
where w(k) is a measurement noise vector, which is Gaussian white noise with the covariance matrix .
3.2. Two-Point Differencing Initialization with Maximum Speed Gating
Two-point differencing initialization has been applied to target tracking by a drone [27,28,29]. The initial state and covariance of target t are obtained, respectively, as
where kt is the frame number when the target t is initialized, and kt can be any number between 2 and NK. The state is confirmed as the initial state of a track if the following speed gating is satisfied: , where Vmax is the maximum speed of targets. The initialization is only performed for measurements that are not associated with an existing track.
3.3. Multi-Mode Interaction
The states and covariances of all modes at the previous frame are mixed to generate the mode-initial state and covariance of target t for mode j at the current frame k:
where and are, respectively, the state and covariance of target t for mode i at frame k−1, is the mode probability of target t for mode i at frame k−1, and pij is the mode transition probability from mode i to mode j. When the track is initialized at frame k-1, and are replaced by Equations (8) and (9), and is set at 1/M.
3.4. Mode Matched Kalman Filtering
The Kalman filter is performed for each mode. The state and covariance predictions of target t for mode j at frame k are computed as
The residual covariance and the filter gain of target t for mode j are, respectively, obtained as
3.5. Measurement-Track Association
Measurement to track association is the process of assigning measurements to established tracks. The measurement gating is performed by the chi-square hypothesis test assuming Gaussian measurement residuals [24]. All measurements in the validation region are considered candidates for mode j and target t at frame k as
where zm(k) is the m-th measurement vector at frame k, is the gating size for measurement association, and NM(k) is the number of measurements at frame k. The NN association rule assigns track t to the -th measurement, which is obtained as
where is the number of valid measurements for mode j and target t at frame k. Any remaining measurements that fail to associate with the target go to the initialization stage in the Section 3.2.
3.6. State Estimate and Covariance Update
The state and the covariance of target t for mode j are updated as
If no measurement exists in the validation region, they merely become the predictions of the state and the covariance as
The mode probability is updated as
where N denotes Gaussian probability density function. If no measurement exists in the validation region, the mode probability becomes
Finally, the state vector and covariance matrix of each target are updated as
The procedures from Equation (10) to Equation (29) repeat until the track is terminated. The track termination criteria and the track validity testing are described in the next subsection.
3.7. Track Termination and Validity Testing
Two criteria for track termination are proposed in the paper. One is the number of consecutive updates with no measurements. If a continuous search for a measurement for a certain number of frames fails, the track is terminated. The other is the target’s minimum speed. If the track is slower than the minimum speed, the track is considered to have been generated by false detections. The false detections of the stationary object can set the wrong trajectory due to unstable camera position. Finally, all tracks are tested for validity in terms of the length of the track life. The length of the track life is defined as the number of frames in between including the last frame updated by the measurement and the initial frame [26,27].
4. Results
Experimental results for all videos were detailed through video description, parameter setting, and people detection and tracking along with the proposed strategy.
4.1. Video Description
Three thermal videos (Videos 1–3) were captured by an IR thermal camera, FILR Vue Pro R640 (f = 19 mm, FOV = 32° × 26°) mounted on a DJI Inspire 2 drone. The spectrum band of the thermal camera is 7.5–13.5 μm [35]. The image resolution is 620 × 540 pixels, the pixel pitch is 17 μm, and the frame rate is 30 fps. The drone hovered from a fixed position with the camera facing directly to the ground or slightly titled in the mountain. The altitude of the drone is 30, 45, 100 m for Videos 1–3, respectively. Videos 1 and 2 were captured on winter nights on a flat pavement and in the mountains, respectively, and Video 3 was captured with a complex background of a parking lot during the summer daytime. In Video 1, a total of eight walking or running people appeared and disappeared for 40 s. In Videos 2 and 3, three hikers and two walkers were captured for 30 and 50 s, respectively. Every fifth frame was processed in Video 1, and every third frame was processed in Videos 2 and 3 for efficient image processing. The details of the videos are described in Table 1.
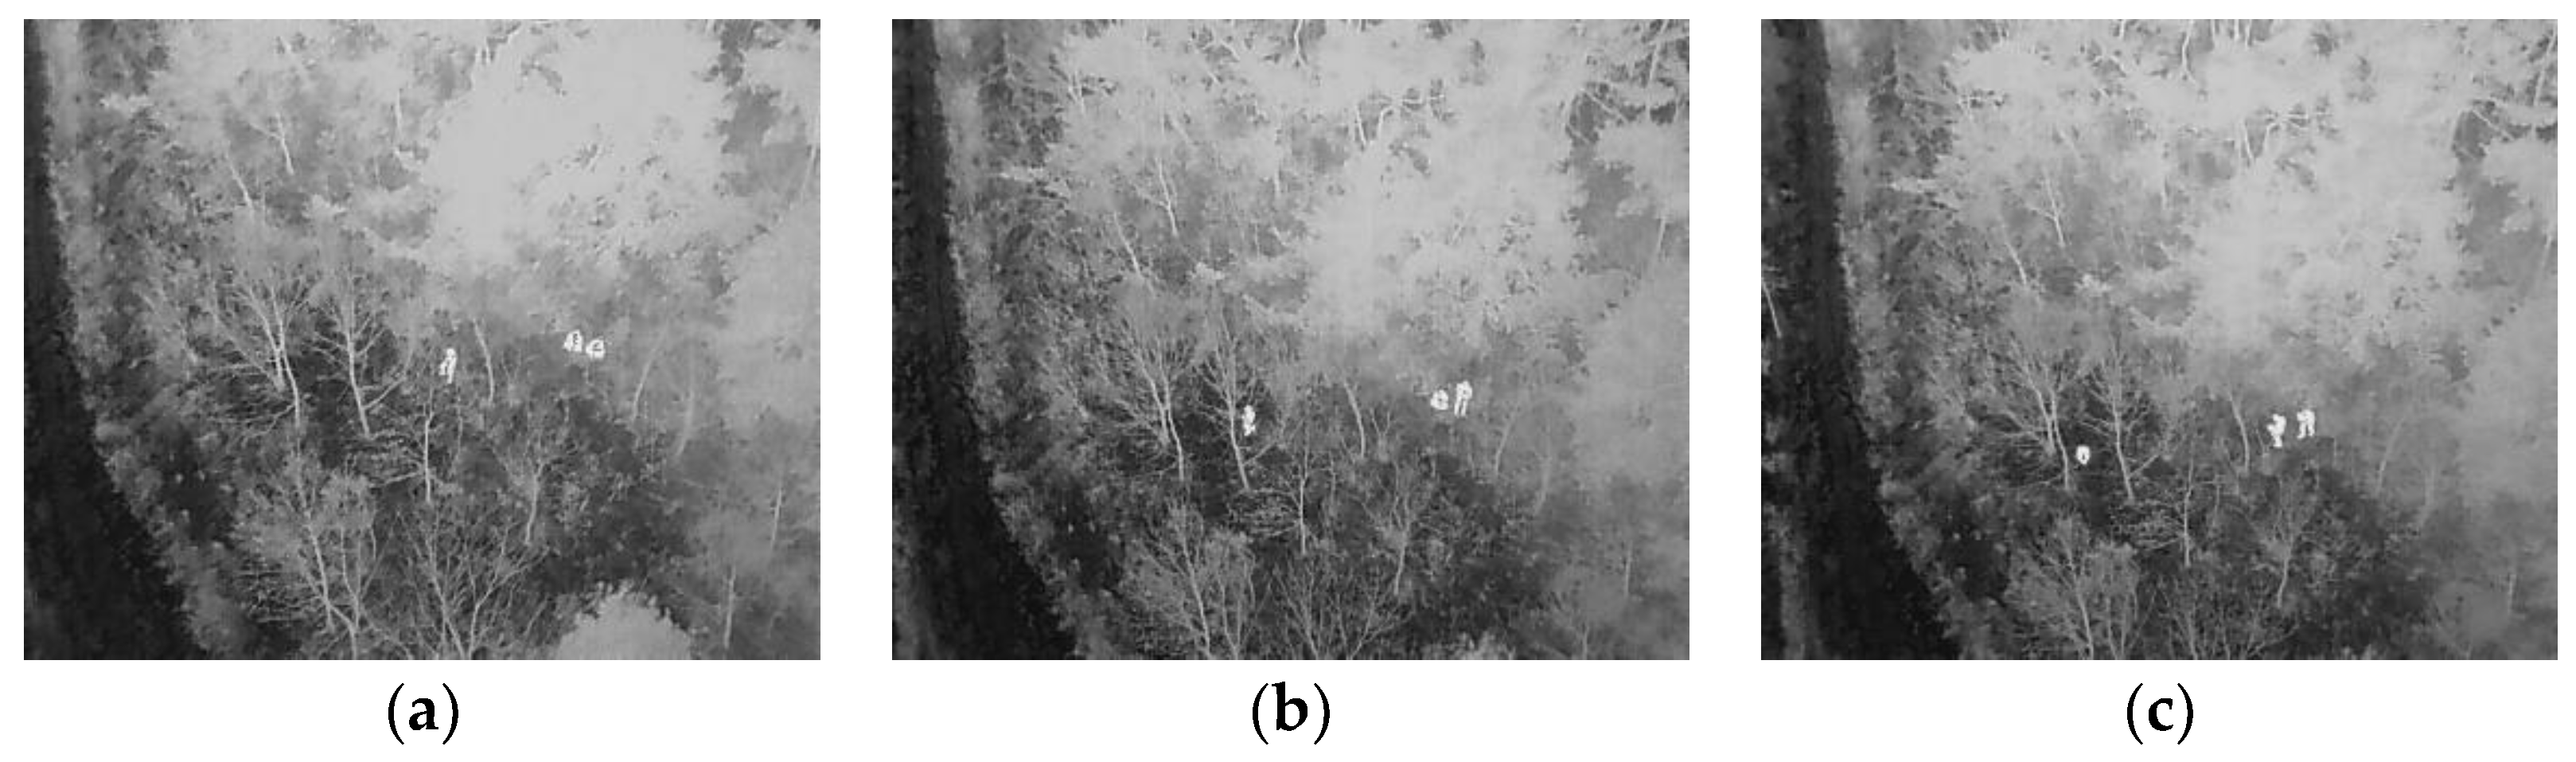
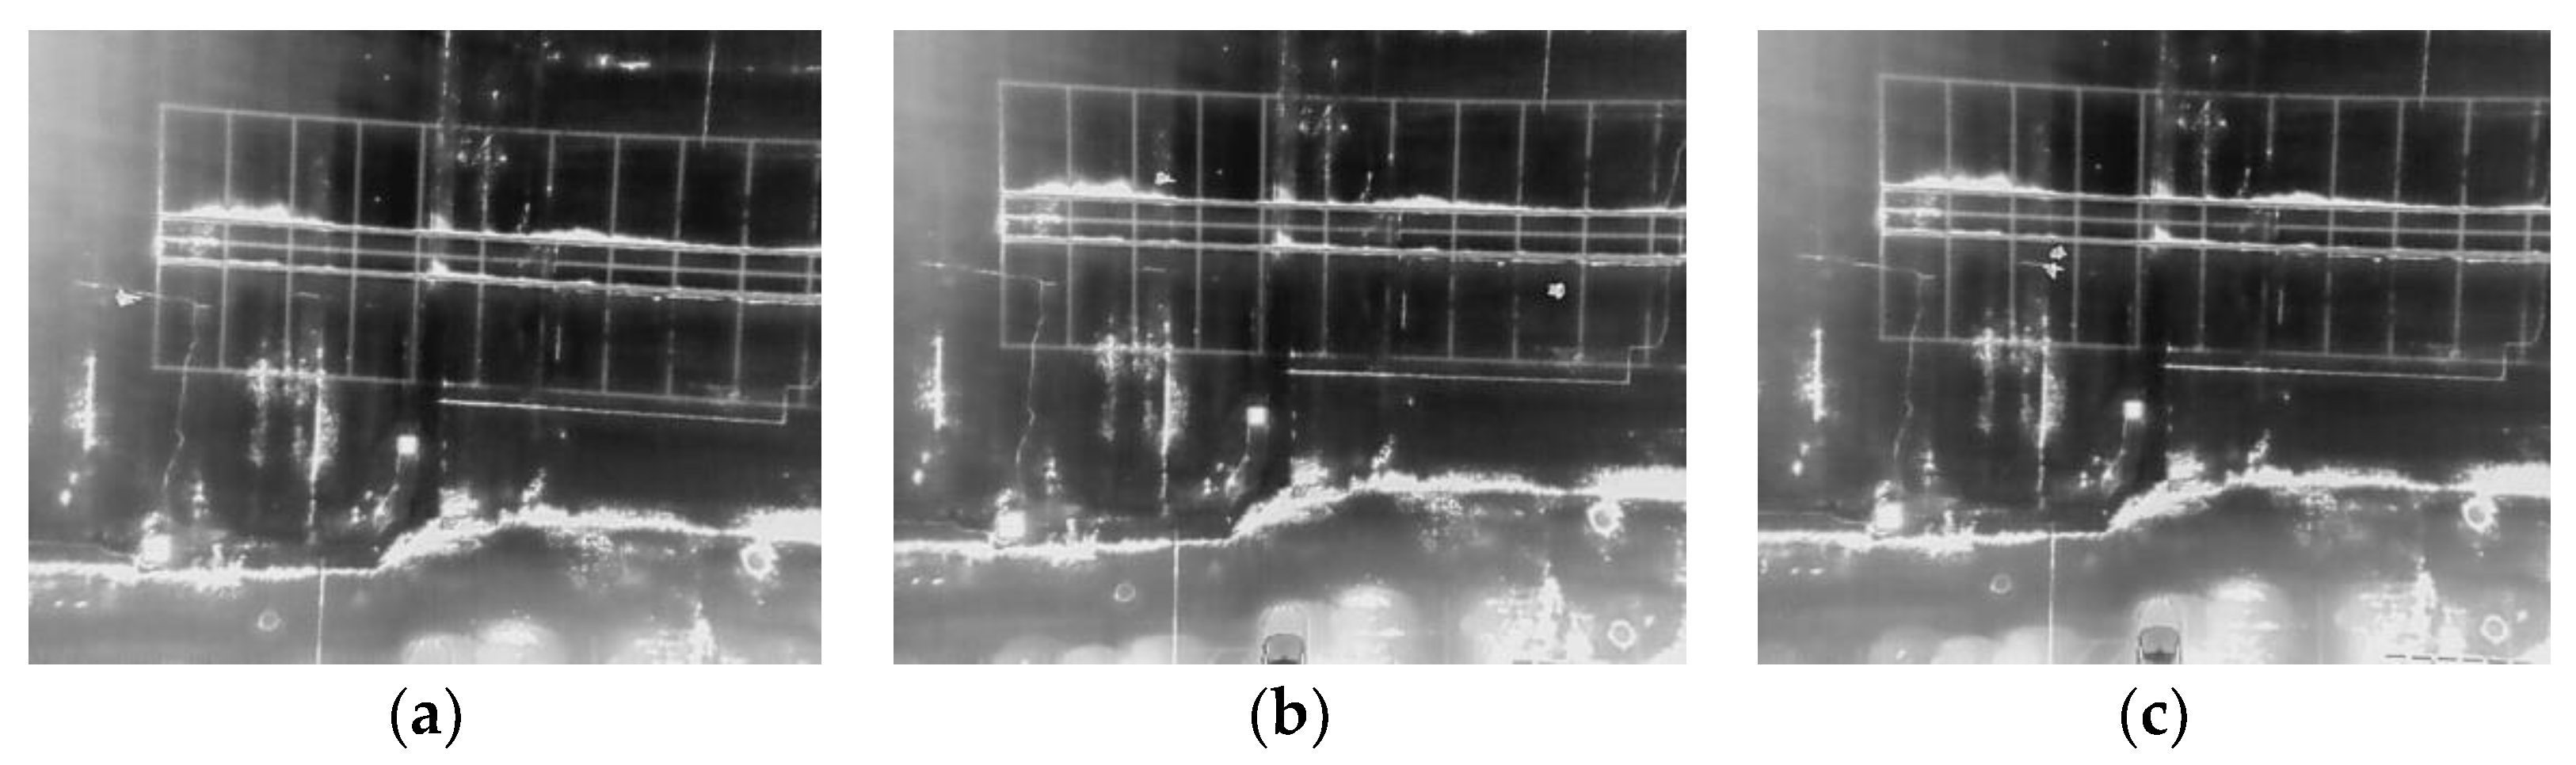
Figure 4 shows the 50th, 90th, and 150th frame of Video 1, and Figure 5 shows the 1st, 151st, and 301st frame of Video 2, and Figure 6 shows the 6th, 280th, and 406th frame of Video 3. The image characteristics vary greatly between the videos depending on climatic conditions and surrounding objects.
4.2. People Detection
The k-means clustering, morphological filtering, and false alarm removing were performed sequentially. The coordinate compensation was applied only to Video 3 to compensate for the unstable motion of the drone.
4.2.1. Parameter Set-Up
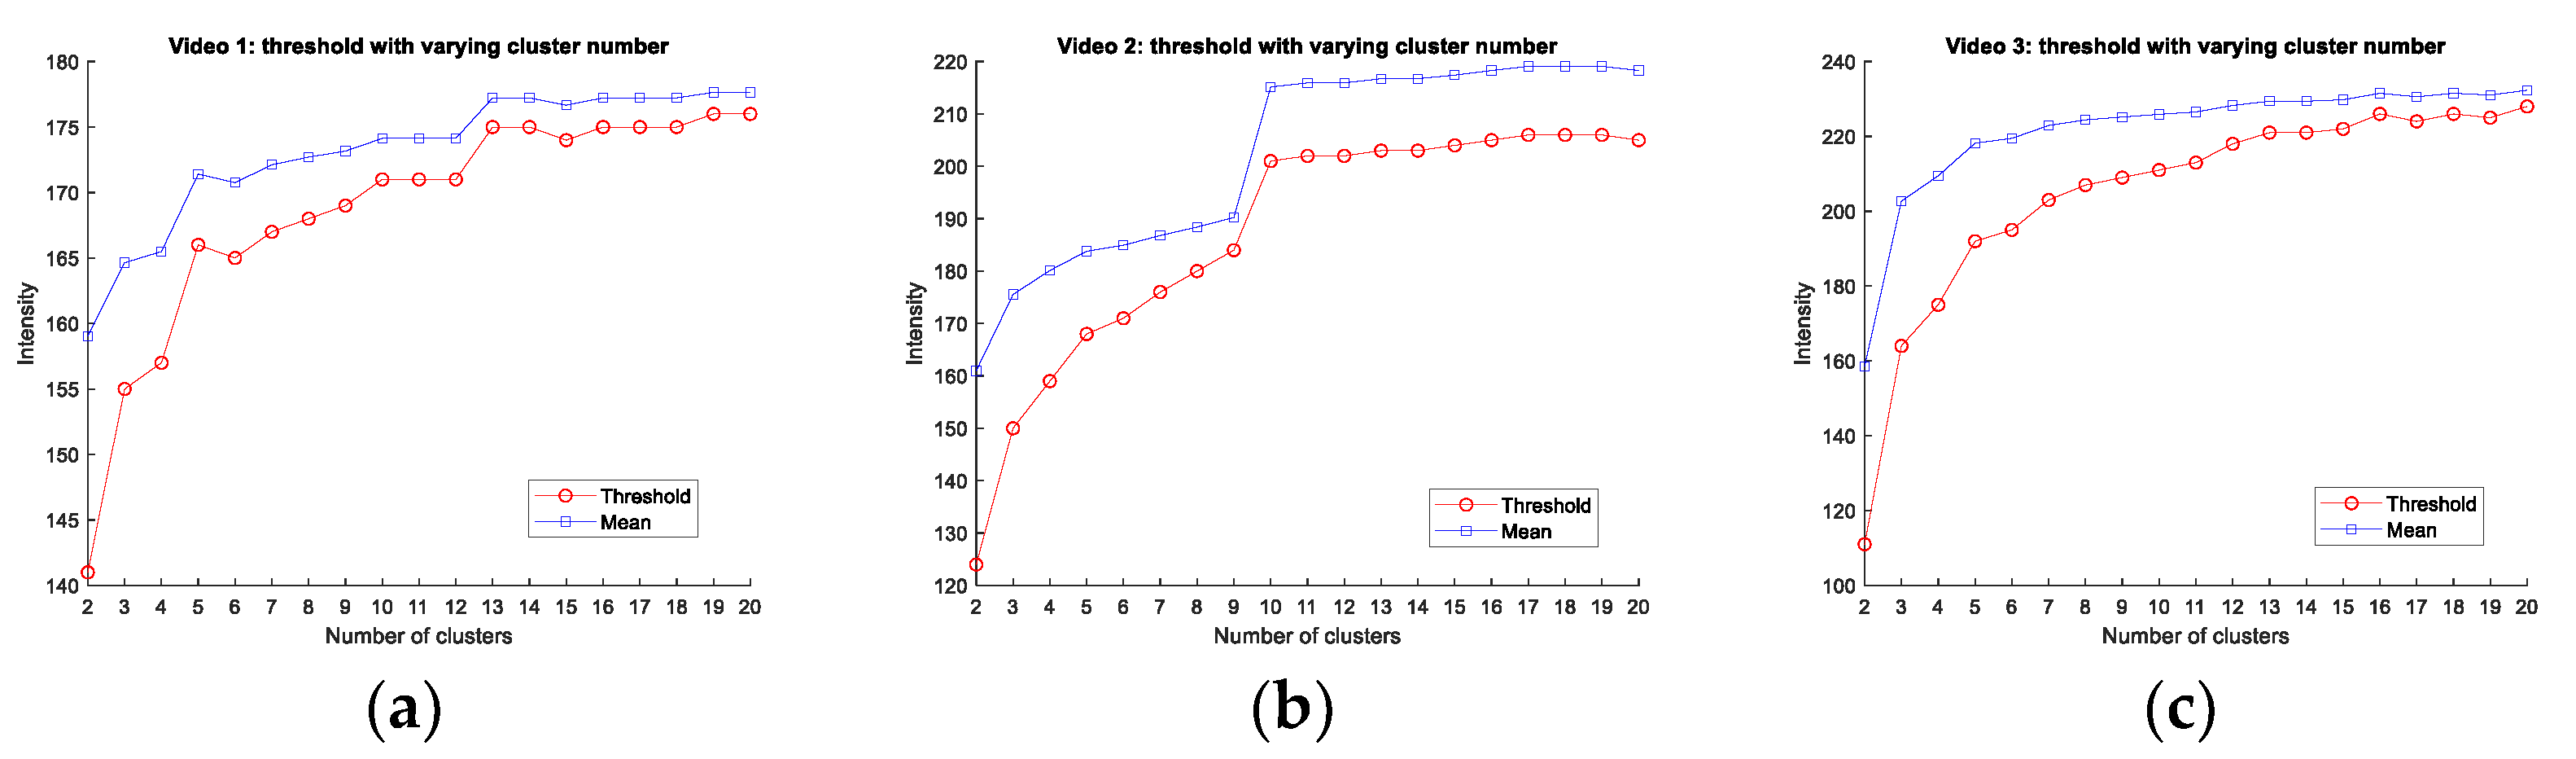
Since k-means clustering depends on the number of clusters, it is important to choose an appropriate number of clusters. The data set can be evaluated to find the elbow point where the cost function begins to be flat [32]. However, only the largest mean cluster is important for detecting people in thermal images since the region of interest is the object with the highest temperature. Therefore, the minimum of the largest mean cluster according to the number of clusters was obtained for sample frames. This minimum value is equal to the thresholding intensity. The minimum number of clusters was chosen for which the threshold remains constant. Figure 7 shows the thresholds with varying cluster numbers; the cluster number was set to six for Videos 1 and 3, and 10 for Video 2.
The parameters θmax and θmin reflect the size of the true object. They are the maximum and minimum size of the basic rectangle in Figure 2 projected onto the imaging plane. The maximum and minimum size of the basic rectangle were set to 1 m2 and 0.25 m2, respectively for Videos 1 and 2, and 1.5 m2 and 0.5 m2 for Video 3; θmax and θmin are calculated accordingly as in Table 2. The minimum squareness and minimum rectangularity are chosen heuristically when better results were produced. The parameters for object detection are presented in Table 2.
4.2.2. Detection Results
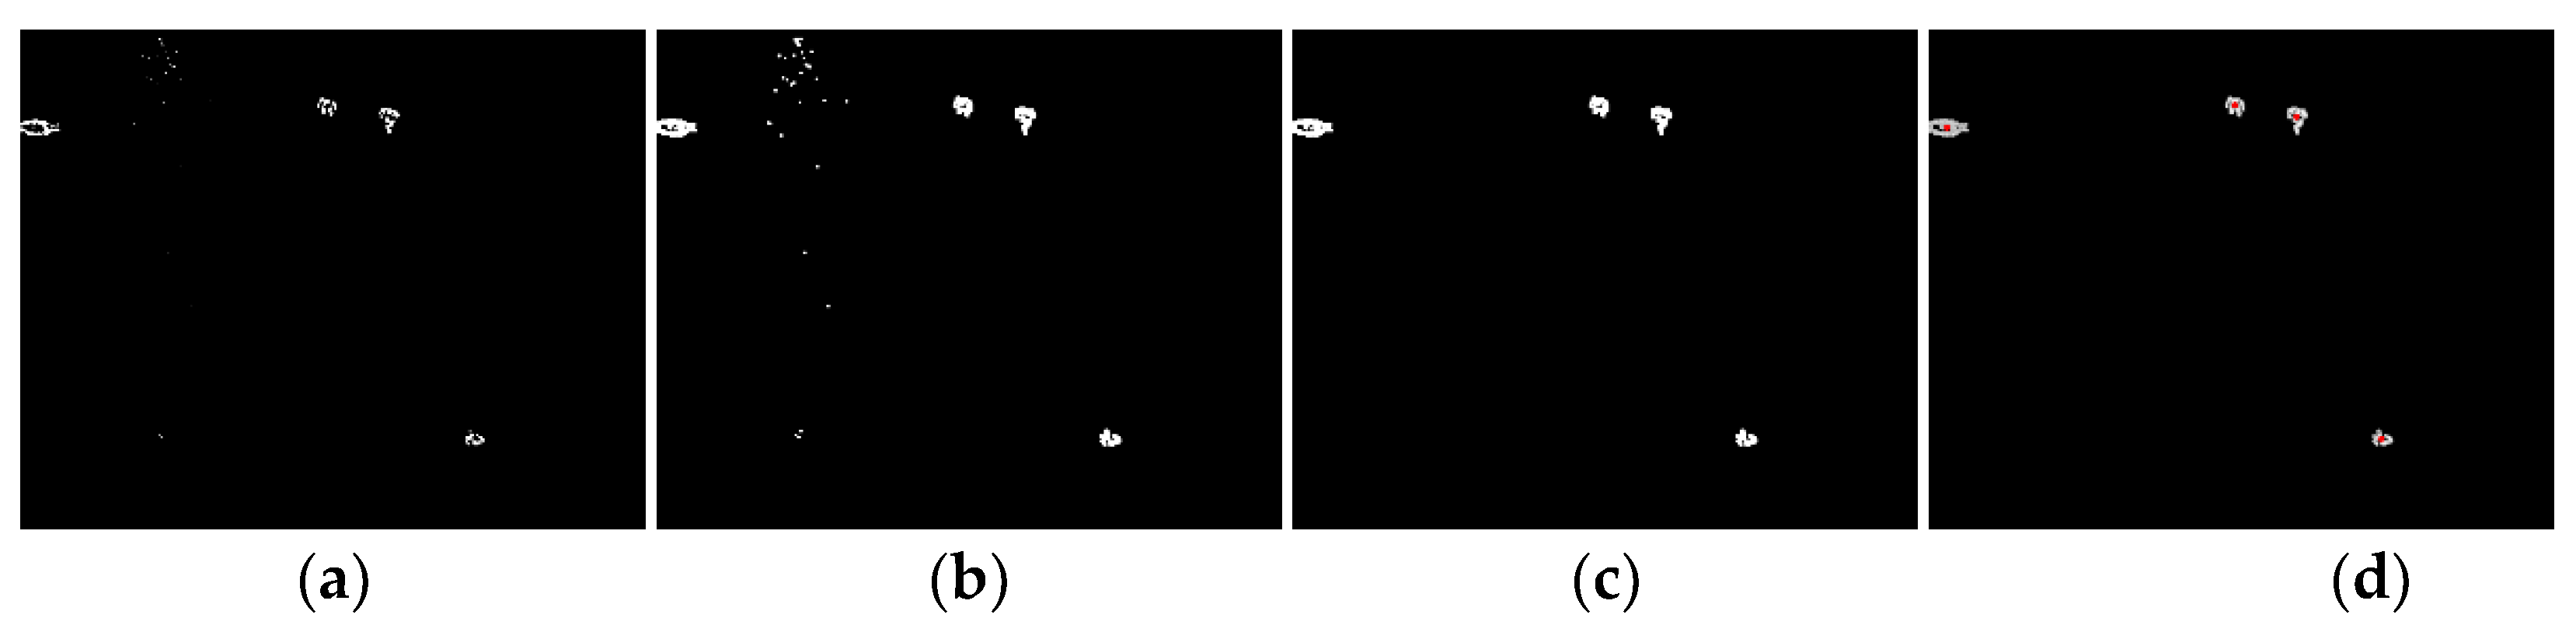
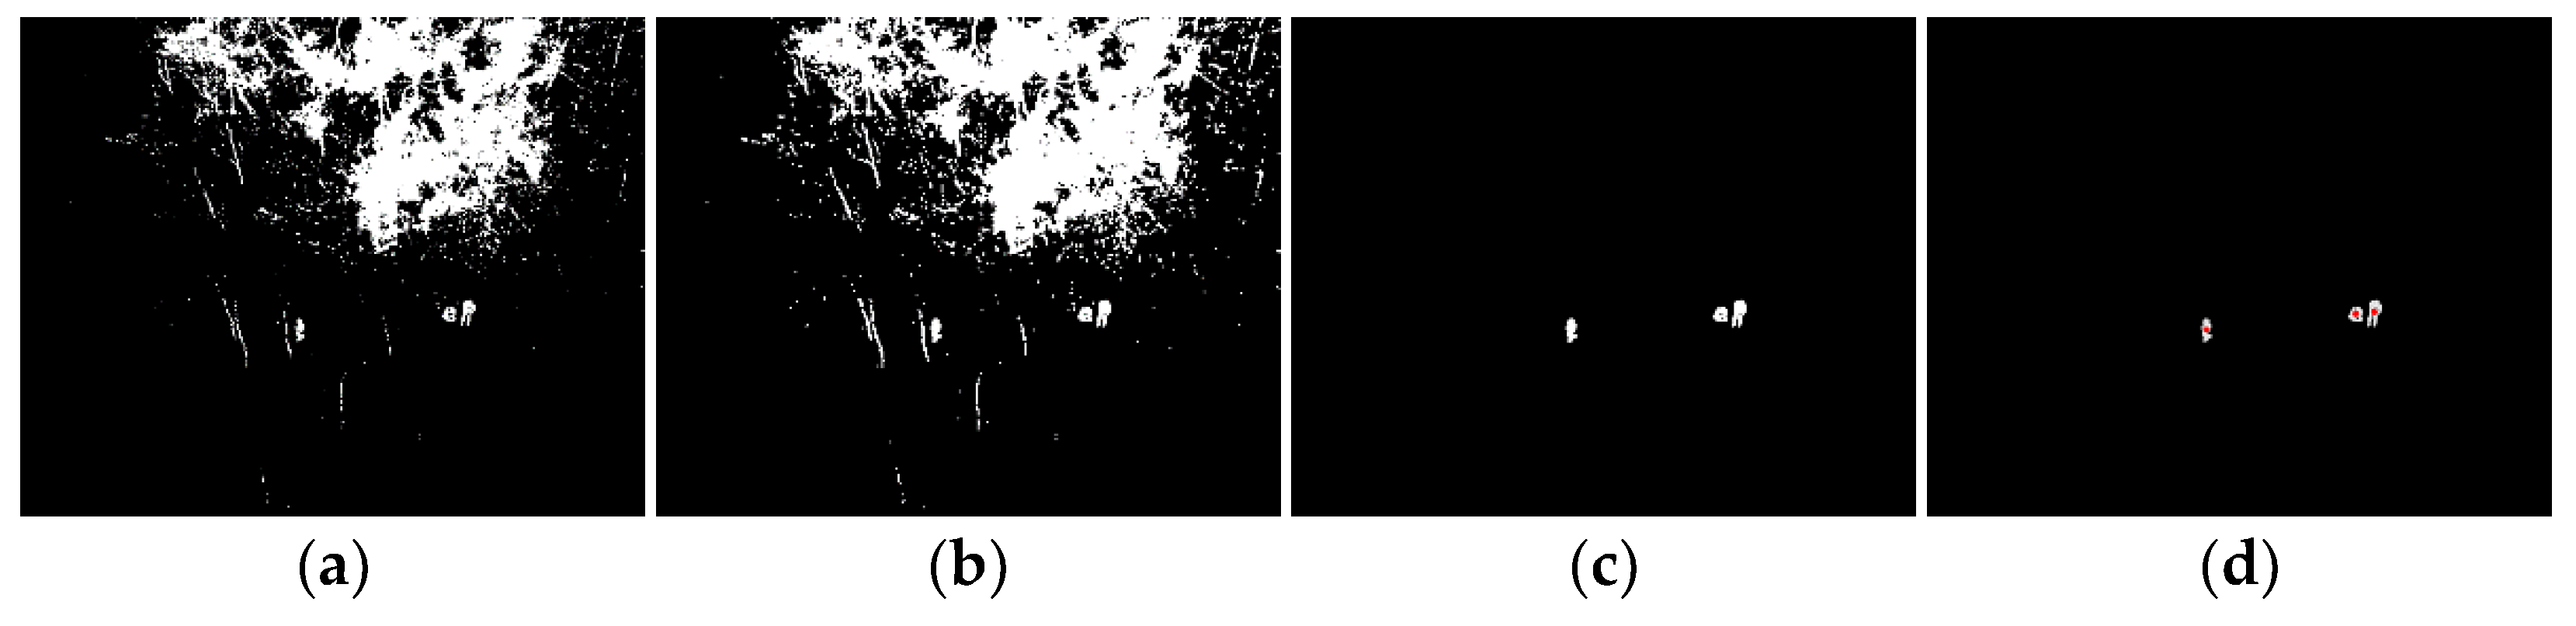
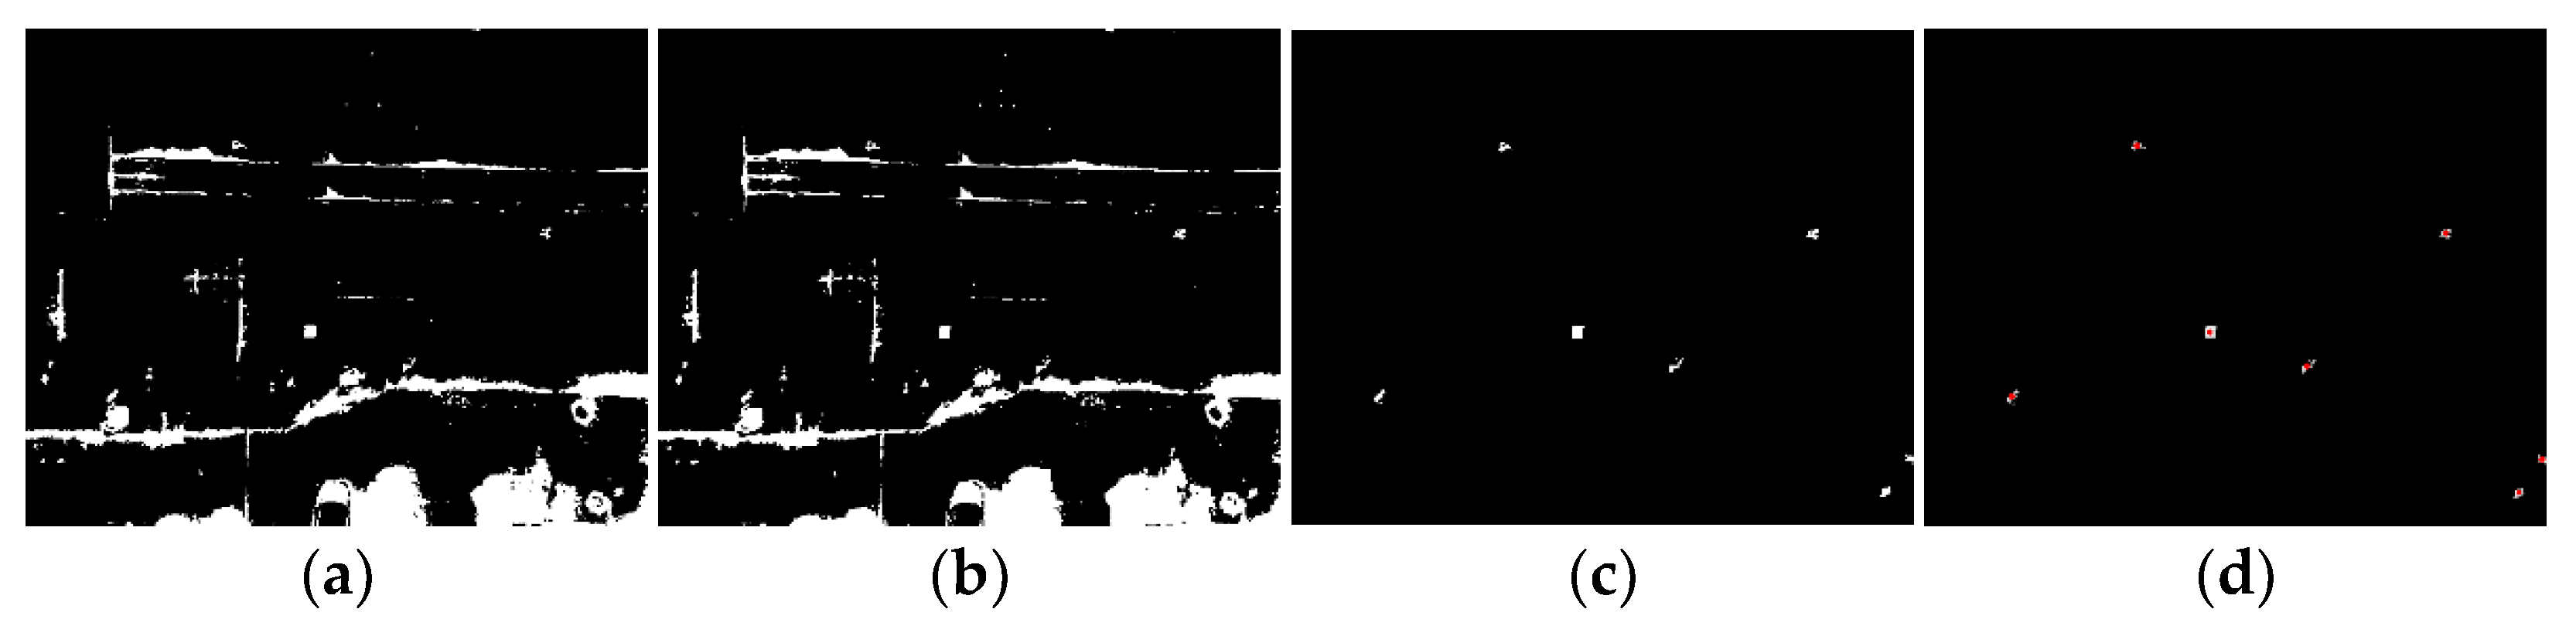
Figure 8a–d shows the intermediate results of the detection process of Figure 4b. Figure 8a is the binary image generated by k-means clustering. Figure 8b is the object area after the morphological operation are applied to Figure 8a. Figure 8c shows the object areas after false alarm removing in Figure 8b. Figure 8d shows the area of the detected object with the centroid marked by a red circle. Figure 9a–d shows the detection results of Figure 5b, and Figure 10a–d shows the detection results of Figure 6b.
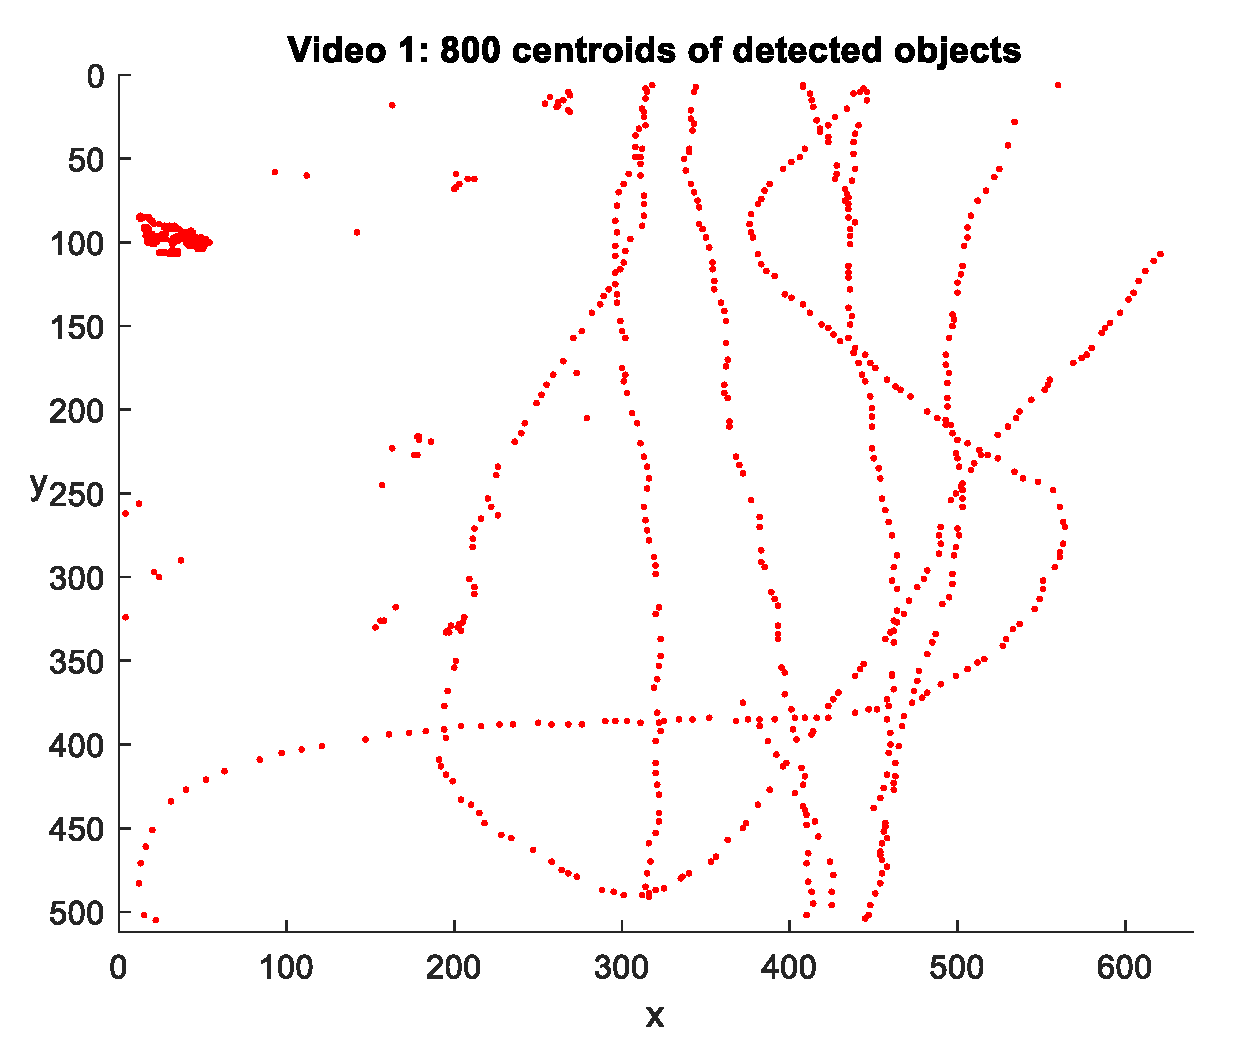
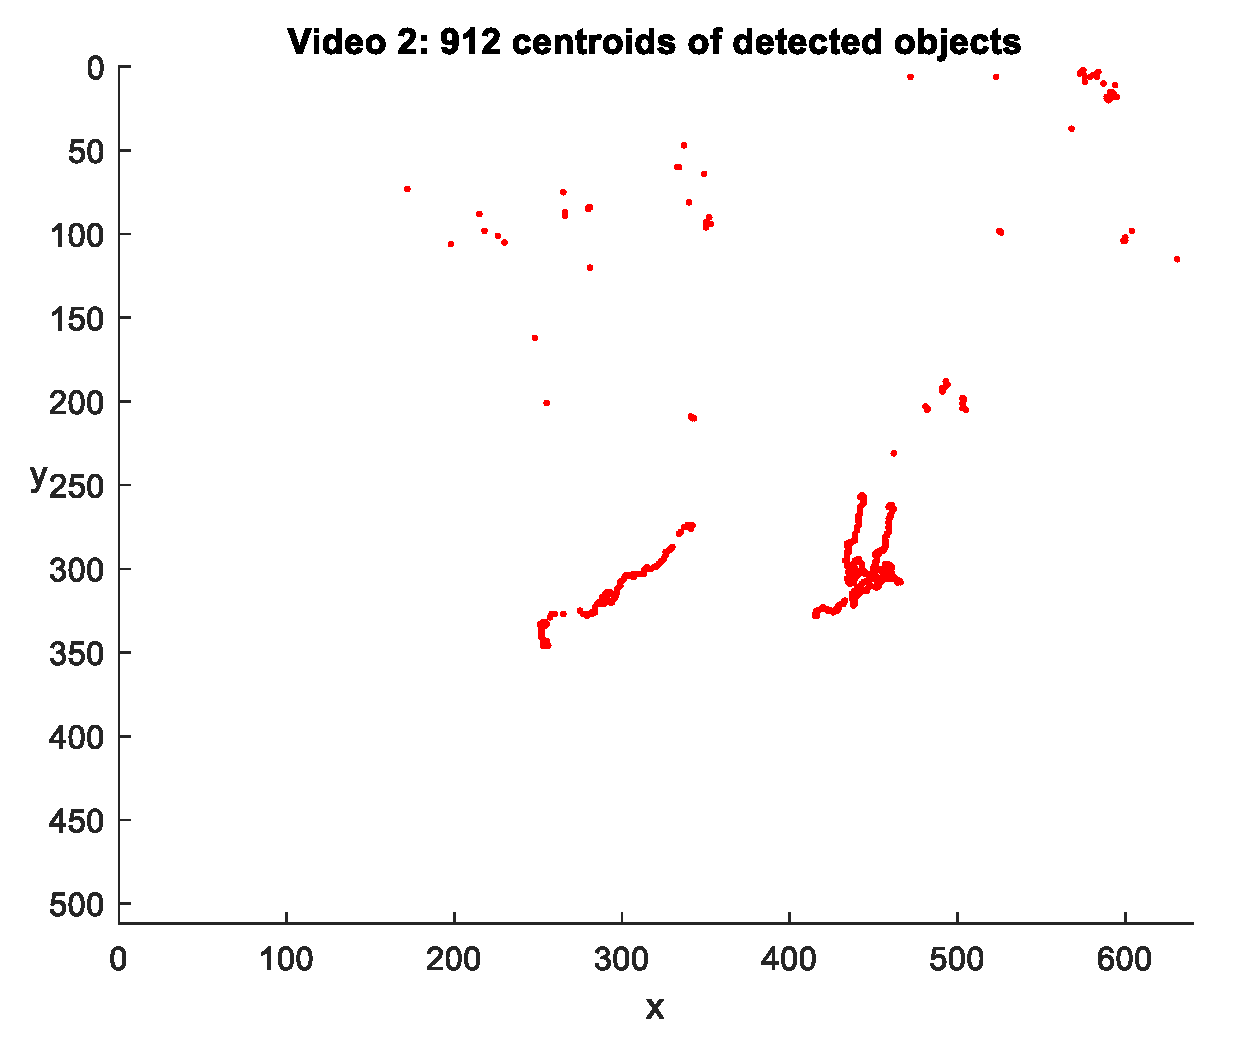
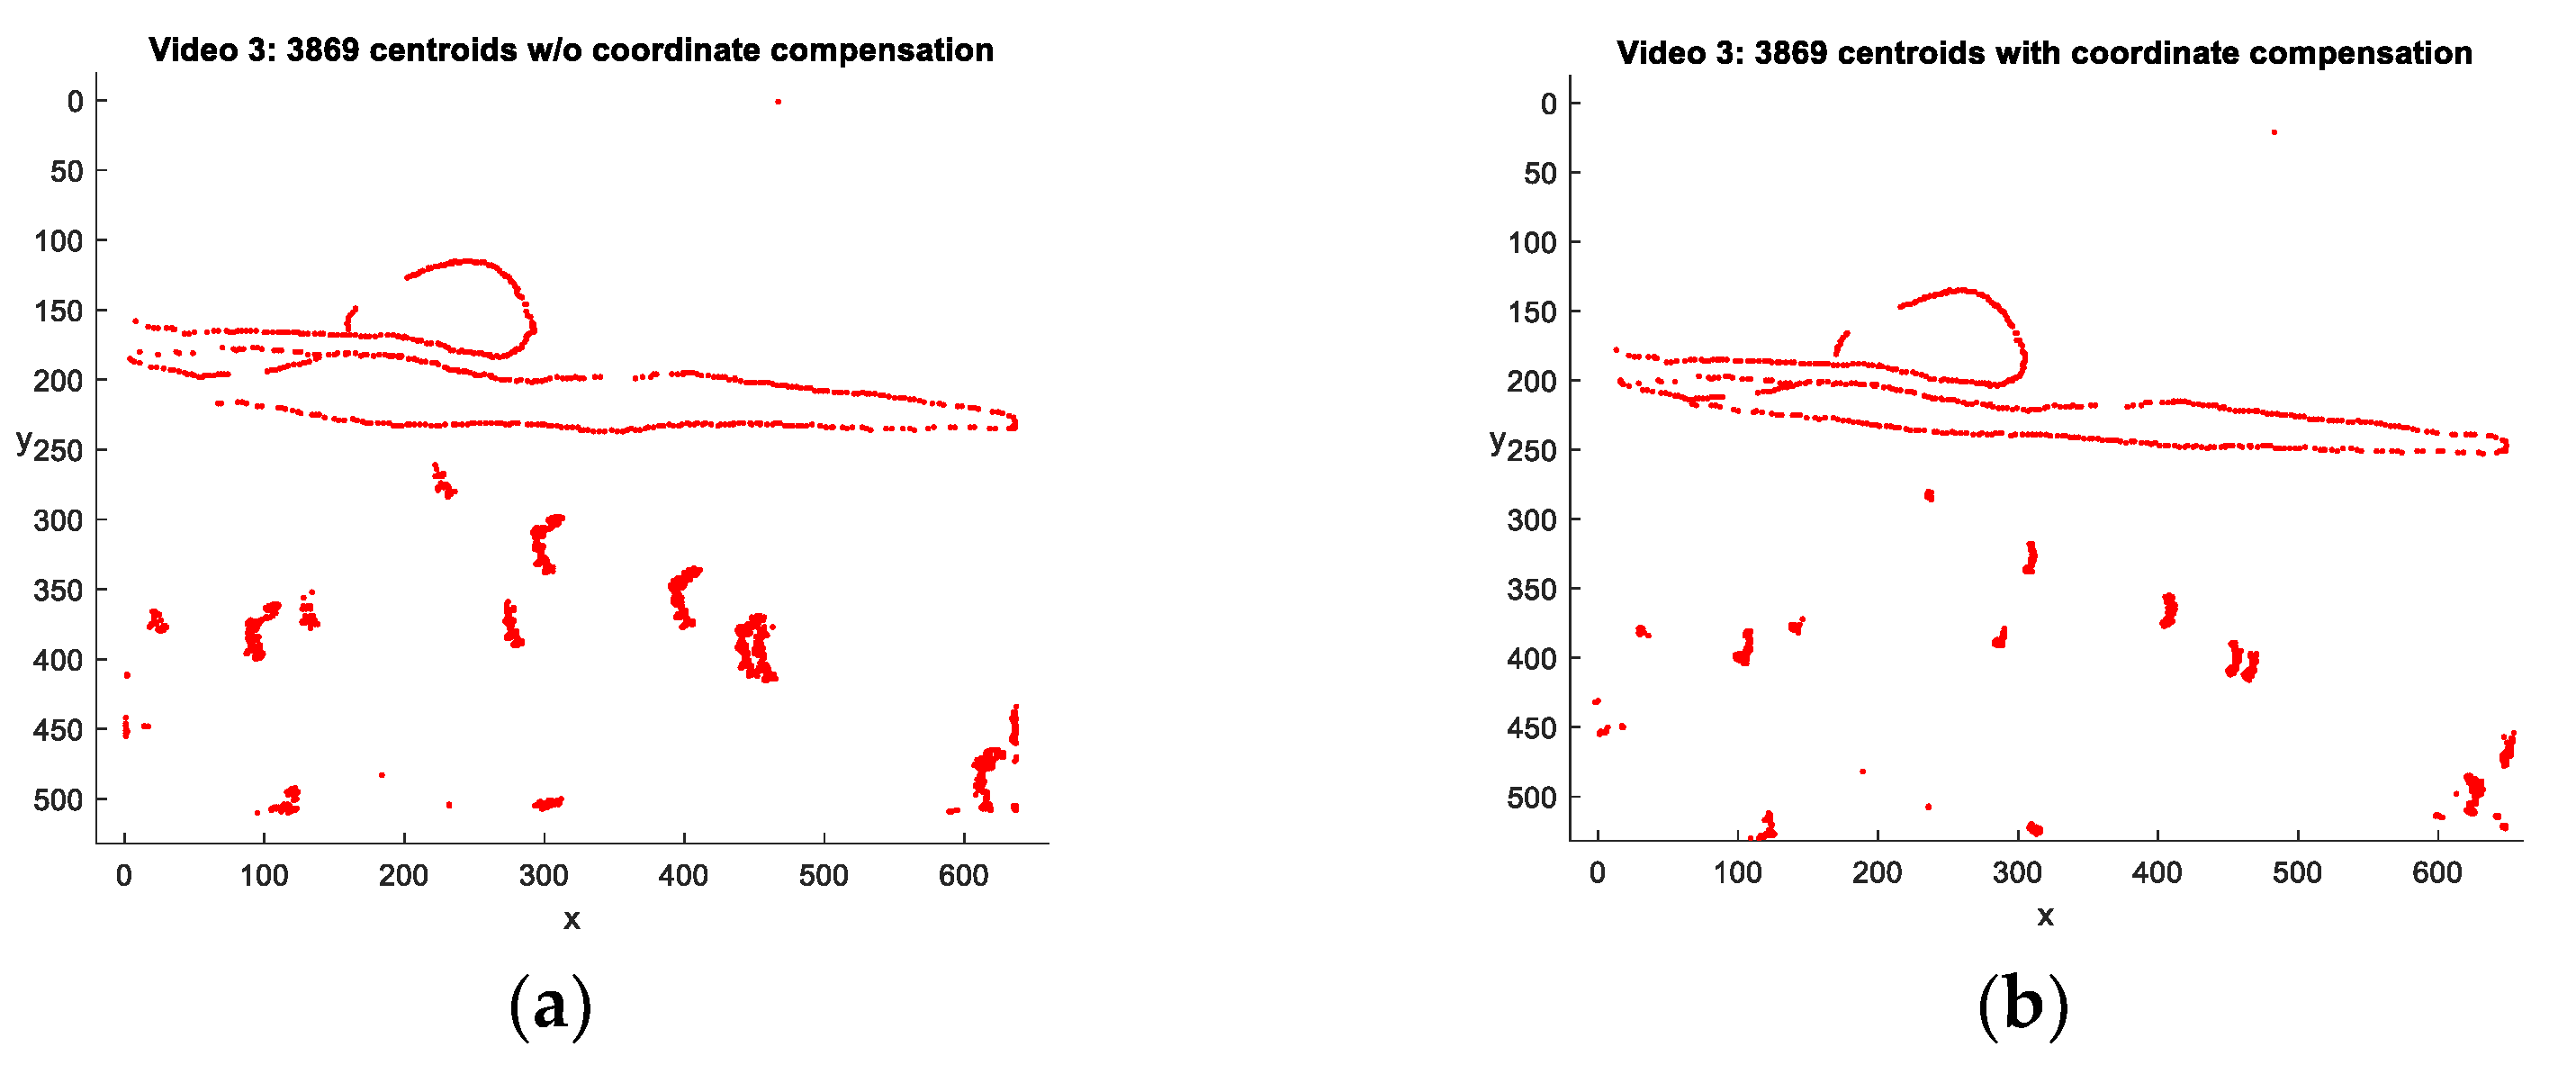
The detection results of the three videos are summarized in Table 3. The detection results for Videos 1, 2, and 3 are 91.4%, 91.8% and 79.8%, respectively. The number of false alarms per frame for Videos 1, 2, and 3 are 1.08, 0.28, and 6.36, respectively. The detection performances were degraded in Video 3. The false alarms were generated from the warm non-human objects at still. Certain objects (streetlight in Video 1 and manhole cover in Video 3) continuously generated false alarms in most of the frames. All the centroids of the object areas including false alarms are shown in Figure 11, Figure 12 and Figure 13. Figure 13a,b shows the centroids of the objects of Video 3 before and after the coordinate compensation, respectively; the coordinates of the objects are translated by obtained in equation (1). The coordinate translation reduced the fluctuation of the false alarms as shown in Figure 13b. It is noted that all centroids are input to the next target tracking stage as measurements.
4.3. Multiple Target Tracking
4.3.1. Parameter Set-Up
The parameters for target tracking are designed as in Table 4. The sampling time is 0.167 s for Video 1 and 0.1 s for Videos 2 and 3 since the actual frame rate is 6 and 10 fps, respectively. A single-mode IMM filter is adopted for Videos 1 and 2, which is the same as the Kalman filter, thus only one process noise variance is set to 10 m/s2. Two different process noise variances are set for the two-mode IMM filter which is adopted for Video 3. One variance is low as 5 m/s2, and that of the other mode is set large as 10 m/s2 to handle maneuvering targets and the unstable camera motion. The maximum target speed for track initialization and measurement association is set to 10 m/s and the minimum target speed for termination is set to 0.5 m/s, that is, the system aims to track a target moving between 0.5–10 m/s except for Video 2. For Video 2, the minimum target speed was set at 0 m/s considering that missing hikers can move and stop intermittently. The track termination criterion is set to a maximum of 10 and 15 searches with no valid measurements for Videos 1 and 2, and Video 3, respectively. The minimum track life length for a valid track is set to 10, thus all tracks less than 10 frames in length (approximately 1.7 s for Video 1 and 1 s for Videos 2 and 3) are removed as false tracks.
4.3.2. Tracking Results of Video 1
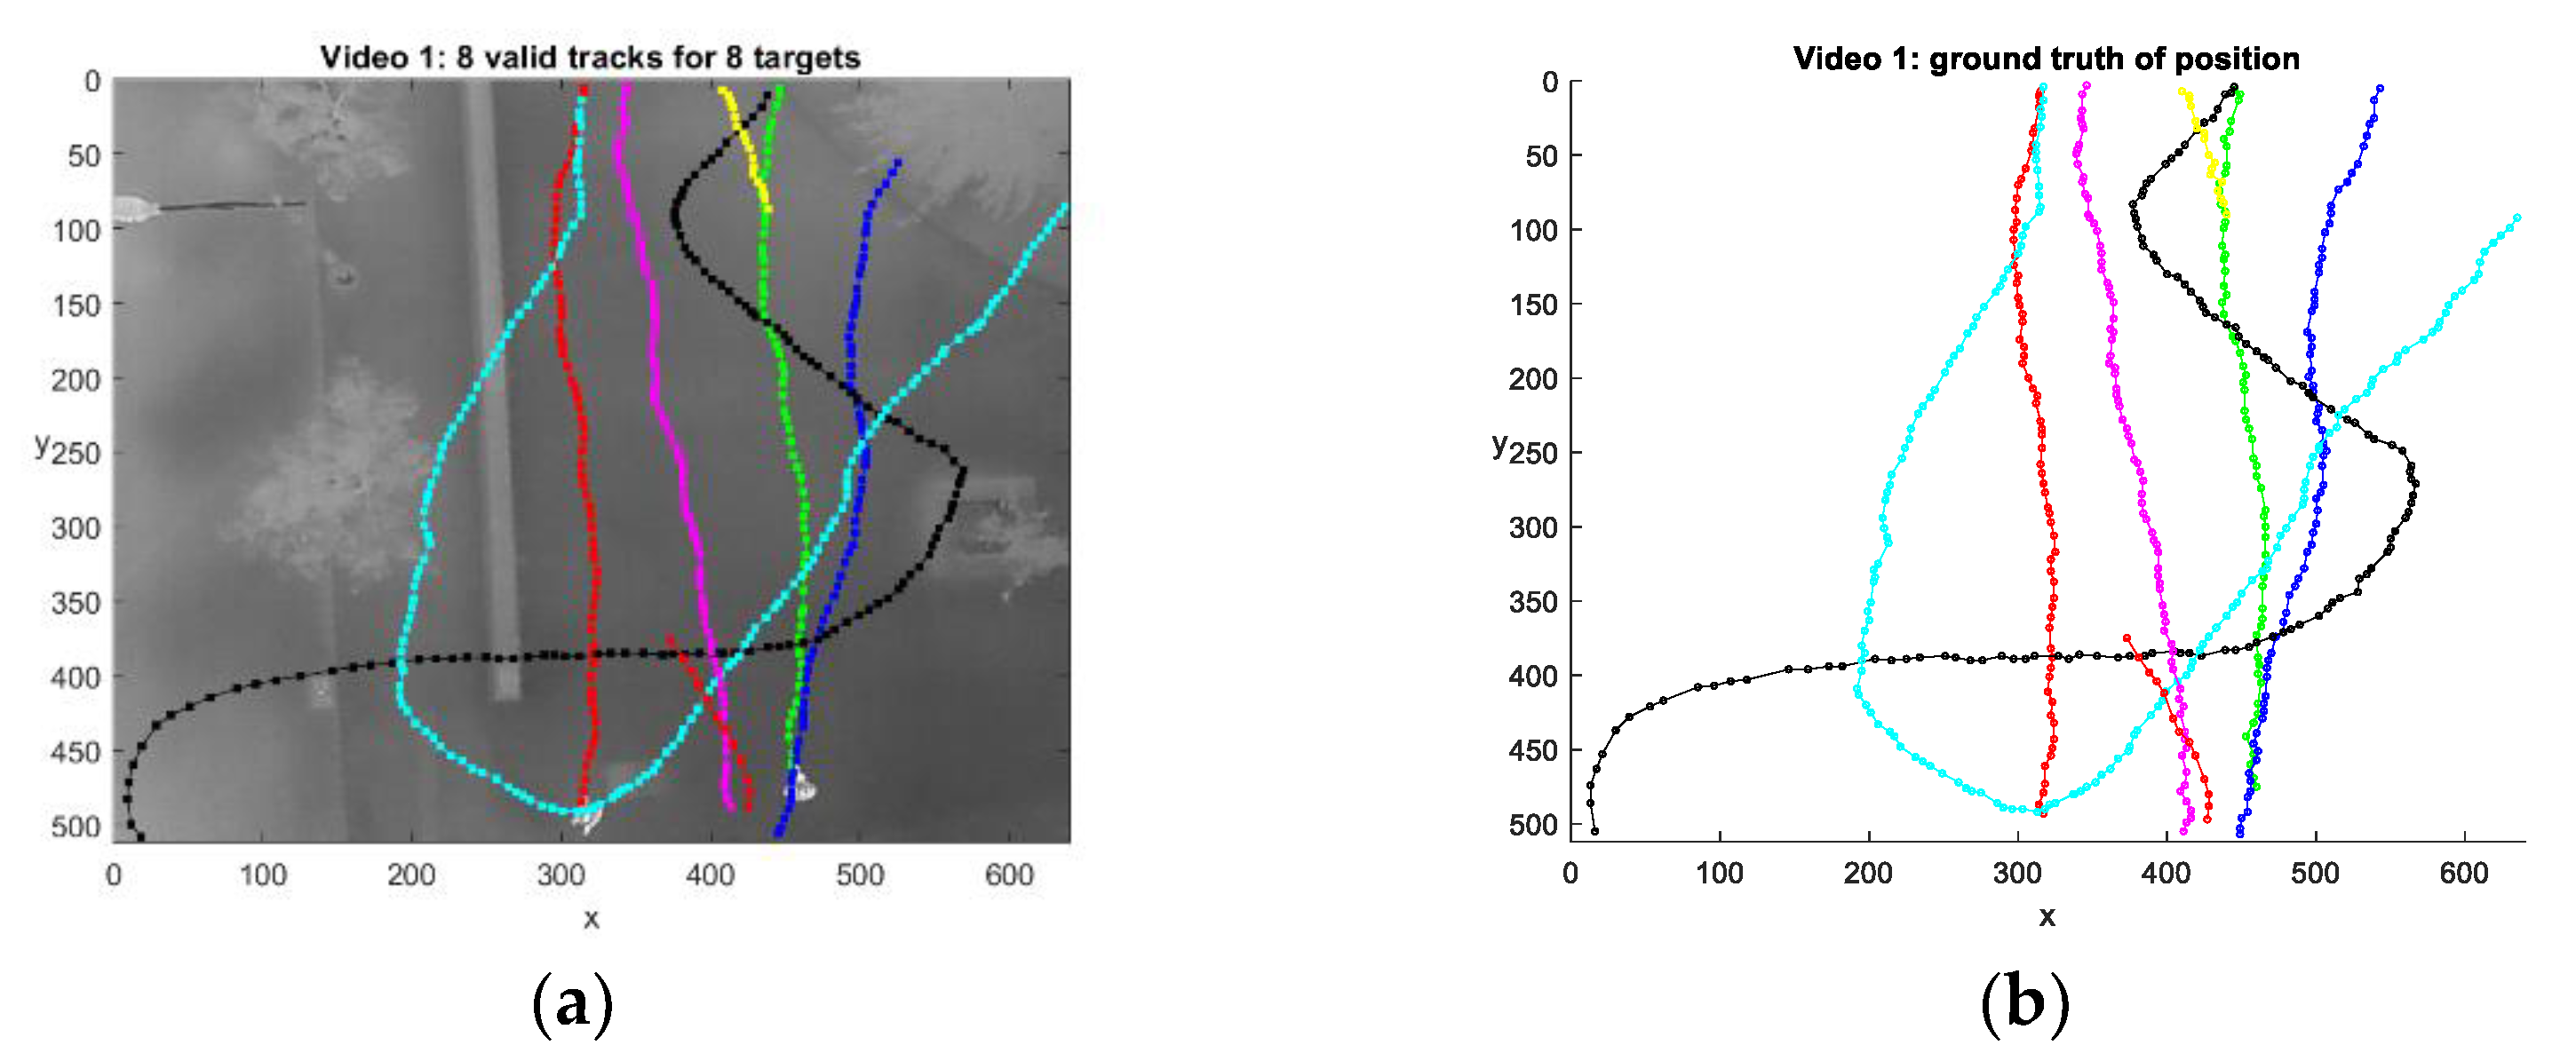
A total of eight valid tracks are generated for eight targets as shown in Figure 14a. Figure 14b shows the ground truth of the target position. The ground truth is manually obtained from each frame of the video. The ground truth of the velocity is obtained as the difference in position between consecutive frames divided by the sampling time.
The tracking performance is evaluated in terms of the number of track segments (NTS), and the total track life (TTL) [26] as well as the position and velocity RMSEs. The target ID of a track is defined as the target with the largest number of measurements in the track. The TTL is defined as the ratio of the sum of lengths of track segments which have the same target ID and the target life length. Table 5 shows the NTS and TTL for each target and the position and velocity RMSEs of Video 1. The NTS is 1 for each target because there are no redundant, missing, or segmented tracks among valid tracks. No valid false track was generated as well. The average TTL is 99% showing the robustness of the tracking performance. The average position RMSE is about 0.077 m, which is equivalent to 2.85 pixels, and the average velocity RMSE is 0.528 m/s. This result shows that the manually obtained centroid of the object is very close to the position estimate calculated by the target tracker.
Two supplementary multimedia files (MP4 format) that track people in Video 1 are available online. One is the target tracking result, which displays the position estimate immediately, and the valid track number is displayed together (Supplementary Material Video S1); The other shows the trajectories of valid tracks, and the invalid (false) trajectories are removed when the track termination criteria are satisfied in the movie (Supplementary Material Video S2). The blue circles in the MP4 file are the position estimates of the valid tracks, and the black circles represent the false tracks. The numbers represent the valid track numbers in the order they were created.
4.3.3. Tracking Results of Video 2
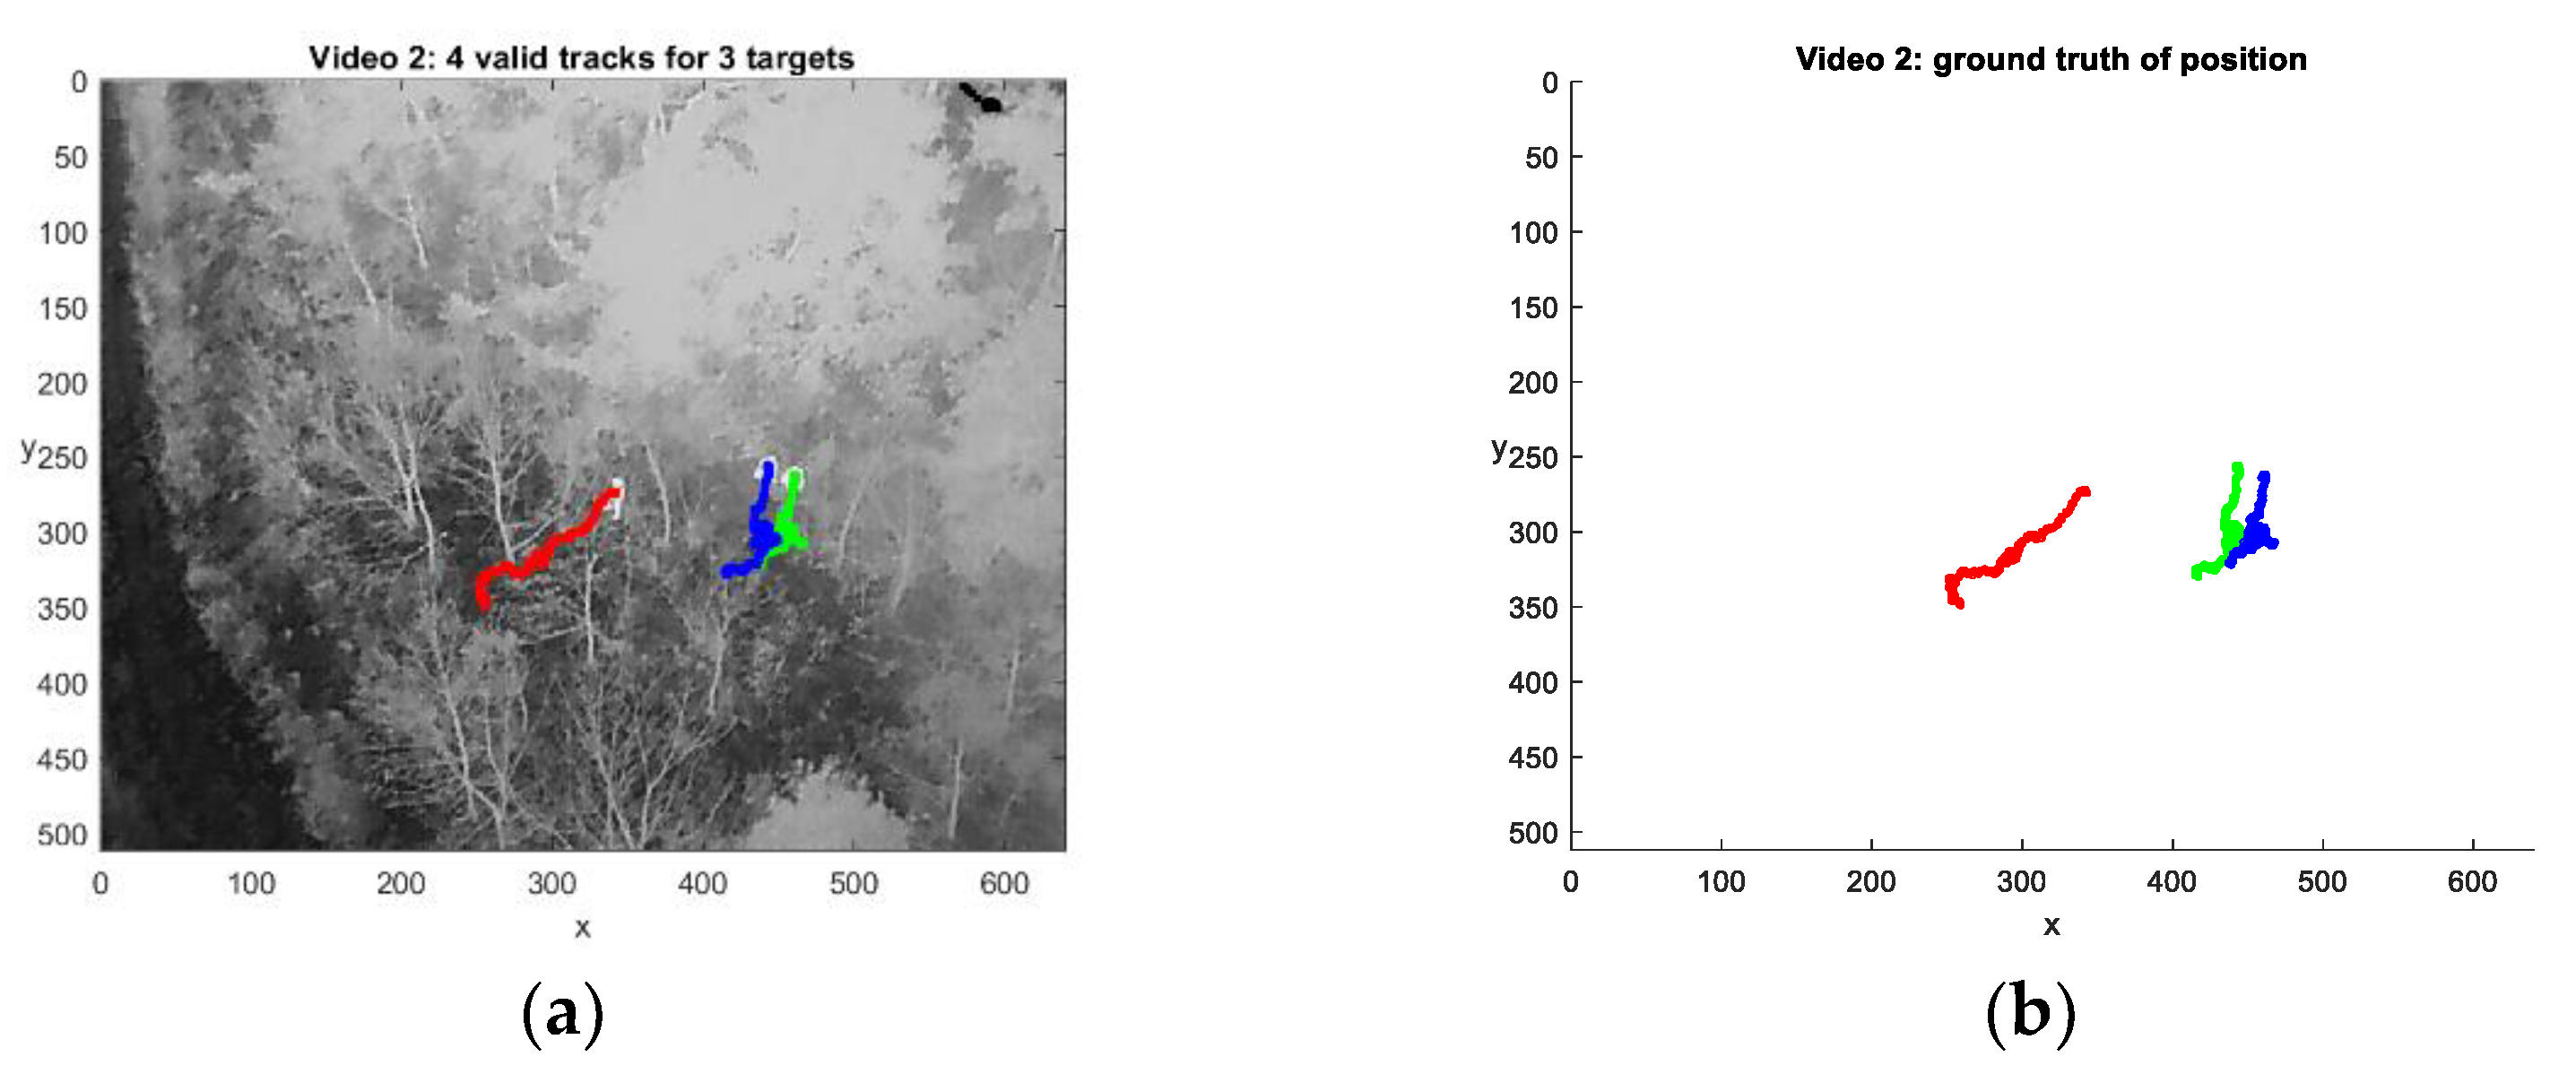
A total of four valid tracks are generated for three targets as shown in Figure 15a. Figure 15b shows the ground truth of the target position. One false track is validated in the upper right corner as shown in Figure 15a.
Table 6 shows the tracking performance of Video 2. The NTS for a false target is equivalent to the number of the false track. The average TTL is 100%, and the average position RMSE is about 0.06 m, which is equivalent to 1.5 pixels, and the average velocity RMSE is 0.582 m/s.
Two supplementary multimedia files (MP4 format) that track people in Video 2 are available online (Supplementary Material Video S3 and Supplementary Material Video Video S4). They are displayed the same as in the previous subsection.
4.3.4. Tracking Results of Video 3
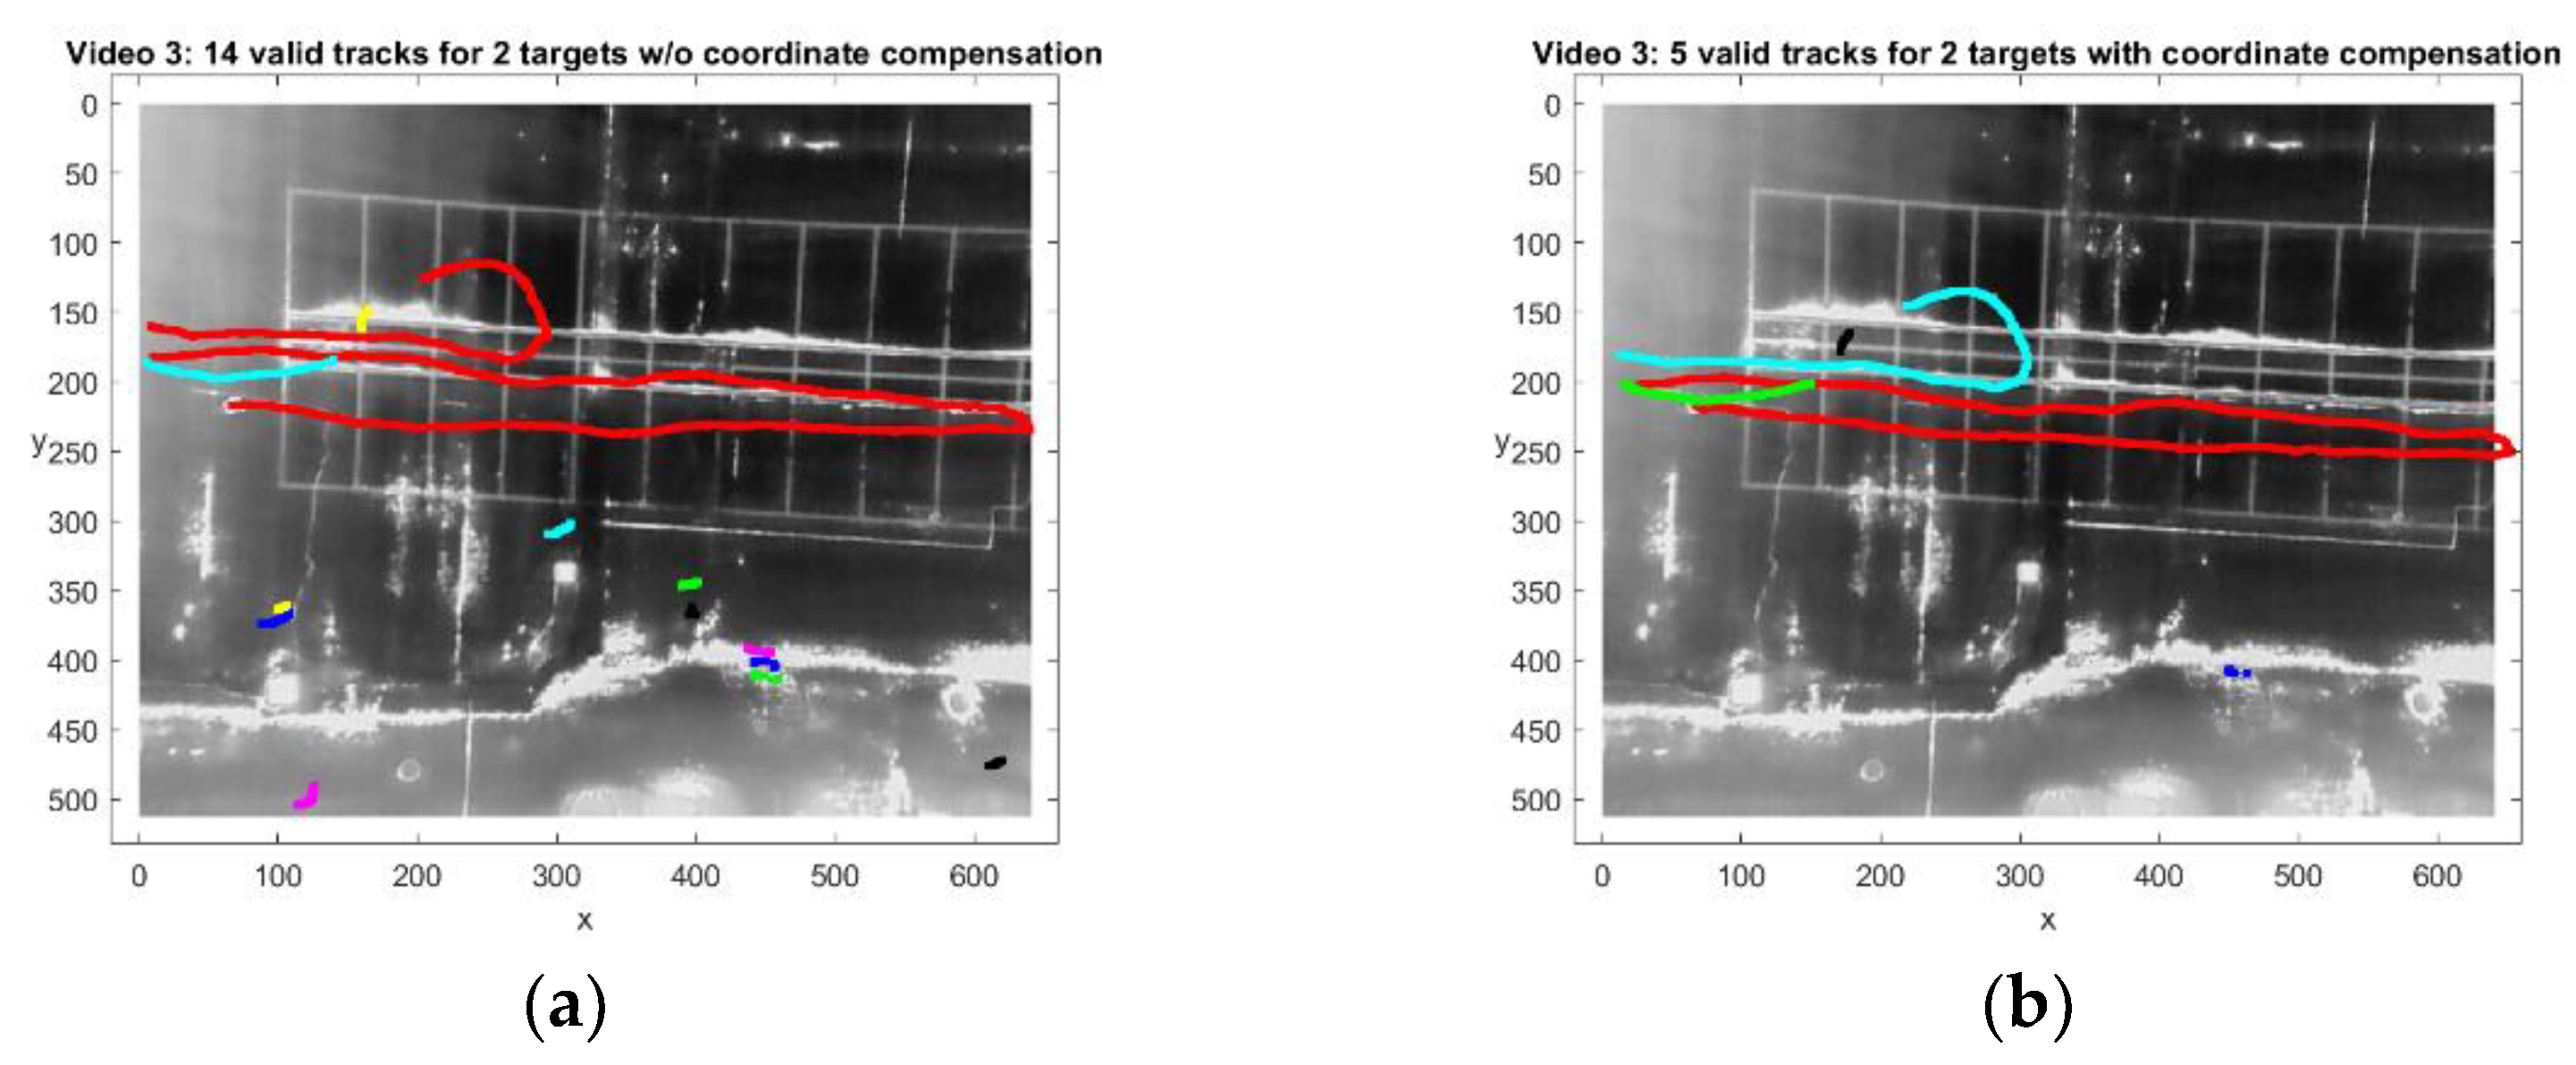
A total of 14 valid tracks are generated for two targets without the coordinate compensation as shown in Figure 16a. The number of the false track is 10 out of 14 valid tracks. The number of false tracks is reduced to one by the coordinate compensation as shown in Figure 16b. Figure 17a,b show the ground truths without and with the coordinate compensation, respectively.
The first target was well tracked with one valid track, but three track segments were generated for the second target due to missing detections caused by the backgrounds. Table 7 and Table 8 show the tracking results with and without coordinate compensation, respectively. The NTS and TTS remain the same for the true targets, but the NTS for a false target were reduced from 10 to 1. The average RMSE of position decreased from 0.2 m to 0.177 m, and the average RMSE of velocity decreased from 1.877 m/s to 1.838 m/s after the coordinate compensation.
Four supplementary multimedia files (MP4 format) for Video 3 are available online. Two are tracking results without coordinate compensation (Supplementary Material Videos S5 and S6), and the other two use coordinate compensation (Supplementary Material Videos S7 and S8). They are displayed the same as in the previous section.
5. Discussion
The thermal image quality varies with atmospheric conditions and surrounding objects. In Video 1, the streetlight continuously generates a false alarm for almost every frame, but no false track was generated because it was a stationary object moving slower than the minimum target speed. In Video 2, which simulates missing hikers who can move and stop intermittently, the minimum target speed was not set to remove false tracks, but only one false track was generated. In Video 3, the ambient temperature was similar to that of a human, resulting in lower detection and high false alarm rates. These false alarms generate many false tracks due to strong winds and high altitude of the drone, but two proposed strategies have significantly reduced the number of false tracks; one is the coordinate compensation, and the other is the track termination criterion based on a minimum target speed. It has been also shown that the coordinate compensation improves the tracking accuracy.
6. Conclusions
In this paper, an IR thermal camera mounted on a drone captured multiple moving people in winter and summer. The coordinates of the frame were compensated, and the moving objects were detected based on the k-means clustering, morphological operations, and false alarm removing. The targets were tracked with two-point differencing initialization, Kalman or IMM filter, and NN association. The target’s minimum speed is tested, and the very slow tracks are removed as false-positive tracks. The robust performance was obtained from all video clips captured in a very different environment and climate conditions. The proposed detection and tracking method is useful for smart security and surveillance and for search and rescue missions in hazardous areas. It can be used to track animals in wildlife, that remains for future study.
Supplementary Materials
The following are available online at https://0-www-mdpi-com.brum.beds.ac.uk/article/10.3390/drones5030065/s1, Video S1: Video 1 all tracks, Video S2: Video 1 all traces, Video S3: Video 2 all tracks, Video S4: Video 2 all traces, Video S5: Video 3 all tracks without compensation, Video S6: Video 3 all traces without compensation, Video S7: Video 3 all tracks with compensation, Video S8: Video 3 all traces with compensation.
Funding
This research was supported by Daegu University Research Grant.
Institutional Review Board Statement
Not applicable.
Informed Consent Statement
Not applicable.
Data Availability Statement
Not applicable.
Acknowledgments
I am thankful to Don-Ho Nam, Dong-Il Kim, and Dong-Min Park for their assistance in capturing the IR thermal videos.
Conflicts of Interest
The authors declare no conflict of interest.
References
- Available online: https://www.businessinsider.com/drone-technology-uses-applications (accessed on 1 July 2021).
- Available online: https://www.axis.com/files/articles/Ch5_thermalcameras.pdf (accessed on 1 July 2021).
- Available online: https://www.flirmedia.com/MMC/THG/Brochures/T559243/T559243_EN.pdf (accessed on 1 July 2021).
- Available online: https://www.infinitioptics.com/technology/thermal-imaging (accessed on 1 July 2021).
- Vollmer, M.; Mollmann, K.-P. Infrared Thermal Imaging: Fundamentals, Research and Applications; Wiley-VCH: Weinheim, Germany, 2010. [Google Scholar]
- Available online: https://www.photonics.com/Articles/Thermal_Camera-Equipped_UAVs_Spot_Hard-to-Find/a63435 (accessed on 1 July 2021).
- Burke, C.; McWhirter, P.R.; Veitch-Michaelis, J.; McAree, O.; Pointon, H.A.G.; Wich, S.; Longmore, S. Requirements and Limitations of Thermal Drones for Effective Search and Rescue in Marine and Coastal Areas. Drones 2019, 3, 78. [Google Scholar] [CrossRef] [Green Version]
- Gonzalez, L.F.; Montes, H.G.A.; Puig, E.; Johnson, S.; Mengersen, K.; Gaston, K.J. Unmanned Aerial Vehicles (UAVs) and Artificial Intelligence Revolutionizing Wildlife Monitoring and Conservation. Sensors 2016, 16, 97. [Google Scholar] [CrossRef] [PubMed] [Green Version]
- Messina, G.; Modica, G. Applications of UAV Thermal Imagery in Precision Agriculture: State of the Art and Future Research Outlook. Remote Sens. 2020, 12, 1491. [Google Scholar] [CrossRef]
- Sanna, A.; Pralio, B.; Lamberti, F.; Paravati, G. A Novel Ego-Motion Compensation Strategy for Automatic Target Tracking in FLIR Video Sequences taken from UAVs. IEEE Trans. Aerosp. Electron. Syst. 2009, 45, 723–734. [Google Scholar] [CrossRef]
- Levin, E.; Zarnowski, A.; McCarty, J.L.; Bialas, J.; Banaszek, A.; Banaszek, S. Feasibility Study of Inexpensive Thermal Sensor and Small UAS Deployment for Living Human Detection in Rescue Missions Application Scenario. In Proceedings of the International Archives of the Photogrammetry, Remote Sensing and Spatial Information Sciences, Volume XLI-B8, 2016 XXIII ISPRS Congress, Prague, Czech Republic, 12–19 July 2016. [Google Scholar]
- Teutsch, M.; Mueller, T.; Huber, M.; Beyerer, J. Low Resolution Person Detection with a Moving Thermal Infrared Camera by Hot Spot Classification. In Proceedings of the 2014 IEEE Conference on Computer Vision and Pattern Recognition Workshops, Columbus, OH, USA, 23–28 June 2014; pp. 209–216. [Google Scholar] [CrossRef]
- Rudol, P.; Doherty, P. Human Body Detection and Geolocalization for UAV Search and Rescue Missions Using Color and Thermal Imagery. In Proceedings of the 2008 IEEE Aerospace Conference, Big Sky, MT, USA, 1–8 March 2008; pp. 1–8. [Google Scholar] [CrossRef]
- Giitsidis, T.; Karakasis, E.G.; Gasteratos, A.; Sirakoulis, G.C. Human and Fire Detection from High Altitude UAV Images. In Proceedings of the 2015 23rd Euromicro International Conference on Parallel, Distributed, and Network-Based Processing, Turku, Finland, 4–6 March 2015; pp. 309–315. [Google Scholar] [CrossRef]
- Kim, D.; Yeom, S. Experimental Study on Human Detection with a Drone at Night. In Proceedings of the 2019 International Conference on Fuzzy Theory and Its Applications (iFUZZY 2019), New Taipei City, Taiwan, 7–10 November 2019; pp. 149–150. [Google Scholar]
- Leira, F.S.; Helgensen, H.H.; Johansen, T.A.; Fossen, T.I. Object detection, recognition, and tracking from UAVs using a thermal camera. J. Field Robot. 2021, 38, 242–267. [Google Scholar] [CrossRef]
- Helgesen, H.H.; Leira, F.S.; Johansen, T.A. Colored-Noise Tracking of Floating Objects using UAVs with Thermal Cameras. In Proceedings of the 2019 International Conference on Unmanned Aircraft Systems (ICUAS), Atlanta, GA, USA, 11–14 June 2019; pp. 651–660. [Google Scholar] [CrossRef] [Green Version]
- Davis, J.W.; Sharma, V. Background-Subtraction in Thermal Imagery Using Contour Saliency. Int. J. Comput. Vis. 2007, 71, 161–181. [Google Scholar] [CrossRef]
- Soundrapandiyan, R. Adaptive Pedestrian Detection in Infrared Images Using Background Subtraction and Local Thresholding. Procedia Comput. Sci. 2015, 58, 706–713. [Google Scholar] [CrossRef] [Green Version]
- Krišto, M.; Ivasic-Kos, M.; Pobar, M. Thermal Object Detection in Difficult Weather Conditions Using YOLO. IEEE Access 2020, 8, 25459–125476. [Google Scholar] [CrossRef]
- Portmann, J.; Lynen, S.; Chli, M.; Siegwart, R. People detection and tracking from aerial thermal views. In Proceedings of the 2014 IEEE International Conference on Robotics and Automation (ICRA), Hong Kong, China, 31 May–7 June 2014; pp. 1794–1800. [Google Scholar] [CrossRef] [Green Version]
- Lee, D.; Yeom, S. Tracking of Human Subjects with Infrared Imaging. In Proceedings of the 2018 Joint 10th International Conference on Soft Computing and Intelligent Systems (SCIS) and 19th International Symposium on Advanced Intelligent Systems (ISIS), Toyama, Japan, 5–8 December 2018. [Google Scholar]
- He, Y.-J.; Li, M.; Zhang, J.; Yao, J.-P. Infrared target tracking via weighted correlation filter. Infrared Phys.Technol. 2015, 73, 103–114. [Google Scholar] [CrossRef]
- Bar-Shalom, Y.; Li, X.R. Multitarget-Multisensor Tracking: Principles and Techniques; YBS Publishing: Storrs, CT, USA, 1995. [Google Scholar]
- Blom, H.A.P.; Bar-shalom, Y. The interacting multiple model algorithm for systems with Markovian switching coefficients. IEEE Trans. Autom.Control. 1988, 33, 780–783. [Google Scholar] [CrossRef]
- Yeom, S.; Kirubarajan, T.; Bar-Shalom, Y. Track segment association, fine-step IMM, and initialization with Doppler for improved track performance. IEEE Trans. Aerosp. Electron.Syst. 2004, 40, 293–309. [Google Scholar] [CrossRef]
- Yeom, S.; Nam, D.-H. Moving Vehicle Tracking with a Moving Drone Based on Track Association. Appl.Sci. 2021, 11, 4046. [Google Scholar] [CrossRef]
- Lee, M.-H.; Yeom, S. Detection and Tracking of Multiple Moving Vehicles with a UAV. Int. J. Fuzzy Log. Intell.Syst. 2018, 18, 182–189. [Google Scholar] [CrossRef] [Green Version]
- Yeom, S.; Cho, I.-J. Detection and tracking of moving pedestrians with a small unmanned aerial vehicle. Appl. Sci. 2019, 9, 3359. [Google Scholar] [CrossRef] [Green Version]
- Nam, D.; Yeom, S. Moving Vehicle Detection and Drone Velocity Estimation with a Moving Drone. Int. J. Fuzzy Log. Intell. Syst. 2020, 20, 43–51. [Google Scholar] [CrossRef]
- Nanjundan, S.; Sankaran, S.; Arjun, C.R.; Anand, G.P. Identifying the Number of Clusters for K-Means: A Hypersphere Density Based Approach. Available online: https://arxiv:abs/1912.00643 (accessed on 1 July 2021).
- Chiang, M.M.T.; Mirkin, B. Intelligent Choice of the Number of Clusters in K-Means Clustering: An Experimental Study with Different Cluster Spreads. J. Classif. 2010, 27, 3–40. [Google Scholar] [CrossRef] [Green Version]
- Pitas, I. Digital Image Processing Algorithms and Applications; John Wiley & Sons, Inc.: Hoboken, NJ, USA, 2000. [Google Scholar]
- Rosin, P. Measuring rectangularity. Mach. Vis. Appl. 1999, 11, 191–196. [Google Scholar] [CrossRef]
- Available online: https://www.flir.com/products/vue-pro-r (accessed on 1 July 2021).
Figure 1.
Block diagram of the object detection and tracking with multirotor thermal video.

Figure 2.
Illustration of the object imaging and basic rectangle.

Figure 3.
Block diagram of multiple target tracking.

Figure 4.
Sample frames of Video 1, (a) 50th frame; (b) 90th frame; (c) 150th frame.
Figure 4.
Sample frames of Video 1, (a) 50th frame; (b) 90th frame; (c) 150th frame.

Figure 5.
Sample frames of Video 2, (a) 1st frame; (b) 151st frame; (c) 301st frame.
Figure 5.
Sample frames of Video 2, (a) 1st frame; (b) 151st frame; (c) 301st frame.

Figure 6.
Sample frames of Video 3, (a) 6th frame; (b) 280th frame; (c) 406th frame.
Figure 6.
Sample frames of Video 3, (a) 6th frame; (b) 280th frame; (c) 406th frame.


Figure 8.
Video 1: object detection of Figure 4b, (a) k-means clustering; (b) morphological operation; (c) removing false alarms; (d) objects with centroids.

Figure 9.
Video 2: object detection of Figure 5b, (a) k-means clustering; (b) morphological operation; (c) removing false alarms; (d) objects with centroids.

Figure 10.
Video 3: object detection of Figure 6b, (a) k-means clustering; (b) morphological operation; (c) removing false alarms; (d) objects with centroids.

Figure 11.
Video 1: 800 detections including false alarms.
Figure 11.
Video 1: 800 detections including false alarms.

Figure 12.
Video 2: 912 detections including false alarms.
Figure 12.
Video 2: 912 detections including false alarms.

Figure 13.
Video 3: 3869 detections including false alarms; (a) without coordinate compensation, (b) with coordinate compensation.
Figure 13.
Video 3: 3869 detections including false alarms; (a) without coordinate compensation, (b) with coordinate compensation.

Figure 14.
Video 1, (a) 8 valid tracks; (b) ground truth of target position.
Figure 14.
Video 1, (a) 8 valid tracks; (b) ground truth of target position.

Figure 15.
Video 2, (a) 4 valid tracks; (b) ground truth of target position.
Figure 15.
Video 2, (a) 4 valid tracks; (b) ground truth of target position.

Figure 16.
Video 3, (a) 14 valid tracks without coordinate compensation, (b) 5 valid tracks with coordinate compensation.
Figure 16.
Video 3, (a) 14 valid tracks without coordinate compensation, (b) 5 valid tracks with coordinate compensation.

Figure 17.
Video 3: ground truth of target position, (a) without coordinate compensation; (b) with coordinate compensation.
Figure 17.
Video 3: ground truth of target position, (a) without coordinate compensation; (b) with coordinate compensation.


Table 1.
Video descriptions.
| Video 1 | Video 2 | Video 3 | |
|---|---|---|---|
| Altitude (m) | 30 | 45 | 100 |
| Illumination and climate | Winter night | Winter night | Summer day |
| Background | Pavement | Mountains | Parking lot |
| Pixel to space ratio (m/pixel) | 0.027 | 0.04 | 0.09 |
| Video length (s) | 40 | 30 | 50 |
| Actual frame rate (fps) | 6 | 10 | 10 |
| Actual frame number | 241 | 301 | 501 |
| Number of Targets | 8 | 3 | 2 |
Table 2.
Parameters for object detection.
| Parameters | Video 1 | Video 2 | Video 3 |
|---|---|---|---|
| Number of clusters (k) | 6 | 10 | 6 |
| Morphological operations (Structural Element Size) | Dilation (3 × 3) | Dilation (2 × 2) | Closing (2 × 2) |
| Min. Basic Rectangle (θmin) | 0.25 m2 (343) | 0.25 m2 (156) | 0.5 m2 (62) |
| Max. Basic Rectangle (θmax) | 1 m2 (1372) | 1 m2 (625) | 1.5 m2 (185) |
| Minimum Squareness | 0.25 | 0.25 | 0.25 |
| Minimum Rectangularity | 0.2 | 0.5 | 0.2 |
Table 3.
Detection results.
| Video 1 | Video 2 | Video 3 | |
|---|---|---|---|
| Number of correct detections | 540 | 829 | 685 |
| Average detection rate (%) | 91.4 | 91.8 | 79.8 |
| Number of false alarms | 260 | 83 | 3184 |
| False alarm rate (/frame) | 1.08 | 0.28 | 6.36 |
Table 4.
Parameters for target tracking.
| Video 1 | Video 2 | Video 3 | ||
|---|---|---|---|---|
| Sampling Time (s) | 0.167 | 0.1 | 0.1 | |
| Maximum target speed, Vmax (m/s) for initialization | 10 | 10 | 10 | |
| (m/s2) | Mode 1 | 10 | 10 | 10 |
| Mode 2 | - | - | 5 | |
| (m) | 0.5 | 0.5 | 1 | |
| Maximum taget speed, Smax (m/s) for measurment association | 10 | 10 | 10 | |
| for measurent association | 4 | 4 | 4 | |
| Minimum target speed, Smin (m/s) for track termination | 0.5 | 0 | 0.5 | |
| Maximum searching number for track termination | 10 | 10 | 15 | |
| Minimum track life length for a valid track | 10 | 10 | 10 | |
Table 5.
Video 1: tracking results.
Table 5.
Video 1: tracking results.
| Target 1 | Target 2 | Target 3 | Target 4 | Target 5 | Target 6 | Target 7 | Target 8 | Total/Average | |
|---|---|---|---|---|---|---|---|---|---|
| NTS | 1 | 1 | 1 | 1 | 1 | 1 | 1 | 1 | 8 |
| TTL (%) | 100 | 100 | 93.24 | 100 | 100 | 98.78 | 100 | 100 | 99.0 |
| Position (m) | 0.069 | 0.09 | 0.082 | 0.081 | 0.078 | 0.072 | 0.086 | 0.054 | 0.077 |
| Velocity (m/s) | 0.462 | 0.535 | 0.507 | 0.604 | 0.489 | 0.499 | 0.570 | 0.563 | 0.528 |
Table 6.
Video 2: tracking results.
Table 6.
Video 2: tracking results.
| Target 1 | Target 2 | Target 3 | False Target | Total/Average | |
|---|---|---|---|---|---|
| NTS | 1 | 1 | 1 | 1 | 4 |
| TTL (%) | 100 | 100 | 100 | - | 100 |
| Position (m) | 0.08 | 0.053 | 0.056 | - | 0.06 |
| Velocity (m/s) | 0.55 | 0.557 | 0.639 | - | 0.582 |
Table 7.
Video 3: tracking results without coordinate compensation.
Table 7.
Video 3: tracking results without coordinate compensation.
| Target 1 | Target 2 | False Target | Total/Average | |
|---|---|---|---|---|
| NTS | 1 | 3 | 10 | 14 |
| TTL (%) | 100 | 87.0 | - | 93.5 |
| Position (m) | 0.190 | 0.214 | - | 0.202 |
| Velocity (m/s) | 1.896 | 1.857 | - | 1.877 |
Table 8.
Video 3: tracking results with coordinate compensation.
Table 8.
Video 3: tracking results with coordinate compensation.
| Target 1 | Target 2 | False Target | Total/Average | |
|---|---|---|---|---|
| NTS | 1 | 3 | 1 | 5 |
| TTL (%) | 100 | 87.0 | - | 93.5 |
| Position (m) | 0.183 | 0.172 | - | 0.177 |
| Velocity (m/s) | 1.868 | 1.808 | - | 1.838 |
Publisher’s Note: MDPI stays neutral with regard to jurisdictional claims in published maps and institutional affiliations. |
© 2021 by the author. Licensee MDPI, Basel, Switzerland. This article is an open access article distributed under the terms and conditions of the Creative Commons Attribution (CC BY) license (https://creativecommons.org/licenses/by/4.0/).
Share and Cite
MDPI and ACS Style
Yeom, S. Moving People Tracking and False Track Removing with Infrared Thermal Imaging by a Multirotor. Drones 2021, 5, 65. https://0-doi-org.brum.beds.ac.uk/10.3390/drones5030065
AMA Style
Yeom S. Moving People Tracking and False Track Removing with Infrared Thermal Imaging by a Multirotor. Drones. 2021; 5(3):65. https://0-doi-org.brum.beds.ac.uk/10.3390/drones5030065
Chicago/Turabian StyleYeom, Seokwon. 2021. "Moving People Tracking and False Track Removing with Infrared Thermal Imaging by a Multirotor" Drones 5, no. 3: 65. https://0-doi-org.brum.beds.ac.uk/10.3390/drones5030065