Article

Revealing Archaeological Sites under Mediterranean Forest Canopy Using LiDAR: El Viandar Castle (husum) in El Hoyo (Belmez-Córdoba, Spain)

by
Antonio Monterroso-Checa
*,
Juan Carlos Moreno-Escribano
,
Massimo Gasparini
,
José Alejandro Conejo-Moreno
and
José Luis Domínguez-Jiménez
Patricia Unit for R&D in Cultural Heritage (HUM 882 Research Group), Universidad de Córdoba, Campus de Rabanales, N-IVa, Km. 396, Edificio C1, 14014 Córdoba, Spain
*
Author to whom correspondence should be addressed.
Submission received: 15 July 2021 / Revised: 30 July 2021 / Accepted: 31 July 2021 / Published: 3 August 2021

Abstract

:
Light detection and Ranging (LiDAR) technology is a valuable tool for archaeological prospection in areas covered by dense vegetation. Its capacity to penetrate dense forest environments enables it to detect archaeological remains scattered over orographically complex areas. LiDAR-derived digital terrain models (DTMs) have made an exceptional contribution towards identifying topographic landscapes of archaeological interest. In this study, we focus on an area of intense historic settlement from the Chalcolithic to the Middle Ages, which today is completely covered by Mediterranean forest. Due to the dense canopy, and the fact that it is a protected area on private land, it has never been analyzed. To reveal the settlement, we primarily used a series of LiDAR mapping surveys to gather data and analyzed other open access remote sensing resources from the National Geographic Institute of Spain (IGN). The IGN LiDAR data proved to be of particular interest. These resources enabled us to detect an ancient fortress (El Viandar Castle) and its surrounding settlement. LiDAR, in conjunction with other products, was fundamental in identifying the site. Equally, the mapping surveys enabled us to analyze the limits and scope of the IGN airborne LiDAR and other free access remote sensing products. Our background in this research demonstrates that low-cost products applied to LiDAR research in archaeology have major limitations when it is necessary to have a high level of spatial resolution in order to define the layout and the main components of an archaeological site.

1. Introduction

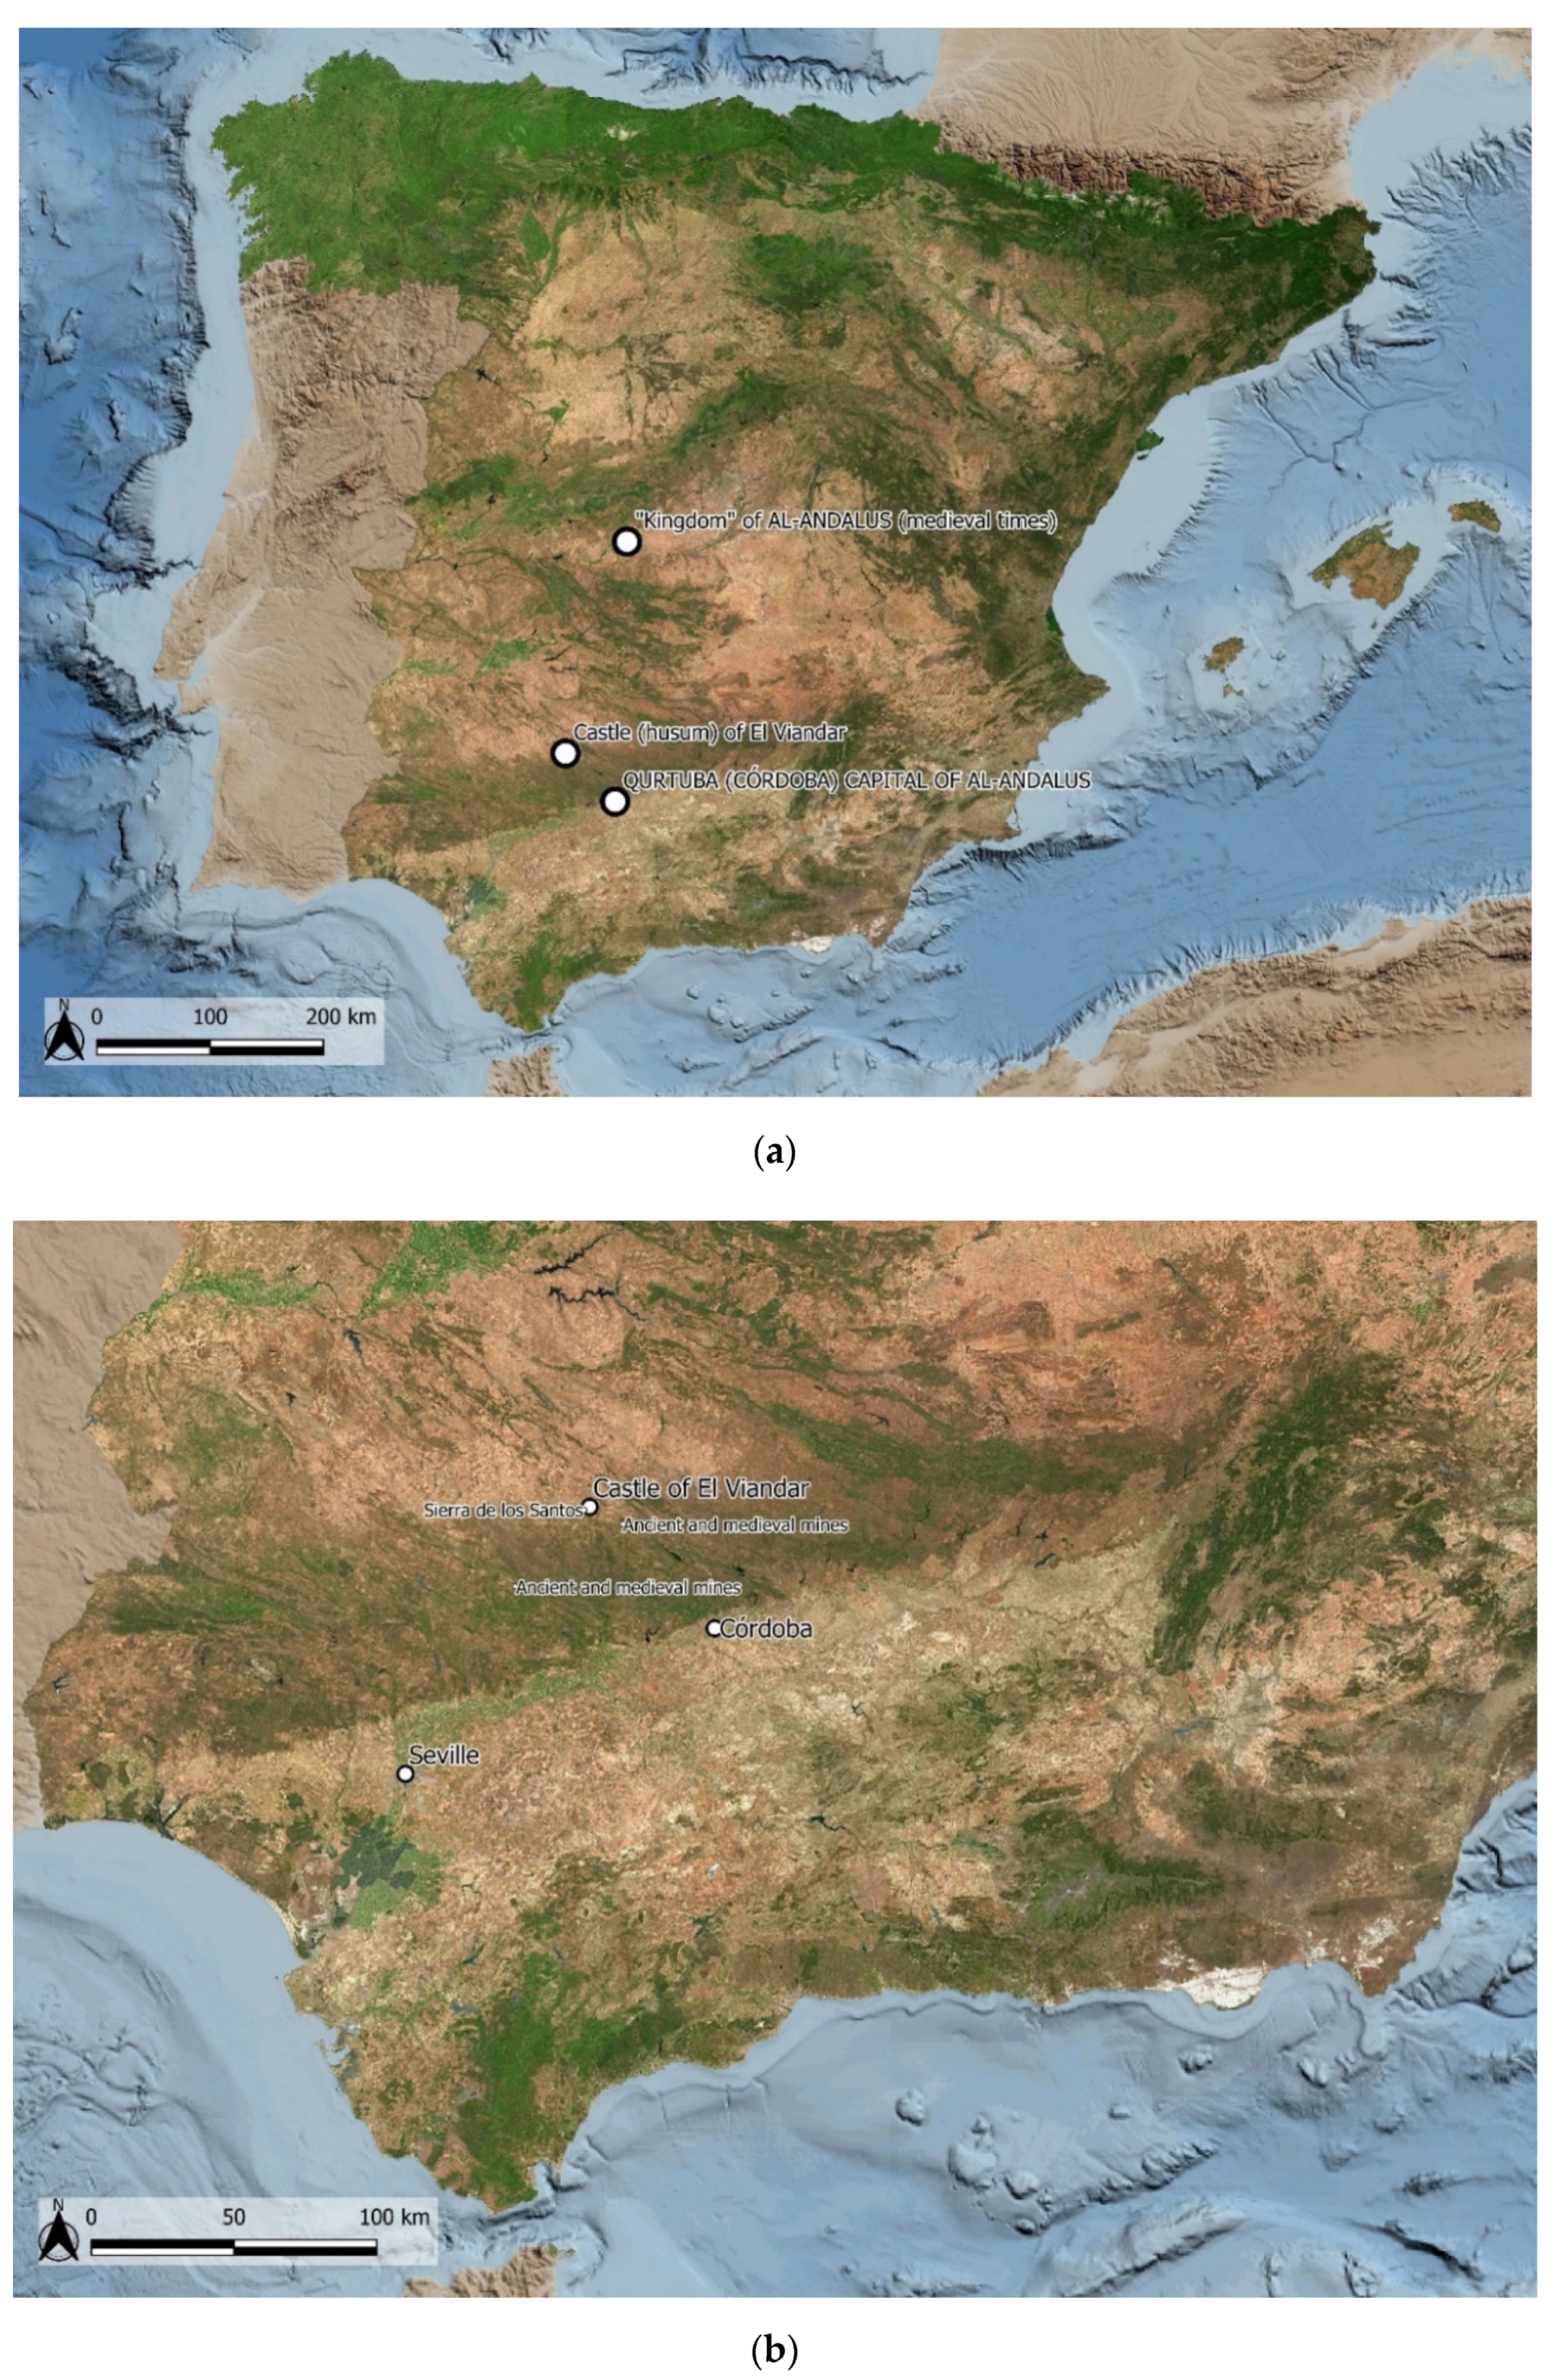
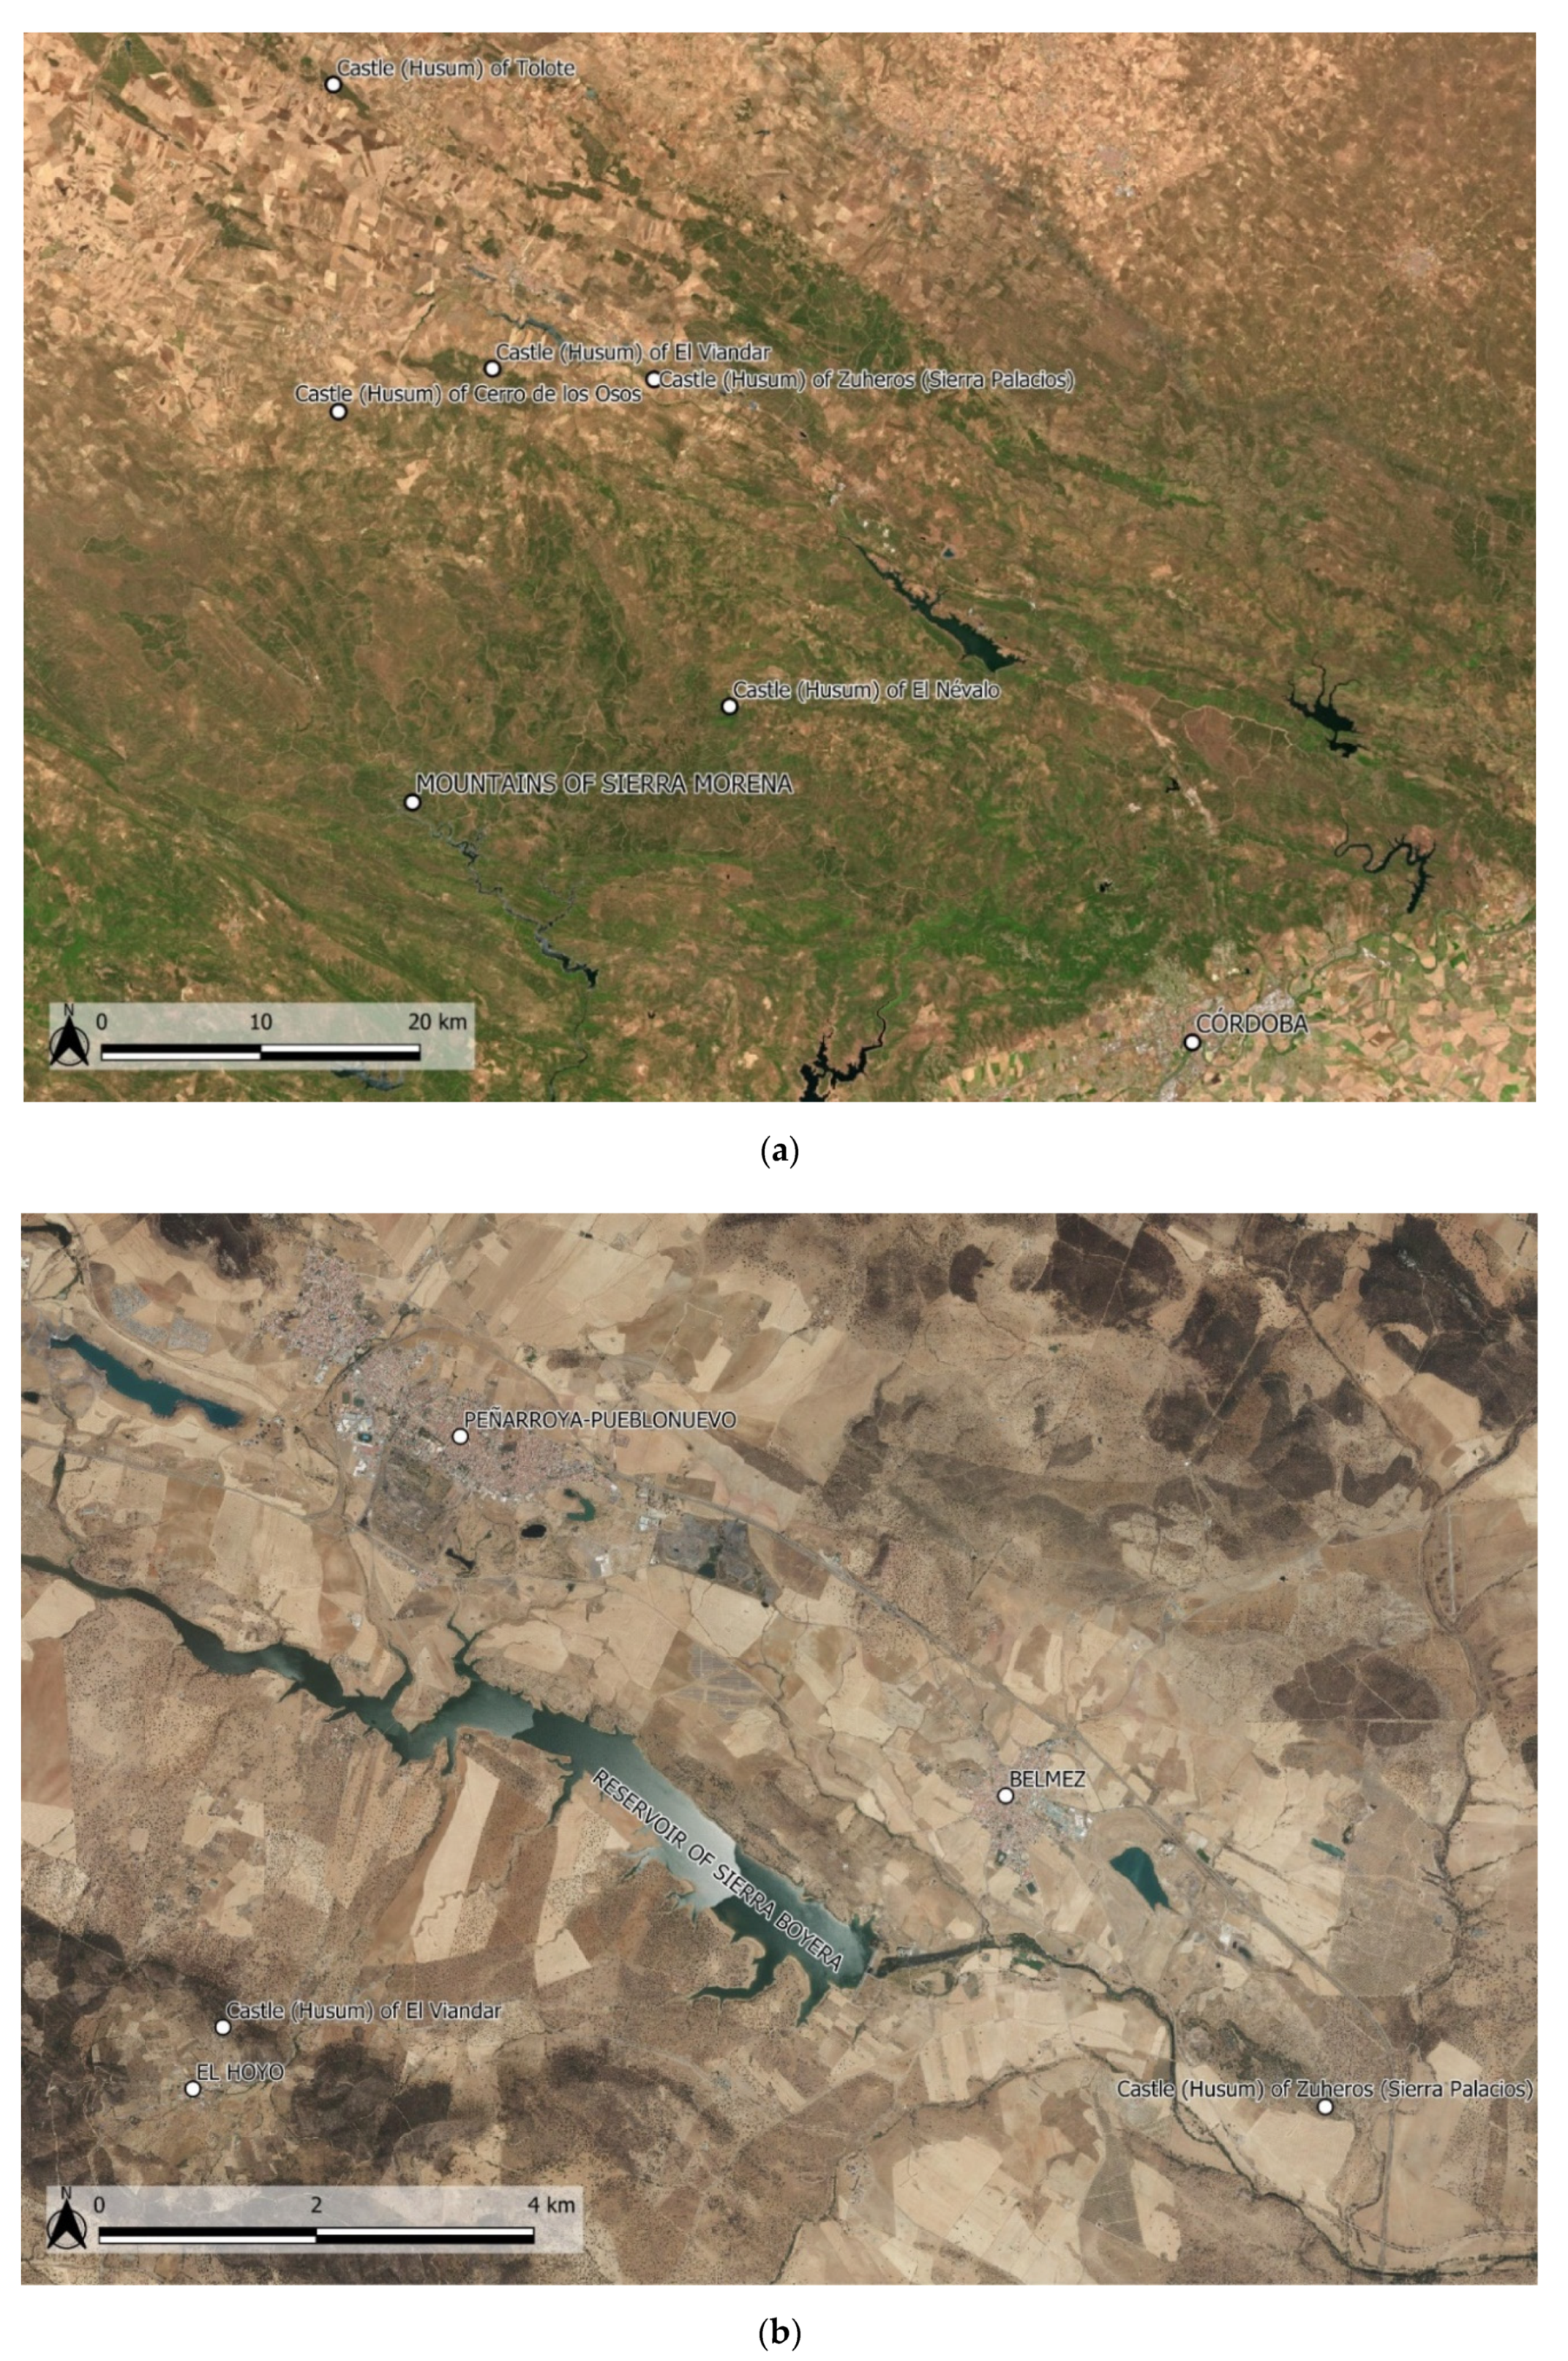
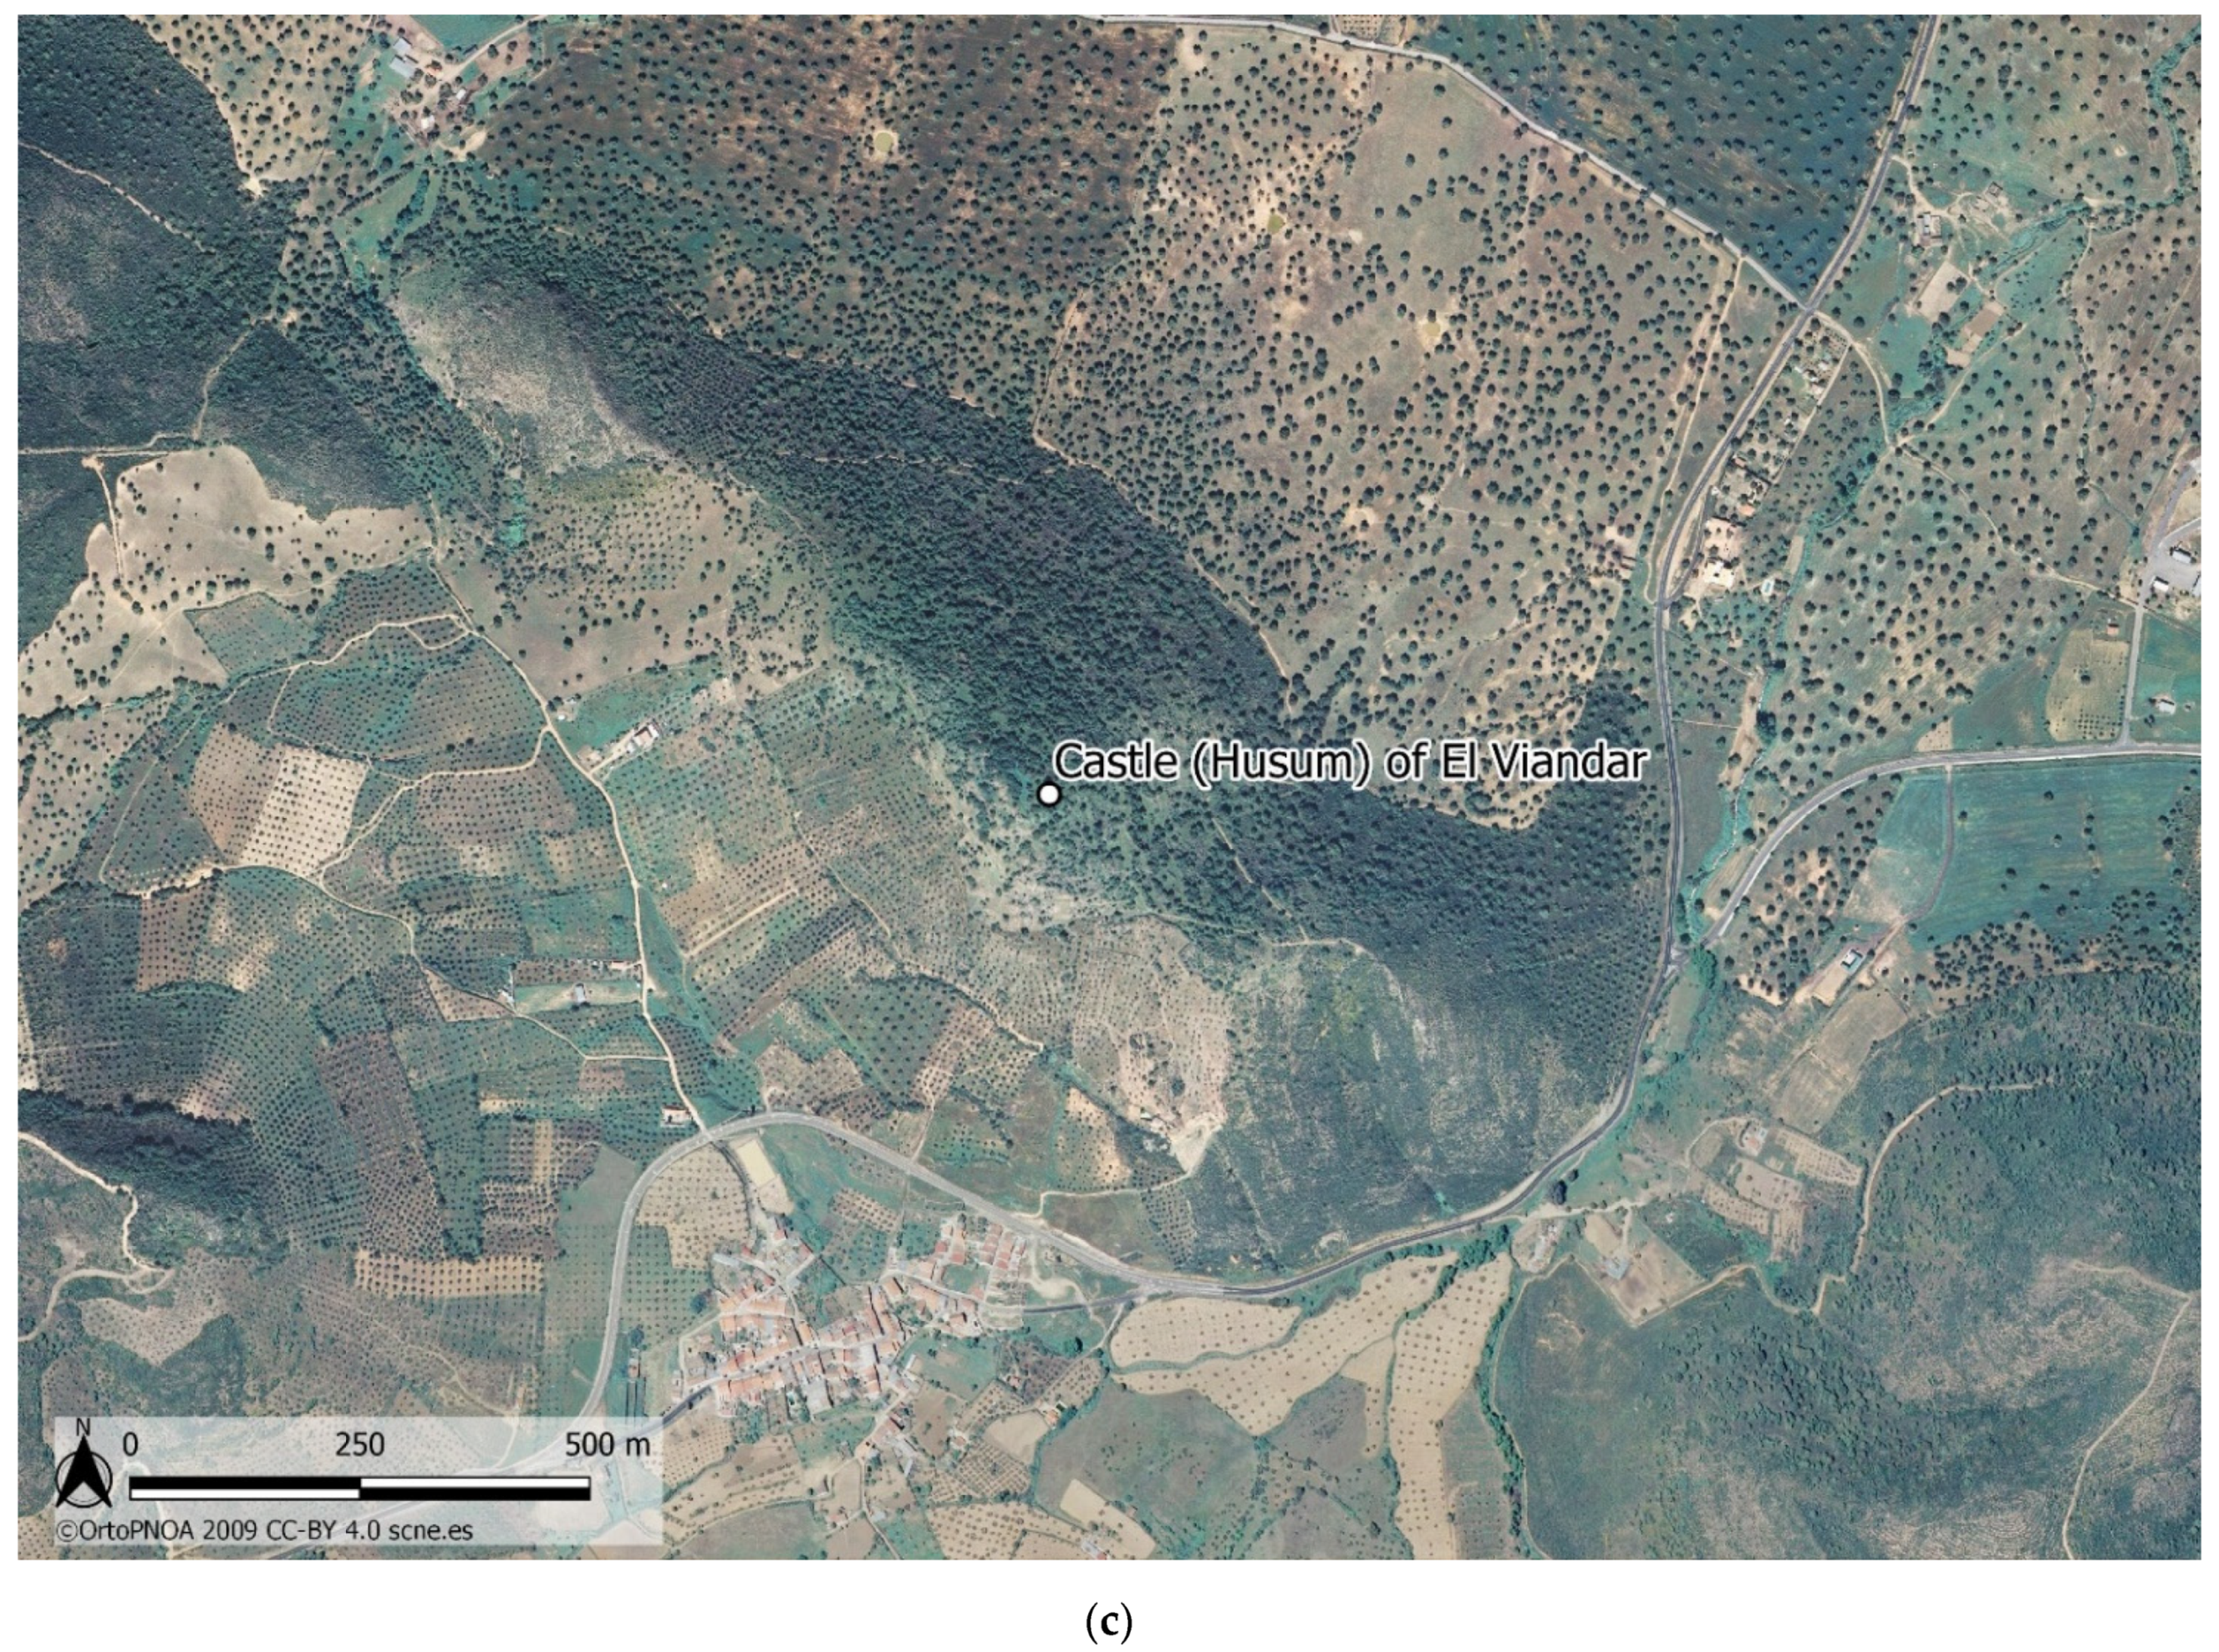
1.1. El Viandar Castle

The Andalusian fortification (husum) of El Viandar is located in the village of El Hoyo (in the district of Belmez, Córdoba, Spain) (Figure 1a,b). It is one of a group of fortified settlements (hisn) built on high ground distributed throughout the main geographical landmarks of the Guadiato Valley in Córdoba, Spain. These fortified settlements were designed to control and protect the surrounding territory, forming a network of fortifications that safeguarded the transport and communication links from Córdoba and the Guadalquivir Valley all the way to the Guadiana Valley separating Spain from Portugal.
Moreover, El Viandar Castle is located close to a natural mountain pass that leads to the heart of the Sierra de los Santos, the Sierra Norte area of Seville in the southwest, and Córdoba in the southeast. It controlled the transport and communication links to one of the richest areas of metalliferous deposits in Sierra Morena. It also defended and regulated the use of the area’s abundant natural resources such as forestry and hunting, among other coveted assets [1,2,3].
The geographic coordinates of El Viandar Castle are 38°15′7.24″ N–5°17′29.08″ W, in the central zone of the foothills of the Sierra de los Santos on a hill called Alto del Castillo at an altitude of 774 m. Although not the most pronounced elevation in the mountain range, higher peaks include Cerro Maleto and Cerro de la Atalaya, Alto del Castillo presents the most favorable characteristics for both the settlement and the castle. The location is also ideal for controlling one of the most important historic ford crossings on the Guadiato River, and connecting with other nearby hisn, such as Cerro de los Osos (Fuente Obejuna), Tolote (Los Blázquez), and Zuheros in Sierra Palacios (Belmez) (Figure 2a–c).
More precisely, El Viandar Castle sits on the plateau, the highest part of the hill, taking advantage of the rocky outcrops that populate the surrounding hills. The jagged rocks were used as construction material and foundations for buildings. The remains of many of those buildings can still be seen at the site today. In general, the stones are expertly cut, and the masonry well-executed, apparently without using mortar.
The fortress has been dated to the Caliphate of Córdoba period (eighth to ninth century) due to the skill and symmetry of the construction technique [4]. The material remains on the surface show signs that construction might have continued until the fourteenth century.
Although the name and location of El Viandar husum is well-known, from both archaeological remains and literary sources [5,6], a dense Mediterranean forest now hides almost the entire site from view. The fortress itself, as mentioned above, can still be analyzed as it is somewhat more devoid of vegetation. However, the settlement that was located around the castle is completely hidden by impenetrable Mediterranean forest.
El Viandar is one of the many settlements of its kind in the historic area of northern Córdoba that has never been analyzed. The thick Mediterranean forest impedes geophysical surveys and extensive archaeological excavations. Moreover, the site is on private land dedicated to grazing and hunting, which also hinders traditional archaeological activity.
To resolve these issues and ultimately reveal the complete remains of the fortress and settlement, we designed archaeological mapping surveys using LiDAR remote sensing technology. Using LiDAR in mountain environments that conceal archaeological remains has recently achieved considerable success in scientific circles in the field of archaeology. The combination of the LiDAR survey with other types of data sources, such as cartographic and toponymic studies, has proved to be fundamental in locating completely obscured archaeological sites.
In this study, we first combined the aforementioned data to determine the location and hypothetical organization of the fortified hilltop site. We then performed the LiDAR mapping surveys, and lastly, we analyzed the photogrammetric, cartographic, and LiDAR documentation held at the IGN of Spain. Naturally, we were particularly interested in the first complete LiDAR mapping survey of Spain, whose results we analyzed and compared to those of our own survey.
This enabled us to pinpoint the exact location of the El Viandar husum. Second, the mapping surveys made it possible to recover almost the entire dimension of the site as well as its internal organization. This provided us with excellent data with which to plan future archaeological excavations that will enable us to discover the site’s specific chronological and cultural sequence.

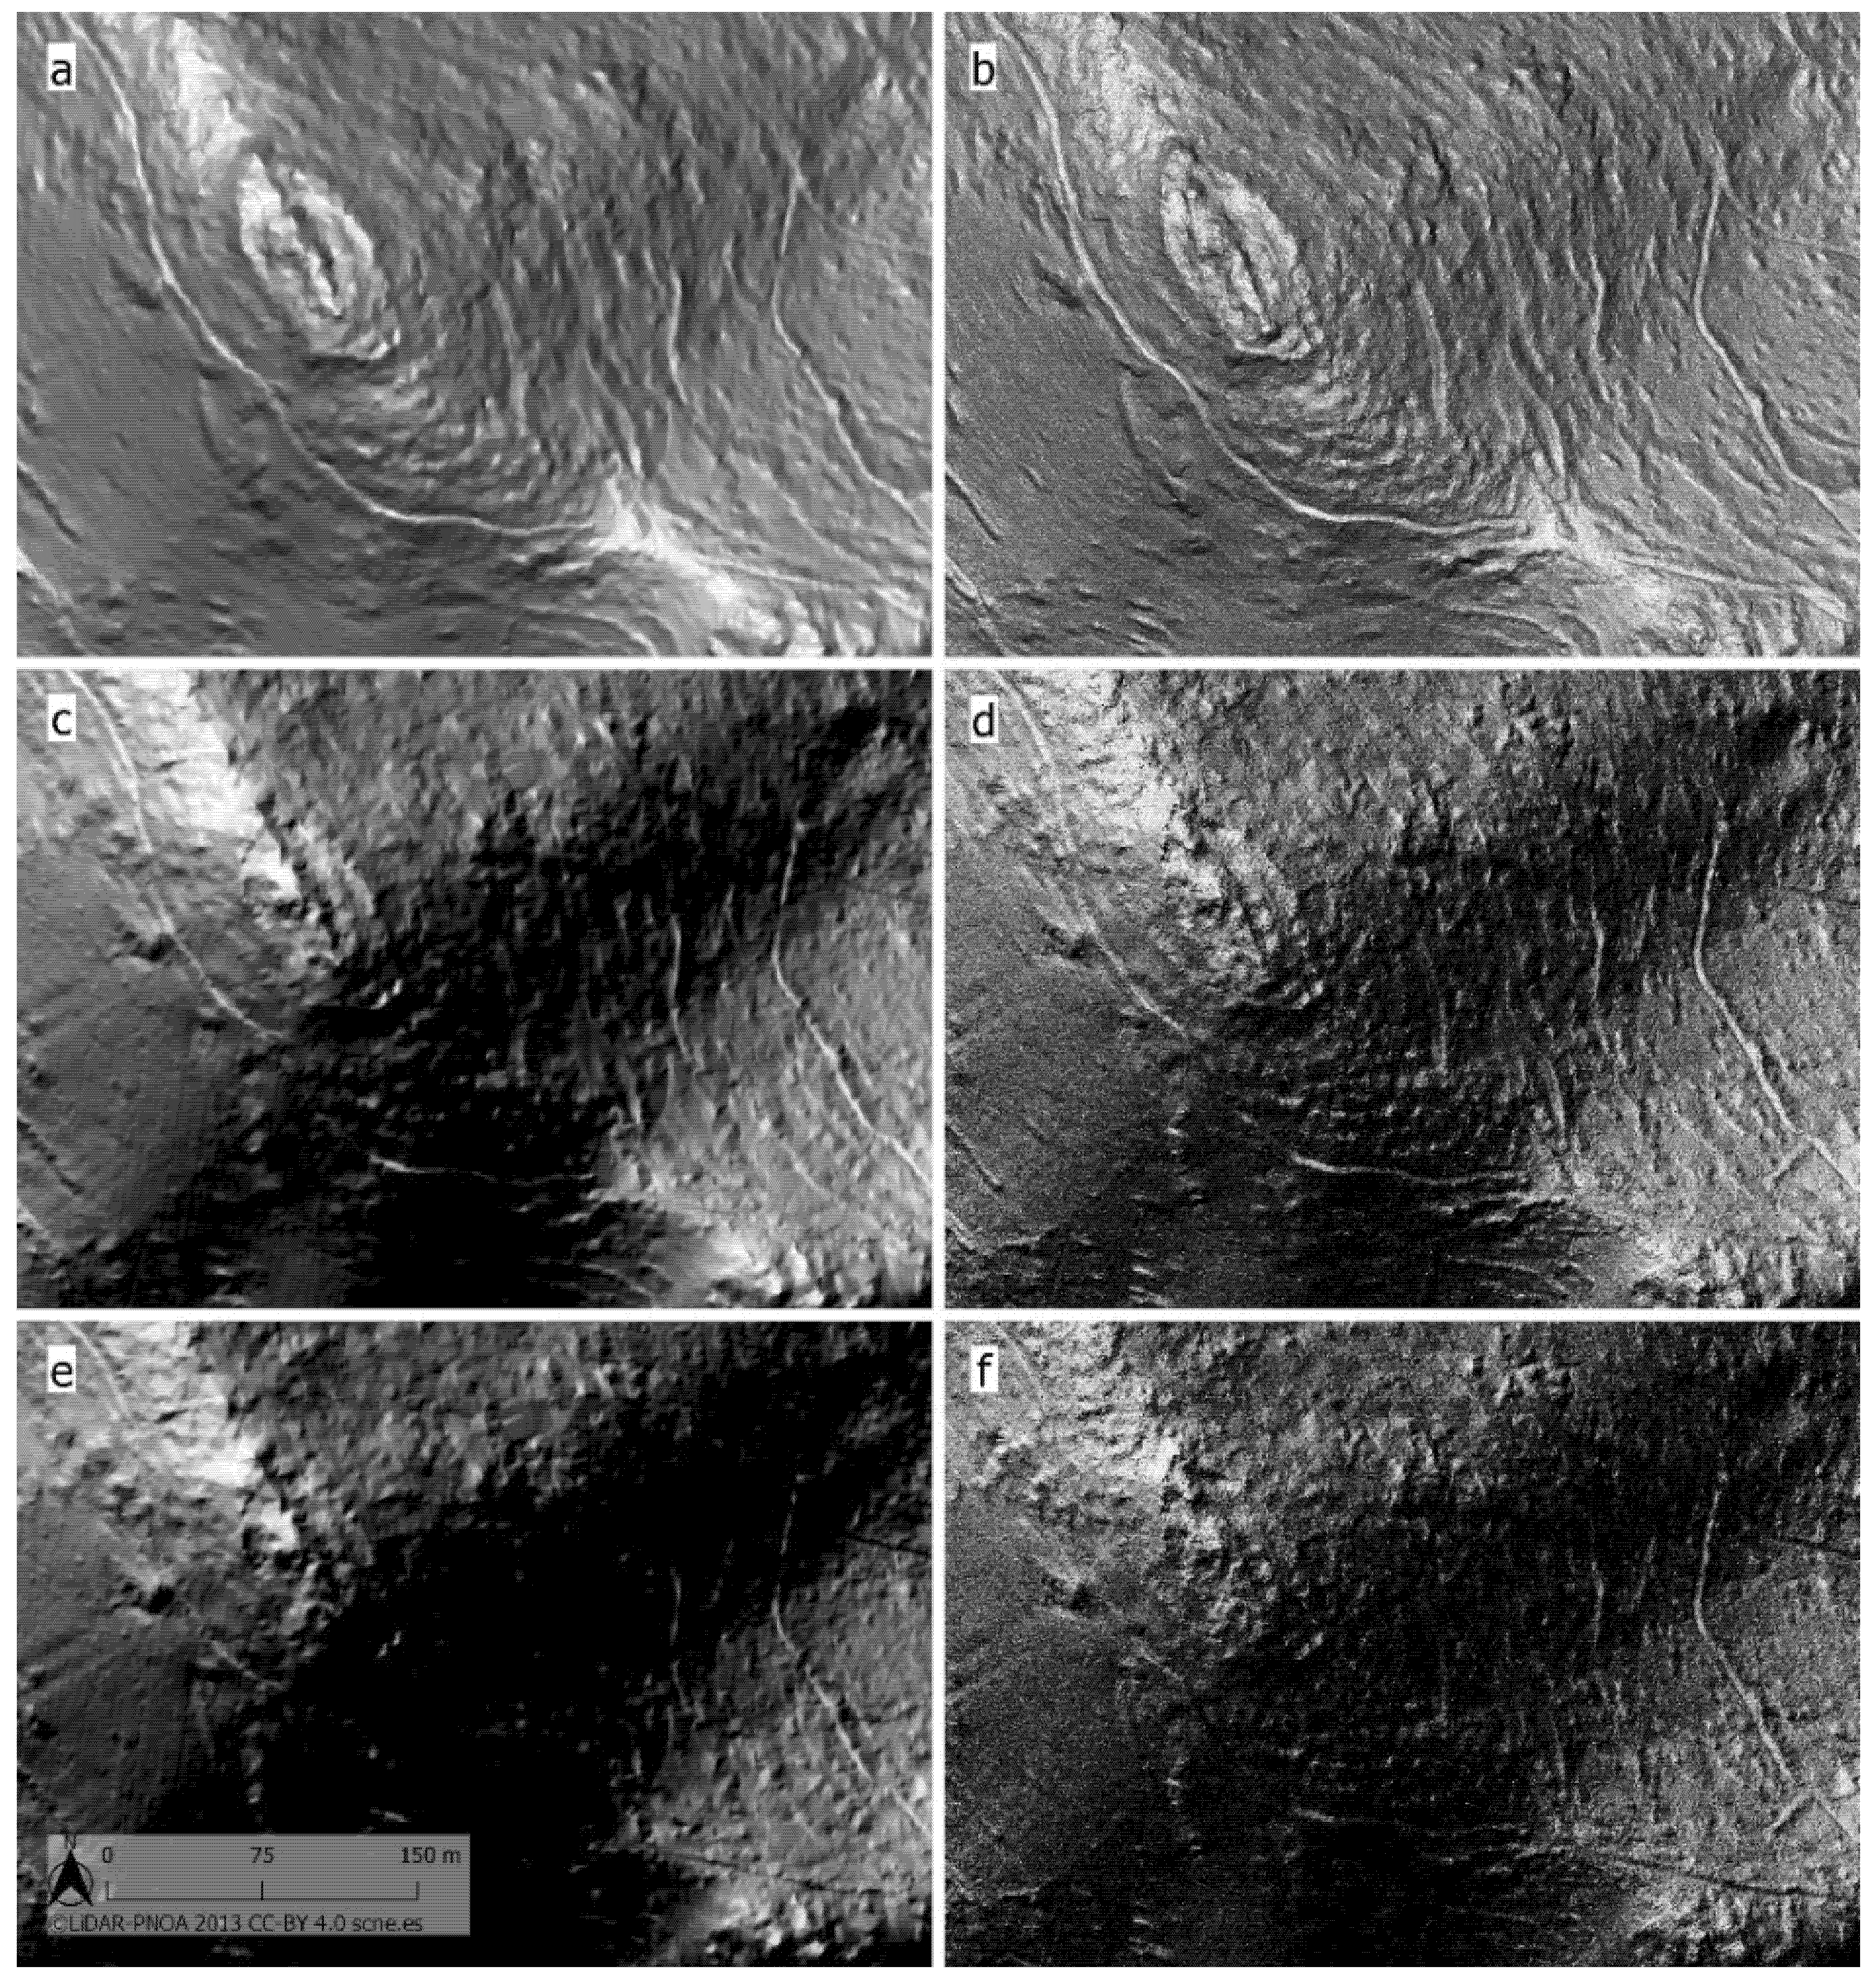
1.2. LiDAR, a Tool Tailored to the Inaccessibility of the Terrain

As a development of Geographic Information Technologies (GIT), LiDAR has shown great potential in the field of archaeology [7] (p. 1). The use of LiDAR is becoming increasingly more frequent in archaeological research, with technical advances in the field [8,9,10,11,12]. This non-invasive method facilitates archaeological surveys of sites that would not have been possible by means of a geophysical survey or aerial photography [13] (p. 27). As an example, it is worth mentioning the LiDAR mapping of one of the world’s most spectacular landmarks, Angkor Wat (Cambodia), that revealed the existence of roads, walls, and canals, giving rise to the analysis of an entire urban network [14] (pp. 12595–12596) [15] (pp. 22, 34) and serving as a basis for the approach of future research [16]. Similar surveys have been performed in Central and South America, as in the case of Kuelap (Perú), where a multifunctional complex was discovered next to a fortress [17,18] (p. 12). Moreover, the use of LiDAR in Mayan areas facilitated the analysis of the relationship between environmental, cultural, and archaeological variables, which enabled researchers to deduce factors such as population density [19] (p. 17).
There is currently a multitude of research being performed in Europe that uses LiDAR. For example, in Norway, LiDAR has been implemented (in some cases even working with the use of semi-automatic detection techniques, thanks to the use of CultSearcher software) in arctic and subarctic areas with excellent results; a total of 1186 pieces of archaeological evidence has been discovered so far [20] (p. 17). In the Istrian Peninsula, both in Croatia and Slovenia, hillforts dating from the Bronze and Iron Ages have been found [21] (p. 6) [22] (pp. 4–12). Other examples are the LiDAR surveys performed in France in the Forest of Tronçais and the Garonne Valley. In the former, by using this technology, the difficulties posed by the forest canopy were overcome, leading to the discovery and verification of a large amount of archaeological evidence, from a Gallo–Roman settlement to roads and quarry faces, which has rewritten the area’s history [23] (pp. 14, 19). A similar study was performed in Garonne, but with a major difference: instead of using a more expensive mode of transport, LiDAR was carried by a drone, which increases its economic accessibility. In the Forest of Agre, Gallo–Roman structures, a potential fortified medieval enclosure, and a medieval church were found [24] (pp. 3–14). In Colophon, Anatolia (modern-day Turkey), LiDAR was used to locate and map the wooded hills around the town, providing rich and detailed data of the terrain [25] (pp. 316, 331). In Great Britain, LiDAR was used to support the study of an area in Nottinghamshire occupied during the Upper Paleolithic [26]. And lastly, it was used in Italy to identify micro-topologies relating to the urban fabric of a medieval settlement in Monte Serico and to study the Forest of Incoronata (Apulia) [27], the medieval fortified area of Torre di Cisterna (Melfi) [28], and the fortified settlements of Montagna di Gildone (Molise) [29] (pp. 1–9).
In the case of Spain, the impact of LiDAR is linked to the open transfer of data from IGN in 2015, which has published approximately 59 studies using LiDAR data from 2011 to the present day. The research performed in the northwestern area of the Iberian Peninsula, focusing on the study of megaliths and Roman structures, constitutes one of the most important archives to date due to the volume of data gathered [30]. In Andalusia, several studies have been performed, such as the discovery of the Roman amphitheater of Torreparedones [31], the Roman Corduba to Emerita Road passing through Puente Nuevo [32], the geomorphological analysis of Córdoba capital city [33], and the topographic investigation to eliminate Sancti Petri, in Cádiz, as a Temple of Melqart [34].

2. Materials and Methods

2.1. Data and Software

To achieve the objective of this study, we generated two datasets from different surveys. On the one hand, we used data from the National Aerial Orthophotography Project-LiDAR (PNOA-LiDAR) held at the IGN, and on the other, we used our own data acquired and generated by an unmanned aerial vehicle (UAV) with a built-in LiDAR sensor.
The PNOA-LiDAR dataset is freely available and can be obtained from the IGN download service.
The geographic products acquired from IGN sources include:
  • LiDAR first complete mapping of Spain (2008–2015);
    LAS point cloud;
    Density 0.5 points/m2;
    RMSE H 0.40: m; Planimetric accuracy: 0.30 m;
    Perpendicular field of vision (FoV): 50°;
    Frequency 45 kHz; Maximum range 3000 m;
For our survey, the instrumentation for the UAV dataset is as follows:
  • VANT DJI Matrice 600 Pro;
  • Velodyne VLP-16/32 Lidar sensor and an Applanix AP-15 GNSS/INS system;
  • Sony A6000 camera to capture RGB data;
The characteristics of the UAV dataset are:
  • LAS point cloud;
  • Density 50 points/m2;
  • Perpendicular field of vision (FoV): 50°;
  • Flight altitude: 80 m;
Data management was performed using QGIS software together with the LAStools point cloud management library. All analysis and auxiliary operations were performed using QGIS. The initial data and the derived geographic products were organized and visualized by means of a Geographic Information System (GIS) mapping system managed using QGIS.
The datasets and derived geographic data are georeferenced in the ETRS89 projected coordinate system in UTM zone 30. Orthometric height was used to measure altitude.

2.2. Methodology

The remote sensing analysis consisted of visualizing geographic features that may present anomalies formed by the micro-topographic characteristics of terrain that present unnatural geometric forms. Fundamentally, such anomalies are changes in slopes that are evidence of human intervention in the landscape. The geometry of the anomalies detected is regular and primarily consists of circumferential arcs, right angles, and circular, elliptical, and rectangular polygons. To highlight the micro-topology of the terrain, we used slope maps and shadow mapping, which enhance archaeological remote sensing.
The study is based on the data from two LAS point clouds used to generate DTMs using LiDAR ground returns from open ground, classified within the “Class 2” category according to the codes defined by the American Society for Photogrammetry and Remote Sensing (ASPRS) for LAS data [35]. All the geographic data used for the remote sensing analysis comprised products derived from these input data, with the exception of auxiliary geographic data from the IGN, such as orthophotographs and vector mapping. The input data were converted into DTMs in raster format to enhance visualization.
The geographic data produced consisted of slope maps and three shadow maps (Figure 3 and Figure 4) for each dataset. The shadow maps were produced with identical parameters, the purpose being to try to be objective as possible to ensure both datasets had the same visualization characteristics, thus leaving no room for subjectivity in the observation of the remote sensing data. The following parameters were chosen: vertical exaggeration factor Z of 4; solar azimuth angle of 320°; solar tilt angle of 80° (Figure 3a,b), 45° (Figure 3c,d), and 20° (Figure 3e,f), different solar tilt angles for each shadow map.
A GIS was created using the geographic data to analyze the remote sensing mapping (Figure 5a,b). Several remote sensing technicians have visualized the GIS created in search of human geographic anomalies. Having several opinions mitigates human subjectivity and eliminates those anomalies not unanimously accepted.
In addition to the data produced, we also included the most recent orthophotographs and any other data that might help to corroborate the anomalies detected. As a result, the analysis contained abundant data, which facilitated an enhanced perception of the study area (Figure 6).

3. Results

Figure 6 shows the study area as a large mountainous region covered by Mediterranean forest vegetation. The only human activity observed in the orthophotography are crops and olive groves, with their respective boundaries in the south and west of the image. The absence of large-scale constructions indicates that the anomalies detected do not belong to contemporary constructions and could be archeological remains, which was verified by an inspection of the site.
The different anomalies detected were divided into obvious anomalies that belonged to structures that comprise El Viandar Castle (Figure 7 and Figure 8) and anomalies that were more difficult to interpret that might belong to the settlement or village that was located around the castle.
The human factor in remote sensing analysis has a huge impact, given that the individualization of anomalies depends on the researcher’s ability to recognize and interpret data. To mitigate the human factor and be as objective as possible, we focused most of the study on the dataset of anomalies of the castle ruins, which enabled us to design protocolized and secure analysis parameters. The second set of anomalies, relating to the settlement around the castle, presented sufficiently clear evidence to warrant a future archeological survey using geophysical methods for a more precise definition.
Analysis of the first anomaly dataset (Figure 8) provided us with very significant archaeological data. On a smaller scale, details were observed in the UAV dataset that was not visible in the PNOA-LiDAR dataset. The most characteristic feature is the entrance to the walled enclosure of the castle (Figure 8, in red) to the southeast of the building. Outside the castle, the road ends in a 27 × 26 m plain that might belong to a room attached to the castle (Figure 8, in magenta). This anomaly is visible in the slope map (Figure 9).
In both datasets, the walled enclosure seen surrounding other structures in its interior was detected. The common structures detected are the keep (Figure 6, in green) and an anomaly extending from north to south (Figure 6, in teal). In the UAV data, two circular towers of approximately 8 m each were also detected (Figure 8, in orange).
The second dataset of anomalies (Figure 5; in yellow) are more complicated to identify. Some present a geometry that is not especially well defined by the micro-topology (Figure 10b). Others present a clearly defined geometry and a spatial distribution close to the castle (Figure 11b). Finally, there are also anomalies that evidence some kind of structure relating to the settlement around the castle (Figure 12b). A formal approach using other methodologies and techniques is needed to gather additional archaeological data to better define the archaeological anomalies detected.
In Figure 10, Figure 11 and Figure 12, it can be observed that the anomalies detected in the UAV dataset have greater definition with respect to the PNOA-LiDAR data (Figure 12b). The importance of using UAV-LiDAR to deepen the analysis of this type of anomaly cannot be stressed enough. The anomalies might belong to residential areas given that they were relatively easy to locate. However, other techniques might be able to enhance their definition.

4. Discussion

Low-cost products applied to LiDAR research in archaeology have major limitations when it is necessary to have a high level of spatial resolution in order to define the layout and the main components of an archaeological site. Public and free access products, as is the case of IGN products, have helped to discover and preserve a huge number of unrevealed archaeological sites. Without these acquisitions and data processing, we would not have been able to carry out socialization heritage activities, researches, or excavations. However, in the case of LiDAR, as we tried to demonstrate here, it is necessary to develop an acquisition that rise up 50 p.m2 to define an archaeological site with accuracy. The 0.5 p.m2 of the IGN-PNOA acquisitions serve to discover or situate an archaeological site; but it is very difficult to know the full organization of a site with the low spatial resolutions of the Pnoa products. Low-cost applications have then their limitations. Only funded research projects, or research teams owning a LidAR sensor, can achieve this level of research.
Logically, LiDAR data with a higher density per m2 provides more detailed information [36]. In the case of Spain, IGN data provide excellent archaeological information via an approach that has shown to be very successful in recent years [31,32]. Internationally, the potential of LiDAR technology as a useful tool in archaeological prospection has also been highlighted [37]. In this study, on the whole, the surveys performed using LiDAR tend to have a similar point density to the PNOA-LiDAR data (0.5 p/m2).
As regards El Viandar Castle, PNOA-LiDAR data helped to determine its exact location, main structures, dimensions, areas, and three-dimensional coordinates (X,Y,H). However, the data were not able to provide clear information about the structural definition and, in particular, about the exact location and organization of the settlement around the castle.
The fundamental conclusion of this study is evident: open-access products only facilitate the first stage of archaeological prospection, which consists of detecting and discovering new archaeological sites. Given the low spatial resolution such products provide, this study shows that a second stage using LiDAR mapping surveys is needed to determine the structure of sites with greater precision, which we achieved using the LiDAR surveys we performed.
Identifying structures using LiDAR enabled us to distinguish the archaeological structure of the castle in situ and ensure that the anomalies we analyzed were indeed archaeological remains (Figure 13a,b). In fact, once the anomalies were confirmed, we performed a cursory reconnaissance of the hilltop where the castle is located. We were able to identify and verify exactly what type of structures we were dealing with. This provided us with a more solid guarantee that our interpretation of the anomalies was correct. The most important aspect is that we were able to confirm which structures are visible and which are still buried, having traced them through the DTMs derived from the LiDAR mapping surveys.
However, our knowledge of the site’s entire geography is still incomplete. There are parts of the castle and settlement that LiDAR, due to its very nature, has not been able to reveal. Therefore, a third stage in the analysis focusing on a geophysical survey would still be required at a later stage. LiDAR cannot detect structures that are buried underground and do not present micro-topological elements; such features can only be detected by geophysical surveys. Notwithstanding, it is important to note that LiDAR can provide us with a very good idea of location and dimensions for future geophysical surveys: something that was not possible before the introduction of LiDAR. The working basis provided by this combined and predictive methodology is undoubtedly one of the most important methodological conclusions from our surveys.
The last stage in this protocol of actions would obviously be the archaeological excavation itself. The analysis of El Viandar Castle using LiDAR enabled us to identify areas of special interest that warrant an archaeological excavation that could confirm chronological and cultural questions. LiDAR enables archaeologists to pinpoint with precision exactly where to dig.
In this case study, the high-density dataset acquired from PNOA-LiDAR provided a large amount of geospatial data. This, together with our own surveys, enabled us to obtain a more detailed geometry of the topographic surface of El Viandar Castle and its surroundings by providing small-scale data of structures belonging to the castle. This additional data will undoubtedly help in the decision-making and planning of future interventions at the site.

Author Contributions

Conceptualization, A.M.-C. and J.A.C.-M.; methodology, J.C.M.-E. and M.G.; software, J.C.M.-E.; validation, J.C.M.-E., M.G., and A.M.-C.; formal analysis, J.C.M.-E.; investigation, A.M.-C., J.A.C.-M., and J.L.D.-J.; resources, A.M.-C. and J.A.C.-M.; data curation, J.C.M.-E., A.M.-C.; writing—original draft preparation, J.C.M.-E., A.M.-C., and J.L.D.-J.; writing—review and editing, J.C.M.-E. and A.M.-C.; visualization, J.C.M.-E. and A.M.-C.; supervision, A.M.-C.; project administration, A.M.-C.; funding acquisition, A.M.-C. All authors have read and agreed to the published version of the manuscript.

Funding

This research was funded by the Regional Government of Andalusia R&D&I Program “Programa Operativo FEDER Andalucía 2014–2020” through the project titled Métodos de teledetección y de mínima invasión para la revalorización de los paisajes arqueológicos y la cultura material de ámbito rural en la provincia de Córdoba (SensingAqueoRuralCó), grant number UCO-FEDER 2018 1265775-F. The APC was funded by Drones-MDPI.

Institutional Review Board Statement

Not applicable.

Informed Consent Statement

Not applicable.

Data Availability Statement

PNOA-Lidar data from National Geographic Institute of Spain could be found here: https://centrodedescargas.cnig.es/CentroDescargas/index.jsp (accessed on 1 July 2021).

Acknowledgments

The authors would like to thank Drones-MDPI for the invitation to join this S.I. and Karen T. Neilson for the translation into English.

Conflicts of Interest

The authors declare no conflict of interest.

References

  1. López Ontiveros, A.; Valle Buenestado, B.; García Verdugo, F.R. Caza y paisaje geográfico en las tierras béticas según el Libro de la Montería. In Andalucía Entre Oriente y Occidente (1236–1492), Actas del V Coloquio Internacional de Historia Medieval de Andalucía; Cabrera, E., Ed.; Diputación de Córdoba: Córdoba, Spain, 1988; pp. 281–308. [Google Scholar]
  2. Montoya Ramírez, M.I. Libro de la Montería de Alfonso XI; Universidad de Granada: Granada, Spain, 1992. [Google Scholar]
  3. De La Llave, R.C. Comunicaciones, transportes y albergues en el Reino de Córdoba a fines de la edad media. Historia. Instituciones. Doc. 1995, 22, 87–118. [Google Scholar]
  4. De La Llave, R.C. La fortificación de hábitats en altura almohades. La Comarca del Alto Guadiato (Povincia de Córdoba) en los siglos XII–XIII. In Actas del IV Curso de Cultura Medieval. Seminario: La fortificación medieval en la Península Ibérica; Huerta Huerta, P.L., Ed.; Fundación Santa María la Real, Centro de Estudios del Románico: Aguilar de Campoo, Spain, 2001; pp. 189–200. [Google Scholar]
  5. Blázquez, Y.; Delgado Aguilera, A. Descripción de España por Abu-Abd-Allá Mohamed al-Edrisi. In Idrisi, Geografía de España; Anubar: Valencia, Spain, 1974; pp. 153–216. [Google Scholar]
  6. Saavedra, E. La geografía de España del Edrisi. In Geografía de España de Idrisi; Ubieto Arteta, A., Ed.; Anubar: Valencia, Spain, 1974; pp. 67–152. [Google Scholar]
  7. Crutchley, S.; Crow, P. Using Airborne Lidar in Archaeological Survey: The Light Fantastic; Historic England: Swindon, UK, 2018; pp. 1–94. [Google Scholar]
  8. Štular, B.; Lozić, E.; Eichert, S. Airborne LiDAR-Derived Digital Elevation Model for Archaeology. Remote Sens. 2021, 13, 1855. [Google Scholar] [CrossRef]
  9. Gomes Pereira, L.; Fernández, P.; Mourato, S.; Matos, J.; Mayer, C.; Marques, F. Quality Control of Outsourced LiDAR Data Acquired with a UAV: A Case Study. Remote Sens. 2021, 13, 419. [Google Scholar] [CrossRef]
  10. Magnini, L.; Bettineschi, C. Object-Based Predictive Modeling (OBPM) for Archaeology: Finding Control Places in Mountainous Environments. Remote Sens. 2021, 13, 1197. [Google Scholar] [CrossRef]
  11. Koutsoudis, A. Multispectral aerial imagery-based 3D digitisation, segmentation and annotation of large scale urban areas of significant cultural value. J. Cult. Herit. 2021, 49, 1–9. [Google Scholar] [CrossRef]
  12. Can, G.; Mantegazza, D.; Abbate, G.; Chappuis, S.; Giusti, A. Semantic segmentation on Swiss3DCities: A benchmark study on aerial photogrammetric 3D pointcloud dataset. Pattern Recognit. Lett. 2021. [Google Scholar] [CrossRef]
  13. De Feo, M.E.; Gobbo, J.D.; Moralejo, R.A. Hacer arqueología desde las alturas. Museo 2013, 26, 23–30. [Google Scholar]
  14. Evans, D.H.; Fletcher, R.J.; Pottier, C.; Chevance, J.B.; Soutif, D.; Tan, B.S.; Imd, S.; Ead, D.; Tind, T.; Kimd, S.; et al. Uncovering archaeological landscapes at Angkor using lidar. Proc. Natl. Acad. Sci. USA 2013, 110, 12595–12600. [Google Scholar] [CrossRef] [Green Version]
  15. Shimoda, I.; Haraguchi, T.; Chiba, T.; Shimoda, M. The Advanced Hydraulic City Structure of the Royal City of Angkor Thom and Vicinity Revealed through a High-Resolution Red Relief Image Map. Archaeol. Discov. 2016, 4, 22–36. [Google Scholar] [CrossRef] [Green Version]
  16. Stark, M.; Evans, D.; Rachna, C.; Piphal, H.; Carter, A. Residential patterning at Angkor Wat. Antiquity 2015, 89, 1439–1455. [Google Scholar] [CrossRef]
  17. VanValkenburgh, P.; Cushman, K.C.; Castillo Butters, L.J.; Rojas Vega, C.; Roberts, C.; Kepler, C.; Kellner, J. Lasers Without Lost Cities: Using Drone Lidar to Capture Architectural Complexity at Kuelap Amazonas, Peru. J. Field Archaeol. 2020, 45, 75–88. [Google Scholar] [CrossRef] [Green Version]
  18. Righetti, G.; Serafini, S.; Brondi Rueda, F.; Church, W.; Garnero, G. Sotto le Nuvole, sotto la Foresta: Applicazioni Tecnologiche Lidar e di Intelligenza Artificiale per Nuove prospettive nel Sito monumentale di Kuelap—Perú. Archeomatica 2020, 11, 6–13. [Google Scholar] [CrossRef]
  19. Schroder, W.; Murtha, T.; Golden, C.; Hernández, A.A.; Scherer, A.; Morell-Hart, S.; Almeida Zambrano, A.; Broadbent, E.; Brown, M. The lowland Maya settlement landscape: Environmental LiDAR and ecology. J. Archaeol. Sci. Rep. 2020, 33, 1–22. [Google Scholar] [CrossRef]
  20. Thuestad, A.E.; Risbøl, O.; Kleppe, J.I.; Barlindhaug, S.; Myrvoll, E.R. Archaeological Surveying of Subarctic and Arctic Landscapes: Comparing the Performance of Airborne Laser Scanning and Remote Sensing Image Data. Sustainability 2021, 13, 1917. [Google Scholar] [CrossRef]
  21. Bernardini, F.; Vinci, G. Archaeological landscape in central northern Istria (Croatia) revealed by airborne LiDAR: From prehistoric sites to Roman centuriation. Archaeol. Anthropol. Sci. 2020, 12, 133. [Google Scholar] [CrossRef]
  22. Bernardini, F.; Vinci, G.; Horvat, J.; Lavrenčič, L.; Sibilia, E. Protohistoric pastoral landscape in northern Istria revealed by airborne LiDAR: Hill forts, enclosures and long linear walls in the Mali Kras plateau (southwestern Slovenia). Archaeol. Anthropol. Sci. 2020, 12, 187. [Google Scholar] [CrossRef]
  23. Laüt, L. La forêt domaniale de Tronçais (Allier): De l’acquisition LiDAR à l’approche archéologique de terrain. OpenScience 2020, 4. [Google Scholar] [CrossRef]
  24. Poirier, N.; Baleux, F.; Calastrenc, C. La cartographie des sites archéologiques forestiers au moyen d’un LiDaR embarqué par drone. Un retour d’expérience du Sud-Ouest de la France en archéologie du paysage et du peuplement. OpenScience 2020, 4. [Google Scholar] [CrossRef]
  25. Grammer, B.; Draganits, E.; Gretscher, M.; Muss, U. LiDAR-guided Archaeological Survey of a Mediterranean Landscape: Lessons from the Ancient Greek Polis of Kolophon (Ionia, Western Anatolia). Archaeol. Prospect. 2017, 24, 311–333. [Google Scholar] [CrossRef] [Green Version]
  26. Tapete, D.; Banks, V.; Jones, L.; Kirkham, M.; Garton, D. Contextualising archaeological models with geological, airborne and terrestrial LiDAR data: The Ice Age landscape in Farndon Fields, Nottinghamshire, UK. J. Archaeol. Sci. 2017, 81, 31–48. [Google Scholar] [CrossRef]
  27. Masini, N.; Coluzzi, R.; Lasaporana, R. On the Airborne Lidar Contribution in Archaeology: From Site Identification to Landscape Investigation. In Site Identification to Landscape Investigation, Laser Scanning, Theory and Applications; Wang, C.C., Ed.; IntechOpen: London, UK, 2011; pp. 263–290. [Google Scholar] [CrossRef] [Green Version]
  28. Masini, N.; Gizzi, F.T.; Biscione, M.; Fundone, V.; Sedile, M.; Sileo, M.; Pecci, A.; Lacovara, B.; Lasaporana, R. Medieval Archaeology Under the Canopy with LiDAR. The (Re)Discovery of a Medieval Fortified Settlement in Southern Italy. Remote Sens. 2018, 10, 1598. [Google Scholar] [CrossRef] [Green Version]
  29. Garcia Sanchez, J. Archaeological LiDAR in Italy: Enhancing research with publicly accessible data. Antiquity 2018, 92, 1–10. [Google Scholar]
  30. Cerrillo Cuenca, E.; López López, A. Assessment and perspectives of the use of LiDAR in Spanish archaeology. Boletín Del Mus. Arqueol. Nac. 2020, 39, 221–238. [Google Scholar]
  31. Monterroso-Checa, A. Remote Sensing and Archaeology from Spanish LiDAR-PNOA: Identifying the Amphitheatre of the Roman City of Torreparedones (Córdoba-Andalucía-Spain). Mediterr. Archaeol. Archaeom. 2017, 17. [Google Scholar] [CrossRef]
  32. Gasparini, M.; Moreno-Escribano, J.C.; Monterroso-Checa, A. Identifying the Roman road from Corduba to Emerita in the Puente Nuevo reservoir (Espiel-Córdoba/Spain). J. Archaeol. Sci. 2019, 24, 363–372. [Google Scholar] [CrossRef]
  33. Monterroso-Checa, A. Geoarchaeological Characterisation of Sites of Iberian and Roman Cordoba Using LiDAR Data Acquisitions. Geosciences 2019, 9, 205. [Google Scholar] [CrossRef] [Green Version]
  34. Monterroso-Checa, A. La ubicación del santuario de Melqart en Gadir: Aportación de los datos PNOA-LiDAR. SPAL 2021, 30, 137–164. [Google Scholar] [CrossRef]
  35. The LAS 1.4 Specification. Available online: http://www.asprs.org/wp-content/uploads/2010/12/LAS_Specification.pdf (accessed on 22 June 2021).
  36. Risbøl, G.; Gustavsen, L. LiDAR from drones employed for mapping archaeology –Potential, benefits and challenges. Archaeol. Prospect. 2018, 25, 329–338. [Google Scholar] [CrossRef]
  37. Crutchley, S. Light Detection and Ranging (lidar) in theWithamValley, Lincolnshire: An Assessment of New Remote SensingTechniques. Archaeol. Prospect. 2006, 13, 251–257. [Google Scholar] [CrossRef]
Figure 1. (a) Location of El Viandar Castle (husum) during the Al-Andalus medieval period in Spain © PNOA-Actual CC-BY 4-0 scne.es. (b) Location of El Viandar Castle (husum). Sierra de los Santos is part of the Sierra Morena mountain range. © PNOA-Actual CC-BY 4-0 scne.es.
Drones 05 00072 g001
Figure 2. (a) El Viandar Castle (husum) and other medieval Islamic castles (hisn) in the Guadiato Valley © PNOA-Actual CC-BY 4-0 scne.es. (b) El Viandar Castle (husum) and surrounding villages. © PNOA-Actual CC-BY 4-0 scne.es. (c) Location of El Viandar Castle (husum) under Mediterranean forest canopy. © PNOA-Actual CC-BY 4-0 scne.es.
Drones 05 00072 g002aDrones 05 00072 g002b
Figure 3. Shadow mapping generated from PNOA-LiDAR data (a,c,e) and UAV-LiDAR data (b,d,f) 3 shadow maps with different solar angles of 80° (a,b); 45° (c,d); 20° (e,f). ((a,c,e) ©LiDAR-PNOA 2013 CC-BY 4.0scne.es/(b,d,f) © UCO-FEDER 2018 1265775-F).
Drones 05 00072 g003
Figure 4. Slope maps generated from PNOA-LiDAR data (a) and UAV-LiDAR data (b). ((a) ©LiDAR-PNOA 2013 CC-BY 4.0scne.es/(b) © UCO-FEDER 2018 1265775-F).
Drones 05 00072 g004
Figure 5. (a) Dataset of terrain anomalies detected in geographic features, shadow maps and slope maps. Yellow: dataset of anomalies potentially belonging to the settlement. Other colors: demarcated anomalies that form part of the structure of El Viandar Castle. © UCO-FEDER 2018 1265775-F. (b) Boundary of the main regions of the castle. Yellow: boundary of the hypothetical settlement. Blue: curtain wall of the fortress of El Viandar Castle. © UCO-FEDER 2018 1265775-F.
Drones 05 00072 g005aDrones 05 00072 g005b
Figure 6. Castle and settlement of El Viandar under Mediterranean Forest Canopy. Zenithal orthophotograph from PNOA. GSD: 0.5 m. ©LiDAR-PNOA 2009 CC-BY 4.0scne.es.
Drones 05 00072 g006
Figure 7. (a,b) Detail of the shadow map of the area corresponding to the fortress of El Viandar Castle in the two datasets. Both maps show the same structures belonging to the castle ((a) Processed form Pnoa-Lidar Acquisitions ©LiDAR-PNOA 2017 CC-BY 4.0scne.es/(b) Processed from Uco-Feder 2018 1265775-F Research project acquisitions © UCO-FEDER 2018 1265775-F).
Drones 05 00072 g007
Figure 8. Anomalies detected evidence of archaeological remains of a castle. Blue: a fortified enclosure; Green: keep; Orange: towers; Red: entrance road; Teal and magenta: castle structures. © UCO-FEDER 2018 1265775-F.
Drones 05 00072 g008
Figure 9. Detail of the slope map showing an anomaly interpreted as a structure attached to the castle to the south of the building (in magenta). (a) Slope map. (b) The same slope map with the revealed structures of the castle. © UCO-FEDER 2018 1265775-F.
Drones 05 00072 g009
Figure 10. Detail of the shadow map showing the quadrangular anomaly at a distance of approximately 60 m from the castle wall. These anomalies are imperceptible in (a) and correctly visible in (b) (red arrows) ((a) Processed form Pnoa-Lidar Acquisitions ©LiDAR-PNOA 2017 CC-BY 4.0scne.es/(b) Processed from Uco-Feder 2018 1265775-F Research project acquisitions © UCO-FEDER 2018 1265775-F).
Drones 05 00072 g010
Figure 11. Detail of the shadow map showing the rectangular anomaly attached to the castle walls. These anomalies are imperceptible in (a) and correctly visible in (b) (red arrows) ((a) Processed form Pnoa-Lidar Acquisitions ©LiDAR-PNOA 2017 CC-BY 4.0scne.es/(b) Processed from Uco-Feder 2018 1265775-F Research project acquisitions © UCO-FEDER 2018 1265775-F).
Drones 05 00072 g011
Figure 12. Detail of the shadow map showing a series of anomalies at a distance of approximately 250 m from the castle walls. These anomalies are imperceptible in (a) and correctly visible in (b) (red arrows) ((a) Processed form Pnoa-Lidar Acquisitions ©LiDAR-PNOA 2017 CC-BY 4.0scne.es/(b) Processed from Uco-Feder 2018 1265775-F Research project acquisitions © UCO-FEDER 2018 1265775-F). ((a) ©LiDAR-PNOA 2017 CC-BY 4.0scne.es/(b) © UCO-FEDER 2018 1265775-F).
Drones 05 00072 g012
Figure 13. (a,b) El Viandar Castle. Archaeological remains of the castle wall (Figure 8 in deep blue) © UCO-FEDER 2018 1265775-F.
Drones 05 00072 g013
Publisher’s Note: MDPI stays neutral with regard to jurisdictional claims in published maps and institutional affiliations.

