Article

Evaluation of Optimization Parameters of Semi-Solid Metal 6063 Aluminum Alloy from Friction Stir Welding Process Using Factorial Design Analysis

by
Chaiyoot Meengam
and
Kittima Sillapasa
*
Department of Industrial Engineering, Faculty of Engineering, Ubon Ratchathani University, Ubon Ratchathani 34190, Thailand
*
Author to whom correspondence should be addressed.
J. Manuf. Mater. Process. 2020, 4(4), 123; https://0-doi-org.brum.beds.ac.uk/10.3390/jmmp4040123
Submission received: 9 November 2020 / Revised: 11 December 2020 / Accepted: 14 December 2020 / Published: 17 December 2020
(This article belongs to the Special Issue Advanced Joining Processes and Techniques)

Abstract

:
The semi-solid-metal 6063 aluminum alloy was developed for the automotive industry. The objective of this research was to optimize parameters in friction stir welding process that can provide the highest tensile strength. The ANOVA factorial design was used to analyze rotation speed, welding speed, and tool geometry at different factor levels of experimentation. The results showed that the optimized tensile strength was 120.7 MPa from the cylindrical tool, rotation speed was from 1300 to 2100 rpm, and welding speed less than 75 mm/min in the coefficient of determination R2 was 95.09%, as can be considered from the regression equation. The examination of the stir-zone and thermal mechanical affected zone using SEM and EDX showed that the new recrystallization of the microstructure causes fine grain in the stir-zone, coarse grain in advancing-side thermal mechanical affected zone, and equiaxed grain in the retracting-side thermal-mechanical affect zone. The intermetallic compounds of β-Al5FeSi phase transformation phase were formed to three types, i.e., β″-Al5Fe, Mg2Si, and Al8Fe2Si phase were observed. Moreover, in the stir-zone and thermal-mechanical-affected zone, defects were found such as flash defects, void or cavity defects, crack defects, lack of penetration defects, tunnel defects, kissing bond defects, and dendrite formation defects affecting weldability.

1. Introduction

The semi-solid-metal (SSM) 6063 is Al-Mg aluminum alloy materials that were developed for new techniques for forming castings in a semi-solid state, which application used in the automotive and other industries. Gullino et al. [1] discovered the gas-induced semi-solid-metal (GISSM) technique with casting temperatures below the Tm, where Tm is the melting temperature of the material, leading to the reduction of problems after casting, such as shrinkage, porosity, cracking after casting and damage to the mold. The semi-solid casting with the release of gas bubbles can reduce the problem after casting the samples well. Simultaneously, the Al-Mg-SSM 6063 aluminum alloy will be researched to produce an inner door for cars and is more likely to develop in other parts of motor vehicles further considered by Wannasin et al. [2]. In addition, the friction stir welding process (FSWp) have continuously had a role to joint welding in many automotive parts and floor panels of Shinkansen train described by Richter-Trummer et al. [3]. The FSWp is invented by Wayne Thomas at The Welding Institute (TWI) in the UK [4]. With many welding advantages, the FSWp was popular because it can lower temperature while welding (temperature in the range of 0.5–0.8 Tm), leading to low distortion and shrinkage, excellent mechanical properties, no filler wire, no porosity, no gas shielding, and the saving of energy. Moreover, it can weld dissimilar joint materials and environmentally friendly [5,6,7,8]. However, studying the optimum parameters of FSWp for semi-solid cast aluminum alloy is therefore a challenge. This study covers the search for parameters that affect the joint quality of welds and good mechanical properties. Ten years ago, many researchers tried to find good parameters in these FSWp. According to Meengam et al. [9], friction welding parameters of SSM 7075 aluminum alloy affect precipitation of MgZn2 phase in the friction zone. For mechanical properties, the different parameters during welding make the integrity of the quality welds different as well, whilst the friction stir welding methods for welded joint for the Al-Mg-Si alloy lead to the change of the weld zone formation new zone, named the “Triangle zone”, assessed by Hua ji et al. [10]. The optimum parameters for FSWp of the Al 5052 sheet joint also cause thermal optimization while welding obtained by Hosseini et al. [11]. At the same time, Boukraa et al. [12] improved the optimization of FSWp of Al-Li on AA2195-T8 with 3D transient heat-transfer numerical simulation found that good condition reduces welding time by 11% and 38% energy saved. Moreover, the shape of the tool pin also affects the quality of joint substantiate; Li et al. [13] investigated bobbin tool geometry of FSWp of ZK60-T5 magnesium alloy that affects the weld quality, and the result showed that the taper angle pin of 10° reduced the travel force and bobbin tool geometry welding speed to 600 mm/min for resulting in optimized welding quality observed. The type of joint and tool pin profiles of FSWp affected the mechanical properties and the change of microstructure; the butt joints gave good performance from welding with tapered cylindrical tools, as considered by Goel et al. [14], and different tool pins had different defects after being welded. Piccini and Svoboda [15] evaluated different tool pin profiles and butt and scarf joint effects on the efficiency of welding. They found that butt joints fabricated with tapered cylindrical tools obtained their highest tensile strength at 162 MPa. Another reason to reduce the observed tensile-strength problems of A12O3 oxide film present on the weldment from FSWp of AA2198-T851 Alloy as described by Donatus et al. [16]. The sound joined of Fe-22Cr-5Al-3Mo steel (Kanthal APMT™) affects parameters from rotation speed 600 rpm and a traverse speed of 25.4 mm/min, affecting strengthening mechanisms, mechanical properties, and microstructure analysis, as explained by Sittihoa et al. [17]. The optimization of dissimilar FSWp between the 6N01 and 7N01 was high-quality joint strength, when the estimated fatigue of FSWp joints tested found that a good relationship between fatigue strength and tensile strength is σω (R = −1) = 0.53 σB was obtained reported by Sillapasa et al. [18]. Predicting with mathematical equations can solve duplicate experiment problems can lead to reducing the use of materials in experimental. Bayazid et al. [19] investigated the dissimilar joint between 6063 with 7075 aluminum alloy by FSWp, when was predicted via the Taguchi method showed that the regression equation could predict the tensile strength precision. Likewise, Kumar and Murukan [20] investigated the optimized parameters of dissimilar joint between a AA6061-T6 and AINp composite and how they affect tensile strength from FSWp. They found that tool rotation speed, welding speed, axial force, and percentage of reinforcement influenced the ultimate tensile strength and elongation percentage. Variance analysis with analysis of variance (ANOVA) statistical method helped them develop a regression model to predict ultimate tensile strength and elongation percentage. Although the FSWp of aluminum alloy succeeds, optimized parameters for welding are also necessary and important because they can save the cost and evaluate mechanical properties of implementations in production. Therefore, the experimental design is introduced to reduce material wastage which is important for FSWp. Moreover, General Full Factorial Design (GFFD) of experiments technique is a model developed to validate the analysis of variance, which could reduce the cost for the welding process described by Palanivel et al. [21].
Consequently, the main idea of this study was to find optimized parameters for FSWp of SSM 6063 aluminum alloy, such as rotation speed, welding speed, and different shapes of tools that influence welding quality. In this experiment, the result of tensile strength was analyzed with a statistical engineering program, with the GFFD model, to develop equations to forecast tensile strength optimization of welded joints observed. The regression equations found in the research can be used to predict tensile strength, which is useful to use. We payed attention to the sound joins of samples and the microstructure mechanism transformation of Al5FeSi eutectic phase formation after FSWp examined by Scanning Electron Microscopy (SEM) and energy-dispersive X-ray spectroscopy (EDX) was used to evaluate the distribution of alloys elements in the stir zone (SZ) and Thermo-Mechanically Affected Zone (TMAZ), respectively. Besides this, some of the samples were measurements for tensile strength and hardness properties tests, to analyze the weldability observed.

2. Materials and Methods

2.1. Materials

The material used in this experiment was SSM 6063 aluminum alloy in a rectangular shape with 75 × 150 × 6 mm. The samples were prepared to form surface roughness approximately 3–5 µm by using Mitutoyo model SJ 210 (make: Mitutoyo Co., Ltd., Kanagawa, Japan), which was sponsored by GISSCO company limited (Songkhla, Thailand). The SSM 6063 aluminum alloy formed by the SSM technique was discovered by Wannasin [22]. The ingot was melted in semi-solid status with casting temperature at 629 °C. Then, the flowing of nitrogen gas rate was controlled at 14 L per minute, through porous graphite, for 12 s. This nitrogen gas will inhibit the formation of dendrite structured because this nitrogen gas can destroy the primary dendrite structure during the hardening step. However, this nitrogen gas promotes microstructures of the material to form as globular grain structures, from which the melting temperature can be calculated. The solid fraction is 33.34%, and the liquid fraction is 66.66%, which can be explained by the equation of lever rule [23]. After that, the squeezed casting step was done with a pressure of 350 N, from a GISSM Casting System machine, model V2. After the gas was induced into semi-solid casting, the base microstructure of SSM 6063 aluminum alloys consisted of α-aluminum matrix and β-Al5FeSi eutectic phase, the α-aluminum matrix looked round, like a petal from a flower, and the β-Al5FeSi eutectic phase inserted itself along the grain boundary shown in Figure 1. The particle grain size of the α-aluminum matrix was around 32–45 µm (gray particles). The Al5FeSi eutectic phase was formed as a plate-like shape (black particles). The alloys contain SSM 6063 aluminum alloy, which has silicon and magnesium elements as the main ingredients, and the chemical composition is shown in Table 1, with the melting point at 654 °C, tensile strength at 149 MPa, and Vicker’s hardness properties at 67 HV. The mechanical properties are shown in Table 2.

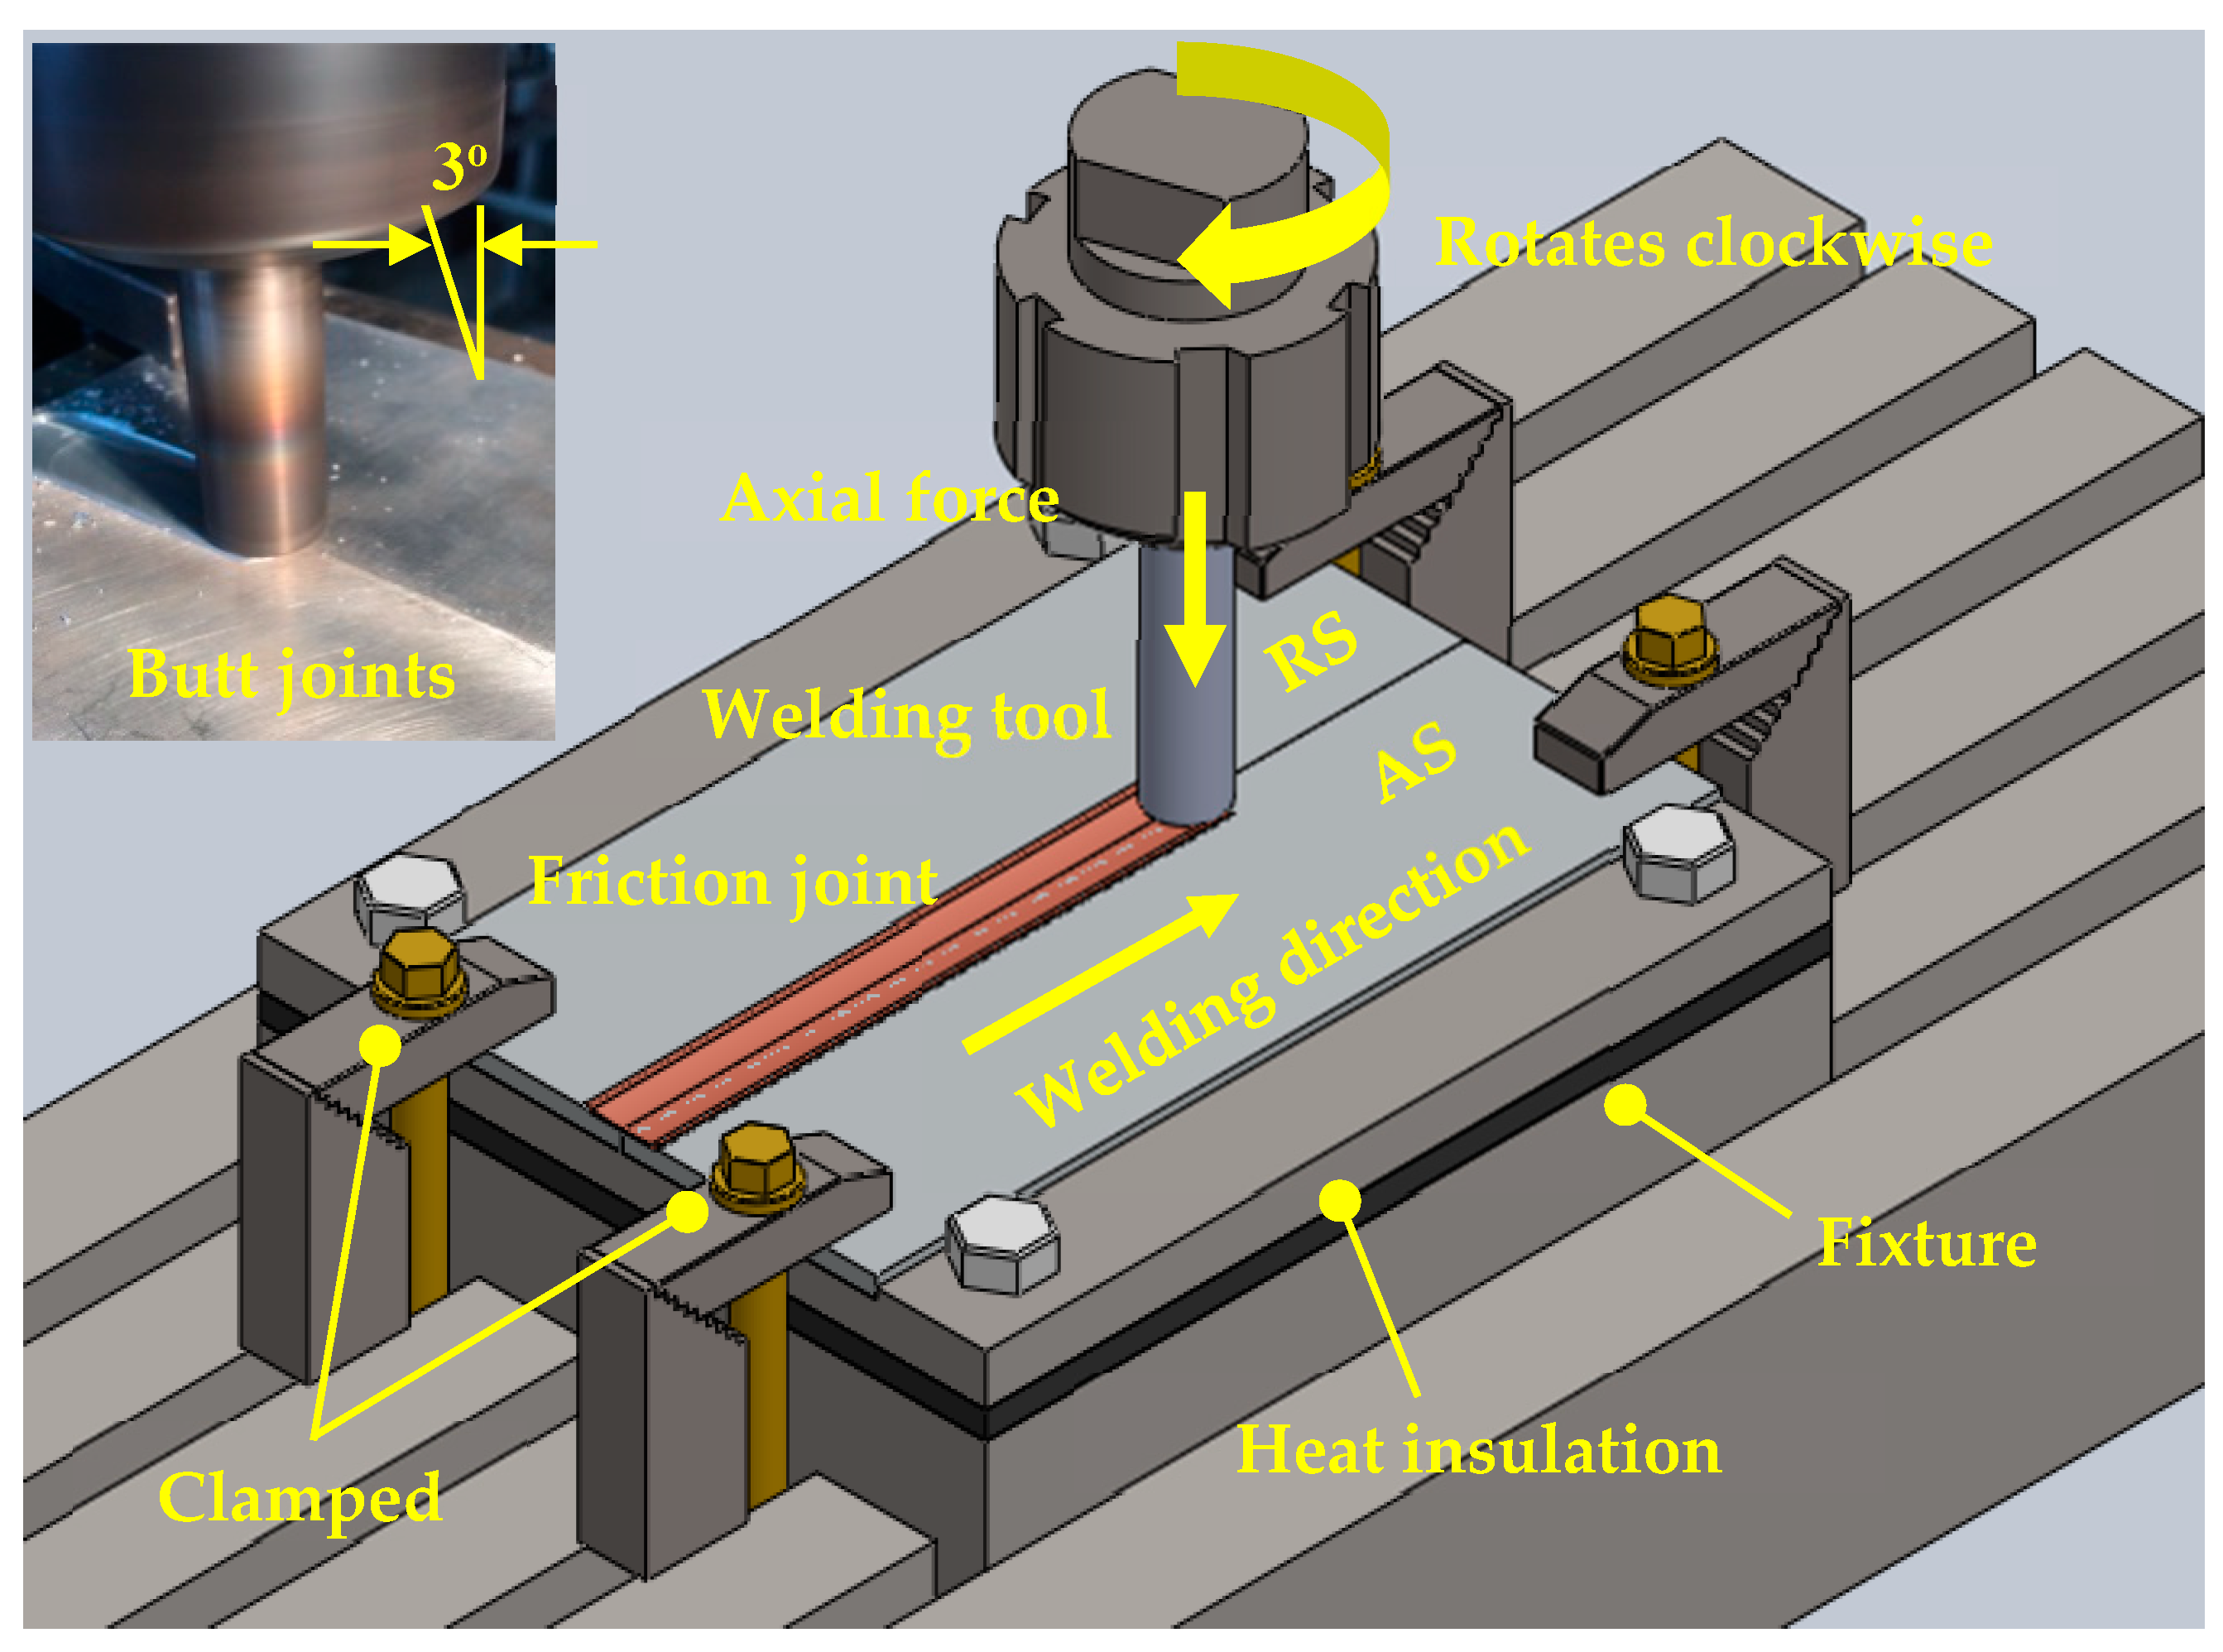
2.2. Experimental Procedures

In this experiment, three parameters of FSWp of SSM 6063 aluminum alloy were studied—rotation speed, welding speed, and different shapes of tool pin geometry. The welding tool pin geometries were cylindrical, triangular, square, and pentagon, which were manufactured from H13 tool steel. The welding tool was designed to be a good heat input. The relationship between shoulder diameter to pin diameter (D/d) ratio at 3.84 for cylindrical when the shoulder diameter was 20 mm and the tool pin diameter was 5.2 mm obtained by Khan et al. [24]. The side lengths of triangular, square, and pentagon were 4.2, 4.4, 5.6 mm respectively. However, the shoulder diameter of all welding tools was 20 mm. Moreover, the height of the pin tool is also the same size at 4.8 mm. The details of the pin geometry tool are shown in Figure 2.
These samples were placed like a butt-welded joint pattern in which the sides were placed adjacent to the others. These were placed on a fixture and clamped tightly. The heat insulation was supported between the fixture and the base of the FSW machine, to prevent the distribution of heat while welding. The welding direction rotated clockwise, and the tilt angle was at 3°. Then, the welding tool was set to the start position of welding, and the compression load was applied to make the shoulder tool contact the samples, with a rate of 2.7 mm/min, for the tool pin to sink into the material. During this period, the presence of high friction could be observed from scraps of metal that came out of the surface of the welding material. Next, the compression allowed the shoulder tool to sink into the material, with a depth of plug at 0.6 mm, and hold for 30 s, to generate heat from the surface the of welding tool between the samples’ surface of the material. Next, the welding tool was moved into the direction as specified. In order to make a complete welding, the welding tool was held for 30 s at the last position. Then, the welding tool was up to complete the process. However, a keyhole was still observed on the welded piece. The optimized parameters led to good weldability, and the defects can cause unrelated welding parameters shown in Figure 3.

2.3. Development of Regression Model

All welding factors were designed according to the GFFD matrix. There are 3 parameters with 4 levels of each parameter design which are the total of 43 models. Thus, all 64 experiments led to the proper and accurate experimental design. The condition shown in Table 3 provides the tensile strength obtained after FSWp. The tensile strength and joint efficiency results are shown in Table 4 which were used to create the regression model equation to assess the relationship of all three parameters in the experiment, leading to an accurate prediction. We used a personal computer (PC, Intel(R) Core(TM) i5-9300H central processing unit (CPU) 2.40 GHz, random access memory (RAM) Double Data Rate 4 (DDR4) 16 GB, Bangkok, Thailand; model: ASUS) for simulating the parameter optimization with Minitab 19 software (Minitab, LLC, State College, PA, USA).

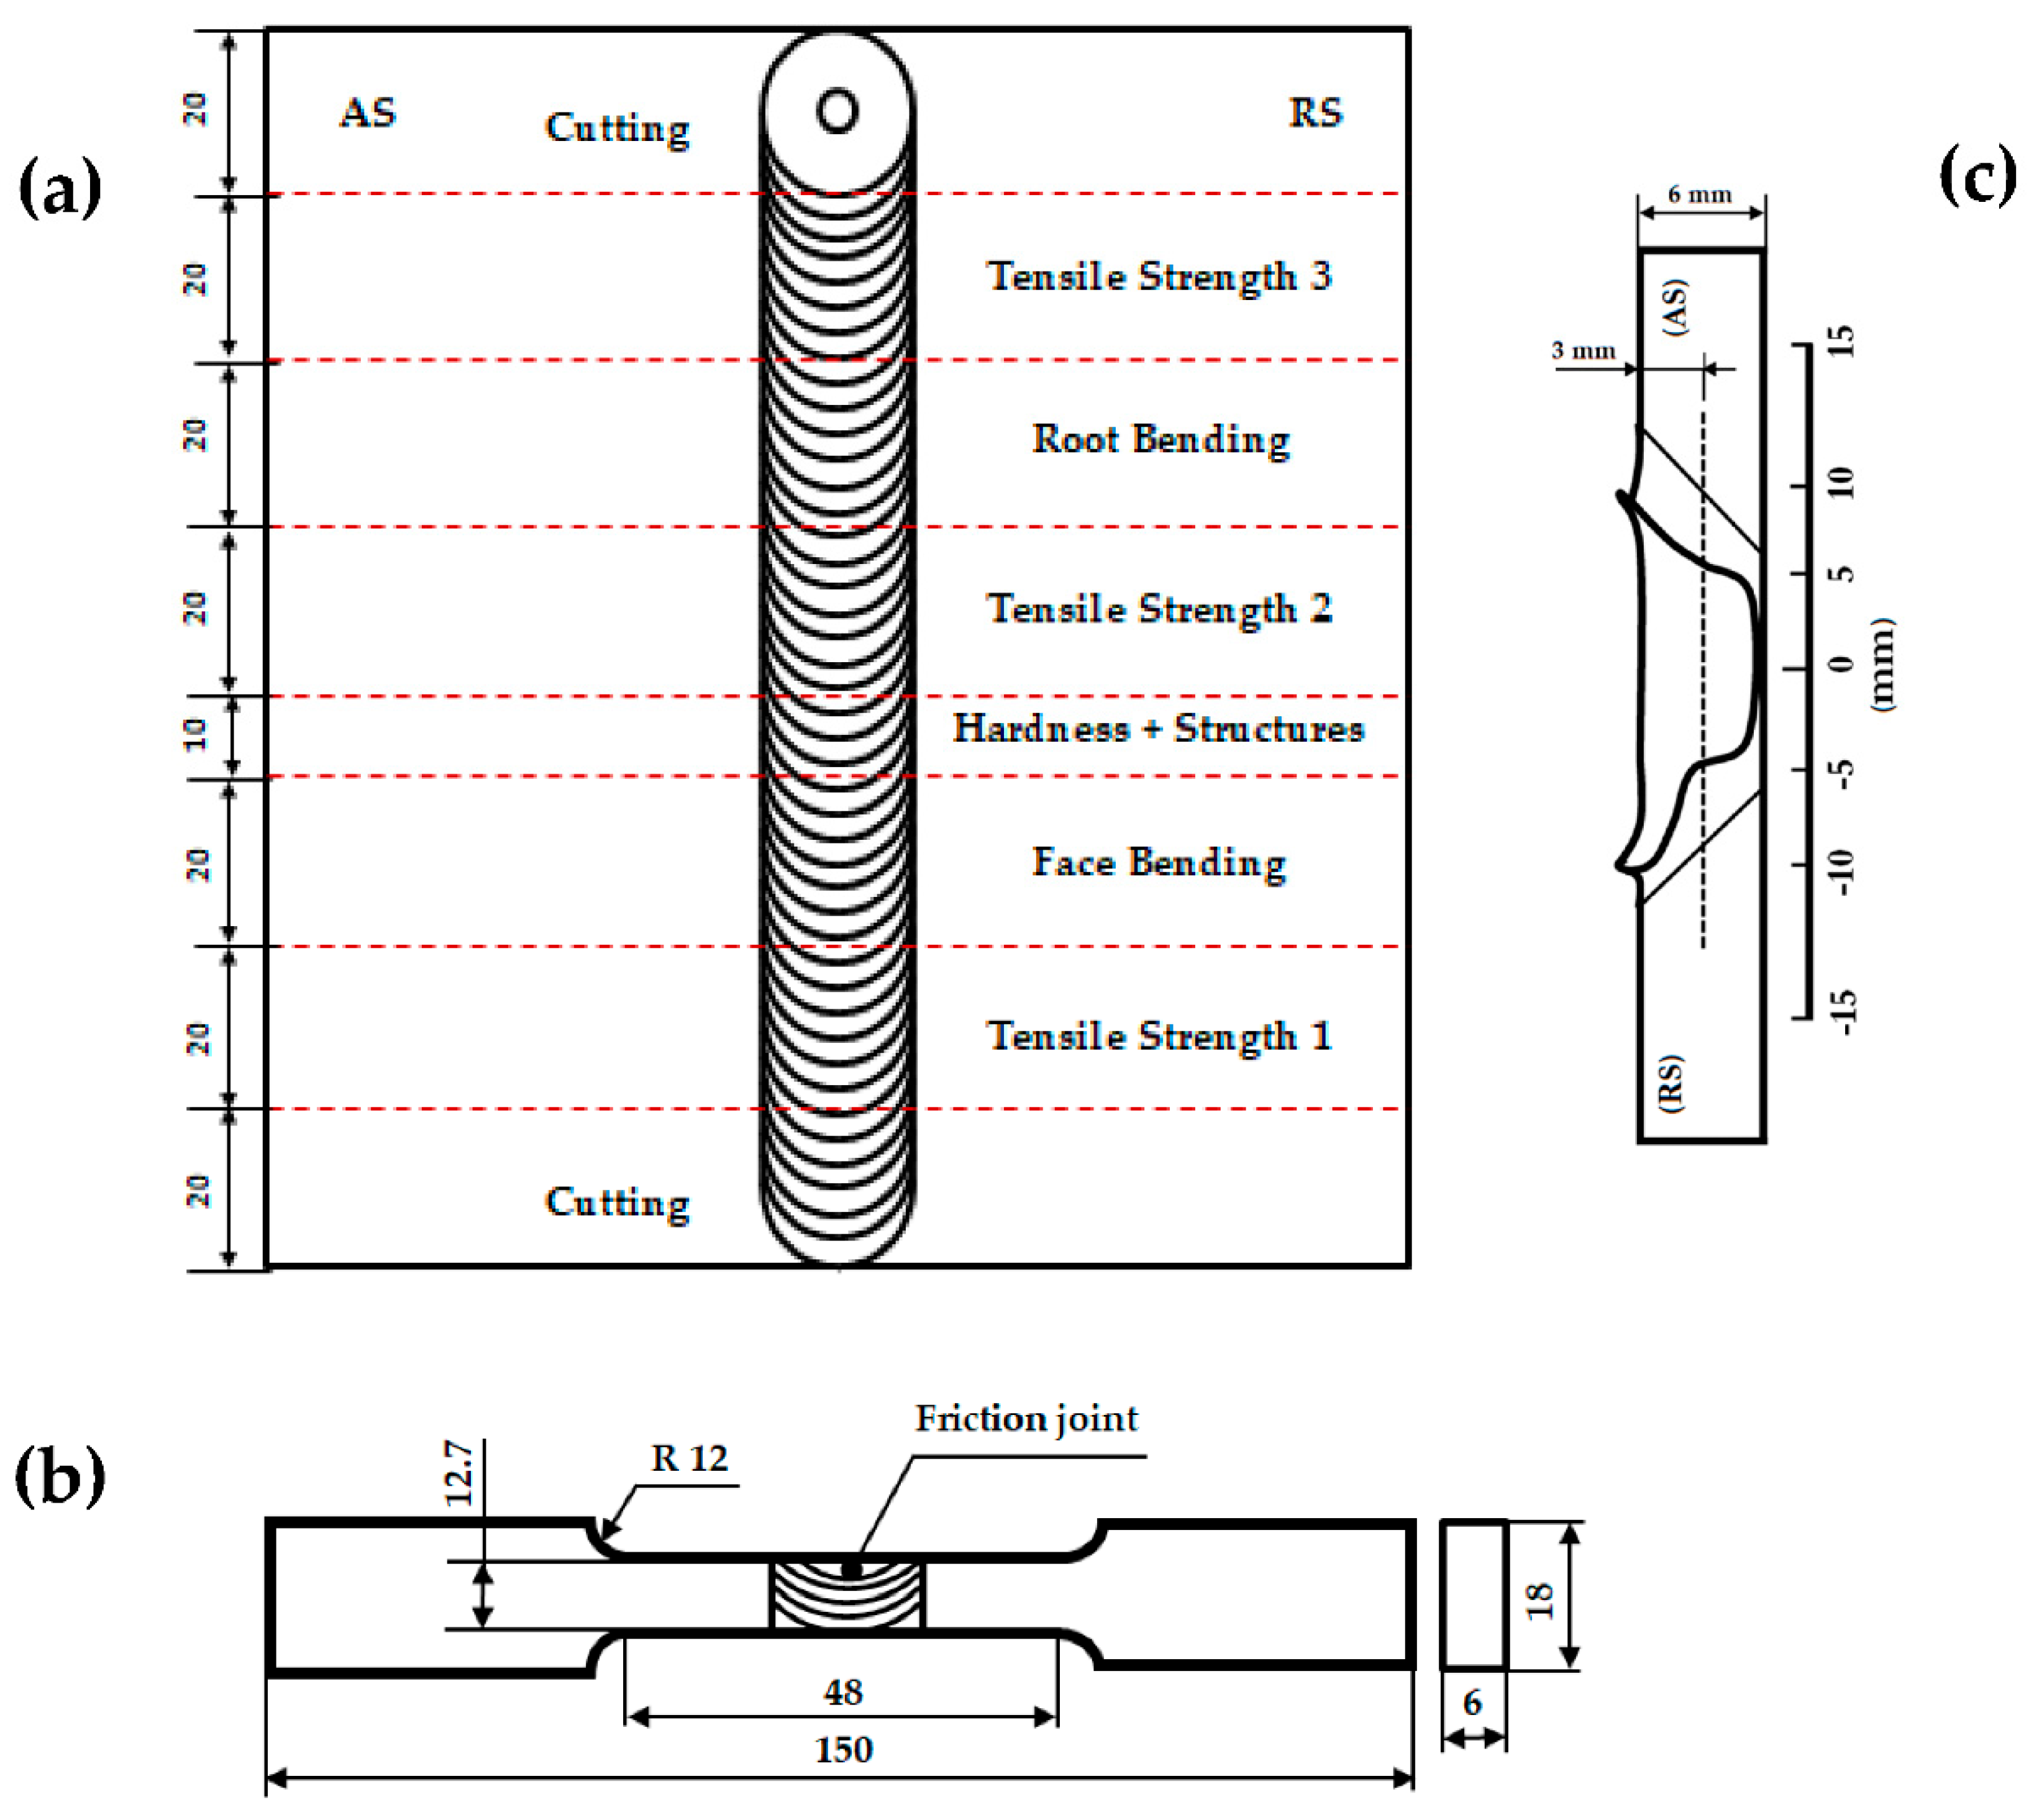
2.4. Mechanical Testing and Metallurgy

After in FSWp, the samples were taken to test the mechanical properties on a machine (Mazak, Singapore; model: VCN-430A), and the results are shown in Figure 4a. The samples for tensile strength were prepared in a rectangular shape, with the geometry and dimensions shown in Figure 4b. The test was performed under room temperature and carried out at a crosshead speed at 1.27 × 10⁻² mm/s, with a universal testing machine (Lloyd, South Carolina, USA; model: EZ50), according to the American Society for Testing of Materials standard in ASTM E8M-04 observed. Finally, Vicker’s microhardness was conducted on Matsuzawa model MMT-X (make: Matsuzawa Co., Ltd., Akita, Japan), with a 1.96 N, the diamond probe, and indent period of 10 s. The position of the measure was in the center of the samples, through the weld zone, and maintained a 0.2 mm space between each indentation shown in Figure 4c. For the metallurgy analysis, the samples were cut and prepared for polishing by emery papers from P320 up to P1200 grit, respectively. Then, the samples were polished with alumina powder (Buehler brand, Illinois, USA), in micro-particle sizes 5, 3, and 1 µm, respectively. Finally, the samples were etched with Keller’s reagent mixed in proportion volume as follows: 190 mL in H2O, 5 mL in HNO3, 3 mL in HCl, and 2 mL in HF. These chemicals were taken from UBU Materials Laboratory, Ubon Ratchathani University, Ubon Ratchathani, Thailand. The microstructural evaluation was carried out by using a light optical microscopy (OM) and an Optika microscope, (Optika, Ponteranica Bergamo, Italy; model: B-382PHi-ALC), and phase transformation on the joint of the samples was carried out by a scanning electron microscope with back-scattered electron image mode and assessed by the SEM and variations in compositions of alloying elements by energy-dispersive X-ray spectroscopy with EDX detector (FEI-Quanta, Zurich, Switzerland; model: 400FEG).

3. Results and Discussion

3.1. Optimization Parameters with General Full Factorial Design Analysis

The ANOVA analyses were evaluated in relation to the parameters with tensile strength. The evaluation with regression equations is used for parameter participation. The accurate regression equation is selected to predict the tensile strength for industrial applications, in order to reduce waste in the production system. The response function tensile strength (TS) of the FSWp joint is a function of rotation speed (R), welding speed (W), and tool geometry (T), relating to each other significantly. These factors could affect the integrity of the weld, formation of defects, and different tensile properties. The tensile strength results from all experiments are shown in Table 4. The experimental results show that the maximum tensile strength can be determined from the cylindrical tool and observed from rotation speed at 1320 rpm, welding speed 60 mm/min with an average tensile strength of 123.59 MPa. When calculating the joint efficiency from Equation (1), 82.95% of the joint efficiency value was calculated as shown in the 29th experiment. On the contrary, it was found that the triangular tool tended to provide lower tensile strength from rotation speed 1110 rpm, welding speed 120 mm/min with an average of 47.93 MPa, which joint efficiency 32.17% shown in the 27th experiment, compared with the tensile strength base materials. These results are consistent with Goel et al. [14].
Joint efficiency = UTS of friction joint/UTS of SSM 6063 Aluminum alloy × 100%
However, the results from the square and pentagon tools are similar. The tensile strength results showed a good tendency of better tensile strength than the triangle tool but less than a cylindrical tool. These can be explained by the ability of material flow around different pin tools to cause a relationship model of the tensile equation to have different tensile strength values, according to the tool geometry report by Wang et al. [25].
The relationship model of the tensile equation is determined by the variable function in the experiment, in which the variability of all three factors will affect the change in tensile strength described by Dinaharan et al. [26]. It can be expressed as follows:
TS = ƒ(R, W, T)
However, another regression equation that describes the response surface of tensile strength, which is in the form of a function “Y”, has been described according to Montgomery et al. [27].
Y = b0 + ΣbiXi + ΣbiiX2i + ΣbijXiXj
When b0 is the average response surface, bi, bii, and bij are the response coefficient which is the main factor. For covariate Xi and Xj, these factors have an interaction effect on the parameters. In the experiment, three factors can be described as polynomial equation below:
Tensile Strength (TS) = b0 + b1(R) + b2(W) + b3(T) + b11(R2) + b22(W2) + b33(T2) + b12(RW) + b13(RT) + b23(WT)
where b0 is the average of responses of tensile strength, b1, b2, b3b11, b22, b33b12, b13, b23, are the coefficient that depends on the respective main and interaction factors considered by Seetharaman et al. [28]. The regression model analysis indicates that the p-value of factors in this experiment affecting the tensile strength of SSM 6063 aluminum alloy using the FSWp process was less than 0.05 significant level. These factors were rotation speed (R), welding time (W), tool geometry (T), square term of rotation speed (R × R), square term of welding time (W × W), and square term of tool geometry (T × T). In addition, the main factors, that affect the tensile strength and the co-factors of tree factors also influenced the tensile strength, can be considered from the interaction between the rotation speed and welding time (R × W), interaction between the rotation speed and tool geometry (R × T), and interaction between the welding time and tool geometry (W × T), respectively. The p-value of this regression model was 0.000, which is better than the previous model, as shown in Table 5. The coefficient of determination R2 was 95.09%. In order to verify the accuracy of this equation, this equation was rechecked and can be used to predict the tensile strength.
Tensile strength = 124.80 + 0.0382 R − 0.157 W − 35.450 T − 0.000016 R2 − 0.003336 W2 + 7.006 T2 + 0.000252 RW − 0.00071 RT + 0.008 WT    (MPa)
To confirm the results from these regression equations, the regression equations were employed to predict tensile strength and to conduct the experiment to find the appropriate parameters in the FSWp process of SSM 6063 aluminum alloy. The repeated experiments were conducted to verify the accuracy of this regression equation by 12 replications. These experiments were conducted under the conditions of rotation speed 1320 rpm, welding speed 60 mm/min, and cylindrical tool, to confirm the test results. The following tensile strengths were recorded: 120.17, 119.85, 117.21, 118.99, 121.01, 125.32, 122.45, 119.38, 121.71, 123.23, 118.84, and 120.44 MPa respectively. The calculated average tensile strength value was at 120.7 MPa. Therefore, all 12 values of average tensile strength were in the forecasting range, according to the response optimizer, from 86.17 to 138.41 MPa (95% PI), as shown in Table 6. Thus, it can be concluded that it was not statistically different. This equation can be used to predict the tensile strength in the FSWp process of SSM 6063 aluminum alloy [29].
Figure 5 shows the contour plot, and the graphic characteristic was nonlinear. The result found that the inner oval area had the highest tensile strength at 110 MPa, and the outer oval area showed the lower tensile strength values of 85, 90, 95, 100, and 105 Mpa, respectively. When considering the relationship between R and W, it was found that increasing rotation speed and lowering welding speed tended to increase the tensile strength; the relationship of these two variables must be appropriated for tensile strength optimization, as shown in Figure 5a. The relationship between T and W is also significant in tensile strength optimization. The cylindrical tool tends to give better tensile strength than other tool geometry, due to the flowing ability of material around the pin, as shown in Figure 5b. While the relationship of T is an influence of the change of tensile strength optimization, it was found that the increase of rotation speed tends to increase tensile strength significantly, as shown in Figure 5c. However, the result of welding at too-high rotation speed leads to the occurrence of the flash defect, and that is the reason for the lower mechanical property. The evaluation of three factors in the experiment can explain optimization factors affecting tensile strength; the contour plot and response optimization analysis show that rotation speed ranged from 1300 to 2100 rpm, welding lower 75 mm/min and cylindrical tool suitable for FSW of SSM 6063 aluminum alloy. Therefore, the benefit of this statistical analysis helps to reduce material waste in the experiment and can accurately predict the desired results described by Ryan [30]. However, multiple optimizations could further improve the regression equations, in order to create a perfect condition for the auto industry.

3.2. Tensile Strength in the Joint Analysis

The evaluation of stress and strain deformation from a tensile test is shown in Figure 6. It shows that plastic deformation behavior is observed and the slope of the graph is high because of the good bonding of dislocated atoms. However, the acting force on the specimen results in dislocation of atoms which can destroy and cause the strength of the material to be decreased. It is noteworthy that the material has a fast elongation rate, which is an elastic deformation behavior because some of the atomic adhesion were changed. This is due to the action leading to material weakness and material fracture [31]. On the contrary, some materials have high toughness property, resulting in the difficulty of atomic dislocation to be destroyed. This can be explained why elastic deformation behavior is in a small range. For example, from rotation speed 1320 rpm, welding speed 60 mm/min, and cylindrical geometry of the tools, the maximum tensile strength was at 123.59 MPa and the elongation rate was at 23 mm, because SSM 6063 aluminum alloys have the strength and ductile property. However, fracture position in the advancing-side thermal mechanical affected zone (AS-TMAZ) was a coarse grain of microstructure and low hardness property, leading to the fracture of samples after tensile strength test in such area. Moreover, some fractures of the samples have been found in the SZ due to defects occurring after welding, resulting in less weldability [32]. However, all experimental results tend to be in the same direction.

3.3. Vickers Hardness Analysis

Figure 7 shows that Vicker’s hardness profiles from the welded joints from all different tool geometries have similar hardness values; the base metal (BM) was casted with higher hardness than other areas from the average at 64 to 68 HV, while resulted in the average hardness in SZ was 42 to 55 HV and the hardness of TMAZ is the lowest when compared to other areas with an average hardness of 29 to 34 HV. The hardness simulation is shown in Figure 7a. It is noteworthy that the microstructure transformation of the Al5FeSi phase of intermetallic compounds affects the difference in hardness properties. In the SZ, the recrystallization and deformation formation of intermetallic compounds of the Al5FeSi phase resulted in the small particles leading to new precipitation of the Al5FeSi phase. Moreover, temperature cycle and friction force are other causes of hardness properties in SZ [33], the residual stress in the SZ can also give different hardness results mentioned in Zhang et al. [34]. In the TMAZ, the temperature cycle of materials was diffused. This is the area where the temperature cycle causes the incomplete recrystallization of the microstructure leading to lower hardness than in the SZ and BM. The experimental results consider that the hardness value from the cylindrical tool was higher than the hardness values from triangular, square, and pentagon tools because the different geometry tools make Al5FeSi phase facture and unequal in size. In the same sense, the pentagon tool and all other geometry tools provide similar temperature cycle results because it can affect the flow of materials and distribution of intermetallic compounds in SZ [35]. On the other hand, the triangular tool provides lower hardness because the triangle shape of the pin tool provides poor ability for the material to flow in SZ. Noticed that, the hardness profiles in welded joint similar to W-shape shown in Figure 7b, which are in accordance with the study from Goel et al. [14]. The lower hardness in AS-TMAZ leads to the explanation of the behavior of the broken sample during the tensile strength test.

3.4. Microstructure in Joint Analysis

After FSWp, the microstructure evaluation under an optical microscope showed that the globular grain structure resembled petal flowers due to the transformation phase in the SZ and the TMAZ. This is because the heat results in the softening of both α-aluminum matrix and β-Al5FeSi phase and friction force affects the fracture of the β-Al5FeSi phase. However, after parameter optimization, the defects will be eliminated and materials will be subject to recrystallization [36], leading to a homogenous and sound joint, which can be observed from the rotation speed at 1320 rpm and welding speed at 60 mm/min with the cylindrical tool pin shown in Figure 8. The changes of microstructure in SZ and TMAZ are different because the influence of both heat and friction force induces grain refinement [37]. Both areas can be grouped into three types of structural changes: First, fine grain areas in SZ are recrystallized in a very small size comparing to other areas and form as β-Al5FeSi phase shown in Figure 8h. This is because the tool pin directly touches the SZ and stirs until it becomes a small fracture shape. Second, coarse grain areas in AS-TMAZ are in a bigger size of β-Al5FeSi phase compared to the SZ. This is because AS-TMAZ received only heat, unlike SZ, which received both heat and friction force, as shown in Figure 8e,f. Finally, equiaxed grain areas in the retracting-side thermal-mechanical affect zone (RS-TMAZ) were influenced by heat and some friction force causing plastic deformation. The globular grains were transformed to be elongated grains, especially α-aluminum matrix elongated in the direction of rotational flow. Moreover, for heat-affected areas next to TMAZ, the growth of the α-aluminum matrix is shown in Figure 8a, which may lead to the ductile properties of the material. The difficulty of microstructural changes depends on the input energy during FSWp, which was evaluated by Heidarzadeh et al. [38] shown in Figure 8b,c. Some of the β-Al5FeSi phases still form as plate-like structure. The evaluation of welding parameters shows that the differences in parameters in the experiment lead to a different amount of heat and force during FSWp. However, the heat generated during FSWp significantly contributes to the microstructural changes to plastic deformation, viscous dissipation of materials, and friction heat generation, which mostly occurs from heat input behavior reported by Zhanga et al. [32]. This can be expressed as in the following equation.
H e a t   I n p u t   ( H I ) = Q t o t a l υ = Q s h o u l d e r 0.83 υ = 2 π μ   F n   R i   ω 0.83 v                   ( kJ / mm )
where “HI” is heat input, “Qtotal” is the overall heat generation, “Qshoulder” is heat generated by tool shoulder, “υ” is welding speed (mm/min), “π” is the constant value, “µ” is frictional coefficient between the surface of tool shoulder and surface of the sample (for frictional coefficient between aluminum alloy and tool steel approximately as 0.2–0.8, studied by Javadi and Tajdari [39]), “Fn” is spindle downforce of friction (kN), “Ri ” is the tool shoulder radius, “ω” is the observed rotation speed (rpm). According to Equation (6), it clearly demonstrates that the increase in rotation speed, downforce of friction, and tool radius result in the higher heat input. Additionally, the measurement of peak temperature at the SZ during FSWp shows that there was approximately from 360 to 412 °C. This heat is enough for the SZ to form new precipitation, but the arrangement of the atoms is incomplete because welding time is too short. Nevertheless, the shear stress during FSWp significantly affects the change of microstructures and mechanical properties. The shear stress is related to the particle size of the intermetallic compound. From Equation (7), it proves that increased rotational speed can increase the shear stress. The shear stress of the material can be described in the form exponential function presented by Quintana et al. [40].
τ l = A e B ω
where τl is the local shear yield stress of the material, A is friction force, B is the area of the shoulder tool in experimental design, and ω is the rotational speed respectively. The crucial consideration shows that the relationship of the rotating speed with the shear stress (torque) is the reason for the broken characteristics of the particles and the different particle sizes after welding.
However, when the microstructure in the welding joint was evaluated, six types of defects were observed. If the selected welding parameters are not optimized, these can cause a variety of defects. The first type of defect was a flash defect. It is found in the lower welding speed and higher rotating speed from both cylindrical and pentagon pin tools. These flash defects were formed due to excess heat input, as shown in Figure 9a. Likewise, the cylindrical and pentagon tool can induce the void or cavity defects which were caused by too-high welding speeds, unsuitable forging load, and inappropriate tool tilt angle, as shown in Figure 9b. The third type of defect came from a triangular tool with stress concentration in joint, lack of material flow, lower heat input, and shrinkage, as shown in Figure 9c. Simultaneously, lack of penetration and tunnel defects (Figure 9d) were from the higher welding speed, lower rotating speed, lower depth of plunge, and local variations in the sample thickness, leading to low heat input while welding. These reasons caused the defects described in [41]. The kissing bond defect is the fifth type of defects that was appeared at the weld joint for FSWp of SSM 6063 aluminum alloy. When the welding speed was too high, the preparation of the oxide layer was removed from the faying surface of the sample and insufficient of how material flows, shown in Figure 9e [42]. Finally, when a high rotating speed and low welding speed were selected, they caused very high heat input. Dendrite formation defect was surprisingly observed from the samples. A new dendrite structure was formed as columnar grains, as shown in Figure 9f. This defect is an important finding because this type of defect is not usually found in semi-solid materials [43].
According to SEM analysis, the plate-like shapes in BM were deformed into needle-type precipitations in TMAZ and transformed into rod-type precipitations in SZ with the shear stress shown in Figure 10. This rod-type precipitation in SZ has the smallest size of β-Al5FeSi particle compared to other areas, in which the size of base intermetallic compound β-Al5FeSi particle was 79–114 µm (Figure 10a). The intermetallic compound β-Al5FeSi phase receives shear stress during welding, resulting in β-Al5FeSi phase incomplete precipitations (unstably), as shown in Figure 10b. Likewise, the broken behavior of intermetallic compound β-Al5FeSi phase in the center of SZ was small in size with the average particle size around 8–13 µm. This new crystallization produces good hardness properties shown in Figure 10c, and it is found at the bottom of the pin tool area shown in Figure 10e. The size of the intermetallic compound β-Al5FeSi phase is slightly increased. In this area, heat and shear stress are difficult to access and the particle size is around 17–24 µm. The permanent fracture and deformation of the eutectic phase were significantly influenced by welding parameters. The mechanism of uniform phase distribution and similar particle sizes provide fatigue and hardness properties reported by Rao et al. [44]. The heat, shear stress, and cooling rates are important components for the complete precipitation. The sequence of 6XXX aluminum alloy mechanism precipitation can be observed as follows: α (SSS) GP zones→needle-type β″→lath-type Q’→Q + Si. As previously mentioned, the heating and cooling rates promote the formation of GP zones, which lead to the highest hardness [45]. For precipitation mechanism, Al-Mg-Si-Fe system can be observed in equilibrium with the aluminum solid solution system β-Al5FeSi→β′-Al8Mg5→β″-Al5Fe. This FSWp creates short heat input, leading to difficult crystallization in GP zones, but some elements of the Mg2Si, Al8Fe2Si phase in SZ were observed. The low solubility of iron in the α-aluminum matrix makes all elements a supersaturated solid solution (SSS) that cannot be formed. The Fe-containing phase compound can promote hardness, and this is the reason for the joint performant [46].
The elemental analysis in the welded joint with EDX-Ray spectroscopy is shown in Figure 11. The welded joint was photographed by SEM shown in Figure 11a. This SSM 6063 aluminum alloy has a face-center-cubic (FCC) crystal structure [47], which the similar atomic size results in the substitution diffusion mechanism of atoms. When heat can give the activation energy and make the diffusion of Si, Mg, and C-atoms to be inserted into the Al-atoms. This diffusion is found to be diffused between the atoms of one element and another atom from other elements shown in Figure 11b. For Fe-atom, it has a body-center-cubic (BCC) crystal structure and is large in size, compared to other alloys [48]. This causes the atoms to difficultly move to result in the concentration of the element in little quantity to be analyzed shown in Figure 11e. On the contrary, Si, Mg, and C-atoms are small atoms. Thus, they require lower activation energy to create a good diffusion mechanism. This can be observed from the high concentration of those elements shown in Figure 11d,f,g. However, the concentration of the elements can be evaluated by the EDX technic. It shows that FSWp of SSM 6063 aluminum alloy is non-steady-state diffusion, because the diffusion concentration of atoms in one area changes from time to time and can be explained by Fick’s second law [49].
C x C 0 C s C 0 = 1 e r f ( x / 2 D t )
where C0 is the concentration of atoms that are in the solid-state before diffusion. Cs is the concentration of atoms on the solid surface, the concentration of atoms at the distance from the surface x at time t. D is the diffusion coefficient (m2/s) and t is diffusion time (s) respectively. The temperature and time effect is related to diffusion. It is observable from Si and Mg atoms that have the ability of good diffusion around 7.4 and 9.4 (Atomic%) due to its small atomic size and high atomic concentration causes the ability to well diffuse shown in Figure 11f. Likewise, the atom of Fe can diffuse well because heat stimulates the movement of atoms, and the high temperature tends to make Fe change from crystal structure to FCC lead to the ability of diffusion [50]. However, the appropriate diffusion mechanism results in the completion of the samples after welding.

4. Conclusions

In this experiment, the evaluation of optimization parameters of butt-joint welding for SSM 6063 aluminum alloy from FSWp resulted in the following conclusions:
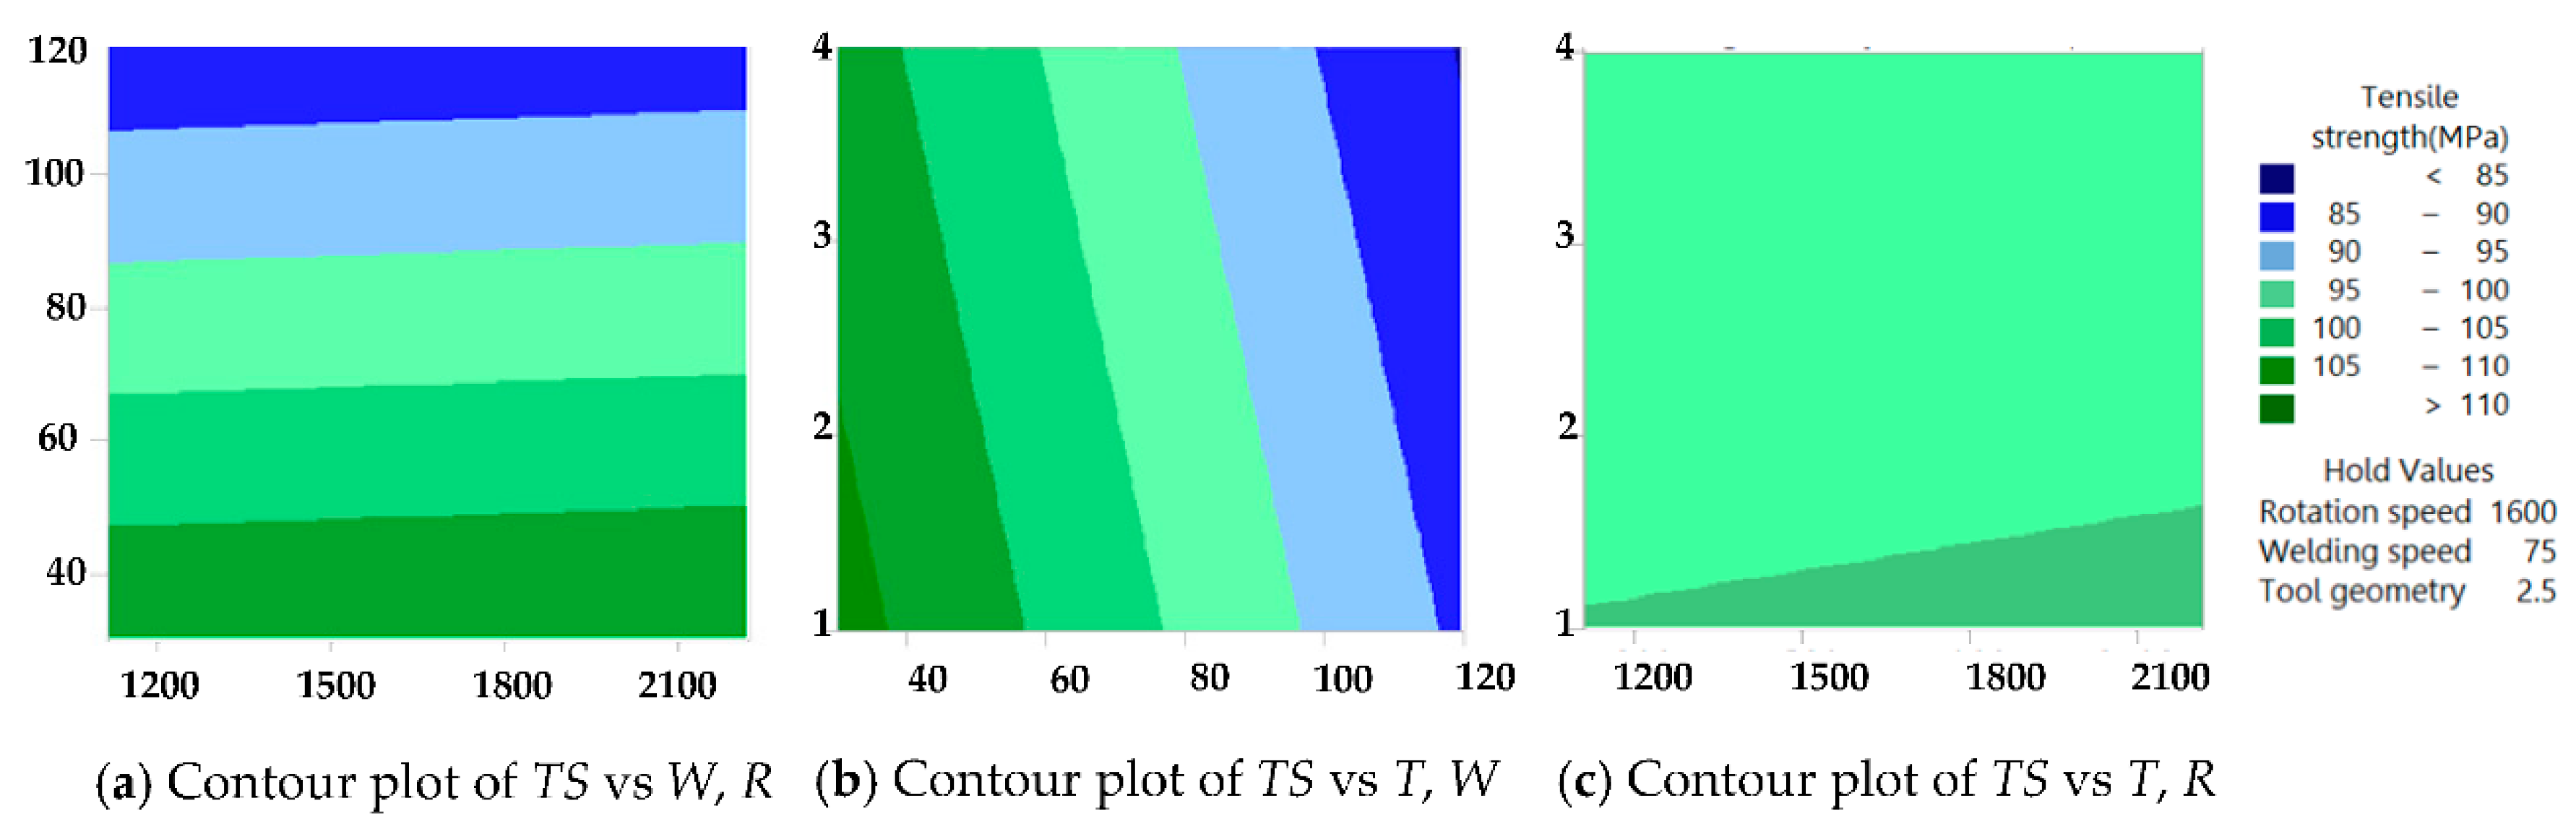
  • For the optimization of tensile strength prediction from the regression equation, the mathematical relationship of factors found that the response optimizer was 86.17 to 138.41 MPa from cylindrical tool, rotation speed was 1300 to 2100 rpm, and welding speed was 75 mm/min with the coefficient of determination R2 at 95.09% when verifying tensile strength was 120.7 MPa with confident α = 0.05 and demonstrating the accuracy and precision.
  • The maximum tensile strength was at 123.59 MPa, and maximum elongation was at 23 mm from the rotation speed at 1320 rpm and welding speed at 60 mm/min with the cylindrical tool. The joint efficiency was at 82.95%, compared to the tensile strength at 149.00 MPa of base SSM 6063 aluminum alloy. On the other hand, the lowest tensile strength (47.93 MPa) was from the rotation speed at 1110 rpm and welding speed at 120 mm/min; joint efficiency stayed consistent at 32.17%, in all, over AS-TMAZ.
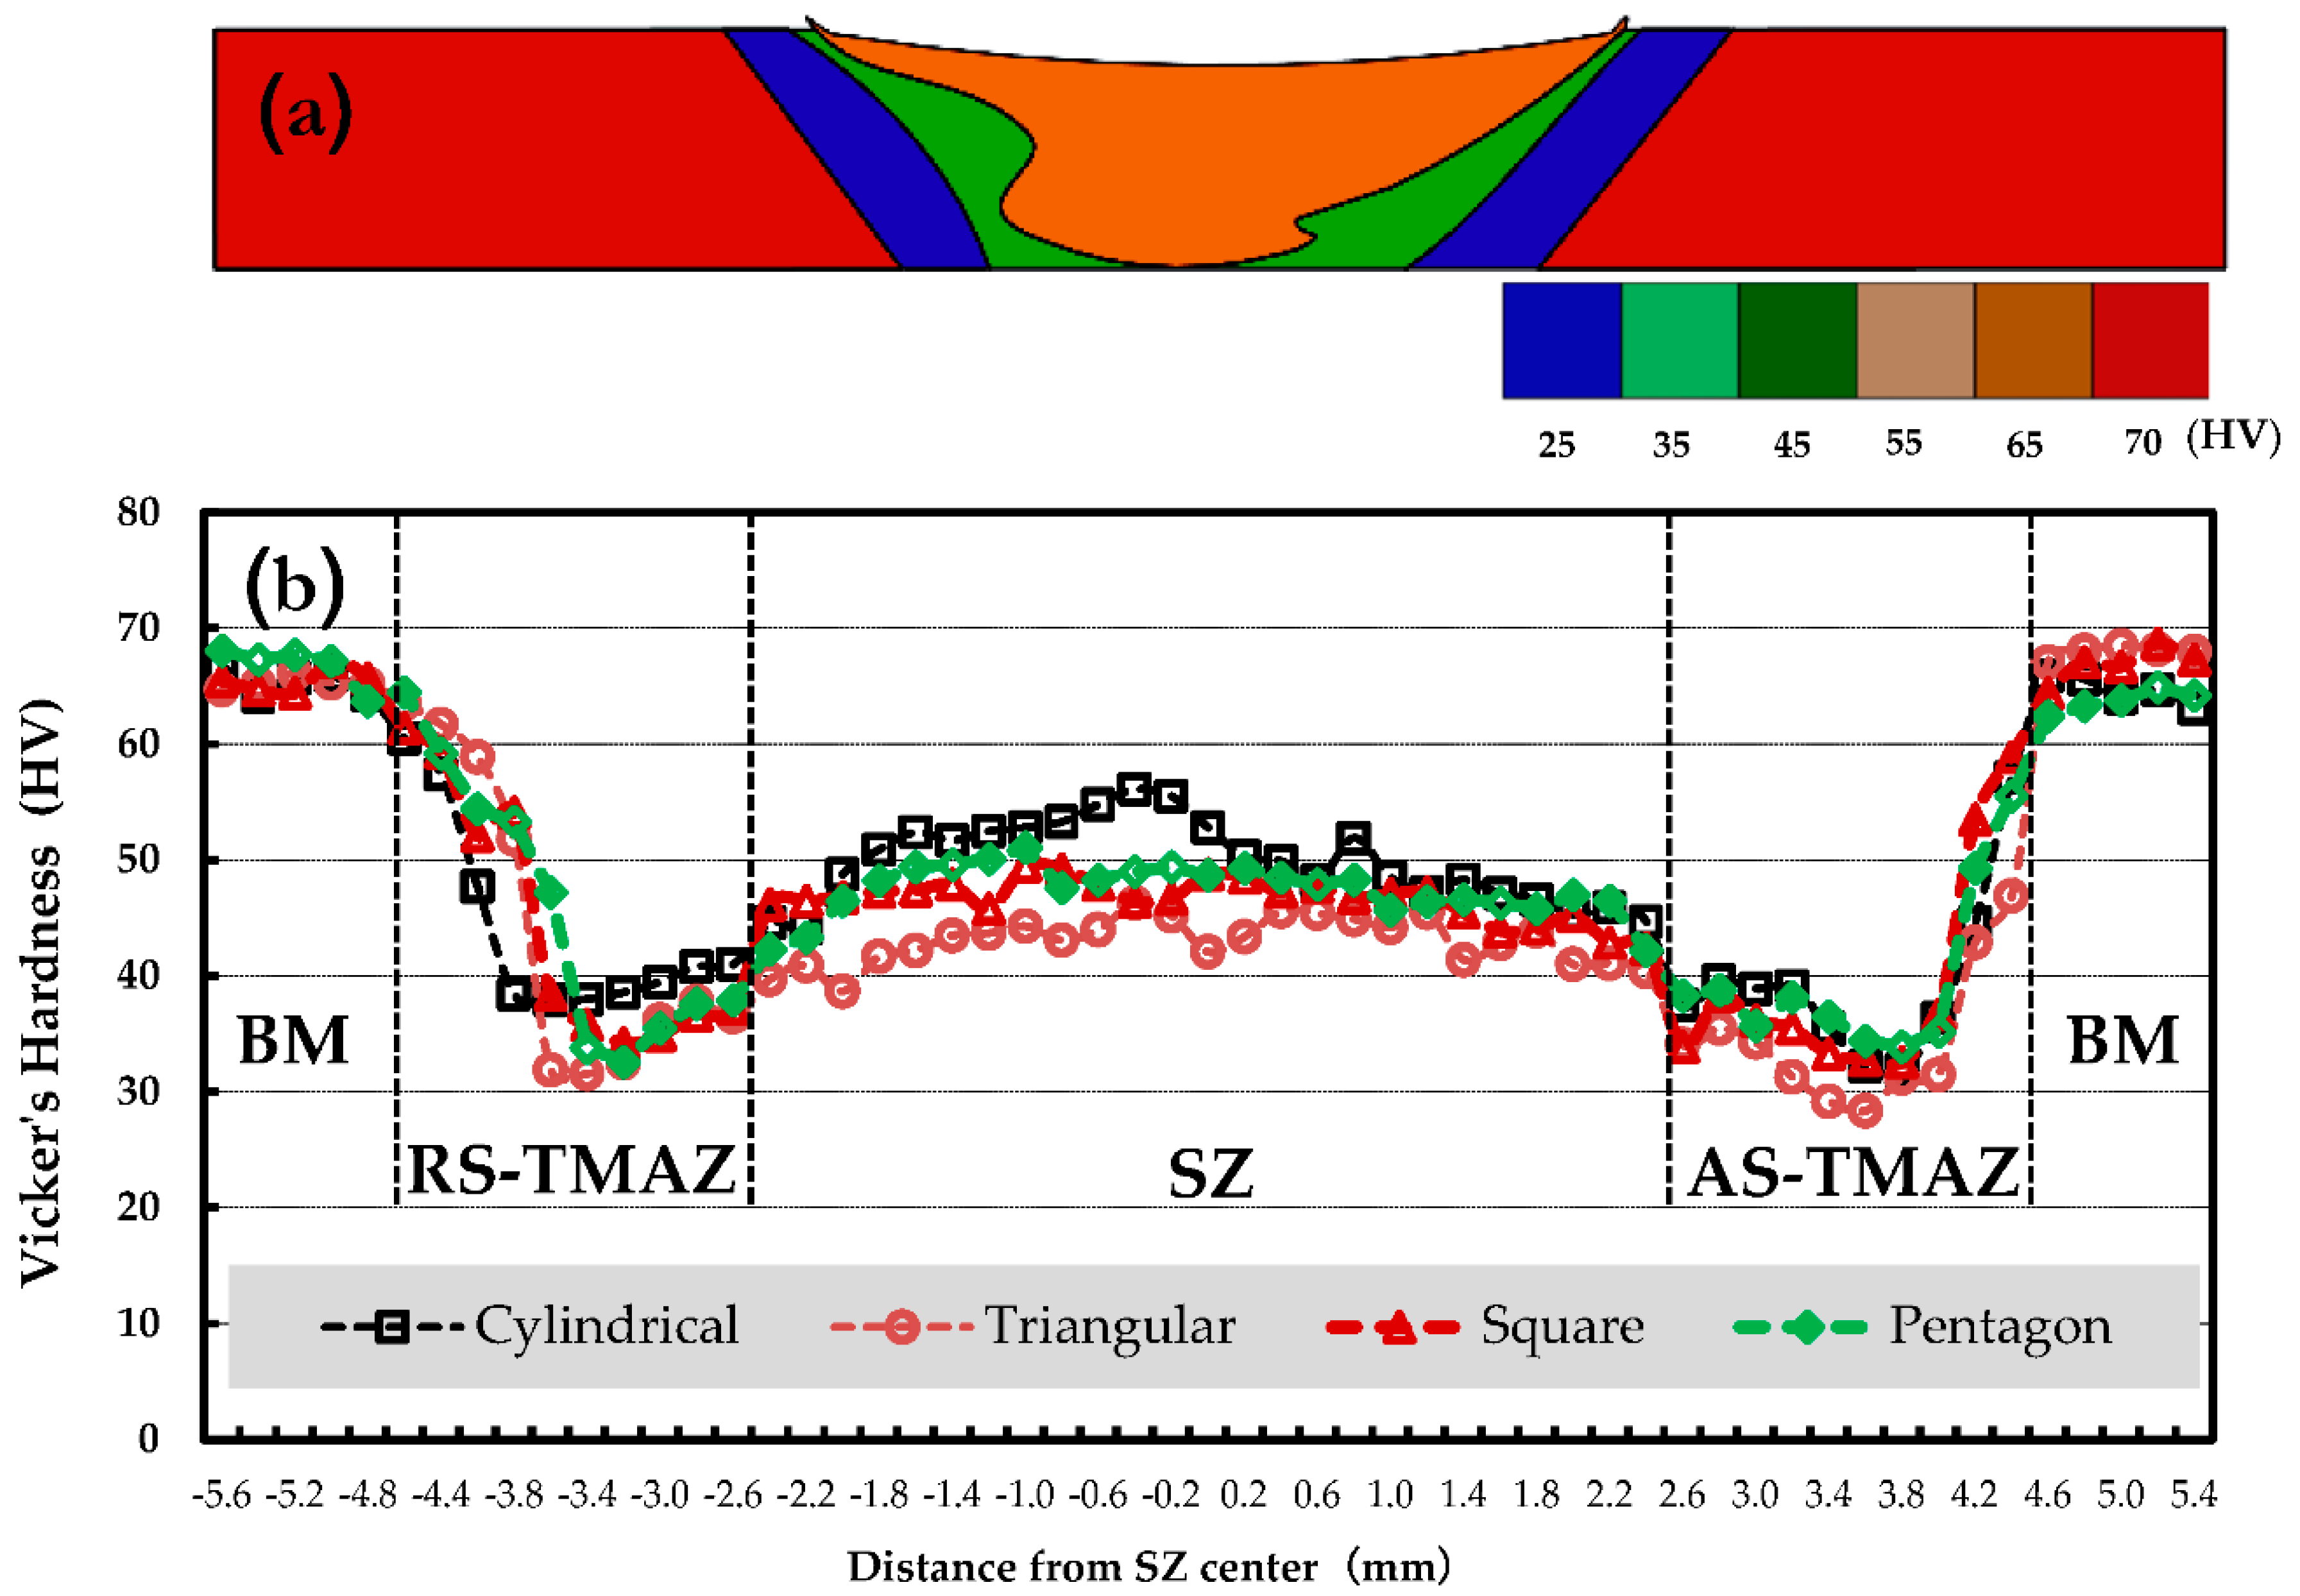
  • The hardness profiles in the welded joint are similar to “W” shape. It was also found that heat, friction force, and microstructure changes are the causes of different hardness in each area, and TMAZ shows the lowest hardness in comparison to other areas.
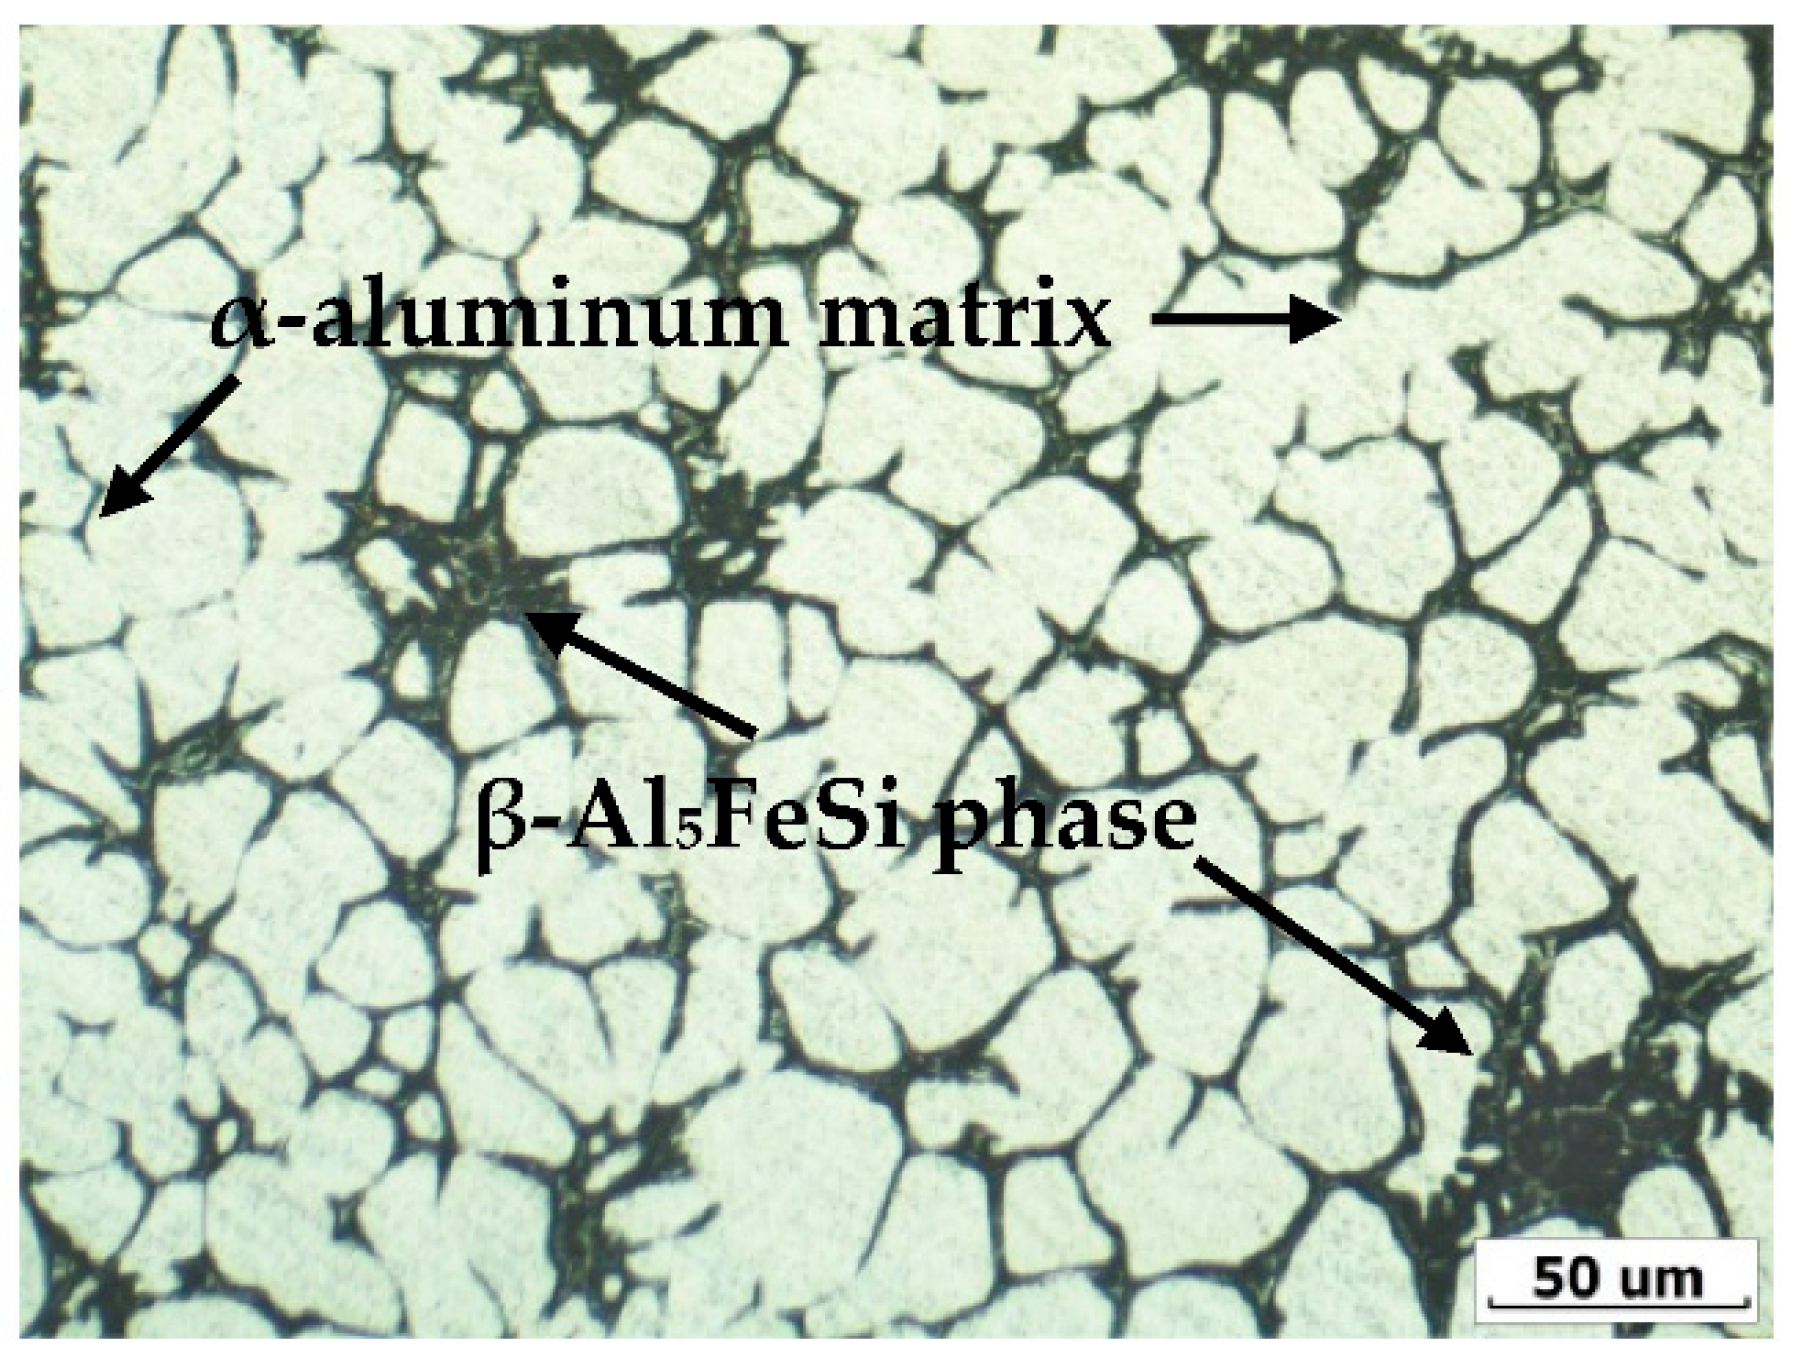
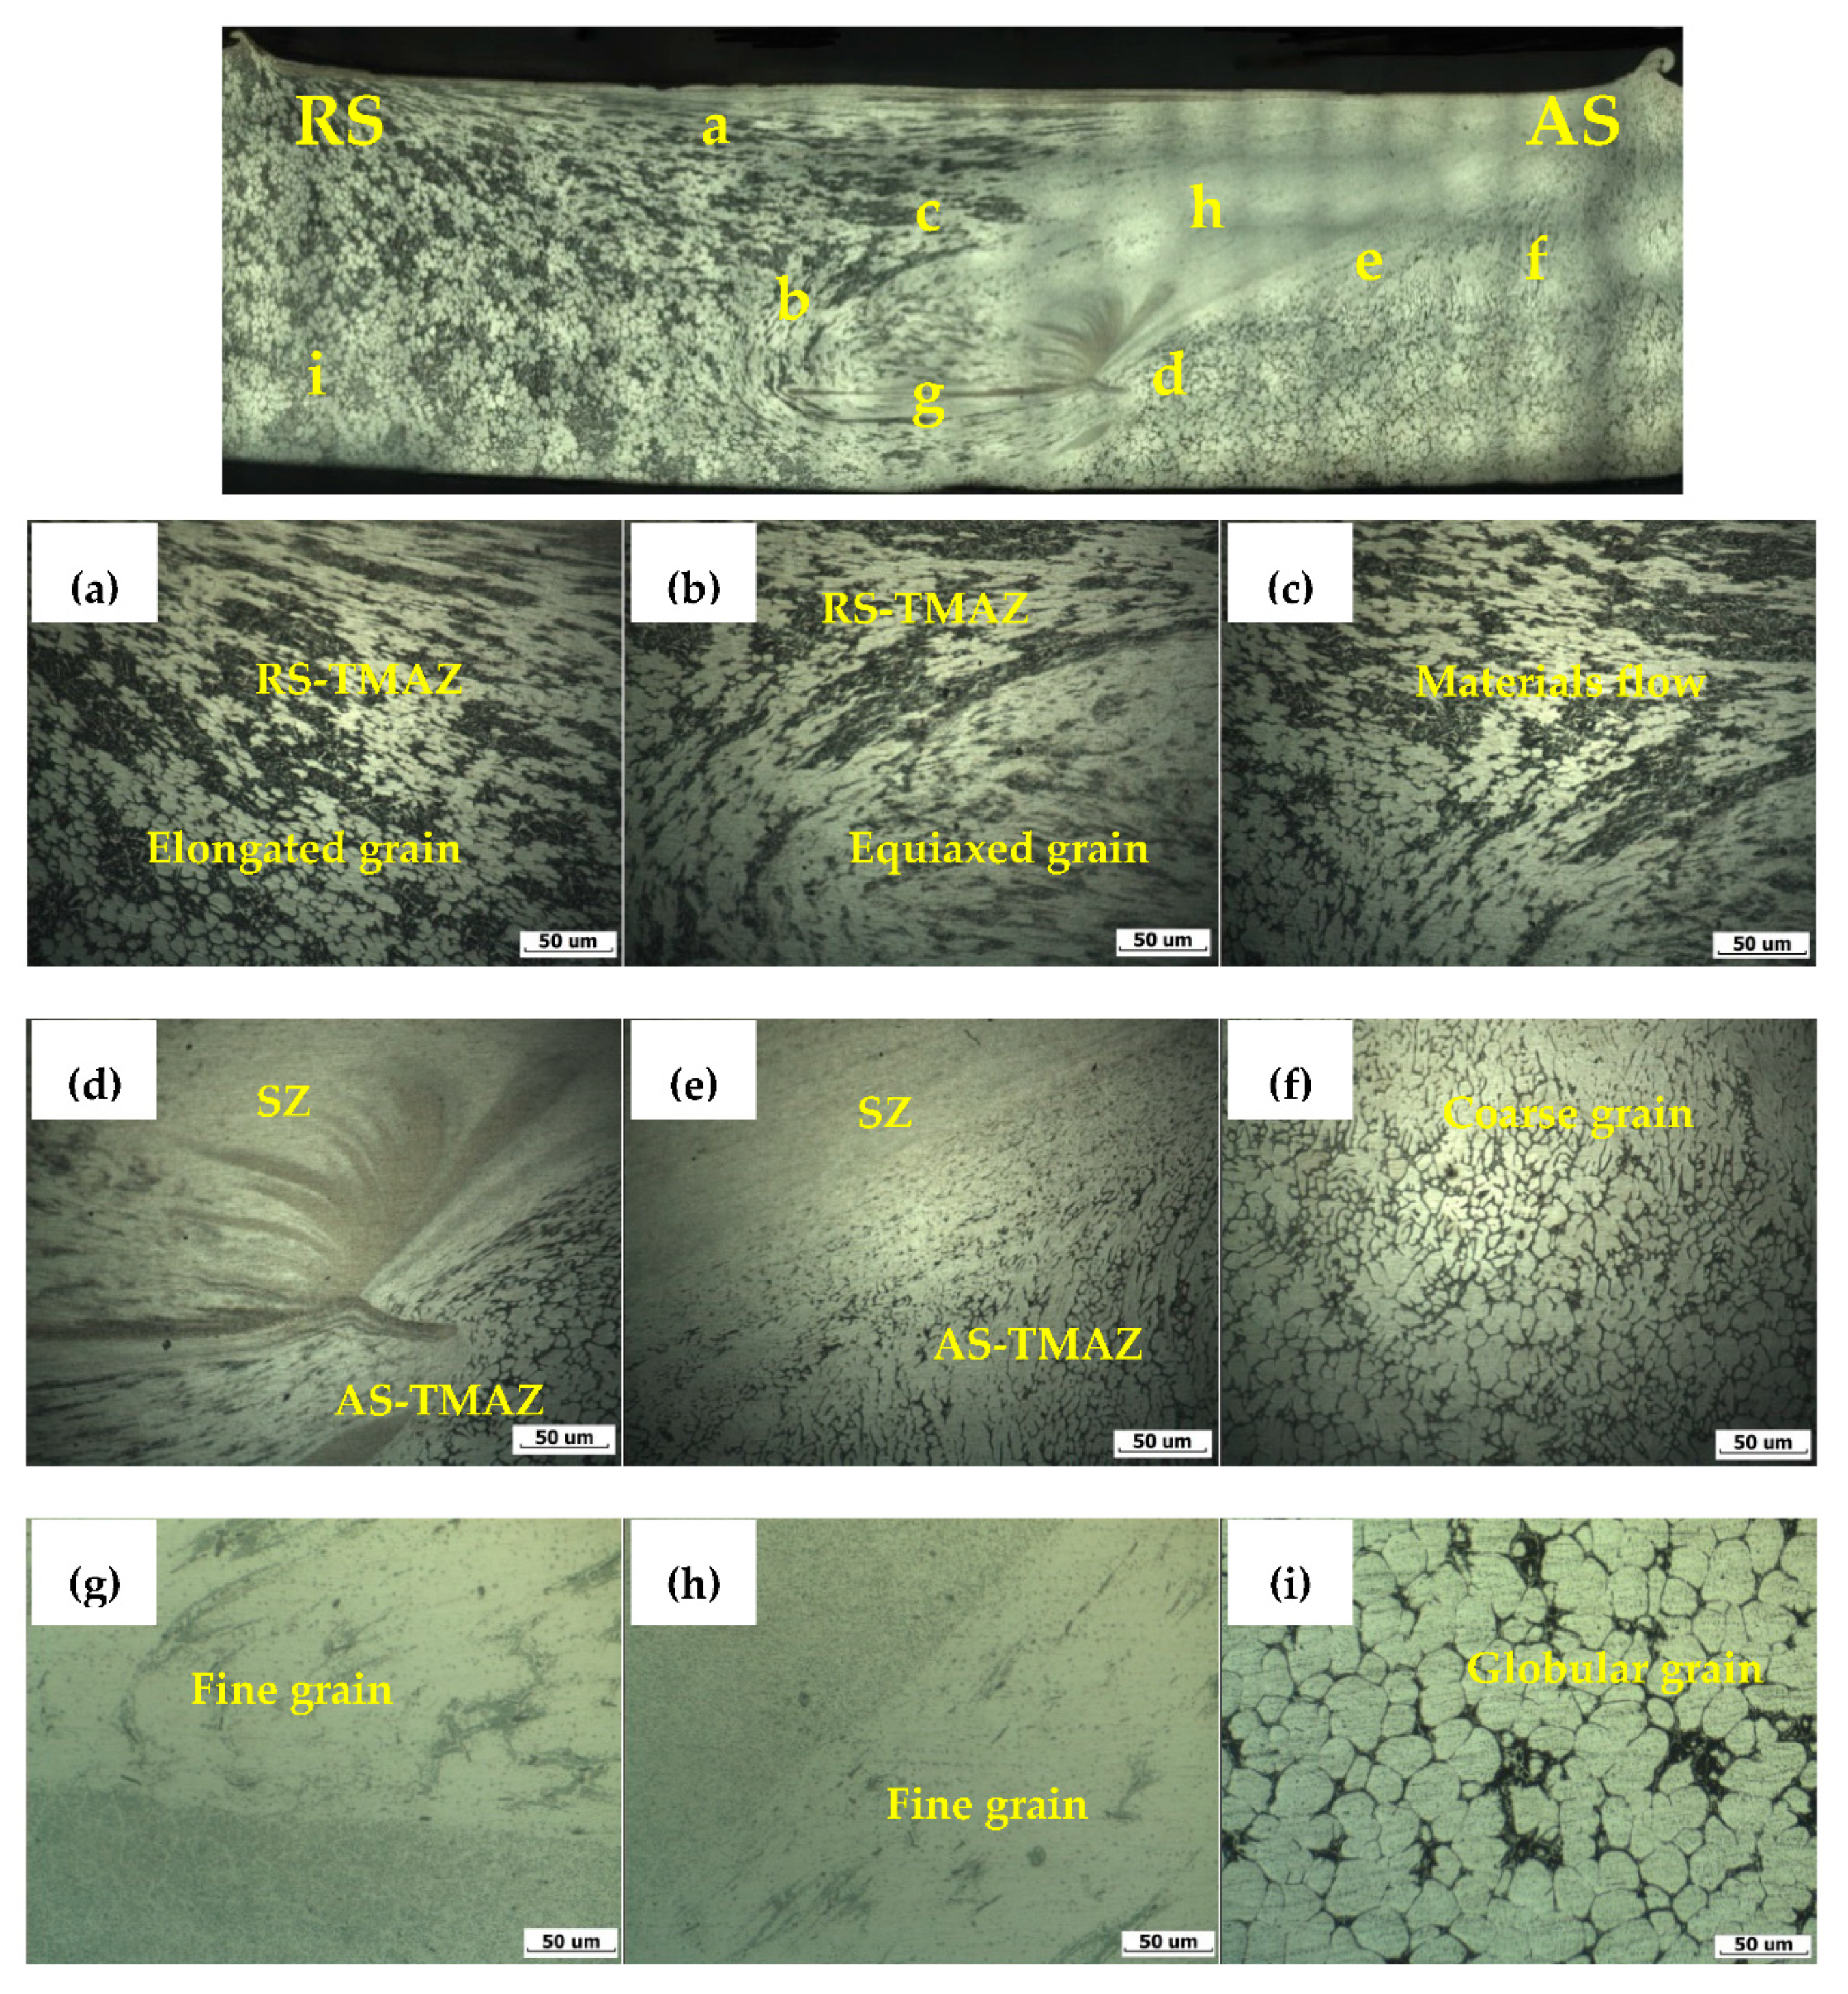
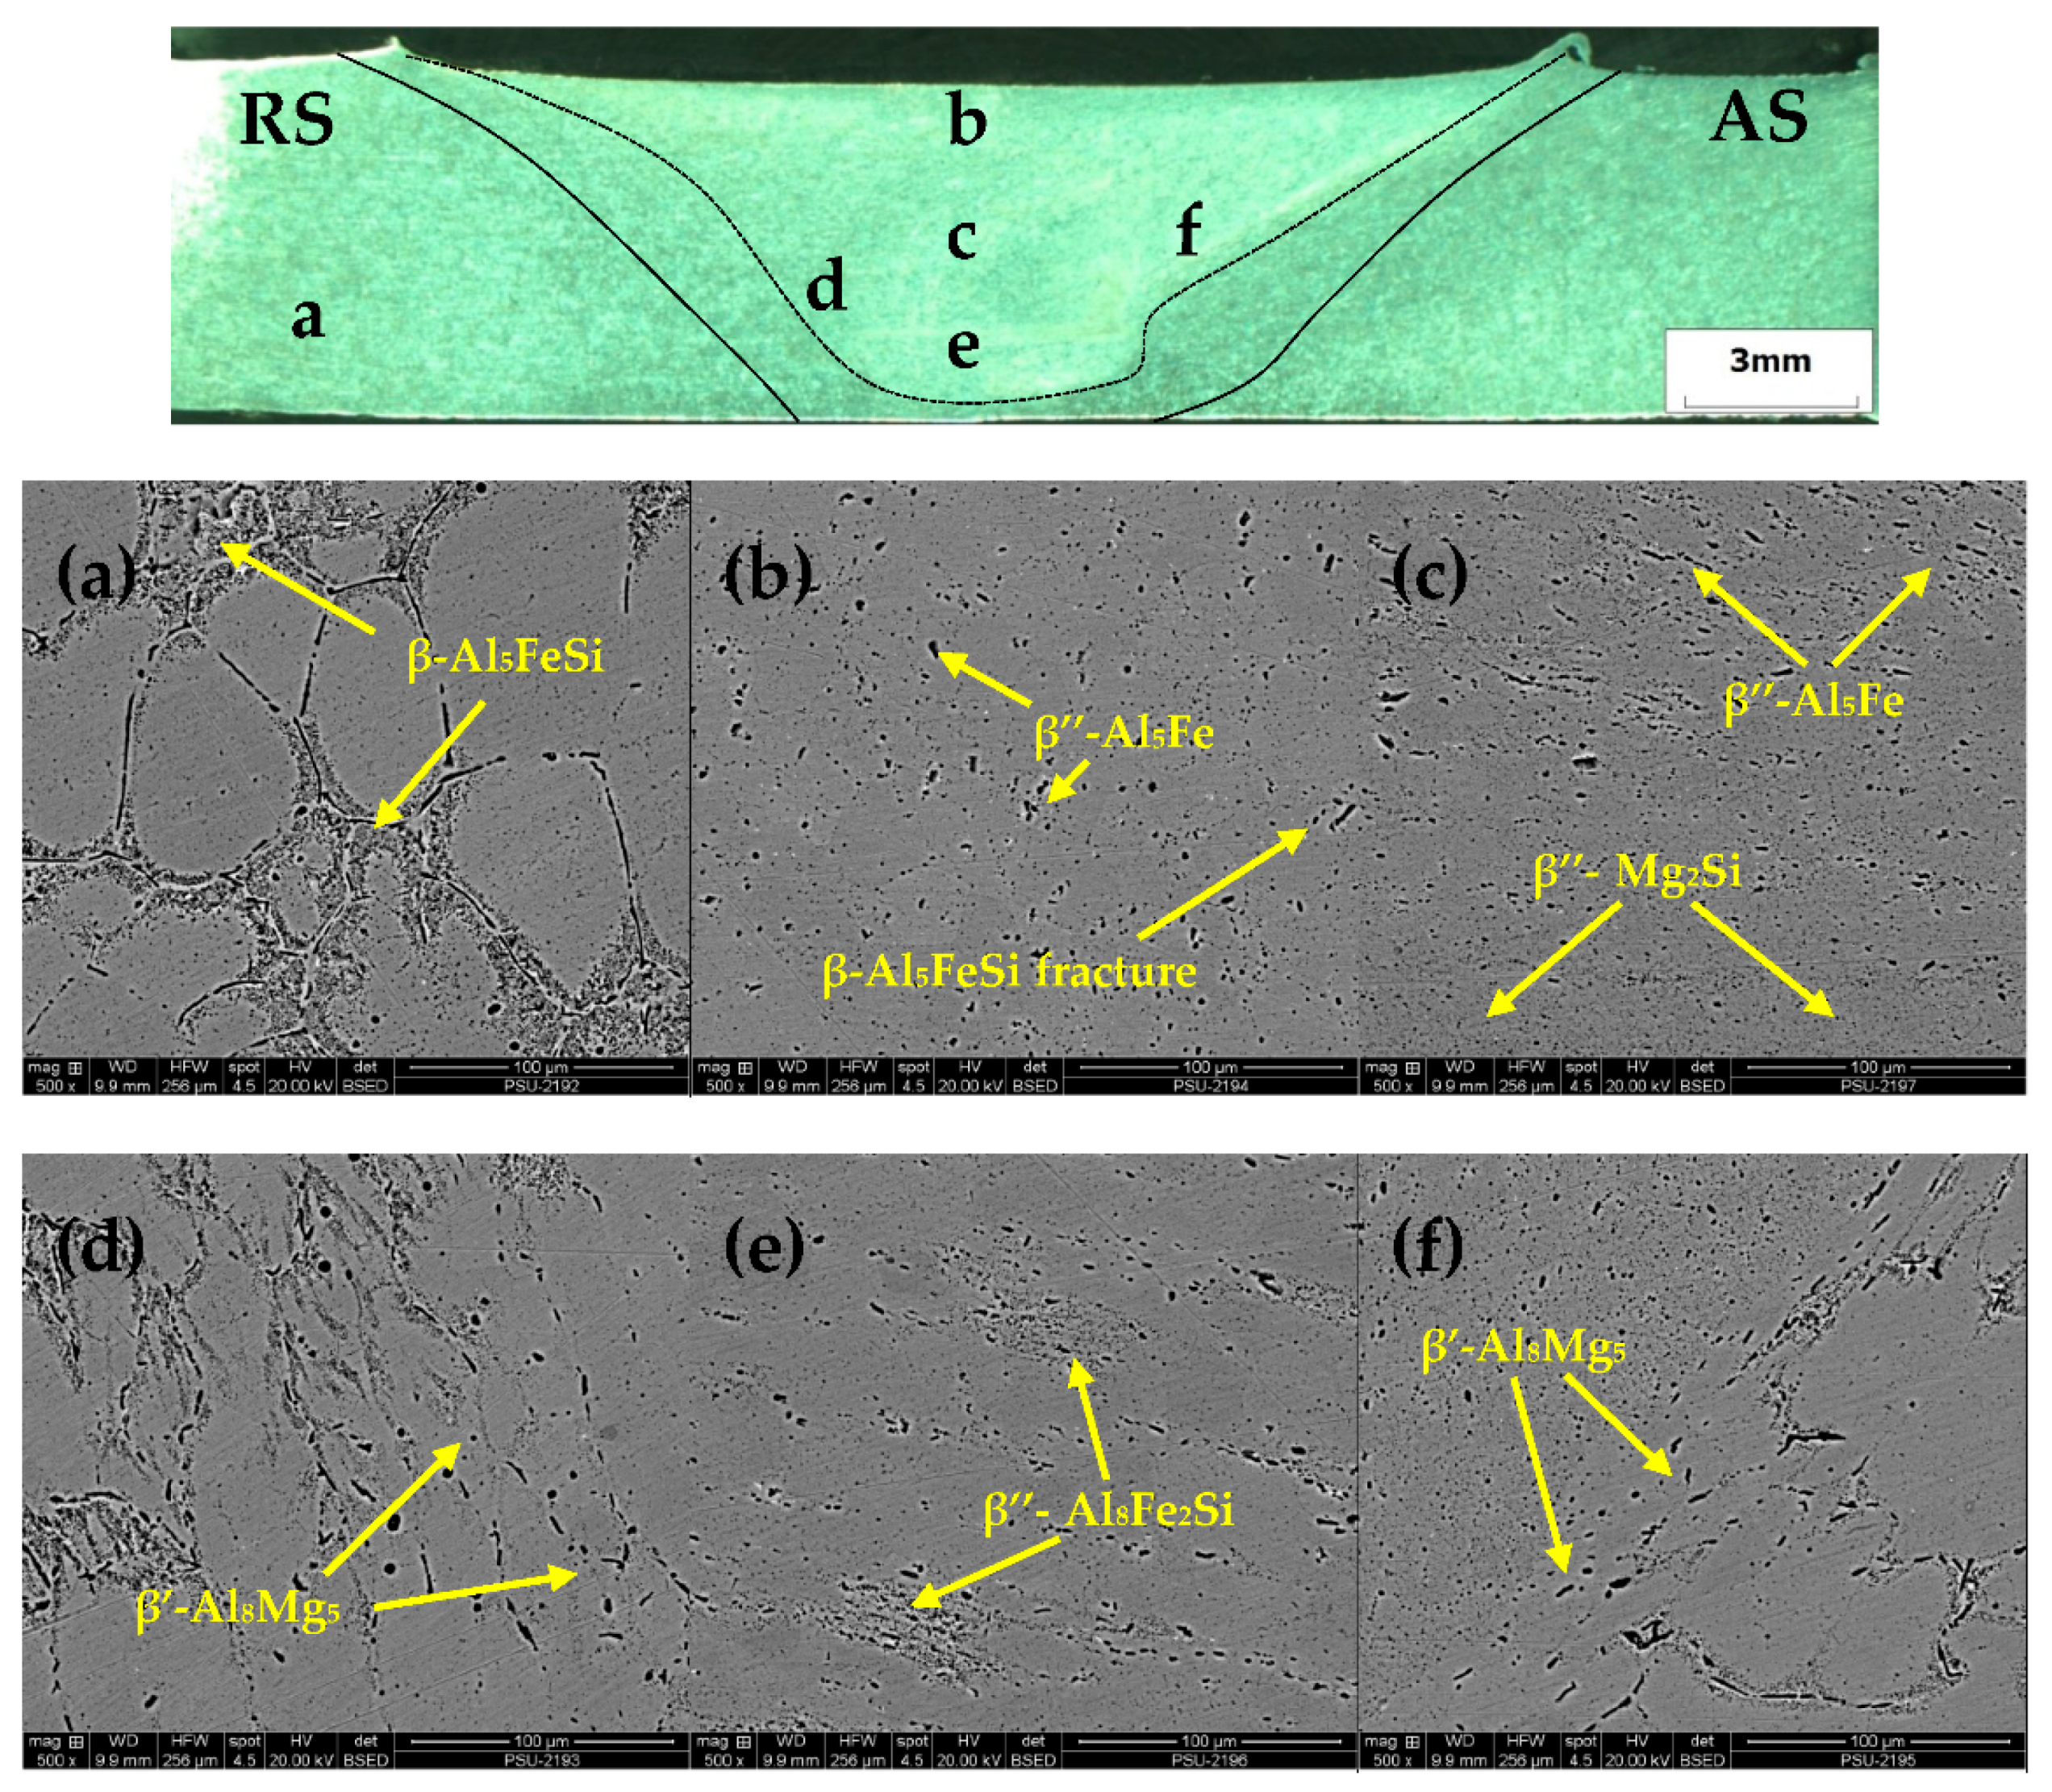
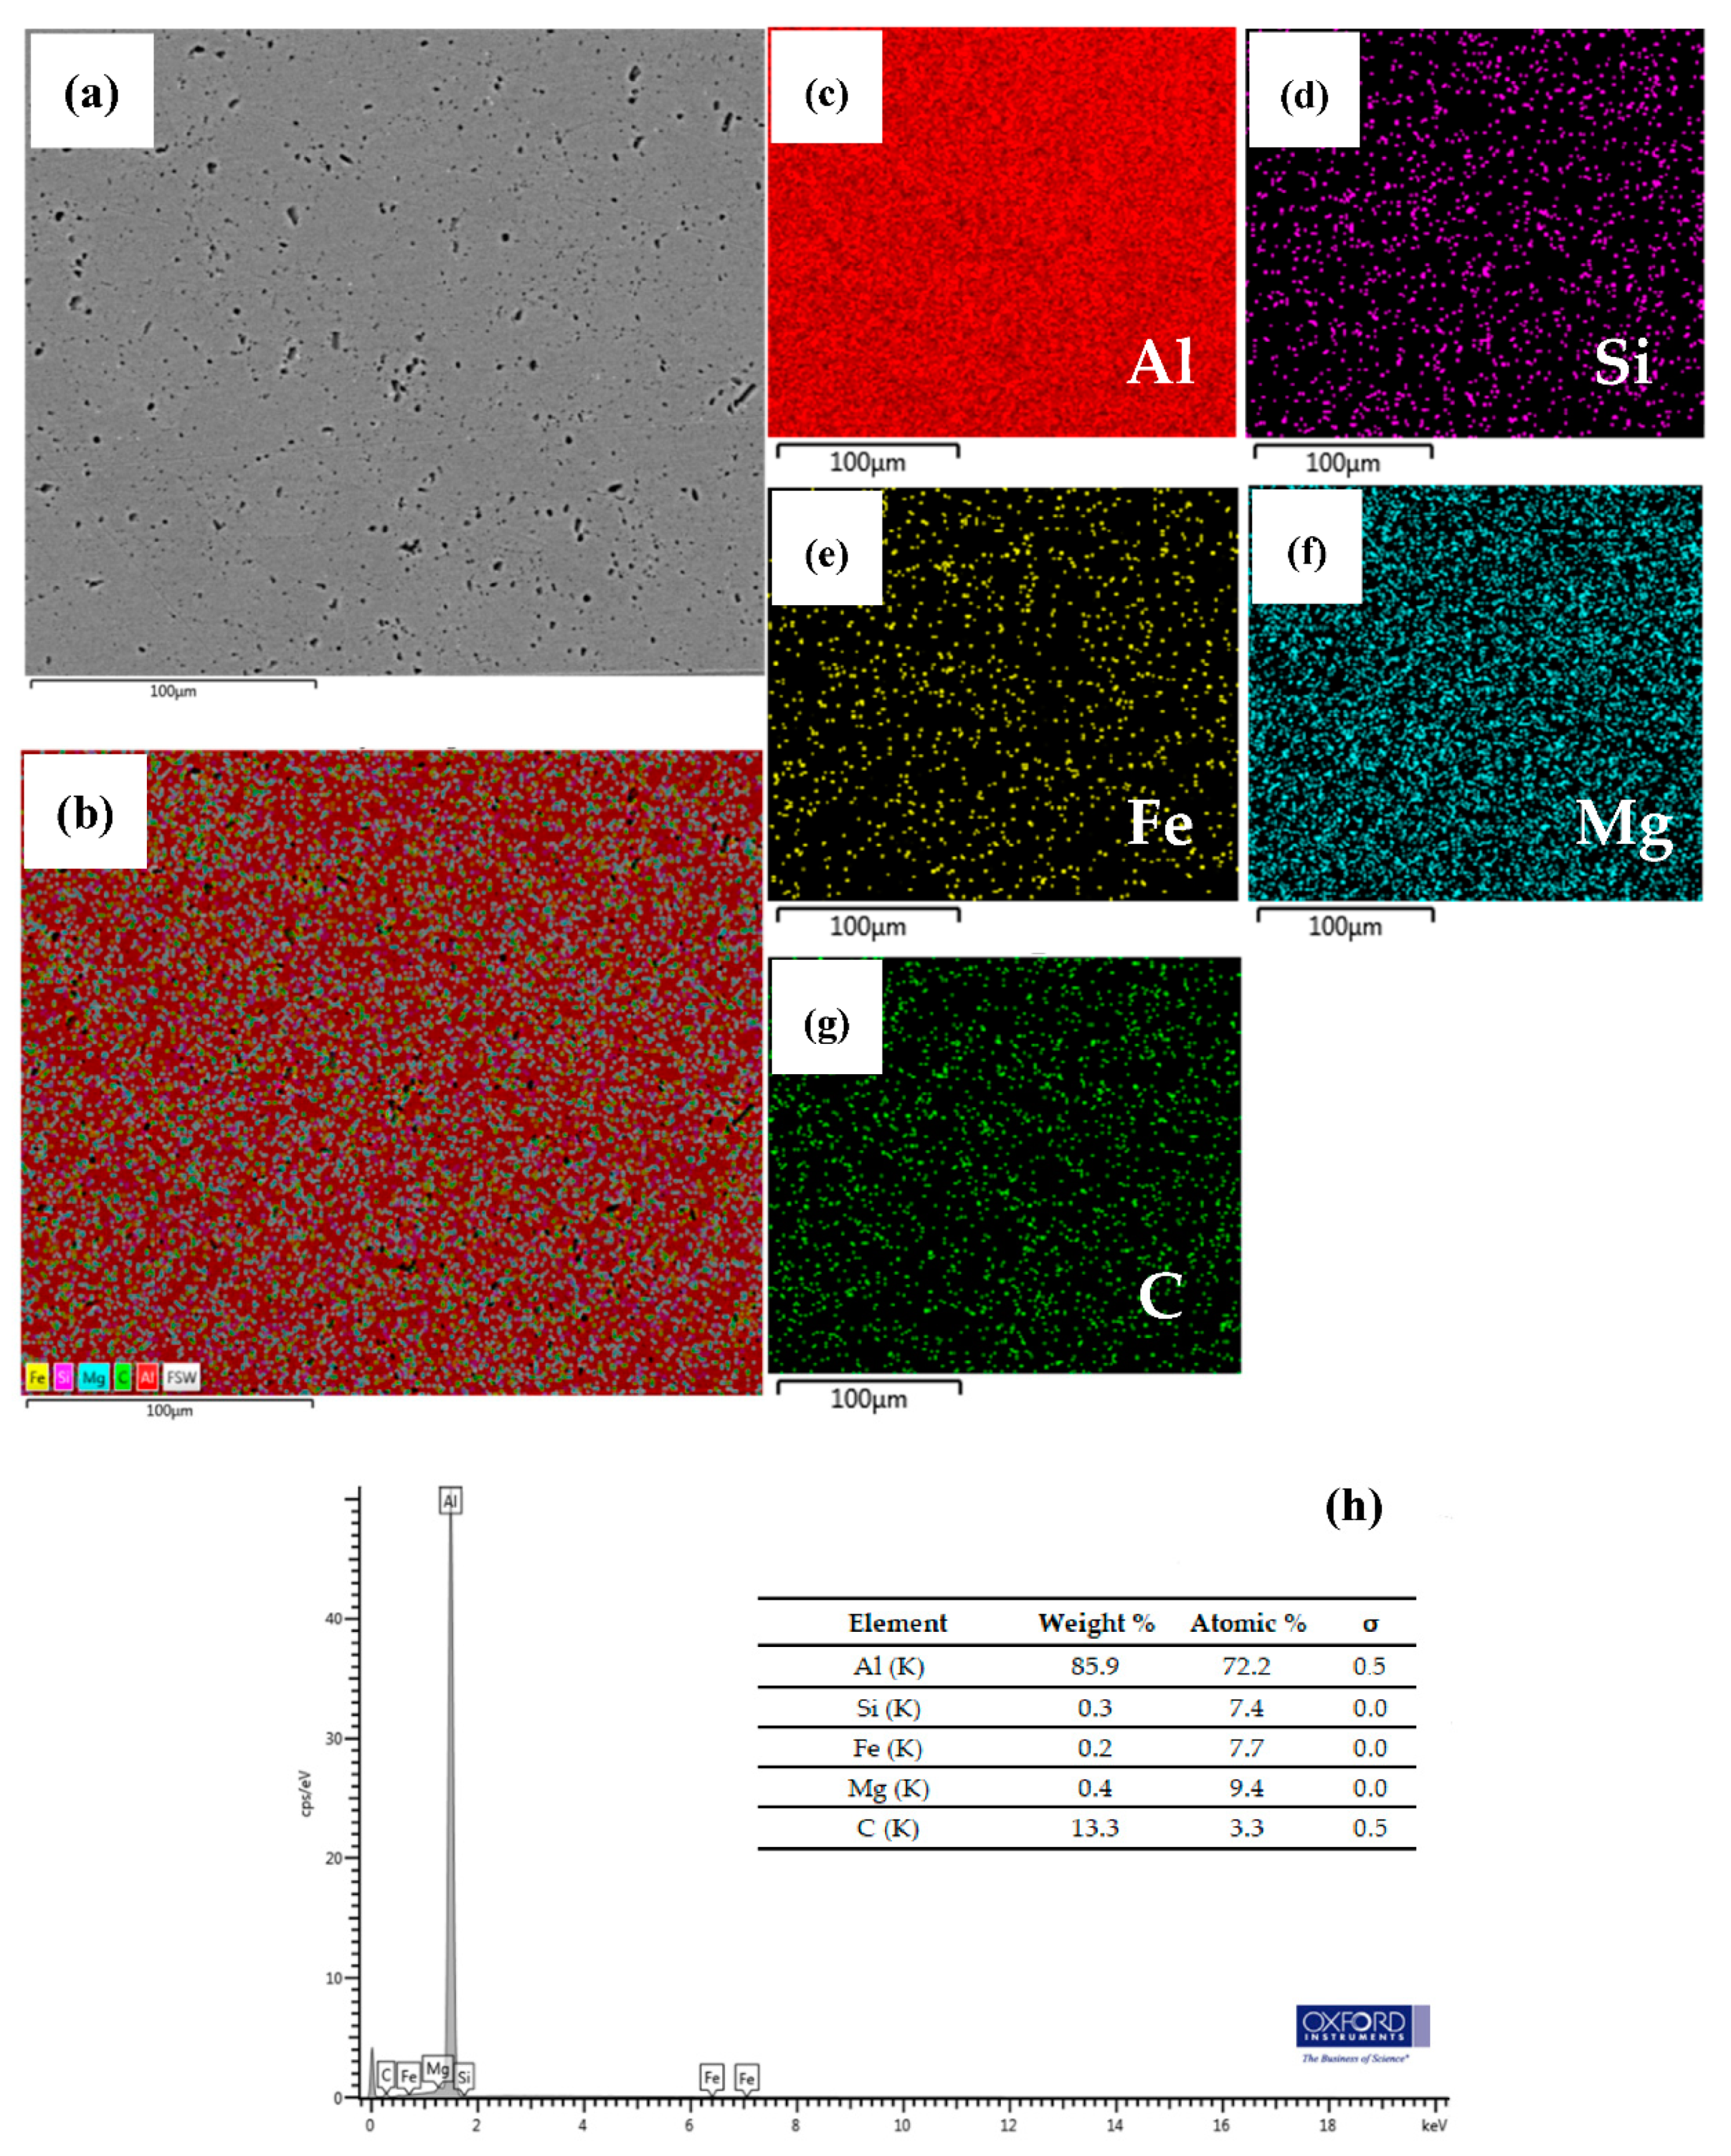
  • The globular microstructure of base SSM 6063 aluminum alloy transformation phase was formed as new recrystallization of the microstructure, which can be grouped into three types of structural changes: (1) fine-grain areas in SZ, (2) coarse-grain areas in AS-TMAZ, and (3) equiaxed-grain areas in RS-TMAZ. Moreover, the average size of the intermetallic compound β-Al5FeSi phase was around 79–114 µm. Its structure changes from a needle-like structure of base particle precipitation to β″-Al5Fe phase, which was a small particle size with an average of 8–13 µm in SZ from rod-type and elements formula of Mg2Si and Al8Fe2Si phase observed.
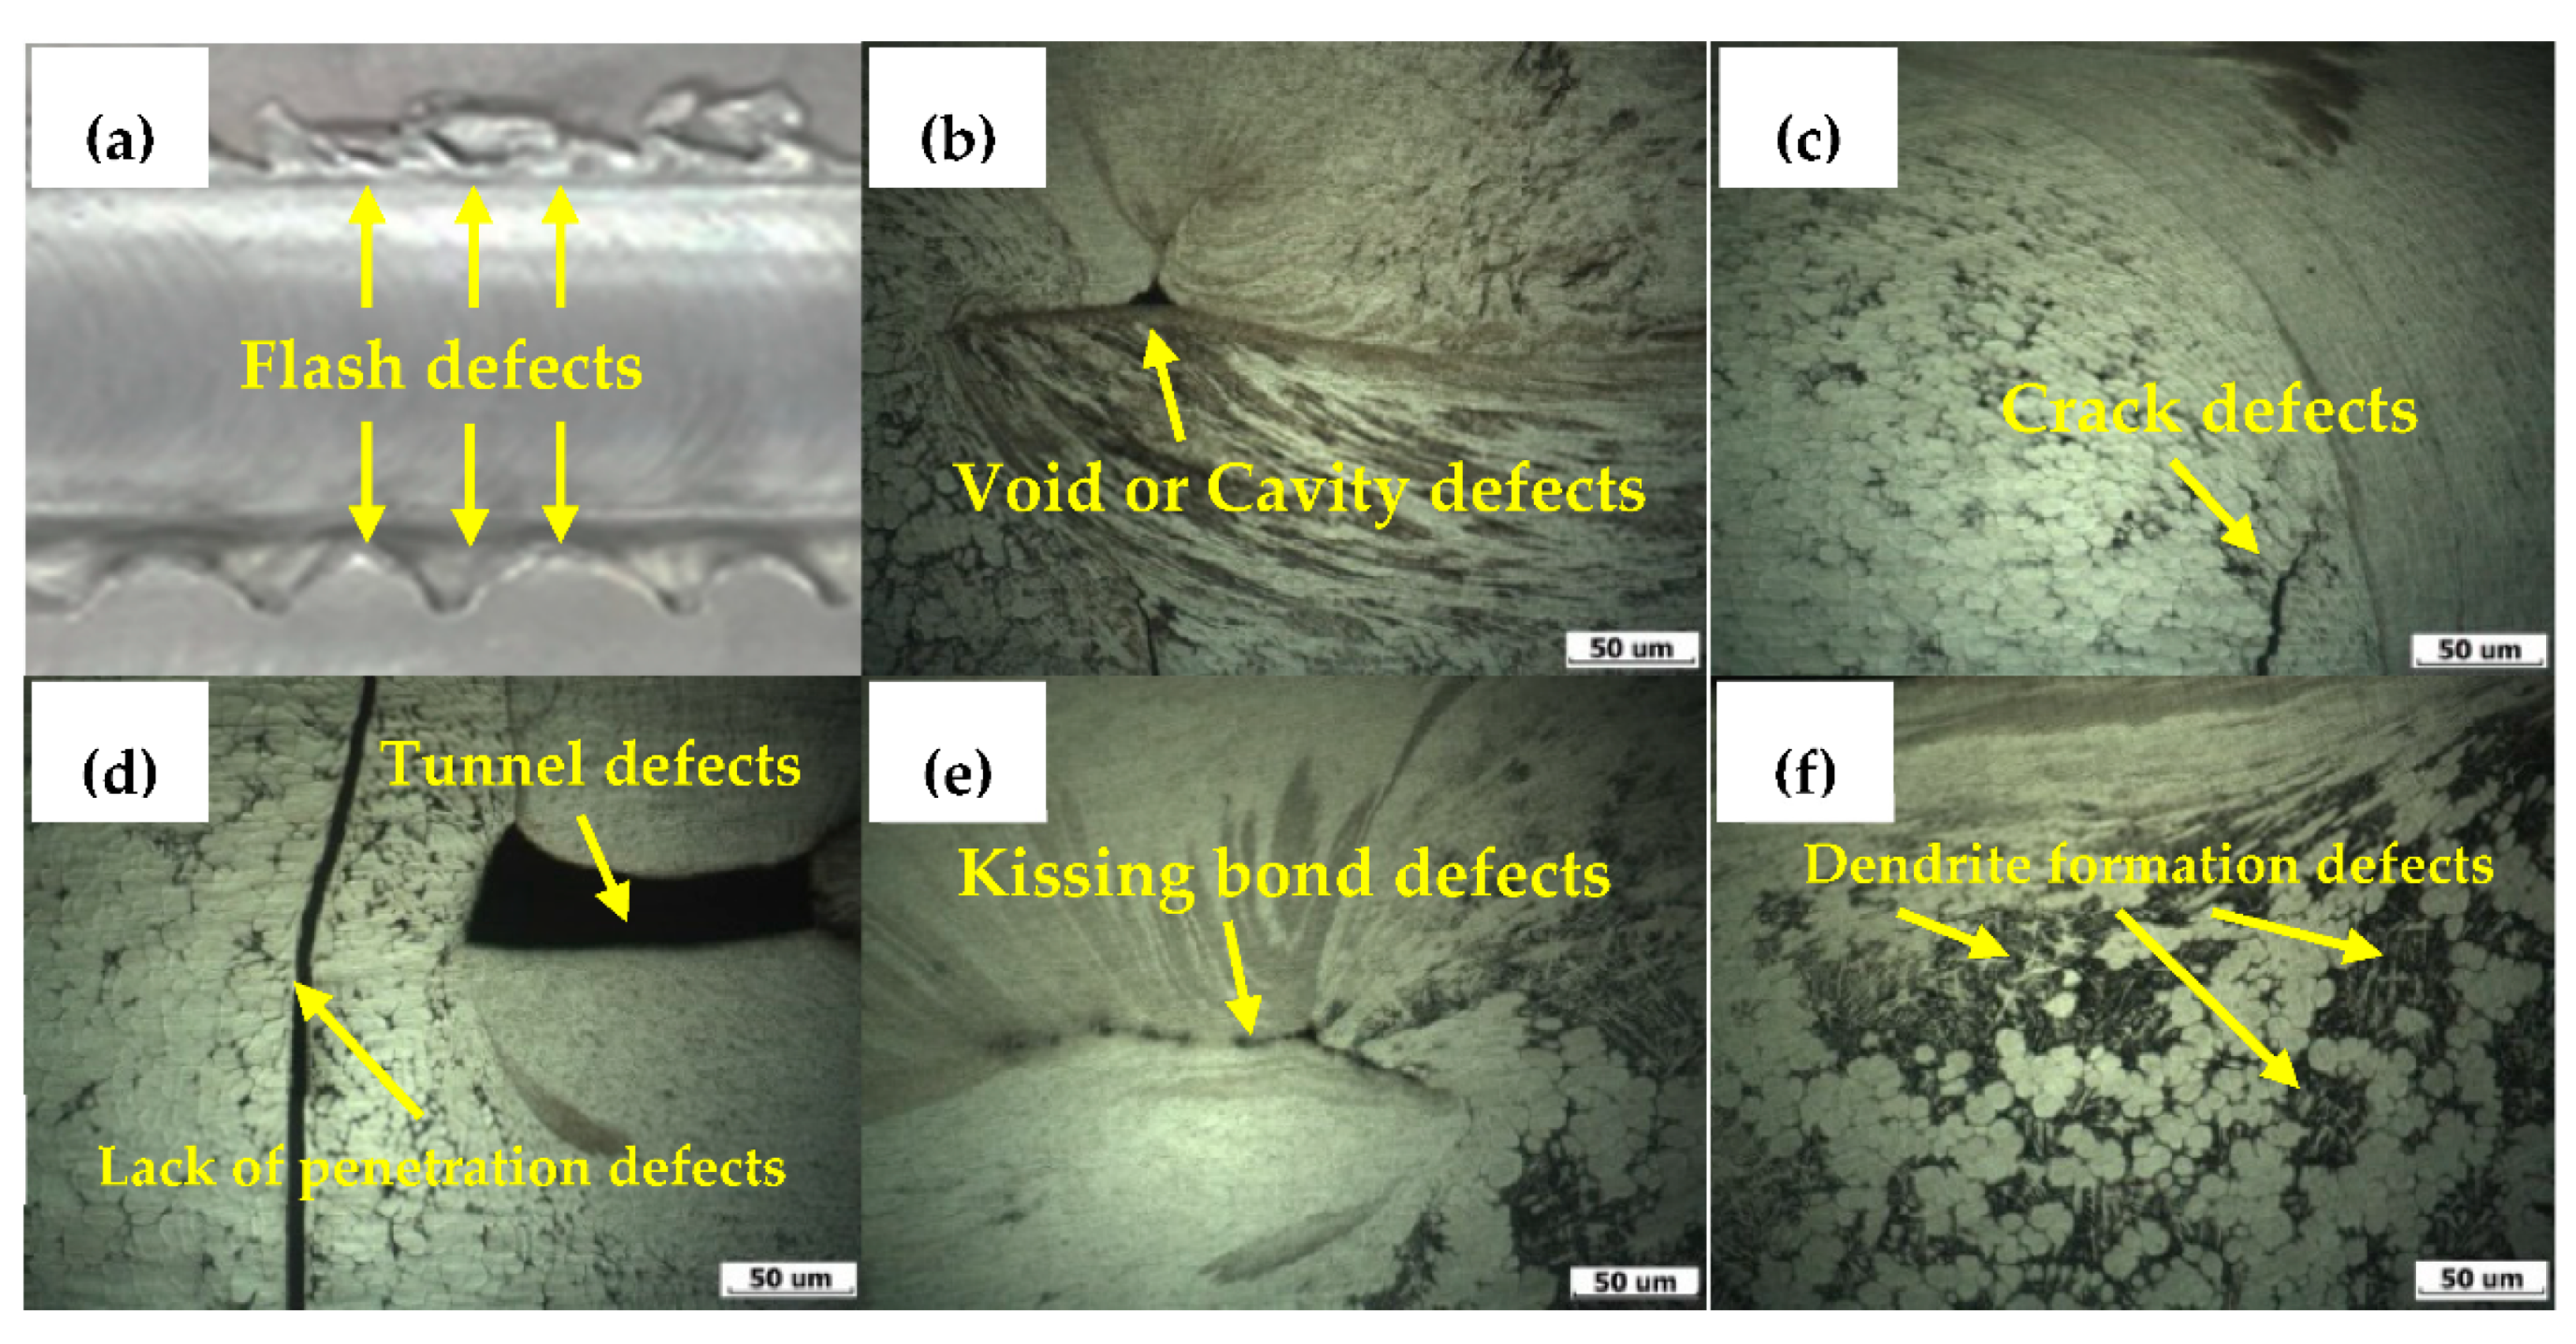
  • Six types of defects after welding found in SZ and TMAZ come from the differences in welding parameters. There are flash defects, void or cavity defects, crack defects, lack of penetration defects, tunnel defects, kissing bond defects, and dendrite formation defects. These can affect the ability of the joint efficiency.

Author Contributions

Conceptualization, K.S.; methodology, C.M.; software, C.M.; formal analysis, K.S. and C.M.; investigation, K.S.; data curation, K.S.; writing—original draft preparation, C.M. and K.S.; writing—review and editing, C.M. and K.S.; supervision, K.S.; project administration, C.M. All authors have read and agreed to the published version of the manuscript.

Funding

This research received no external funding.

Acknowledgments

The authors would like to thank Department of Industrial Engineering, Faculty of Engineering, Ubon Ratchathani University in Thailand.

Conflicts of Interest

The authors declare no conflict of interest.

Abbreviations

The following abbreviations are used in this manuscript:
SSMsemi-solid-metal
GISSMgas-induced semi-solid-metal
FSWpfriction stir welding process
ANOVAanalysis of variance
GFFDGeneral Full Factorial Design
SEMScanning Electron Microscopy
EDXenergy-dispersive X-ray spectroscopy
OMoptical microscopy
BMbase metal
SZstir zone
TMAZthermal mechanical affect zone
AS-TMAZadvancing-side thermal mechanical affect zone
RS-TMAZretracting-side thermal mechanical affect zone
ASTMAmerican Society for Testing and Materials

References

  1. Alessio, G.; Paolo, M.; Fabio, D. Review of Aluminum-To-Steel Welding Technologies for Car-Body Applications. Metals 2019, 9, 315. [Google Scholar]
  2. Wannasin, J.; Janudom, S.; Rattanochaikul, T.; Canyook, R.; Burapa, R.; Chucheep, T.; Thanabumrungkul, S. Research and development of gas induced semi-solid process for industrial applications. Trans. Nonferrous Met. Soc. China 2010, 20, s1010–s1015. [Google Scholar] [CrossRef]
  3. Richter-Trummer, V.; Tavares, S.M.A.; Moreira, P.M.G.P.; Castro, P.M.S.T. Friction stir welding of aluminium alloys and damage tolerance of integral monolithic structures. Mechanics 2008, 73, 18–22. [Google Scholar]
  4. Ma, Z.Y.; Feng, A.H.; Chen, D.L.; Shen, J. Recent advance in friction stir welding/processing in aluminum alloys: Microstructure evaluation and mechanical properties. Crit. Rev. Solid State Mater. Sci. 2018, 43, 269–333. [Google Scholar] [CrossRef]
  5. Mishra, R.S.; Ma, Z.Y. Friction stir welding and processing. Mater Sci. Eng. R 2005, 50, 78. [Google Scholar] [CrossRef]
  6. Anand, R.; Sridhar, V.G. Studies on process parameters and tool geometry selecting aspects of friction stir welding. Mater. Today Proc. 2020, 27, 576–583. [Google Scholar] [CrossRef]
  7. Virendra, P.S.; Surendra, K.P.; Alok, R.; Basil, K. Recent research progress in solid state friction-stir welding of aluminum–magnesium alloys: A critical review. J. Mater. Res. Technol. 2020, 9, 6217–6256. [Google Scholar]
  8. Morteza, S.; Abbas, M.; Jalal, K.; Jerzy, S.A. Characterization and mechanical behavior of AISI316L/Incoloy825 dissimilar welds processed by friction stir welding. J. Manuf. Process. 2020, 55, 66–77. [Google Scholar]
  9. Meengam, C.; Chainarong, S.; Muangjunburee, P. Friction Welding of Semi-Solid Metal 7075 Aluminum Alloy. Mater. Today Proc. 2017, 4, 1303–1311. [Google Scholar] [CrossRef]
  10. Hua, J.; Yunlai, D.; Hongyong, X.; Sen, L.; Wenquan, W.; Honggang, D. The mechanism of rotational and non-rotational shoulder affecting the microstructure and mechanical properties of Al-Mg-Si alloy friction stir welded joint. Mater. Des. 2020, 192, 108729. [Google Scholar]
  11. Mir, M.H.; Hassan, B.T.; Nima, J. Thermal optimization of friction stir welding with simultaneous cooling using inverse approach. Appl. Therm. Eng. 2016, 108, 751–763. [Google Scholar]
  12. Moustafa, B.; Nadhir, L.; Amina, M.; Abdelhakim, S.; Mouloud, A. Friction stir welding process improvement through coupling an optimization procedure and three-dimensional transient heat transfer numerical analysis. J. Manuf. Process. 2018, 34, 566–578. [Google Scholar]
  13. Li, G.H.; Zhou, L.; Luo, S.F.; Dong, F.B.; Guo, N. Quality Improvement of Bobbin Tool Friction Stir Welds in Mg-Zn-Zr Alloy by Adjusting tool geometry. J. Mater. Process. Technol. 2020, 282, 14. [Google Scholar] [CrossRef]
  14. Pankul, G.; Arshad, N.S.; Noor, Z.K.; Mohd, A.H.; Zahid, A.K.; Mustufa, H.A.; Abdulrahman, A.A. Investigation on the Effect of Tool Pin Profiles on Mechanical and Microstructural Properties of Friction Stir Butt and Scarf Welded Aluminum Alloy 6063. Metals 2018, 8, 74. [Google Scholar]
  15. Joaquín, M.P.; Hernán, G.S. Tool geometry optimization in friction stir spot welding of Al-steel joints. J. Manuf. Process. 2017, 26, 142–154. [Google Scholar]
  16. Donatus, U.; da Silva, R.M.P.; de Sousa Araujo, J.V.; Milagre, M.X.; de Abreu, C.P.; Machado, C.D.S.C.; Costa, I. Macro and microgalvanic interactions in friction stir weldment of AA2198-T851 alloy. J. Mater. Res. Technol. 2019, 8, 6209–6222. [Google Scholar] [CrossRef]
  17. Anumat, S.; Vedavyas, T.; Indrajit, C.; Rajiv, S.M. Microstructure, mechanical properties and strengthening mechanisms of friction stir welded Kanthal APMT™ steel. J. Nucl. Mater. 2018, 509, 435–444. [Google Scholar]
  18. Kittima, S.; Yoshiharu, M.; Yukio, M.; Nobushiro, S. Fatigue Strength Estimation Based on Local Mechanical Properties for Aluminum Alloy FSW Joints. Metals 2017, 10, 186. [Google Scholar]
  19. Bayazid, S.M.; Farhangi, H.; Ghahramani, A. Investigation of friction stir welding parameters of 6063-7075 Aluminum alloys by Taguchi method. Mater. Today Proc. 2015, 11, 6–11. [Google Scholar] [CrossRef] [Green Version]
  20. Ahsok, K.; Murukan, N. Optimization of Friction Stir Welding Process Parameters to Maximize Tensile Strength of Stir Cast AA6061-T6/AINp Composite. Mater. Des. 2014, 57, 383–393. [Google Scholar]
  21. Palanivel, R.; Laubscher, R.F.; Vigneshwaran, S. Prediction and optimization of the mechanical properties of dissimilar friction stir welding of aluminum alloys using design of experiments. Proc. Inst. Mech. Eng. B. J. Eng. Manuf. 2016, 232, 1384–1394. [Google Scholar] [CrossRef]
  22. Wannasin, J.; Canyook, R.; Wisutmethangoon, S.; Flemings, M.C. Grain refinement behavior of an aluminum alloy by inoculation and dynamic nucleation. Acta Mater. 2013, 61, 3897–3903. [Google Scholar] [CrossRef]
  23. Kumar, N.; Mishra, R.S.; Huskamp, C.S.; Sankaran, K.K. Microstructure and mechanical behavior of friction stir processed ultrafine grained Al–Mg–Sc alloy. Mater. Sci. Eng. A 2011, 258, 5883–5887. [Google Scholar] [CrossRef]
  24. Noor, Z.K.; Zahid, A.K.; Arshad, N.S. Effect of shoulder diameter to pin diameter (D/d) ratio on tensile strength of friction stir welded 6063 aluminum alloy. Mater. Today Proc. 2015, 2, 1450–1457. [Google Scholar]
  25. Wang, D.; Xiao, B.L.; Wang, Q.Z.; Ma, Z.Y. Evolution of the Microstructure and strength in the nugget zone of friction stir welded SiCp/Al-Cu-Mg composite. J. Mater. Sci. Technol. 2014, 30, 54–60. [Google Scholar] [CrossRef]
  26. Dinaharan, I.; Murukan, N.; Parameswaran, S. Development and Empirical Relationship to Predict the influence of Process Parameters on Tensile Strength of Friction Stir Welded AA6061/0-10 wt% ZrB2 in Situ Composite. Trans. Indian Inst. Met. 2012, 65, 70–159. [Google Scholar] [CrossRef]
  27. Montgomery, D.C. Designing and Analysis of Experiments, 8th ed.; John Wiley & Sons Inc.: New York, NY, USA, 2000; pp. 24–146. [Google Scholar]
  28. Seetharaman, R.; Seeman, M.; Kanagarajan, D.; Sivaraj, P.; Saravanan, I. A statistical evaluation of the corrosion behaviour of friction stir welded AA2024 aluminum alloy. Mater. Today Proc. 2020, 22, 673–680. [Google Scholar] [CrossRef]
  29. Box, G.E.P.; Draper, N.R. Empirical Model-Building and Response Surface, 1st ed.; John Wiley & Sons Inc.: New York, NY, USA, 1987; pp. 52–189. [Google Scholar]
  30. Ryan, T.P. Modern Engineering Statistics, 1st ed.; John Wiley & Sons Inc.: New York, NY, USA, 2007; pp. 140–189. [Google Scholar]
  31. Salih, O.S.; Ou, H.; Wei, X.G.; Sun, W. Microstructure and mechanical properties of friction stir welded AA6092/SiC metal matrix composite. Mater. Sci. Eng. A 2019, 742, 78–88. [Google Scholar] [CrossRef]
  32. Zhanga, C.; Cui, L.; Liua, Y.; Liua, C.; Li, H. Microstructures and mechanical properties of friction stir welds on 9% Cr reduced activation ferritic/martensitic steel. J. Mater. Sci. Technol. 2018, 34, 756–766. [Google Scholar] [CrossRef]
  33. Yutaka, S.S.; Hiroyuki, K.; Masatoshi, E.; Shigetoshi, J. Microstructural Evolution of 6063 Aluminum during Friction Stir Welding. Metall. Mater. Trans. A 1999, 30A, 1999–2431. [Google Scholar]
  34. Zhang, X.X.; Wang, D.; Xiao, B.L. Enhanced multiscale modeling of macroscopic and microscopic residual stresses evolution during multi-thermo-mechanical processes. Mater. Des. 2017, 115, 364–378. [Google Scholar] [CrossRef]
  35. Moradi, M.M.; Jamshidi, A.H.; Jamaati, R.; Amirkhanlou, S.; Ji, S. Effect of SiC nanoparticles on the microstructure and texture of friction stir welded AA2024/AA6061. Mater. Charact. 2019, 152, 169–179. [Google Scholar] [CrossRef]
  36. Parikh, V.K.; Badgujar, A.D.; Ghetiya, N.D. Joining of metal matrix composites using friction stir welding: A review. Mater. Manuf. Process. 2018, 34, 123–146. [Google Scholar] [CrossRef]
  37. Zhou, L.; Li, G.H.; Zha, G.D.; Shu, F.Y.; Liu, H.J.; Feng, J.C. Effect of rotation speed on microstructure and mechanical properties of bobbin tool friction stir welded AZ61 magnesium alloy. Sci. Technol. Weld Join. 2018, 23, 596–605. [Google Scholar] [CrossRef]
  38. Heidarzadeh, A.; Saeid, T.; Klemm, V.; Chabok, A.; Pei, Y. Effect of stacking fault energy on the restoration mechanisms and mechanical properties of friction stir welded copper alloys. Mater. Des. 2019, 162, 185–197. [Google Scholar] [CrossRef]
  39. Javadi, M.; Tajdari, M. Experimental investigation of the friction coefficient between aluminum and steel. Mater. Sci.-Poland 2006, 24, 305–310. [Google Scholar]
  40. Karen, J.Q.; Jose, L.L.S. Mechanistic models and experimental analysis for the torque in FSW considering the tool geometry and the process velocities. J. Manuf. Process. 2017, 30, 406–417. [Google Scholar]
  41. Firouzdor, V.; Kou, S. Formation of liquid and intermetallic in Al-to-Mg friction stir welding. Metall. Mater. Trans. A 2010, 20, s619–s623. [Google Scholar] [CrossRef]
  42. Pourahmad, P.; Abbasi, M. Materials flow and phase transformation in friction stir welding of Al 6013/Mg. Trans. Nonferrous Met. Soc. China 2013, 23, 1253–1261. [Google Scholar] [CrossRef]
  43. Hi, H.; Chen, K.; Liang, Z.; Dong, F.; Yu, T.; Dong, X. Intermetallic compounds in the banded structure and their effect on mechanical properties of Al/Mg dissimilar friction stir welding joints. J. Mater. Sci. Technol. 2017, 33, 359–366. [Google Scholar]
  44. Rao, H.M.; Jordon, J.B.; Ghaffari, B.; Su, X.; Khosrovaneh, A.K.; Barkey, M.E. Fatigue and fracture of friction stir linear welded dissimilar aluminum to magnesium alloys. Int. J. Fatigue 2016, 82, 737–747. [Google Scholar] [CrossRef] [Green Version]
  45. Sharma, N.; Khan, Z.A.; Siddiquee, A.N. Friction stir welding of aluminum to copper—An overview. Trans. Nonferrous Met. Soc. China. 2017, 27, 2113–2136. [Google Scholar] [CrossRef]
  46. Bozkurt, Y.; Kentli, A.; Uzun, H.; Salman, S. Experimental investigation and prediction of mechanical properties of friction stir welded aluminum metal matrix composite plates. Mater. Sci. Medzg. 2012, 18, 336–340. [Google Scholar]
  47. Liu, H.; Hu, Y.Y.; Zhao, Y.Q.; Fujii, H. Improving the particle distribution and mechanical properties of friction-stir-welded composites by using a smooth pin tool. Mech. Compos. Mater. 2017, 53, 515–524. [Google Scholar] [CrossRef]
  48. Yutaka, S.S.; Hiroyuki, K.; Masatoshi, E.; Shigetoshi, J.; Takenori, H. Precipitation Sequence in Friction Stir Weld of 6063 Aluminum during Aging. Metall. Mater. Trans. A 1999, 30A, 1999–3125. [Google Scholar]
  49. Kumar, L.; Yazar, K.U.; Pramanik, S. Effect of fusion and friction stir welding techniques on the microstructure, crystallographic texture and mechanical properties of mild steel. Mater. Sci. Eng. A 2019, 754, 400–410. [Google Scholar] [CrossRef]
  50. Luo, C.; Li, X.; Song, D.; Zhou, N.; Li, Y.; Qi, W. Microstructure evolution and mechanical properties of friction stir welded dissimilar joints of Mg–Zn–Gd and Mg–Al–Zn alloys. Mater. Sci. Eng. A 2016, 664, 103–113. [Google Scholar] [CrossRef]
Figure 1. A globular microstructure of base SSM 6063 aluminum alloys.
Jmmp 04 00123 g001
Figure 2. Different tool pin geometry for friction stir welding process (FSWp) of SSM 6063 aluminum alloys: (a) cylindrical, (b) triangular, (c) square, and (d) pentagon.
Jmmp 04 00123 g002
Figure 3. The schematic view of the steps for principle FSWp of SSM 6063 aluminum alloys.
Jmmp 04 00123 g003
Figure 4. Schematic diagram of FSWp of SSM 6063 aluminum alloys as (a) FSW sample, (b) tensile strength sample, and (c) hardness sample.
Jmmp 04 00123 g004
Figure 5. The contour plot of tensile strength vs. R, W, and T of the welded on FSWp of SSM 6063 aluminum alloys.
Jmmp 04 00123 g005
Figure 6. The stress–strain of the welded joint on FSWp of SSM 6063 aluminum alloys.
Jmmp 04 00123 g006
Figure 7. Vicker’s hardness profiles: (a) Vicker’s hardness profiles in the cross-section of the welded on FSWp of SSM 6063 aluminum alloys and (b) Plot graph between Vicker’s hardness profiles and Distance from SZ center.
Jmmp 04 00123 g007
Figure 8. The photography of microstructure in the joint from rotation speed 1320 rpm, welding speed 60 mm/min, and cylindrical tool. (ai) nine different types of microstructural changes were observed under microscope.
Jmmp 04 00123 g008
Figure 9. The six patterns of the defects of SSM 6063 aluminum alloy after FSWp in many different conditions for this experiment: (a) the flash defects, (b) the void or cavity defects, (c) the crack defects, (d) lack of penetration and tunnel defects, (e) the kissing bond defects, and (f) the dendrite formation defects.
Jmmp 04 00123 g009
Figure 10. The evaluated of the microstructure in the welded joint by SEM from cylindrical tool, rotation speed at 1320 rpm, and welding speed at 60 mm/min. (af) six patterns of microstructural changes were observed.
Jmmp 04 00123 g010
Figure 11. The micrographic mapping image by EDX spectroscopy of the welded joint: (a) the presence of SEM micrographs, (b) the presence of element phase maps, (c) the presence of aluminum element, (d) the presence of silicon element, (e) the presence of iron element, (f) the presence of manganese element, (g) the presence of carbon element, and (h) the present of EDX results of the secondary phase.
Jmmp 04 00123 g011
Table 1. Chemicals properties of the base semi-solid-metal (SSM) 6063 aluminum alloy used in this experiment [22].
ElementMgSiFeOthersAl
SSM 60630.45–0.900.20–0.600.350.15Balance
Table 2. Mechanical properties of the base SSM 6063 aluminum alloy used in this experiment [22].
Ultimate Tensile
Strength in MPa
Elongation in mmYield Strength in MPaHardness in HV
14927–4211267
Table 3. The FSWp of parameters and its levels.
Experiment No.ParametersNotationUnitLevels
−1−2−3−4
1Rotation speedRRpm1100132017502220
2Welding speedWmm/min306090120
3Tool geometryT---CylindricalTriangularSquarePentagon
R, rotation speed; W, welding speed; T, tool geometry.
Table 4. The result of the experimental design of model 43 with 64 general full factorial designs.
Experiment No.Design Matrix ProcessTensile Strength (MPa)Joint Efficiency
(%)
Experiment No.Design Matrix ProcessTensile Strength (MPa)Joint Efficiency
(%)
RWTRWT
1−4−4−1101.5268.1333−4−3−4108.4572.79
2−3−2−4105.2270.6234−2−3−298.4166.05
3−2−4−496.0064.4335−4−1−383.5156.05
4−4−4−379.8753.6036−2−4−183.3555.94
5−4−2−384.6456.8137−3−4−381.0254.38
6−1−4−374.0949.7238−3−1−1120.2080.67
7−3−4−4111.1174.5739−3−1−2107.0071.81
8−3−2−278.4452.6440−3−3−1107.2771.99
9−1−2−3108.2572.6541−4−4−488.5159.40
10−2−1−2104.7970.3342−2−1−397.2365.26
11−2−1−4108.9973.1543−4−2−2100.2967.31
12−1−3−263.3742.5344−4−4−276.6251.42
13−1−1−3111.5574.8745−4−3−197.0865.15
14−1−2−2101.4268.0746−1−1−2103.3969.39
15−4−1−1113.9676.4847−2−3−1113.1875.96
16−3−3−289.0959.7948−1−3−4107.9872.47
17−1−1−4112.7475.6649−1−2−1101.8568.36
18−1−2−4114.7677.0250−3−2−3115.5377.54
19−4−3−3111.5874.8951−2−3−393.0062.42
20−1−3−190.0760.4552−1−4−188.7959.59
21−1−4−480.9954.3653−4−1−4101.0867.84
22−3−1−4108.3572.7254−4−1−296.2564.60
23−4−2−1111.1174.5755−2−2−2102.6668.90
24−3−2−1115.4377.4756−2−4−265.1543.72
25−2−2−396.0364.4557−3−4−282.0755.08
26−2−3−495.0963.8258−3−3−491.0661.11
27−1−4−247.9332.1759−2−4−383.3655.95
28−2−1−1114.9877.1760−3−1−3101.9068.39
29−2−2−1123.5982.9561−1−3−3105.7070.94
30−2−2−4118.7679.7062−4−2−4112.7075.64
31−3−4−1106.5371.5063−3−3−392.7062.21
32−1−1−1115.5077.5264−4−3−283.3955.97
Table 5. Analysis of variance analysis for tensile strength.
SourceDFAdj SSAdj MSF-Valuep-Value
Regression Model6343,840.4695.8839.330.000Significant
Linear927,307.93034.21171.500.000
R3890.3296.7616.770.000
W315,497.55165.82291.990.000
T310,920.23640.05205.750.000
2-Way Interactions279341.8345.9919.560.000
R × W94264.1373.7926.780.000
R × T92320.7257.8914.570.000
W × T92757.0306.3317.310.000
3-Way Interactions277190.7266.3215.05
R × W × T277190.7266.3215.05
Pure Error1282264.617.69
Total19146,105.0
S = 4.20619R2 = 95.09%        Adjusted R2 = 92.67%
Table 6. The response optimization analysis for tensile strength.
Prediction for Shear Strength
Multiple response prediction
Variables     Setting
Rotation speed (rpm)       2220
Welding speed (mm/min)        30
Tool geometry        1
ResponseFitSE Fit95% CI95% PI
Tensile strength112.292.43107.49, 117.0986.17, 138.41
Publisher’s Note: MDPI stays neutral with regard to jurisdictional claims in published maps and institutional affiliations.

