Article

Data-Driven Digital Twins for Technical Building Services Operation in Factories: A Cooling Tower Case Study

1
Chair of Sustainable Manufacturing and Life Cycle Engineering, Institute of Machine Tools and Production Technology (IWF), Technische Universität Braunschweig, Langer Kamp 19B, 38106 Braunschweig, Germany
2
Fraunhofer Institute for Surface Engineering and Thin Films IST, Bienroder Weg 54E, 38108 Braunschweig, Germany
*
Author to whom correspondence should be addressed.
J. Manuf. Mater. Process. 2020, 4(4), 97; https://0-doi-org.brum.beds.ac.uk/10.3390/jmmp4040097
Submission received: 30 July 2020 / Revised: 24 August 2020 / Accepted: 2 September 2020 / Published: 23 September 2020
(This article belongs to the Special Issue Cyber Physical Production Systems)

Abstract

:
Cyber-physical production systems (CPPS) and digital twins (DT) with a data-driven core enable retrospective analyses of acquired data to achieve a pervasive system understanding and can further support prospective operational management in production systems. Cost pressure and environmental compliances sensitize facility operators for energy and resource efficiency within the whole life cycle while achieving reliability requirements. In manufacturing systems, technical building services (TBS) such as cooling towers (CT) are drivers of resource demands while they fulfil a vital mission to keep the production running. Data-driven approaches, such as data mining (DM), help to support operators in their daily business. Within this paper the development of a data-driven DT for TBS operation is presented and applied on an industrial CT case study located in Germany. It aims to improve system understanding and performance prediction as essentials for a successful operational management. The approach comprises seven consecutive steps in a broadly applicable workflow based on the CRISP-DM paradigm. Step by step, the workflow is explained including a tailored data pre-processing, transformation and aggregation as well as feature selection procedure. The graphical presentation of interim results in portfolio diagrams, heat maps and Sankey diagrams amongst others to enhance the intuitive understanding of the procedure. The comparative evaluation of selected DM algorithms confirms a high prediction accuracy for cooling capacity (R2 = 0.96) by using polynomial regression and electric power demand (R2 = 0.99) by linear regression. The results are evaluated graphically and the transfer into industrial practice is discussed conclusively.

1. Introduction

The digital factory and cyber-physical production systems (CPPS) have become synonyms for future production systems, where virtual depictions of the factory, better known as digital twins (DT), are used to predict and continuously improve the production performance [1]. Innovation push has tremendously reduced the costs for sensors and measurement equipment. Continuously, data acquisition and high performance computational hardware has become affordable for operational management helping to process data in up to real time and achieve energy and resource transparency in factories [2,3]. Consequently, the goal-oriented data processing and the extraction of knowledge from data to support decision makers are growing tasks for actual and future engineers. In that regard, data mining (DM) develops into a mainstream for the interdisciplinary data-based research fields. First described by Fayyad in 1996 [4,5], DM related approaches have numerously been applied in research and practice. These include (but are not limited to) personalized product recommendations and shopping chart analyses in e-commerce and retail, and expertise finding systems and diagnostic tools for service providers. Regarding CPPS, DM is an urgent field of interest for both data scientists and operators. DM approaches can help to anticipate when maintenance services should be performed on machines [6,7,8,9] and it improves the modeling of complex production systems or enables accurate forecasts of energy consumptions [10,11,12]. Moreover, data-driven approaches can support applied remanufacturing activities in circular economies [13].
Within the last decades, energy and resource efficiency has become an important topic for manufacturing companies all over the world aiming to reduce environmental pollution and carbon emissions [14,15]. In manufacturing systems, significant shares of energy and resource demands are usually related to production machines and technical building services (TBS) that are interconnected by physical flows as well as data flows [16]. In particular, TBS exhibit crucial improvement potentials due to their cross-linking within the manufacturing system. Their main purpose is the conversion of final energy such as electricity or natural gas into useful energy forms like compressed air, heat or cooling water as well as the supply of connected machines and processes in the factory building [17]. As energy conversion is related to dissipations such as waste heat or noise emissions, TBS systems are identified as typical main energy consumers in manufacturing systems [18,19].
As a vital element of industrial TBS, cooling towers (CTs) are the prevalent technology to deal with occurring cooling demands from machines, processes and control units in the manufacturing system. Operators of CT systems aim to provide a reliable and economically feasible supply of cooling water. Thereby, they must consider several requirements such as local environmental compliances, production scheduling and local climate conditions [20,21,22,23]. The control of such a complex system requires a high degree of automation and a multi-sensorial network distributed throughout the CT system. Conclusively, the extensive acquisition and storage of operational data is already state of the art. However, this data is often used for monitoring purpose only. Transforming it with adequate methods and tools could help to support operators and decision makers in their challenging daily business. Statistical analyses of historical data can also be used to assess operation strategies regarding improvement potentials based on long-term experiences. Seasonal effects and unique events affecting CT operation can be identified and consequently improvement measures can be derived. Furthermore, additional information about current and future system status is the basis for predictive maintenance and a proactive operation.
The state of research regarding data-driven approaches for CT design and operation proposes artificial neural networks (ANN) and clustering as favored algorithms in this field (compare Section 2.3). However, as most approaches are application-specific, general recommendations to improve CT operation have hardly been formulated so far. This leads to an urgent need for holistic approaches addressing both pervasive system analyses and prediction of relevant aspects for CT operation. Moreover, the beneficial deployment of DT should be clearly described to enhance the transfer from concept into industrial practice.
Within this paper, the development of a data-driven DT for TBS operation applied to an industrial CT system is presented. The approach was developed on an industrial CT system in a manufacturing company located in Germany and implemented as an integrated approach with automated workflow to increase the usability in practice. It aims to uncover interrelations of operational business and technical system and allows to assess different operational strategies. Furthermore, it helps to forecast the CT system performance by predicting key performance indicators (KPIs) like electric power demand and cooling capacity. The approach comprises seven consecutive steps in a broadly applicable workflow that is based on the CRISP-DM paradigm. Initially, background on industrial cooling towers and data-driven approaches for DTs in production systems is presented in Section 2. Subsequently, the underlying case study is introduced and business issues are discussed in Section 3.1. A custom data processing procedure featuring data aggregation, outlier filtering and data transformation is explained stepwise in Section 3.2. A correlation analysis is further used to identify systematical interrelations within the dataset. Subsequently in Section 3.3, several DM algorithms are selected and examined for the DM task to predict performance-related KPIs. All DM algorithms are comparatively evaluated in terms of needed computational time and prediction accuracy. Finally, a conclusion and outlook are presented in Section 4.

2. Background

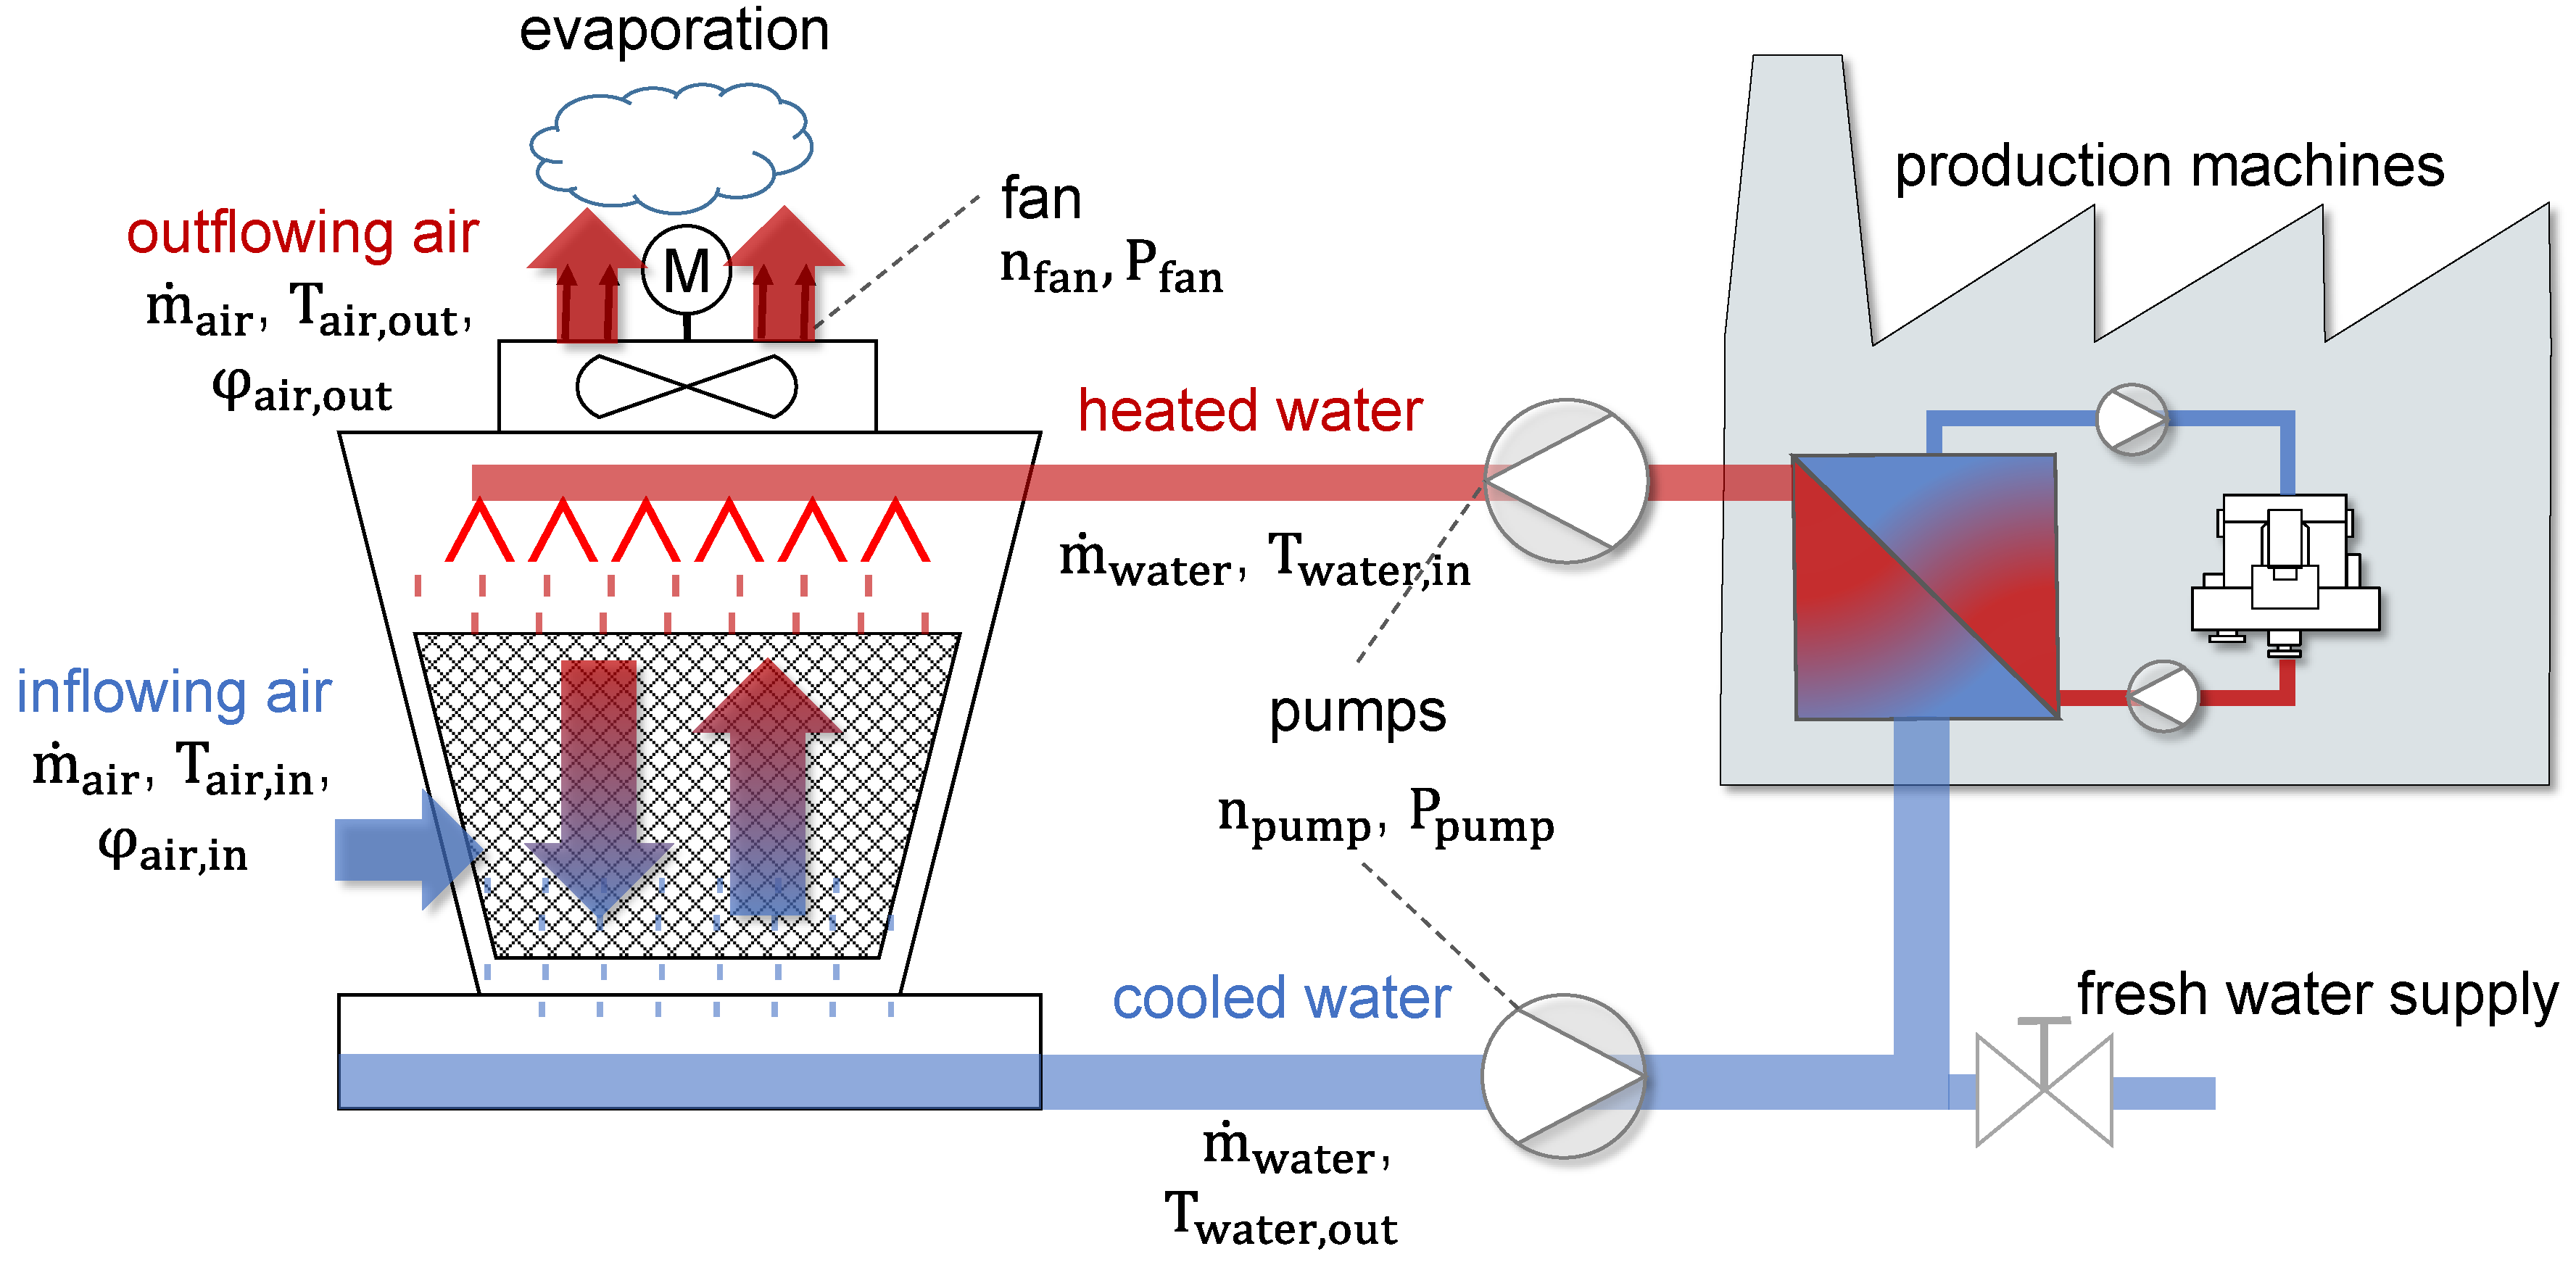
2.1. Industrial Cooling Towers

Industrial CTs in production systems are part of the TBS that deal with occurring cooling demands from production machines by disposing waste heat to the environment. Figure 1 illustrates the main components and functions of a common industrial CT. The cooling water circulates between the production machines and the CT. Starting from the production machines, the heated water is supplied to the CT. Here, the water is sprayed as fine droplets into the CT rinsing down along fillers while reducing its temperature. In counter flow direction, the ambient air flows into the CT. For industrial applications, fans are installed to enhance the air flow. The air saturates with evaporating water and exits on top; hence, it needs to be refilled with fresh water regularly. Finally, the cooled water is pumped back to the production machines. The mathematical relations between the mass flows and temperatures of water and air can be described with Merkel’s theorem [24].
m ˙ air · ( h air , out ( T air , out ,   φ air , out ) h air , in ( T air , in ,   φ air , in ) ) = m ˙ water · c water · ( T water , out T water , in )
The cooling demand of the production, i.e., the right side of equation, depends on the temperature difference of inlet water ( T water ,   in )   and outlet water ( T water ,   out ) , its mass flow ( m ˙ water ) as well as its heat capacity ( c water ) . The left side of the equation characterizes the cooling capacity of the ambient air. It features the absorbency for thermal energy and evaporating water based on ambient temperature and humidity. The equation comprise the air mass flow ( m ˙ air ) as well as the specific enthalpy of inflowing air ( h air , in ) and outflowing air ( h air , out ) which dependent on air temperature ( T air ) and relative humidity ( φ air ) respectively. Consequently, the operation of CTs is highly impacted by environmental conditions of the location. Warm and humid climate impairs the energy and mass transfer leading to increased air demand and fan operation followed by increased energy demand [25].
CTs are tailored constructions with individual specification and size. From small roof-top units for buildings over compact industrial force-draft CTs in industry up to immense natural-draft CTs in power plants, CTs are cross-sector applicable for numerous case studies [20,21,26]. The individual purpose determines design, size and, basically, the required cooling capacity provided by the CT. The achievement of the currently required cooling capacity is one main objective for the operational CT management. Main operational control levers are the installed fans and pumps, which can immediately adjust air and water flows. As these electric components are also main energy consumers of the CT system, they should be considered for energy efficiency issues [27]. A further important KPI for design and monitoring a CT is the energy efficiency ratio (EER), an equivalent to the coefficient of performance (COP) for heating units [28,29]. Equation (2) describes it as the ratio of cooling capacity ( Q CT ) as desired output of the CT and electric power demand   ( P CT ,   electric ) .
EER CT = output CT input CT = Q CT P CT ,   electric  

2.2. Data-Driven Approaches to Create Digital Twins in Factories

A transformation towards digitalization, internet of things (IOT) and industry 4.0 can be observed in most sectors of industry. This includes the establishment of extensive data acquisition systems by installing sensor networks which provide information about machine conditions, progress of production, individual qualities of produced goods etc. [30,31]. Data-driven approaches such as big data, data mining (DM) and visual analytics build upon this data to reveal hidden interrelations within the production system and to forecast vital performance indicators [32]. Novel approaches comprising IOT, DT and CPPS have been introduced for almost every aspect of factories [33,34]. The paradigm of DT comprises detailed virtual depictions of physical systems, their structures and dynamic interaction mechanisms to provide accurate information for prognostics and health management [35]. Prevalent objectives are, amongst others, the improvement of machine tool life cycles [36] and production performance evaluations [37].
The general concept to create a DT of a physical system comprises the definition of requirements, the model creation process and its deployment as illustrated in Figure 2. In particular, for the creation phase, various data-driven approaches are available, including statistics, DM and machine learning (ML). To define requirements for a DT, an in-depth inventory analysis of the physical system should be applied. The deployment of the DT can then encompass numerous tools and methods such as visual analytics, forecasts and predictive maintenance applications. One of the most comprehensive data-driven approaches in industrial practice is the Cross Industry Standard Process for Data Mining (CRISP-DM), which was first introduced by Wirth and Hipp [38] and further detailed in [39,40]. It comprises six sub-sequential steps: The initial step, business understanding, focuses on understanding the project objectives as well as requirements, assumptions and constrains. Data understanding starts with an initial data acquisition and proceeds with its exploration to gain first insights and to detect data quality shortages. Data preparation encompasses all activities to build a final dataset from raw data. It includes tasks to clean, format and merge data in order to derive the desired attributes for modeling tools. For the modeling step, several DM and ML algorithms are available: Supervised, predictive, unsupervised or descriptive algorithms [41,42,43,44]. Supervised ML algorithms include regression approaches (e.g., linear, polynomial regression), classification approaches (e.g., decision trees, support vector machines) or probabilistic algorithms (e.g., Naive Bayes, ANN). Prediction models are derived from existing data and applied to new data, e.g., to derive expectation values for the electric power demand of a technical system. In contrast, descriptive models are developed with algorithms of unsupervised learning such as clustering and association rules, e.g., for pattern recognition in electric load profiles [45,46]. As some algorithms have specific requirements regarding inputs data form, an iteration with previous steps is often necessary. Modeling results are thoroughly evaluated to make sure the model properly fulfils the business objectives. In the deployment step, knowledge gained from the DT needs to be organized and presented for relevant stakeholders and in a valuable form.

2.3. Data-Driven Approaches for Cooling Tower Systems

In recently published studies related with DM and ML for CT systems, two main application fields could be identified; the first is related with buildings such as office buildings and urban spaces [41,47] and the second focuses on industrial CT systems located in factories. Within both, DM and ML are applied to forecast energy demand and cooling capacity, in some cases accompanied with the assessment of environmental conditions. Within the studies, various DM and ML algorithms as well as statistical approaches have been applied. Amongst others, ANN is identified as one of the most common applied algorithm in the field of CT management [48,49,50,51,52]. One main advantage of ANN is the ability to represent systematic and non-linear interrelationships, which could otherwise only be determined in complex experiments [53,54,55,56]. Furthermore, clustering is used to detect patterns and recurring sequences in data from CT systems and TBS, such as typical power demand profiles and efficient operating states [57,58,59]. For example, Li et al. identified efficient operating states and control strategies for up to four connected CT using clustering [60]. Wang et al. investigated the influence of fan speed and ambient air condition on energy demand with a clustering [61]. However, as individual DM algorithms have both strengths and limitations, the combined application of two or more algorithms to an ensemble model is recommended in order to achieve optimal results and reduce the influence of missing values [51,62,63]. Table 1 summarizes recent studies categorized by used data-driven algorithms, applied case study and analyzed target KPIs. It further gives a brief insight into to specific objectives and used data sets.
Based on the state of research it can be concluded that several data-driven algorithms are successfully applied on CT design and operation. In particular, ANN and clustering are the preferred algorithms in this field. However, as all approaches are highly specialized, the most promising approach to improve CT operation remains unclear. However, as most approaches are application-specific, general recommendations to improve CT operation have hardly been formulated so far. Furthermore, the transfer of valuable findings into a DT that is deployable in industrial practice is a virgin field. Addressing these research demands, the presented approach aims to describe the development of a data-driven DT of an industrial CT. Thereby, the overall procedure tries to preserve a generic nature in order to foster a transfer to other types of industrial TBS. The development process will be described step by step, beginning with gathered data and closing with a final evaluation of best fitting DM algorithm. Thereby, occurring challenges in data understanding and processing are discussed.

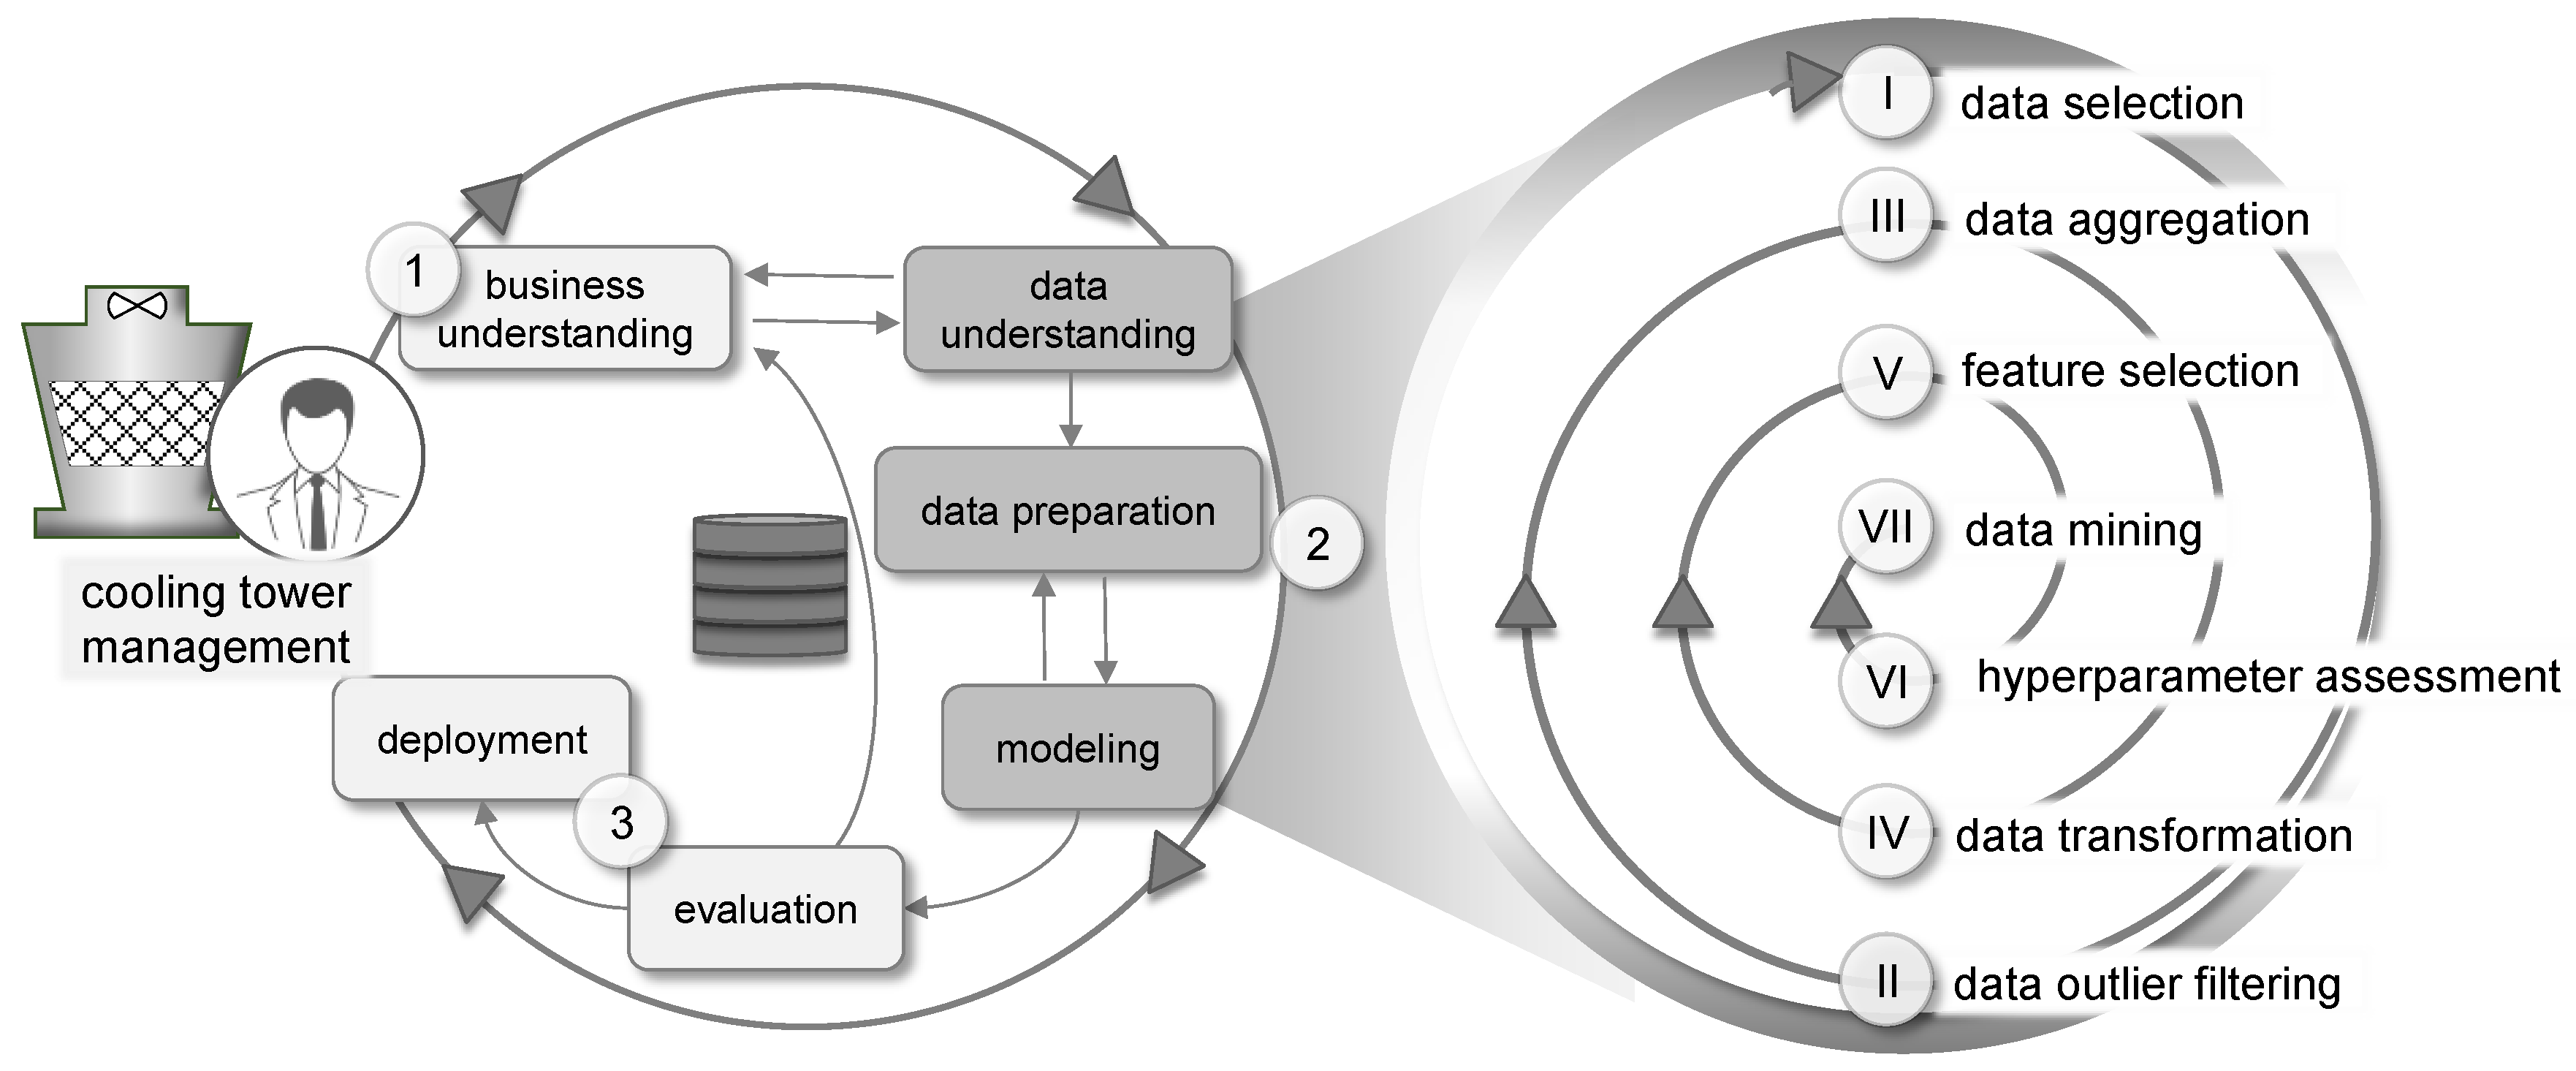
3. A Workflow to Create Digital Twins for Technical Building Services Operation

In the following, the approach to establish a data-driven DT is presented. Its fundamental structure bases on the CRISP-DM procedure detailed in [39]. Figure 3 illustrates the proposed workflow and its main elements. It starts with a brief technical analysis of the CT system and a business analysis in the first phase, followed by the DT creation phase that contains the tasks data understanding, data preparation and modeling. In this phase, seven consecutive steps are conducted, starting with data selection (I) and outlier filtering (II) followed by data aggregation (III) and transformation (IV). In feature selection (V), hyperparameter assessment (VI) and data mining (VII), several DM algorithms are applied on the procedure. Here, requirements of specific algorithms are taken into account and emerging characteristics are highlighted. Finally, in the third phase, DM results are comparatively evaluated and options for deployment in daily practice of CT management are discussed.
The initial phase is related with business understanding (1) of the considered CT system. An inventory analysis is carried out comprising the given structure, measurands and control logics. Subsequently, the CT KPIs electric power demand and cooling capacity are analyzed regarding related influences from production system and environment. Characteristics of the CT system are identified and assumptions for the DM procedure are derived. The second phase encompasses the three CRISP-DM steps data understanding, data preparation and modeling (2) and extends them to a seven-step workflow. Since data must be in an appropriate form to apply DM algorithms, the first four work steps are used for general data processing. The subsequent steps are then applied individually for every single DM algorithm.
First, in the step of data selection (I) relevant measurands of the CT system, i.e., variables and measured data, are chosen and analyzed regarding potential interdependencies (e.g., by correlation analyses). Within data outlier filtering (II) selected variables are processed by filter techniques. Based on given thresholds and requirements from the physical system, outliers in the dataset are identified and cleared. Subsequently, a data aggregation (III) is performed to compress large data amounts while preserving valuable information and data characteristics. Subsequently, in the step of data transformation (IV) variables are transformed into their final form. The target KPIs (cooling capacity, electric power demand) are calculated based on variables and system specific constants. The cooling capacity of the CT system is calculated according to Equation (1). To consider both regressive and classifying algorithms, continuous values are discretized and assigned to classes. Equation (3) exemplifies this procedure for the electric power demand defining intervals with a range of 10 kW:
classes PCT ,   electric   = [ 1 2 3 14 ]   with   intervals   of   electric   power   demand   [ kW ] = [ 0   ;   10 10   ;   20 20   ;   30 140   ;   ]
As DM models should provide accurate predictions within appropriate computational times, the number of variables in the database is assessed in the next step. In an automated procedure, the feature analysis (V) aims to figure out the most relevant variables for each algorithm. The impact of each variable is evaluated in terms of the resulting prediction accuracy by calculating mean squared errors (MSE). For this purpose, the backward feature elimination method was chosen, where used variables are reduced in an iterating program and prediction errors are calculated in every loop. The variable with the least impact to reduce the forecast error is removed in every iteration, i.e., the process starts with all variables and ends with one variable. This dimension reduction approach analyses which variables are necessary for an accurate prediction and how each variable impacts the prediction result. Further, a hyperparameter assessment (VI) is performed for each DM algorithm. Hyperparameters are specific model parameters for DM algorithms that need to be set before the learning process begins, e.g., tree depth for decision trees or number of neurons for ANN. Several studies recommend experimental or rule-based methods to determine adequate hyperparameters [64,65]. In this study, a rule-based method is applied, including several sub steps like data normalization, partitioning and algorithm training. The model is trained within a loop for each possible hyperparameter combination followed by an evaluation of the prediction accuracy. To achieve a high reliability of results, a cross validation is integrated into the loop. Results are then mapped for a graphical evaluation. Subsequently, data mining (VII) is processed with the selected DM algorithms to predict cooling capacity and electric power demand. As various algorithms are basically suitable, an assessment of five algorithms predicting cooling capacity and nine algorithms predicting electric power demand is carried out (see Figure 4). To cope with weaknesses of single algorithm characteristics, several existing studies propose the combination of two or more algorithms in an ensemble model [51,62,63]. Therefore, a gradient boosted trees (GBT) algorithm was coupled with a multilayer perception neural network (MLP) to an ensemble model.
Finally, the phase of evaluation (3) is done based on statistical evaluations regarding coefficient of determination (R2) and mean absolute error (MAE). By means of graphical analyses, results are related to the computational time, which is an important criterion for the applicability in daily practice. Finally, the possible deployment in industrial CT management is discussed.
The presented workflow was successfully applied on an industrial CT system located in a German automotive plant. In the following, the application of each process phase is described and exemplary results are presented. The developed methods are prototypically implemented in the software tools KNIME® and Microsoft Excel©, which are, amongst others, typical tools to apply DM approaches [41,66].

3.1. Business Understanding (Phase 1)

Starting with an analysis of the system requirements and constrains from a business perspective, two main aspects should be taken into account: On the one hand, the technical perspective defines the basis for data analysis. It is defined by the overall structure of the CT system with its technical properties such as installed technology types and number of devices as well as the available measurands and control logics. On the other hand, a systematical analysis of periodic and unique events during the CT operation is a vital part of the business understanding. It helps to identify typical operational characteristics of the CT system and determines requirements for the DT approach.

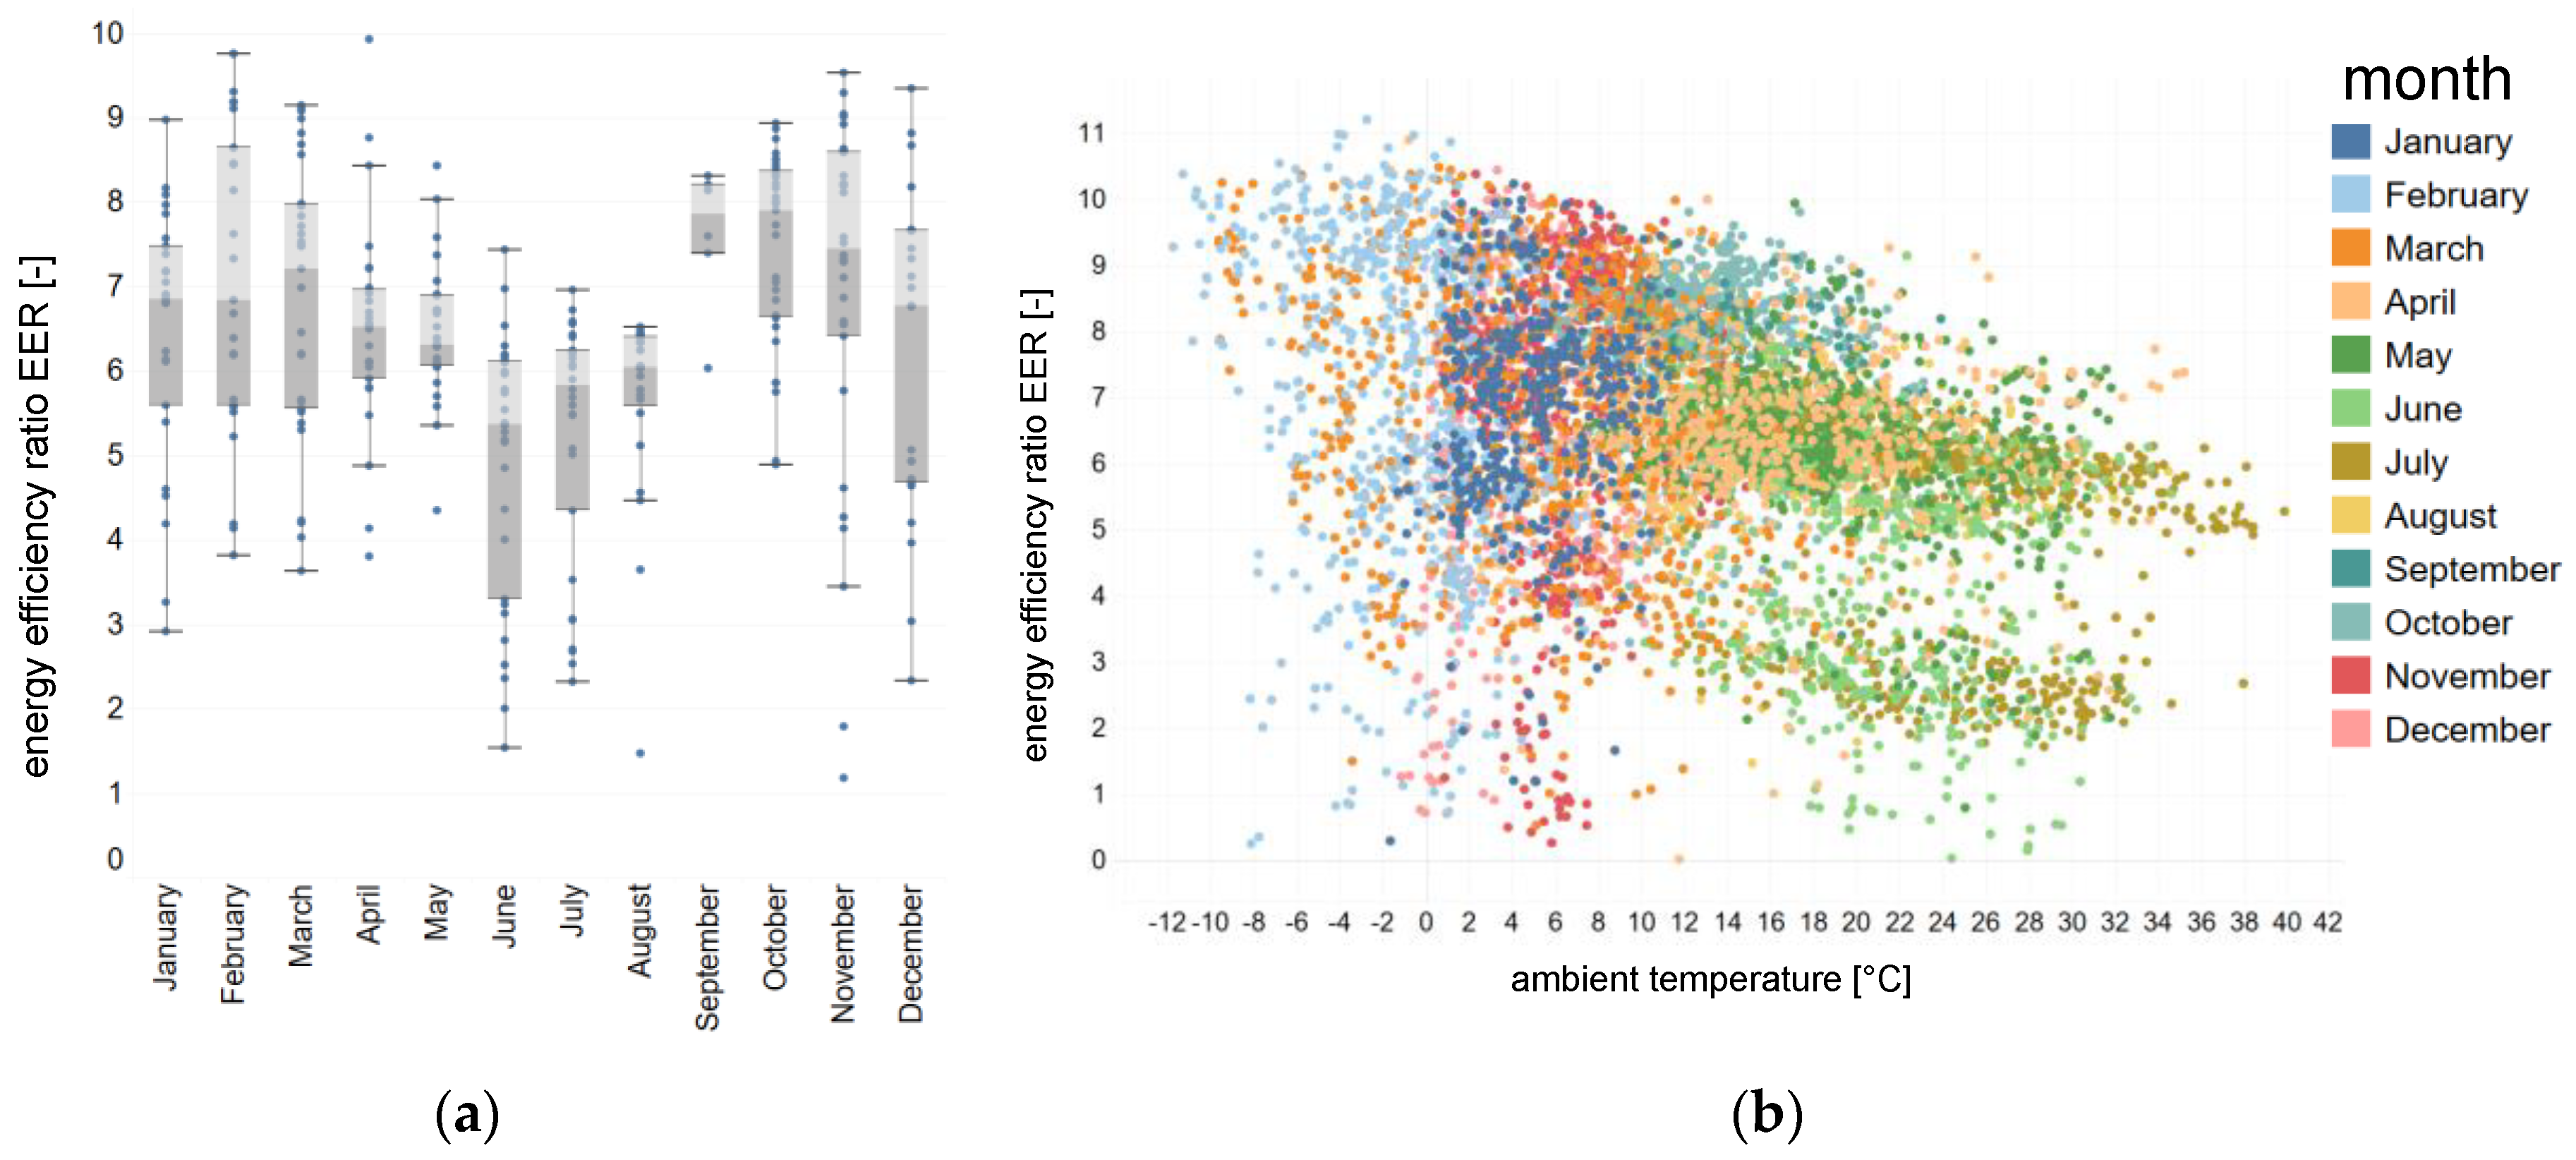
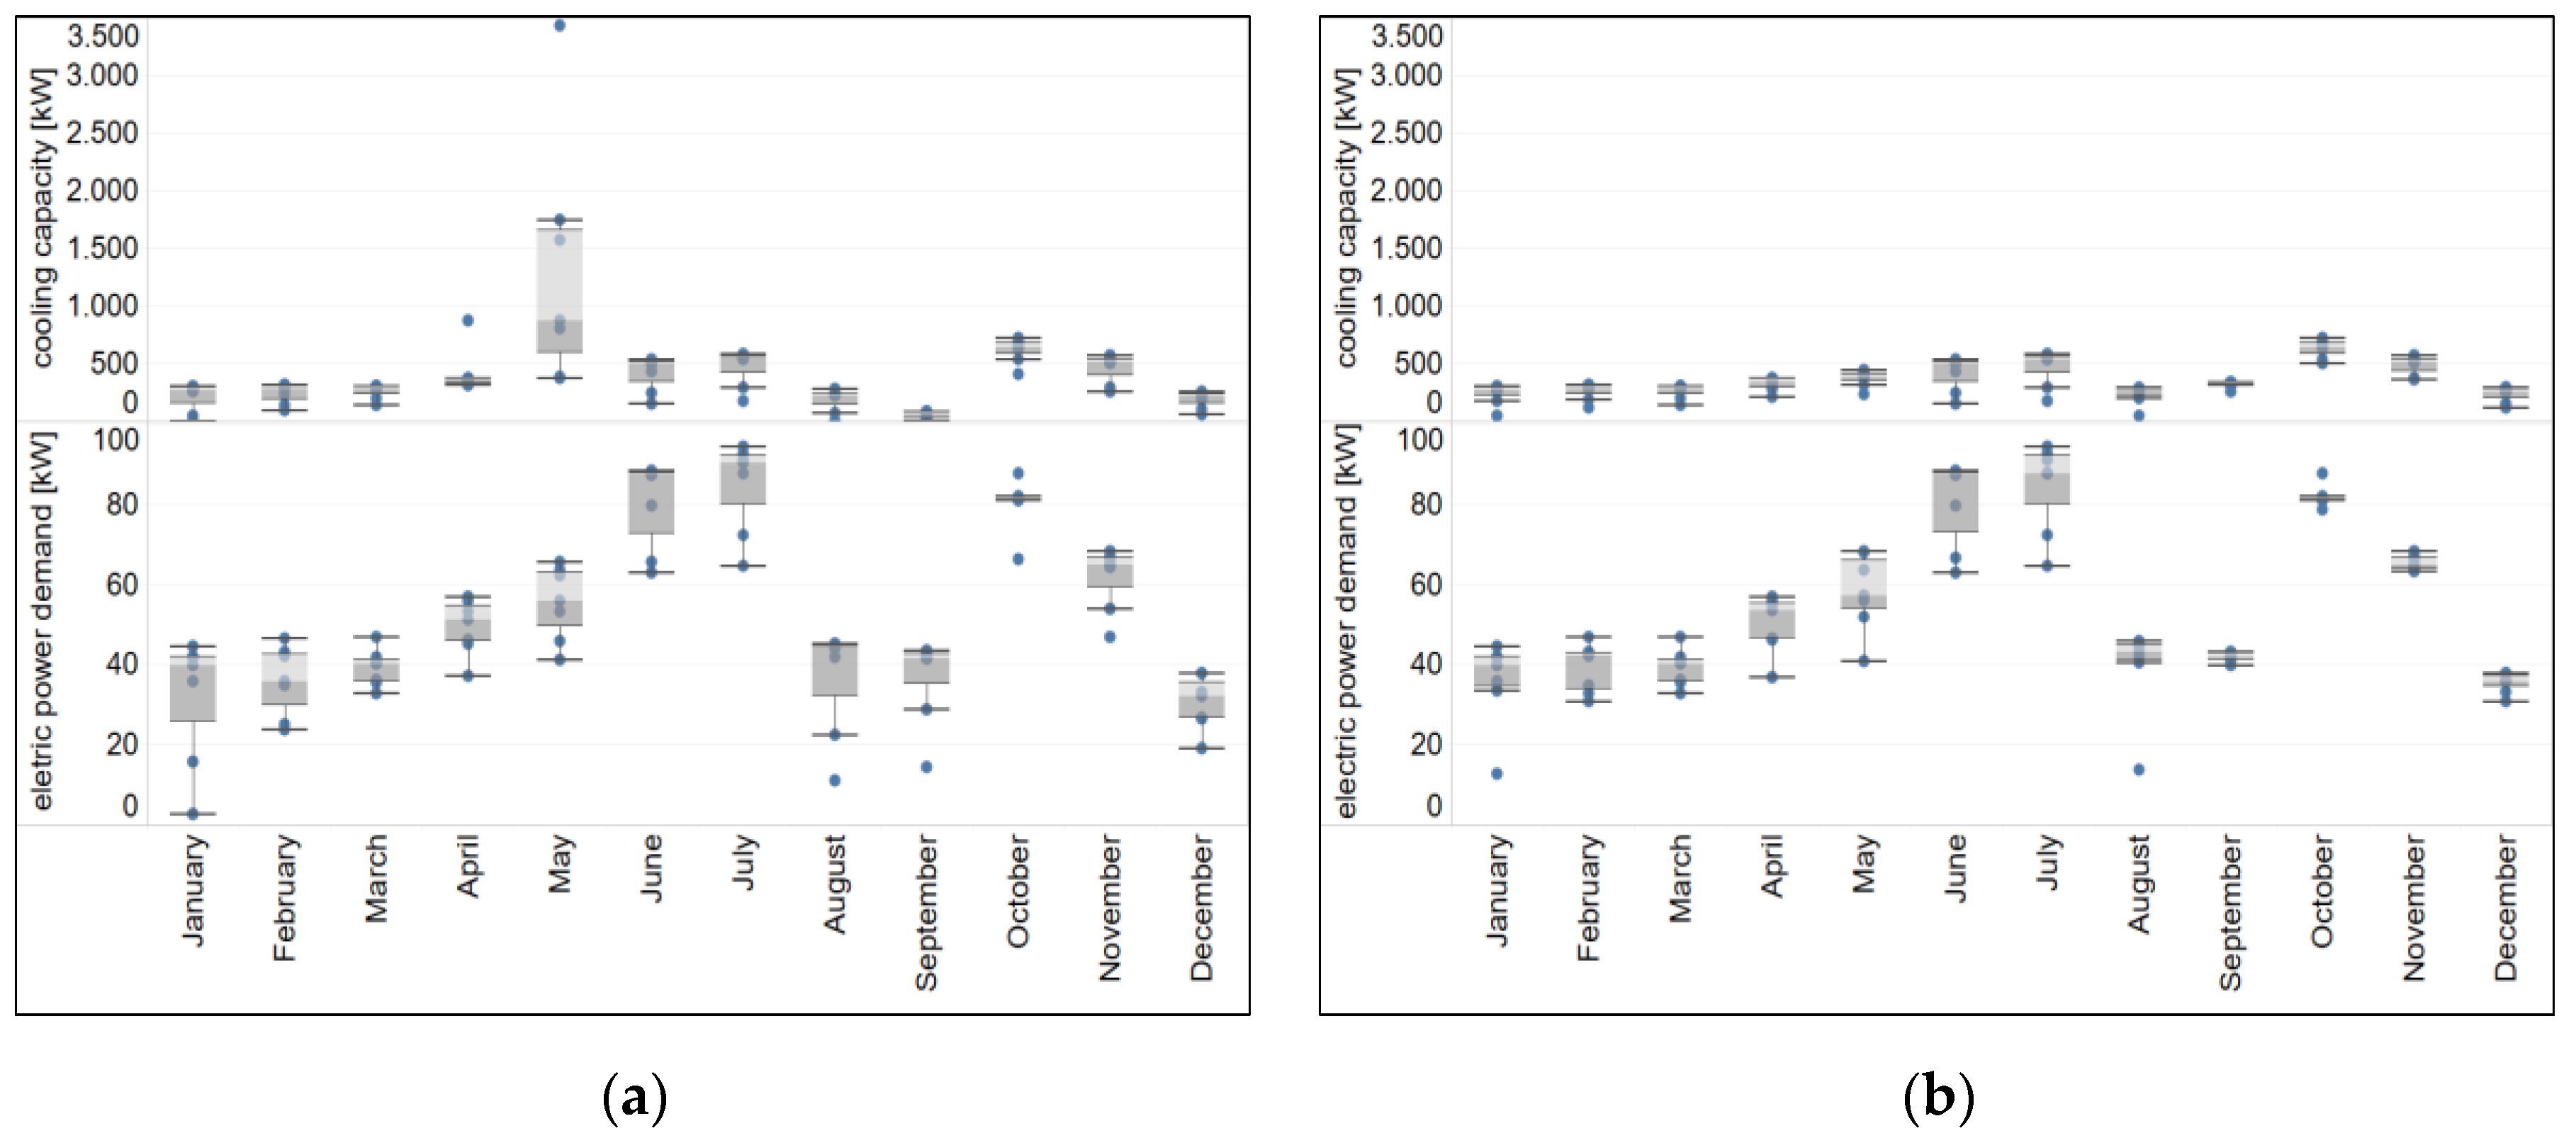
3.1.1. Technical Analysis of the Cooling Tower System

The considered industrial CT system is part of the TBS in a manufacturing company located in Germany. The CT system is used to dissipate heat from four nearby heat exchanger. It comprises three open circuit CTs (CT 1, CT 2, CT 3) illustrated in Figure 5. All CTs operate with water as coolant and follow a forced-draft air flow design, where the natural draft is supported by fans. While CT 1 and CT 2 have fans with static speed (i.e., without speed control), the fan of CT 3 supports a controllable speed range. Forward flow and backward flow pumps provide a circulation of water in the CT system. Each pump group comprises a static pump, a redundant standby pump as backup, and one speed-controlled pump. Flow and return circuits each have a tank to maintain the required amount of water and the specified pressure level. CT fans are switched on and off following hysteresis based on water flow temperatures. Three lower and three higher thresholds thereby define the fan operation. The speed-controlled fan in addition regulates its speed in a given range proportional to flow temperatures.
For data acquisition purposes, an existing SCADA (Supervisory Control and Data Acquisition) system of the plant is used. It captures valuable measurands for a live visualization and control like water temperatures, electrical conductivity, water flows and pressure levels. The continuously collected data is stored within a MySQL database. A constant frequency of one full record (consisting of 32 values) each 10 s was chosen. More information about the data acquisition concept can be found in [20].

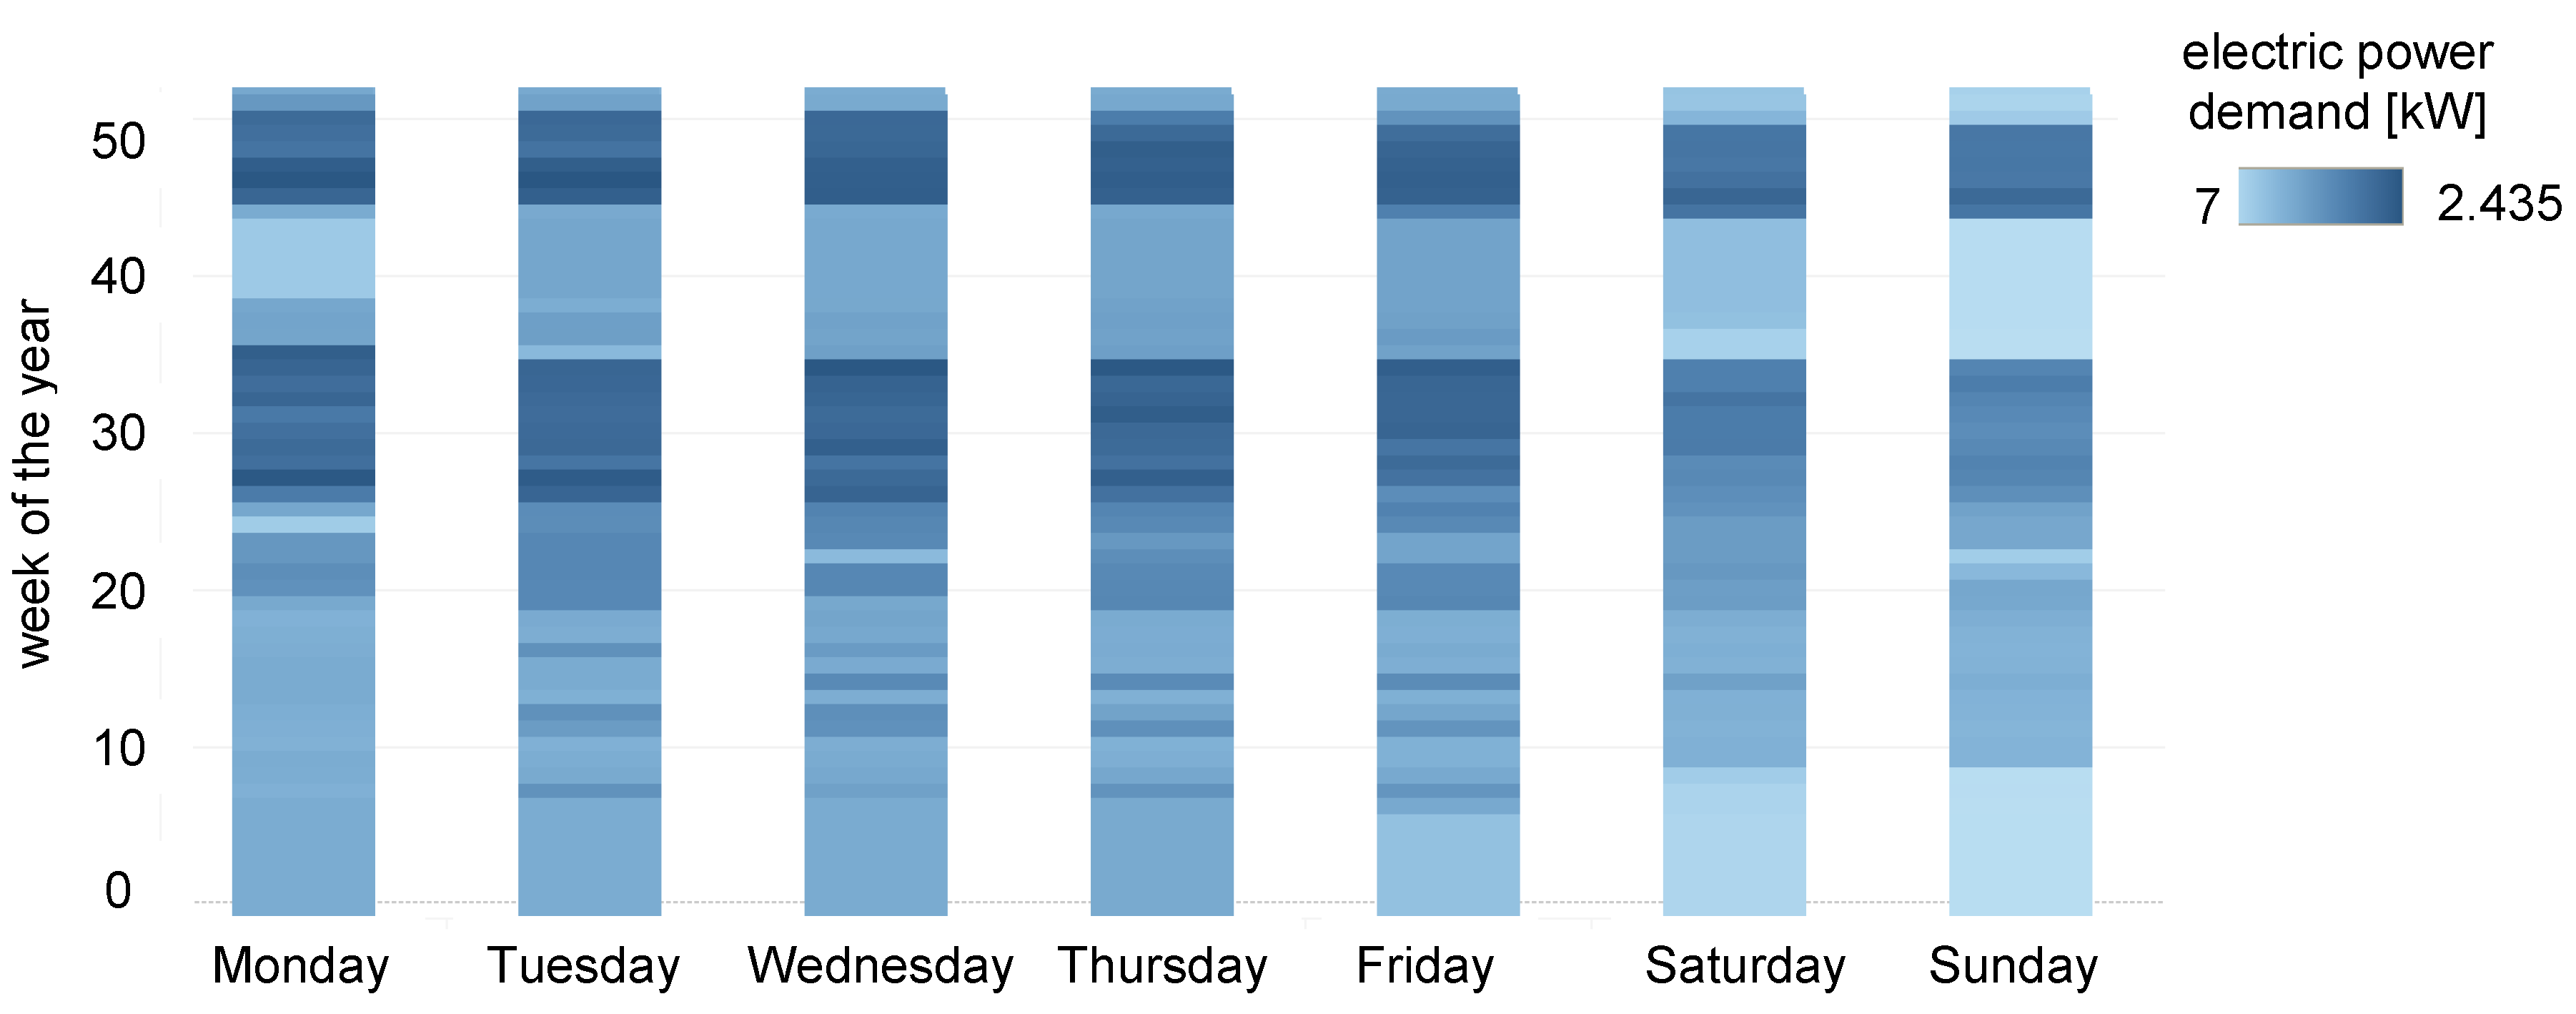
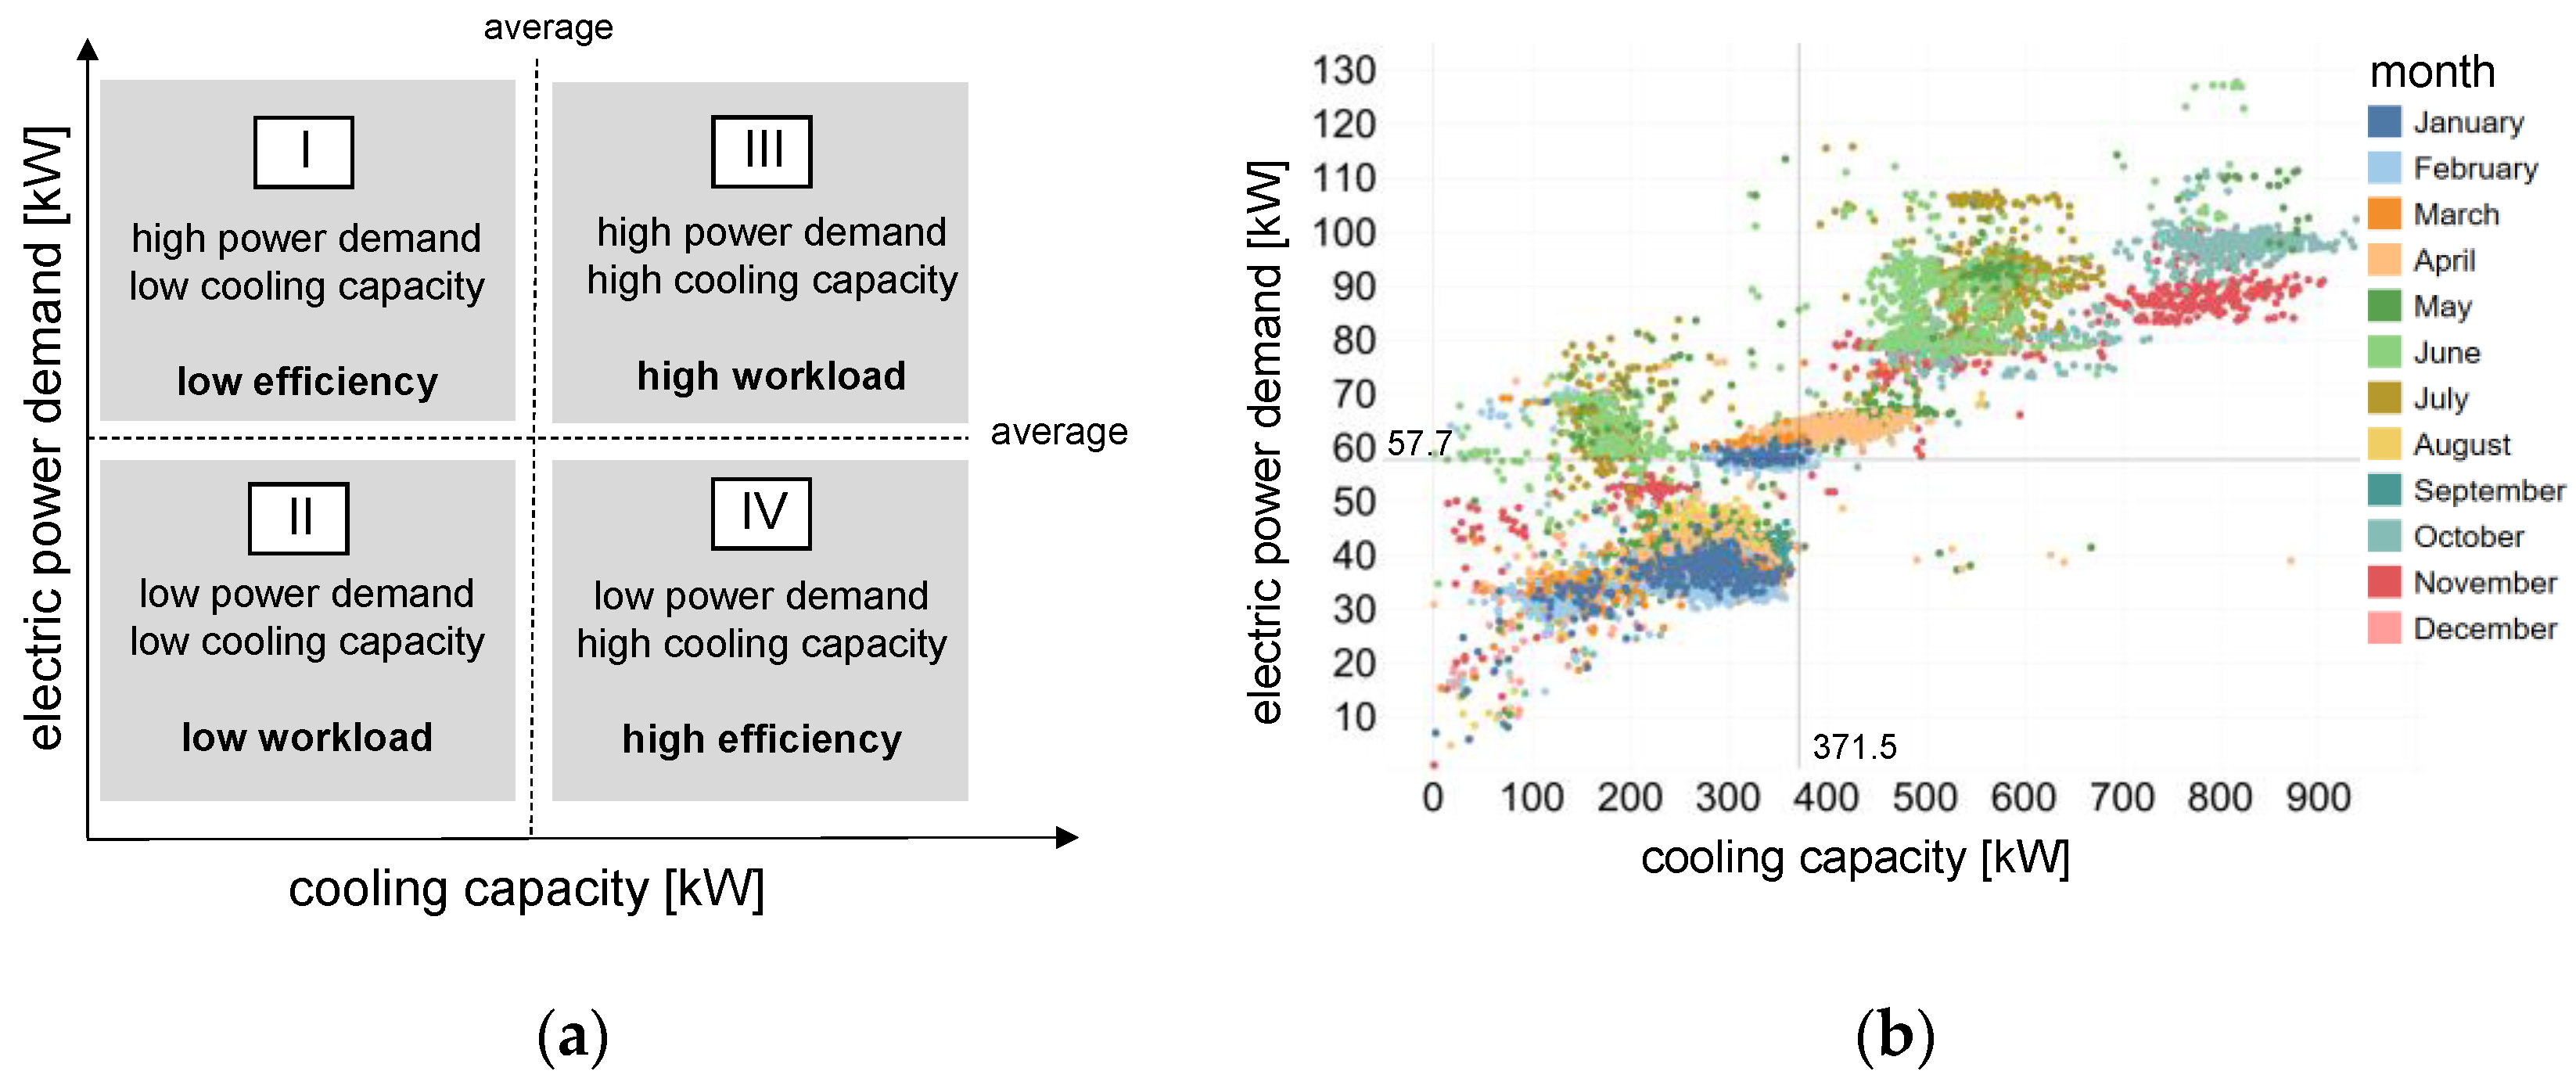
3.1.2. System and Business Analysis

With focus on the most relevant KPIs for CT operation, a detailed system and business analysis considering electric power demand, cooling capacity and energy efficiency ratio EER of the CT system is introduced. Thereby, the impact of external influences such as seasonal weather conditions and production capacity on the CT system performance scheduling is analyzed.
As mentioned before, the cooling demand from the production system is a main parameter for CT operation and a driver for energy demand. Focusing on this aspect, the weekly electric power demand of the CT system for one year is illustrated as heatmap in Figure 6, classified by weekdays. The color indicates the amount of demanded energy from low (bright blue) to high (dark blue). In general, during weekdays (Monday–Friday) the power demand is higher compared to weekends. During one week, no reoccurring specific peak load can be identified. However, comparing all weeks within the year, certain periods of high and low electric power demand can be identified. High power demand particularly occurs between weeks 25 and 35 as well as between weeks 45 and 50. Typically, these periods are within high production seasons of the manufacturing system which induce higher cooling demands. Low energy demand periods between weeks 35 and 45 overlap with the typical holiday season during Mid-Europe’s summer time that is related with reduced production capacities. As a result, it can be concluded that the scheduling of the production system influences operation states and thus electric power demands of the CT system.
As a further aspect, the EER of the CT system and its dynamic during the year is of a special interest. Originally, the EER is primarily used for design purposes considering only a small number of defined typical temperature examples from the location [29]. However, the understanding of yearly EER dynamics could help to continuously adjust operational tasks and to counteract performance gaps, if necessary. To get an overview, Figure 7a depicts a boxplot of the monthly EER range for one year with an aggregated daily average. From October to May, the EER ranges between 5.5 and 7.5, while the lower and upper whisker achieve an EER of 2.5 and 10 respectively. During the summer months June to September, the EER is significantly lower from approximately 3.5 to 6.5. With a minimum of 1.5 and maximum of 7.5, the whisker range is comparably low. On the one hand, the collapse of the EER could be explained with the former discussed holiday season during summer. On the other hand, ambient temperature and humidity impact the CT performance (compare Equation (1)). This issue is further analyzed in Figure 7b, which puts the EER in relation to the ambient temperature with aggregated hourly averages. The respective months are identifiable by coloring. Typically, the CT operates in a temperature range between 2 and 20 °C, which corresponds to the average temperature profile in Mid-Europe. During late autumn and winter (November until March), the EER is significantly higher compared to the summer months (May until July). Generally, it can be stated that the EER decreases with rising ambient temperatures. This is in line with the relations expressed in Equation (1) and the findings of [25], indicating that higher ambient temperatures negatively impact the energy and mass transfer in the CT, resulting in a lower EER. Additionally, the illustrations show the magnitude and the range of seasonal impacts on the EER dynamics.
As a first conclusion it can be stated, that particularly two main aspects impact CT performance and EER: the workload resulting from the cooling demand of the production system and seasonally changing environmental conditions. However, these influences could superimpose each other and distort conclusions. In order to uncouple these effects, cooling capacity and electric power demand are compared using a portfolio analysis. Figure 8a illustrated the general method to perform a portfolio analysis inspired by the energy portfolio from Thiede [16] to evaluate the energy efficiency ratio (EER). Figure 8b illustrates the extracted data for one operation year (hourly aggregation). To integrate the time perspective, a color code indicates the respective month of the year. The average values of electric power demand (57.7 kW) and cooling capacity (371.5 kW) define the four portfolio categories:
  • High electric power demand, low cooling capacity (category I): The EER during these times is low. For the presented use case, such inefficiencies occur intermittently in almost every month of the year, but particularly frequent during May, June and July.
  • Low electric power demand, low cooling capacity (category II): The EER is in an acceptable range, whereas the workload of the CT system is comparatively low. On the one hand, these stages are mainly detected during winter season, when low ambient air temperatures increase the natural cooling effect (compare Equation (1)). This means, the CT system already achieves a sufficient cooling capacity with relatively low additional power demands. On the other hand, this portfolio category includes days in August and May, which are typically related with holiday season, and thus, reduced cooling demand from production system.
  • High electric power demand, high cooling capacity (category III): High workload is linked to high power demands, yet acceptable EER ranges. High workload occurs particularly during the warm summer season, e.g., June and July. Furthermore, October and November show overall the highest workload of the year, which could indicate high production capacities.
  • Low electric power demand, high cooling capacity (category IV): With high EER, those states are the most desirable for CT system operation. However, there are only few samples in April and May in this category.

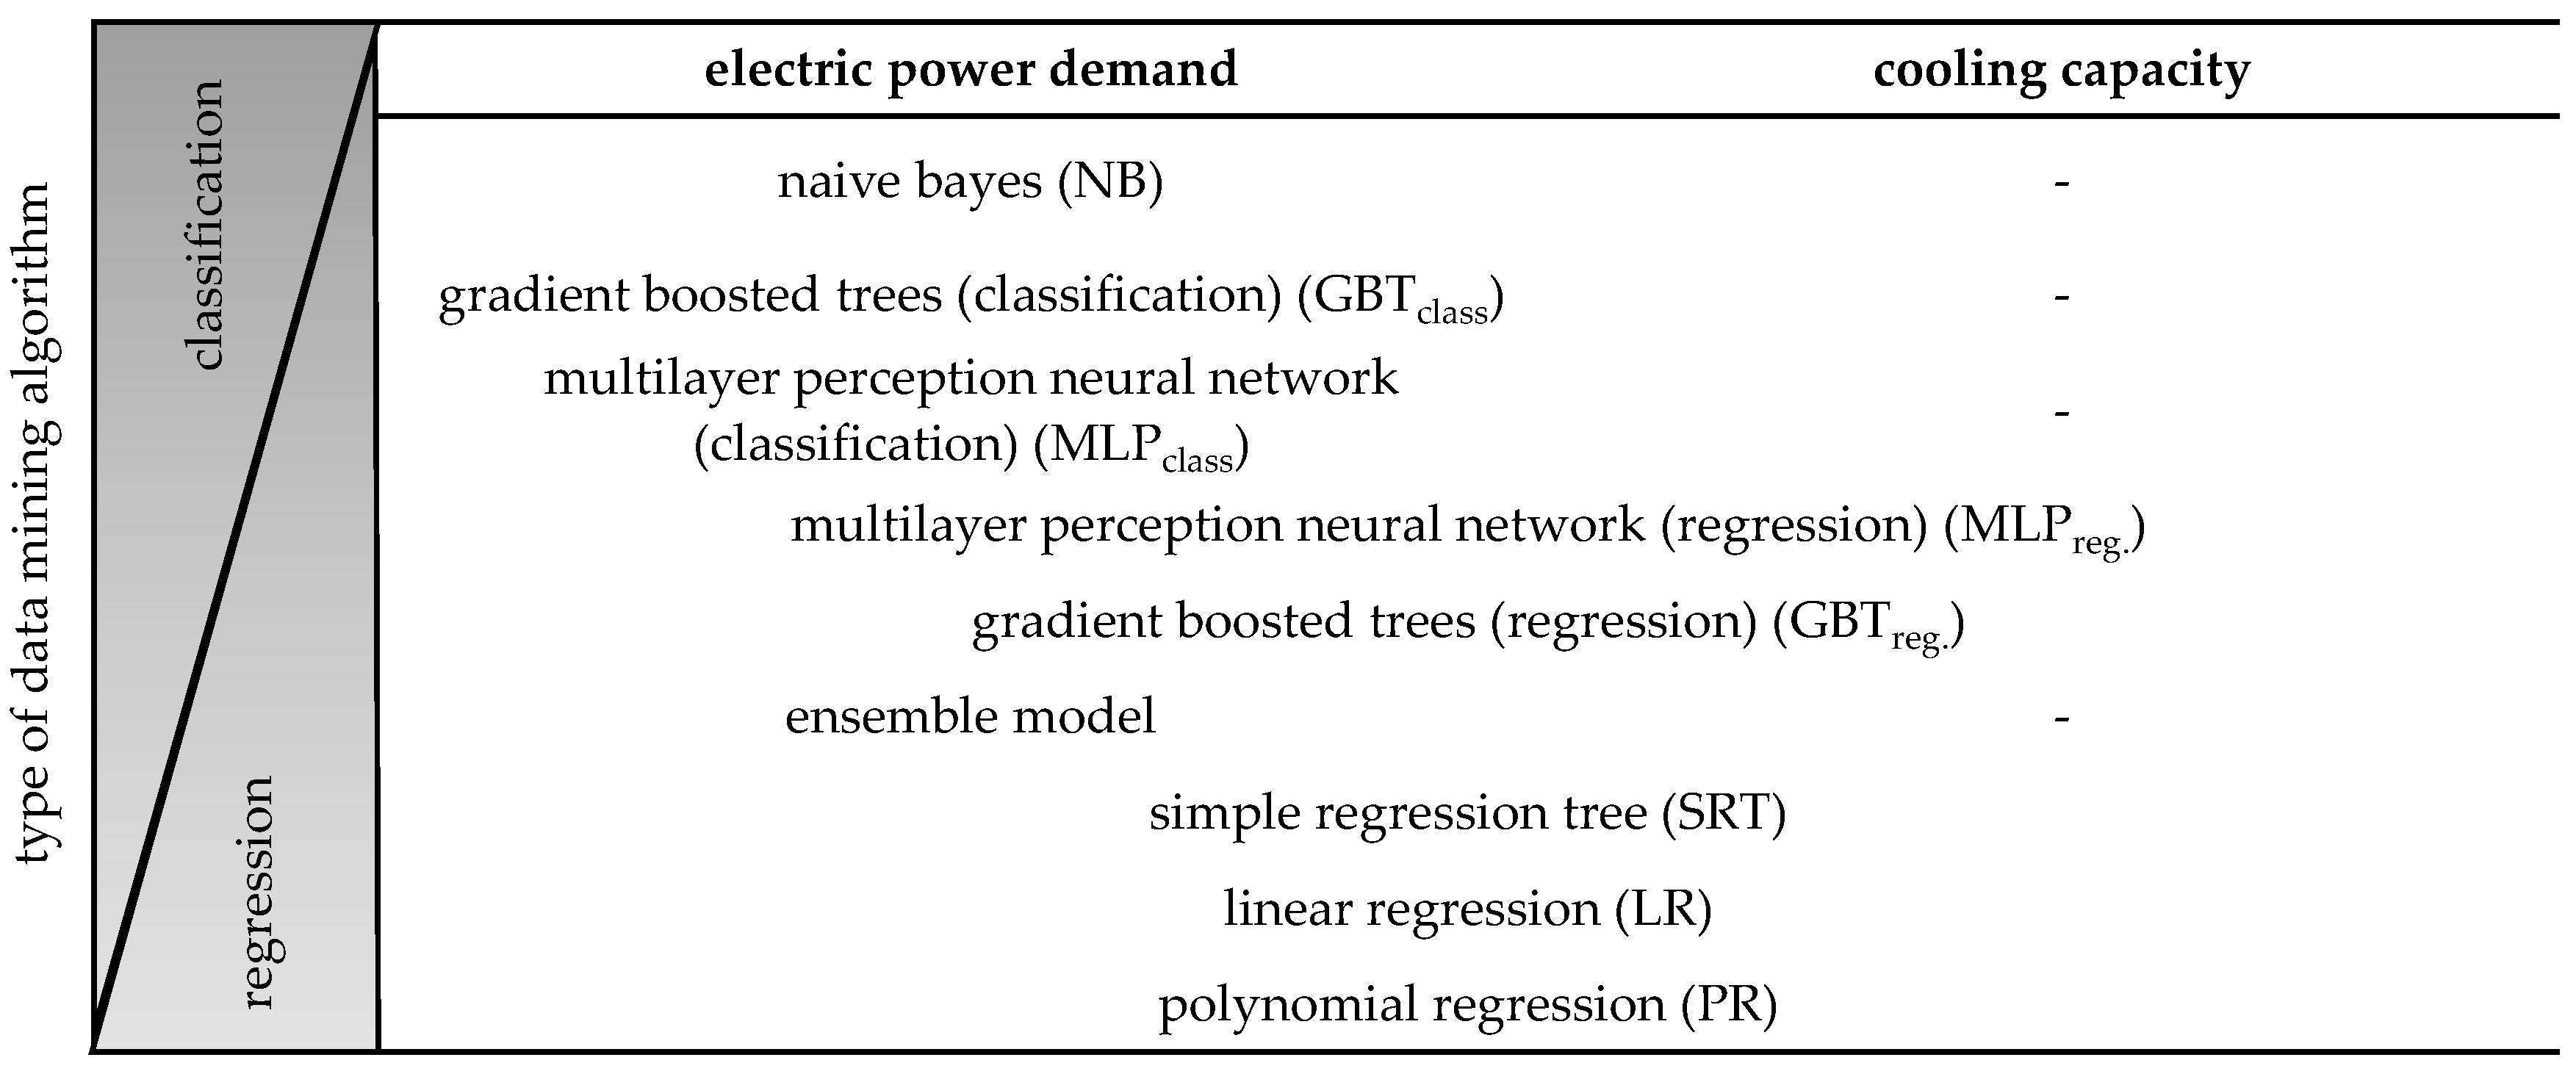
3.2. Creating a Data-Driven Digital Twin—A Data Mining Approach (Phase 2)

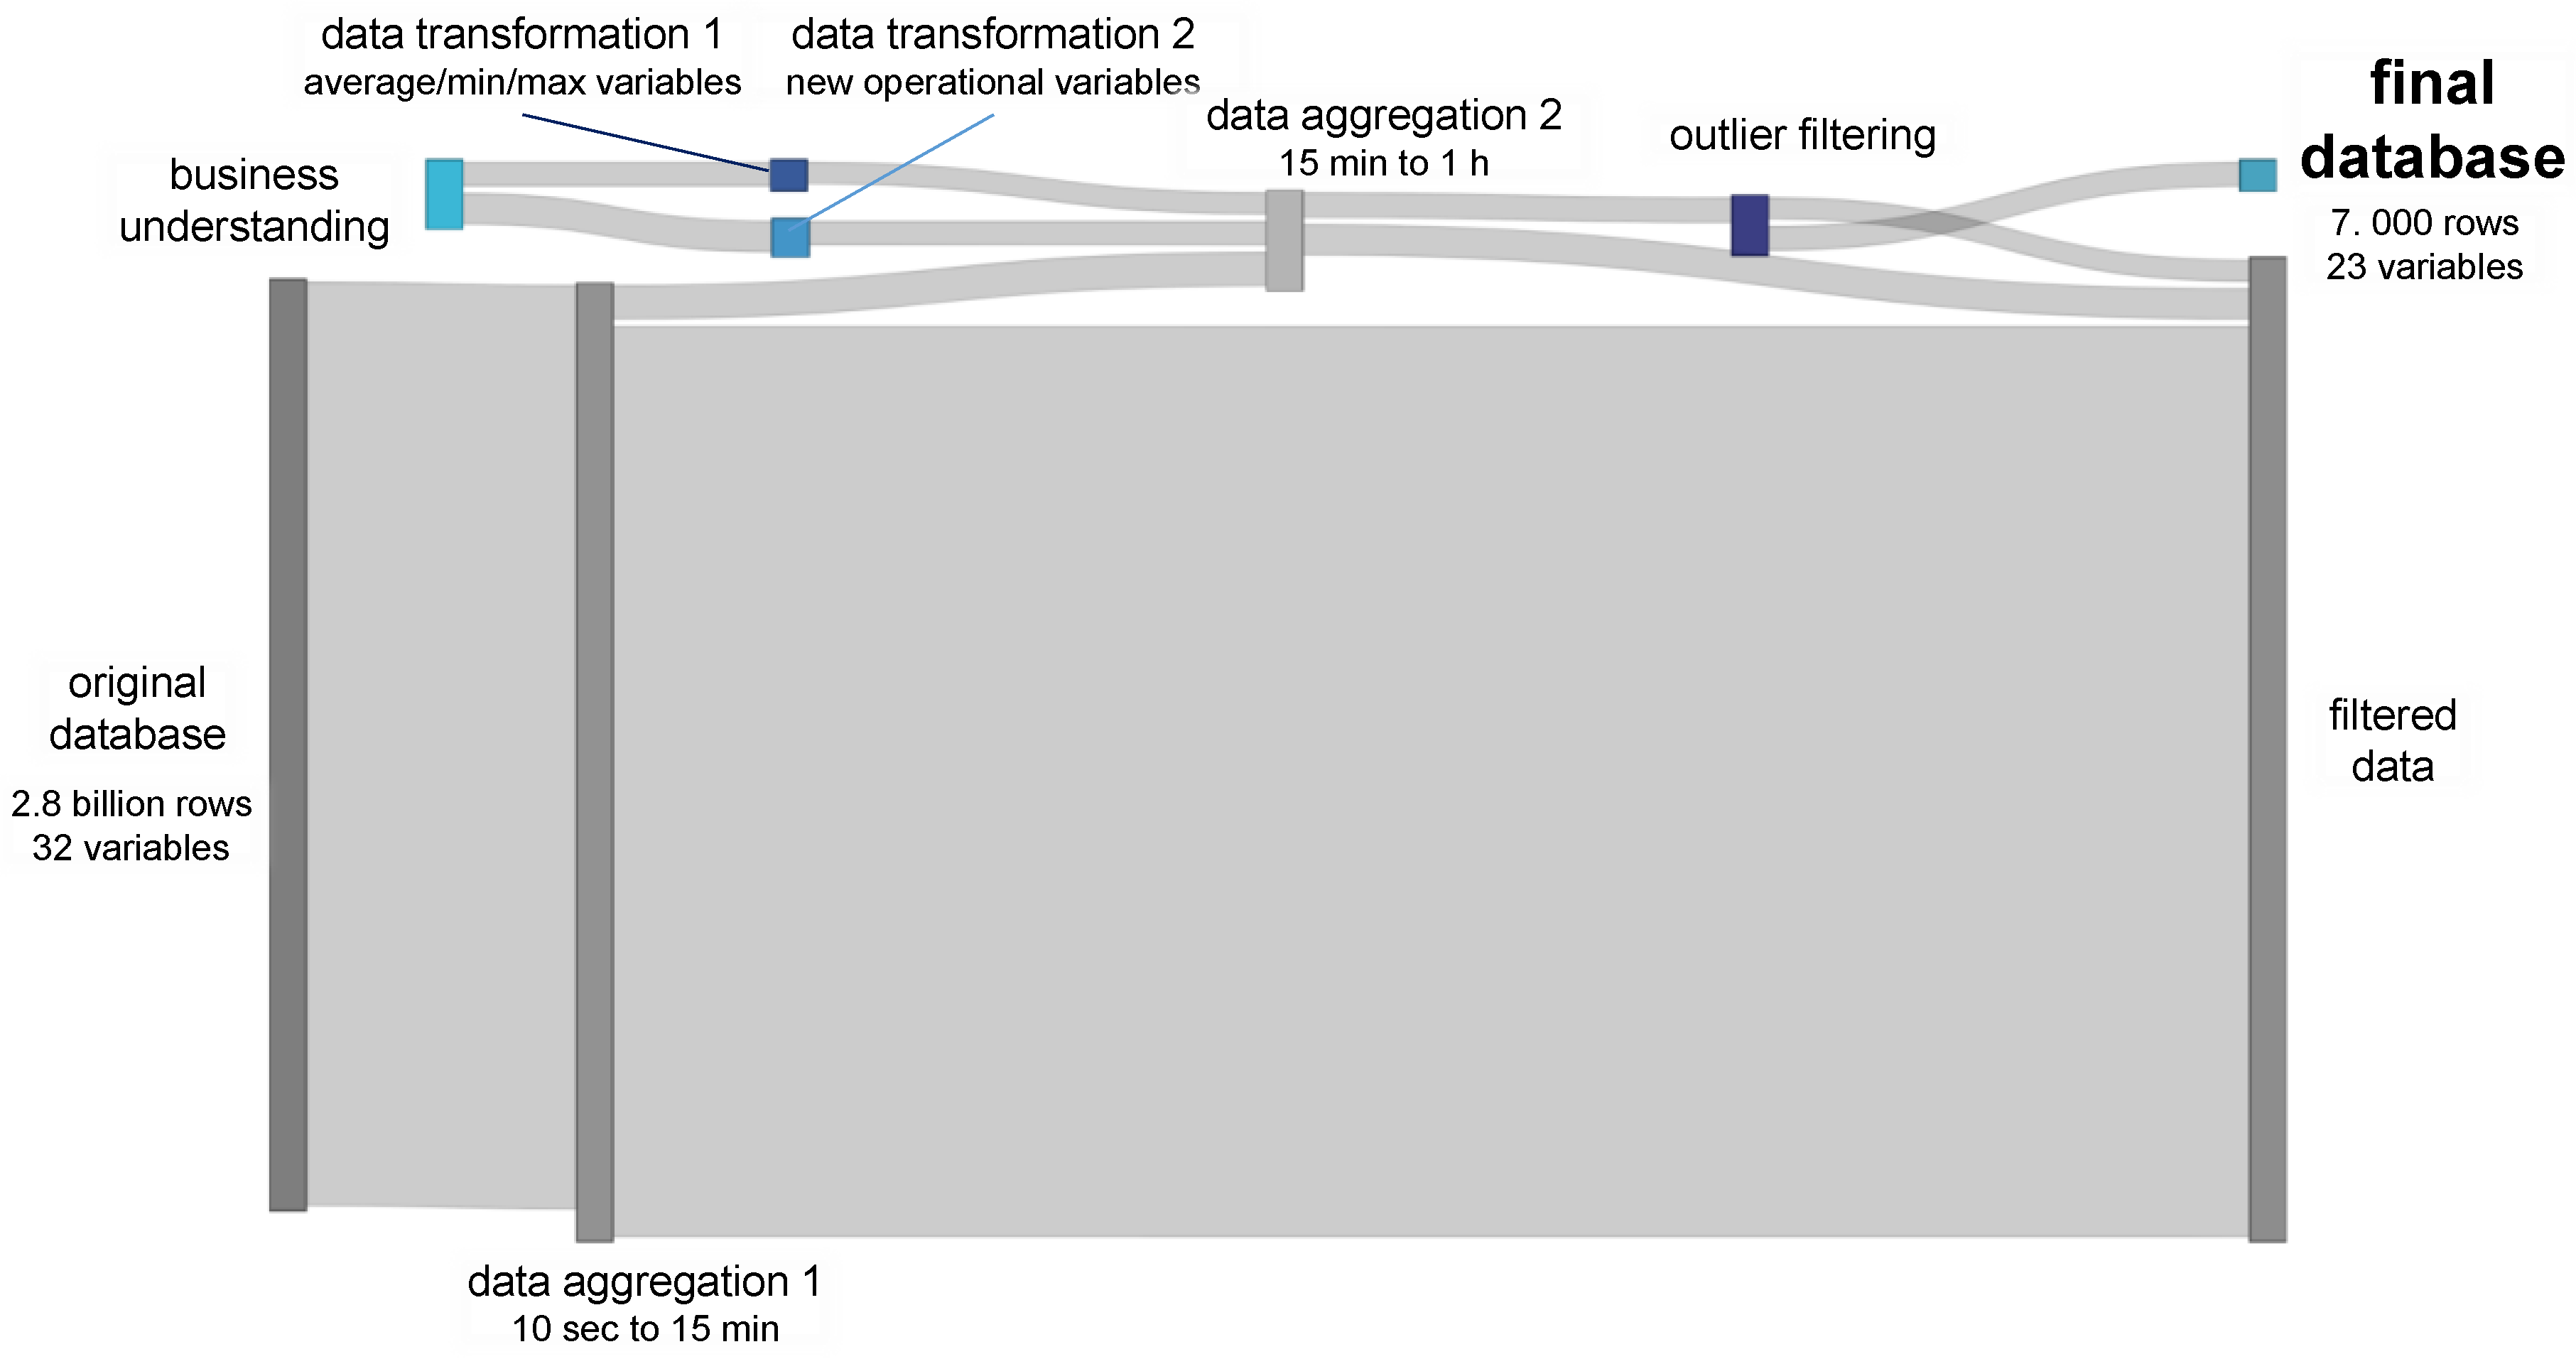
3.2.1. Data Selection and Outlier Filtering

For this case study, operational data of one full year is taken into account (August 2016 to July 2017), while data is gathered in ten second intervals. If all 32 measurands of the CT system are considered (compare Figure 5), the resulting database comprises over 2.8 billion rows. The first crucial step of DM is to get a general understanding of the database and to identify interdependencies [67]. Statistical and visualization techniques such as correlation matrix, box plots and time series diagrams provide important insights into data characteristics like trends and seasonality and they allow to detect outliers. In order to filter outliers from the data set, a ruleset is derived exploratively here based on the electric power demand, cooling capacity and water volume flow. Based on these three variables, the operational system status of the CT can be identified, i.e., normal operation mode can be distinguished from single events such as shut down or maintenance. If single data points significantly deviate from the median value, they are removed as outliers (compare [68]). For example, if a value is more than 40% above the median of the last three hours, it is removed. Furthermore, zero values are excluded from the dataset as they indicate shutdowns. Figure 9 illustrates the average weekly cooling capacities and electric power demands for every month over the year before—before outlier filtering Figure 9a and after outlier filtering Figure 9b. After data filtering, the variance is significantly lower and the data range is as expected according to CT system design.
Subsequently, an analysis of the linear correlation provides valuable insights into data interdependencies. The resulting matrix of Pearson correlation coefficients (PCC) (in Figure 10 indicates negative correlations in red color and positive correlations in green color. The PCC ranges from −1 to 1. A value of 1 implies a linear positive relationship between X and Y, while a value of −1 implies a linear negative relationship. A value of 0 implies that there is no linear correlation between the variables [69]. As highly intensive colors relate to high PCC values and thus a high linear correlation between variables, the most relevant variables can easily be identified visually. These include environmental conditions, i.e., ambient air temperature and relative humidity, the temperature of warm and cold water storages, seasonal impacts such as the activity of heat sources and connected pumping stations, as well as time indicators such as weekdays and hours of the day. In order to improve information density, available variables are consolidated and aggregated, if necessary. This particularly affects variables representing technical devices with similar behavior or purpose such as pumps, fans or heat sources. Additionally, new parameters could be constructed to a tailored parameter set achieving the aspired decision support, such as EER and cooling capacity.

3.2.2. Data Aggregation and Transformation

In order to improve data management and efficiency of the DM process, the database is aggregated from original ten second intervals to hourly intervals. Furthermore, the reduction of used variables is examined. Combining variables of similar system components entails only a small loss of information whereas the information content of each variable increases. The combination and transformation of variables is exemplified in Equation (4) for active heat sources in the CT system. As explained in Figure 5, the considered CT system includes four heat exchangers representing the heat sources. If a heat source is active, it emits waste heat in form of warm water to the CT. The activity is described as a binary value. However, the respective share of waste heat to the warm water flow cannot be allocated to the individual heat source. Thus, an evenly distribution of the waste heat sources is assumed and the current number of active heat sources is derived.
heat   source active = i = 1 4 activity heat   source ,   i
with   activity heat   source ,   i = { 0 ,   if   heat   source   is   not   active 1 ,   if   heat   source   is   active  
The same procedure is used for the number of active CT fans, forward flow pumps and backward flow pumps. Thereby, all binary values are formatted into continuous values, indicating how long system components are proportionately active in the interval. Moreover, according to [51], it might be helpful to use additional historical values of the variables, such as values of the day before. Therefore, several new parameters are introduced based on the previous day (marked with (−1) (variable name)), including average and extreme values (minimum, maximum). Furthermore, variables specific for CT operation and decision making are established in the final database, such as EER (comp. Equation (2)), electric power demand and cooling capacity. Figure 11 illustrates the development of data quantities in each processing step in a Sankey diagram. Data aggregation steps 1 and 2 reduce data quantities by approximately 99%. Subsequently, a further outlier filtering follows and data is then merged with the newly established variables to form the final database. After all processing steps, the data quantity is reduced from former 2.8 billion rows and 32 variables to approximately 7 thousand rows and 23 variables. Utilizing this data with higher information density is assumed to increase computational times and prediction accuracy.

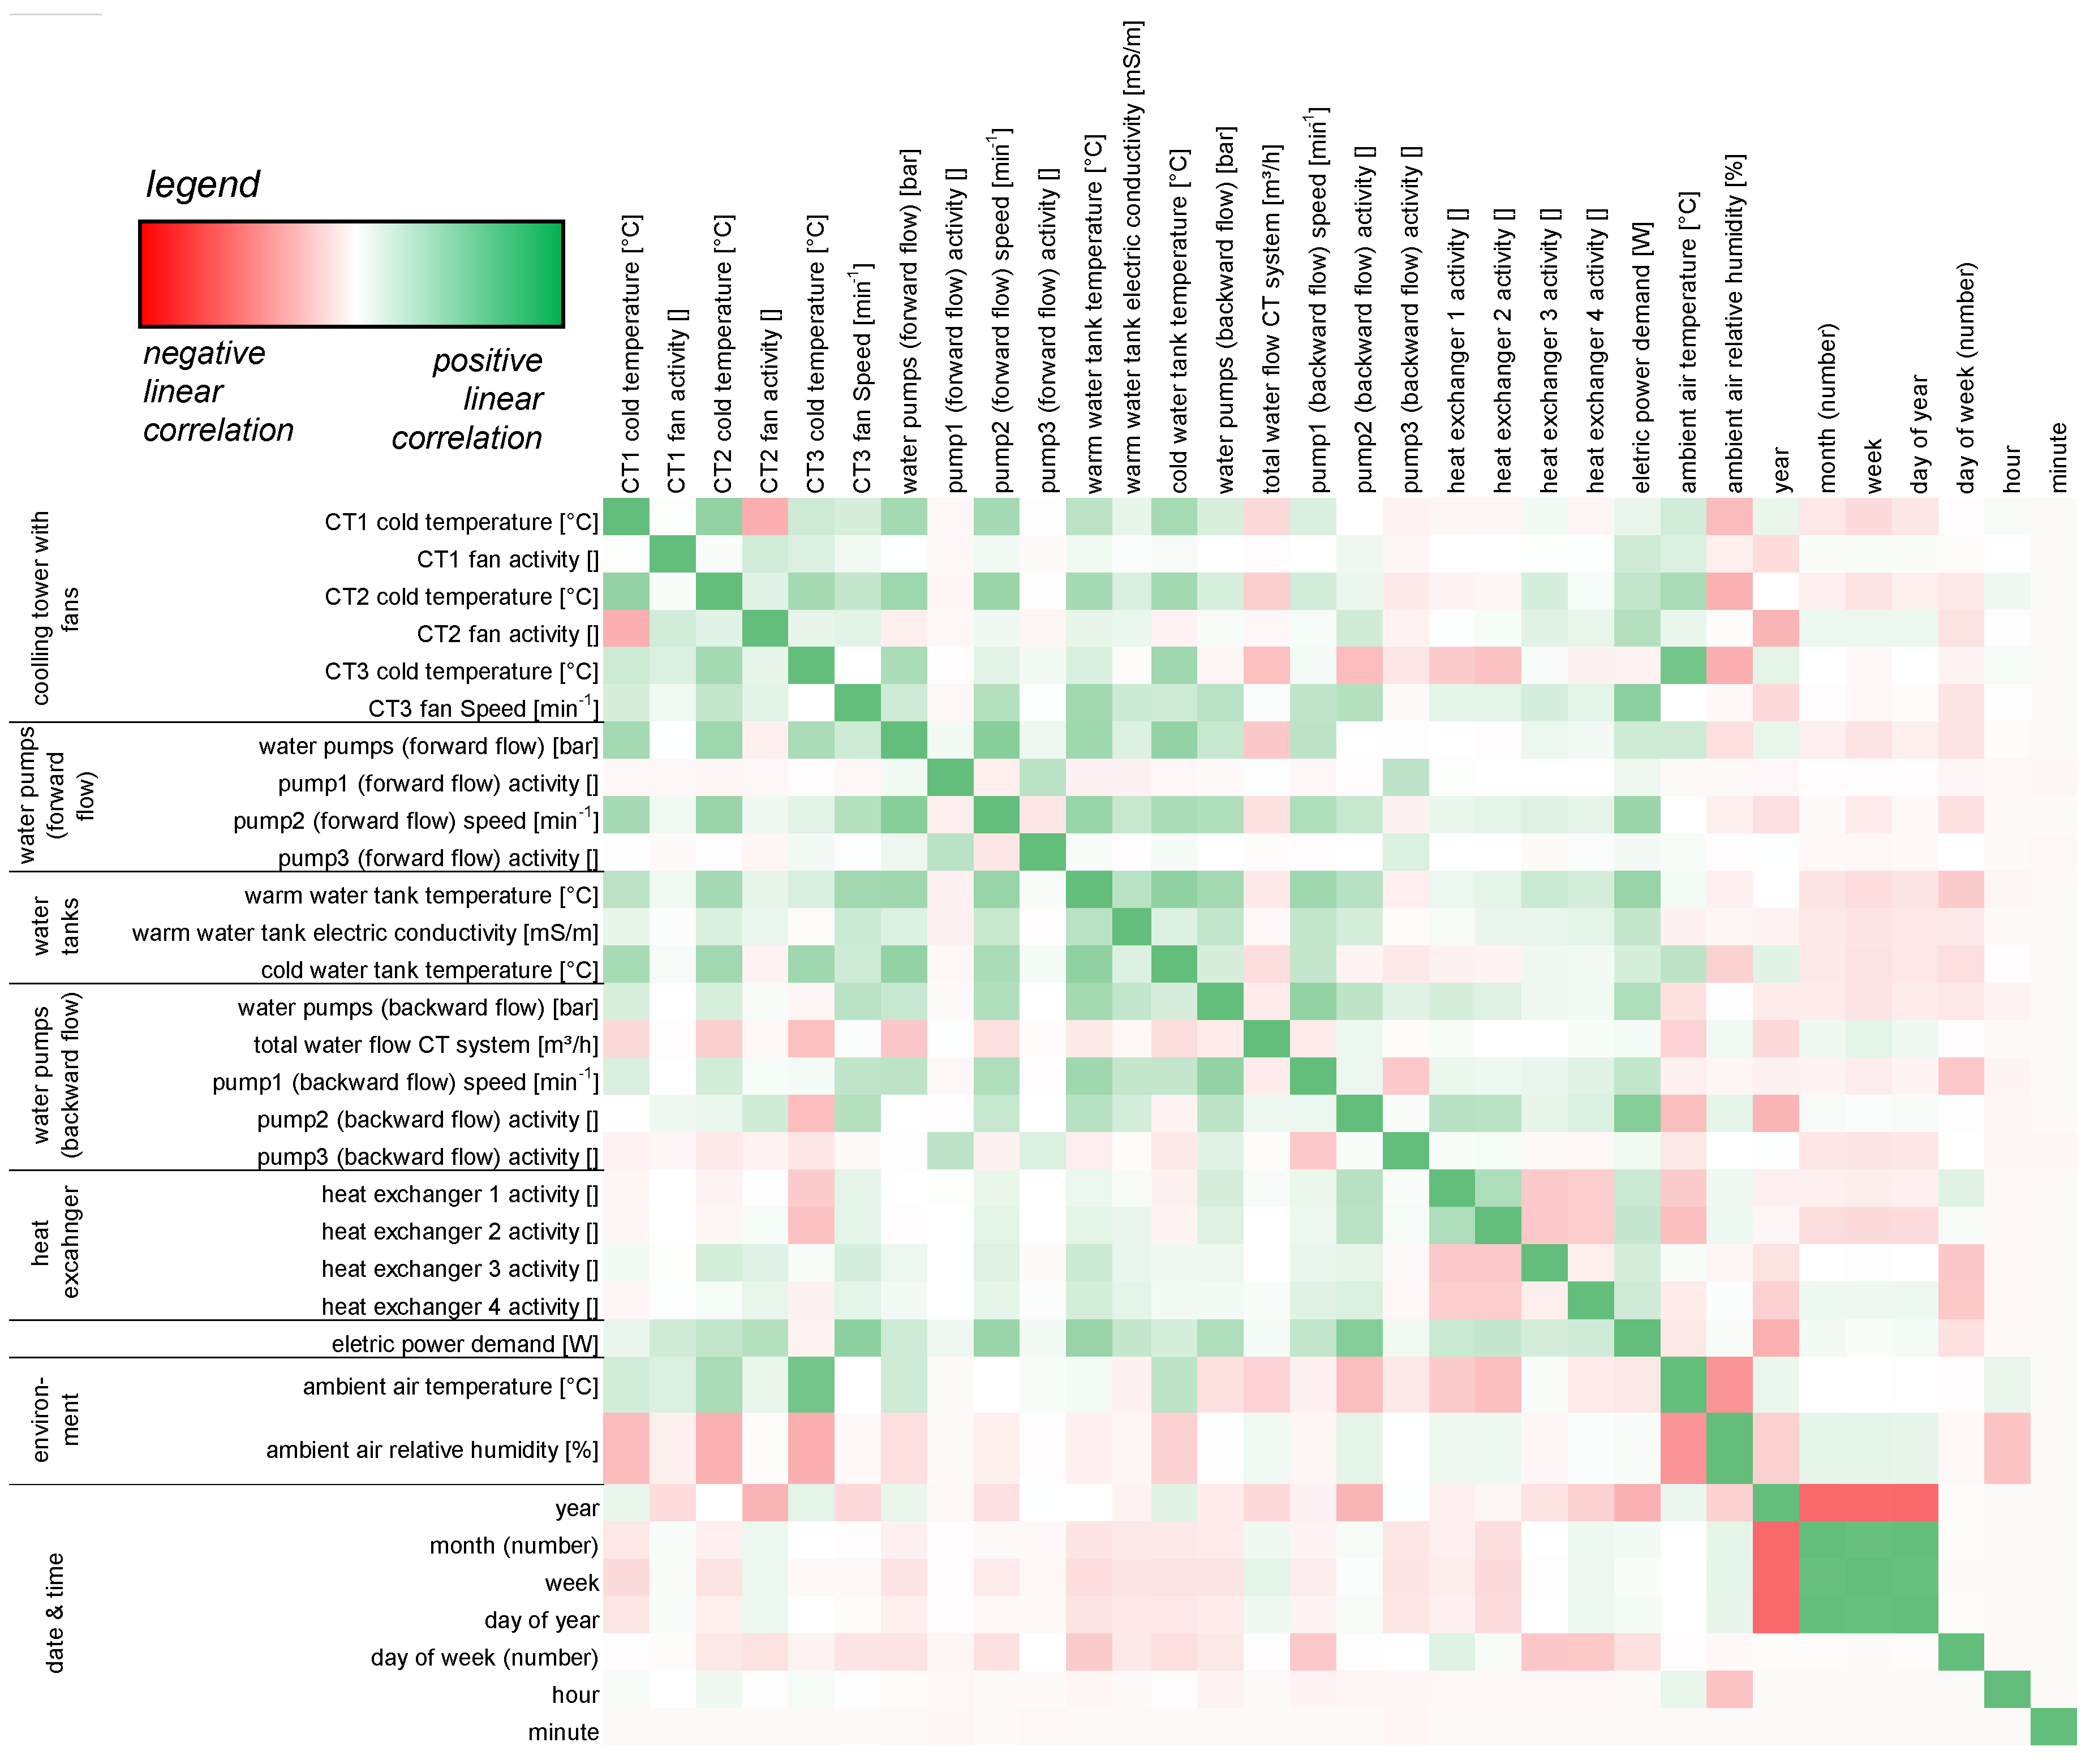
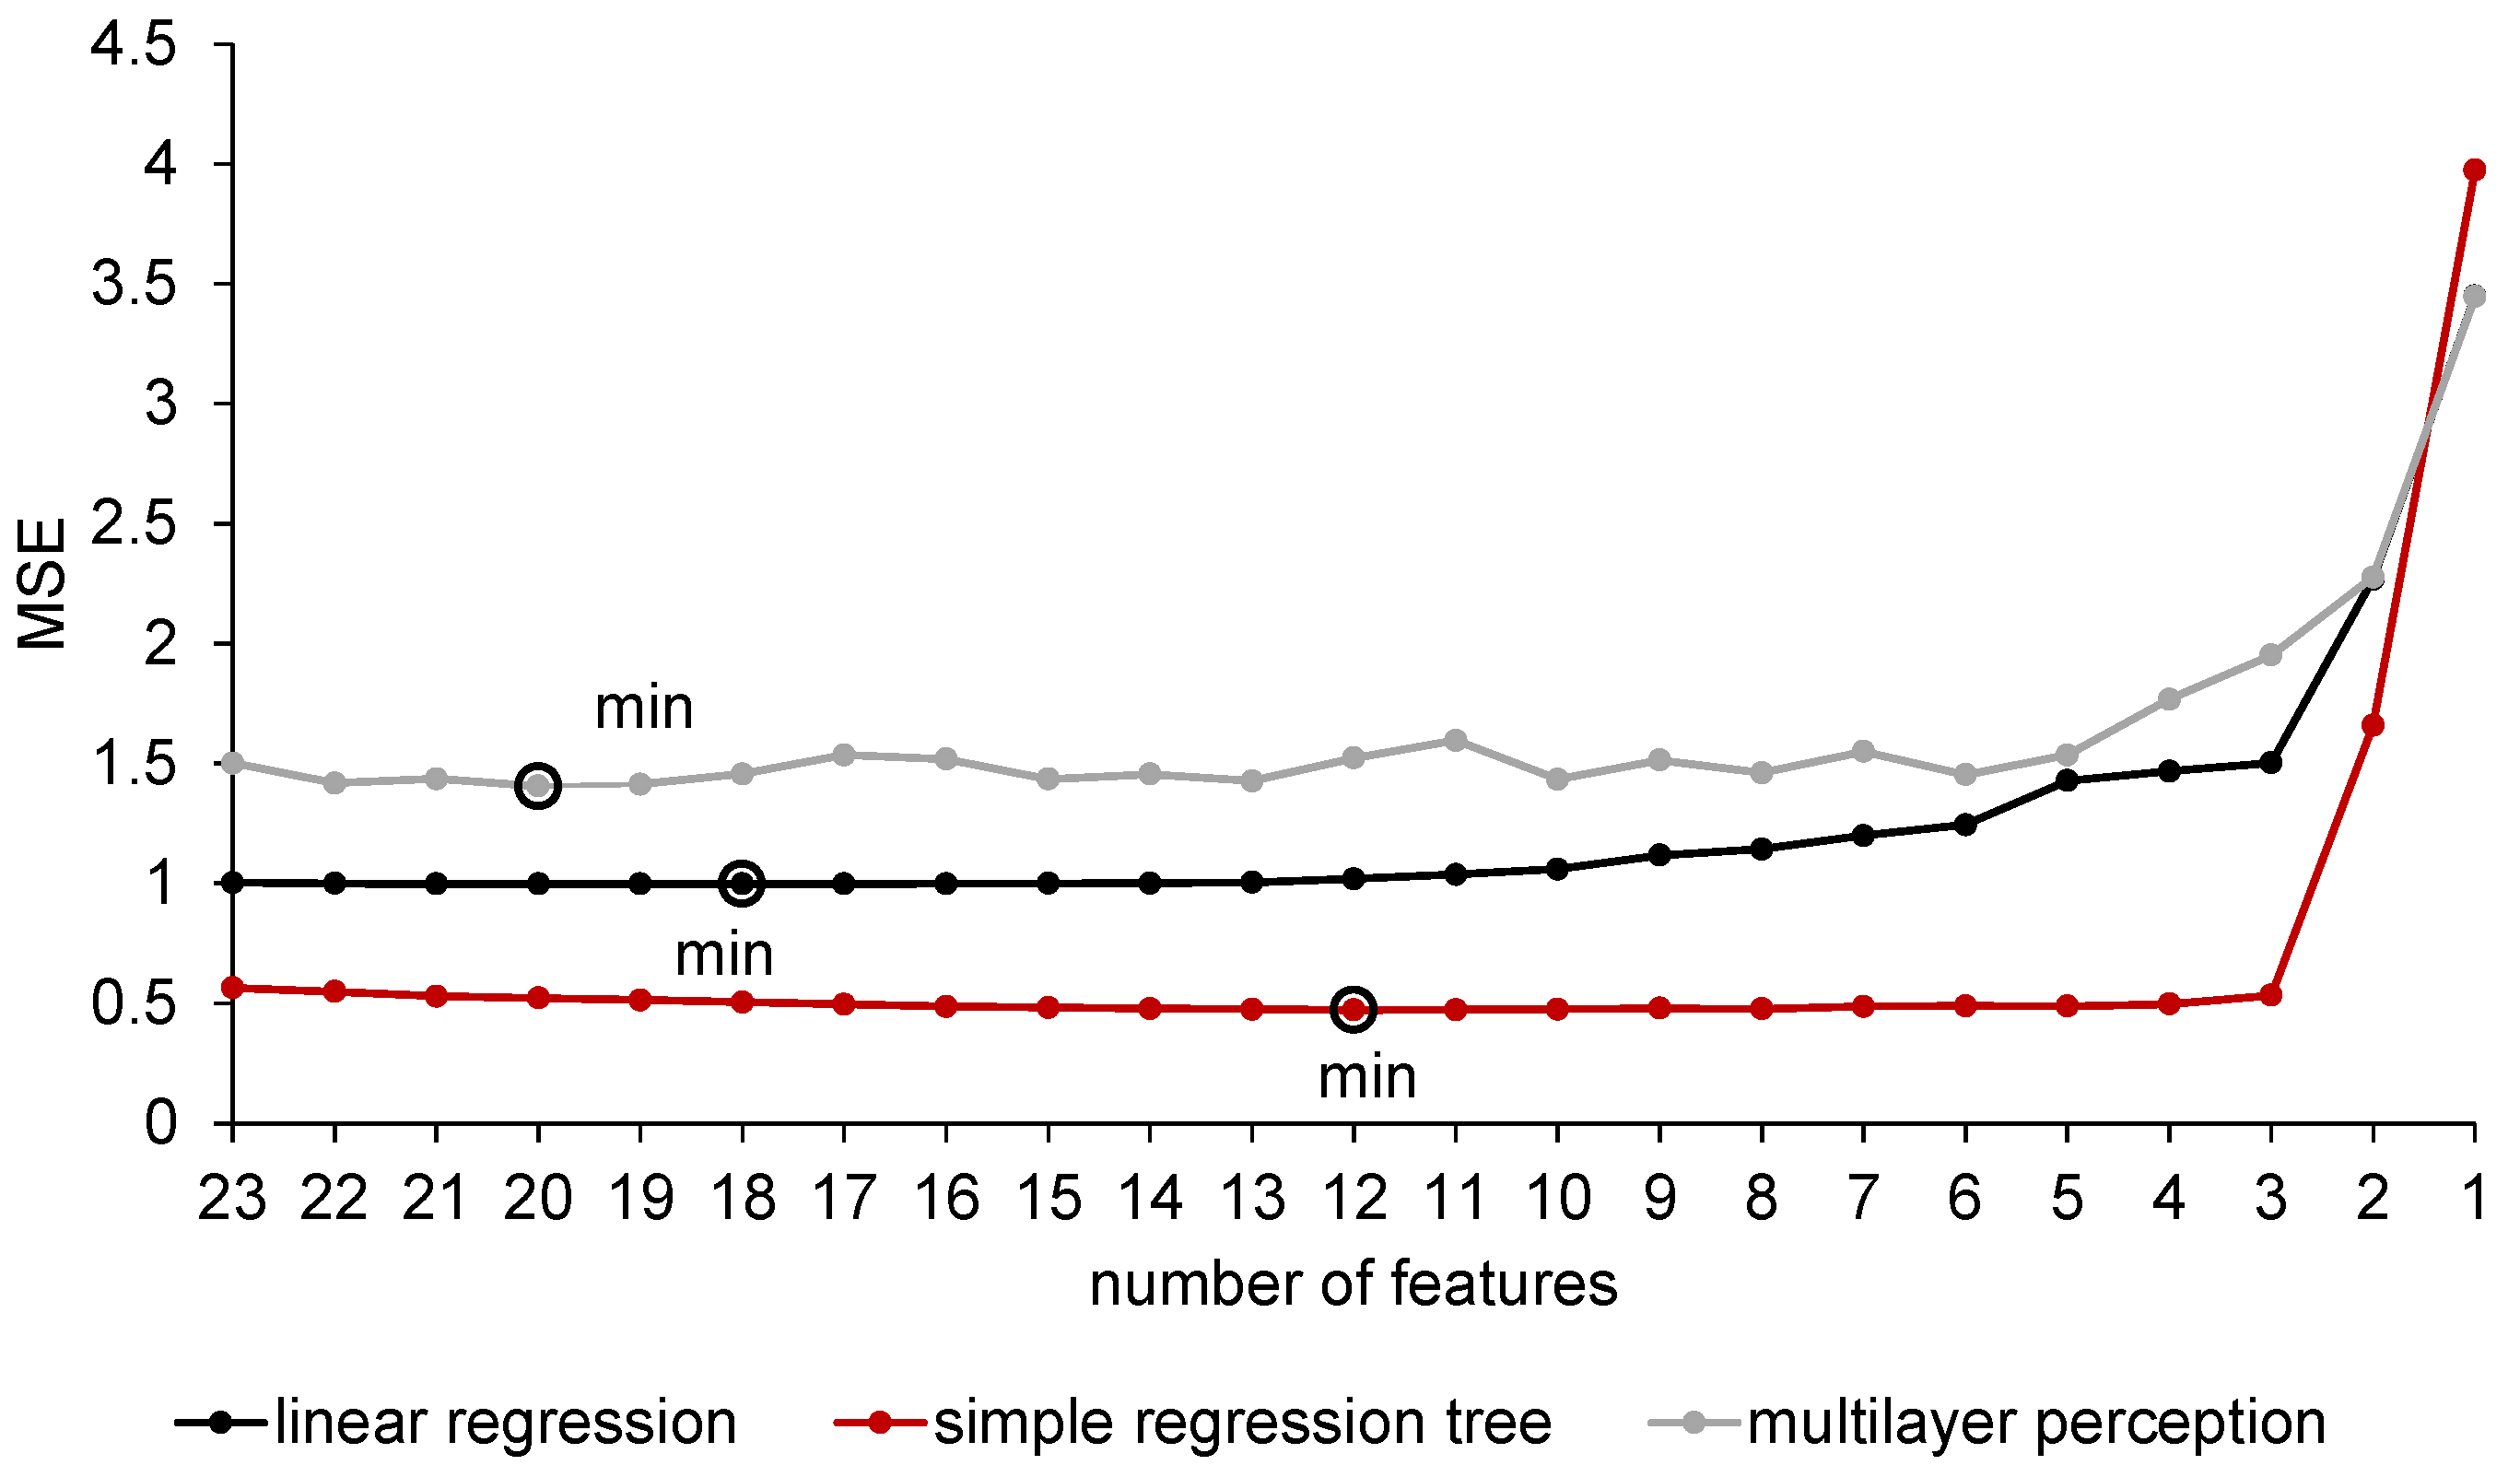
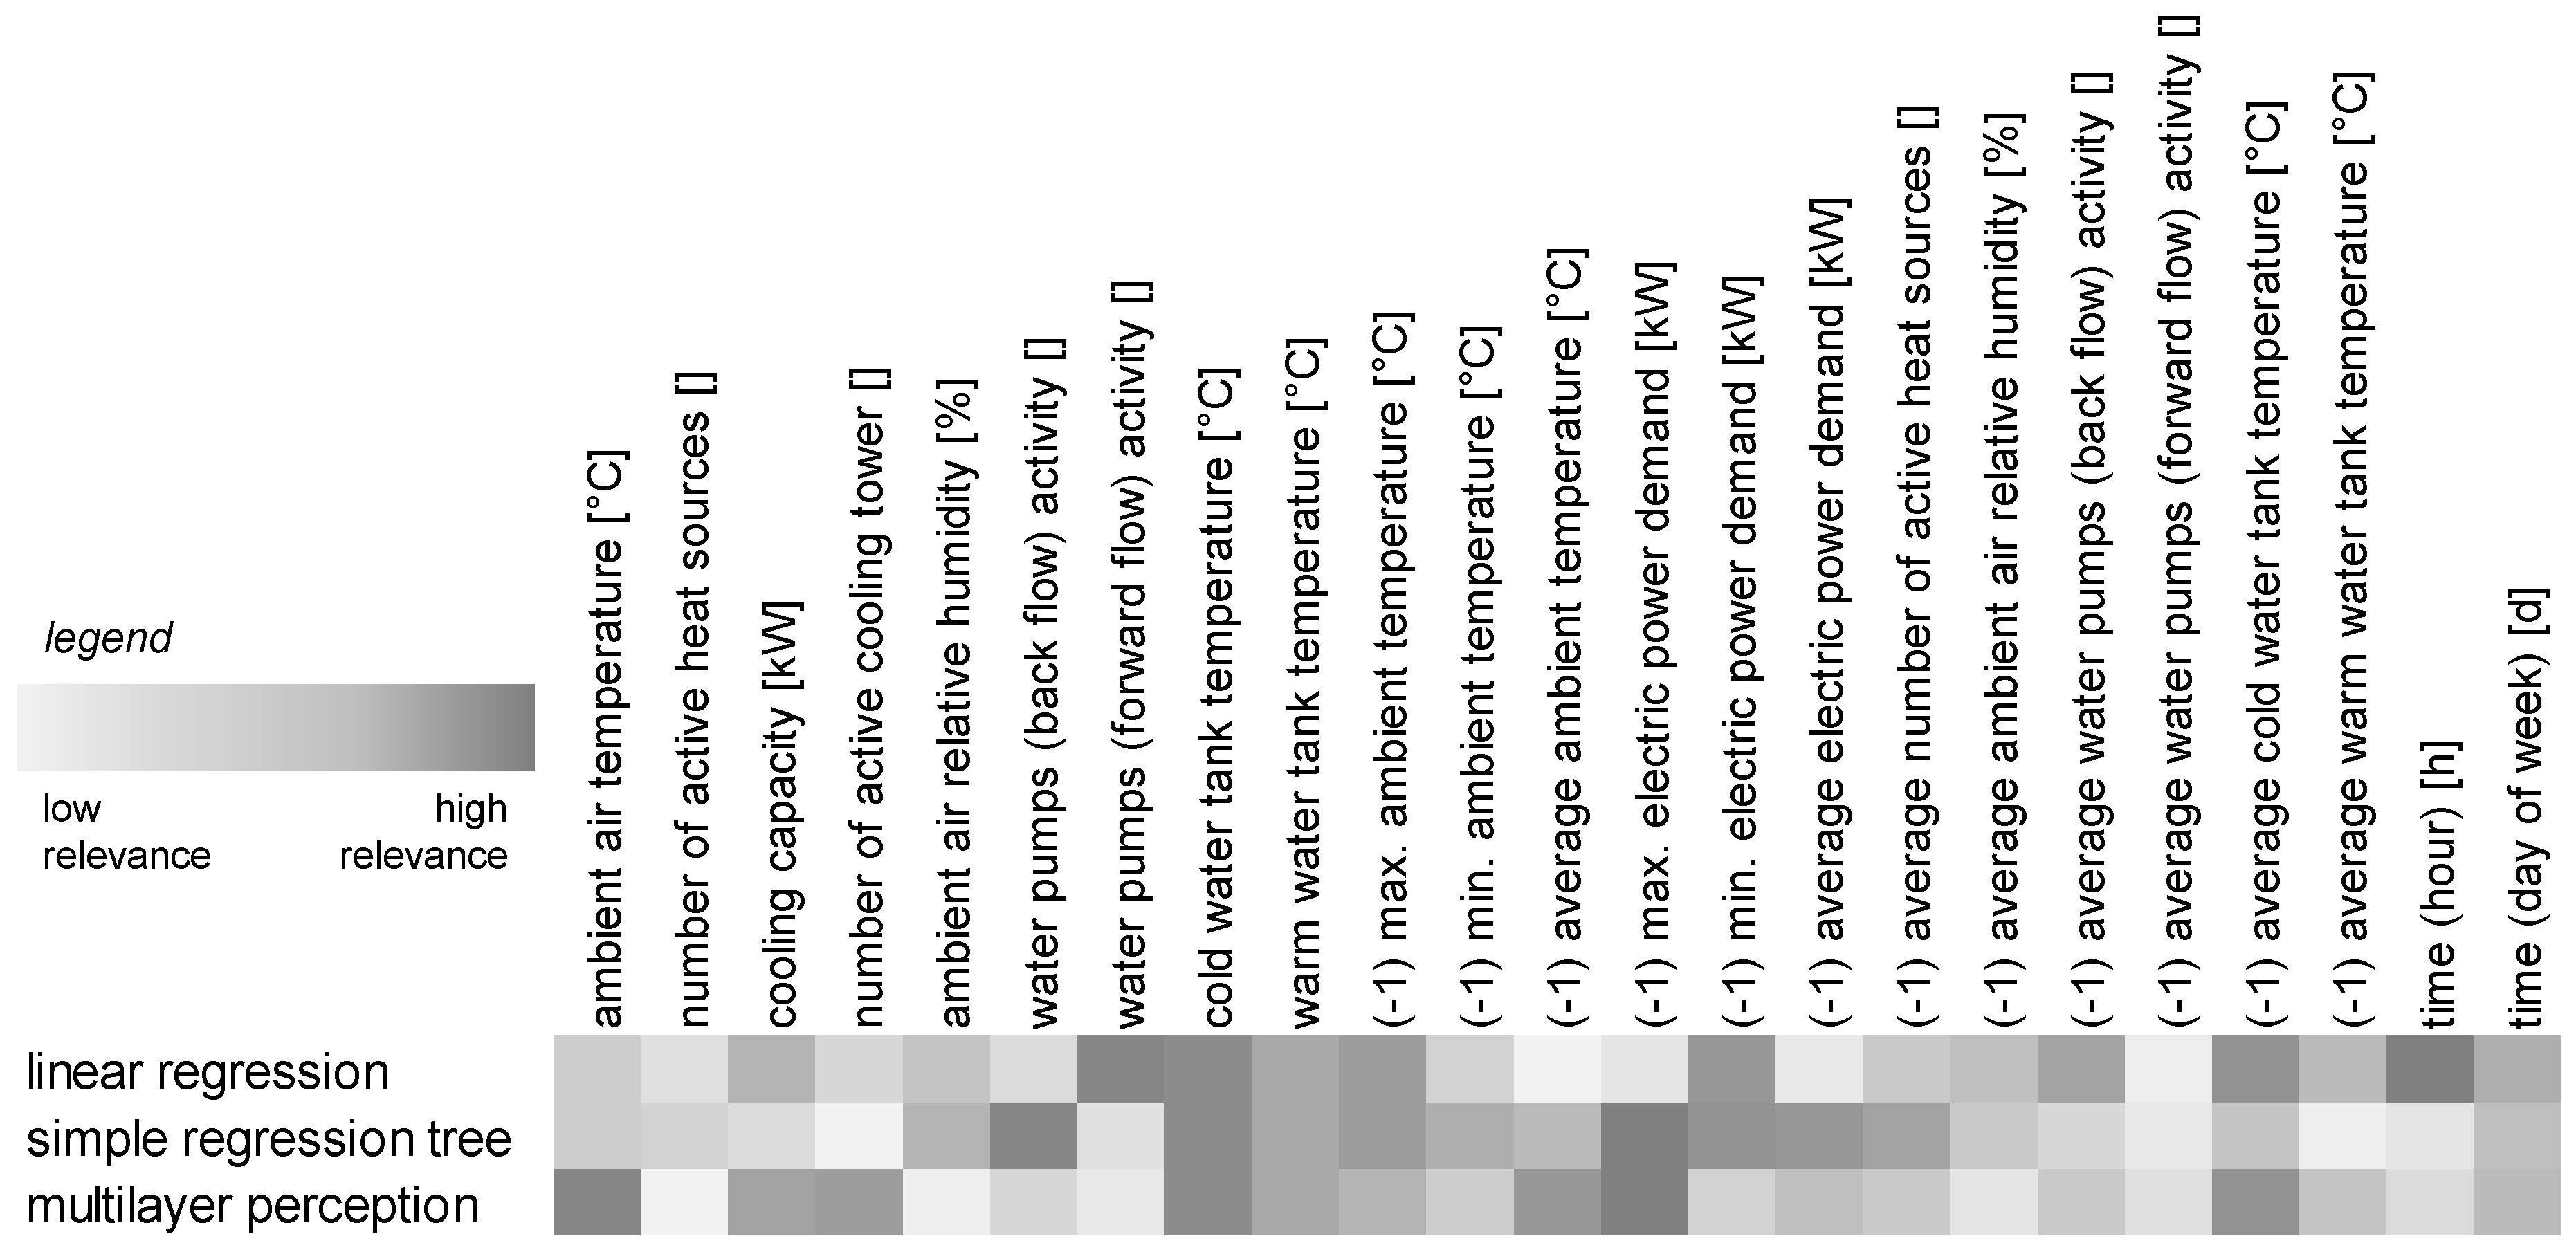
3.2.3. Feature Selection

A subsequent backward feature elimination procedure aims to assess the significance of variables for the applied DM algorithms. This crucial procedure is applied on every selected algorithm individually. For the use case, results are demonstrated for linear regression (LR), simple regression tree (SRT) and ANN multilayer perception (MLP) exemplarily. Figure 12 depicts resulting mean squared errors (MSE), indicating errors to predict the electric power demand in every step of the backward feature elimination. Variables with the greatest contribution to reduce prediction errors are removed last, i.e., the later a variable is removed, the more important it is for the model. As expected, MSE values generally increase with a decreasing number of variables used for prediction. However, the highest number of variables does not necessarily lead to minimal prediction errors. For this example, minimum MSE are achieved by consideration of 12 (SRT), 18 (LR) and 20 (MLP) features. Thus, a high data acquisition effort does not necessarily result in improved prediction results. Rather it is important to capture the most relevant variables in good quality and high resolution.
Throughout the backward feature elimination, the order in which variables are removed differs significantly between applied DM algorithms. However, variables representing activities of system components (CT fans, forward flow pumps, return flow pumps) are high-ranked for all algorithms. Thus, they can generally be assumed as very important features. Figure 13 illustrates the relevance of variables for the different algorithms in form of a heat map, while the relevance increases with darkening grey color.

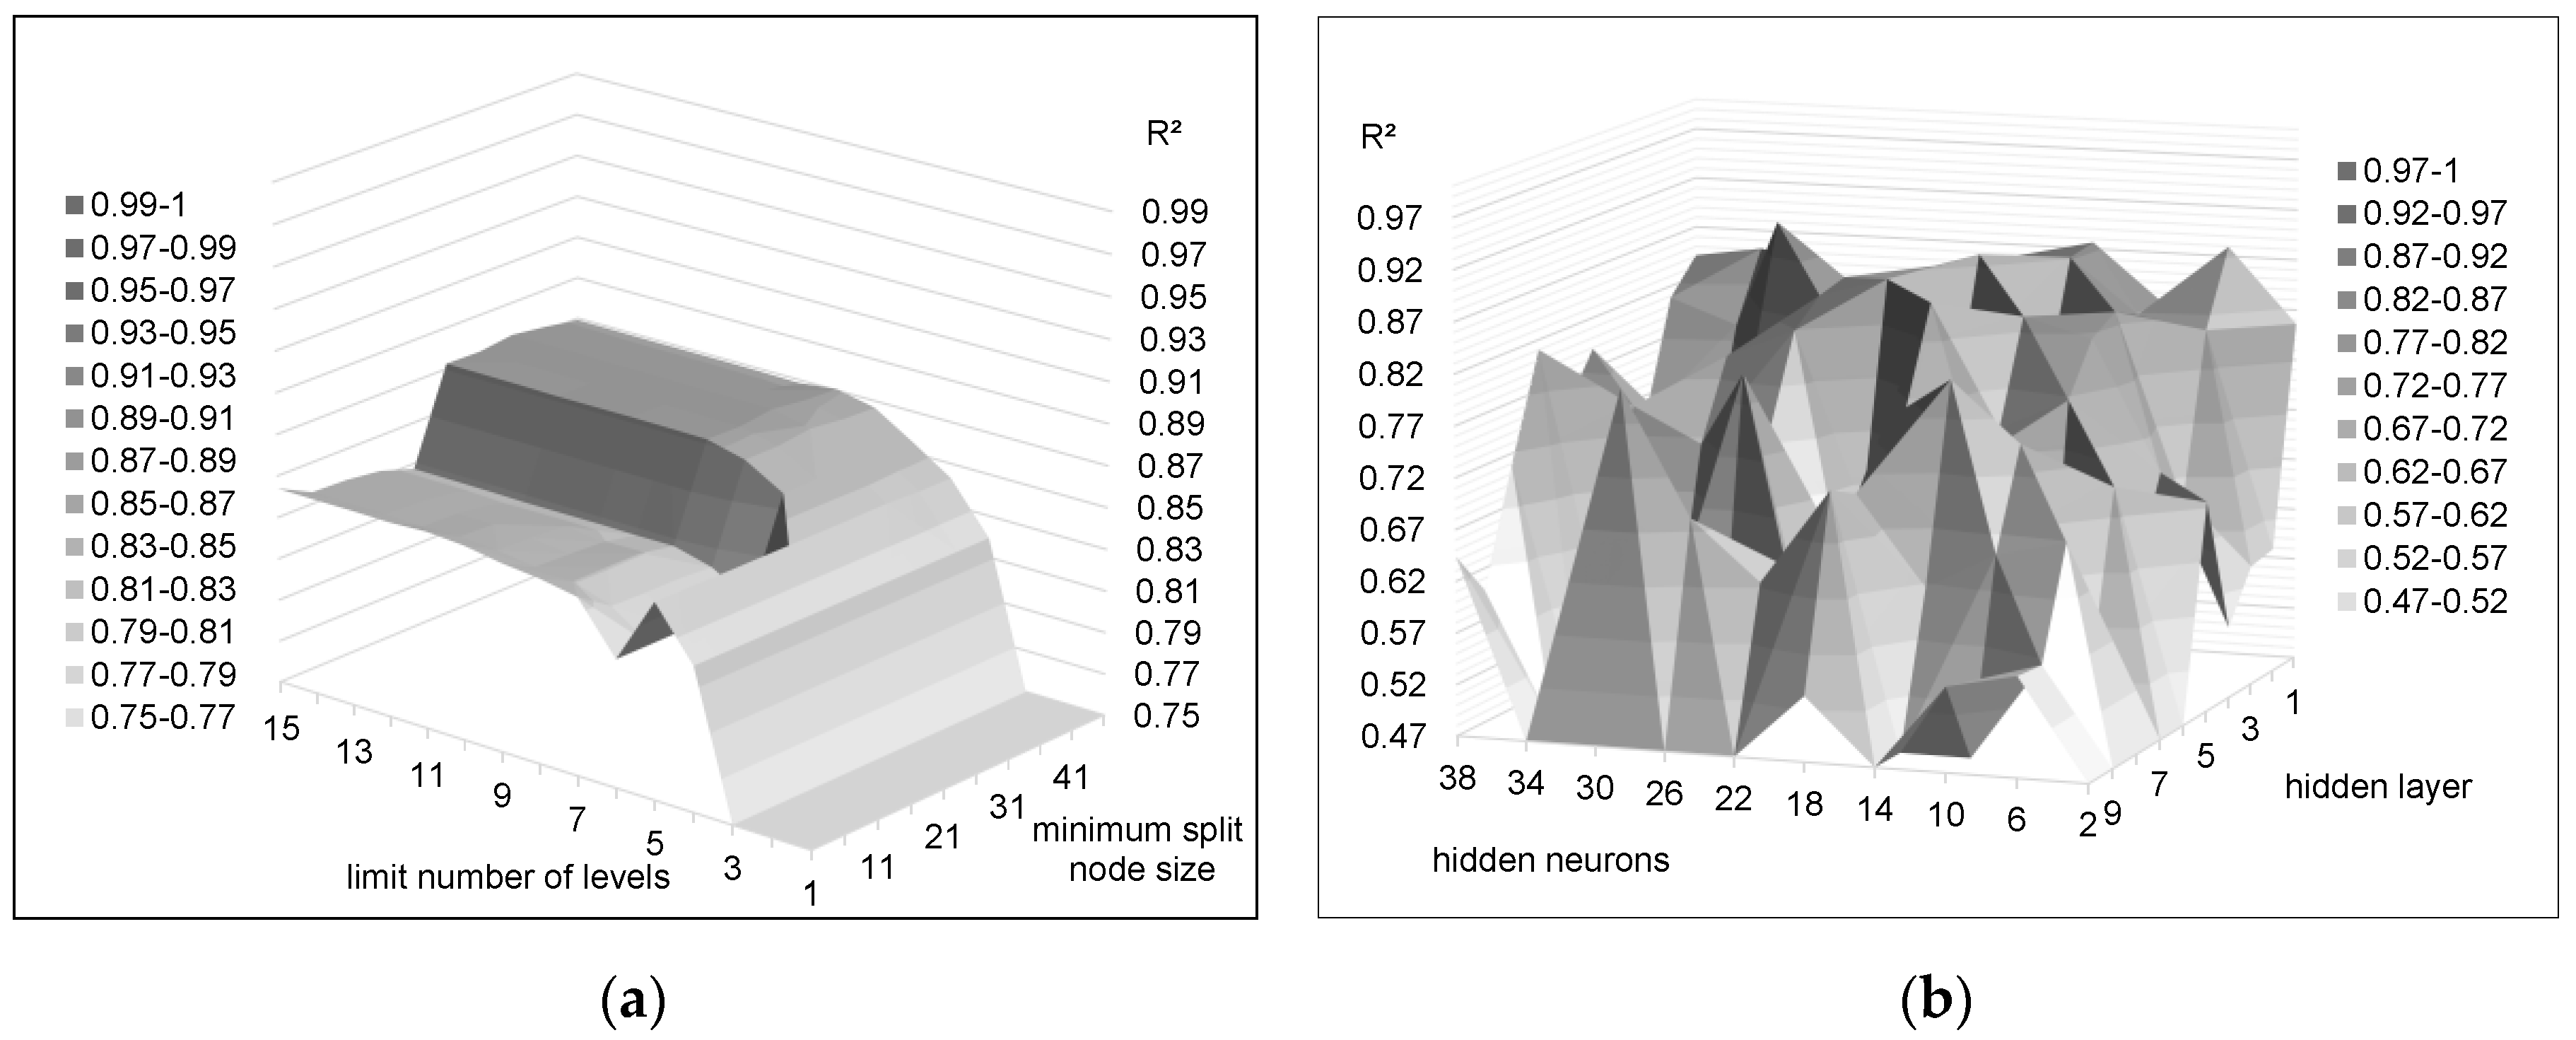
3.2.4. Hyperparameter Assessment

In the following, results of the hyperparameter assessment applied on SRT and MLP algorithms for the target variable electric power demand are described exemplarily. Surface plots help to illustrate the importance of a thorough assessment of hyperparameters, as coefficients of determination (R2) can be significantly improved when hyperparameters are set optimally. Figure 14a illustrates results for the SRT algorithm, where hyperparameters are the limit number of levels (i.e., the maximum depth of the decision tree) and the minimum split node size (i.e., the minimum number of records per branch in the decision tree). High R2 values are reached if the limit number of levels is increased to 10 while choosing a minimum split node size of more than 31. Beyond that, no significant further improvements can be observed. The hyperparameter assessment for the MLP algorithm considers the number of hidden layers and the number of neurons per hidden layer (=hidden neurons) as hyperparameters. As Figure 14b illustrates, no clear correlations between R2 and hyperparameter values could be detected. Consequently, an individual and software-supported automated hyperparameter assessment is recommendable for MLP instead of using experience values. In this case study, 3 hidden layers and 30 neurons per hidden layer are identified as optimal hyperparameter values.

3.3. Evaluation and Deployment of Data Mining Results (Phase 3)

Finally, the DM process is applied. Considering results of the business understanding step, target variables for prediction are cooling capacity and electric power demand. As various algorithms are basically suitable for this task, an assessment of five algorithms predicting cooling capacity and nine algorithms predicting electric power demand is conducted. Results are comparatively evaluated regarding their coefficient of determination (R2) and mean absolute error (MAE) in relation to the computational time. Detailed results, including mean absolute errors (MAE) and mean absolute percentage errors (MAPE), can be found in Appendix A.

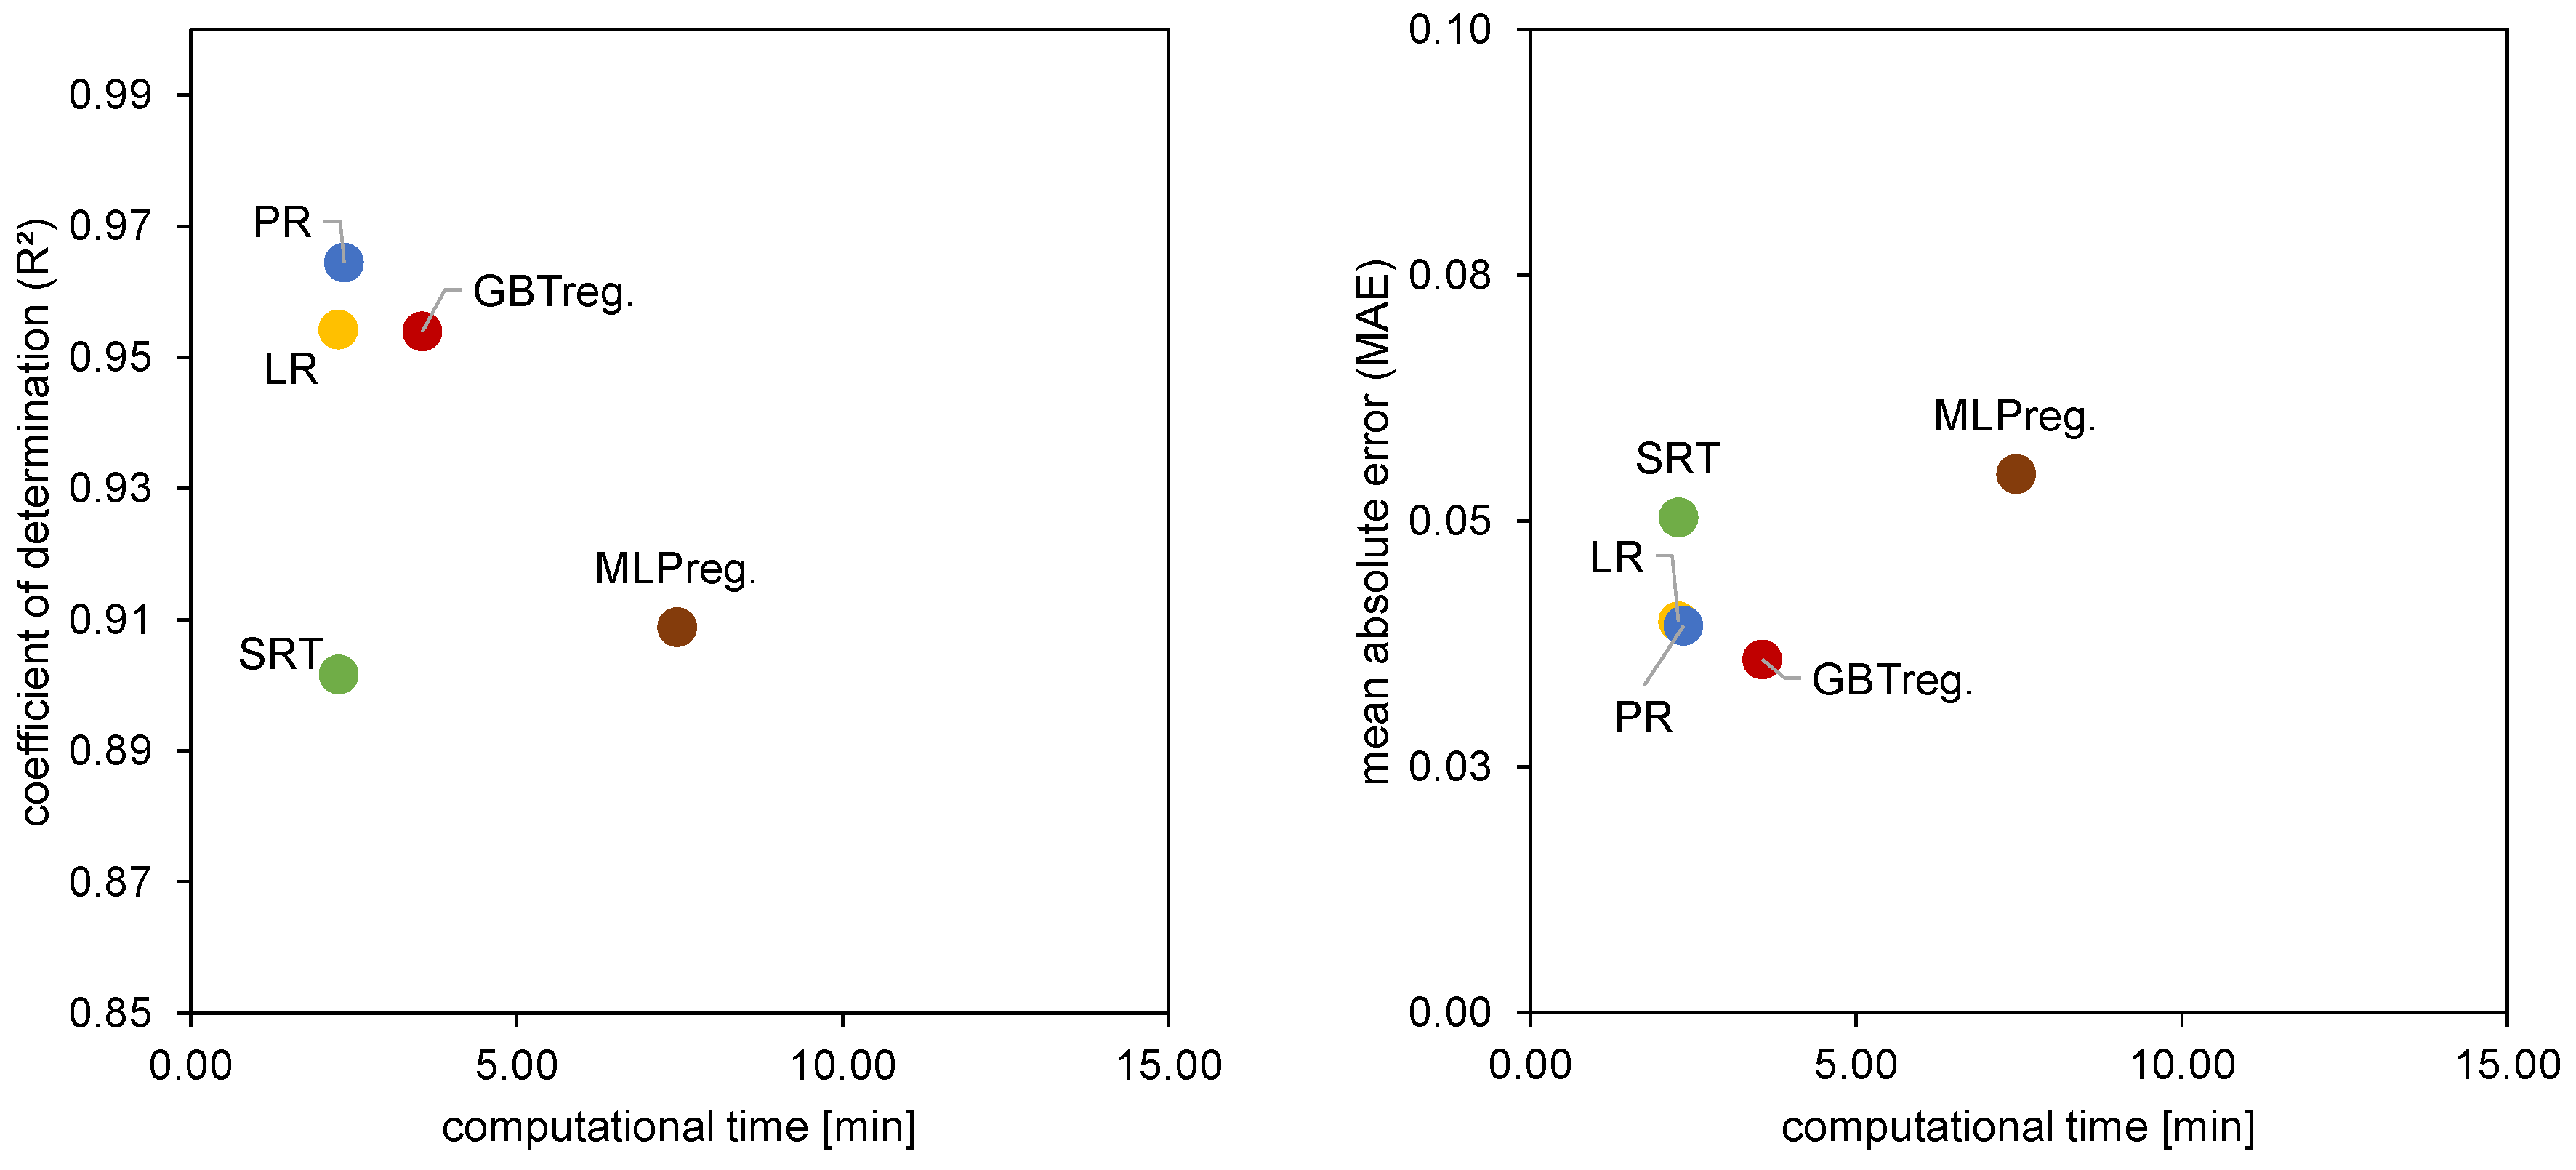
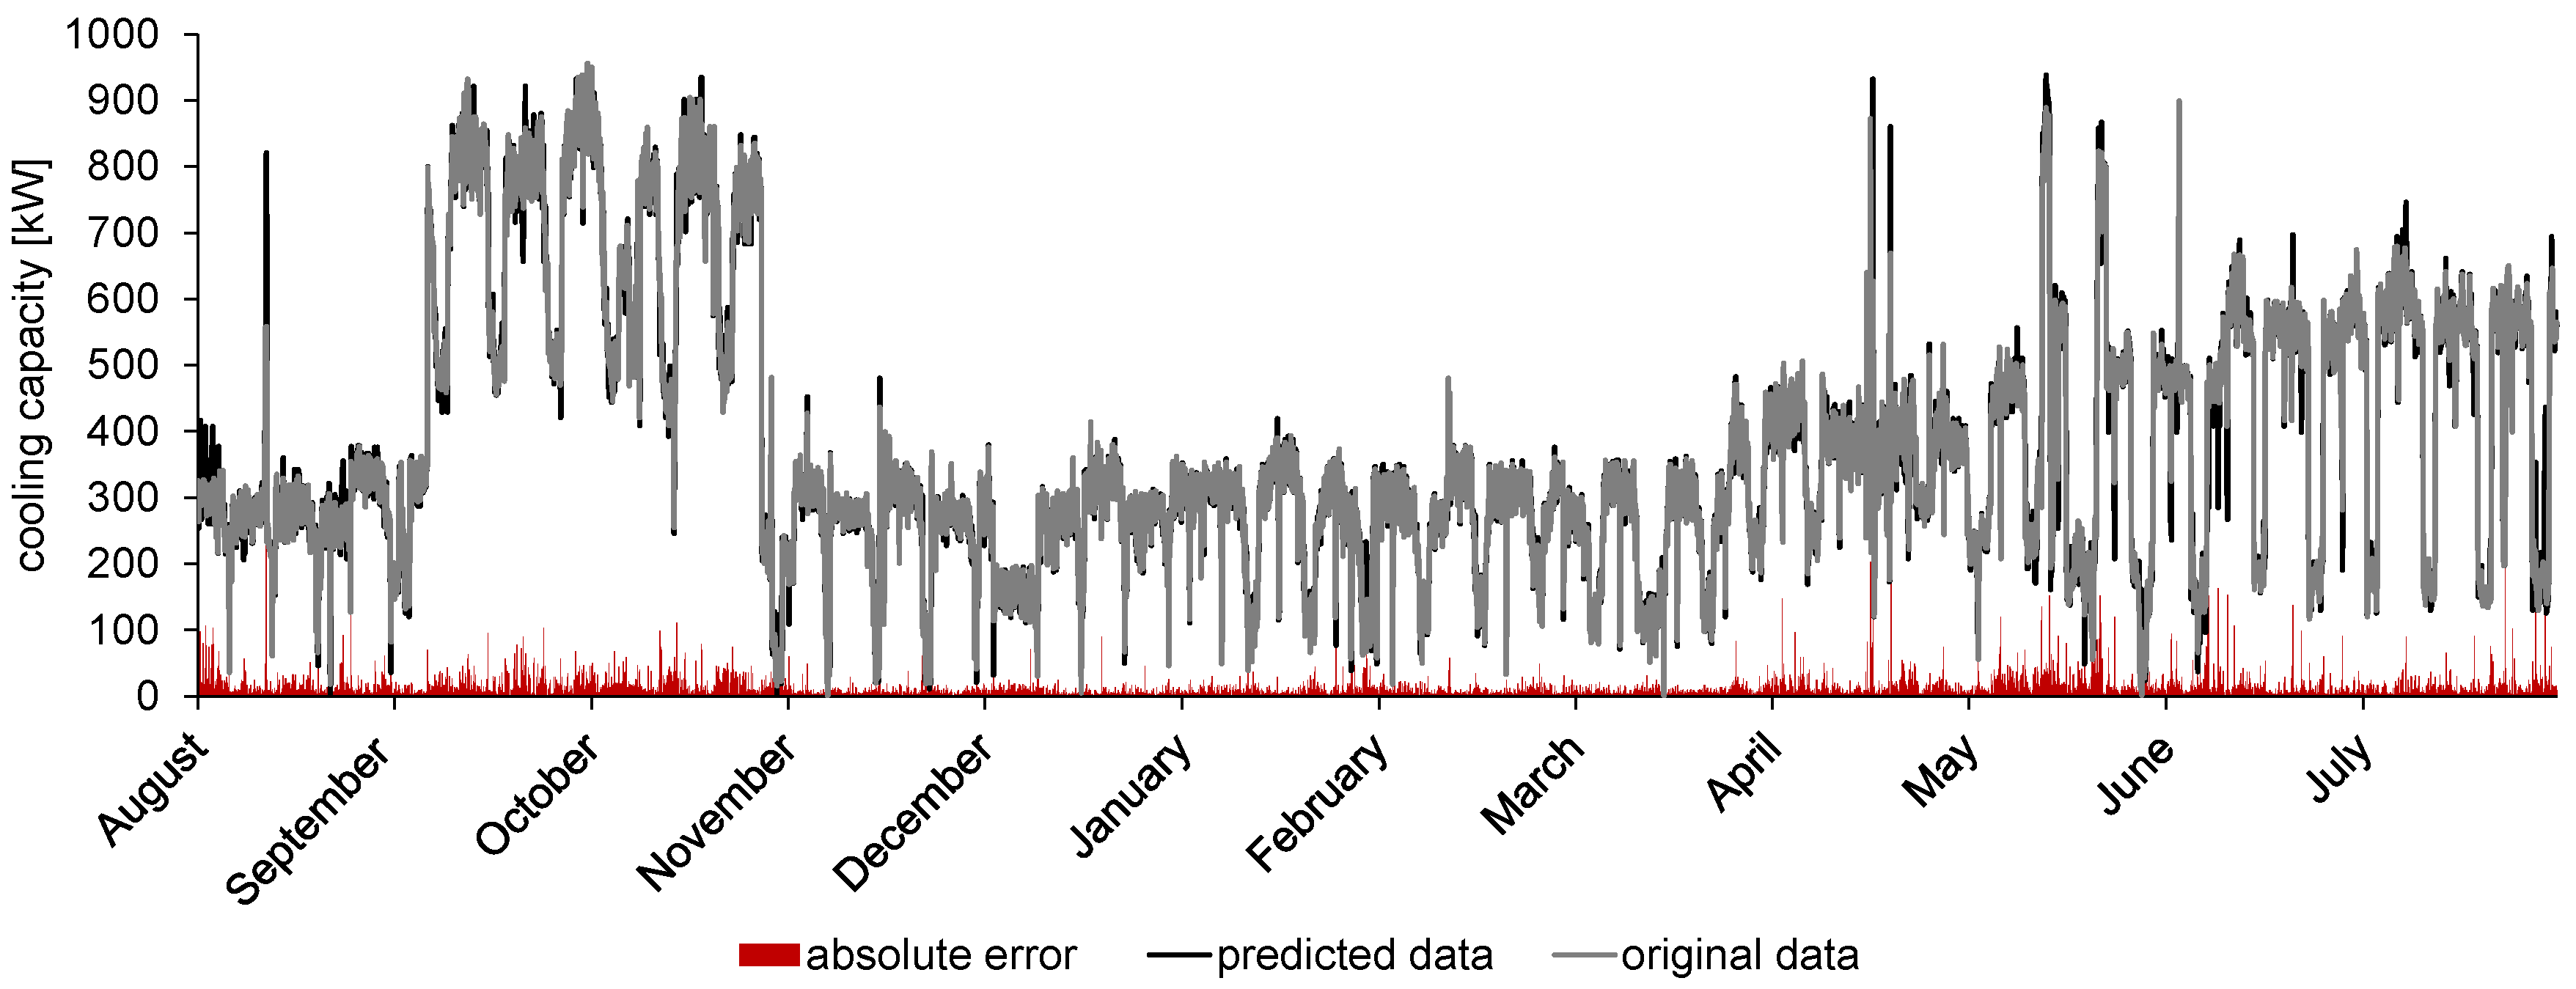
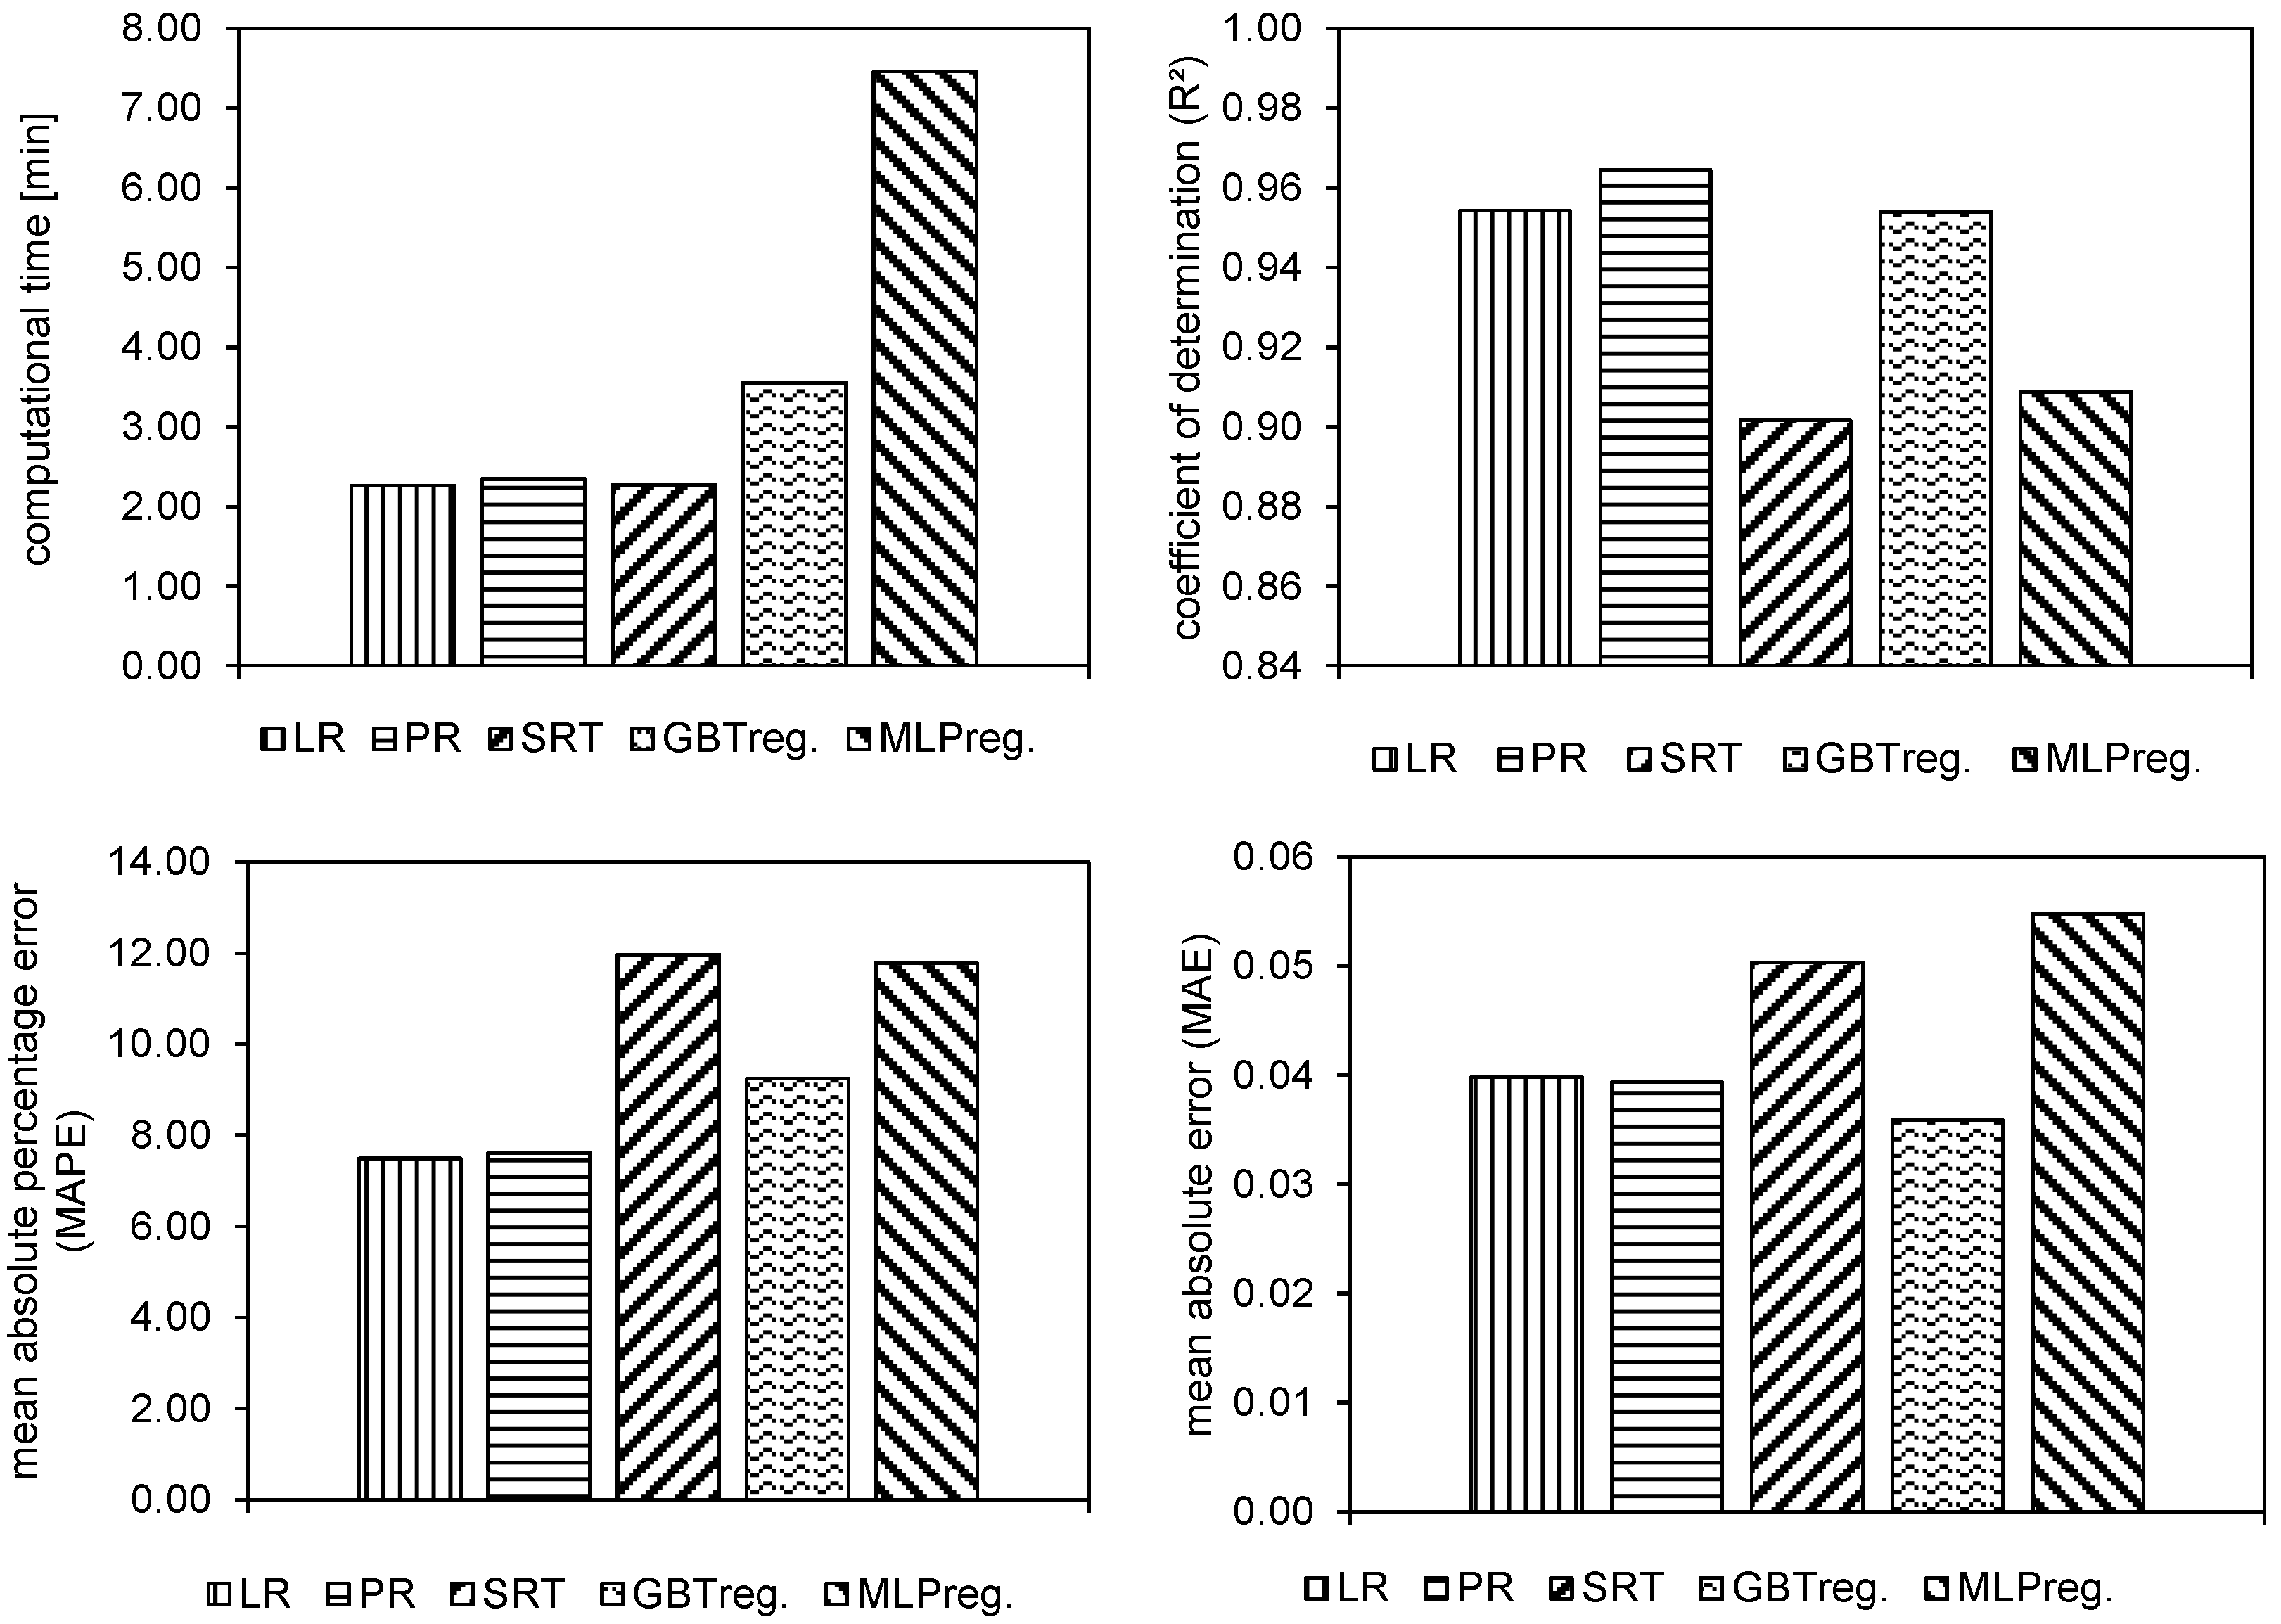
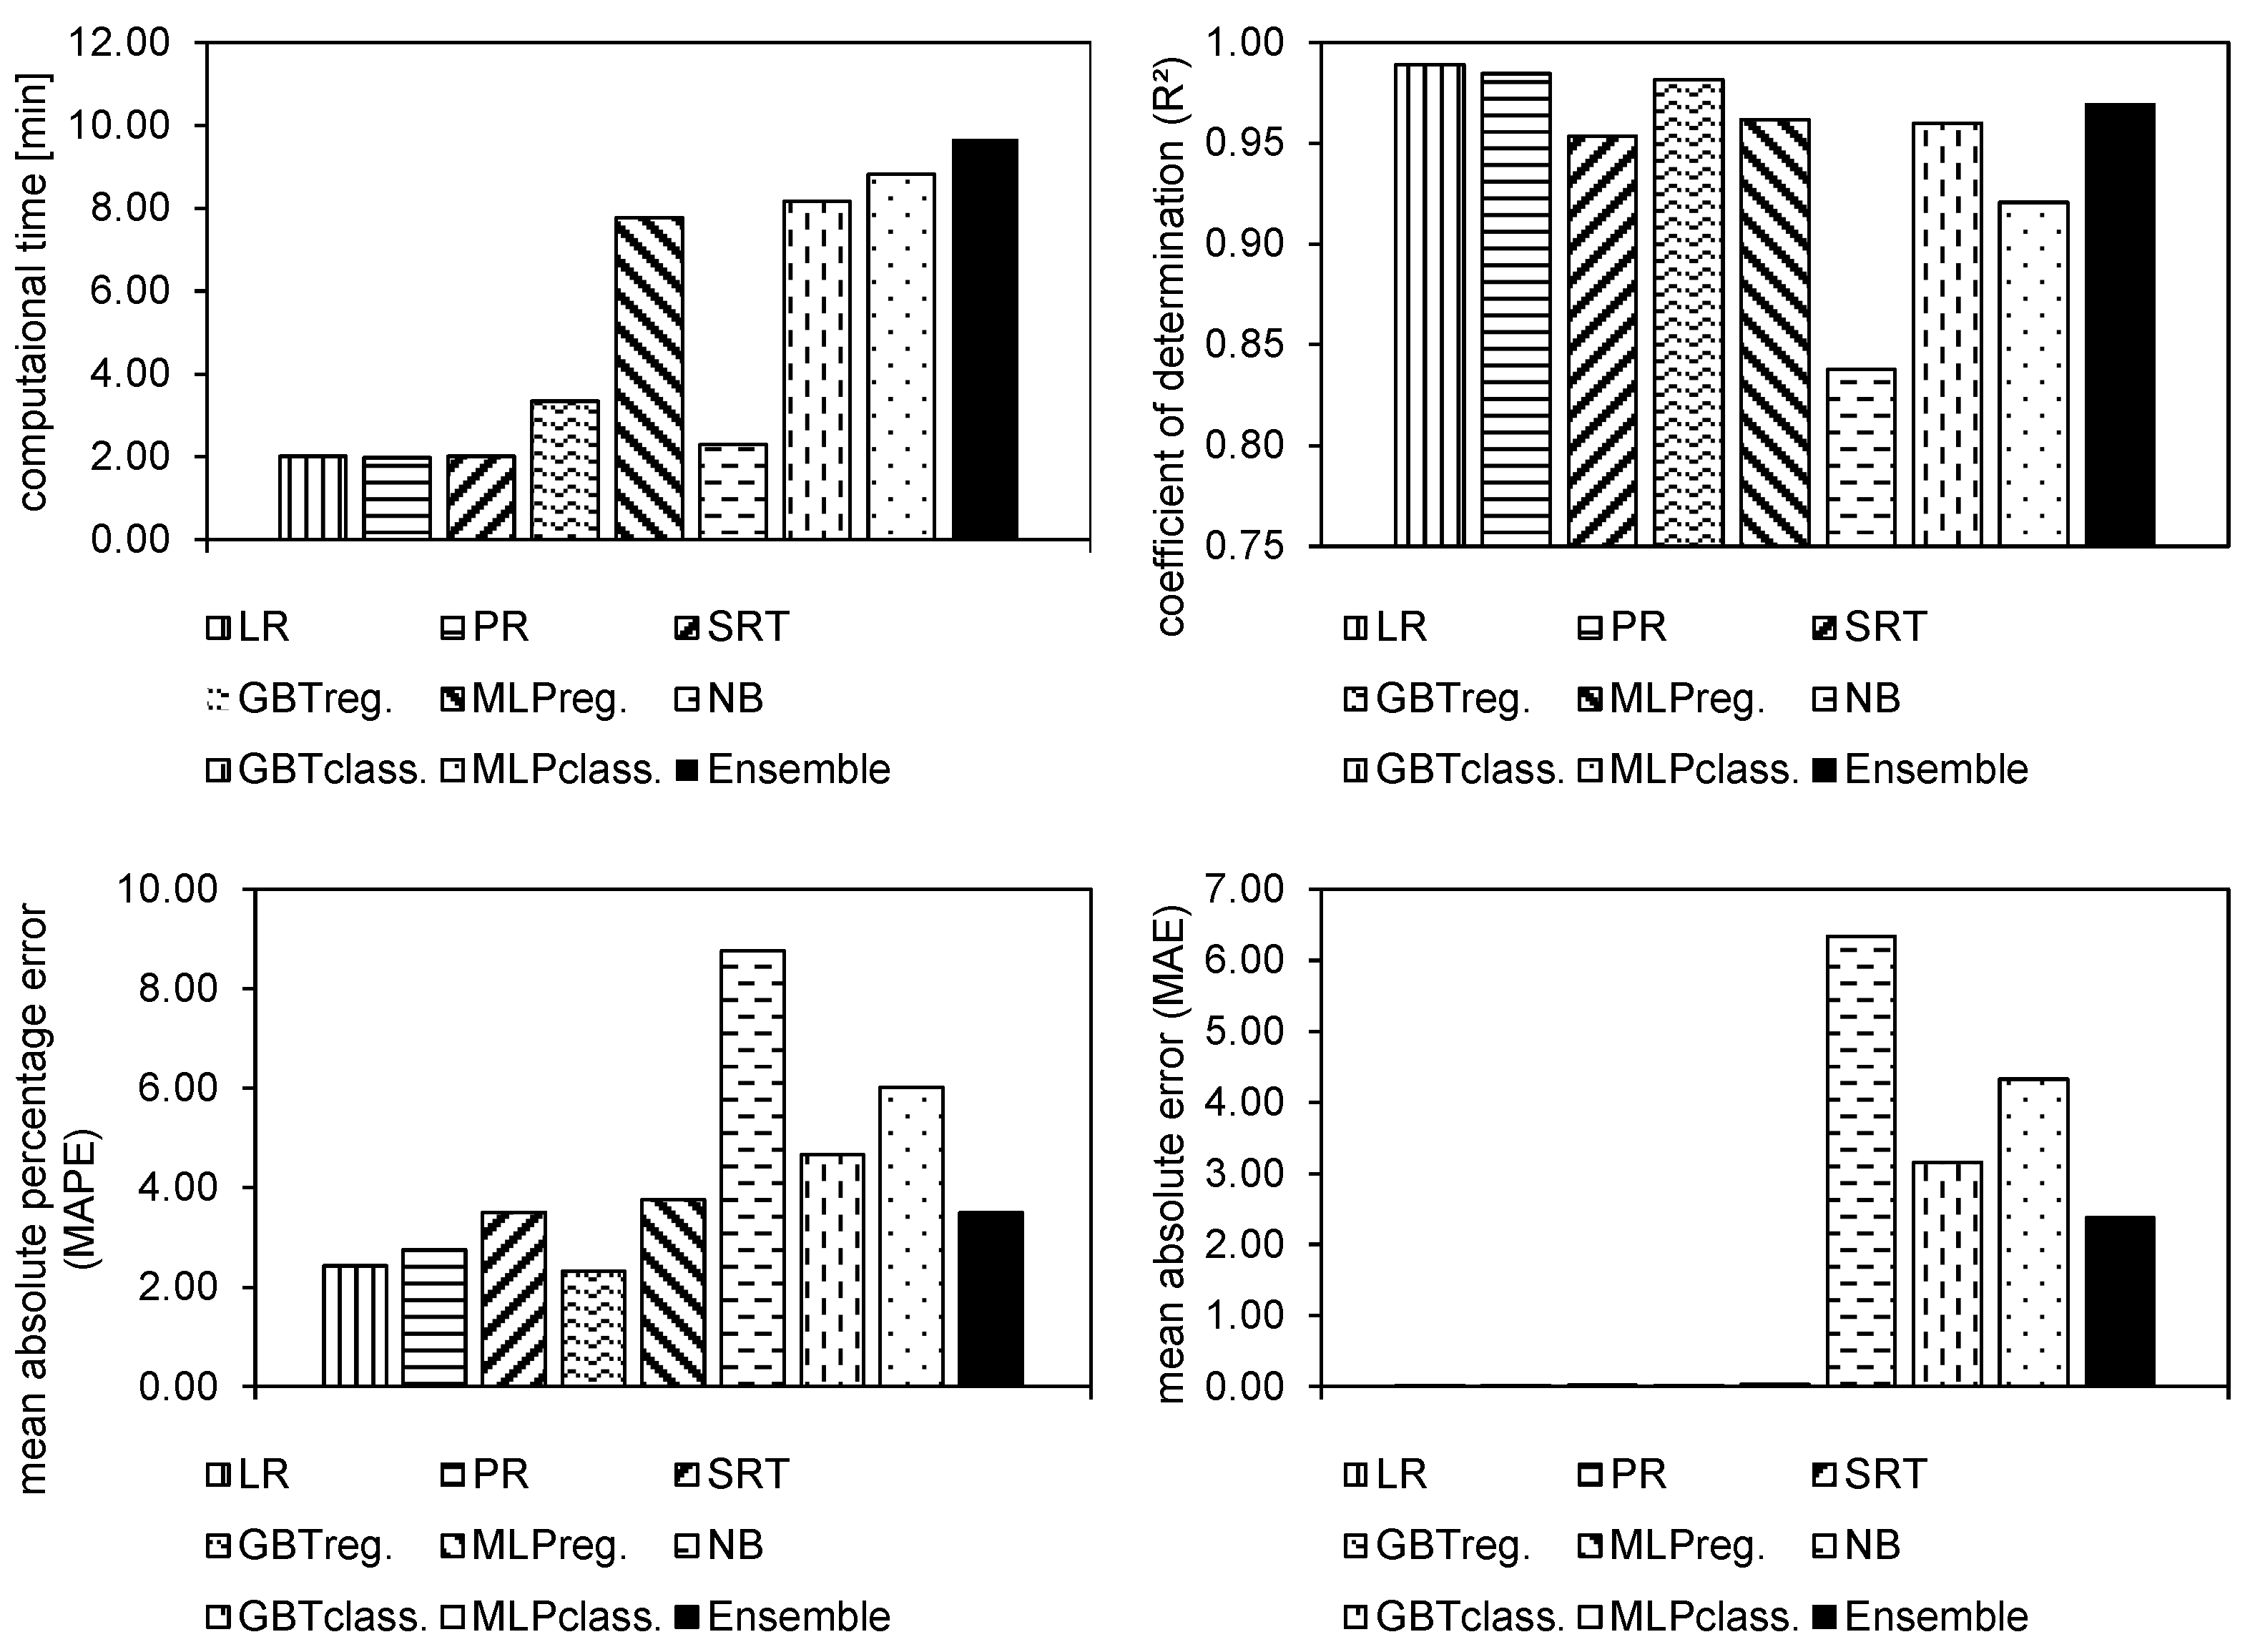
3.3.1. Prediction of Cooling Capacity

As the main purpose of a CT is to cool the production processes and machines, an accurate prediction of the cooling capacity is important for CT operation. In order to identify the best fitting algorithm, several alternatives are applied (compare Figure 4). Figure 15 shows differences between the selected DM algorithms. In general, all algorithms can predict the cooling capacity with a high accuracy, indicating by resulting R2 values between 0.91 (MLPreg.) and 0.96 (PR). Computational times range from 2 to 7 min, which seems to be acceptable in terms of practical application.
As discussed in Section 3.1.2, the cooling capacity mainly depends on local environmental conditions. In order to cover seasonal trends, time series for one year are taken into account. Figure 16 provides a prediction of the cooling capacity from polynomial regression, the algorithm with highest prediction accuracy (R2 = 0.96), highlighting the absolute errors (red color) compared with original data. Apparently, local trends and fluctuations are predicted with high accuracy. During May until November, higher fluctuations in the cooling capacity followed by increased prediction errors are observable. This could be attributed to local weather conditions and production scheduling, as discussed before.

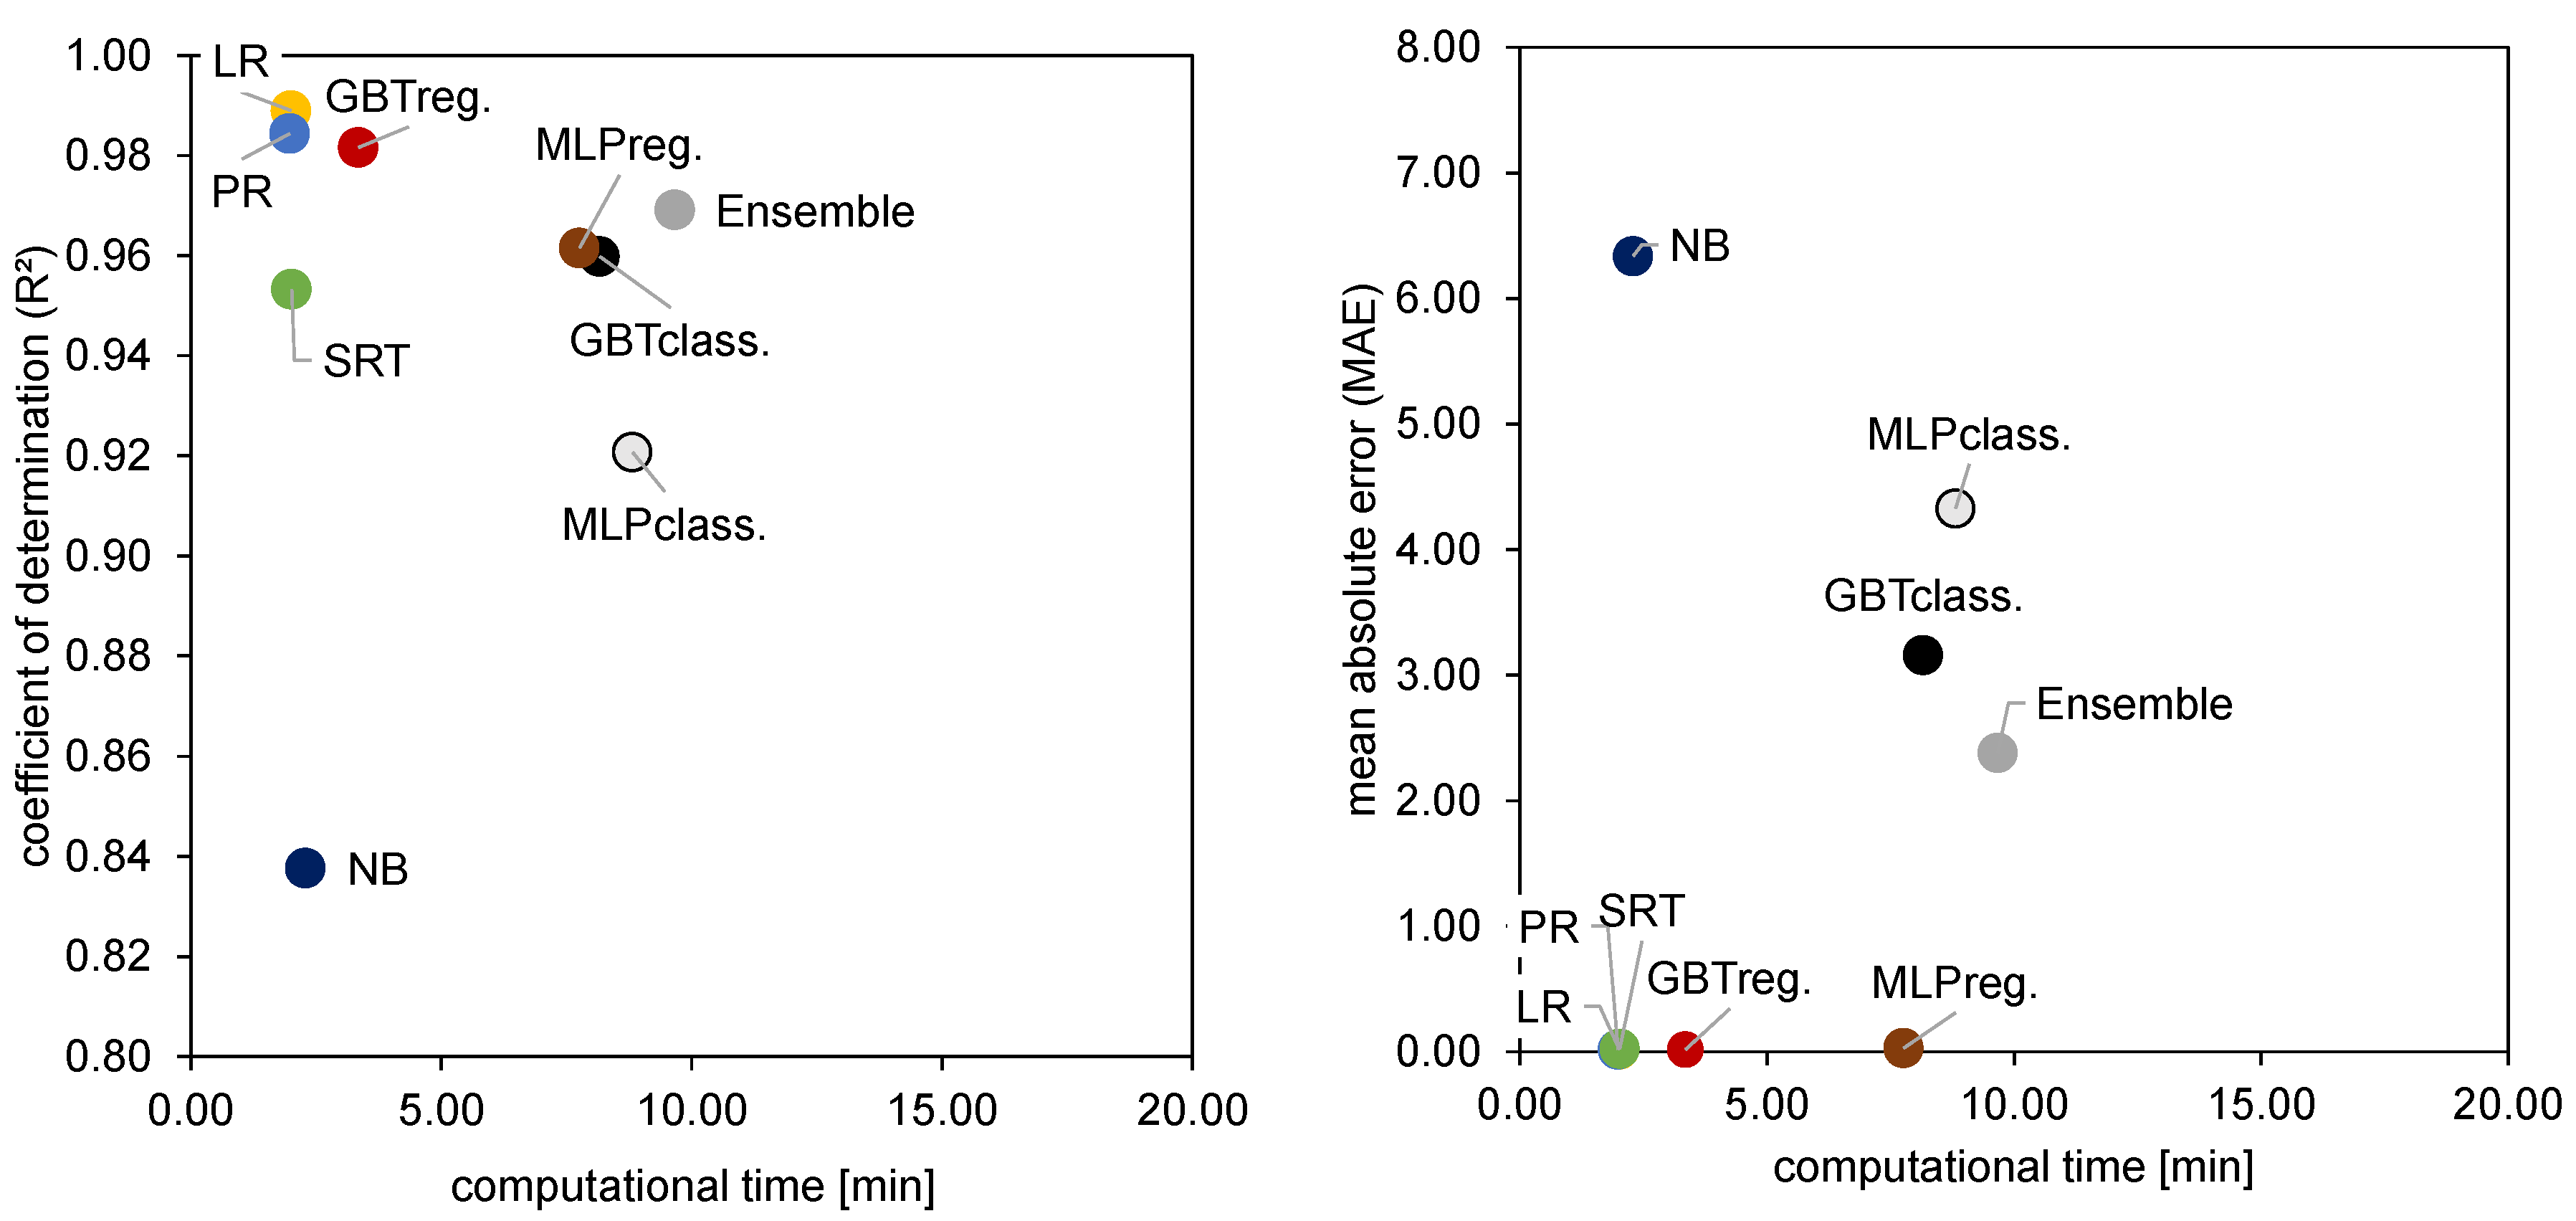
3.3.2. Prediction of Electric Power Demand

The electric power demand is a main lever for CT efficiency and determines economic as well as environmental improvement potentials. Thus, a detailed analysis and forecast of future electric power demands can be an enabler for improving CT operation. In order to identify the best fitting algorithm for this task several alternatives of classification and regression algorithms are applied (compare Figure 4) and prediction results are depicted in Figure 17. Resulting R2 range between 0.84 (NB) and 0.99 (LR) with related computational times between 2 and 9 min.
The electric power demand depends on the performance of electric components, such as pumps and fans with individual operation controls. Figure 18 illustrates the time series of original data, absolute error and predicted data resulting from linear regression (R2 = 0.99). Apparently, local trends in electric power demand such as fluctuating cooling demand by weekly production schedules can be predicted. In general, as discussed in Section 3.1.2, high and low seasons are significantly visible in the electric power demand during the year. Periodical peak consumption during the week can be explained with regularly maintenance activities.

3.3.3. Discussion

A limiting aspect of data-driven approaches in general that cannot be ignored is the availability of measurement data with sufficient scope and detail. The initial effort to develop a measurement infrastructure and database for feasible data-driven approaches, such as the presented DM approach, is typically high and cost intensive. The benefit of a (newly) establishment should therefore be economically assessed before. Furthermore, the actual support for decision makers and TBS operators should be assessed against former expectations. This will be part of future work. The DM algorithms show high accurate prediction of KPI that are relevant to operate and control an industrial CT system. However, a validation based on long-term operation experience is still outstanding. As defined target variables are of continuous character, regression algorithms result in higher prediction qualities compared to classification algorithms. It could provide valuable insights of improvement potentials for the methodology as well as applicability in daily practice. Strength of such classification algorithms can be seen in the prediction of discrete values such as color, shape or production state. Hence, they could be used for future applications such as energy flexibility strategies by predicting future operation states and resulting energy demands.

4. Conclusions and Outlook

The authors present an approach to create a data-driven DT for TBS operation applied on an industrial CT system. It aims to uncover interrelations between operational business and technical system in order to improve operational strategies. The DM approach bases on the well-known CRISP-DM procedure, featuring a high integration capability into daily business and continuous improvement cycles. As CRISP-DM is a generic procedure for DM in industry, the approach is transferable to other TBS technologies apart from CT. Yet, to transfer the approach, it should be discussed to omit single steps or extend the workflow depending on the individual requirement of the use case. Based on a consistent and continuous database, the DM approach features three general phases for thorough system analysis and performance prediction. In the first phase, business understanding, a general system understanding is gained and KPIs to express system conditions and to identify hotspots are defined. A focus is then put on the second phase of creating the DT, while each of seven working steps such as outlier filtering, data aggregation and transformation is explained and illustrated by means off the case study. The use of intuitive diagrams like heat maps and Sankey diagrams is proposed to make workflow and results comprehensible. The comparison of several DM algorithms revealed their general aptitude to predict crucial operational KPIs like cooling capacity and electric power demand with high accuracy and acceptable computational times. The best predictions were achieved by polynomial regression (R2 = 0.96) for cooling capacity and linear regression (R2 = 0.99) for electric power demand. The accurate prediction of cooling capacities provides valuable insights in the overall system performance and operation reliability that is crucial for the whole production system.
With an outlook, the approach offers numerous opportunities. The forecast of energy demands enables a proactive and energy-oriented CT system operation and paves the way for future business models such as energy flexibility. A combination with additional forecast models, e.g., local weather or energy market prices, could increase the economic relevance. Moreover, the data-driven DT could serve as basis for further simulation as an alternative to formula-based simulation models. This would enable the user to run what-if scenarios and evaluate possible future operation strategies in the safe virtual DT environment without affecting the physical system. For further work, the authors also plan to improve applicability and transferability of the approach in daily practice. One contribution could be a higher degree of automation for the presented workflow, significantly reducing efforts for data processing. Furthermore, direct feedback to the physical control system could be a possible extension, reducing the need for human interventions. A full implementation of the DT approach into a real-world CT or any other TBS system with fully automatic response and control of the system can be regarded as aspired vision based on the proposed DT approach.

Author Contributions

C.B., concept, methodology, formal analysis, visualization, writing—original draft preparation; S.B., visualization, validation, writing—review and editing; S.T., concept, supervision, writing—review and editing; C.H., supervision, writing—review and editing. All authors have read and agreed to the published version of the manuscript.

Funding

The authors gratefully acknowledge the financial support of the Kopernikus-Project SynErgie (Grant 03SFK3N1-2) by the Federal Ministry of Education and Research (BMBF) and the project supervision by the project management organization Projektträger Jülich (PtJ).

Conflicts of Interest

The authors declare no conflict of interest. The funders had no role in the design of the study; in the collection, analyses, or interpretation of data; in the writing of the manuscript, or in the decision to publish the results.

Appendix A

Figure A1. Summary of data mining results predicting the cooling capacity.
Jmmp 04 00097 g0a1
Figure A2. Summary of data mining results predicting the electric power demand.
Jmmp 04 00097 g0a2

References

  1. Herrmann, C.; Schmidt, C.; Kurle, D.; Blume, S.; Thiede, S. Sustainability in manufacturing and factories of the future. Int. J. Precis. Eng. Manuf. Green Technol. 2014, 1, 283–292. [Google Scholar] [CrossRef] [Green Version]
  2. Posselt, G. Towards Energy Transparent Factories; Herrmann, C., Kara, S., Eds.; Springer International Publishing: Braunschweig, Germany, 2016; ISBN 978-3-319-20868-8. [Google Scholar]
  3. Stoldt, J.; Trapp, T.U.; Toussaint, S.; Süße, M.; Schlegel, A.; Putz, M. Planning for Digitalisation in SMEs using Tools of the Digital Factory. Procedia CIRP 2018, 72, 179–184. [Google Scholar] [CrossRef]
  4. Fayyad, U.; Piatetsky-Shapiro, G.; Smyth, P. The KDD process for extracting useful knowledge from volumes of data. Commun. ACM 1996, 39, 27–34. [Google Scholar] [CrossRef]
  5. Fayyad, U.; Piatetsky-Shapiro, G.; Smyth, P. From Data Mining to Knowledge Discovery in Databases. AI Mag. 1996, 17, 37–54. [Google Scholar] [CrossRef]
  6. Bagheri, B.; Yang, S.; Kao, H.A.; Lee, J. Cyber-physical systems architecture for self-aware machines in industry 4.0 environment. IFAC-PapersOnLine 2015, 28, 1622–1627. [Google Scholar] [CrossRef]
  7. Ji, W.; Wang, L. Big data analytics based fault prediction for shop floor scheduling. J. Manuf. Syst. 2017, 43, 187–194. [Google Scholar] [CrossRef]
  8. Lee, J.; Ardakani, H.D.; Yang, S.; Bagheri, B. Industrial Big Data Analytics and Cyber-physical Systems for Future Maintenance & Service Innovation. Procedia CIRP 2015, 38, 3–7. [Google Scholar] [CrossRef] [Green Version]
  9. Winters, P.; Adae, I.; Silipo, R. Anomaly Detection in Predictive Maintenance. In Anomaly Detection with Time Series Analysis; KNIME: Zurich, Switzerland, 2014; pp. 3–9. [Google Scholar]
  10. Lau, H.C.W.; Cheng, E.N.M.; Lee, C.K.M.; Ho, G.T.S. A fuzzy logic approach to forecast energy consumption change in a manufacturing system. Expert Syst. Appl. 2008, 34, 1813–1824. [Google Scholar] [CrossRef]
  11. Walther, J.; Spanier, D.; Panten, N.; Abele, E. Very short-term load forecasting on factory level—A machine learning approach. Procedia CIRP 2019, 80, 705–710. [Google Scholar] [CrossRef]
  12. Zhang, Y.; Tao, F.; Chen, K.; Sun, H.; Cheng, Y. Data and knowledge mining with big data towards smart production. J. Ind. Inf. Integr. 2017, 9, 1–13. [Google Scholar] [CrossRef]
  13. Okorie, O.; Salonitis, K.; Charnley, F.; Turner, C. A Systems Dynamics Enabled Real-Time Efficiency for Fuel Cell Data-Driven Remanufacturing. J. Manuf. Mater. Process. 2018, 2, 77. [Google Scholar] [CrossRef] [Green Version]
  14. Duflou, J.R.; Sutherland, J.W.; Dornfeld, D.; Herrmann, C.; Jeswiet, J.; Kara, S.; Hauschild, M.; Kellens, K. Towards energy and resource efficient manufacturing: A processes and systems approach. CIRP Ann. Manuf. Technol. 2012, 61, 587–609. [Google Scholar] [CrossRef] [Green Version]
  15. Gutowski, T.G.; Allwood, J.M.; Herrmann, C.; Sahni, S. A Global Assessment of Manufacturing: Economic Development, Energy Use, Carbon Emissions, and the Potential for Energy Efficiency and Materials Recycling. Annu. Rev. Environ. Resour. 2013, 38, 81–106. [Google Scholar] [CrossRef] [Green Version]
  16. Thiede, S. Energy Efficiency in Manufacturing Systems; Herrmann, C., Kara, S., Eds.; Springer: Berlin/Heidelberg, Germany, 2012; ISBN 9783642259135. [Google Scholar]
  17. Müller, E.; Engelmann, J.; Löffler, T.; Strauch, J. (Eds.) Energieeffiziente Fabriken Planen und Betreiben; Springer: Berlin/Heidelberg, Germany, 2009; ISBN 9788578110796. [Google Scholar]
  18. Rebhahn, E. Energiehandbuch—Gewinnung, Wandlung und Nutzung von Energie, 1st ed.; Springer: Berlin/Heidelberg, Germany, 2002; ISBN 9783-6426-25183. [Google Scholar]
  19. Hesselbach, J.; Herrmann, C.; Detzer, R.; Martin, L.; Thiede, S.; Lüdemann, B. Energy Efficiency through optimized coordination of production and technical building services. In Proceedings of the Conference Proceedings LCE2008—15th CIRP International Conference on Life Cycle Engineering, Sydney, Australia, 17–19 March 2008; Volume 15, pp. 624–628. [Google Scholar]
  20. Schulze, C.; Thiede, S.; Thiede, B.; Kurle, D.; Blume, S.; Herrmann, C. Cooling tower management in manufacturing companies: A cyber- physical system approach. J. Clean. Prod. 2019, 211, 428–441. [Google Scholar] [CrossRef]
  21. Hesselbach, J. Energie- und Klimaeffiziente Produktion; Springer Vieweg: Wiesbaden, Germany, 2012; ISBN 9783834804488. [Google Scholar]
  22. Wischhusen, D.I.S.; Lüdemann, I.B.; Schmitz, I.G. Economical Analysis of Complex Heating and Cooling Systems with the Simulation Tool HKSim. In Proceedings of the 3rd International Modelica Conference, Linköping, Sweden, 3–4 November 2003. [Google Scholar]
  23. VDI Open Recooler Systems—Securing Hygienically Sound Operation of Evaporative Cooling Systems (VDI Cooling Tower Code of Practice); VDI-Gesellschaft Bauen und Gebäudetechnik: Düsseldorf, Germany, 2017.
  24. Kloppers, J.C.; Kroger, D.G. Cooling tower performance evaluation: Merkel, poppe, and e-NTU methods of analysis. J. Eng. Gas Turbines Power Trans. ASME 2005, 127, 1–7. [Google Scholar] [CrossRef]
  25. Schulze, C.; Raabe, B.; Herrmann, C.; Thiede, S. Environmental Impacts of Cooling Tower Operations—The Influence of Regional Conditions on Energy and Water Demands. In Proceedings of the Procedia CIRP 25th Conference on Life Cycle Engineering, Copenhagen, Denmark, 30 April–2 May 2018; Volume 69, pp. 277–282. [Google Scholar]
  26. VDI Gesellschaft Verfahrenstechnik und Chemieingenieurwesen. VDI-Wärmeatlas, 11th ed.; Springer: Berlin/Heidelbarg, Germany, 2013; ISBN 978-3-642-19980-6. [Google Scholar]
  27. Thiede, S.; Kurle, D.; Herrmann, C. The water-energy nexus in manufacturing systems: Framework and systematic improvement approach. CIRP Ann. Manuf. Technol. 2017, 66, 49–52. [Google Scholar] [CrossRef]
  28. Eurovent Certita Certification SAS Energy Efficiency Labels. Available online: https://www.eurovent-certification.com/en/energy-efficiency-labels (accessed on 4 April 2020).
  29. Lambach, S.; Lohmann, S.; Adam, M. Jahres-Energieeffizienz von Kühlgeräten zur Klimatisierung—Vergleich von Normberechnung und Jahressimulationen. KI Kälte-Luft-Klimatech. 2018, 5, 50–55. [Google Scholar]
  30. Beier, J.; Neef, B.; Thiede, S.; Herrmann, C. Integrating on-site renewable electricity generation into a manufacturing system with intermittent battery storage from electric vehicles. Procedia CIRP 2016, 48, 483–488. [Google Scholar] [CrossRef] [Green Version]
  31. Ghosh, A.K.; Sharif Ullah, A.M.M.; Kubo, A.; Akamatsu, T.; D’Addona, D.M. Machining phenomenon twin construction for industry 4.0: A case of surface roughness. J. Manuf. Mater. Process. 2020, 4, 11. [Google Scholar] [CrossRef] [Green Version]
  32. Lichtblau, K.; Stich, V.; Bertenrath, R.; Blum, M.; Bleider, M.; Millack, A.; Katharina, S.; Schmitz, E.; Schröter, M. Industrie 4.0-Readiness; IMPULS—Stiftung für den Maschinenbau, den Anlagenbau und die Informationstechnik: Aachen, Germany; Köln, Germany, 2015. [Google Scholar]
  33. Tao, F.; Zhang, M.; Nee, A.Y.C. (Eds.) Digital Twin Driven Smart Manufacturing; Academic Press: Cambridge, MA, USA, 2019; ISBN 978-0-12-817630-6. [Google Scholar]
  34. Monostori, L. Cyber-Physical Systems. In CIRP Encyclopedia of Production Engineering; Chatti, S., Tolio, T., Eds.; Springer: Berlin/Heidelberg, Germany, 2018; pp. 1–8. ISBN 978-3-642-35950-7. [Google Scholar]
  35. Tao, F.; Zhang, M.; Liu, Y.; Nee, A.Y.C. Digital twin driven prognostics and health management for complex equipment. CIRP Ann. Manuf. Technol. 2018, 67, 169–172. [Google Scholar] [CrossRef]
  36. Armendia, M.; Ghassempouri, M.; Selmi, J.; Berglind, L.; Sossenheimer, J.; Flum, D.; Peysson, F.; Fuertjes, T.; Plakhotnik, D. Twin-Control Evaluation in Industrial Environment: Automotive Case. In Twin-Control; Armendia, M., Ghassempouri, M., Ozturk, E., Peysson, F., Eds.; Springer: Cham, Switzerland, 2019; ISBN 9783030022037. [Google Scholar]
  37. Uhlemann, T.H.J.; Lehmann, C.; Steinhilper, R. The Digital Twin: Realizing the Cyber-Physical Production System for Industry 4.0. Procedia CIRP 2017, 61, 335–340. [Google Scholar] [CrossRef]
  38. Wirth, R.; Hipp, J. CRISP-DM: Towards a Standard Process Model for Data Mining. In Proceedings of the 4th International Conference on the Practical Application of Knowledge Discovery and Data Mining (PADD ’00), Manchester, UK, 11–13 April 2000; pp. 29–39. [Google Scholar]
  39. Chapman, P.; Clinton, J.; Kerber, R.; Khabaza, T.; Reinartz, T.; Shearer, C.; Wirth, R. CRISP-DM 1.0—Step-by-Step Data Mining Guide; SPSS Inc.: Chicago, IL, USA, 2000; ISBN 9780769532677. [Google Scholar]
  40. Shafique, U.; Qaiser, H. A Comparative Study of Data Mining Process Models (KDD, CRISP-DM and SEMMA). Int. J. Innov. Sci. Res. 2014, 12, 217–222. [Google Scholar]
  41. Molina-Solana, M.; Ros, M.; Ruiz, M.D.; Gomez-Romero, J.; Martin-Bautista, M.J. Data Science for Building Energy Management: A review. Renew. Sustain. Energy Rev. 2017, 70, 598–609. [Google Scholar] [CrossRef] [Green Version]
  42. Decker, K.M.; Focardi, S. Technology Overview: A Report on Data Mining; Swiss Scientific Computing Center: Manno, Switzerland, 1995. [Google Scholar]
  43. Han, J.; Kamber, M.; Pei, J. Data Mining—Concepts and Techniques, 3rd ed.; Morgan Kaufmann: Waltham, MA, USA, 2011; ISBN 9780123814791. [Google Scholar]
  44. Clarke, B.; Fokoue, E.; Zhang, H.H. Principles and Theory for Data Mining and Machine Learning; Springer: New York, NY, USA, 2009; ISBN 9780387981345. [Google Scholar]
  45. Teiwes, H.; Blume, S.; Herrmann, C.; Rössinger, M.; Thiede, S. Energy load profile analysis on machine level. In Proceedings of the Procedia CIRP 25th Conference on Life Cycle Engineering, Copenhagen, Denmark, 30 April–2 May 2018; Volume 69, pp. 271–276. [Google Scholar]
  46. Anuar, N.; Zakaria, Z. Electricity Load Profile Determination by using Fuzzy C-Means and Probability Neural Network. In Proceedings of the International Conference on Advances in Energy Engineering (ICAEE), Bangkok, Thailand, 27–28 December 2012. Elsevier Ltd. Selection. [Google Scholar]
  47. Tardioli, G.; Kerrigan, R.; Oates, M.; O’Donnell, J.; Finn, D. Data driven approaches for prediction of building energy consumption at urban level. Energy Procedia 2015, 78, 3378–3383. [Google Scholar] [CrossRef] [Green Version]
  48. Hosoz, M.; Ertunc, H.M.; Bulgurcu, H. An adaptive neuro-fuzzy inference system model for predicting the performance of a refrigeration system with a cooling tower. Expert Syst. Appl. 2011, 38, 14148–14155. [Google Scholar] [CrossRef]
  49. Azadeh, M.A.; Sohrabkhani, S. Annual electricity consumption forecasting with Neural Network in high energy consuming industrial sectors of Iran. Proc. IEEE Int. Conf. Ind. Technol. 2006, 49, 2166–2171. [Google Scholar] [CrossRef]
  50. Chou, J.S.; Hsu, Y.C.; Lin, L.T. Smart meter monitoring and data mining techniques for predicting refrigeration system performance. Expert Syst. Appl. 2014, 41, 2144–2156. [Google Scholar] [CrossRef]
  51. Fan, C.; Xiao, F.; Wang, S. Development of prediction models for next-day building energy consumption and peak power demand using data mining techniques. Appl. Energy 2014, 127, 1–10. [Google Scholar] [CrossRef]
  52. Amasyali, K.; El-Gohary, N.M. A review of data-driven building energy consumption prediction studies. Renew. Sustain. Energy Rev. 2018, 81, 1192–1205. [Google Scholar] [CrossRef]
  53. Ahmad, M.W.; Mourshed, M.; Rezgui, Y. Trees vs Neurons: Comparison between random forest and ANN for high-resolution prediction of building energy consumption. Energy Build. 2017, 147, 77–89. [Google Scholar] [CrossRef]
  54. Qi, X.; Liu, Z.; Li, D. Numerical simulation of shower cooling tower based on artificial neural network. Energy Convers. Manag. 2008, 49, 724–732. [Google Scholar] [CrossRef]
  55. Qi, X.; Liu, Y.; Guo, Q.; Yu, S.; Yu, J. Performance prediction of a shower cooling tower using wavelet neural network. Appl. Therm. Eng. 2016, 108, 475–485. [Google Scholar] [CrossRef]
  56. Pan, T.H.; Shieh, S.S.; Jang, S.S.; Tseng, W.H.; Wu, C.W.; Ou, J.J. Statistical multi-model approach for performance assessment of cooling tower. Energy Convers. Manag. 2011, 52, 1377–1385. [Google Scholar] [CrossRef]
  57. Gao, Y.; Tumwesigye, E.; Cahill, B.; Menzel, K. Using data mining in optimisation of building energy consumption and thermal comfort management. In Proceedings of the 2nd International Conference on Software Engineering and Data Mining, Chengdu, China, 23–25 June 2010; pp. 434–439. [Google Scholar]
  58. Patnaik, D.; Marwah, M.; Sharma, R.; Ramakrishnan, N. Sustainable Operation and Management of Data Center Chillers Using Temporal Data Mining. In Proceedings of the 15th ACM SIGKDD International Conference on Knowledge Discovery and Data Mining, Paris, France, 28 June–1 July 2009; pp. 1305–1314. [Google Scholar] [CrossRef]
  59. Anuar, N.; Zakaria, Z. Electricity load profile determination by using fuzzy C-means and probability neural network. Energy Procedia 2012, 14, 1861–1869. [Google Scholar] [CrossRef] [Green Version]
  60. Li, W.; Thiede, S.; Kara, S.; Herrmann, C. A Generic Sankey Tool for Evaluating Energy Value Stream in Manufacturing Systems. Procedia CIRP 2017, 61, 475–480. [Google Scholar] [CrossRef]
  61. Wang, J.-G.; Shieh, S.-S.; Jang, S.-S.; Wu, C.-W. Discrete model-based operation of cooling tower based on statistical analysis. Energy Convers. Manag. 2013, 73, 226–233. [Google Scholar] [CrossRef]
  62. Jovanović, R.; Sretenović, A.A.; Živković, B.D. Ensemble of various neural networks for prediction of heating energy consumption. Energy Build. 2015, 94, 189–199. [Google Scholar] [CrossRef]
  63. Fan, C.; Xiao, F.; Yan, C. A framework for knowledge discovery in massive building automation data and its application in building diagnostics. Autom. Constr. 2015, 50, 81–90. [Google Scholar] [CrossRef]
  64. Hecht-Nielsen, R. Theory of the Backpropagation Neural Network. Proceedings of International Joint Conference on Neural Networks, Washington, DC, USA, 1989; IEEE: New York, NY, USA, 1989; pp. 593–605. [Google Scholar]
  65. Rafiq, M.Y.; Bugmann, G.; Easterbrook, D.J. Neural network design for engineering applications. Comput. Struct. 2001, 79, 1541–1552. [Google Scholar] [CrossRef]
  66. Goebel, M.; Gruenwald, L. A survey of data mining and knowledge discovery software tools. ACM SIGKDD Explor. Newsl. 1999, 1, 20–33. [Google Scholar] [CrossRef]
  67. Deng, C.; Guo, R.; Liu, C.; Zhong, R.Y.; Xu, X. Data cleansing for energy-saving: A case of Cyber-Physical Machine Tools health monitoring system. Int. J. Prod. Res. 2018, 56, 1000–1015. [Google Scholar] [CrossRef]
  68. Leys, C.; Ley, C.; Klein, O.; Bernard, P.; Licata, L. Detecting outliers: Do not use standard deviation around the mean, use absolute deviation around the median. J. Exp. Soc. Psychol. 2013, 49, 764–766. [Google Scholar] [CrossRef] [Green Version]
  69. Rodgers, J.L.; Nicewander, W.A. Thirteen Ways to Look at the Correlation Coefficient. Am. Stat. 1988, 42, 59–66. [Google Scholar] [CrossRef]
Figure 1. Components and parameters of an industrial cooling tower system based on [25].
Jmmp 04 00097 g001
Figure 2. Data-driven approaches and proposed workflow to create a digital twin.
Jmmp 04 00097 g002
Figure 3. Workflow to create a data-driven digital twin.
Jmmp 04 00097 g003
Figure 4. Data mining algorithms selected for the case study.
Jmmp 04 00097 g004
Figure 5. Scheme of considered industrial cooling tower system with relevant measurands.
Jmmp 04 00097 g005
Figure 6. Heatmap of weekly electric power demand for one year, classified by weekdays.
Jmmp 04 00097 g006
Figure 7. (a) Boxplot of energy efficiency ratio (EER) for cooling tower (CT) system over the year (based on daily data); (b) EER in relation to ambient temperature (based on hourly data, coloring indicates related operation month).
Jmmp 04 00097 g007
Figure 8. (a) Portfolio analysis to characterize energy efficiency ratio (EER) of CT inspired by the energy portfolio in [16]; (b) application of portfolio analysis (hourly data, coloring indicates related operation month).
Jmmp 04 00097 g008
Figure 9. Box plots of cooling capacity and electric power demand: (a) before outlier filtering; (b) after outlier filtering.
Jmmp 04 00097 g009
Figure 10. Correlation matrix indicates data interdependencies with positive linear correlation (green color) and negative linear correlation (red color).
Jmmp 04 00097 g010
Figure 11. Sankey diagram of data quantity development through data aggregation and data transformation, unit is total number of data.
Jmmp 04 00097 g011
Figure 12. Mean squared errors (MSE) from feature selection for linear regression (LR), simple regression tree (SRT) and multilayer perception (MLP) predicting the electric power demand.
Jmmp 04 00097 g012
Figure 13. Heatmap from feature selection indicating relevance of variables for selected algorithms assessed for electric power demand (dark grey color indicates high relevance).
Jmmp 04 00097 g013
Figure 14. Surface plot of hyperparameter assessment: (a) R2 for simple regression tree algorithm; (b) R2 for multilayer perception algorithm.
Jmmp 04 00097 g014
Figure 15. Evaluation of data mining results predicting the cooling capacity.
Jmmp 04 00097 g015
Figure 16. Time series plot of original and predicted cooling capacity and resulting error predicted with polynomial regression (PR) algorithm.
Jmmp 04 00097 g016
Figure 17. Evaluation of data mining results predicting the electric power.
Jmmp 04 00097 g017
Figure 18. Time series plot of original and predicted electric power demand and resulting error predicted with linear regression (LR) algorithm.
Jmmp 04 00097 g018
Table 1. Overview of relevant research addressing data-driven approaches for cooling tower systems.
StudiesData-Driven AlgorithmsUse CaseTarget KPIBrief DescriptionAvailable Data Set Details
Artificial Neural NetworkClusteringFuzzy Association RulesSupport Vector MachineLinear/Polynomial RegressionDecision TreesRandom ForestEnsembleTime Series AnalysisIndustryBuildingsCooling PerformanceEnergy DemandEnvironmental Conditions
Abraham et al., 2001 power demand for the Australian region12 months,
15 min. freq.
Ahmad et al., 2017 development of an expert system applied on the electric power demand of a hotel in Spain10,972 rows,
10 variables
Amasyali et al., 2016 power demand of offices considering clouds and number of persons in the building60 days,
15 min. freq.
Anuar et al., 2012 electric energy demand of various companies in industry and commerce30 min. freq.
Azadeh et al., 2008 long-term development of electric energy demand in Iran130 rows
Fan et al., 2015 identification of recurring patterns in the power demand of a skyscraper’s TBS29,757 rows,
158 variables
Fan et al., 2014 prediction of maximum and total power demand of the cooling tower system for the next day34,616 rows,
15 min. freq.
Gao et al., 2010 identification of operating conditions for comfort air conditioning68,000 rows,
7 variables
Hosoz et al., 2006 model for the construction of cooling towers to substitute experimental data81 rows,
5 variables
Jovanovi et al., 2015 comparison of three different ANNs for a TBS at University3 years,
60 min. freq.
Qi et al., 2006 model for the construction of cooling towers8 variables
Qi et al., 2016 laboratory tests for mapping cooling system behavior using data mining400 rows,
7 variables
Tian-Hong Pan
et al., 2011
description of a cooling system with data mining to reduce design effort8 months,
1 min. freq.
Wang et al., 2013 identification of efficient operating conditions for the cooling system in a steel factory60,000 rows,
5 min. freq.

