
Evaluation of Hardness and Residual Stress Changes of AISI 4140 Steel Due to Thermal Load during Surface Grinding


Abstract
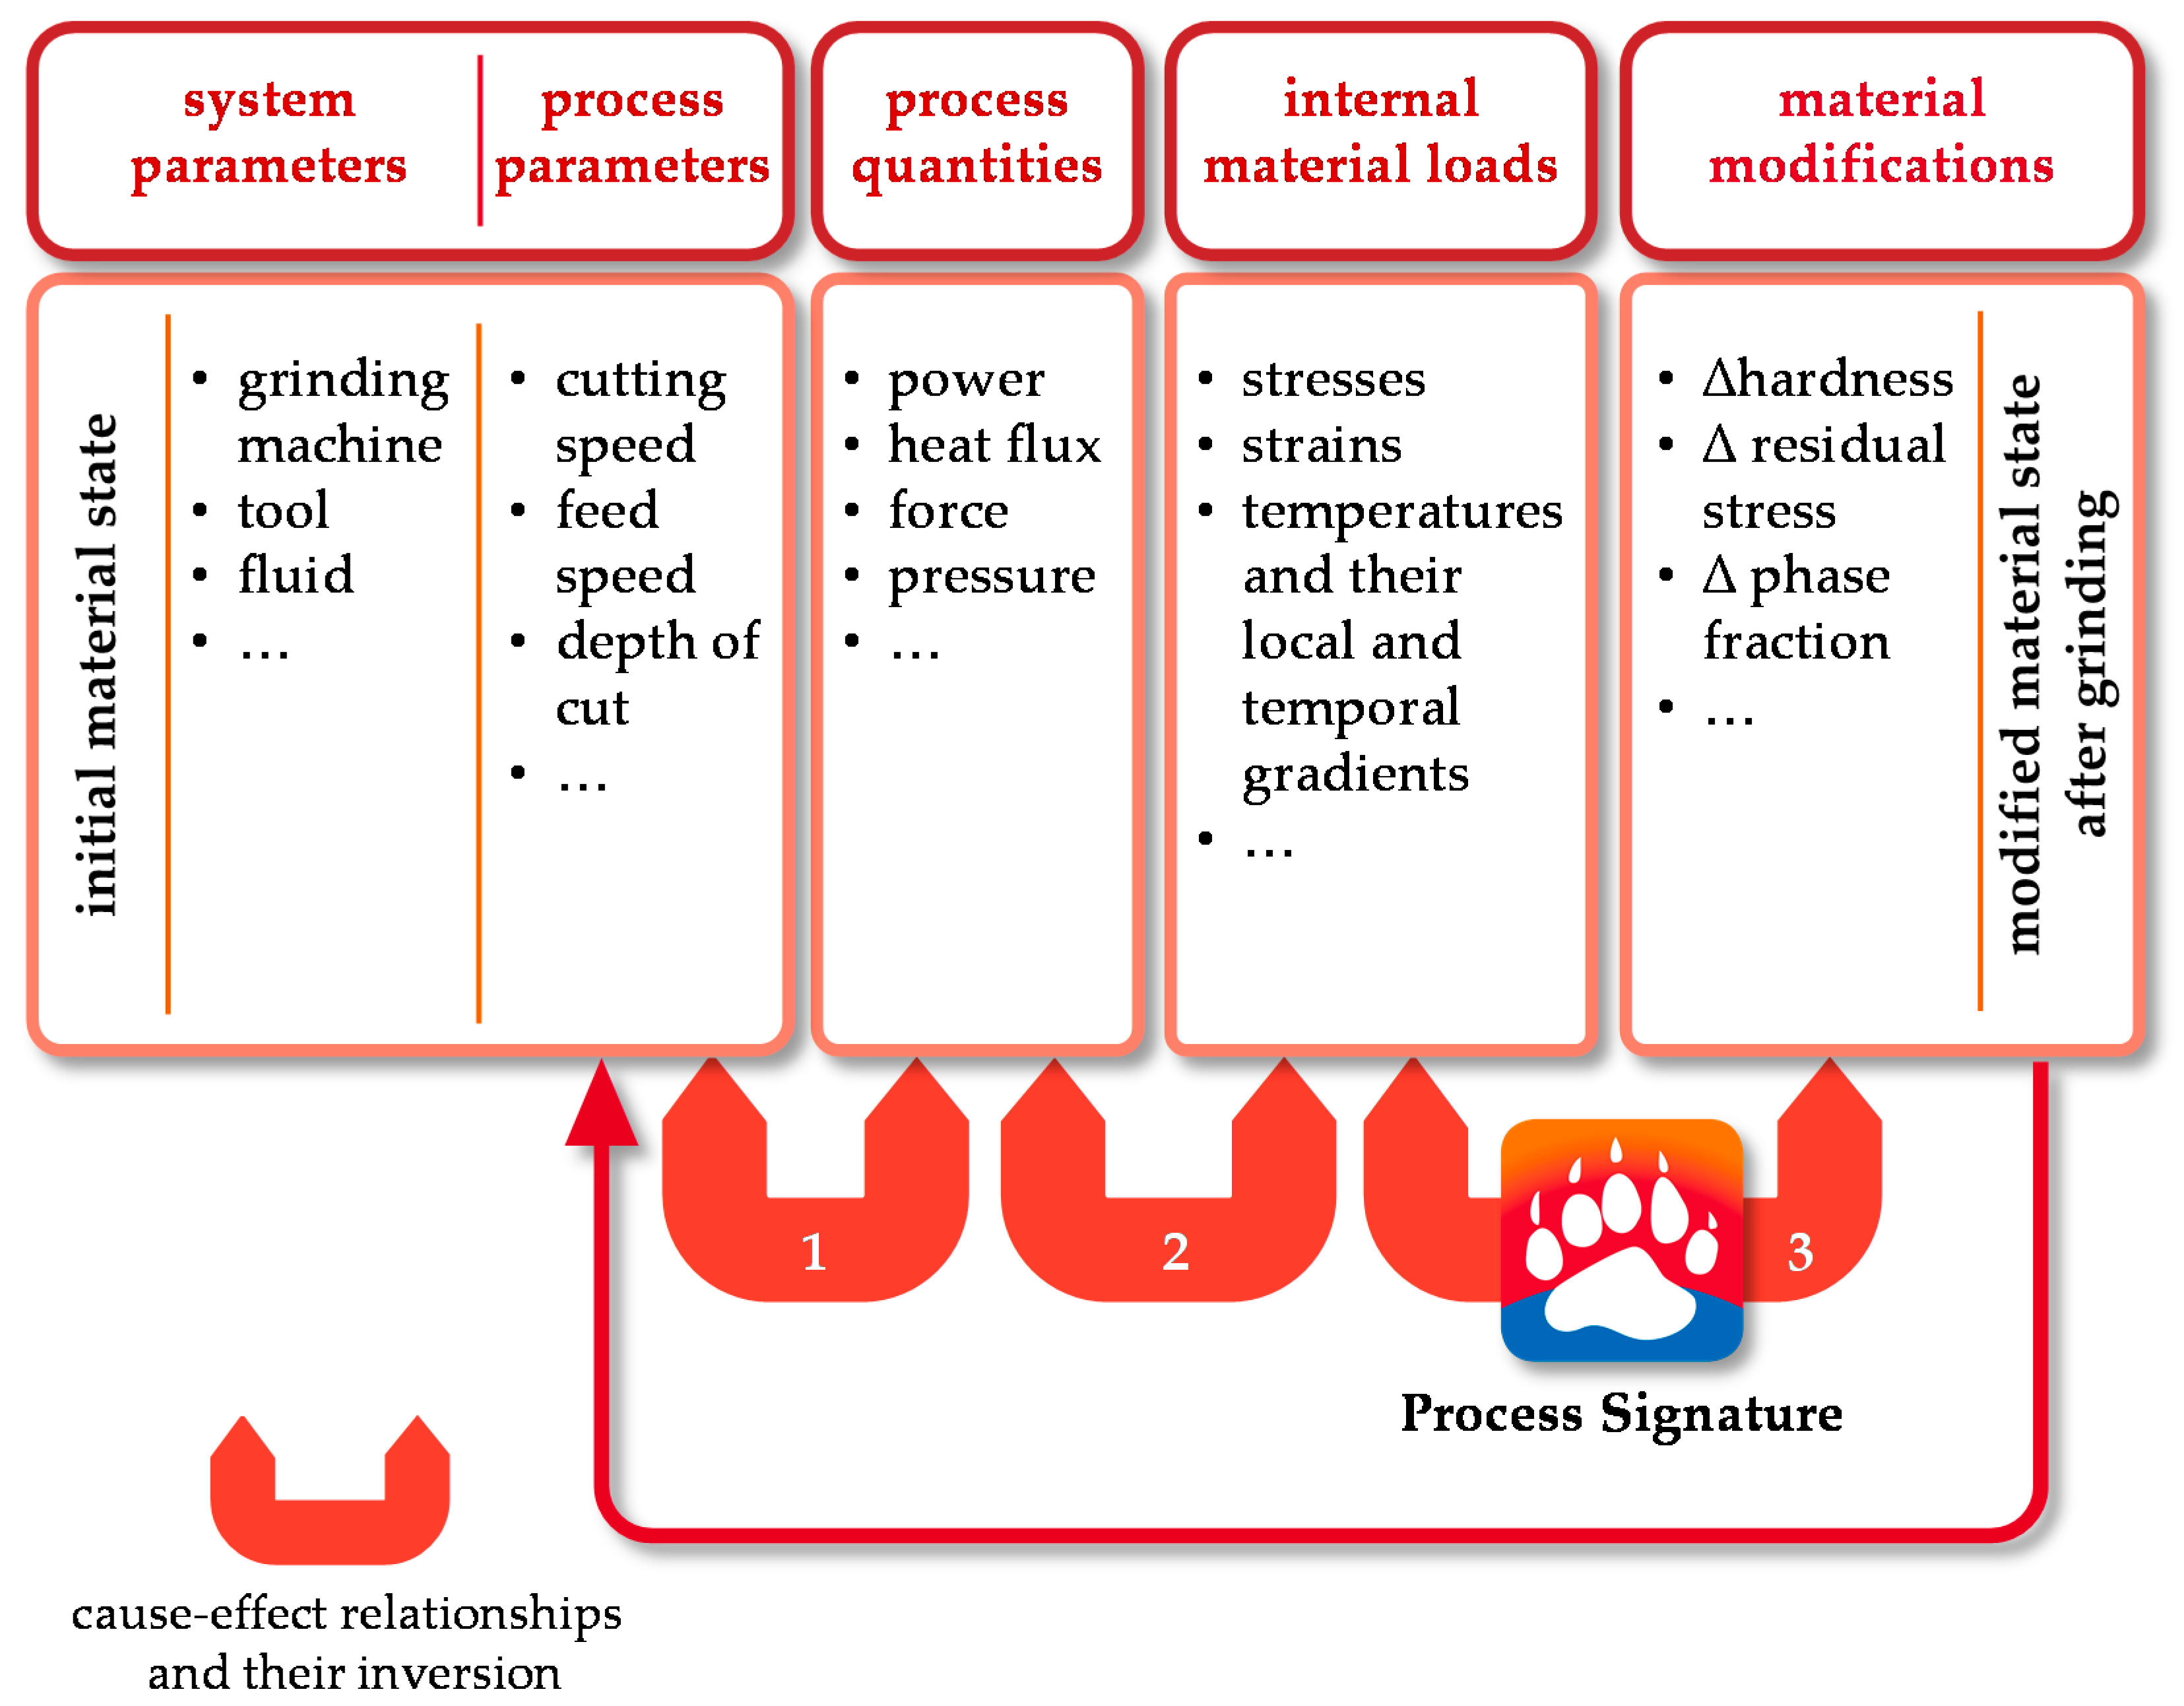
:1. Introduction and State of the Art
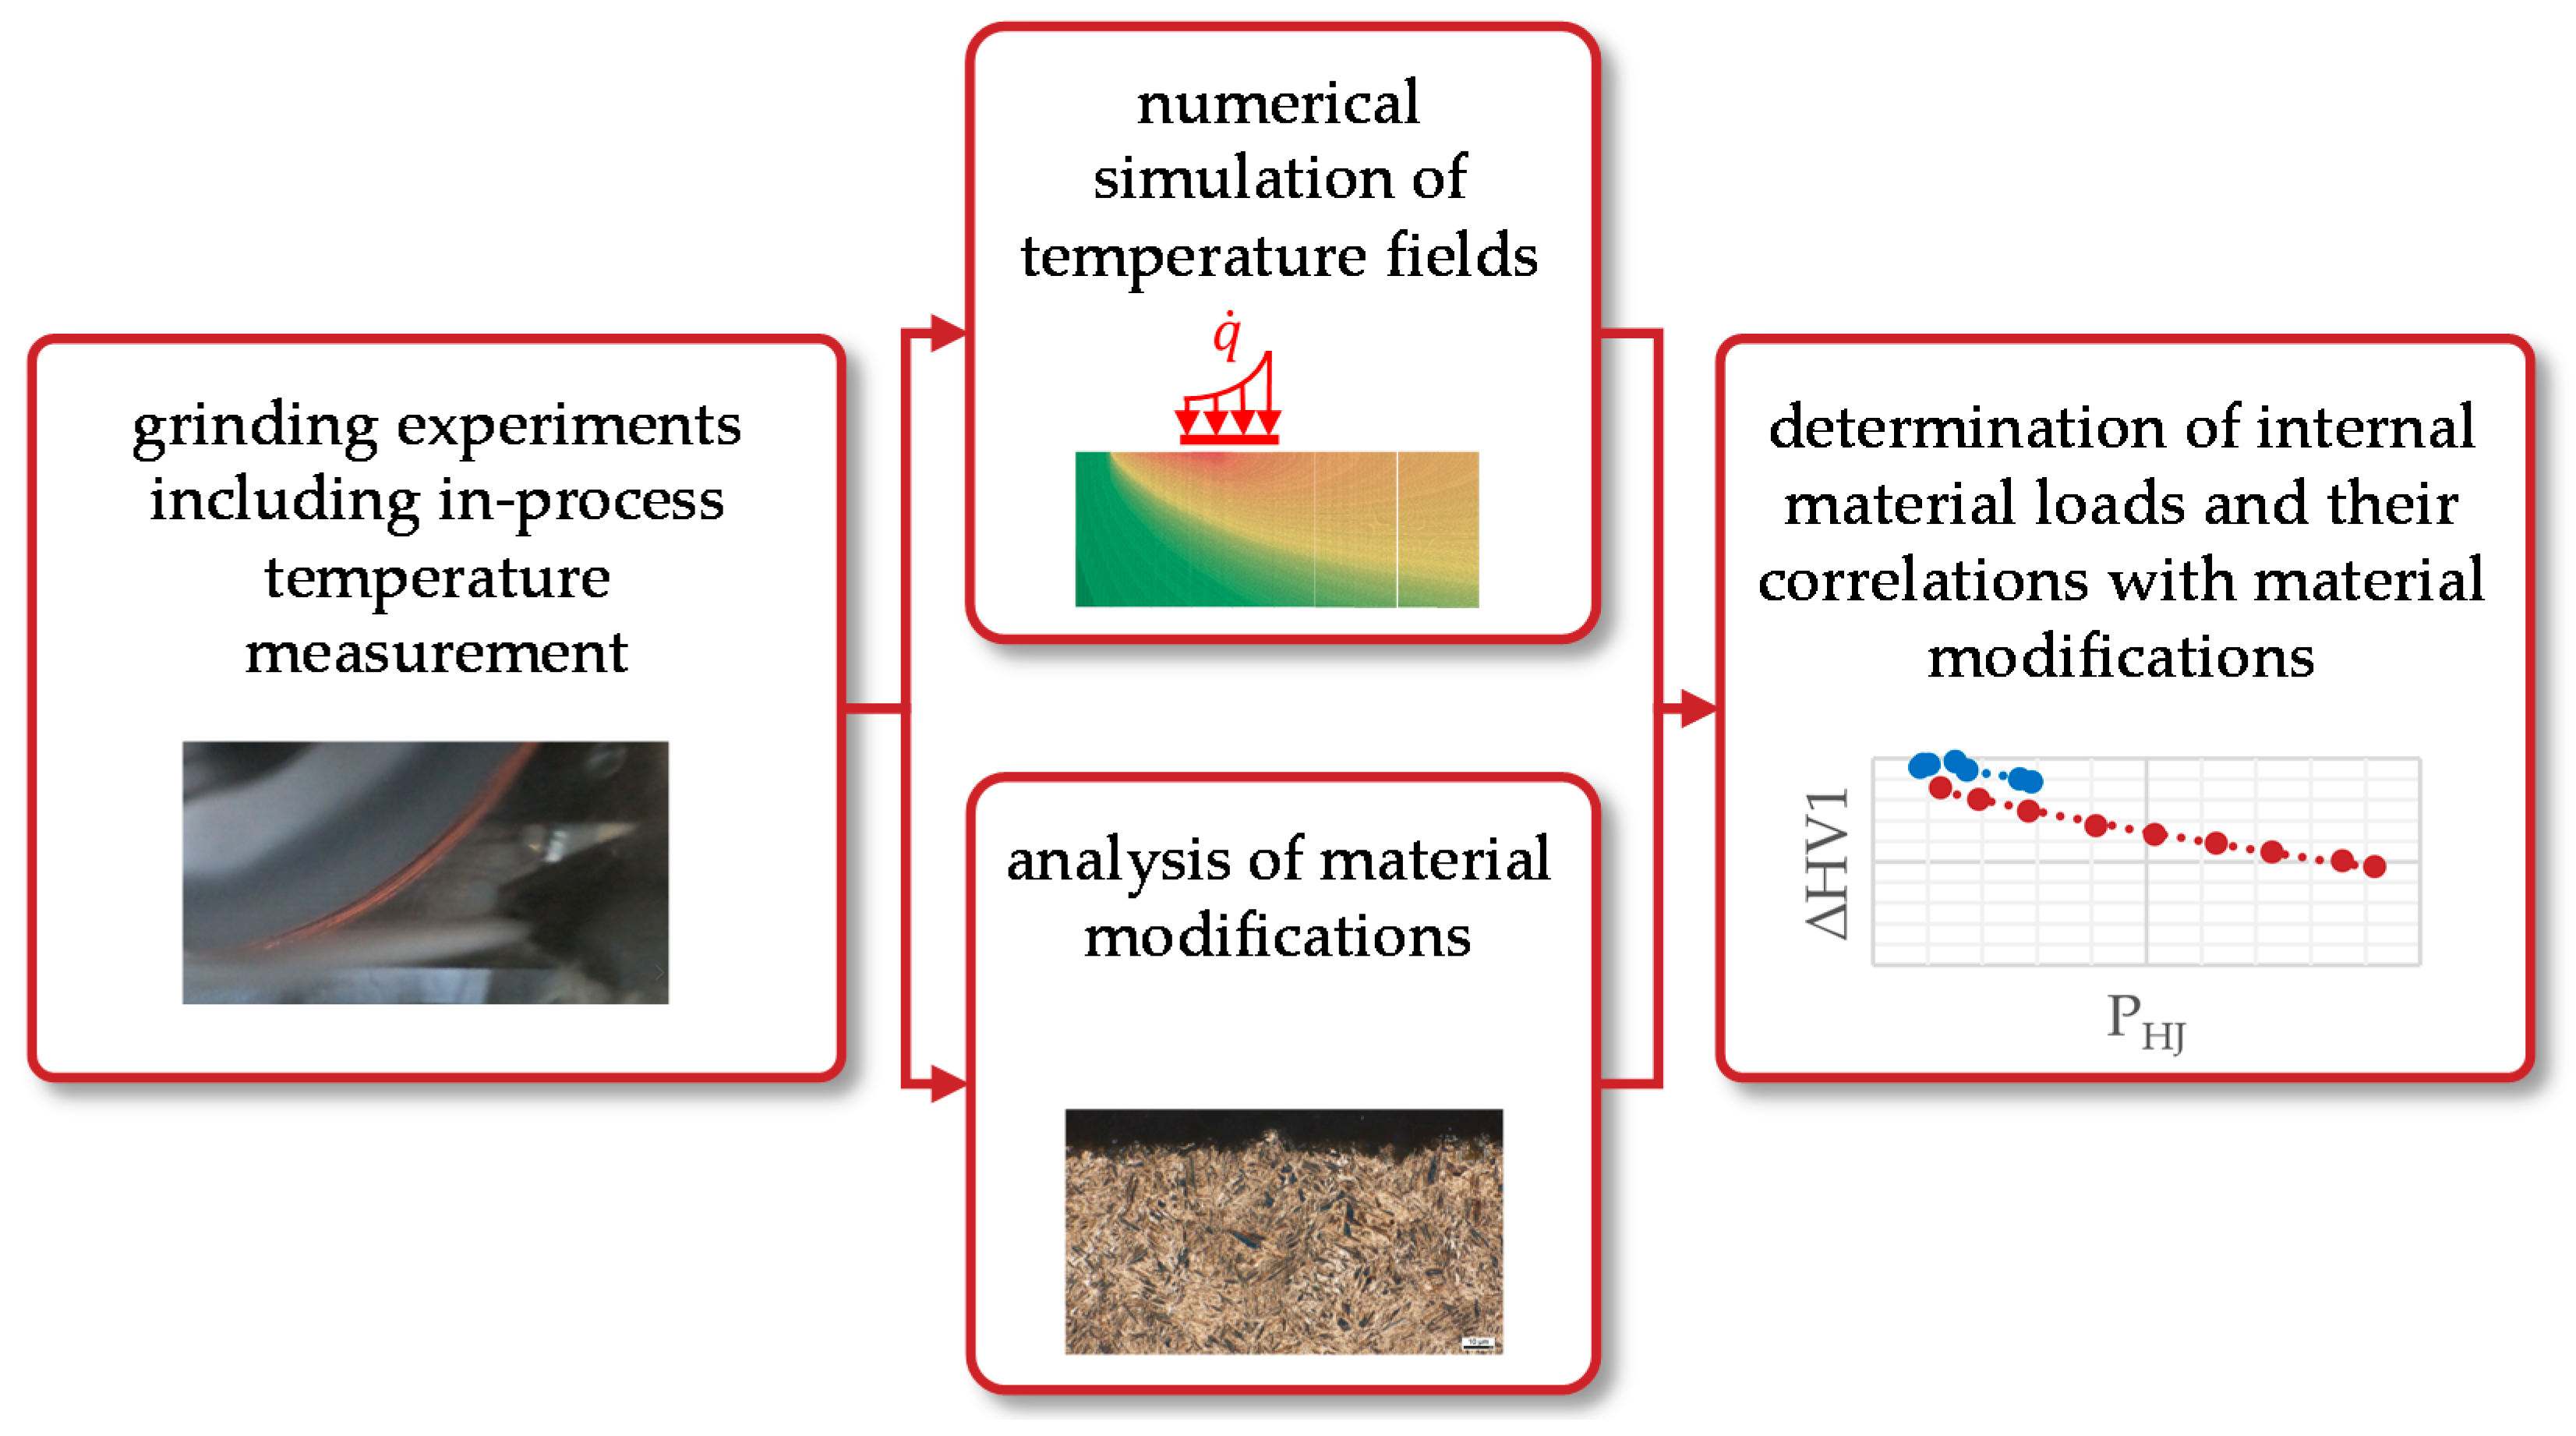
2. Objectives and Research Approach
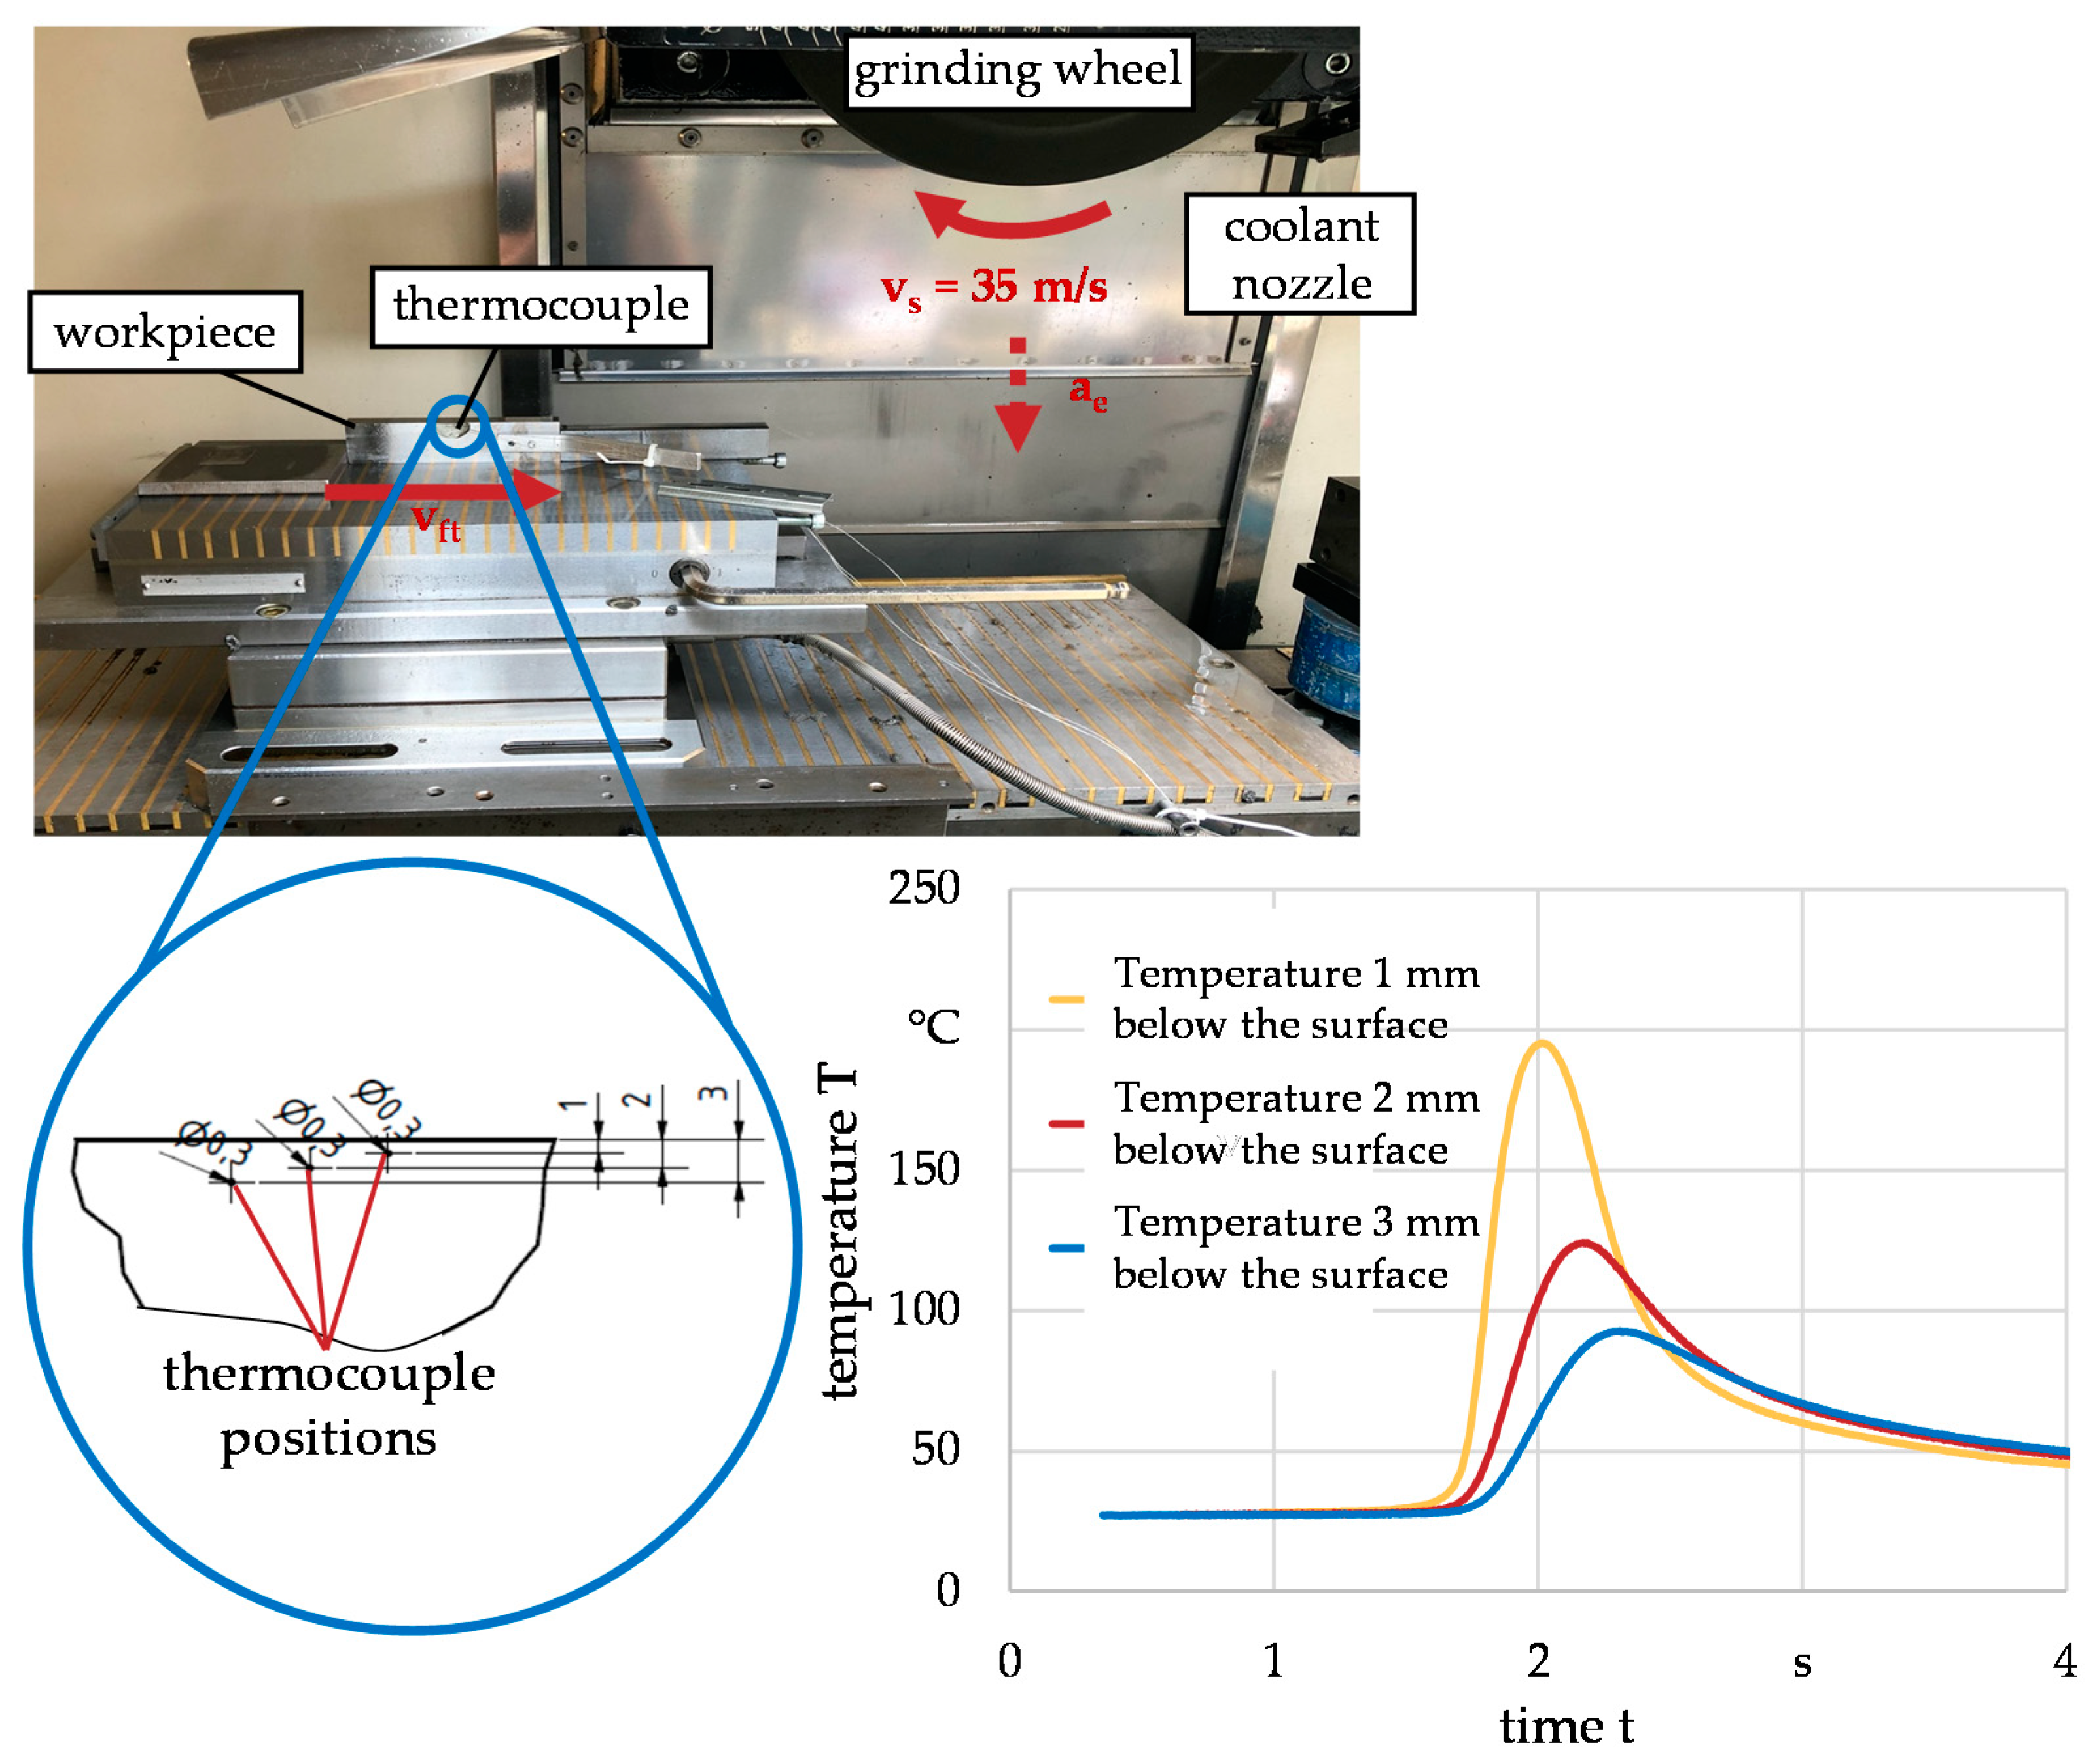
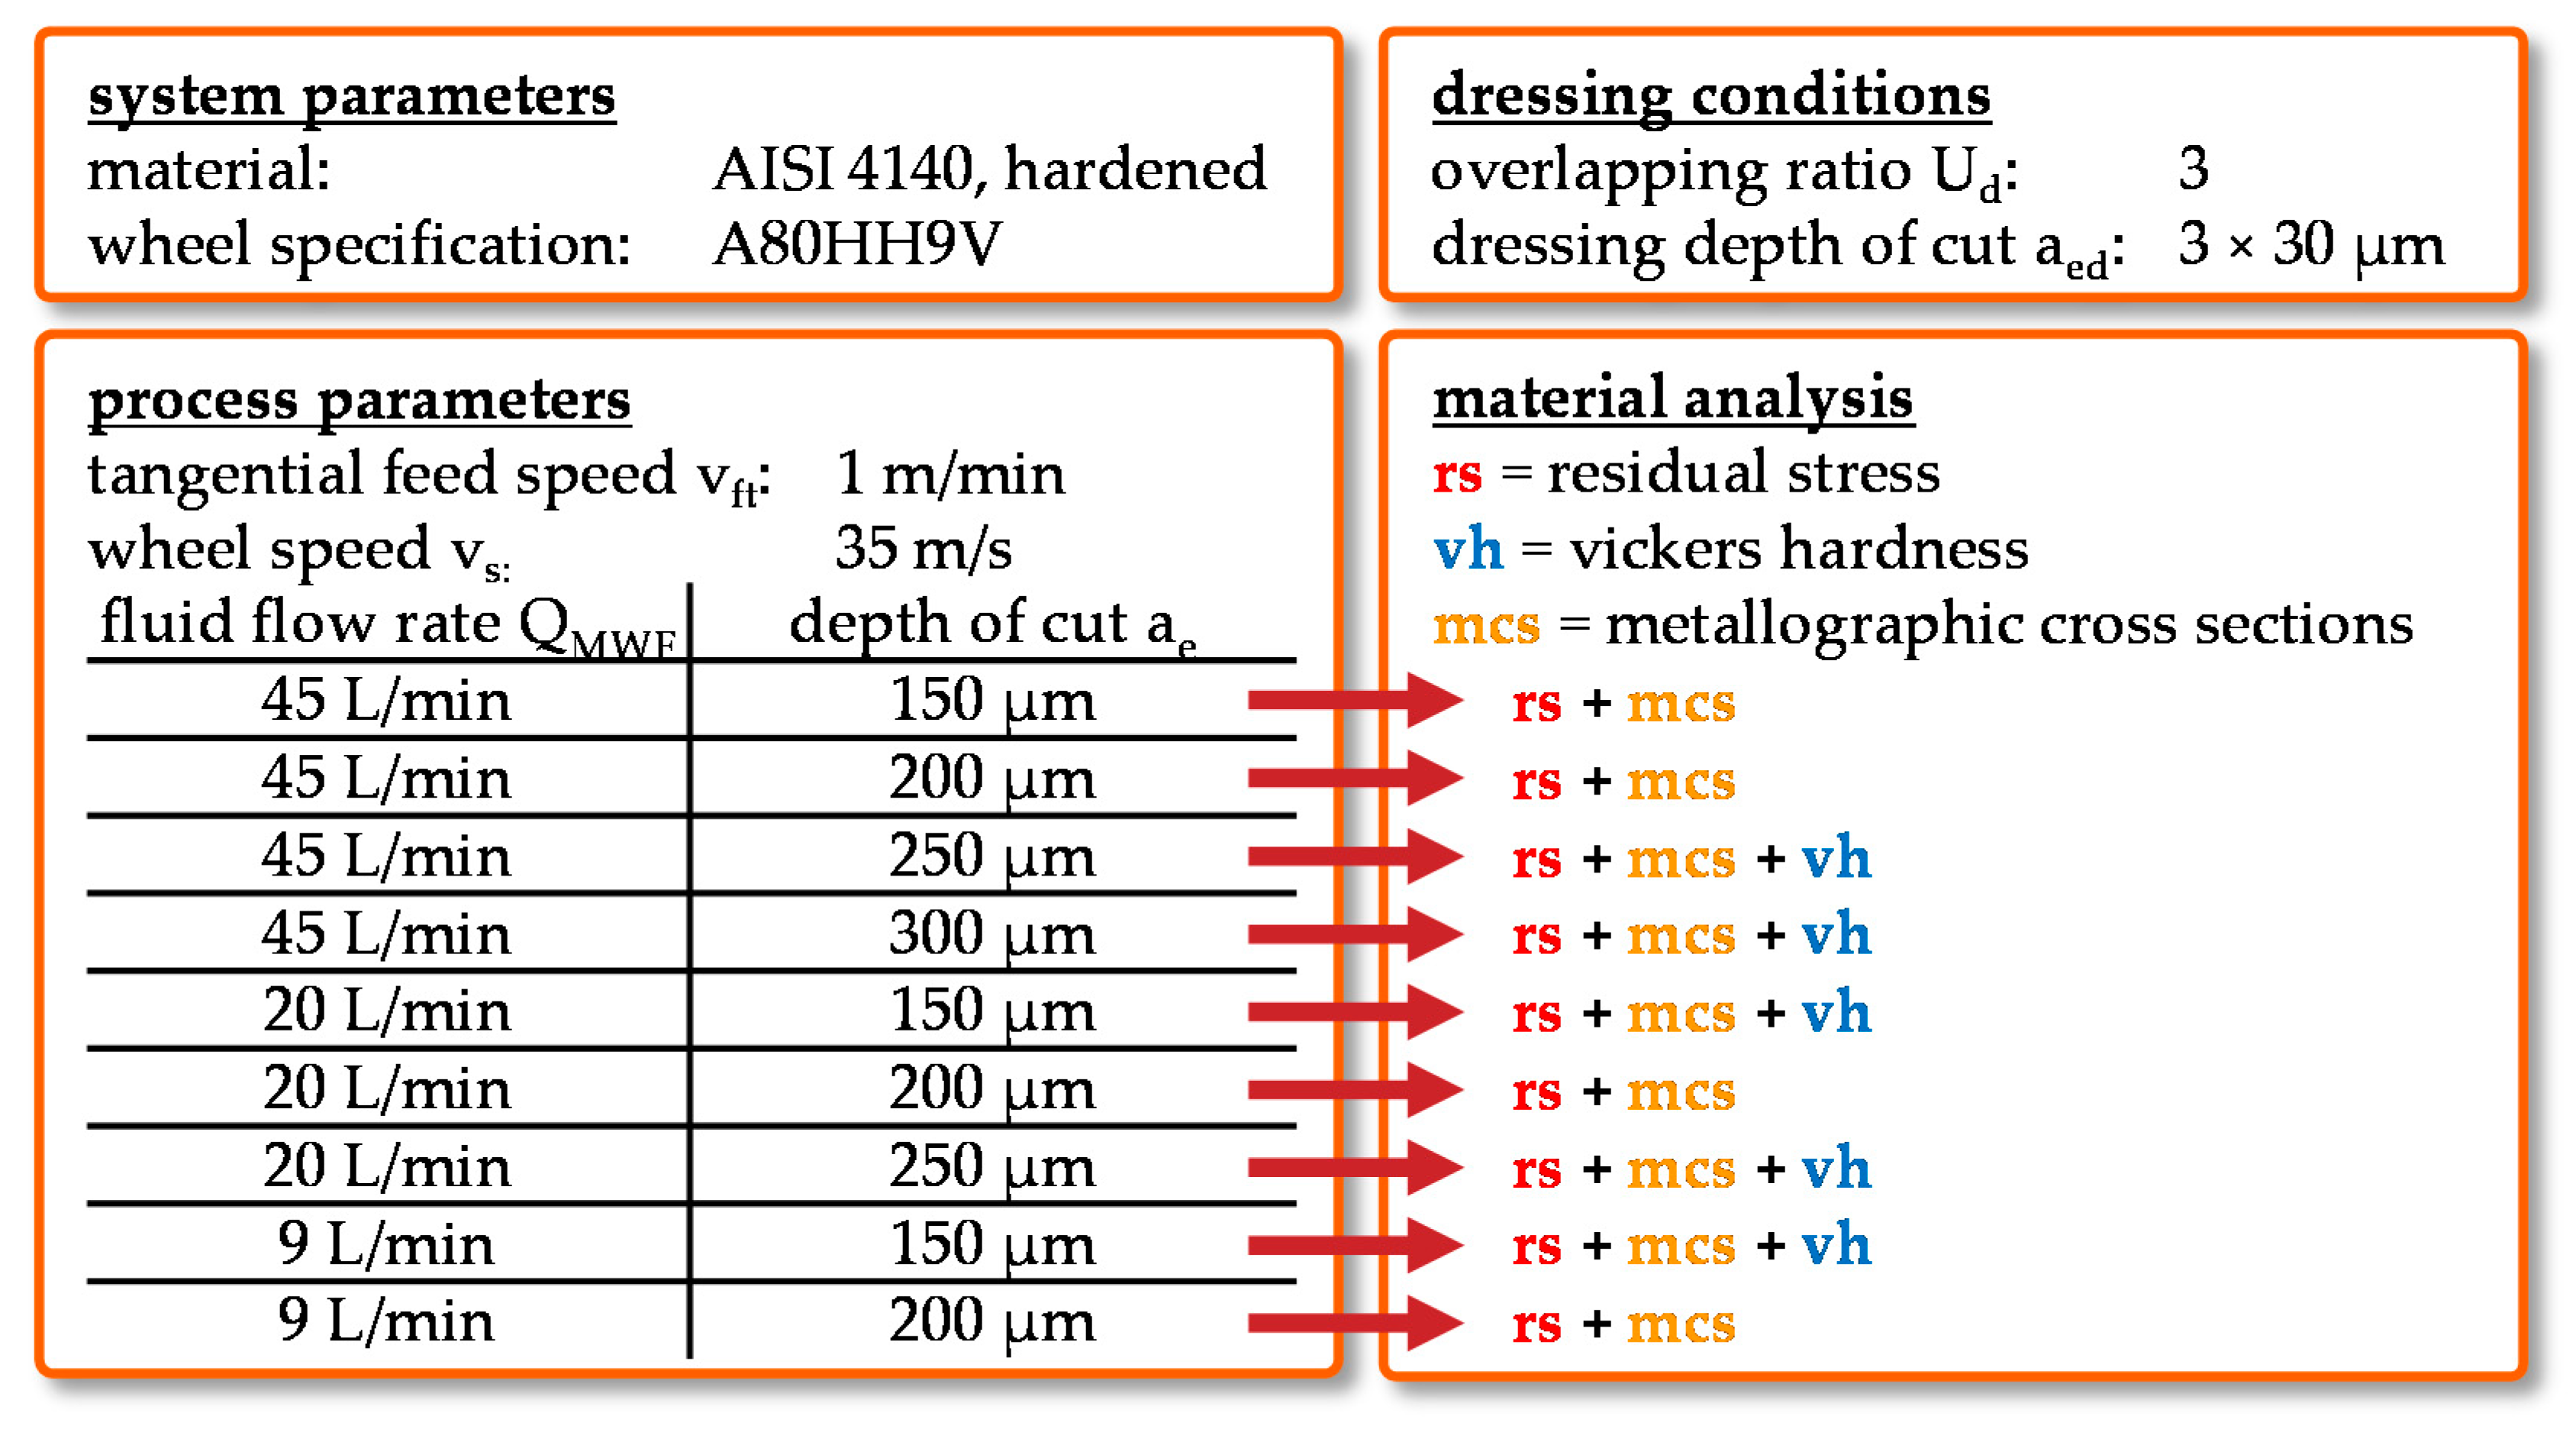
3. Materials and Methods
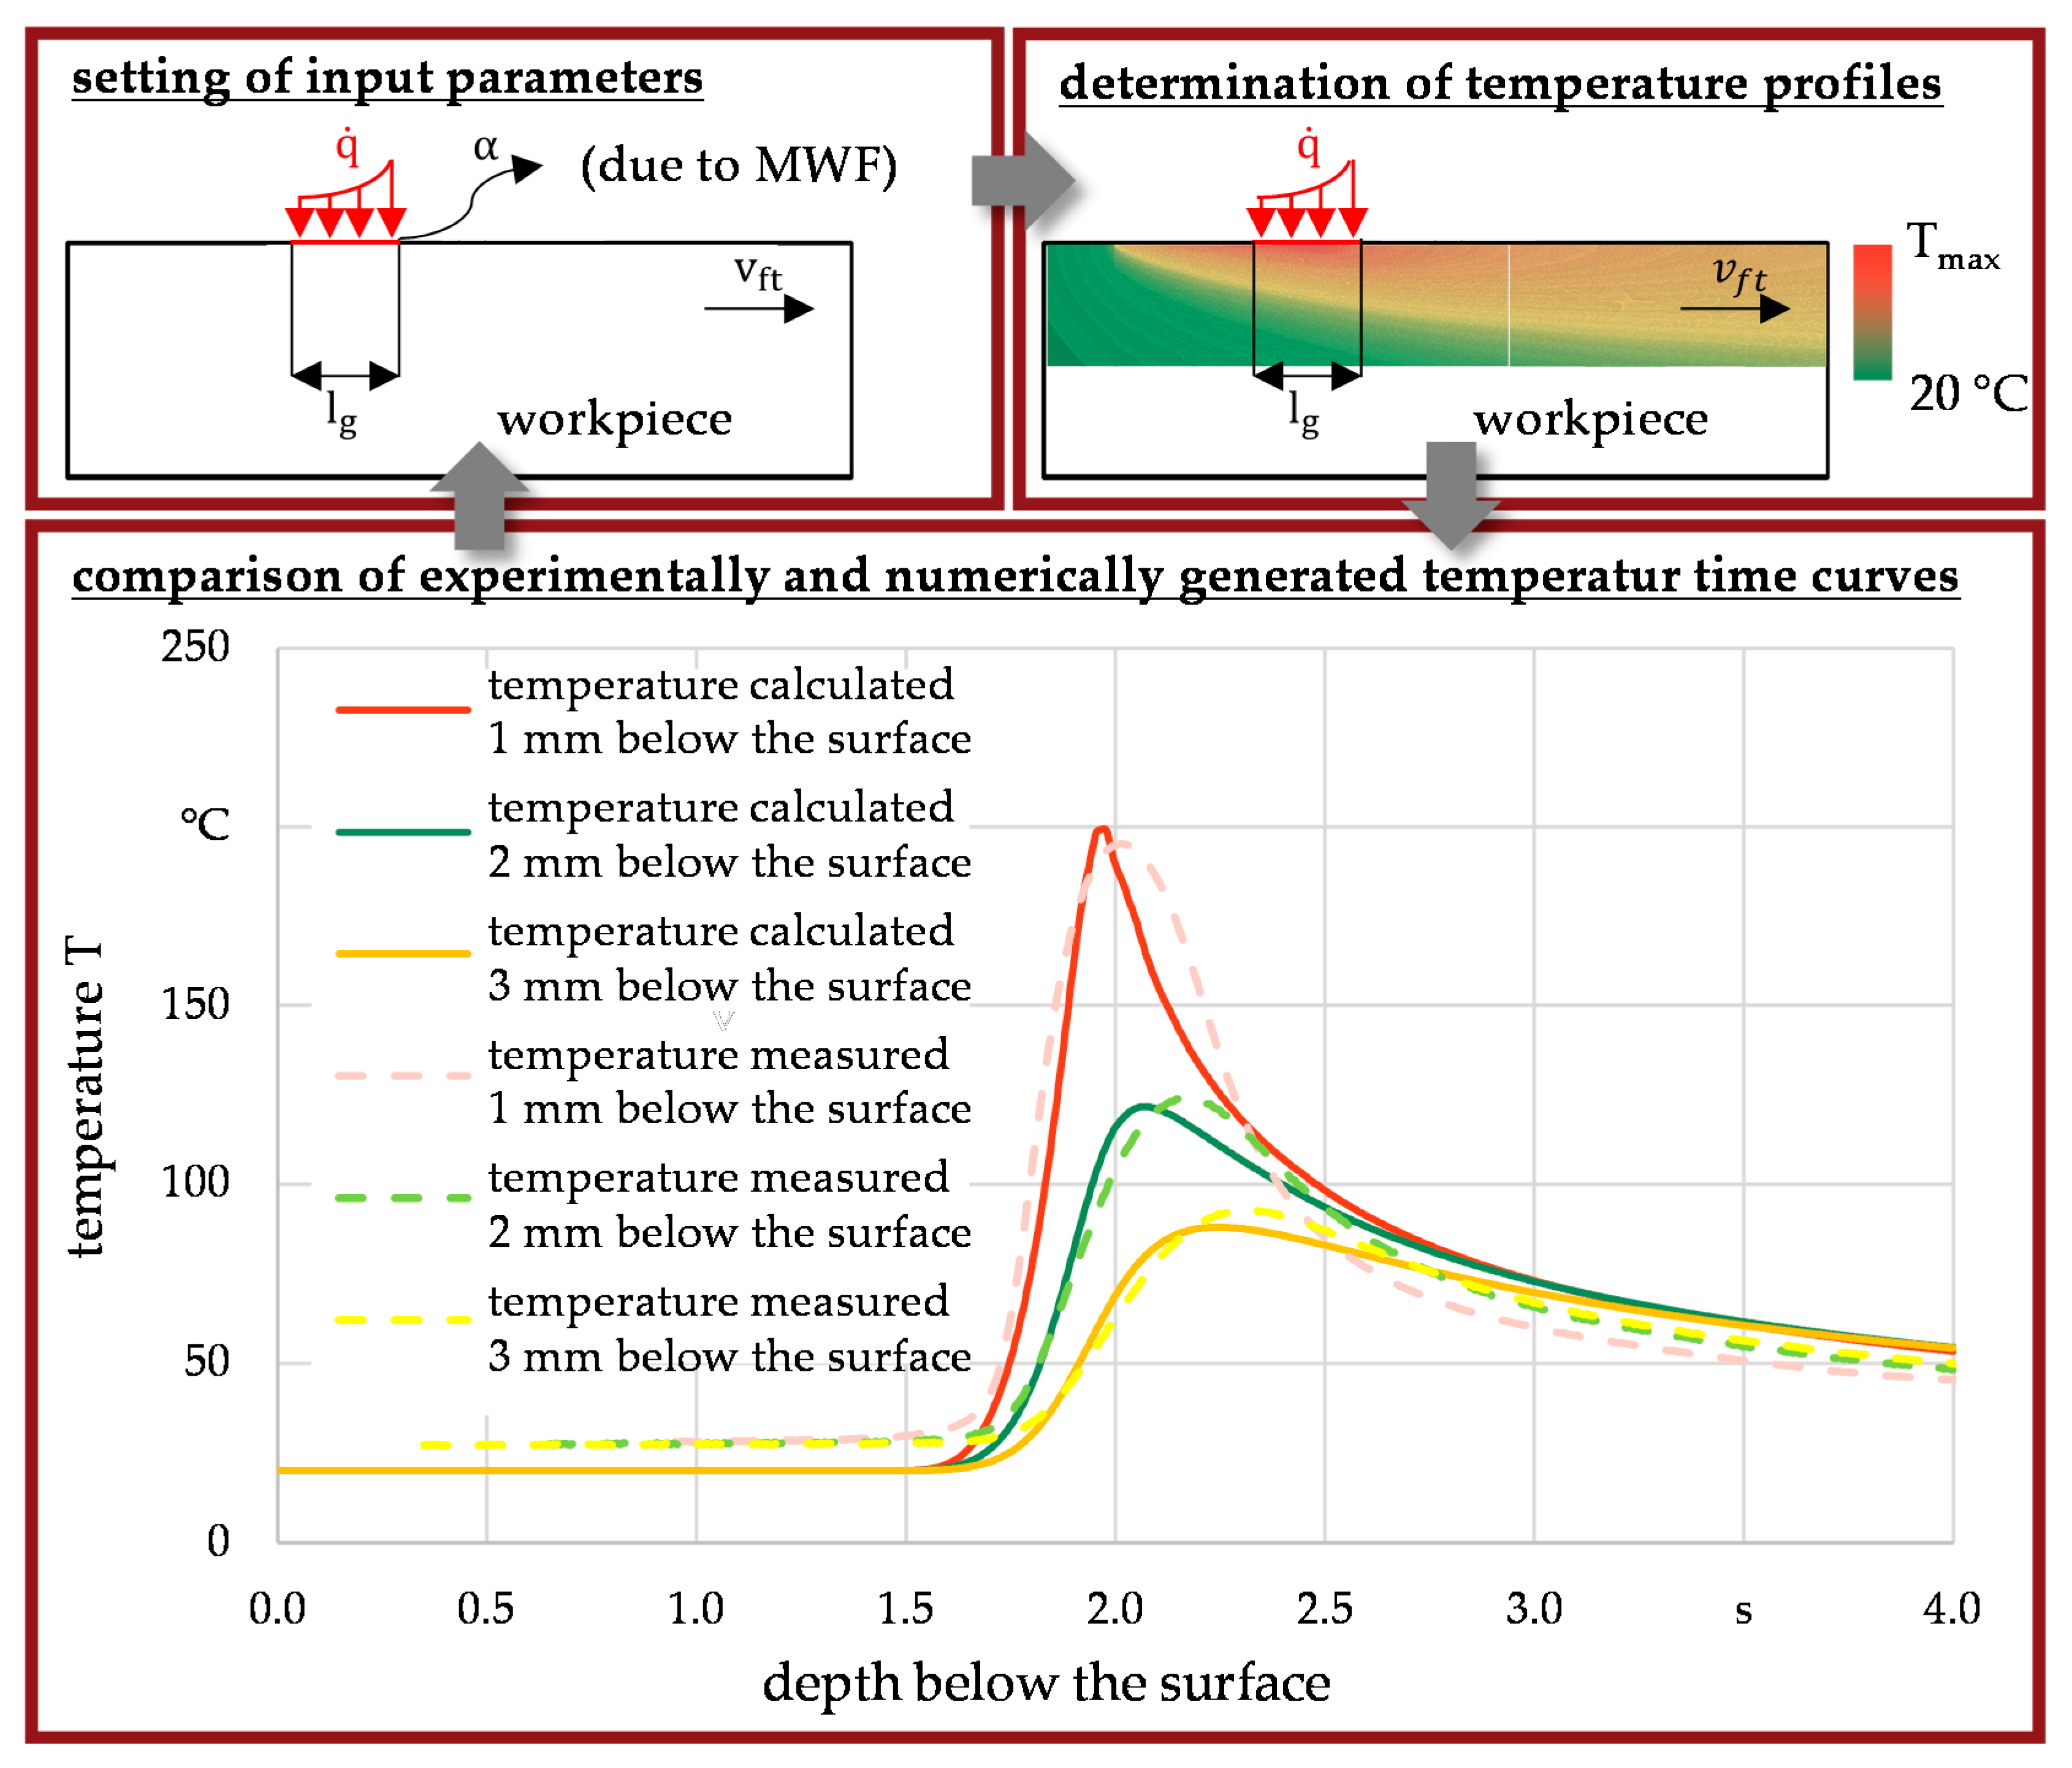
4. Experimental and Numerical Findings
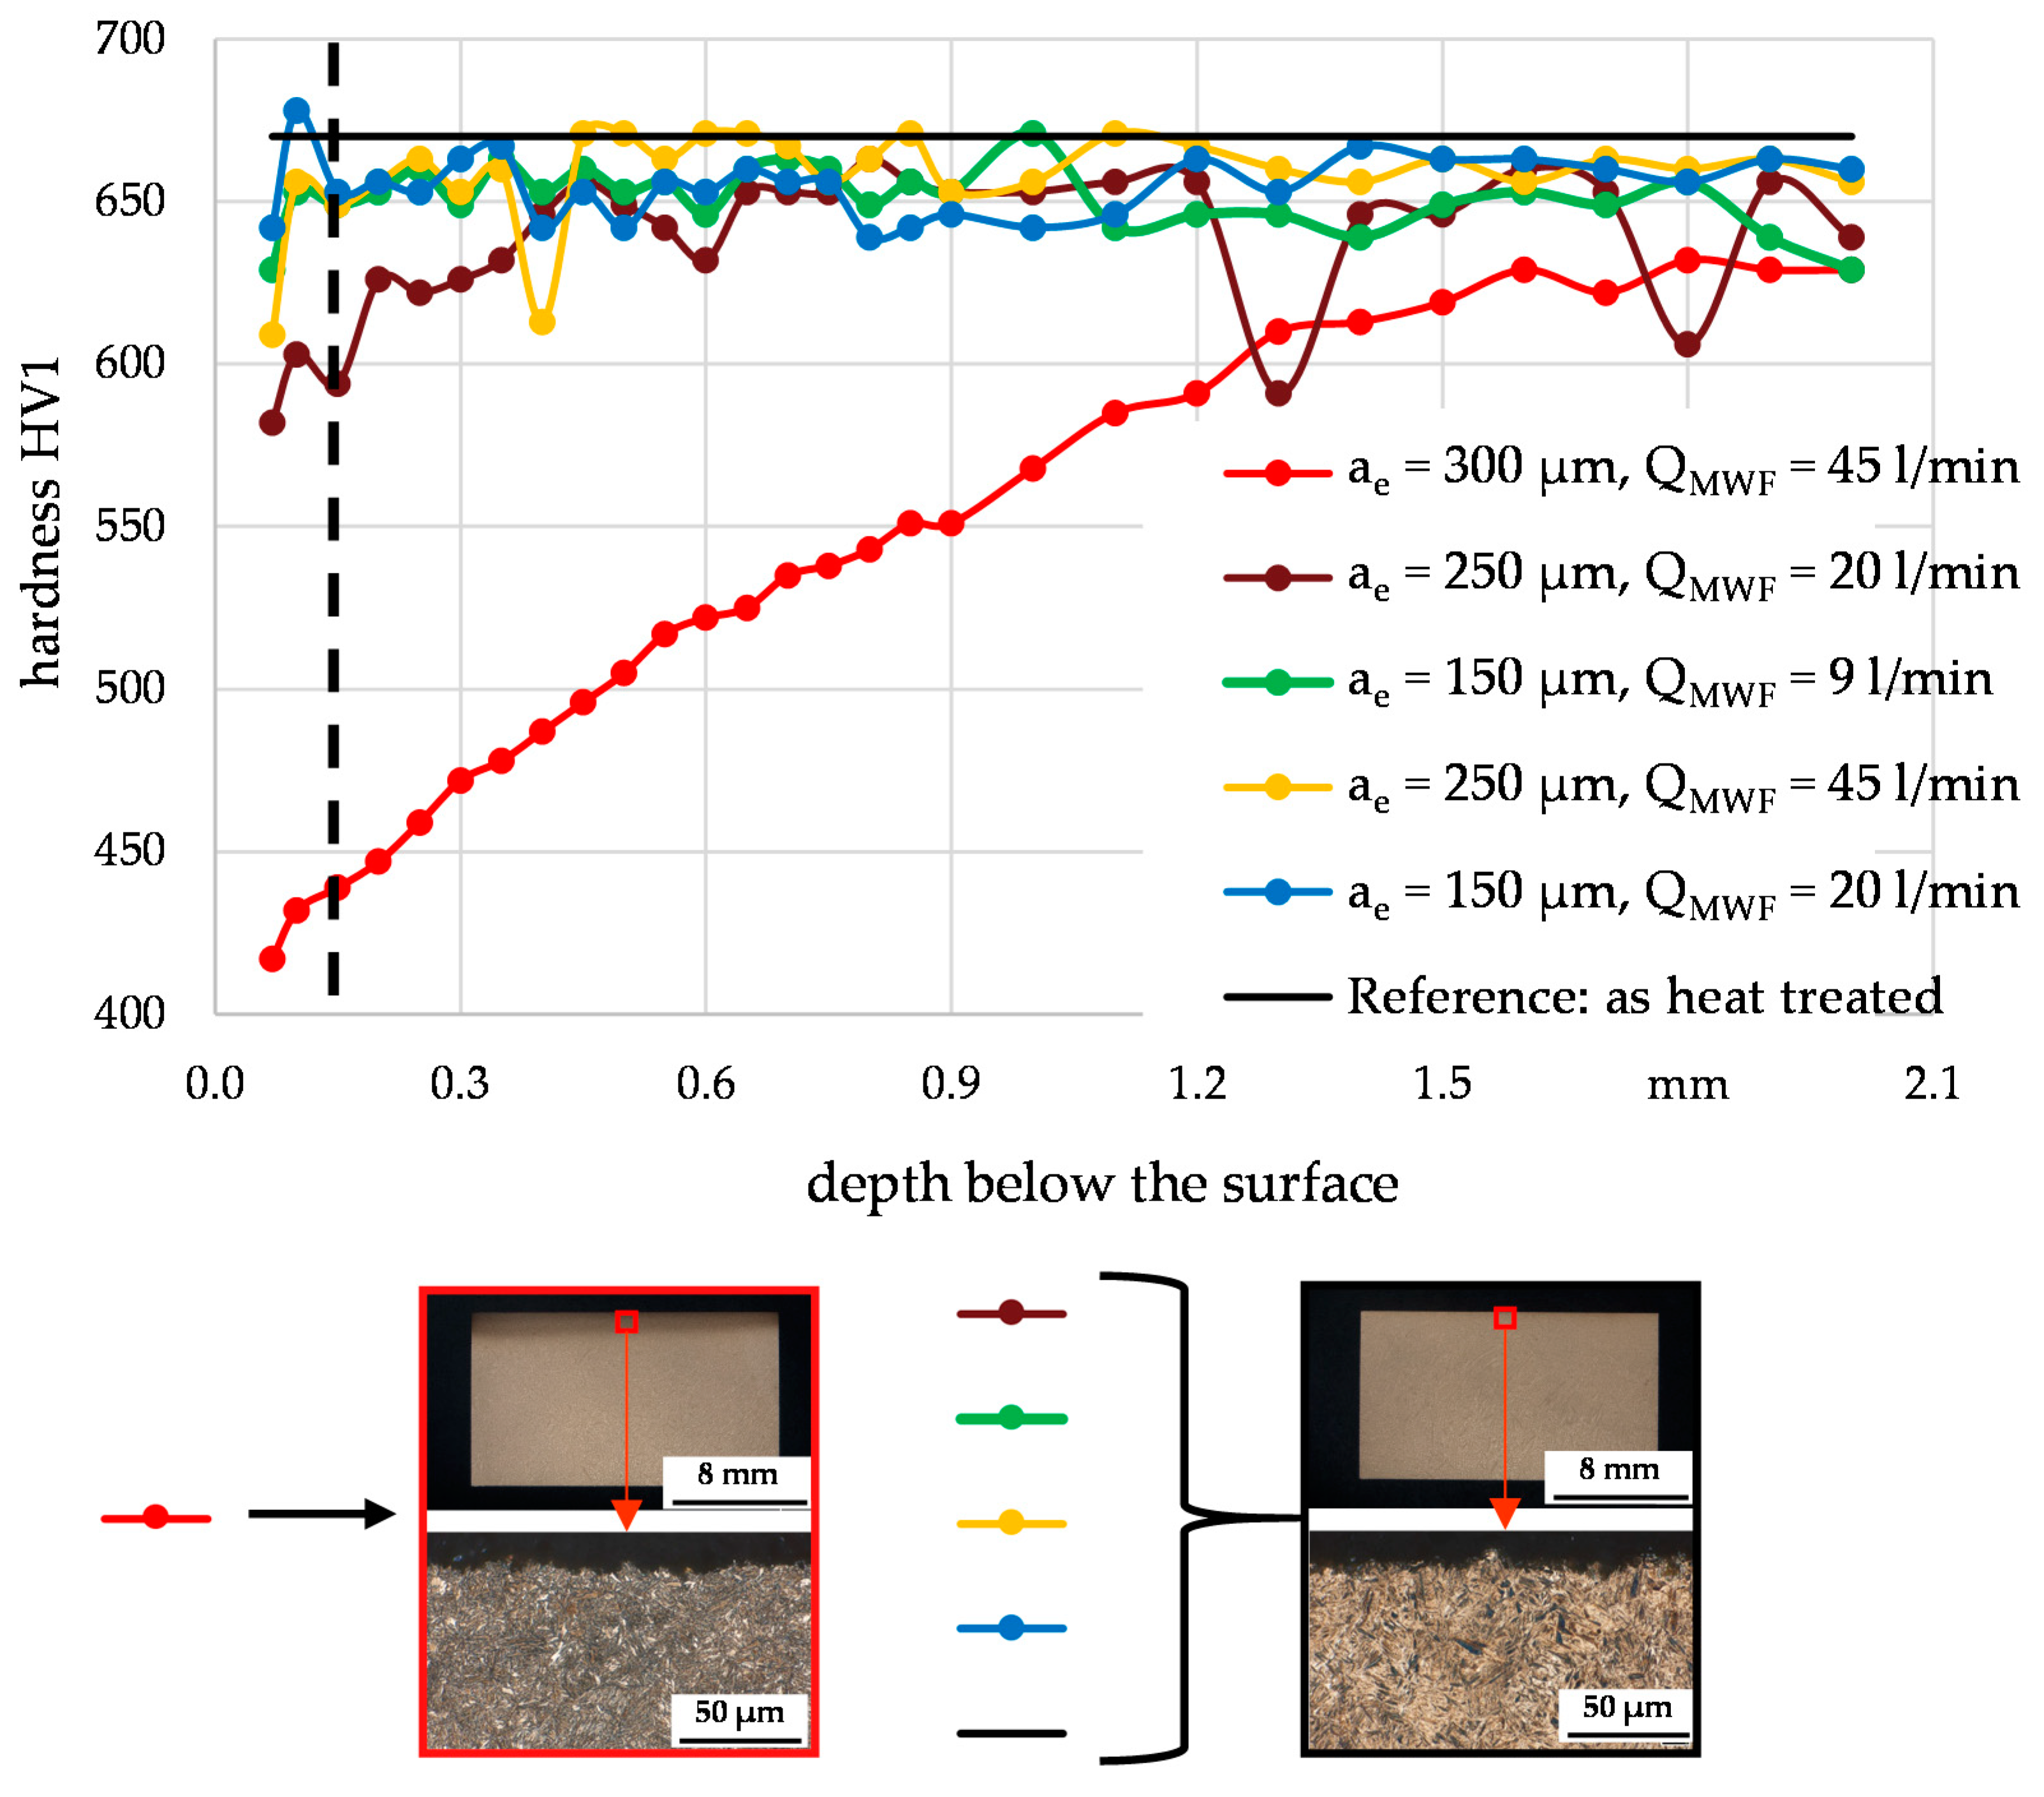
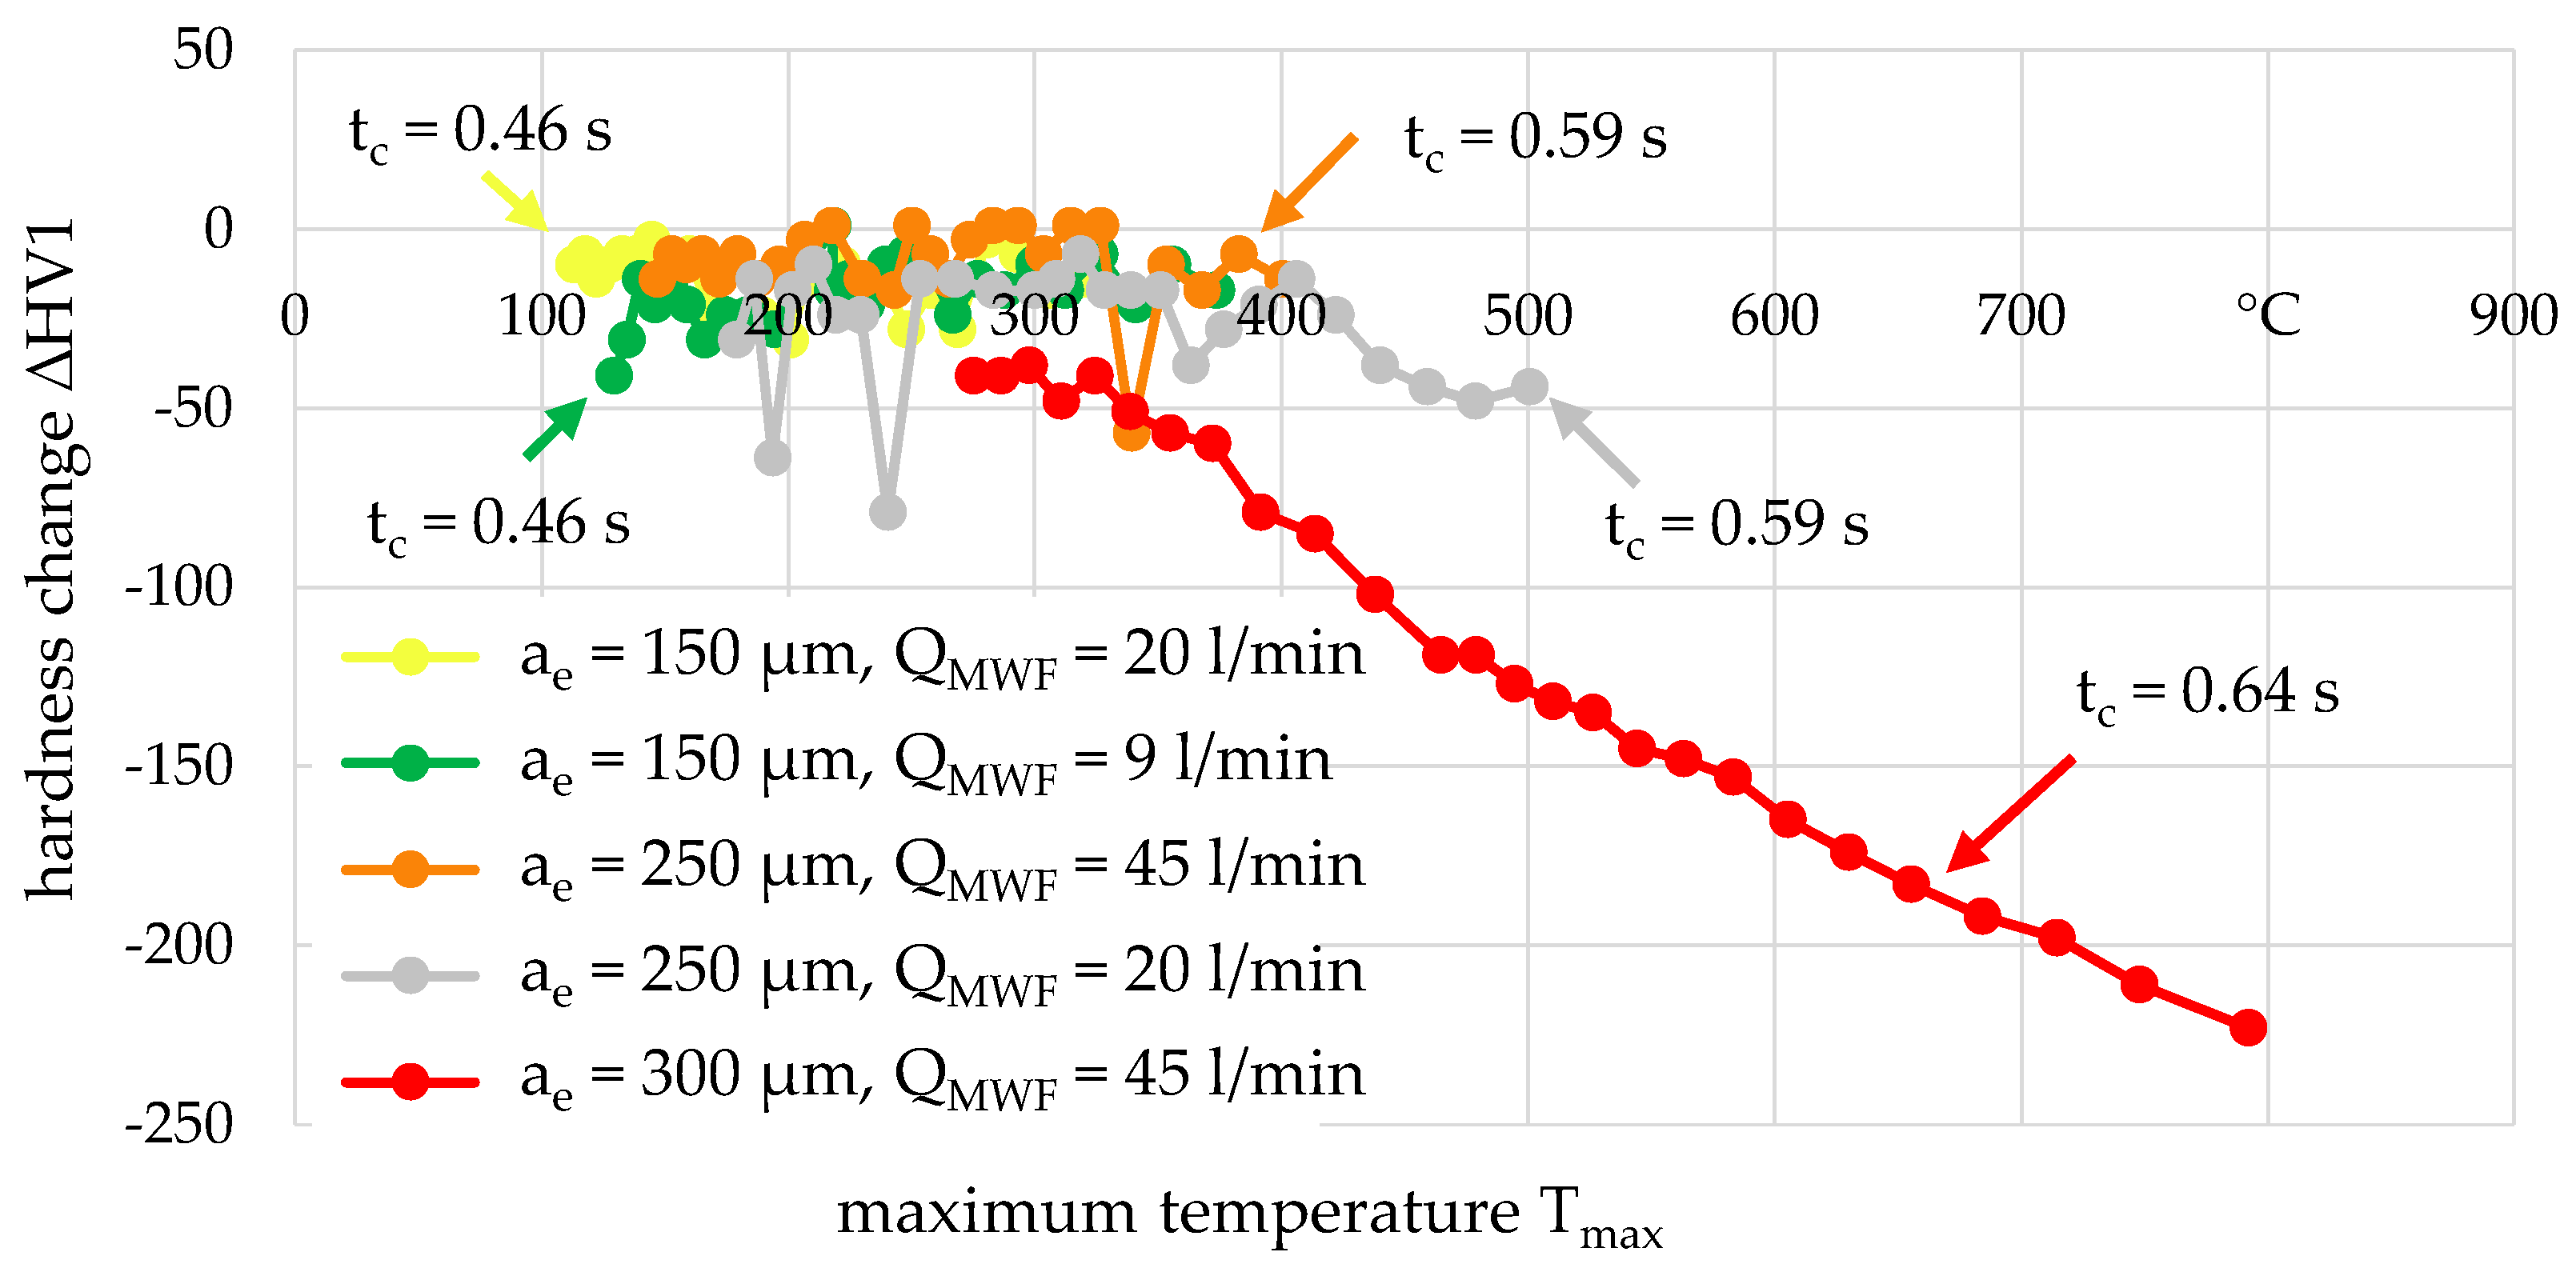
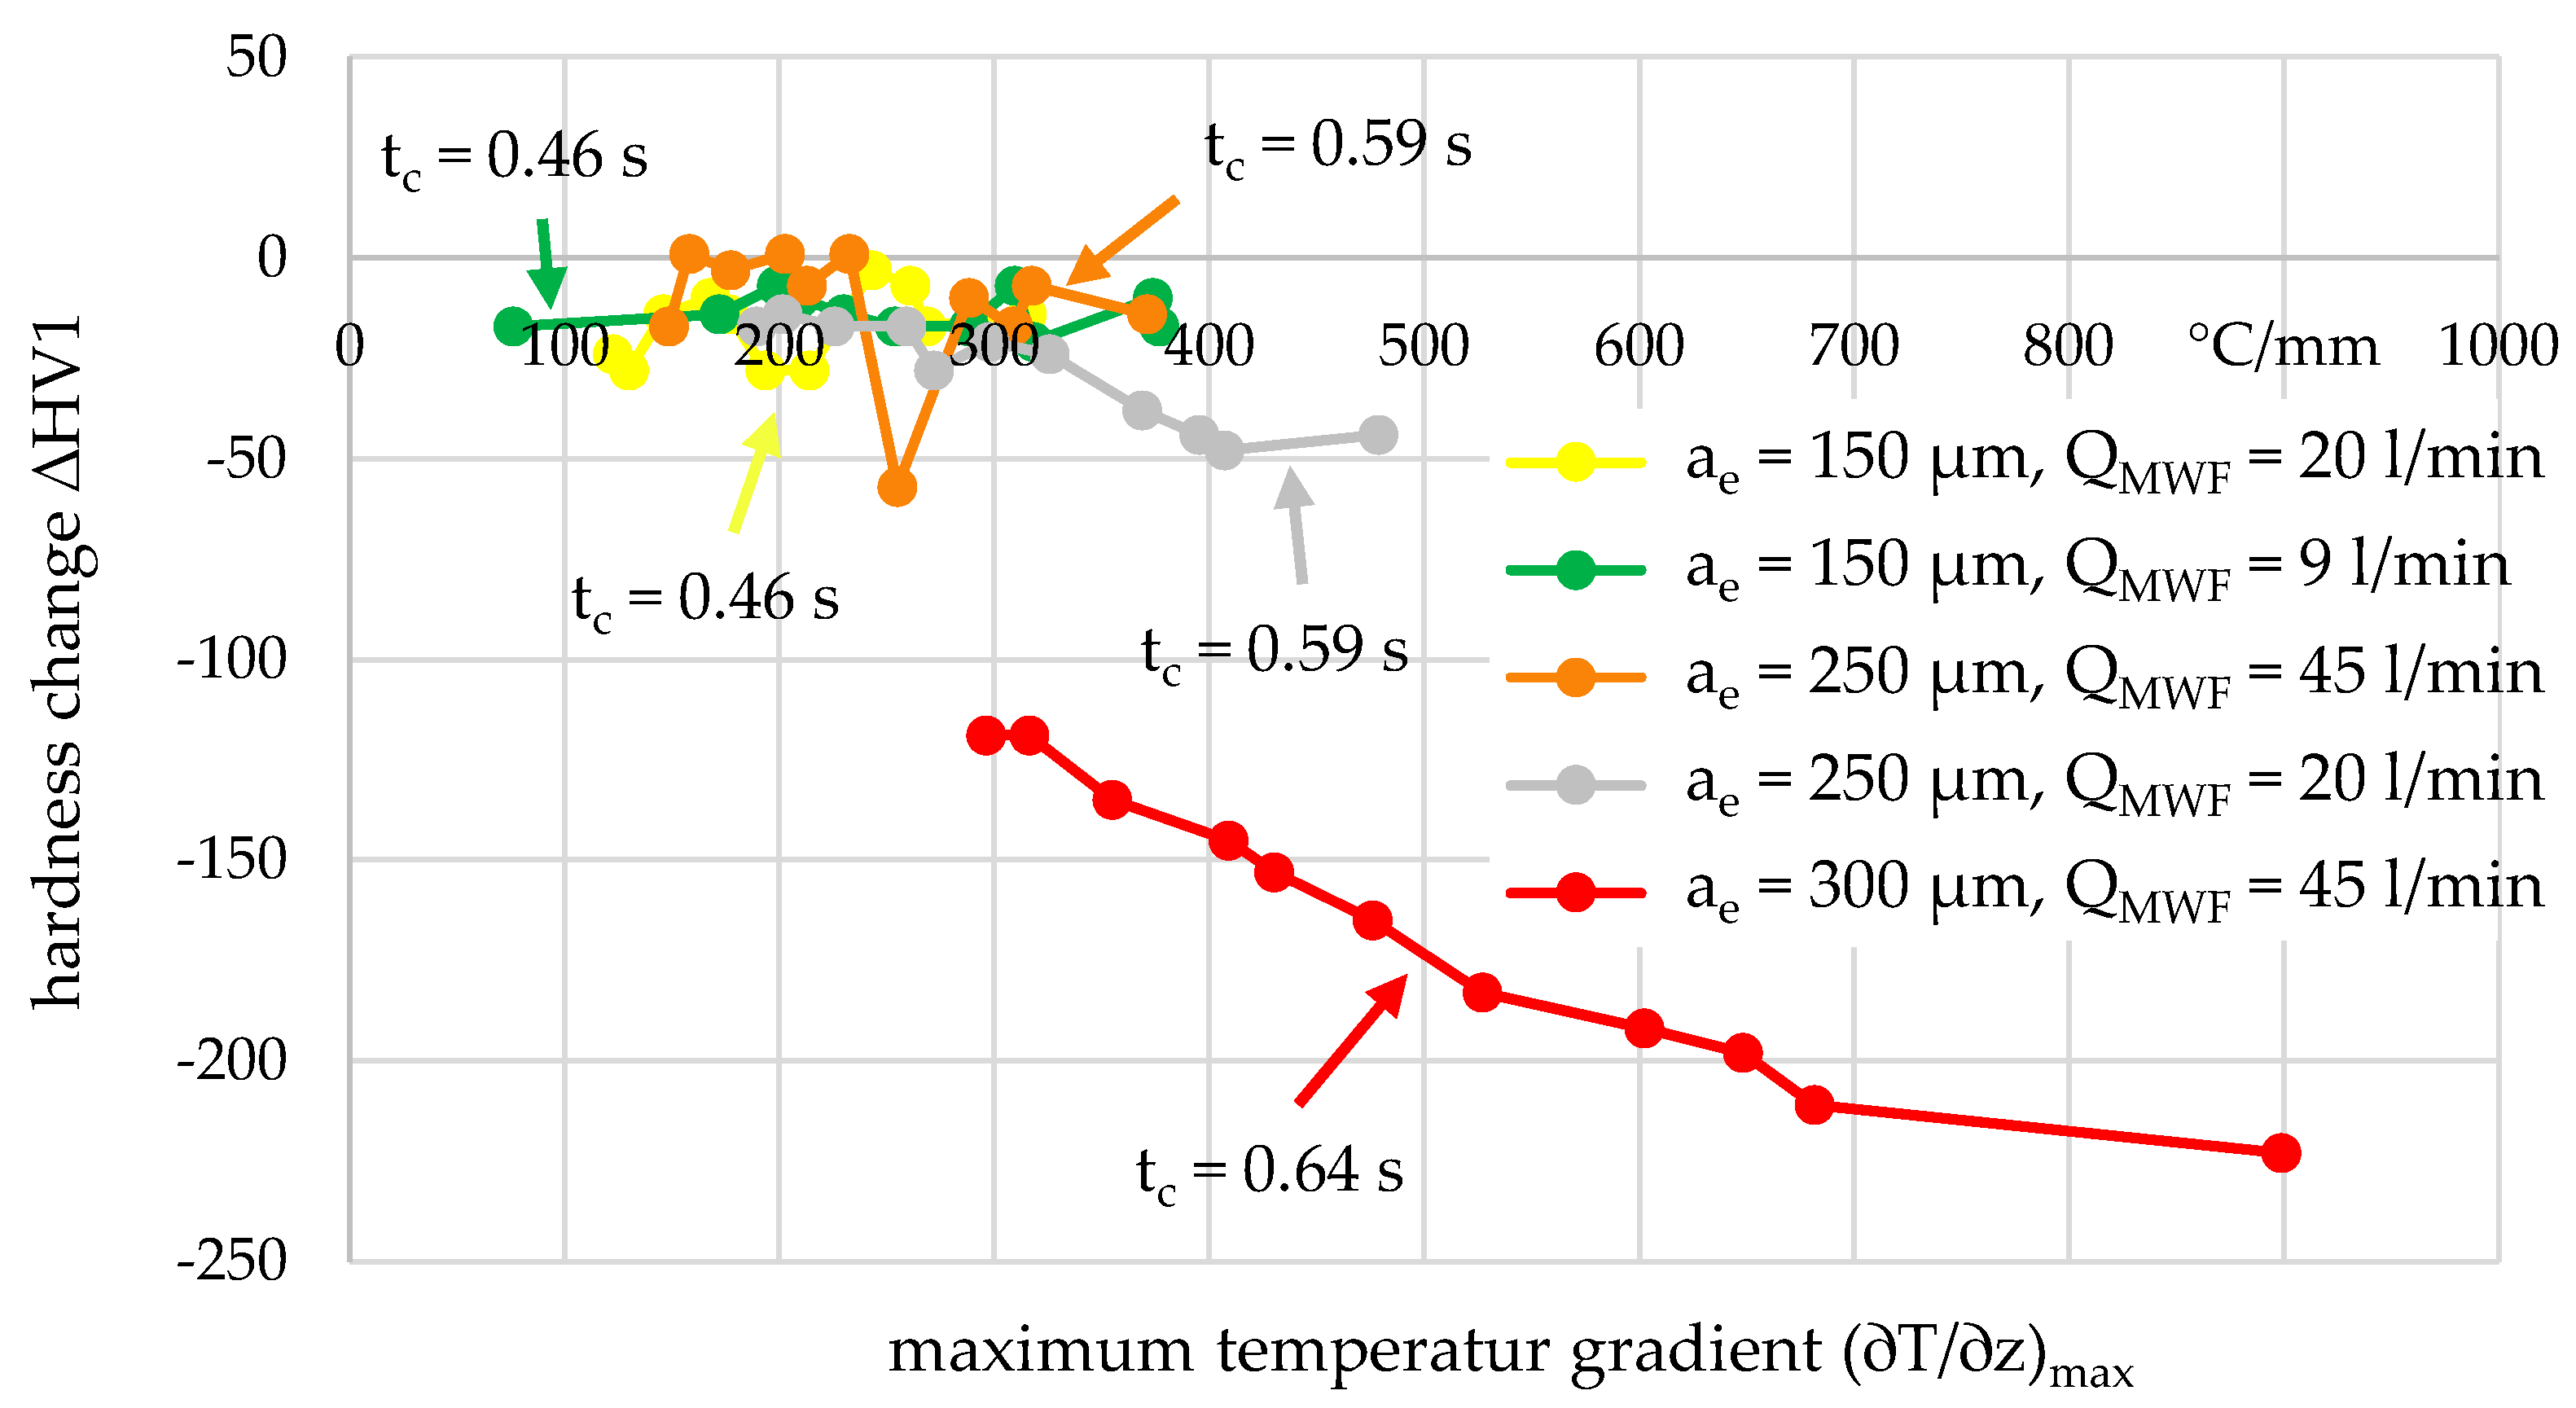
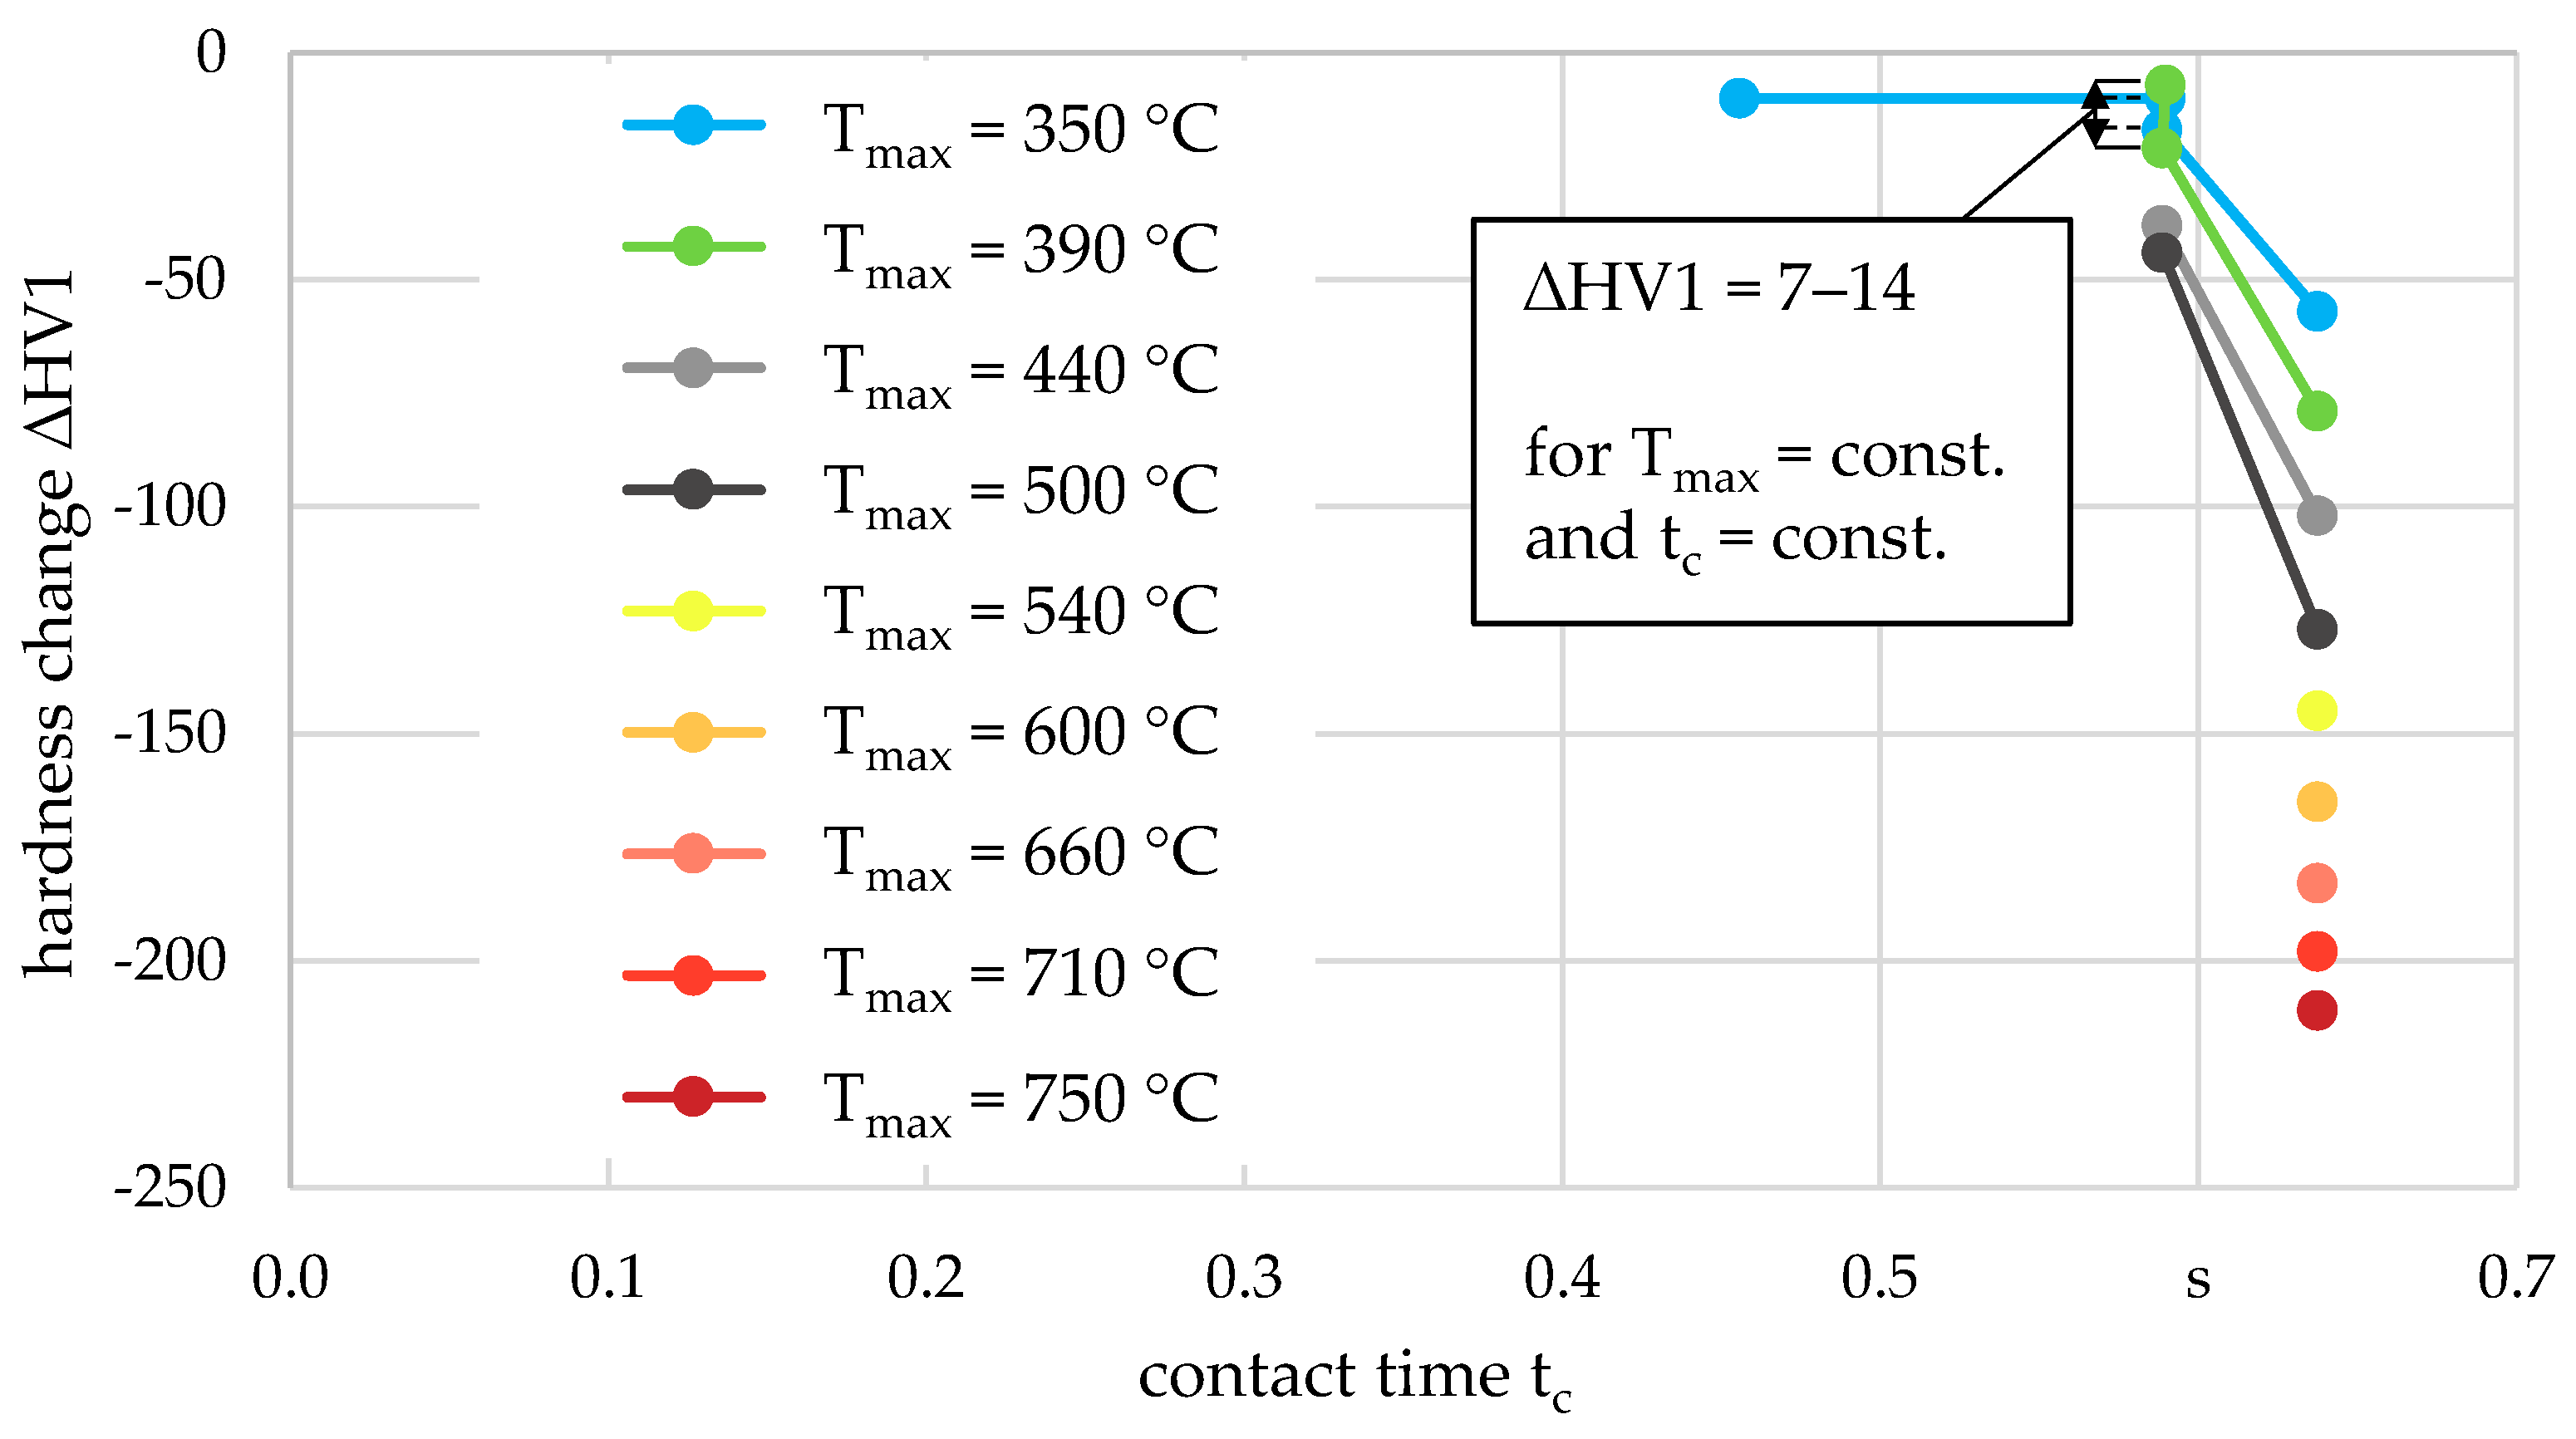
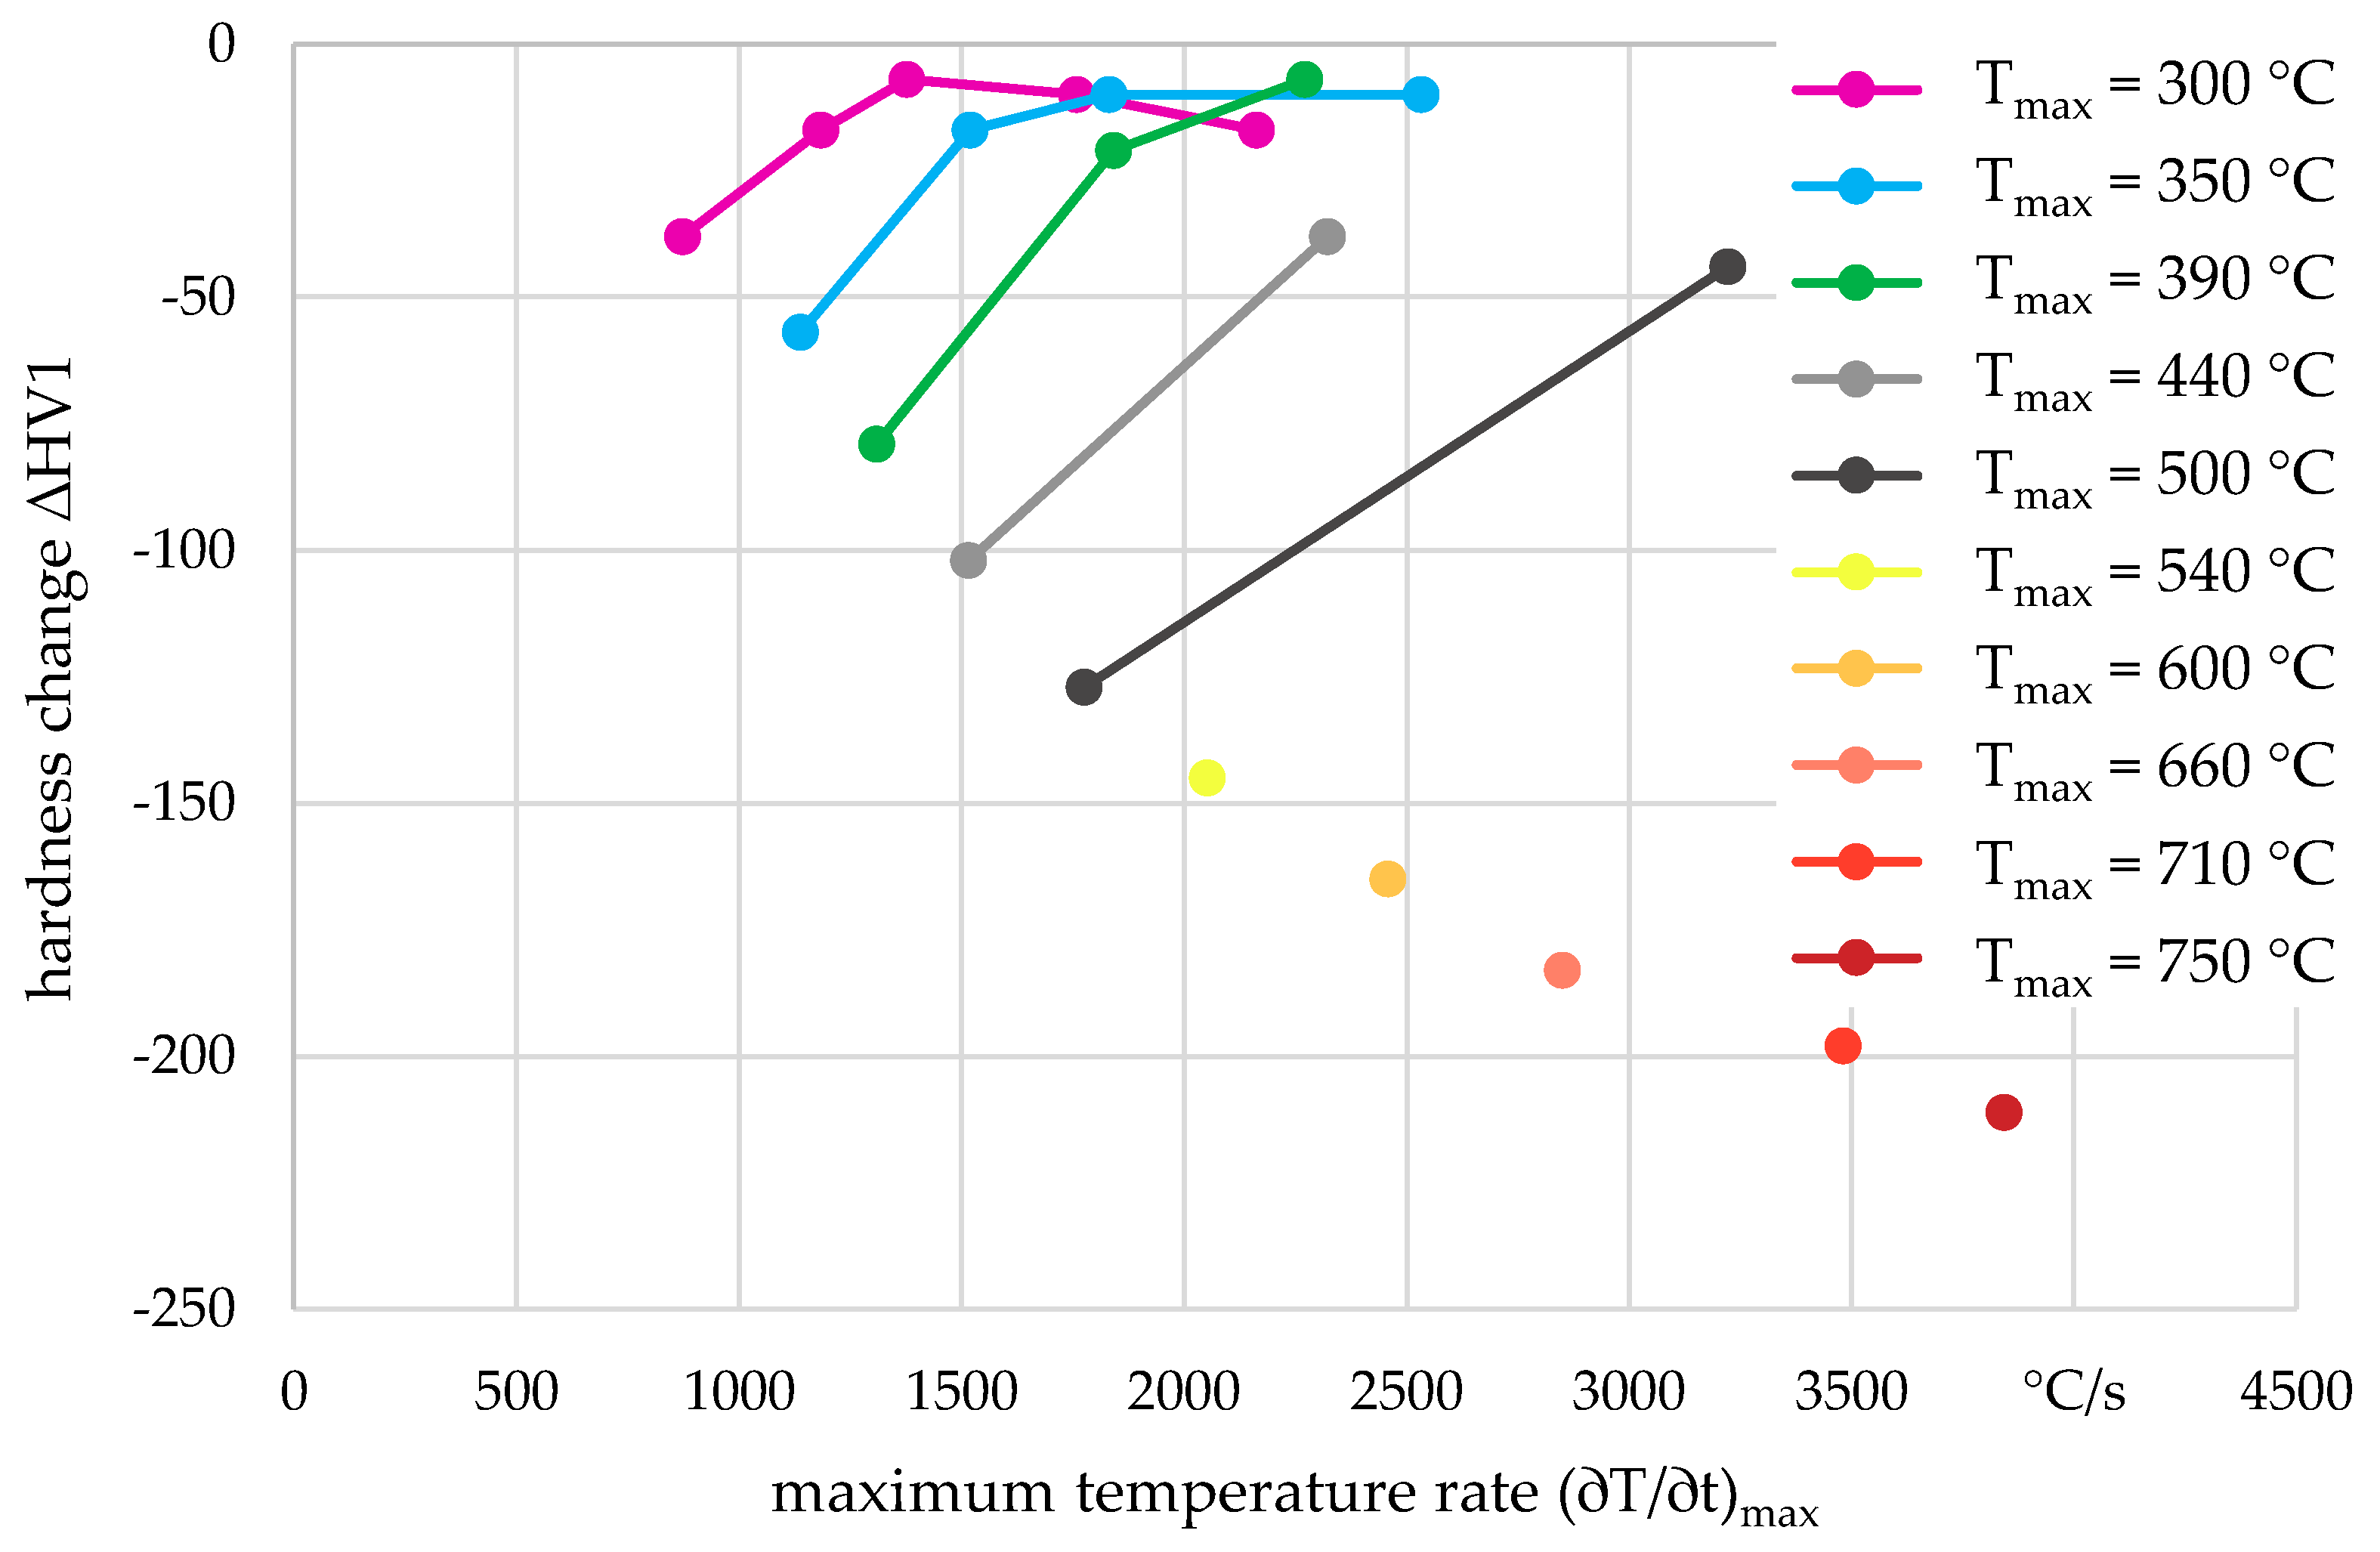
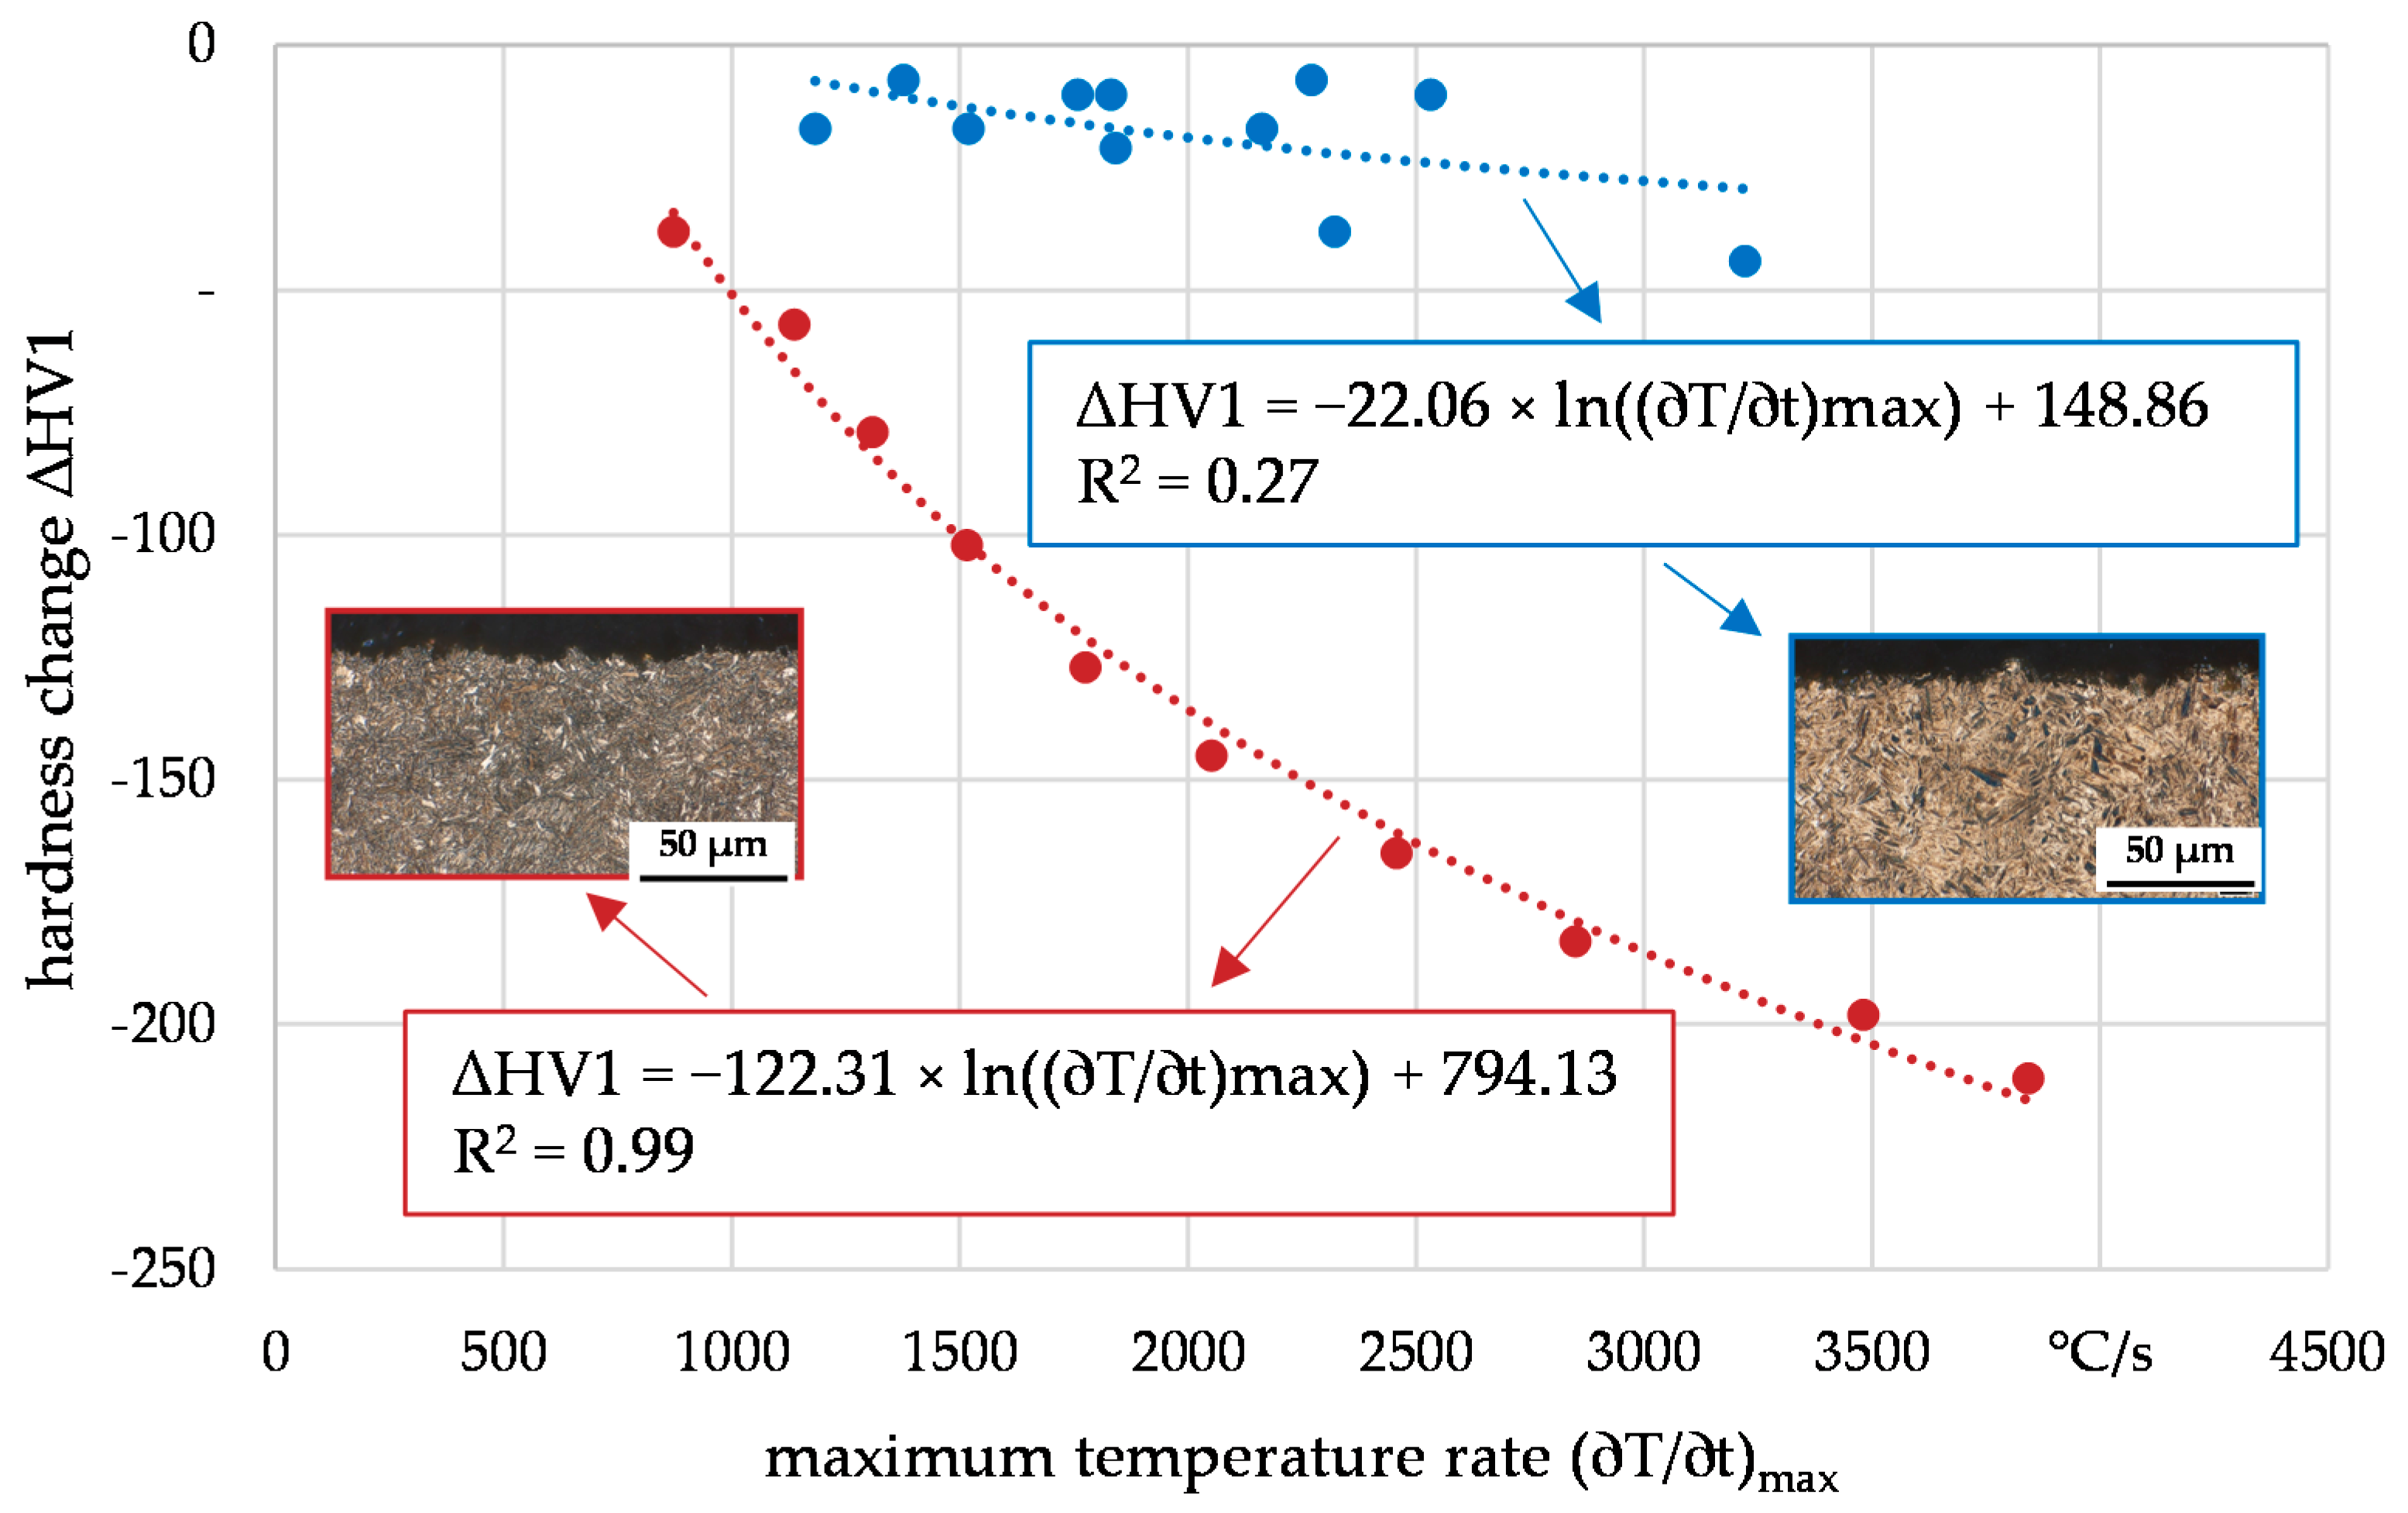
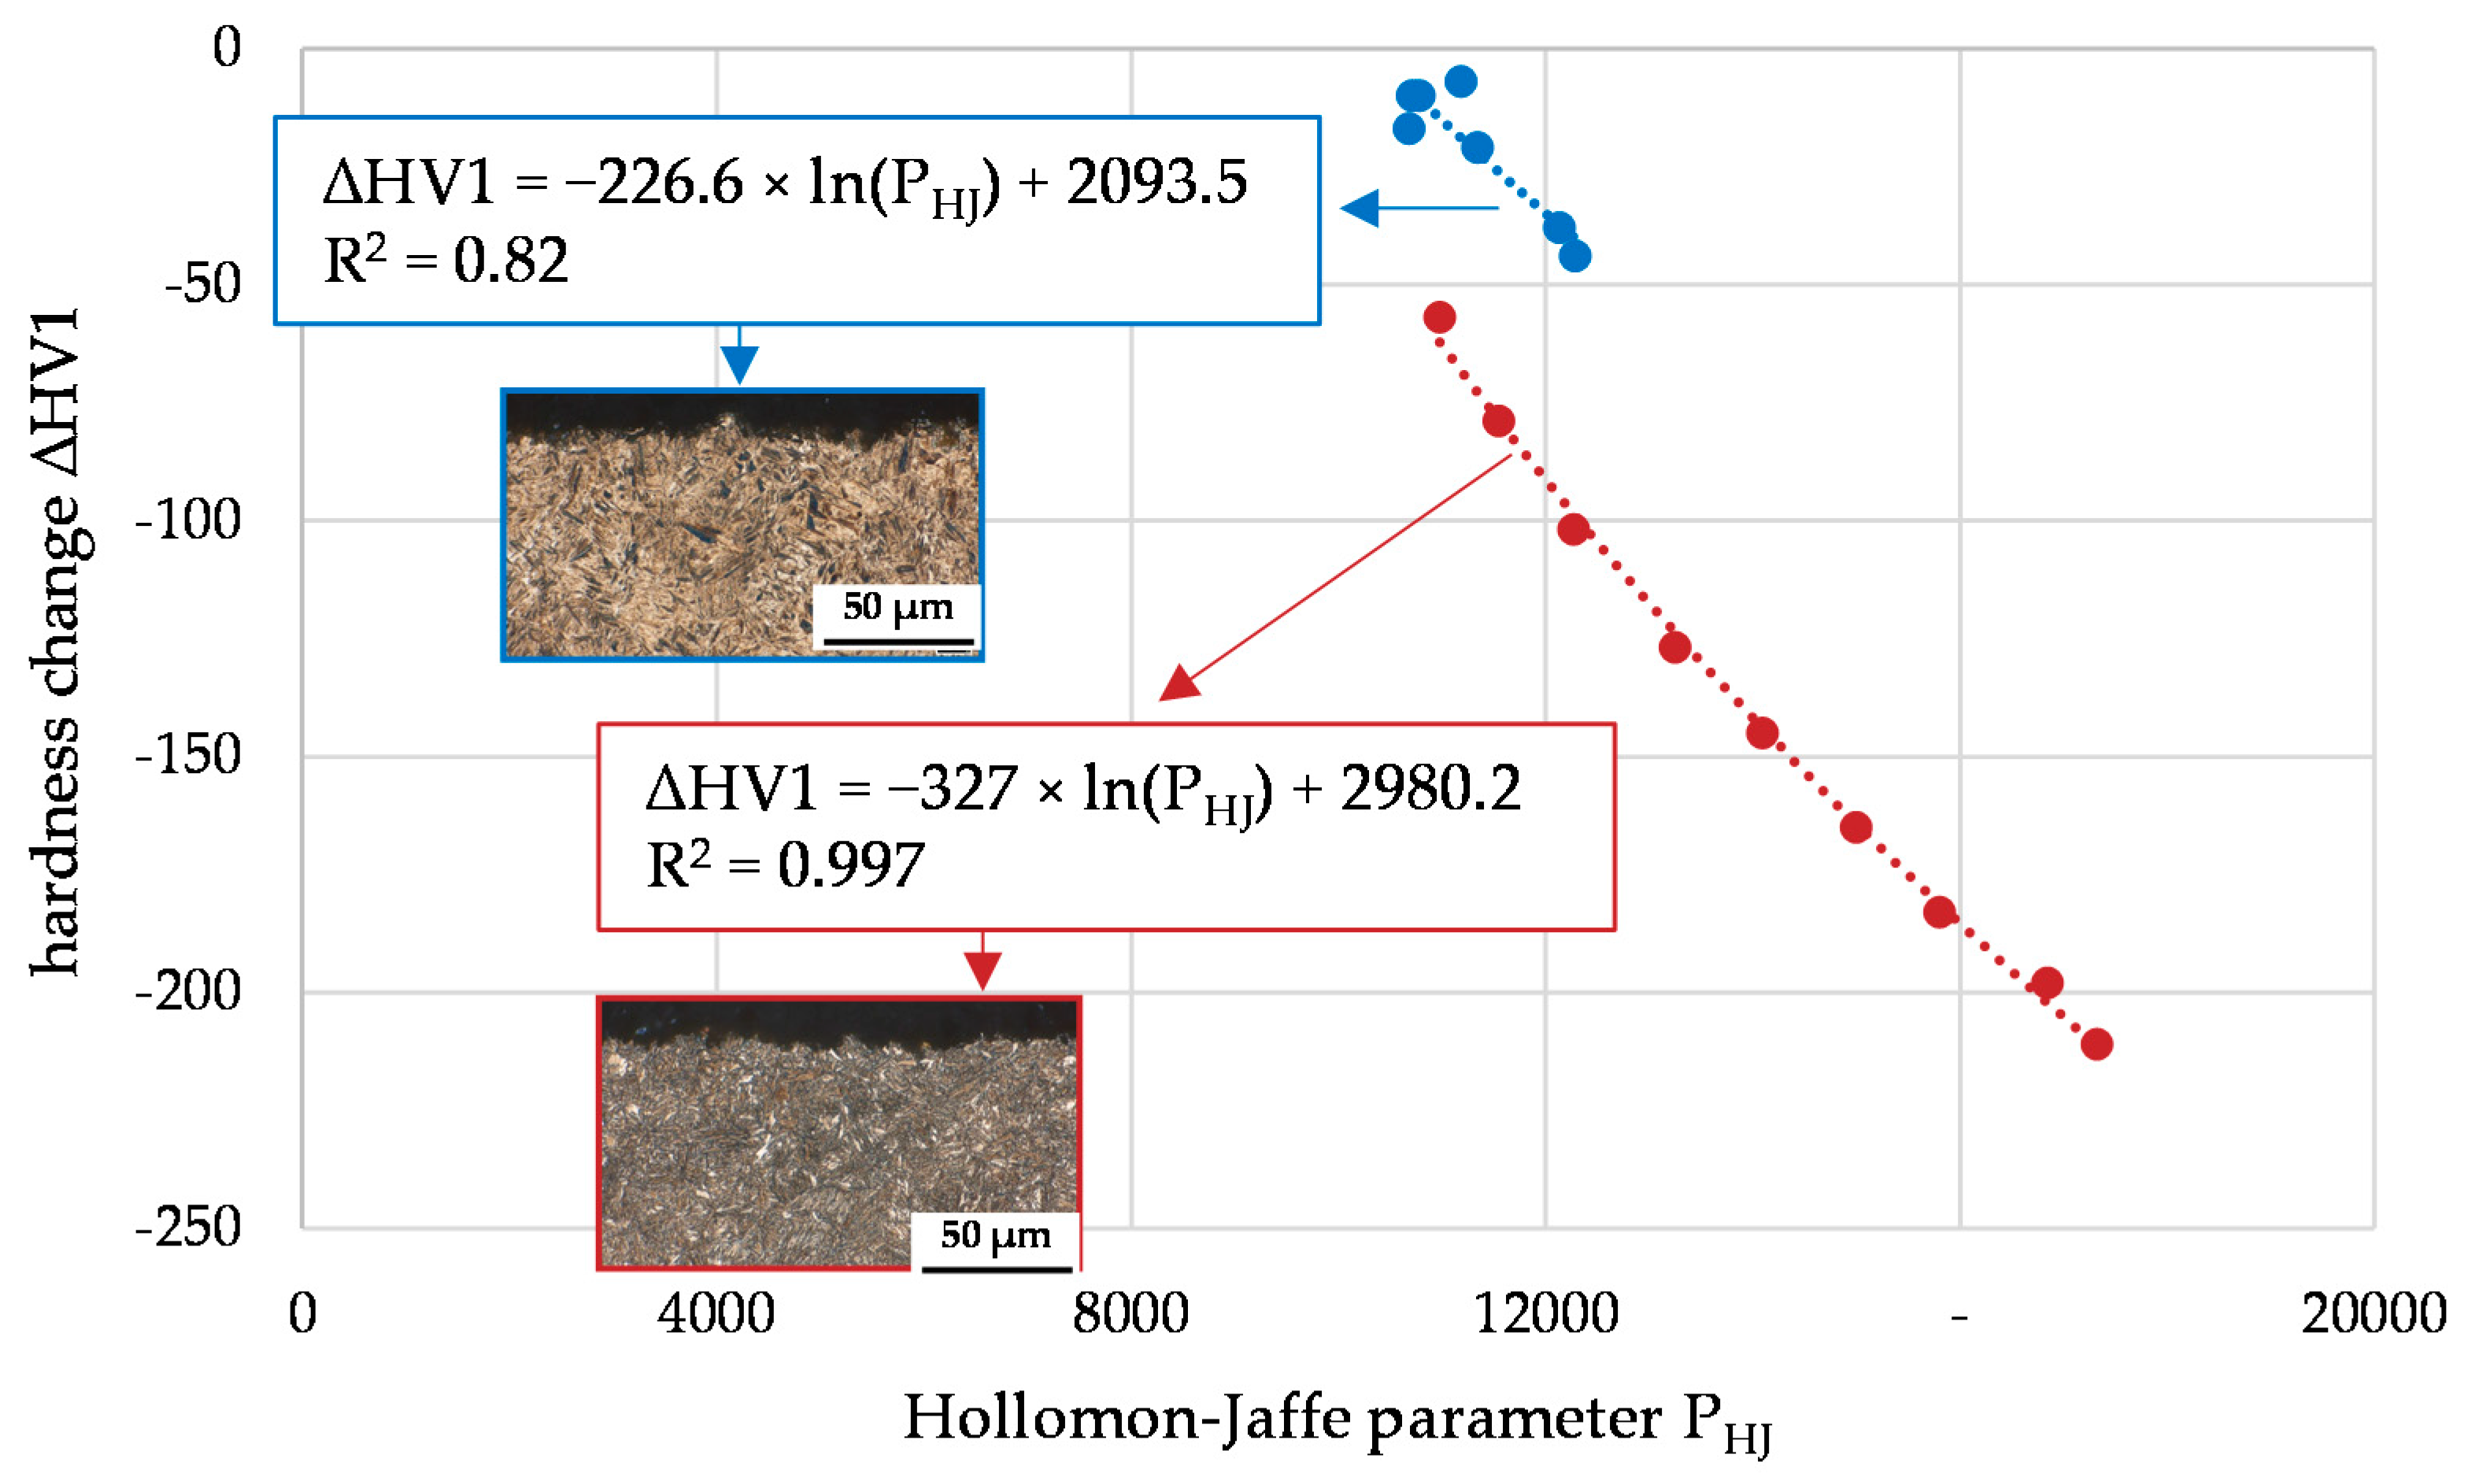
4.1. Evaluation of Hardness Changes Due to Thermal Loads
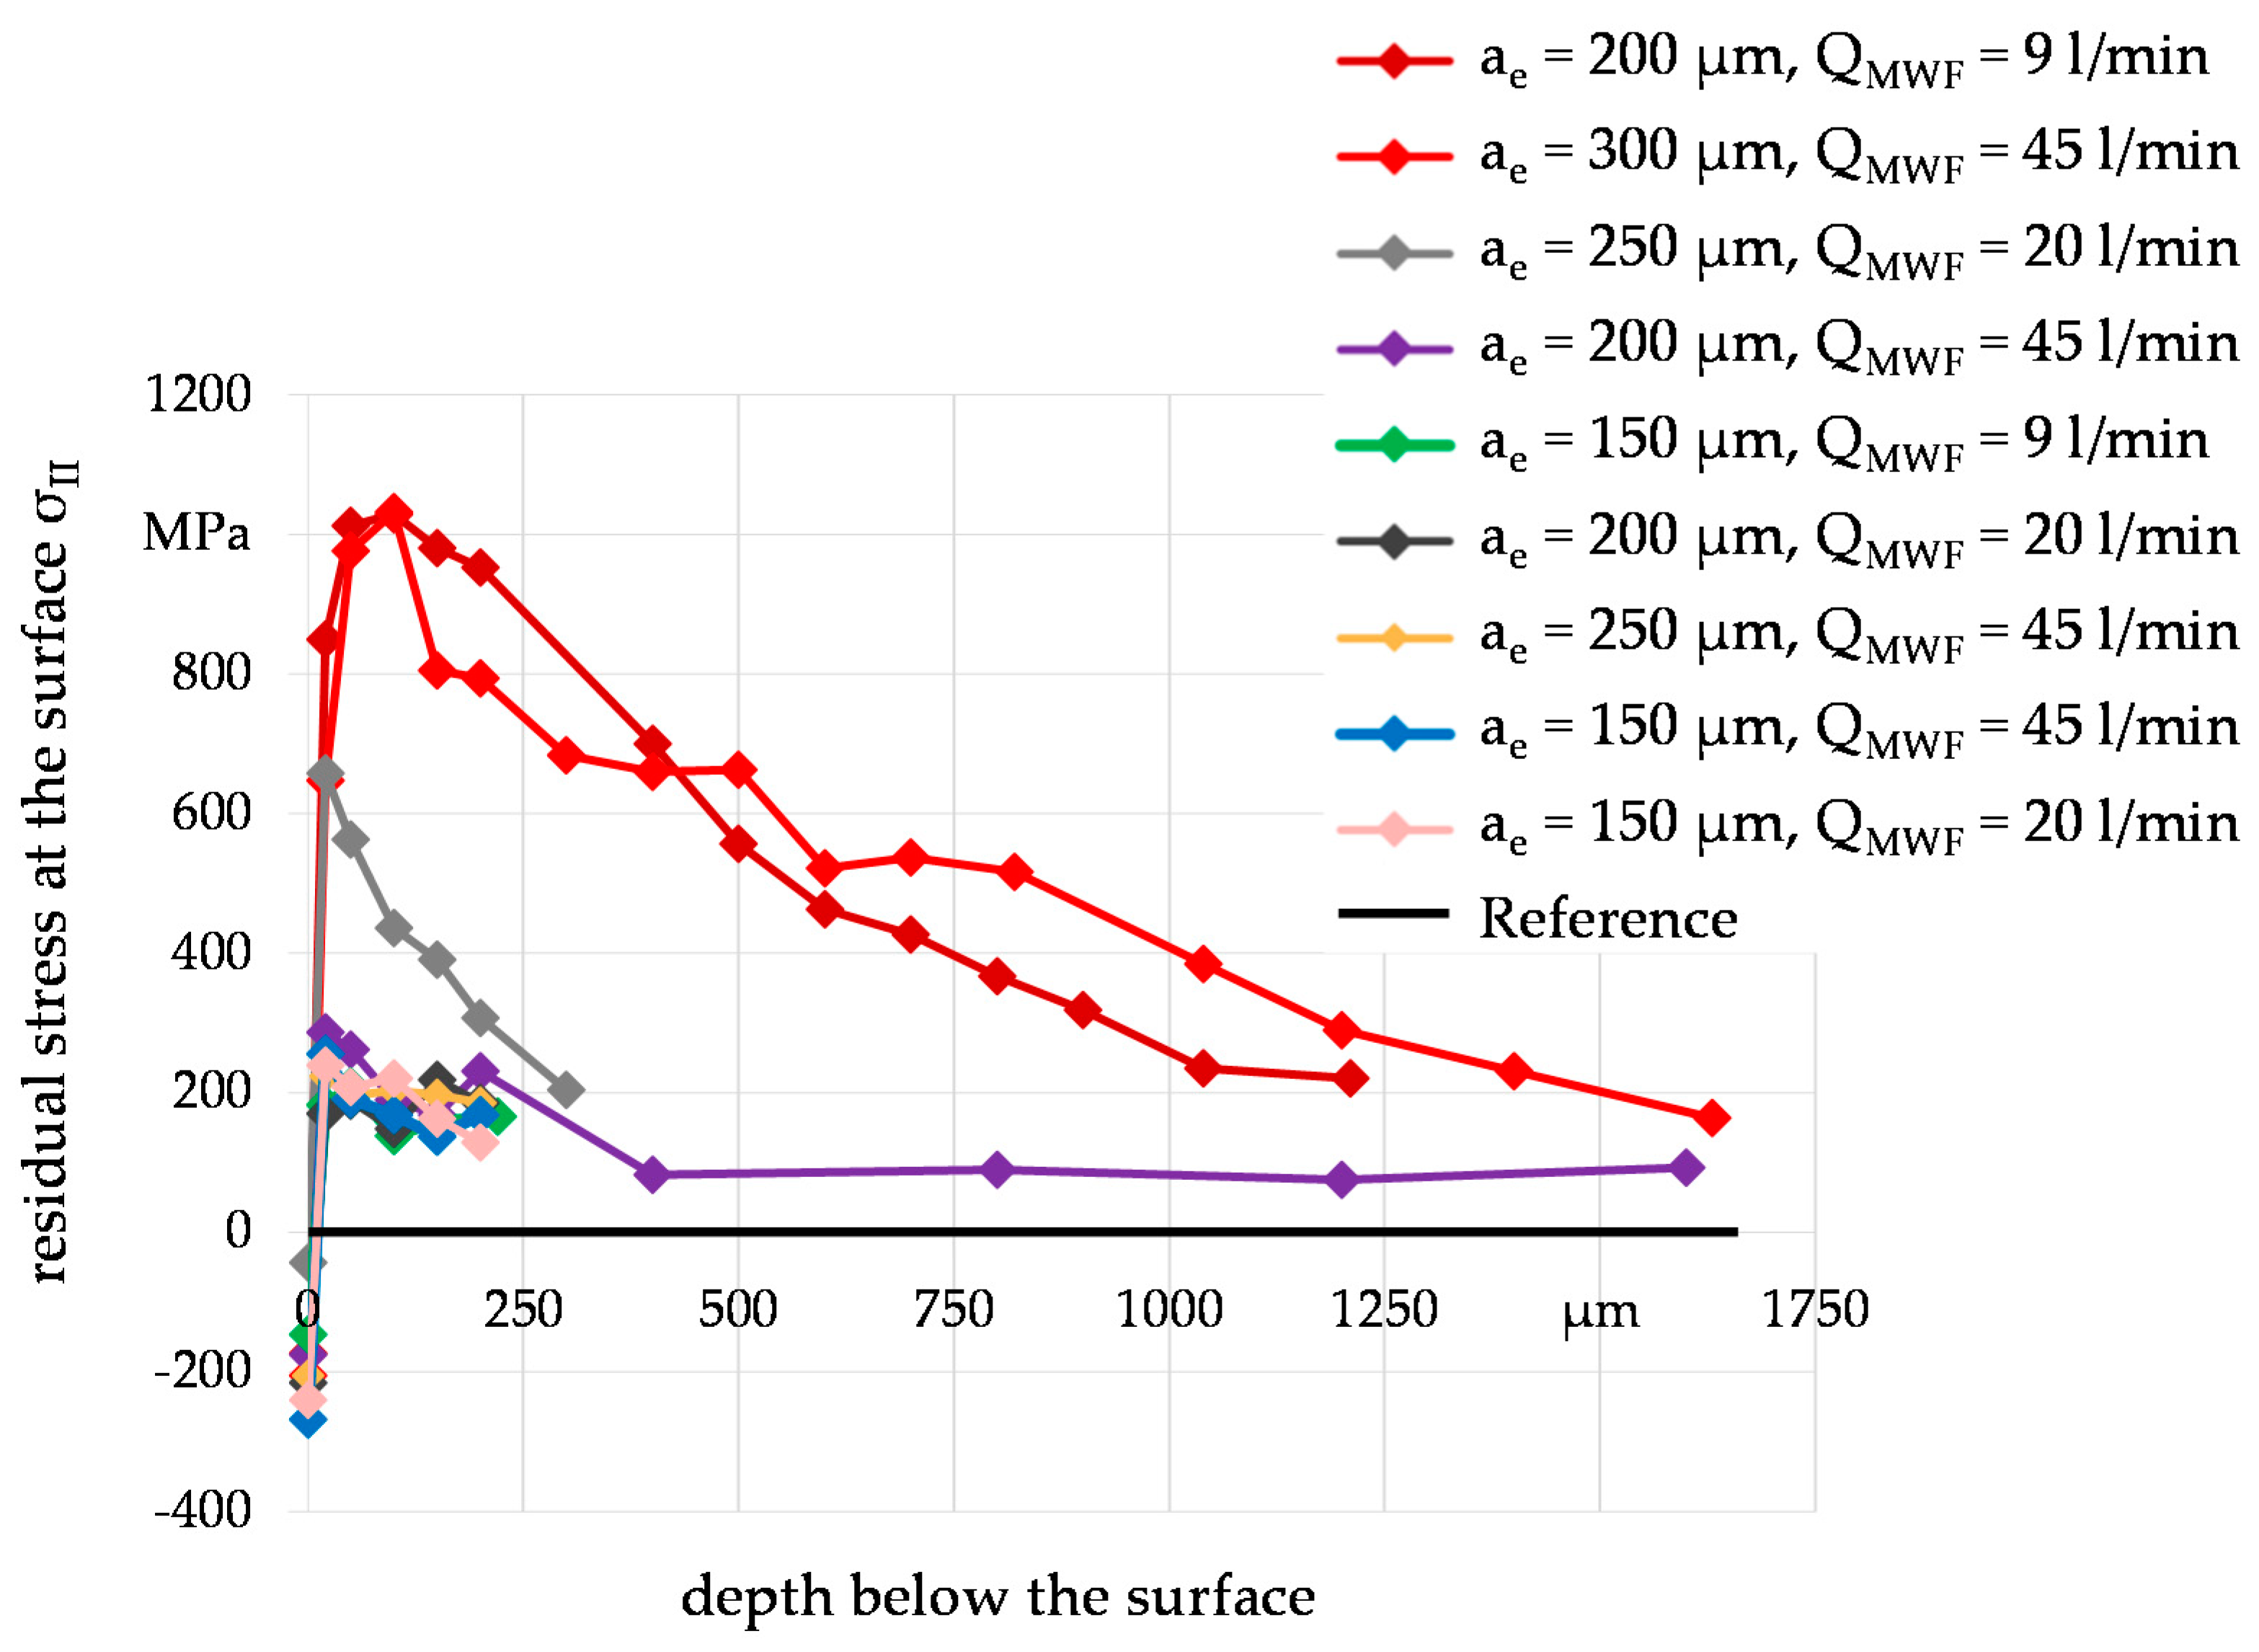
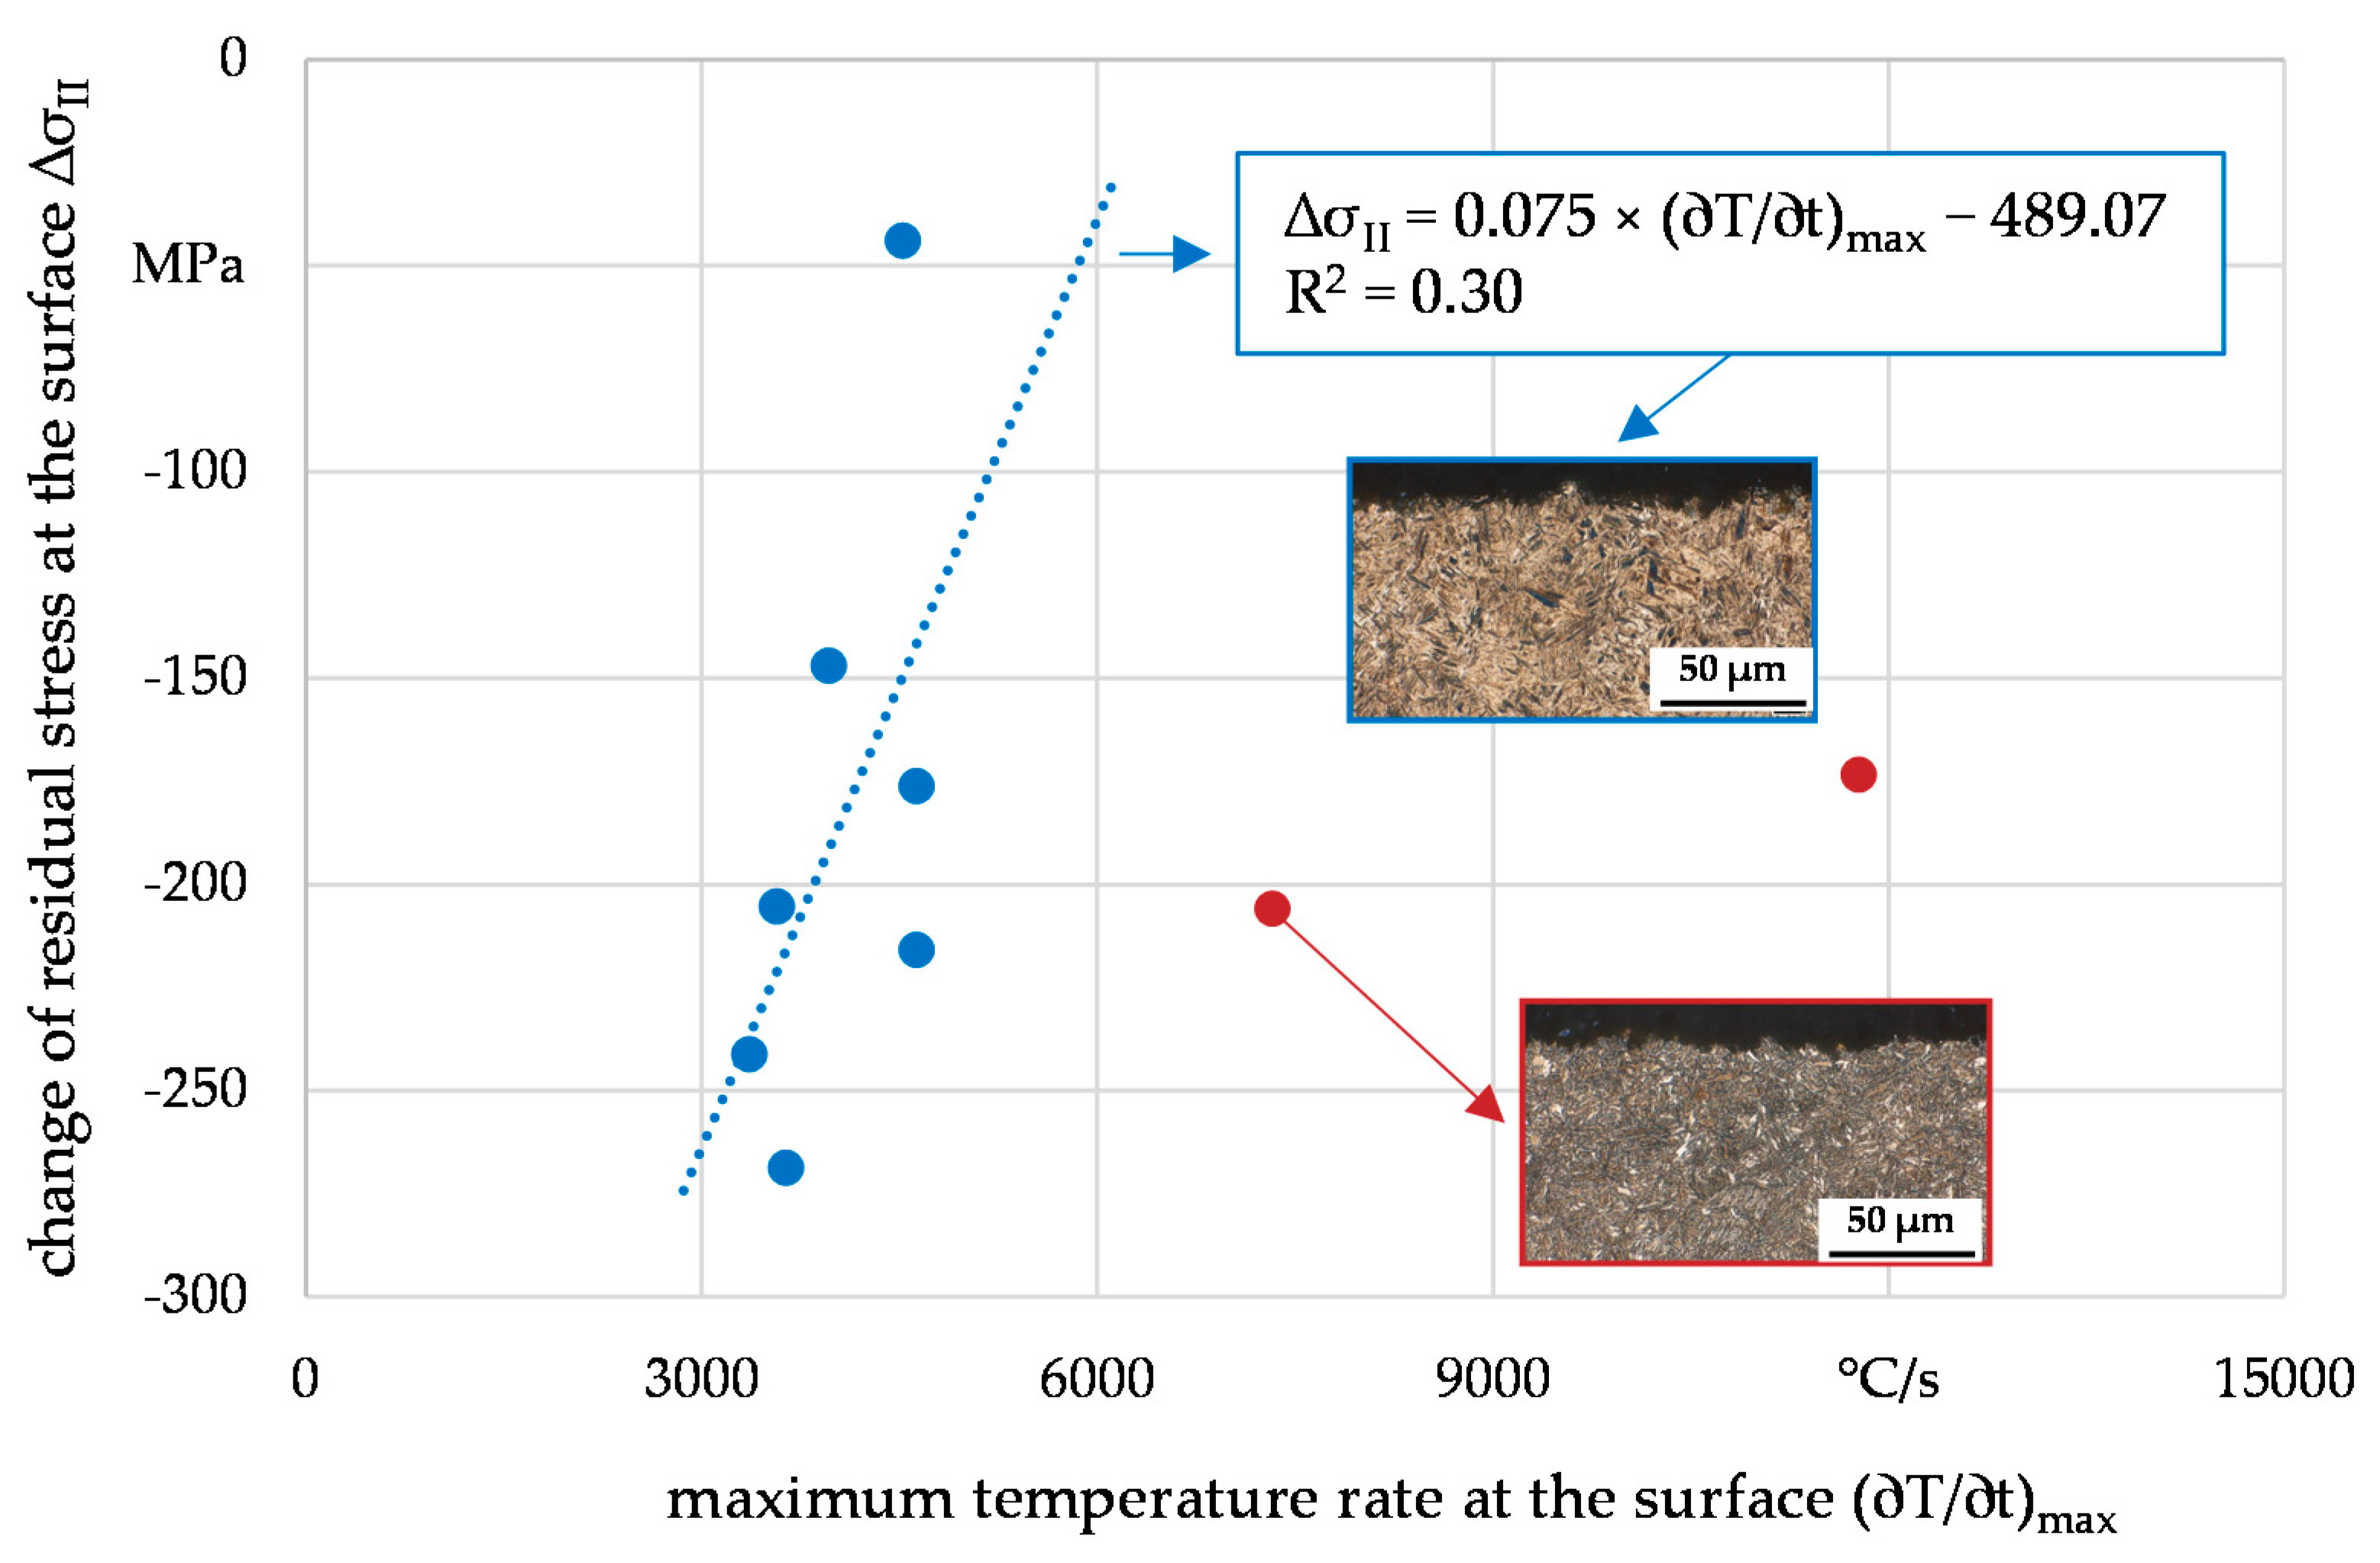
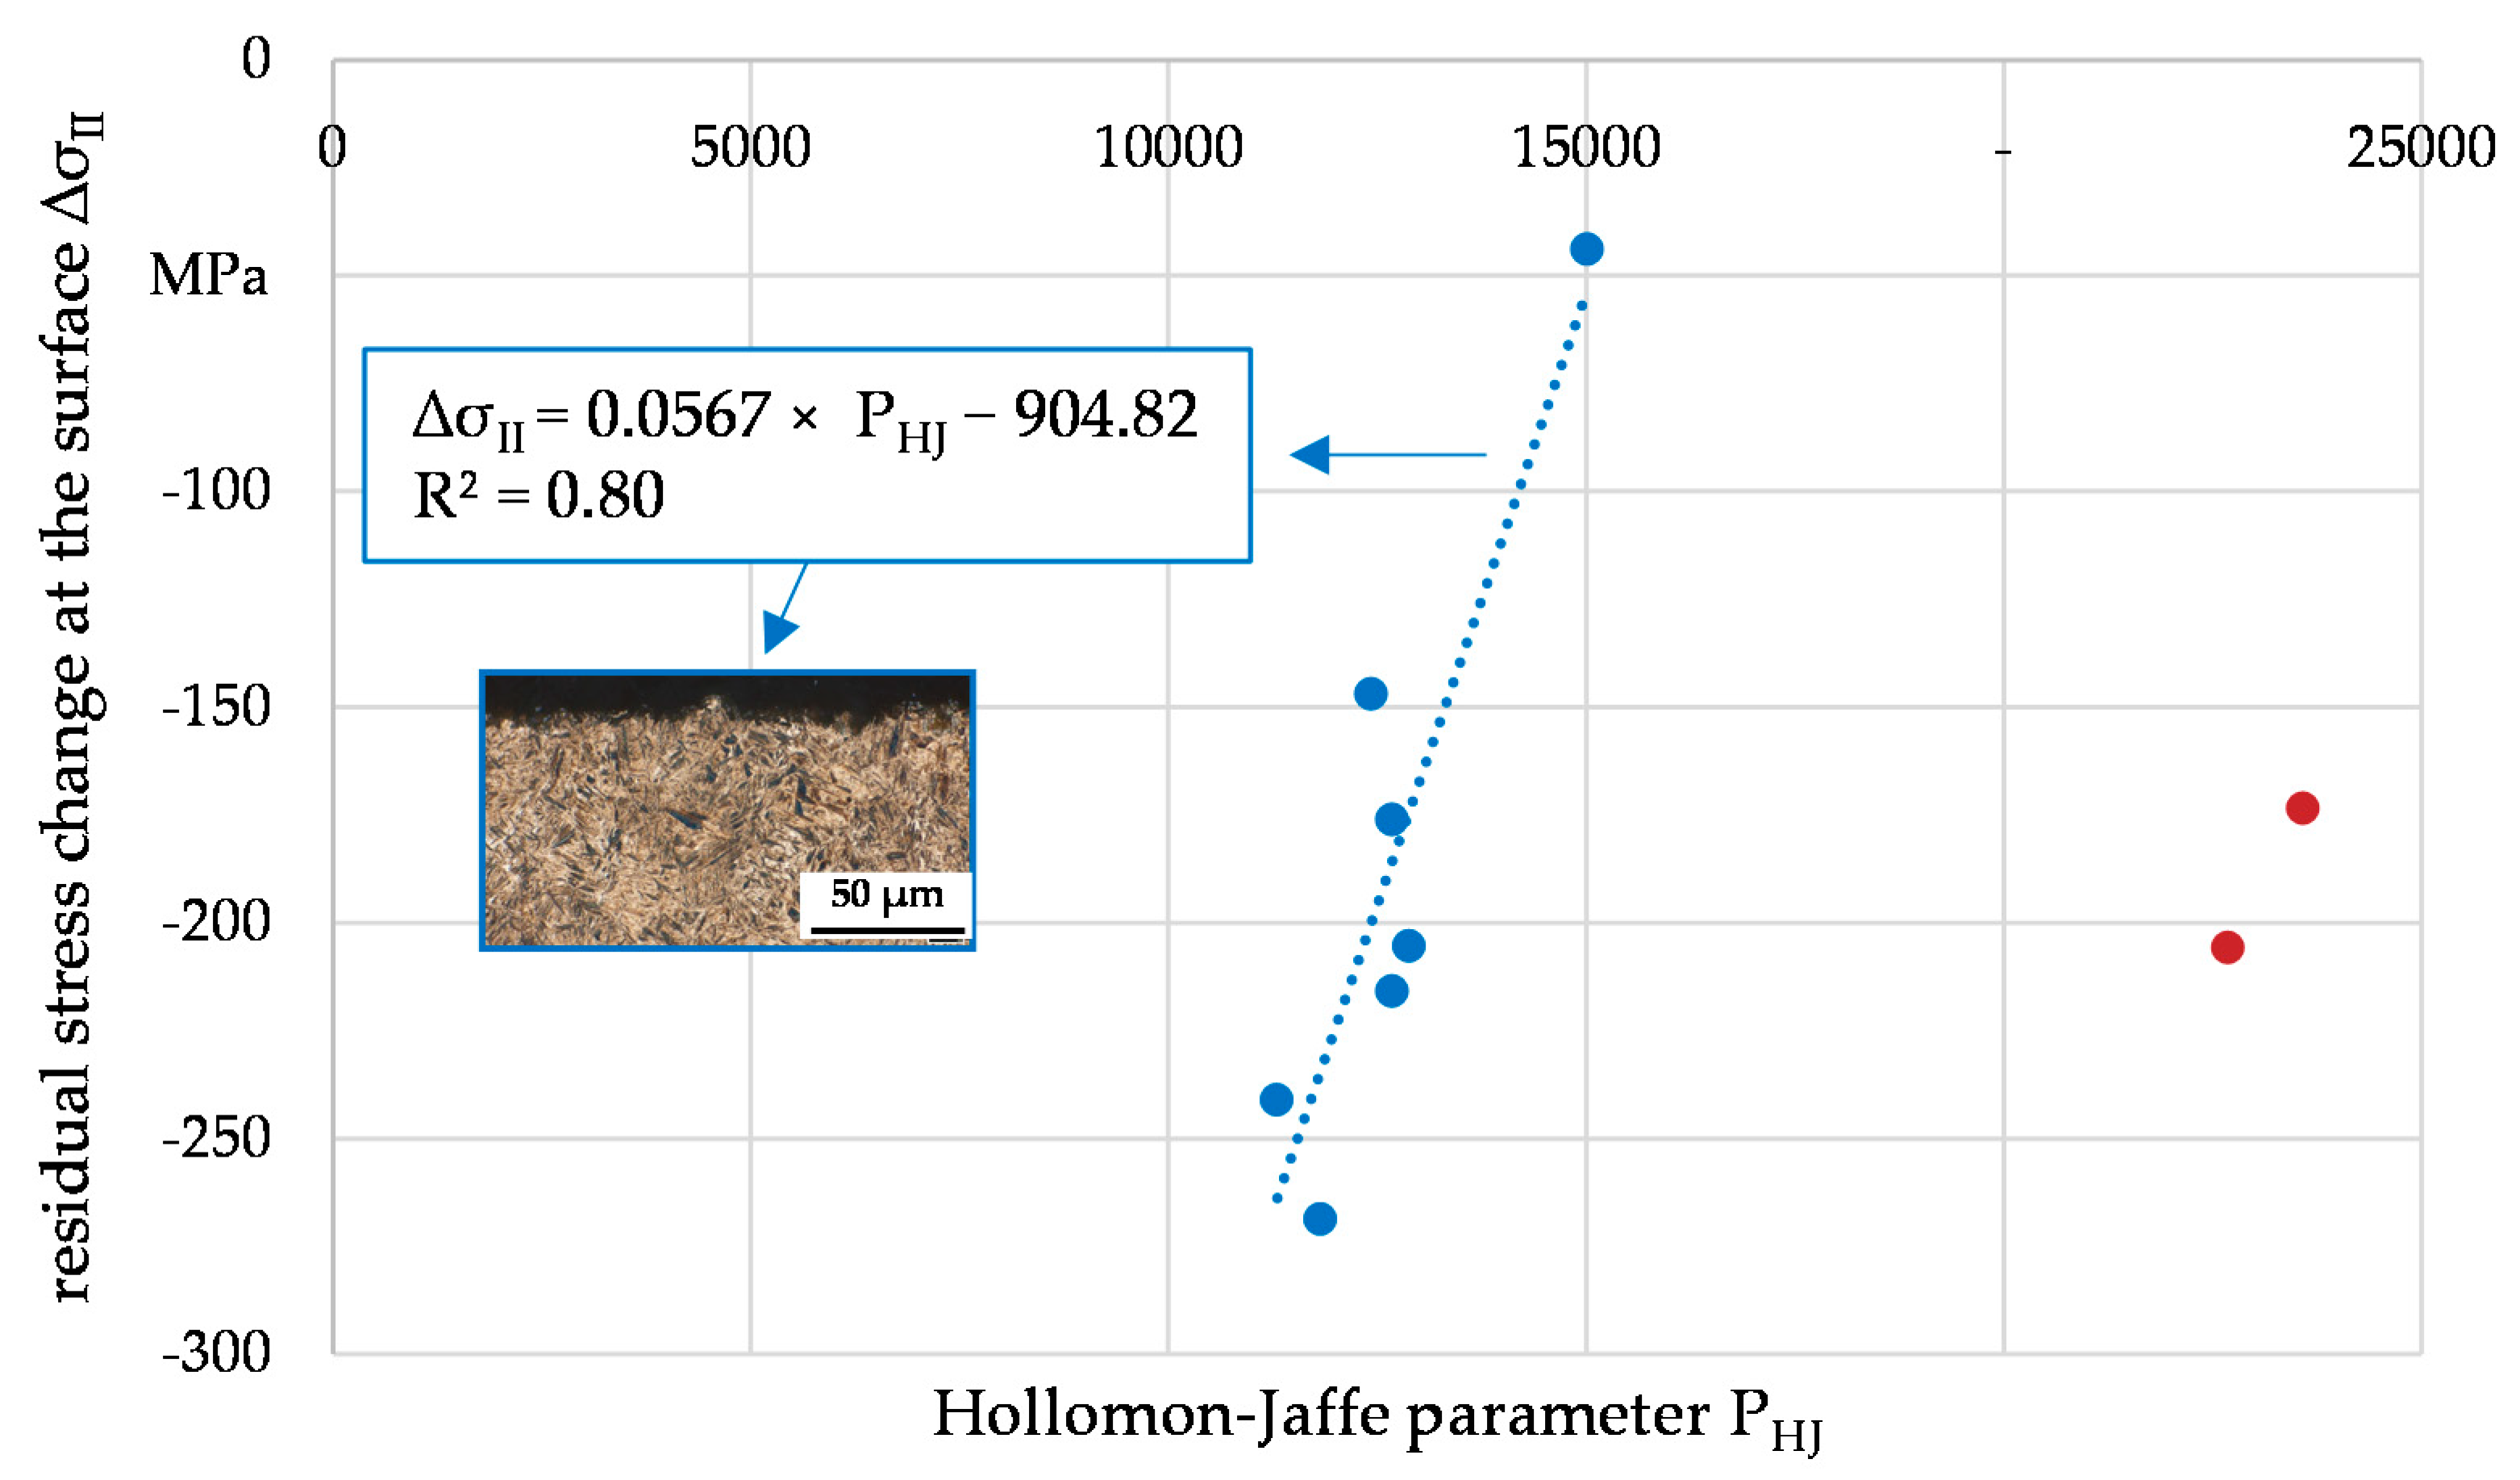
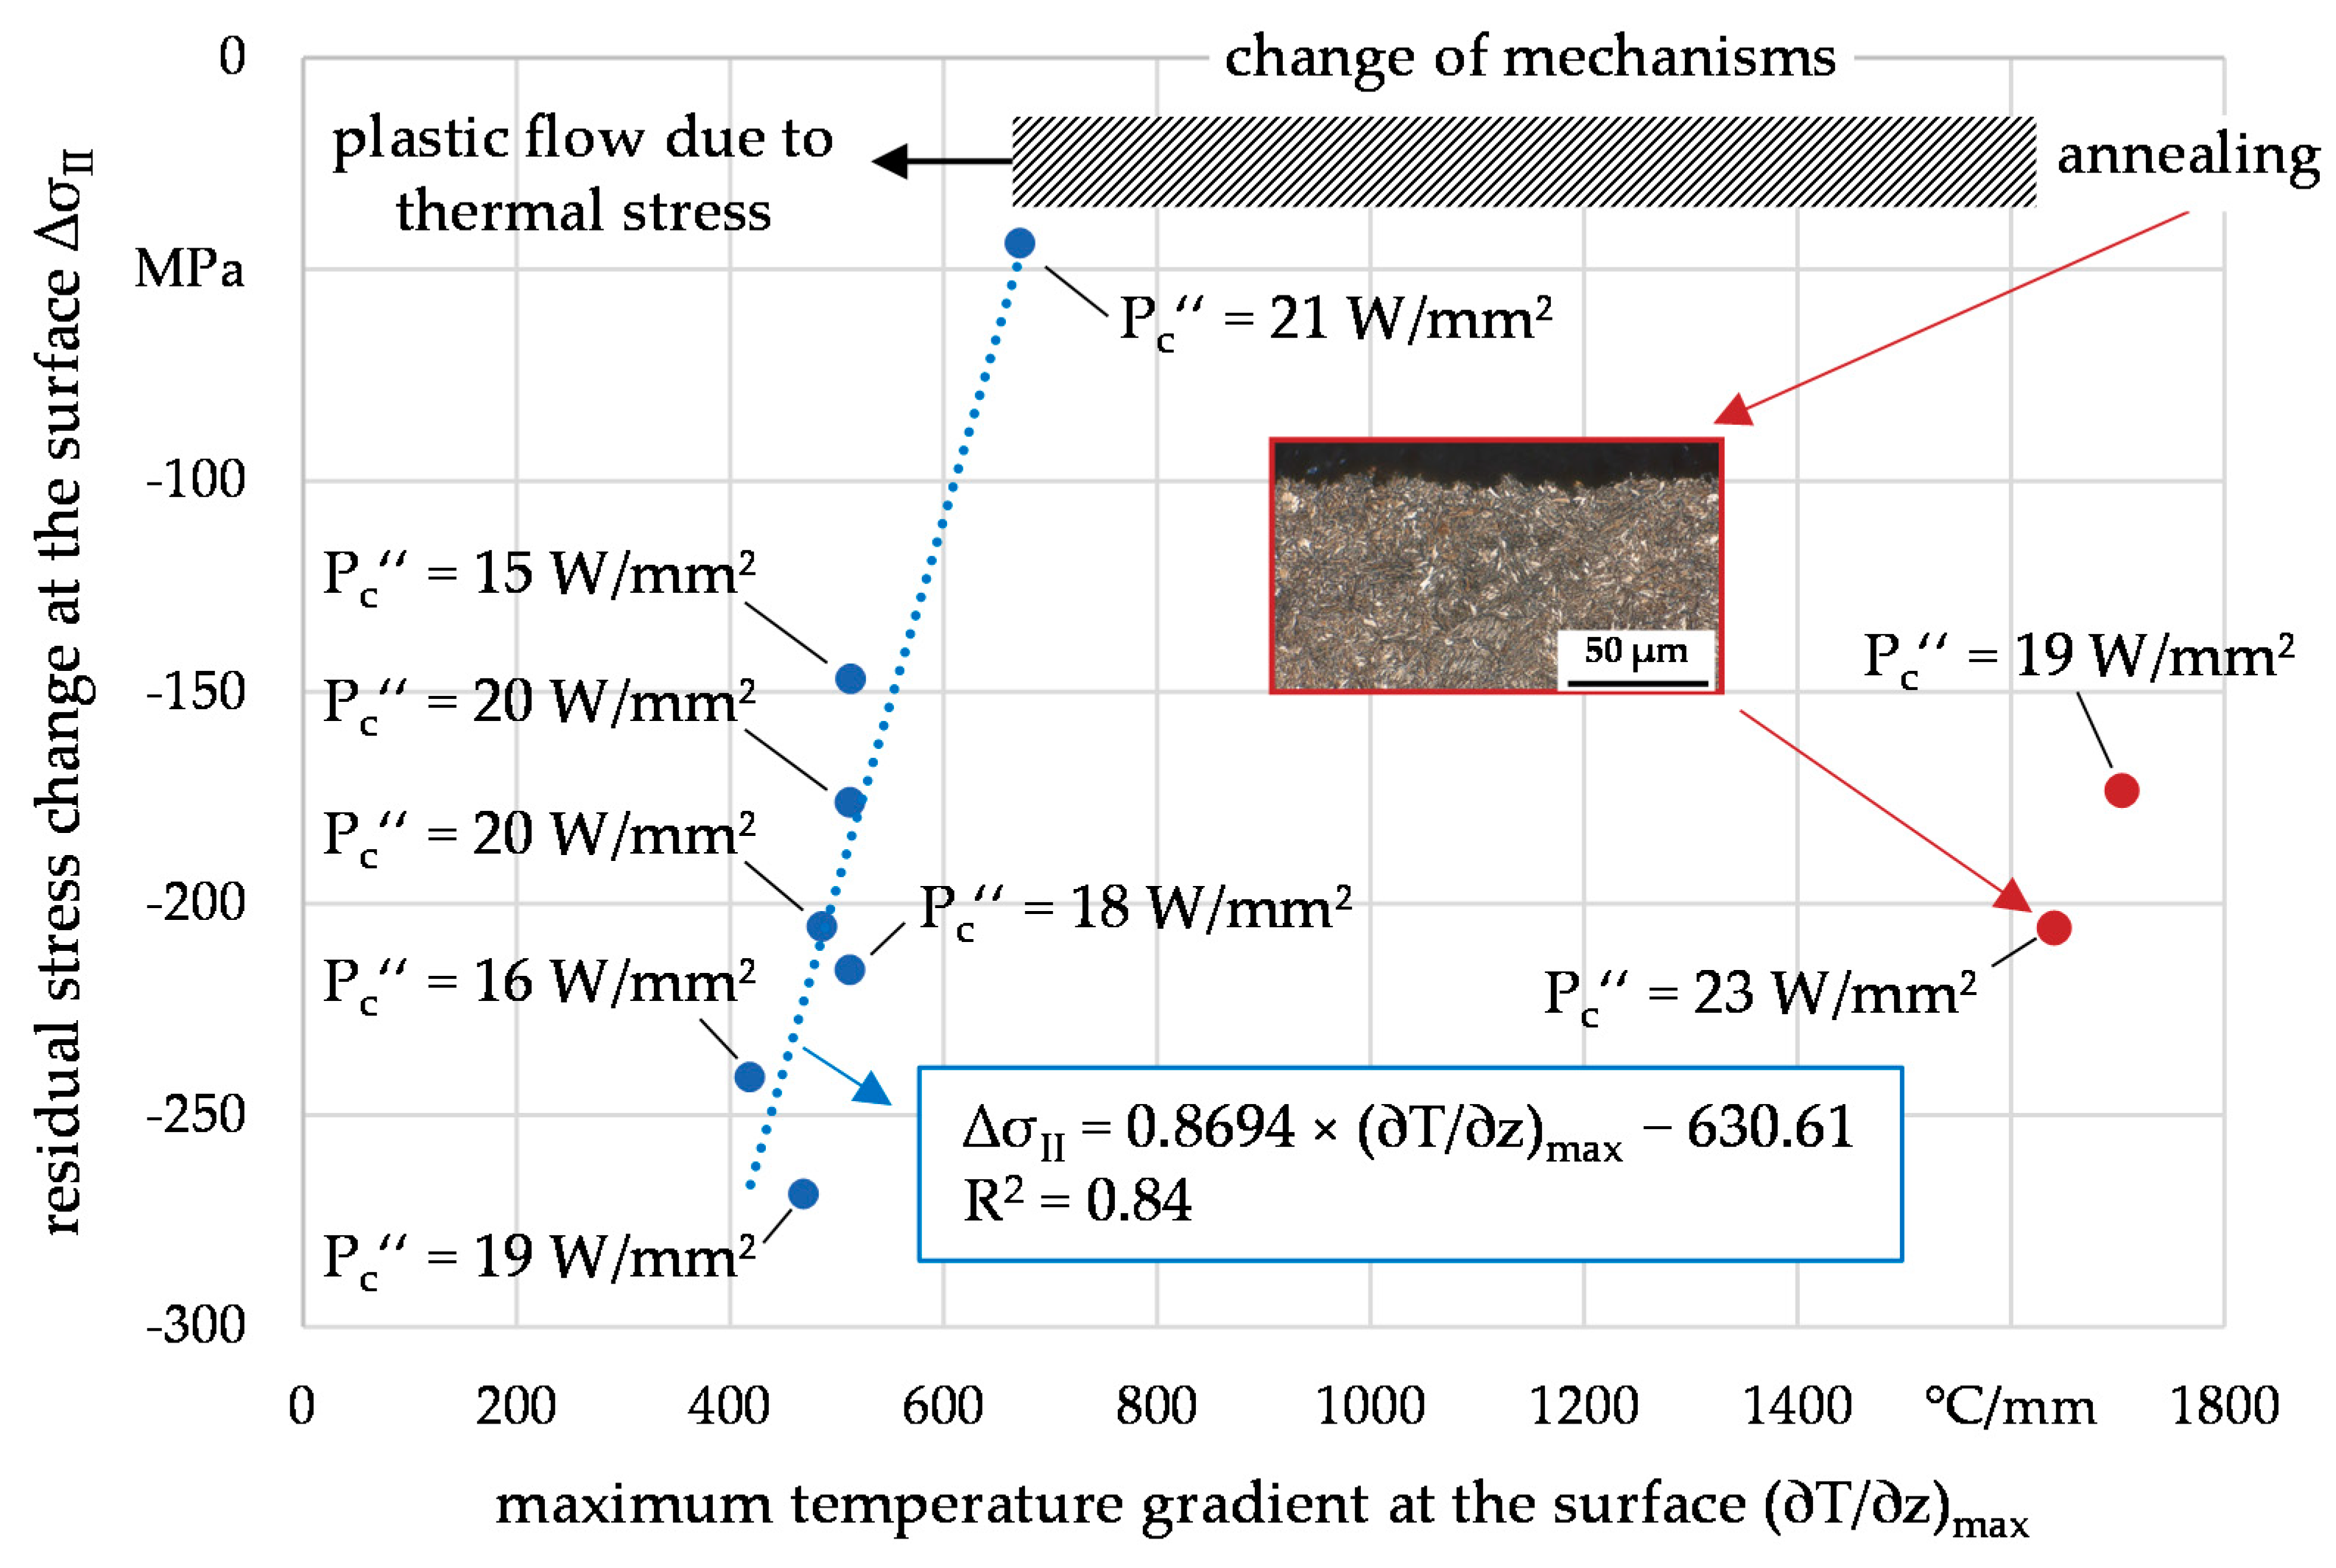
4.2. Evaluation of Residual Stress Changes Due to Thermal Loads
5. Conclusions
Author Contributions
Funding
Data Availability Statement
Acknowledgments
Conflicts of Interest
References
- Heinzel, C.; Bleil, N. The Use of the Size Effect in Grinding for Work-hardening. CIRP Ann. Manuf. Technol. 2007, 56, 327–330. [Google Scholar] [CrossRef]
- Gao, Y.-K.; Li, X.-B.; Yang, Q.-X.; Yao, M. Influence of surface integrity on fatigue strength of 40CrNi2Si2MoVA steel. Mater. Lett. 2007, 61, 466–469. [Google Scholar] [CrossRef]
- Uhlmann, E.; Lypovka, P.; Hochschild, L.; Schröer, N. Influence of rail grinding process parameters on rail surface roughness and surface layer hardness. Wear 2016, 366–367, 287–293. [Google Scholar] [CrossRef]
- Lin, B.; Zhou, K.; Guo, J.; Liu, Q.Y.; Wang, W.J. Influence of grinding parameters on surface temperature and burn behaviors of grinding rail. Tribol. Int. 2018, 122, 151–162. [Google Scholar] [CrossRef]
- Liu, W.; Deng, Z.; Shang, Y.; Wan, L. Effects of grinding parameters on surface quality in silicon nitride grinding. Ceram. Int. 2017, 43, 1571–1577. [Google Scholar] [CrossRef]
- Kirsch, B.; Aurich, J.C. Influence of the macro-topography of grinding wheels on the cooling efficiency and the surface integrity. CIRP CSI 2014, 13, 8–12. [Google Scholar] [CrossRef] [Green Version]
- Heinzel, C.; Meyer, D.; Kolkwitz, B.; Eckebrecht, J. Advanced approach for demand-oriented fluid supply in grinding. CIRP Ann. Manuf. Technol. 2015, 64, 333–336. [Google Scholar] [CrossRef] [Green Version]
- Rowe, W.B.; Morgan, M.N.; Blacks, S.C.E.; Mills, B. A simplified approach to Control of thermal damage in grinding. Ann. CIRP 1996, 45, 299–302. [Google Scholar] [CrossRef]
- Jin, Z.; Stephenson, D. Heat flux distributions and convective heat transfer in deep grinding. Int. J. Mach. Tools Manuf. 2006, 46, 1862–1868. [Google Scholar] [CrossRef]
- Jamshidi, H.; Budak, E. Grinding Temperature Modelling based on a Time Dependent Heat Source. Procedia CIRP 2018, 77, 299–302. [Google Scholar] [CrossRef]
- Malkin, S.; Lenze, E. Burning limit for surface and cylindrical grinding of steels. Ann. CIRP 1978, 27, 233–236. [Google Scholar]
- Heinzel, C.; Heinzel, J.; Guba, N.; Hüsemann, T. Comprehensive analysis of the thermal impact and its depth effect in grinding. CIRP Ann. Manuf. Technol. 2021, 1. [Google Scholar] [CrossRef]
- Baumgart, C.; Heizer, V.; Wegener, K. In-process Workpiece based Temperature Measurement in Cylindrical Grinding. Procedia CIRP 2018, 77, 42–45. [Google Scholar] [CrossRef]
- Balart, M.J.; Bouzina, A.; Edwards, L.; Fitzpatrick, M.E. The onset of tensile residual stresses in grinding of hardened steels. Mater. Sci. Eng. 2004, 367, 132–142. [Google Scholar] [CrossRef]
- Brinksmeier, E. Prozeß- und Werkstückqualität in der Feinbearbeitung. Habilitation Thesis, University Hannover, Hannover, Germany, 1991. [Google Scholar]
- Malkin, S.; Guo, C. Thermal Analysis of Grinding. CIRP Ann. Manuf. Technol. 2007, 56, 760–782. [Google Scholar] [CrossRef]
- Heinzel, C.; Sölter, J.; Kolkwitz, B.; Brinksmeier, E. A versatile method to determine thermal limits in grinding. Procedia CIRP 2014, 13, 429–434. [Google Scholar] [CrossRef] [Green Version]
- Jermolajev, S.; Heinzel, C.; Brinksmeier, E. Experimental and analytical investigation of workpiece thermal load during external cylindrical grinding. Procedia CIRP 2015, 42, 465–470. [Google Scholar] [CrossRef] [Green Version]
- Holtermann, R.; Schumann, S.; Zabel, A.; Biermann, D.; Menzel, A. Numerical Determination of Process Values Influencing the Surface Integrity in Grinding. CIRP CSI 2016, 45, 39–42. [Google Scholar] [CrossRef] [Green Version]
- Pashnyov, V.A.; Pimenov, D.Y. Stress Analysis of a Three-Layer Metal Composite System of Bearing Assemblies during Grinding. Mech. Compos. Mater. 2015, 51, 77–92. [Google Scholar] [CrossRef]
- Pashnyov, V.A.; Pimenov, D.Y.; Erdakov, I.N.; Koltsova, M.S.; Mikolajczyk, T.; Patra, K. Modeling and analysis of temperature distribution in the multilayer metal composite structures in grinding. Int. J. Adv. Manuf. Technol. 2017, 91, 4055–4068. [Google Scholar] [CrossRef] [Green Version]
- Jawahir, I.S.; Brinksmeier, E.; M’Saoubi, R.; Aspinwall, D.K.; Outeiro, J.C.; Meyer, D.; Umbrello, D.; Jayal, A.D. Surface integrity in material removal processes: Recent advances. CIRP Ann. Manuf. Technnol. 2011, 60, 603–626. [Google Scholar] [CrossRef]
- Brinksmeier, E.; Klocke, F.; Lucca, D.A.; Sölter, J.; Meyer, D. Process Signatures—A new Approach to Solve the Inverse Surface Integrity Problem in Machining Processes. Procedia CIRP 2014, 13, 429–434. [Google Scholar] [CrossRef] [Green Version]
- Frerichs, F.; Sölter, J.; Lübben, T.; Brinksmeier, E.; Zoch, H.-W. A Simulation Based Development of Process Signatures for Manufacturing Processes with Thermal Loads. Procedia CIRP 2016, 45, 327–330. [Google Scholar] [CrossRef] [Green Version]
- Kaiser, D.; de Graaf, B.; Dietrich, S.; Schulze, V. Investigation of the precipitation kinetics and microstructure evolution of martensitic AISI 4140 steel during tempering with high heating rates. Metall. Res. Technol. 2018, 115, 404. [Google Scholar] [CrossRef]
- Frerichs, F.; Lübben, T. Influence of Initial Microstructure on Manufacturing Processes with Thermal Loads accompanied by Hardening. Procedia CIRP 2020, 87, 521–526. [Google Scholar] [CrossRef]
- Richter, F. Physikalische Eigenschaften von Staehlen und ihre Temperaturabhaengigkeit; Stahleisen Sonderberichte: Duesseldorf, Germany, 1983. [Google Scholar]
- Brinksmeier, E.; Aurich, J.; Govekar, E.; Heinzel, C.; Hoffmeister, H.; Klocke, F.; Peters, J.; Rentsch, R.; Stephenson, S.; Uhlmann, E.; et al. Advances in Modelling and Simulation of Grinding Processes. Ann. CIRP 2006, 55, 667–696. [Google Scholar] [CrossRef]
- Heinzel, C. Schleifprozesse Verstehen—Zum Stand der Modellbildung und Simulation Sowie Unterstützender Experimenteller Methoden. Habilitation Thesis, Universität of Bremen, Bremen, Germany, 2009. [Google Scholar]
- Takazawa, K. Effects of grinding variables on surface structure of hardened steel. Bull. Jpn. Soc. Grind. Eng. 1966, 2, 14–21. [Google Scholar]
- Hollomon, J.H.; Jaffe, L.D. Time-temperature relations in tempering steel. Trans. AIME 1945, 162, 223–249. [Google Scholar]
- Jermolajev, S.; Brinksmeier, E.; Heinzel, C. Surface layer modification charts for gear grinding. Ann. Cirp 2018, 67, 333–336. [Google Scholar] [CrossRef]
- Gomes, C.; Kaiser, A.-L.; Bas, J.-P.; Aissaoui, A.; Piette, M. Predicting the mechanical properties of a quenched and tempered steel thanks to a “tempering parameter”. Rev. Metall. 2010, 107, 293–302. [Google Scholar] [CrossRef]
- Frerichs, F.; Lübben, T. Development of Process Signatures for Manufacturing Processes with Thermal Loads without and with hardening. CIRP CSI 2018, 71, 418–423. [Google Scholar] [CrossRef]


| Symbol | Description | Unit |
|---|---|---|
| heat flux density | W/mm2 | |
| ∂T/∂t | temperature rate | °C/s |
| ae | depth of cut | µm |
| aed | depth of cut (dressing) | µm |
| bs | grinding wheel width | mm |
| ds | grinding wheel diameter | mm |
| dt | diameter thermocouple | mm |
| FEM | finite element method | - |
| hw | workpiece height | mm |
| lg | contact length | mm |
| lw | workpiece length | mm |
| mcs | metallographic cross-sections | - |
| MWF | metalworking fluid | - |
| Pc″ | specific grinding power | W/mm2 |
| PHJ | Hollomon–Jaffe parameter | - |
| QMWF | flow rate of the fluid | L/min |
| R2 | coefficient of determination | - |
| rs | residual stress | MPa |
| T | temperature | °C |
| t | time | s |
| t0.9 | response time (thermocouple) | s |
| tc | contact time | s |
| Ud | overlapping ratio | - |
| vft | tangential feed speed | m/min |
| vh | Vickers hardness | HV1 |
| vs | grinding wheel speed | m/s |
| vsd | grinding wheel speed (dressing) | m/s |
| wv | workpiece width | mm |
| z | depth below surface | mm |
| α | heat transfer coefficient | W/(m2·K) |
| σ | residual stress | MPa |
| AISI 4140 Chemical Composition (%) | |||||||
|---|---|---|---|---|---|---|---|
| C | Si | Mn | P | S | Cr | Mo | Ni |
| 0.448 | 0.264 | 0.735 | 0.012 | 0.002 | 1.09 | 0.244 | 0.2 |
| Thermophysical Properties | Temperature, °C | ||||||||||
|---|---|---|---|---|---|---|---|---|---|---|---|
| 0 | 20 | 100 | 200 | 300 | 400 | 500 | 600 | 700 | 800 | 900 | |
| Thermal conductivity λ, W/(m∙K) | 36.8 | 37.0 | 37.6 | 37.8 | 36.2 | 34.8 | 33.2 | 31.1 | 29.1 | 20.5 | 11.7 |
| Specific heat capacity cp, J/(kg∙K) | 435 | 446 | 516 | 528 | 539 | 550 | 562 | 573 | 584 | 596 | 607 |
| Density ρ, kg/m3 | 8039 | 8029 | 7989 | 7938 | 7889 | 7840 | 7792 | 7744 | 7697 | 7650 | 7604 |
Publisher’s Note: MDPI stays neutral with regard to jurisdictional claims in published maps and institutional affiliations. |
© 2021 by the authors. Licensee MDPI, Basel, Switzerland. This article is an open access article distributed under the terms and conditions of the Creative Commons Attribution (CC BY) license (https://creativecommons.org/licenses/by/4.0/).
Share and Cite
Kohls, E.; Heinzel, C.; Eich, M. Evaluation of Hardness and Residual Stress Changes of AISI 4140 Steel Due to Thermal Load during Surface Grinding. J. Manuf. Mater. Process. 2021, 5, 73. https://0-doi-org.brum.beds.ac.uk/10.3390/jmmp5030073
Kohls E, Heinzel C, Eich M. Evaluation of Hardness and Residual Stress Changes of AISI 4140 Steel Due to Thermal Load during Surface Grinding. Journal of Manufacturing and Materials Processing. 2021; 5(3):73. https://0-doi-org.brum.beds.ac.uk/10.3390/jmmp5030073
Chicago/Turabian StyleKohls, Ewald, Carsten Heinzel, and Marco Eich. 2021. "Evaluation of Hardness and Residual Stress Changes of AISI 4140 Steel Due to Thermal Load during Surface Grinding" Journal of Manufacturing and Materials Processing 5, no. 3: 73. https://0-doi-org.brum.beds.ac.uk/10.3390/jmmp5030073