1. Introduction
Laser cutting is a widespread process in numerous manufacturing industries [
1]. This processing technology is being constantly improved while contributing to the progress of industrial production in all engineering fields worldwide. The basic laser applications industry-wise include laser cutting, engraving, welding, drilling, and marking. Several processing parameters allow the accurate control of the process. Such process parameters need to be optimised based on the processed material (plastics, metals, ceramics, glass, wood, and fabrics) to achieve an accurate cut [
2,
3]. Most of the reported research is focused on the laser cutting of metallic materials, however in recent years laser cutting applications in polymeric materials have also been researched. Such applications have been significantly developed for the manufacturing of flexible electronics in the last decade [
4,
5,
6].
The main groups of polymeric materials are polycarbonate (PC), polyethylene (PE), polyvinyl chloride (PVC), and polymethyl methacrylate (PMMA), typically known by the commercial names of “acrylic glass” or “plexiglass”, which comprise phenolic and epoxy resins [
2]. During the CO
2-laser cutting of PMMA thin sheets, the manufacturing process parameters (namely LP, LS, focusing distance, and gas type) affect the average surface roughness of the cut surface and the dimensional accuracy of the cut specimens [
7,
8].
A thorough literature review was undertaken resulting in approximately 34 studies when using keywords such as ’laser AND cutting AND CO2 AND PMMA’, but only a few of them were focused on kerf geometry or surface roughness characteristics. A critical review of them is presented below.
Atanasov and Baeva [
9] studied the cutting velocity as a function of the LP. They modelled the process, utilising the energy balance of a given small volume of material. Plates of PMMA material were cut, among other thermoplastic, and they validated their model with experiments having obtained acceptable results. A maximum LS of about 30 mm/s was observed for laser cutting of 4 mm PMMA plates using a 90 W continuous-wave CO
2 laser. They did not measure the attributes of the cutting surface.
Davim et al. [
10] studied the surface roughness, dimensional accuracy, and heat-affected zone of PMMA cut specimens during the CO
2 laser cutting process using LP between 350–650 W and LS between 25–58 mm/s. They concluded that the average surface roughness takes values between 0.5 μm and 3 μm and decreases as the LP increases or the LS decreases. They observed HAZ depths between 0.12 and 0.37 mm and repeatability of external and internal dimensions (σ values) between 0.024 and 0.076 mm.
Eltawahni et al. [
11] focused on studying the upper and down kerf widths and the ratio of them for the case of laser cutting of PMMA plate thickness, LP and LS of the laser, focal point position, and air pressure during a CO
2 laser cutting process. For the experiments, they utilised the Box–Behnken design. The employed LP values were higher than 150 W, and the LS higher than 33 mm/s. The LP used was higher than 150 W, much higher than the proposed 90 W for 4 mm PMMA plates [
9]. Moreover, a higher than 33 mm/s LS was used.
Hossain et al. [
12] developed an intelligent fuzzy expert system to predict the kerf width during the CO
2 laser machining of 3 mm PMMA plates. The applied input variables were the LP and LS of the laser, the stand-off distance, and the gas pressure. The LP values were between 100 and 500 W, the beam velocity between 3.3 and 20 mm/s and the stand-off distance between 1 and 10 mm. A full factorial design was used, and it was concluded that the kerf width becomes wider with the increase of stand-off distance and LP but at higher LS, the kerf width decreases. A minimum kerf width of 0.3167 mm was observed at 0.5 bar gas pressure, 100 W LP, 1 mm stand-off distance, and 20 mm/s LS.
Choudhury and Shirley [
13] studied the laser cutting (CO
2, 500 W, continuous wave) of various polymeric materials (PC, PP, and PMMA) to evaluate the effect of the LP (200–400 W), cutting speed (3.3–6.6 mm/s) and air pressure (0.25–0.35 MPa) on laser cutting quality (average surface roughness, mean HAZ depth, and dimensional accuracy). They used a CCD design and RSM methodology. The average surface roughness was measured only for the 3 mm PMMA material and it was found that all measurements were between 7 and 10 μm. The experimental values of LS are quite larger than those proposed in [
9].
Chen et al. [
14] investigated the effects of assisted gas flow rate (10–30 NL/min), pulse repetition frequency (5–15 kHz), cutting speed (1–2 mm/s), and defocused point (–1, 0, 1 mm) on average surface roughness and optical transmittance of 6 mm PMMA plates during 100 W CO
2 laser cutting. They observed Ra values between 0.38 and 2.8 μm and optimised the process using grey relational analysis. The experimental space used for LS was lower than that proposed in [
9] for 6 mm PMMA plates (proposed speeds about 20 mm/s).
Khoshaim et al. [
15] investigated the effects of the LP (120, 135, 150 W), cutting speed (1.6, 3.2, 4.8 mm/s), assisting gas pressure (0.13 MPa), and sheet thickness (4, 6, 12 mm) on the kerf geometry and surface roughness during a CO
2 laser cutting of PMMA sheets. They observed that the surface of the cut kerf had three main zones: rough, moderate, and soft zones. The worst average surface measurements were observed near the top surface and lay between 7 and 25 μm. The experimental values of LP were higher than 120 W and the LS lower than 5 mm/s for the 4 mm PMMA plates.
In the literature, the kerf geometry during the laser cutting of PMMA has been also studied. Varsi and Shaikh [
16] investigated cutting PMMA samples of 8 mm thickness with a CO
2 laser (0–25 W). They examined the impact of the LP, cutting speed, and several passes on the kerf taper angle. They concluded that a higher LP, lower speed, and a higher number of passes of the laser probe resulted from a low kerf angle.
Elsheikh et al. [
17] optimised the CO
2 laser speed (1.6–5 mm/s), the gas pressure, the LP (120–150 W), and the sheet thickness (4–12 mm) according to the kerf quality features (top kerf width, bottom kerf width, and kerf taper) of the PMMA sheet during a laser cut process. They used the Taguchi L18 orthogonal array with a varied design. The attained outcomes demonstrated that any escalation in the cutting parameters resulted in higher top and bottom kerf widths while increasing the cutting speed or the LP resulted in maximising the kerf angle.
In a study by Khamar and Prakash [
18], the dimensional accuracy of PMMA parts manufactured using a 60 W CO
2 laser machine was investigated. The PMMA plates had a variable thickness between 2 to 12 mm. They concluded that when the dimensions of the parts increase, the accuracy increases too.
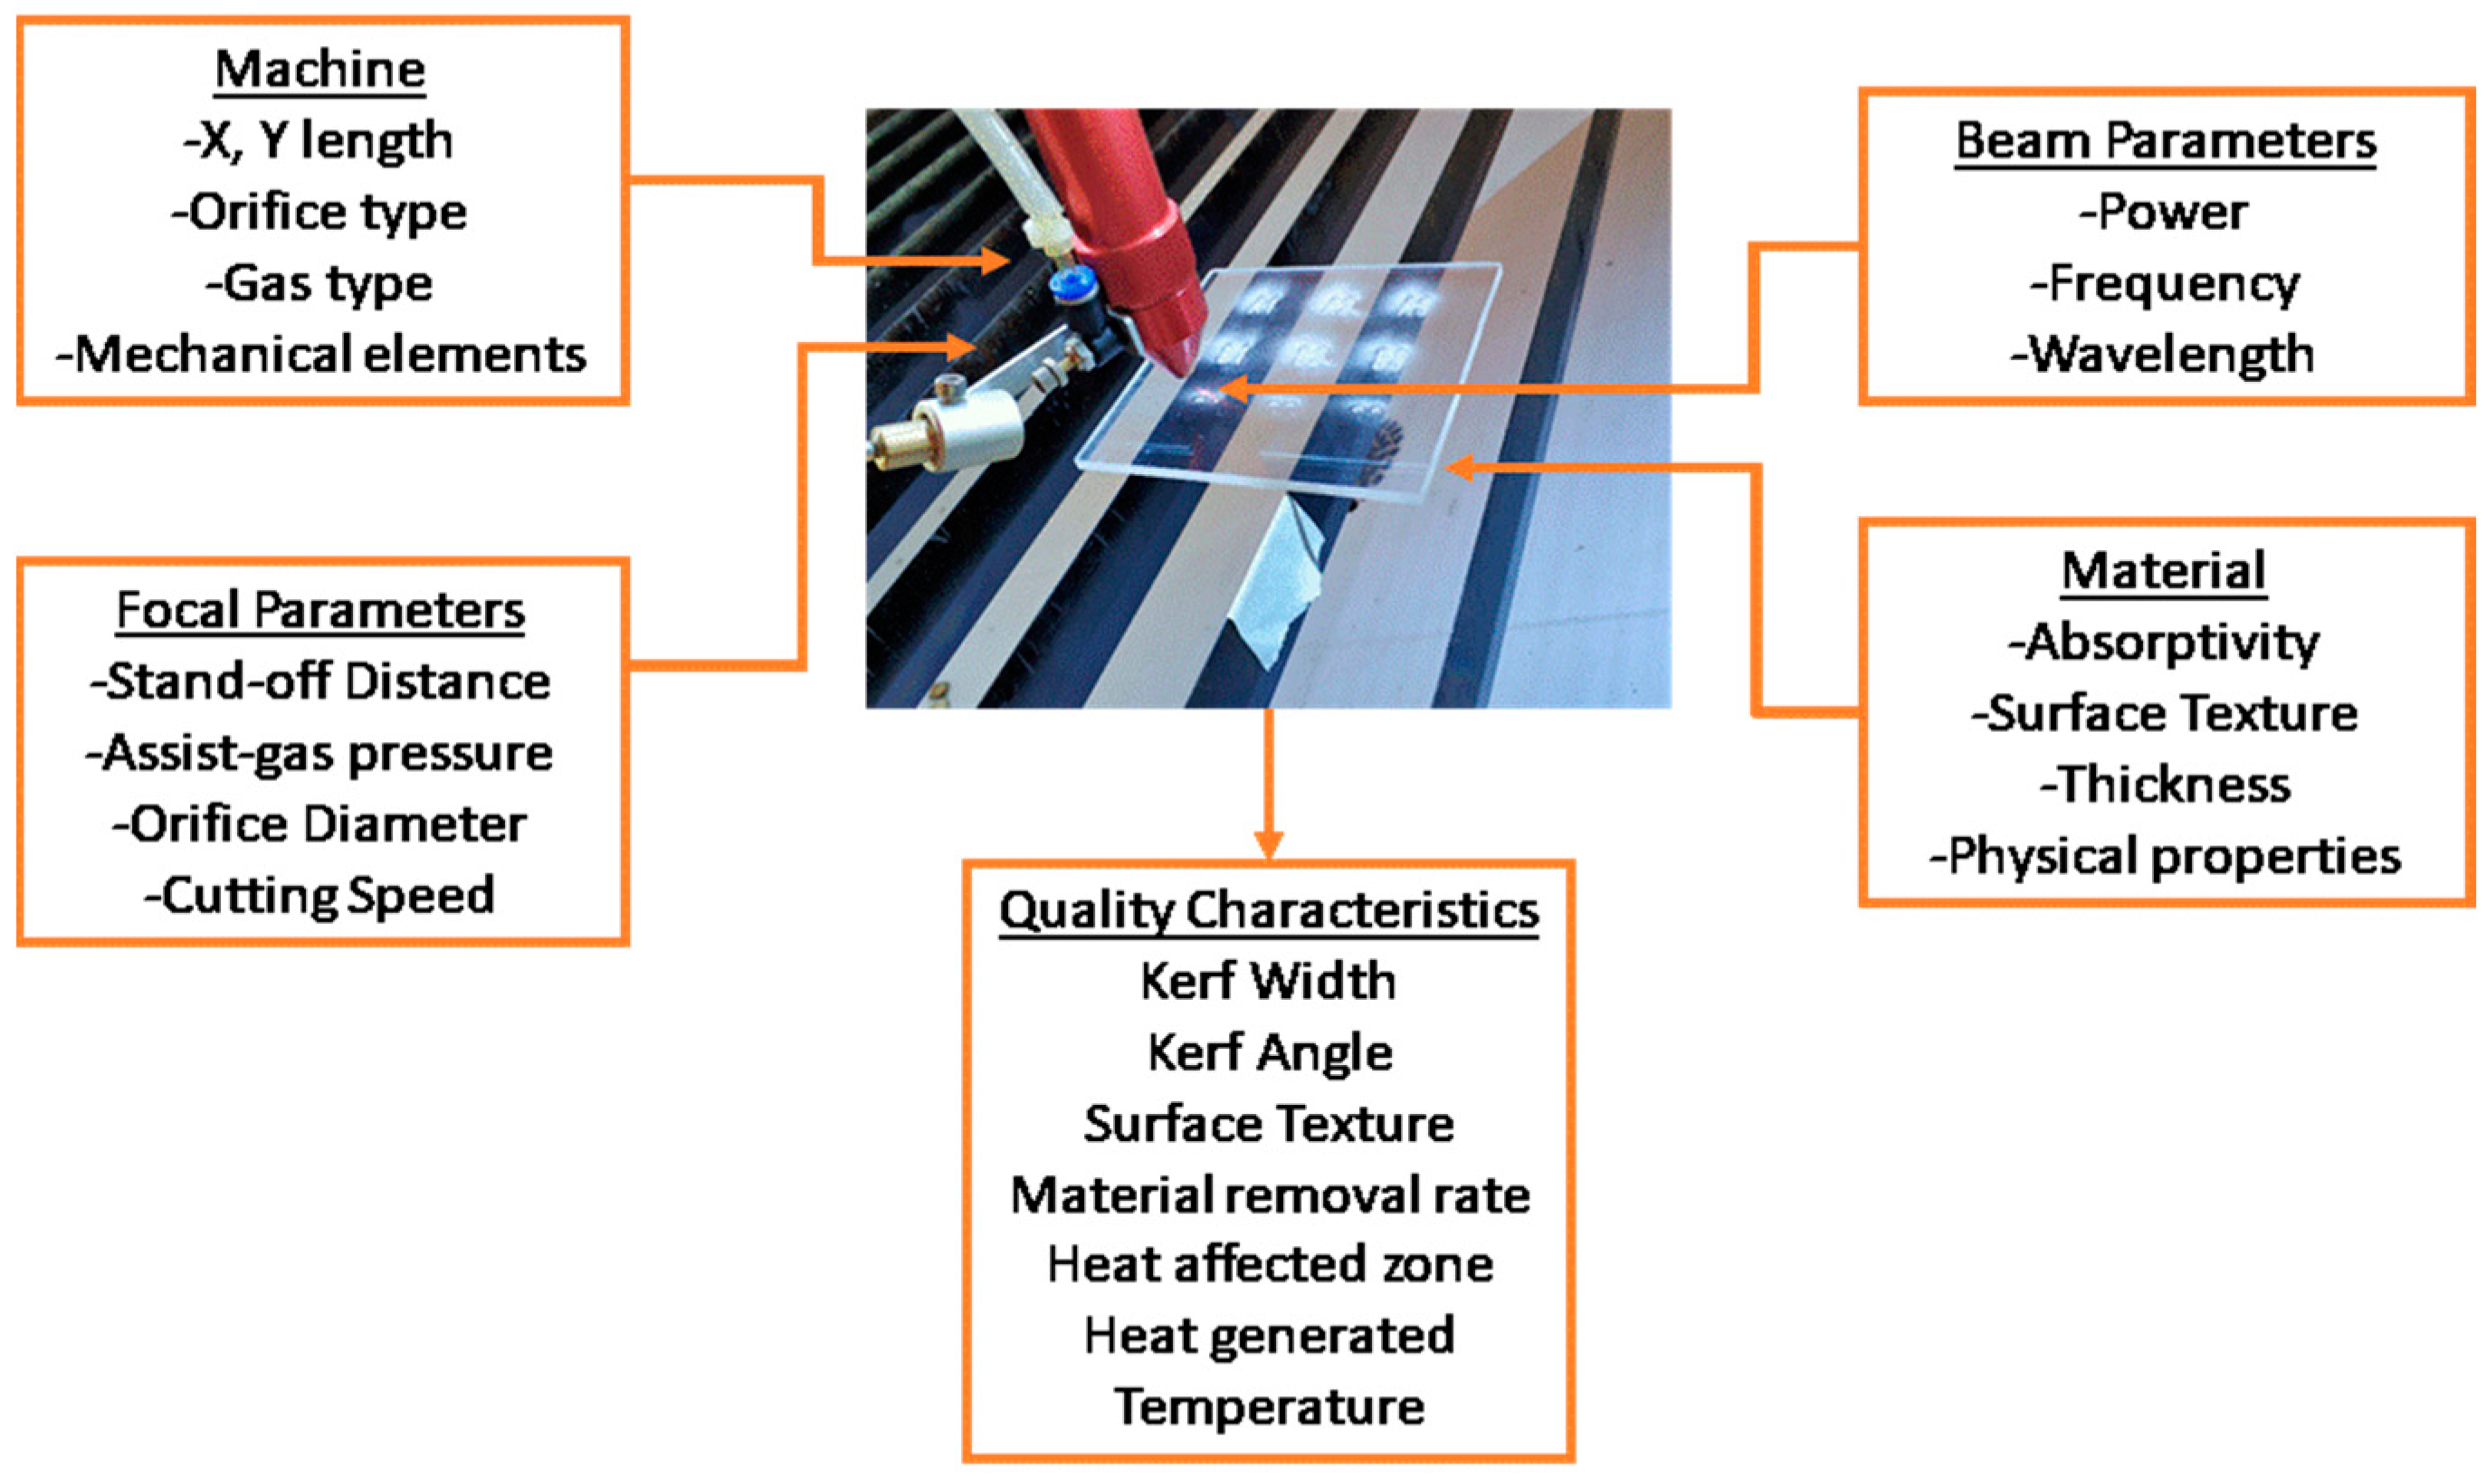
The literature review concluded that the laser cutting quality performance is affected by machine element stiffness and dynamics, beam characteristics, focal processing parameters, and material physical properties, as depicted in
Figure 1 [
1].
This work studied the variations of the average surface roughness and the dimensional accuracy based on the variation of the LP and LS of the laser beam, as well as the specific position and orientation of the cut surface. A continuous-wave (CW) low power CO
2 laser was used. The range of the parameters utilised in this work, LP between 82.5 and 97.5 W and LS between 8–18 mm/s, was investigated for the first time concerning the cut’s shape accuracy and the surface roughness. This experimental space for the LP and LS parameters follows the work presented in [
9]. The average surface roughness and the dimensional accuracy were measured in both cutting directions X and Y (Z-axis rotation, 0° and 90°). Furthermore, the process was optimised according to the ANOM plots and characterised using the ANOVA analysis. Finally, interaction graphs were used to display the interaction between the process parameters.
2. Materials and Methods
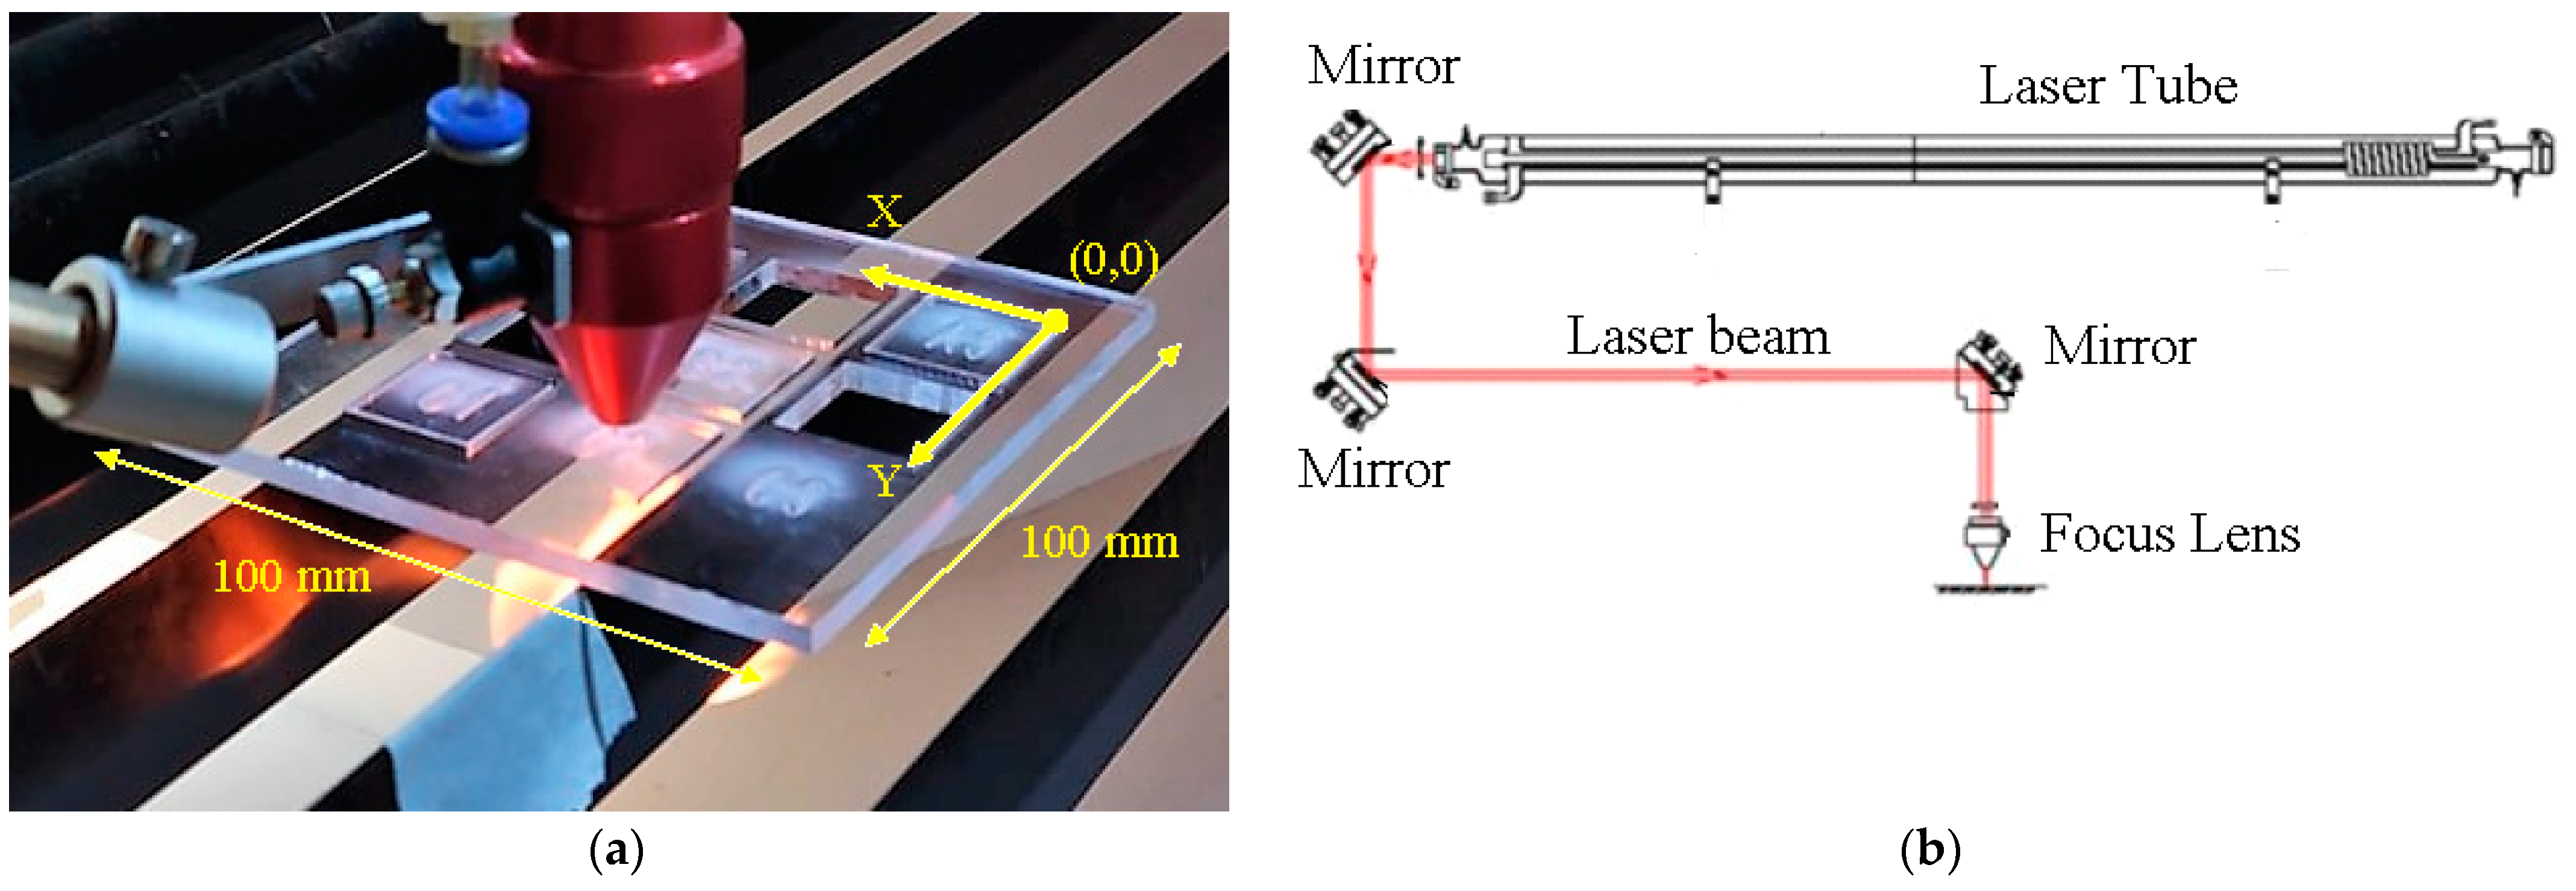
Experiments were undertaken with a laser system consisting of a source of 150 W continuous CO
2 laser beam (model BCL 1325B, stand-off distance 8 mm at the focal point, focal length 46 mm, wavelength 10.6 μm, focal nose diameter 2 mm, spot diameter at focal point 0.3 mm, air as assist gas), with a belt-driven controlled table with a working volume of 2200 mm × 1250 mm (
Figure 2a; [
19]). The laser optical system consists of a laser tube, three (3) reflection mirrors, one (1) focus lens, and a laser head. The laser beam is directed out from the laser tube, reflected by three reflection mirrors, reaching the working table via a focus lens (
Figure 2b). The laser head moved counter-clockwise during all the experiments. The software used for the design of the PMMA square shapes was the Laser Engraving & Cutting Software RDWorks8.0. The technical manual locating accuracy reported ± 0.02 mm. The head tested for coplanarity and calibration issues using specific tools at three different points before each cutting.
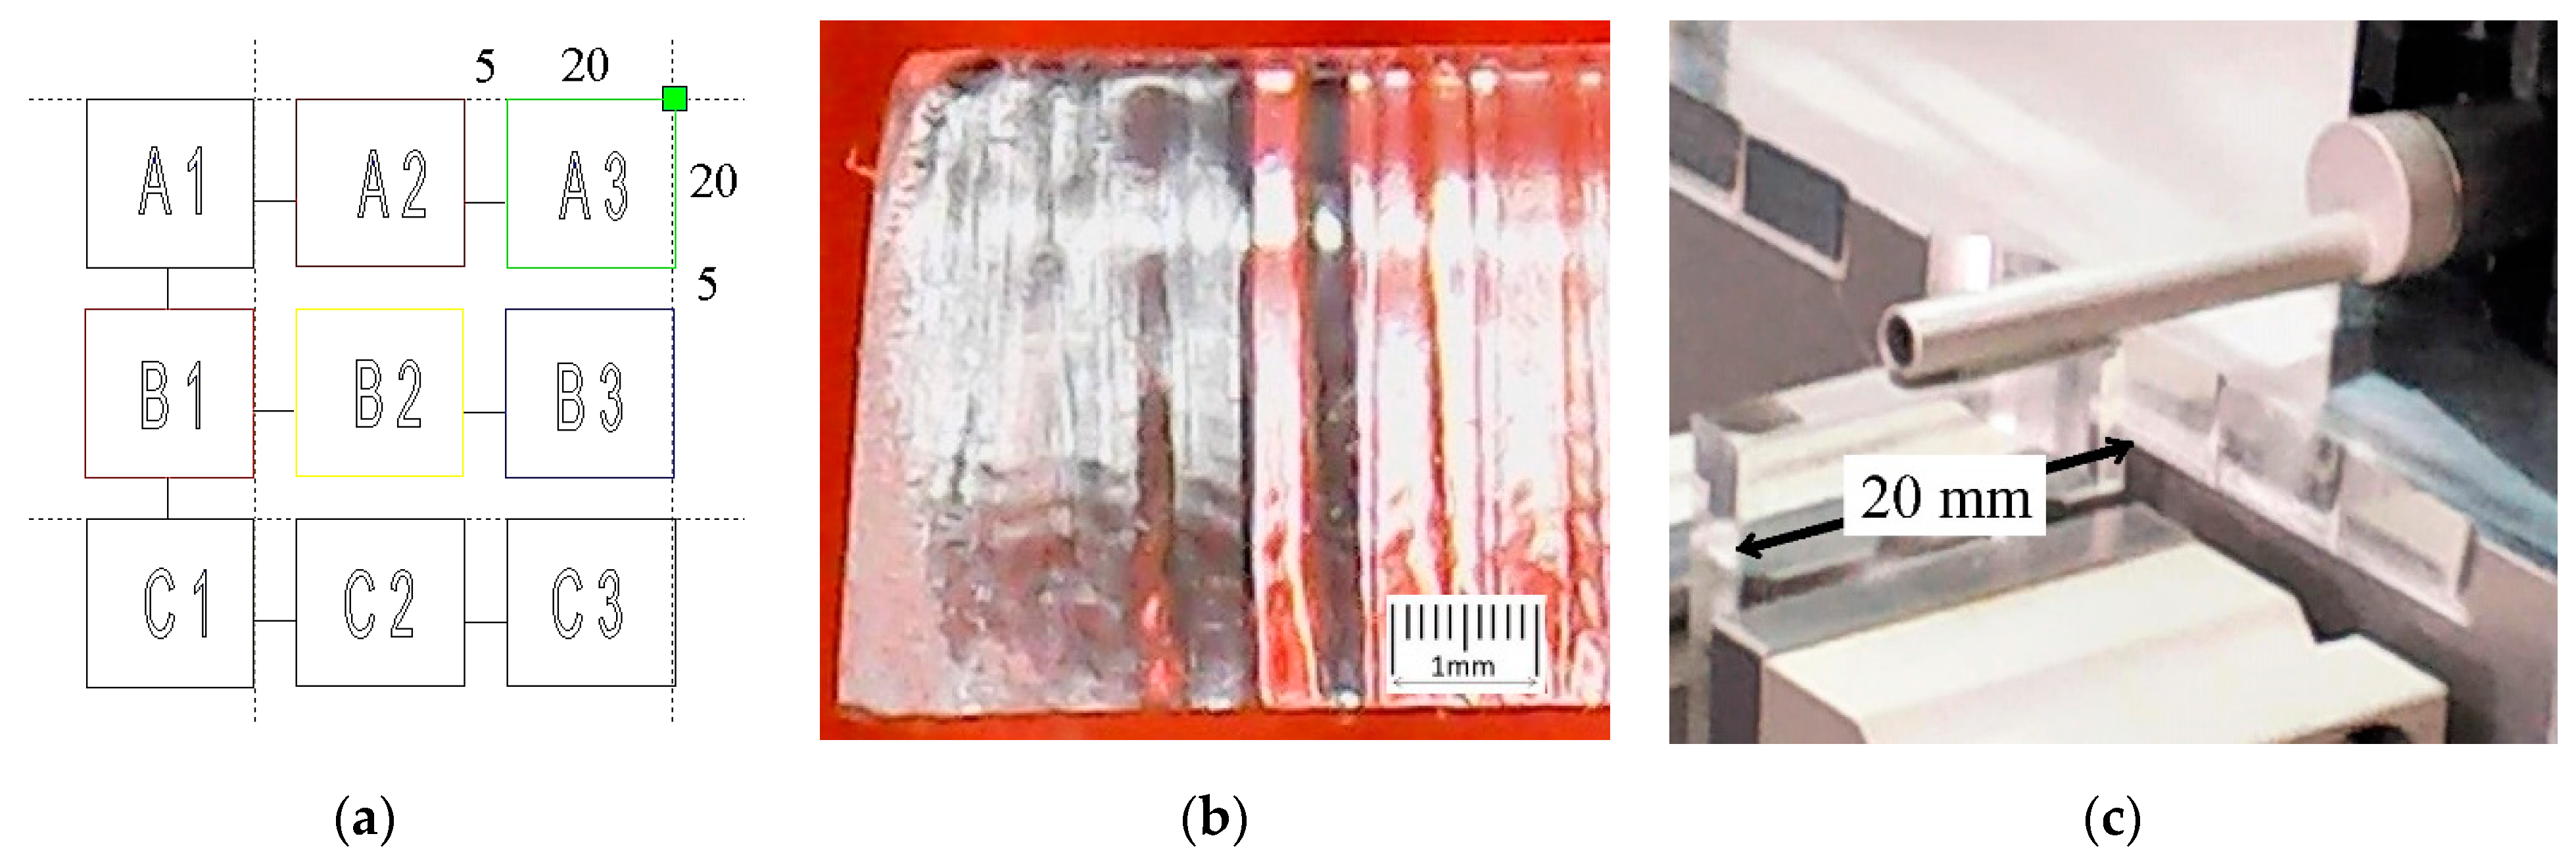
The cut samples have a square shape with a side of 20 mm. These were placed with a distance of 5 mm between them (see
Figure 3a). All the samples were cut from a squared PMMA plate of 100 mm side with a thickness of 4 mm. For the surface roughness readings (
Figure 3b), a high precision surface roughness profilometer was used (DIAVITE-DH8
®,
Figure 3c, [
20]). Readings were undertaken in the middle of the cut surface. The arithmetic mean roughness (μm), is the most common parameter for any machining method and primarily for the product’s quality control. The arithmetic average value of filtered roughness profiles were determined from the deviations about the centre line within the estimation length.
A micrometre with a range of 0–25 mm and 0.01 mm precision was utilised for the dimensional readings—the average (AV) of three measurements calculated in both X and Y directions. Then the dimensional accuracy was calculated by subtracting the ‘average’ from the ‘nominal’ dimension (20 mm) for each direction.
Design of Experiment
The parameters and their levels are shown in
Table 1. The ranges of the parameter values were designed after an extended study of the literature and previous experimental studies by the authors where various materials are cut [
21,
22]. The first parameter has two levels (Z-orientation: 0° and 90°) while all the other have three levels (Y-p and X-
p: 50, 25 and 0 mm from the origin in the Y and X directions, respectively; LS: 8, 13, and 18 mm/s; LP: 82.5, 90, and 97.5 W). All specimens were cut from a PMMA plate 100 mm × 100 mm.
In
Table 2, the thirty-six (36) measurements which were produced by a mixed design of experiments L36 (2
1 × 3
4) are tabulated [
23].
The Y-p and X-p and the laser’s LS and LP were the four parameters with the three levels each, which were designed according to the Taguchi L9 (34) orthogonal array. The experiment was replicated two times resulting in eighteen (18) squared cuts. In each specimen, two surfaces were measured for the Ra and DA at 0 and 90 degrees on the Z orientation Z-or, resulting in thirty-six measurements.
The PMMA plate was positioned both times (set 1 and 2) at the same starting point (reference point x, y: 0, 0; see
Figure 3a). Both average surface roughness and dimensional accuracy were studied to define the optimum quality output.
3. Results and Discussion
Plots of process parameters also called ‘analysis of means’ (ANOM) or ‘main effects’ [
24,
25,
26,
27], were used to plot the mean values at each level of a process parameter. Such plots show graphically the impact of each process parameter concerning the process performance and are useful for optimising the process parameters.
The interaction charts or plots demonstrate the interaction between the two parameters. An interaction chart indicates the relationship between one parameter and a continuous response depending on the value of the second parameter.
The process parameters affect the quality performance of a laser cut to a different degree. The outcome of each process parameter on the quality performance can be revealed using the ANOVA analysis. In general, the ANOVA is an estimation procedure among groups of data used to analyse the differences among dataset averages in a sample [
24] and to derive the importance of each parameter. In the ANOVA analysis, the F and P values are considered to resolve which parameters strongly affect the responses. High F-values imply significance or, equivalently, low
p-values (
p < 0.05).
Finally, process modelling is the procedure to fit mathematical models (theoretical, experimental or hybrid) between the input parameters and the output of the process (performance metrics).
3.1. Effects of the Process Parameters on the Average Surface Roughness
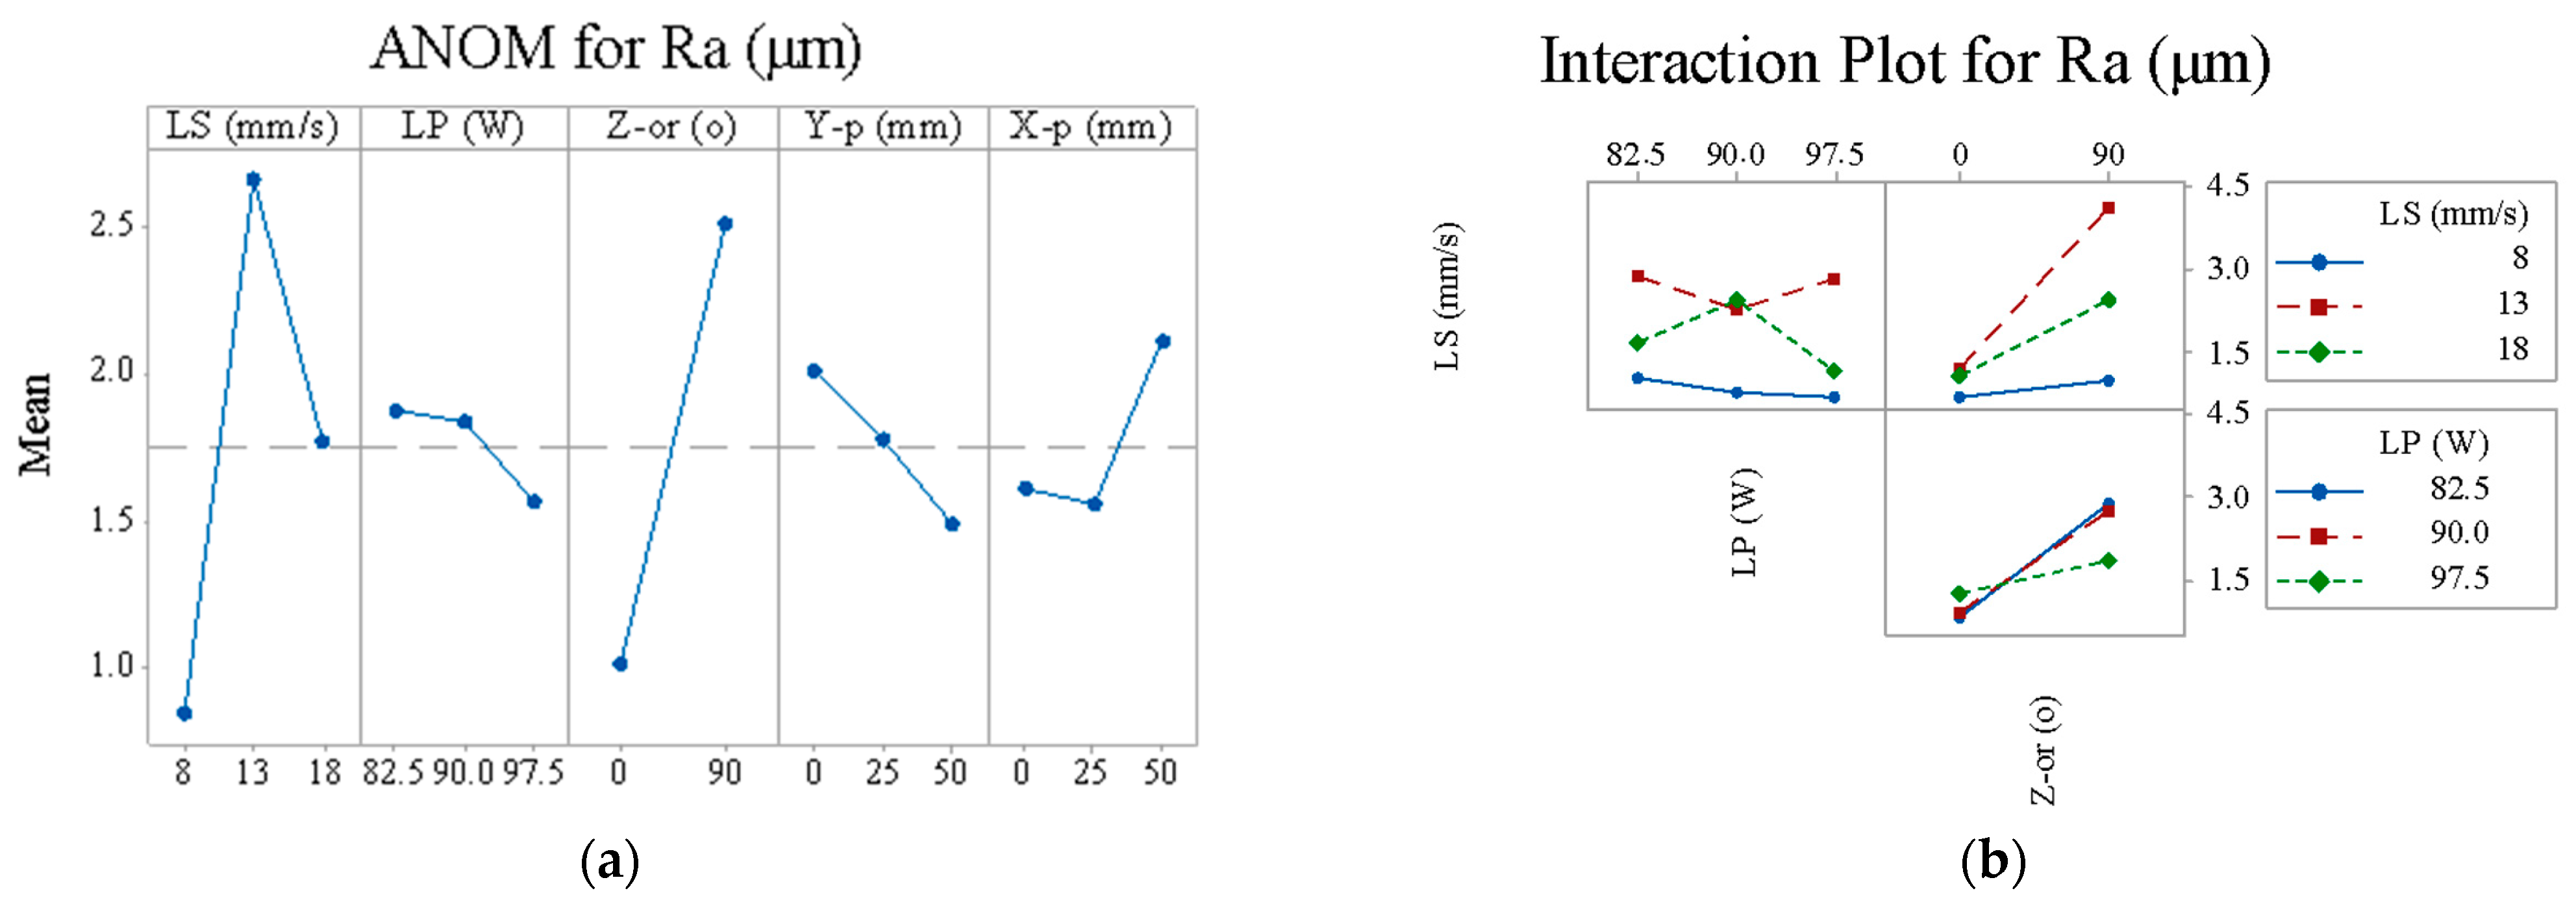
Using the ANOM plots, the effects of the process parameters (LS, LP, Z-or, Y-p and X-p) on the average surface roughness can be depicted (
Figure 4a). The interaction plots for the process parameters on the Ra are presented in
Figure 4b.
The Ra is characterised as ‘the smaller, the better’ quality characteristic, and consequently, it was optimised for 8 mm/s LS, 97.5 W LP, 0° Z-or, 50 mm Y-p, and 25 mm X-p.
The ANOM plots show that the LS affects the Ra the most. It seems that when the LS rises from 8 to 13 mm/s, the vibrations also increase, and the Ra becomes worst (higher). After the 13 mm/s value, the Ra values become slightly better. This is owing to large interactions which appear between LS and LP (
Figure 4b).
The LP has a low impact on the Ra (mean-values have small discrepancies). The experimental space of the LP (82.5–97.5 W) is selected near 90 W, as proposed in [
9] and proved that effects on Ra were insignificant. It was observed that when the LP increases, it has synergistic (increase) effects on Ra.
The Z-or parameter affects the Ra significantly in the proposed experimental range and is optimized in zero degrees. The explanation for these different mean values in 0° and 90° is that the vibrations in these orientations have different bounds.
The Y-p and X-p have a low impact on the Ra (mean-values have small spreads). The slight differences in the mean values of these two parameters are explained due to the dynamic of the belts and motors of the LC machine.
The interaction charts show a smooth synergy between the LS and Z-or (the two most significant parameters).
Table 3, presents the ANOVA analysis for the average surface roughness. A general linear model with an interaction product between the LP and Z-or was used.
The ANOVA analysis shows that the most important parameters are the LS and Z- or, which both contribute at about 32%. The three other parameters are insignificant for the Ra (F < 4 for all). Additionally, the error is about 11%, and the R-sq is about 88.99%. The predicted R-sq(pred) is about 75.22%, demonstrating that the regression model is not overfitted (too many terms in the model). Concluding, the mathematical prediction equation has the following formula:
3.2. Effects of the Process Parameters on the Dimensional Accuracy
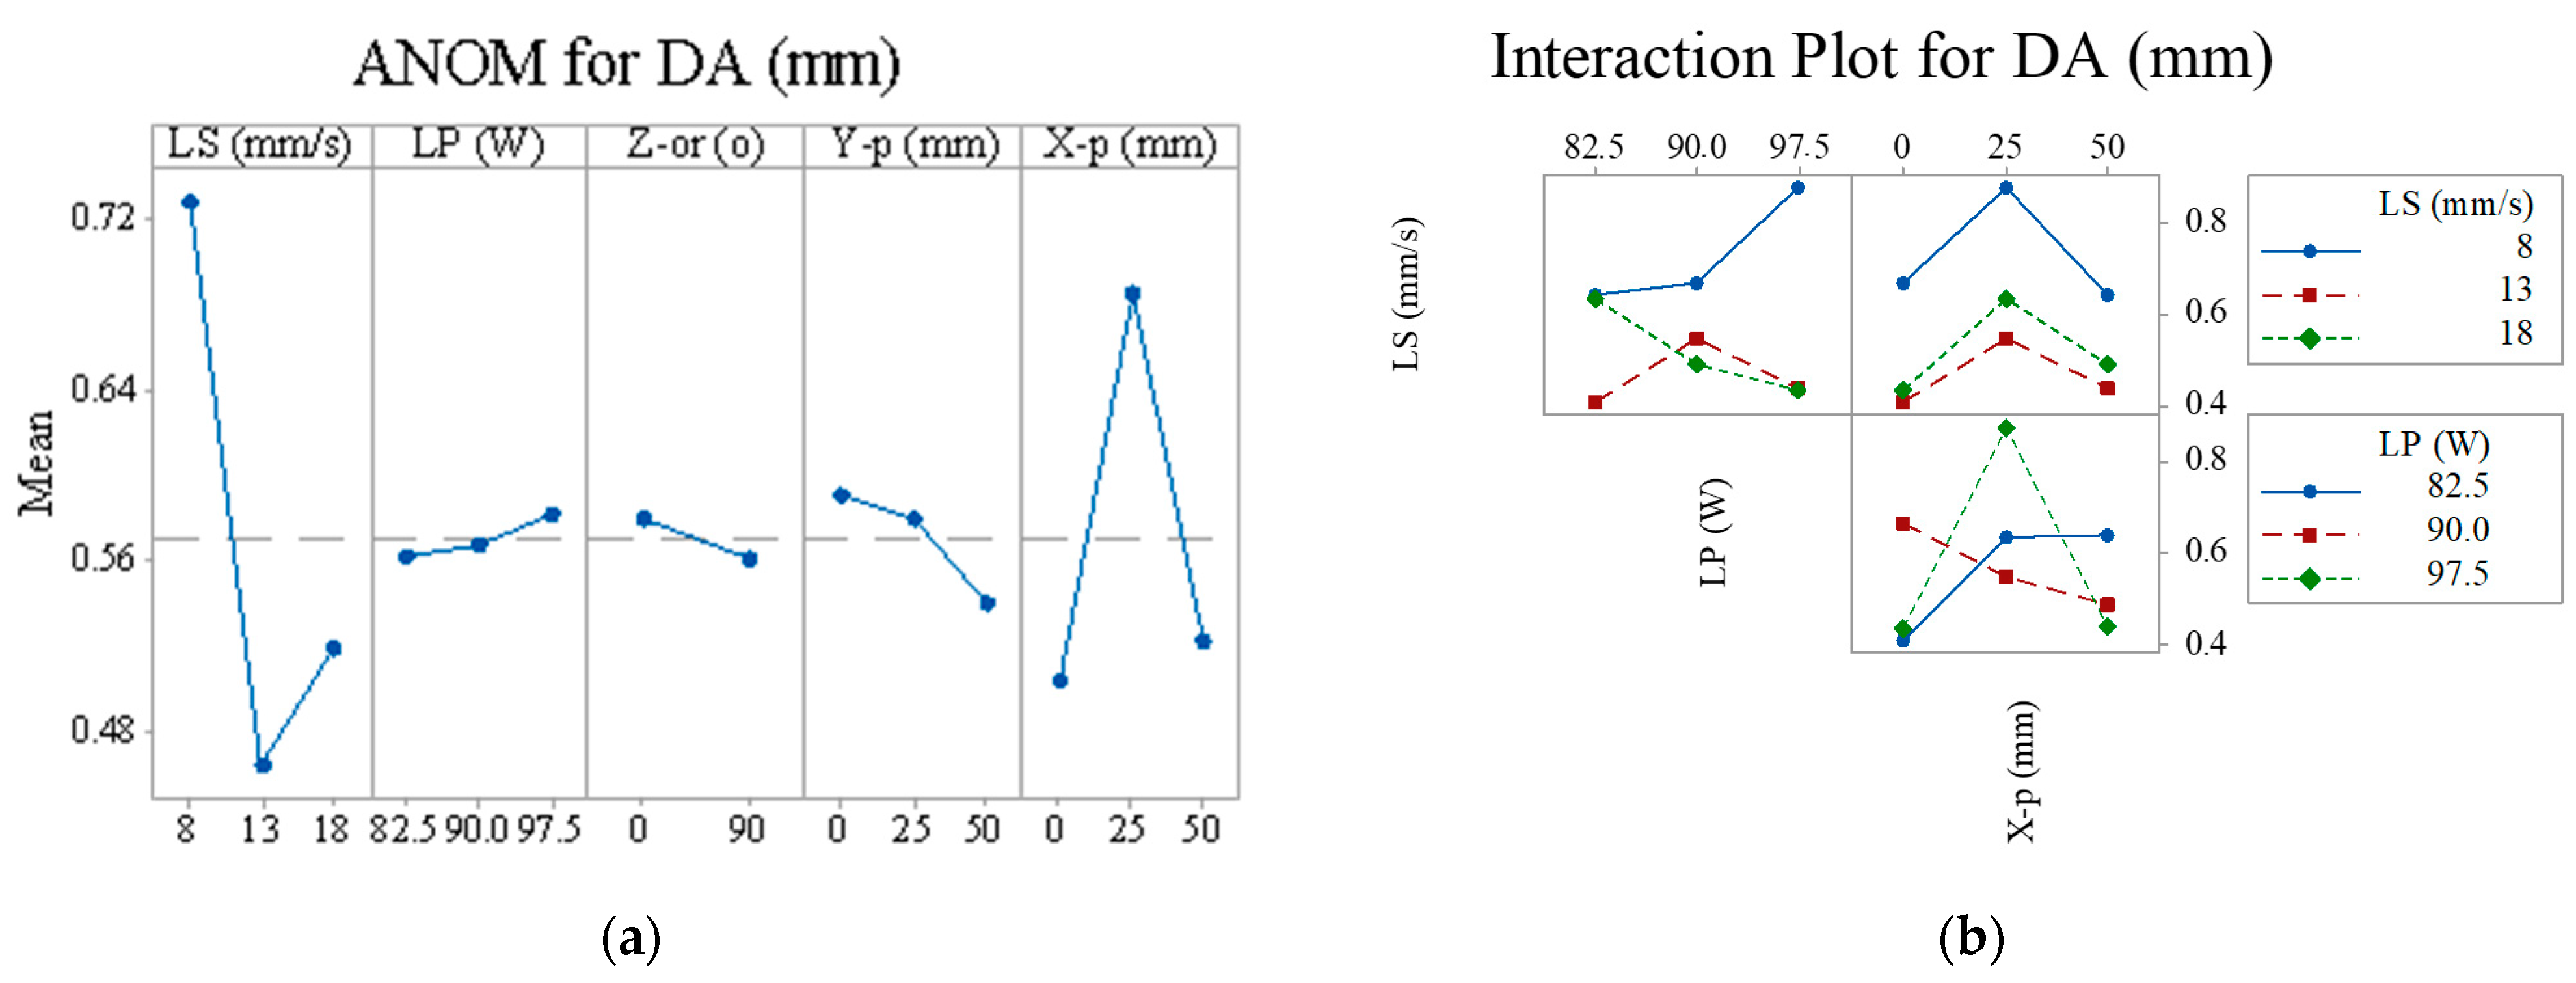
The analysis of means (ANOM plots) of the process parameters (LS, LP, Z-or, Y-p, and X-p) on the dimensional accuracy is presented in
Figure 5a. The interaction plots of the process parameters on the DA are presented in
Figure 5b.
The DA is characterised as a quality characteristic ‘the smaller, the better’, and consequently, it was optimised for 13 mm/s LS, 82.5 W LP, 90° Z-or, 50 mm Y-p, and 0 mm X-p.
The LS is the most significant parameter. When it increases from 8 mm/s to 13 mm/s, the DA decreases (improved) and afterwards, when it takes the 18 mm/s value, the DA slightly increases. Increasing the LS, the laser spot time per unit area decreases, resulting in smaller bottom kerf widths, leading to better DA. The LS shows ‘anti-synergistic’ interaction with the LP.
The LP shows insignificant effects on DA. The selection of the experimental range is the reason, as explained before in
Section 3.1.
The Z-or and the Y-p variables have an insignificant impact on the DA (mean-values have almost zero differences). Finally, the X-p parameter affects the DA significantly and interacts anti-synergistically with LP. The interaction charts show a strong correlation between LS, LP, and X-p.
Table 4 presents the ANOVA analysis for the dimensional accuracy. A general linear model was used.
The ANOVA analysis shows that the most important parameters are the LS and the X-p, which contribute about 46% and 24%. The three other parameters are insignificant for the DA (F < 4 and
p > 0.05 for all). Additionally, the error is 26.9%, and the R-sq is 73.15%, which means that the linear model is not appropriate for an accurate DA prediction. The predicted R-sq(pred) is 48.52%, demonstrating that the model may overfit. Finally, the mathematical prediction equation has the following formula:
3.3. Surface Response Plots and Multi-Response Optimisation
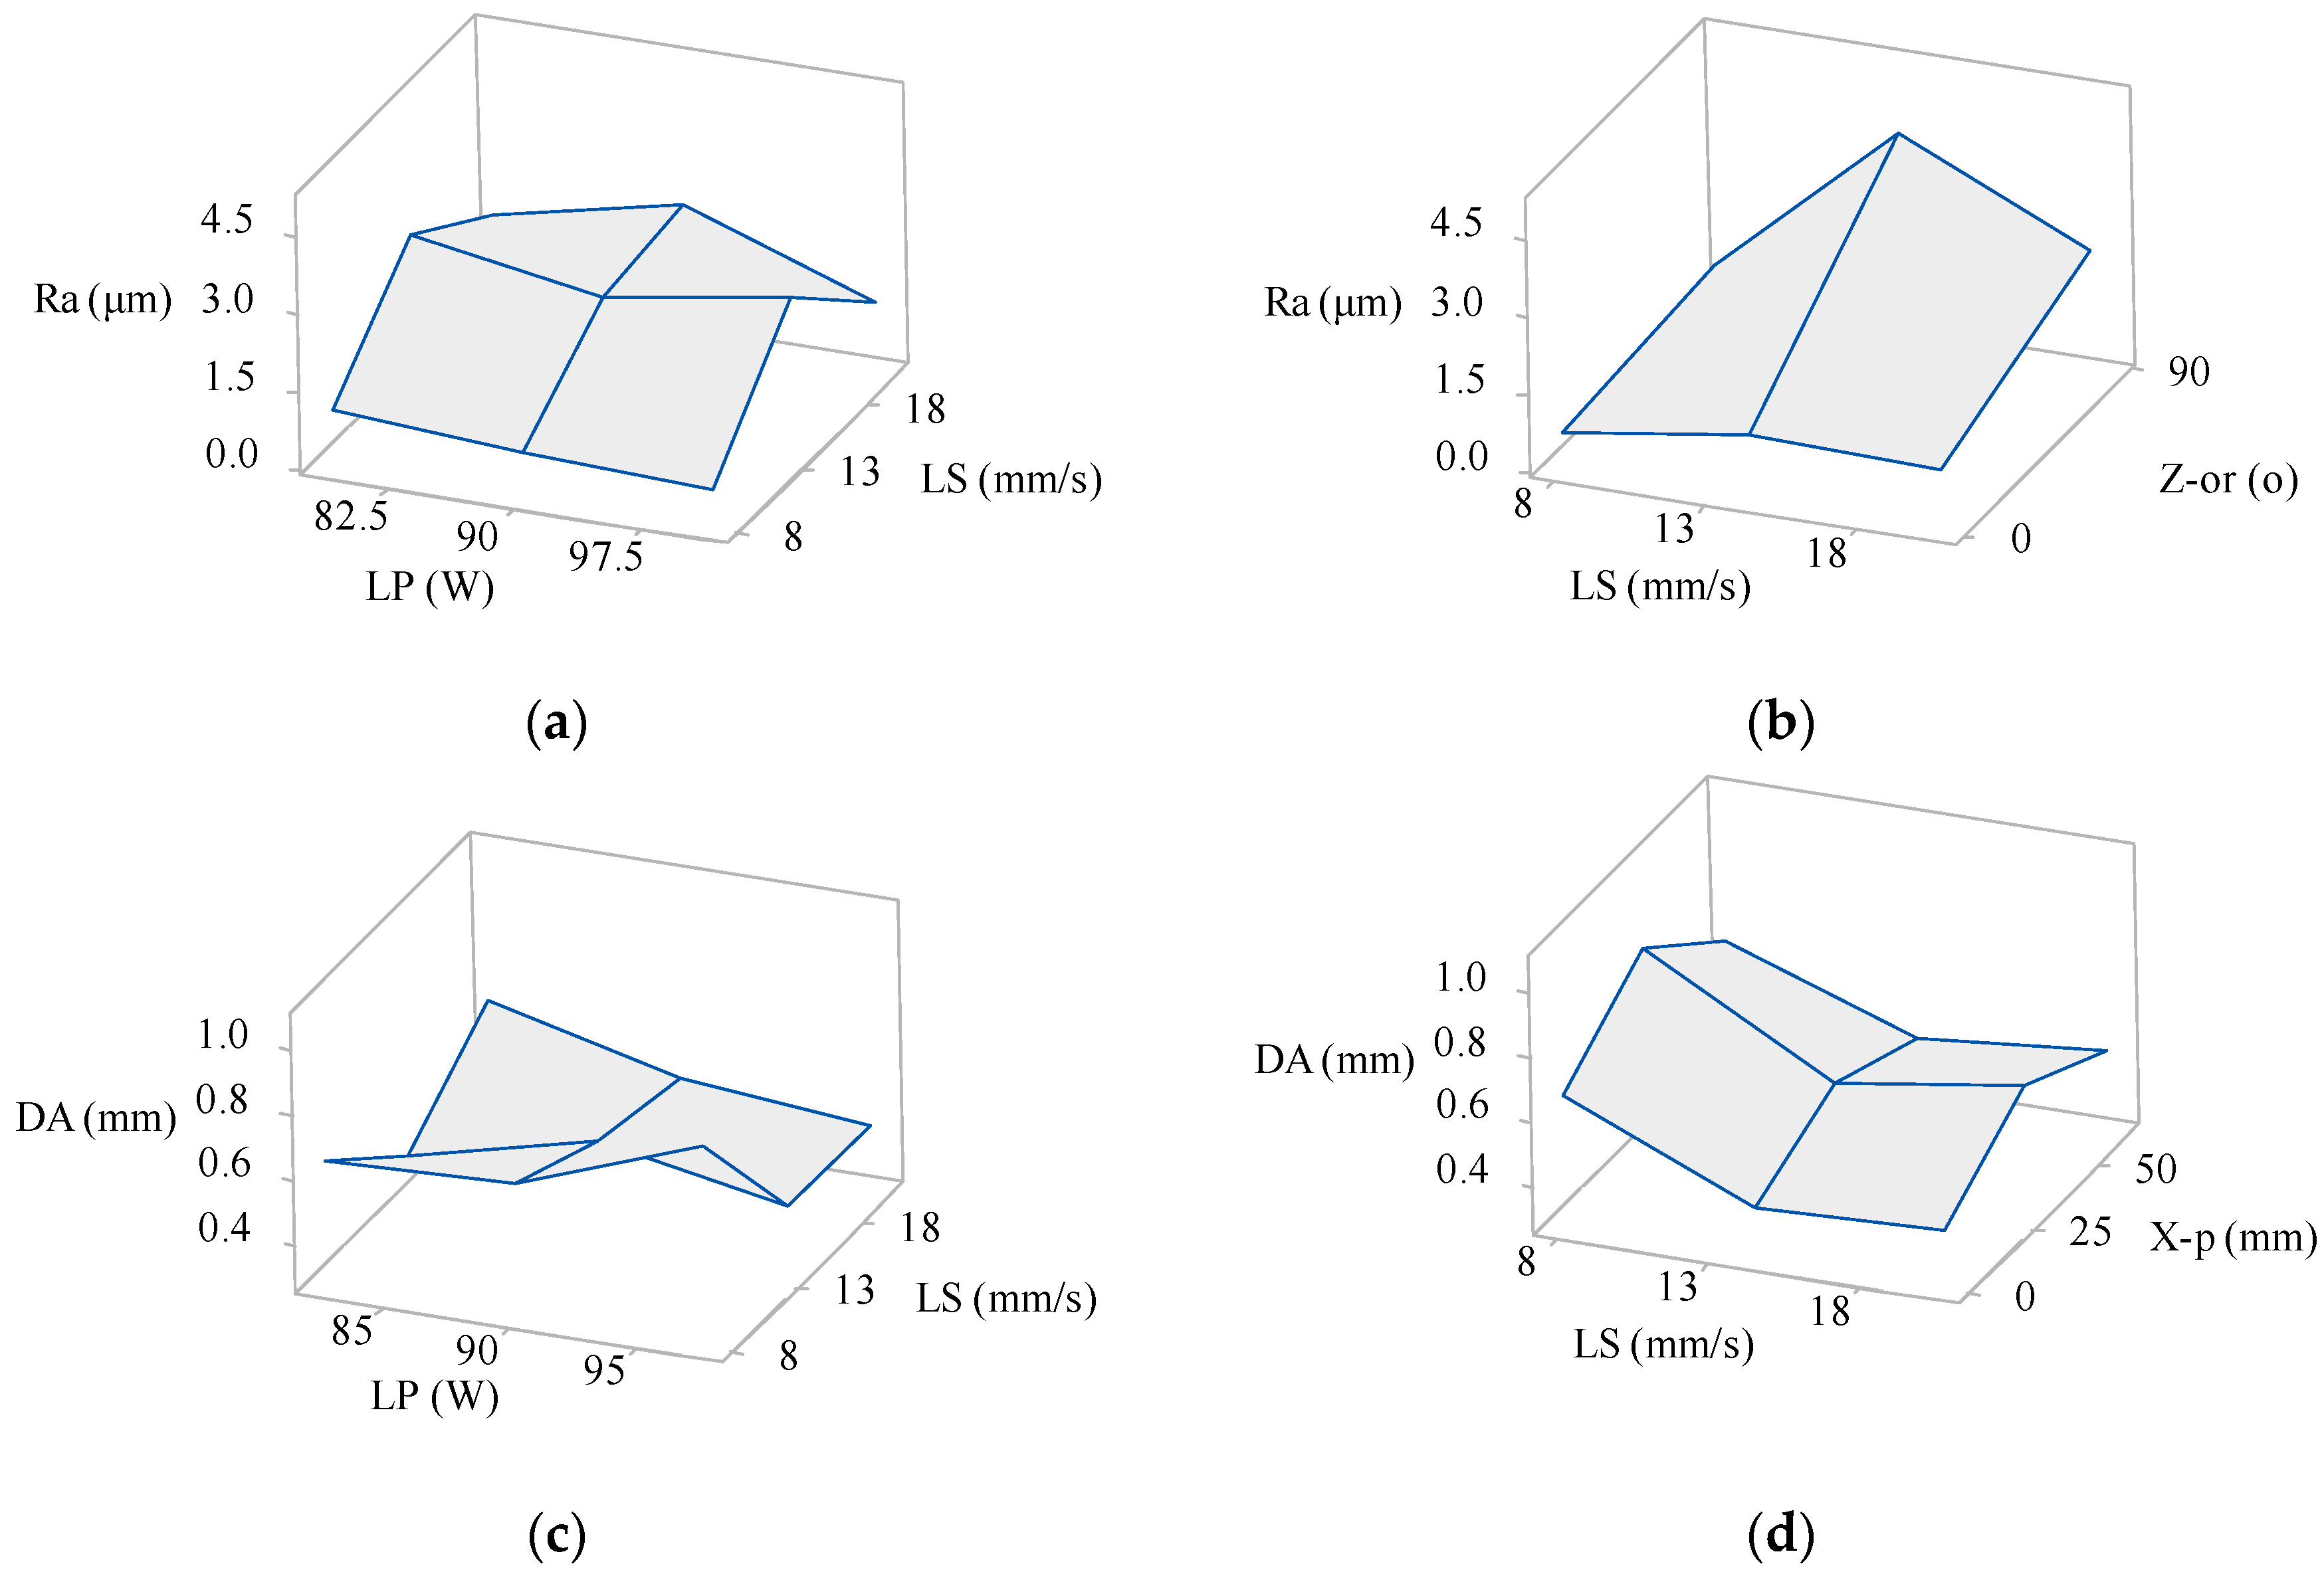
Using the linear Equations (2) and (3), the response graphs can be derived approximately as displayed in
Figure 6.
Figure 6a,b shows the surface plot of the Ra (μm) vs. the LS (mm/s) − LP (W) and LS (mm/s) − Z-or (°).
Figure 6c,d shows the surface plot of the DA (mm) vs. LS (mm/s) − LP (W) and LS (mm/s) − X-p (mm).
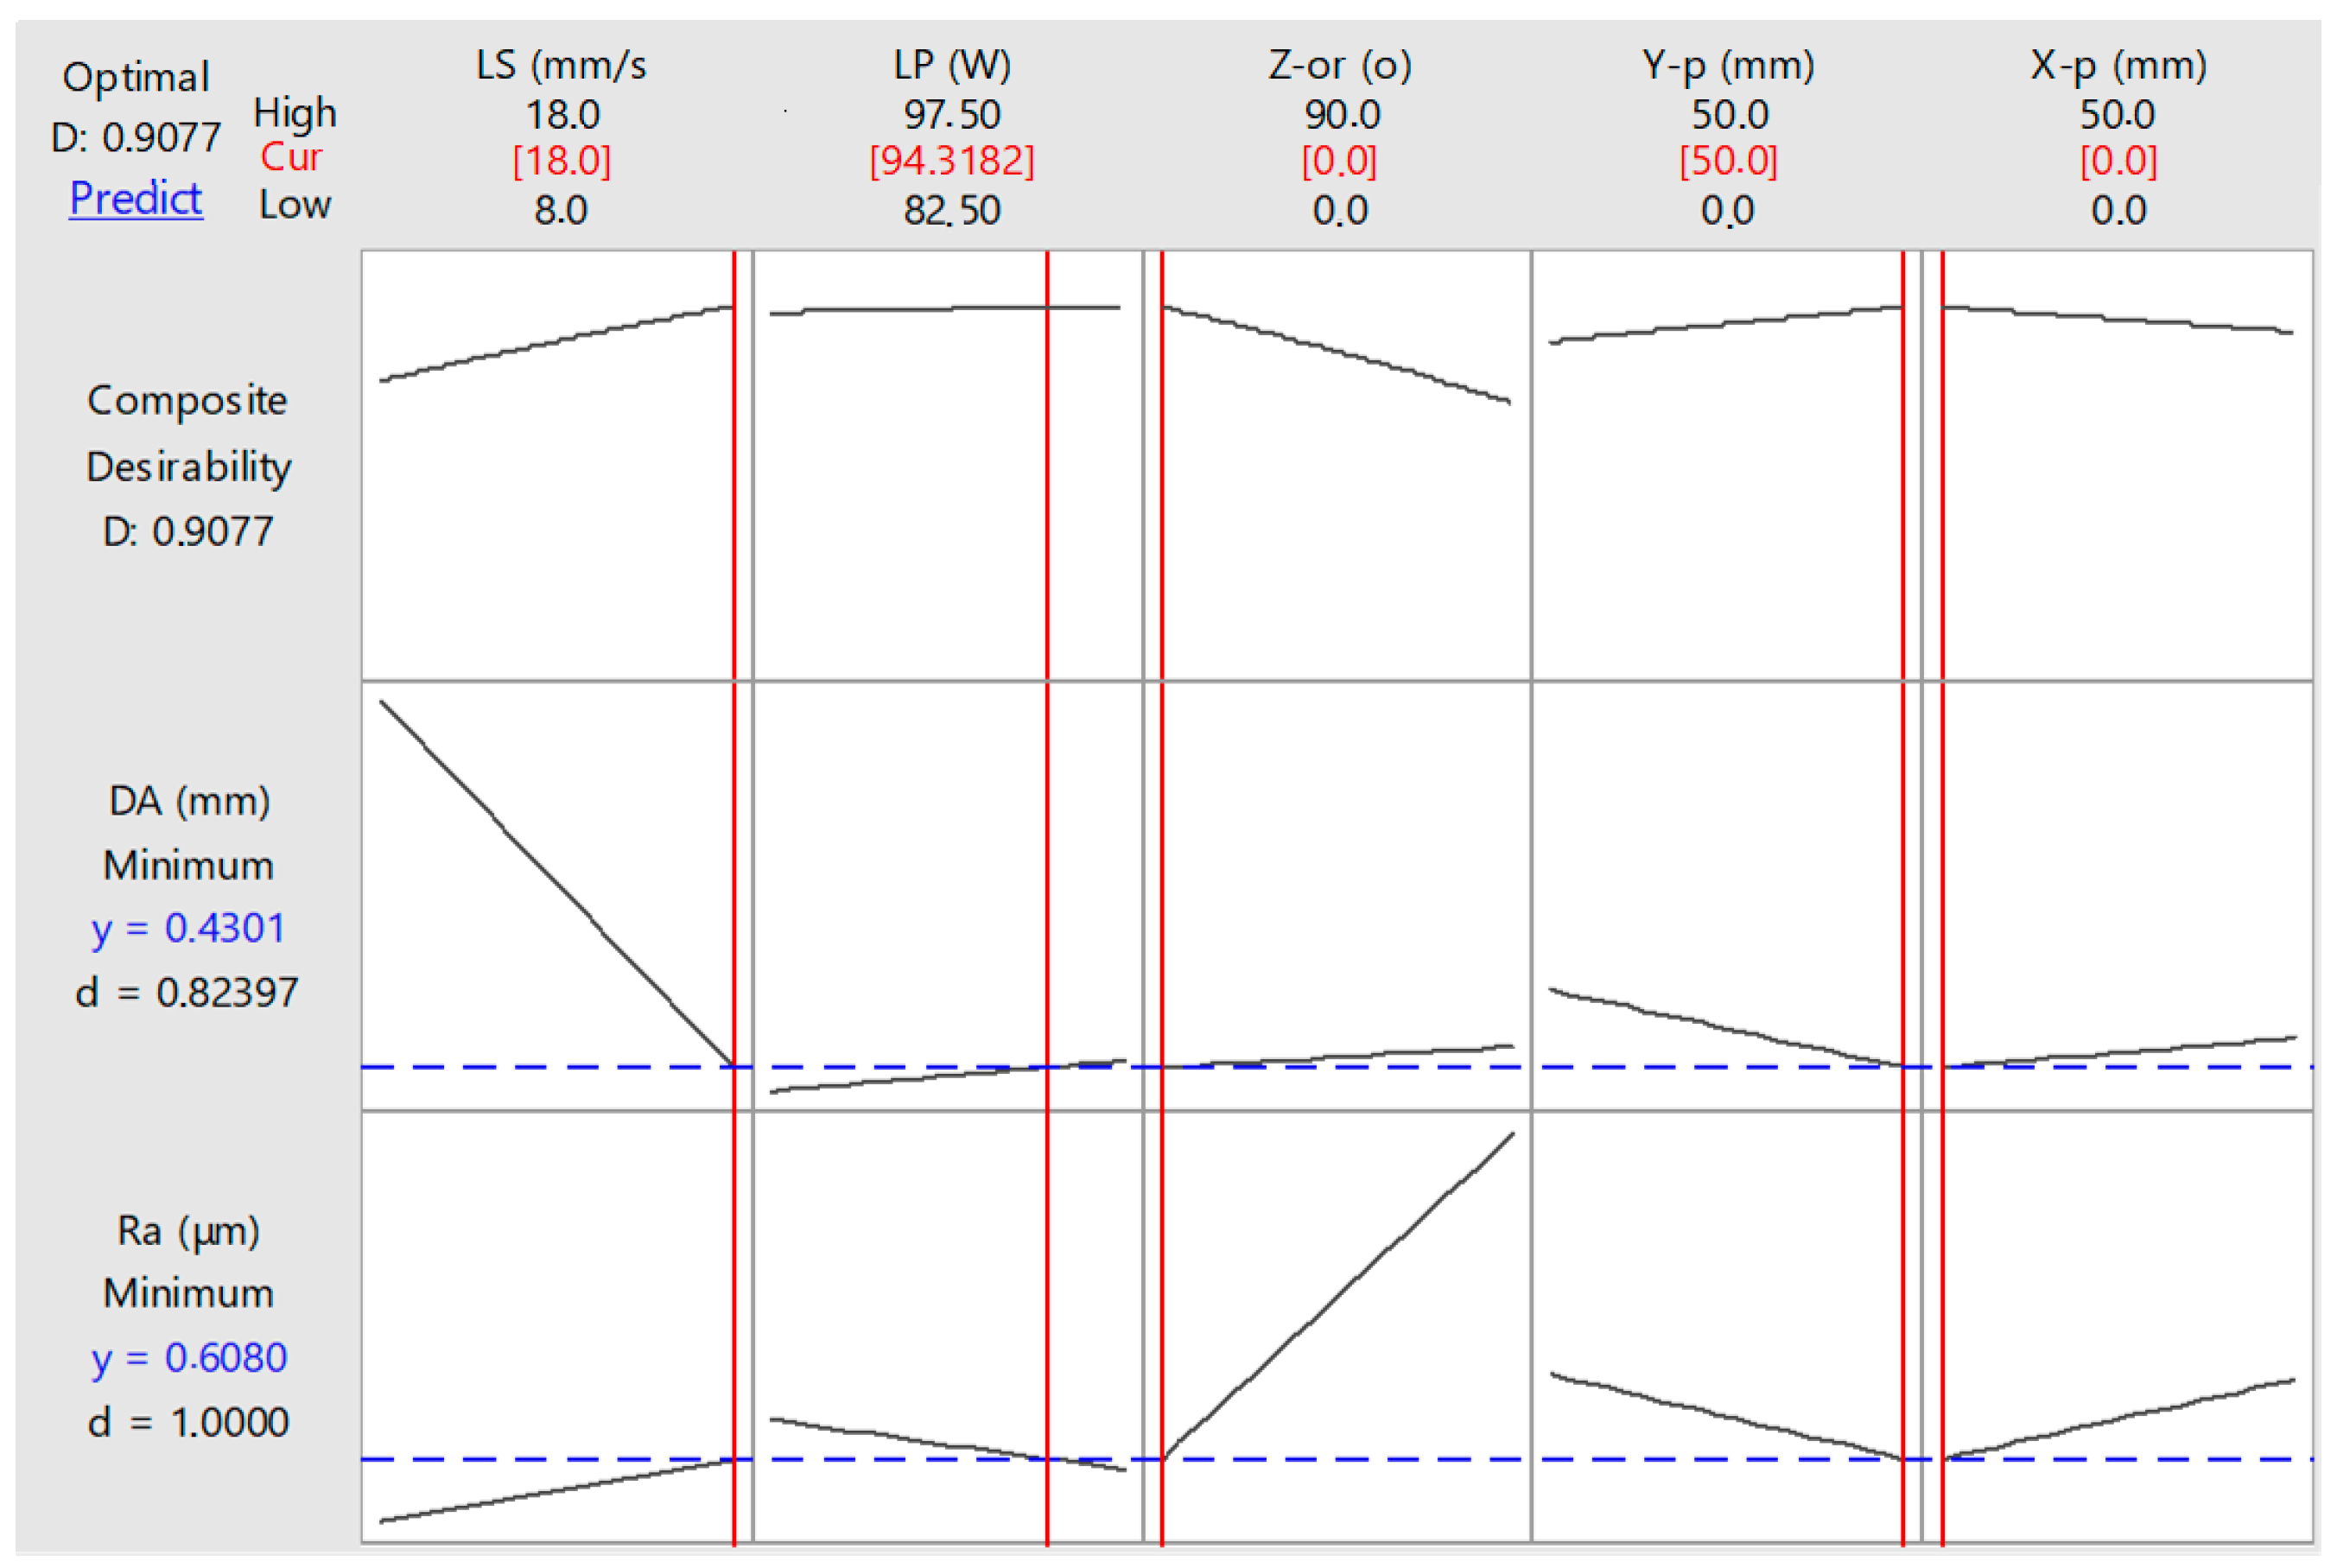
The multi-parameter multi-objective optimisation plots can also be derived using the mathematical Equations (2) and (3); see
Figure 7. These plots show that the following settings, LS of 18 mm/s, LP of 94.31 W, Z orientation of 0°, Y position of 50 mm, and X position of 0 mm, minimise the average surface roughness (Ra = 0.608 μm) and the dimensional accuracy (DA = 0.4301 mm).
An evaluation experiment was undertaken using the above parameters optimal values, and the measured, 0.397 mm DA-actual and 0.602 μm Ra-actual, were better than the predicted values, 0.952 mm DA-predicted and 0.611 μm Ra-predicted. This observation confirms that the linear models are appropriate for optimisation purposes but not for predictions in the proposed experimental range, which is evident by the low values of R- sq(pred) of the ANOVA analysis (48.52% DA, 75.22% Ra).
4. Conclusions
Following the above ANOM plots, interaction plots, and the ANOVA analysis, it is safe to conclude that the laser cutting of a PMMA material can be optimised according to the LS, LP, X-p, Y-p, and Z-or of the cut surface. The LS and the Z-or affect the Ra the most. The laser head movement guided by step motors and belts causes vibrations that affect the Ra. Moreover, the LS and the X-p impact the DA of the cut specimens.
The LS is vital for both the Ra and the DA and should be considered a critical factor in every case. The LS impacts most the Ra (32.1%) and the DA (46.7%). The LP is insignificant for Ra and DA, 1.1% and 0.2%, respectively (F < 2). The Z-or is highly significant for the Ra (32.9%) and insignificant for the DA (0.3%). The Y-p is moderately significant for the Ra (2 < F < 4) and insignificant for the DA (F < 2). Finally, the position of the specimens in the X-p is moderately significant for the Ra (2 < F < 4) and significant for the DA (F > 4).
The Interaction charts illustrated that the relation between the LS and all the other parameters are intricate (synergistic or anti-synergistic), which indicates that strong interactions occur between them. The Ra values are affected by the LS and the Z-or and are all in the range of 0.61 and 5.03 μm. These Ra values are similar to those of Chen et al. [
13] and lower than of Khoshaim et al. [
14]. The DA values are affected by the LS and the X-p and are all between 0.29 and 1.07 mm. According to the multi-parameter multi-objective optimisation plot (
Figure 7), the optimum parameter’s values are LS 18 mm/s, LP 94.31 W, Z-or 90°, Y-p 50 mm, and X-p 0 mm. When the LS increases, the Ra increases as well, while the DA decreases.
Finally, in this work, the gas pressure was not investigated and kept constant. Although the current study resulted in accurate Ra values, about 0.6 μm, the authors intend to study gas pressure in a future study. The authors also propose a multi-parameter multi-objective optimisation of the laser cutting process based on neural network modelling and genetic algorithms for more precise control of the laser cutting process.


_Kechagias.jpg)


