Article

Optimization of Laser Engraving of Acrylic Plastics from the Perspective of Energy Consumption, CO2 Emission and Removal Rate

by
Mohammad Muhshin Aziz Khan
1,
Shanta Saha
1,
Luca Romoli
2,* and
Mehedi Hasan Kibria
1
1
Department of Industrial and Production Engineering, Shahjalal University of Science and Technology, Sylhet 3114, Bangladesh
2
Department of Engineering and Architecture, University of Parma, 43124 Parma, Italy
*
Author to whom correspondence should be addressed.
J. Manuf. Mater. Process. 2021, 5(3), 78; https://0-doi-org.brum.beds.ac.uk/10.3390/jmmp5030078
Submission received: 10 June 2021 / Revised: 9 July 2021 / Accepted: 13 July 2021 / Published: 15 July 2021

Abstract

:
This paper focuses on optimizing the laser engraving of acrylic plastics to reduce energy consumption and CO2 gas emissions, without hindering the production and material removal rates. In this context, the role of laser engraving parameters on energy consumption, CO2 gas emissions, production rate, and material removal rate was first experimentally investigated. Grey–Taguchi approach was then used to identify an optimal set of process parameters meeting the goal. The scan gap was the most significant factor affecting energy consumption, CO2 gas emissions, and production rate, whereas, compared to other factors, its impact on material removal rate (MRR) was relatively lower. Moreover, the defocal length had a negligible impact on the response variables taken into consideration. With this laser-process-material combination, to achieve the desired goal, the laser must be focused on the surface, and laser power, scanning speed, and scan gap must be set at 44 W, 300 mm/s, and 0.065 mm, respectively.

1. Introduction

Manufacturing plays a crucial role in the modern global economy, characterized as the main engine of fast growth over half a century ago [1]. As manufacturing industries are continually facing economic challenges due to rising global competition, improving productivity is critical for their survival. Hence, with the pace of market demand, manufacturing activities are increasing, which correspondingly creates a severe impact on world energy consumption (EC). The manufacturing industry consumes one-third of global energy and is responsible for 36% of CO2 emissions [2]. The exigency of energy for the manufacturing industry is far higher than other sectors, such as building and transportation. There is an estimation that, by the year 2040, the energy need of this sector will increase by about 33% [3]. Electrical energy is the form of energy commonly used in the product manufacturing process as it is associated with different types of machine tools. This electrical power consumption is the most significant source of greenhouse gas (GHG) emission. More particularly, CO2, accounting for almost 60% of the greenhouse effect [4], is at the top of the global agenda. Electricity generation mainly instigates this environmental impact from burning carbon-rich fuel [5]. Thus, electrical energy consumption in manufacturing leaves a carbon emission signature and has attracted worldwide attention to enhance environmental sustainability. Moreover, the increased energy prices with resource scarcity and global council pressures are driving the industry towards an environmentally conscious trade strategy [6]. It is, therefore, essential for manufacturing organizations to create sustainable manufacturing solutions to protect the environment, intensify energy security, and raise the economy. Understanding and illustrating the energy consumption in manufacturing can be critical in promoting the industrial sector and resolving environmental problems [7].
As the machine tool is an essential tool for product manufacturing, energy consumption in manufacturing is substantial and should be analyzed and reduced to lessen the carbon footprint. However, this EC reduction effort should not compromise the productivity of the manufacturing processes involved in the production. In this context, manufacturers have always been concerned with finding optimal solutions for their manufacturing processes. Many researchers, therefore, have carried out their studies to optimize the machining parameters addressing the EC reduction. Wang [8] optimized the process parameters for energy consumption based on the Numerical Control (NC) code. For the same purpose in [9], Hanafi et al. optimized cutting speed, feed, and depth of cut for dry machining. Chen et al. [10] presented a cutting parameter optimization technique for milling operations to maximize energy utilization. Parameter optimization for energy consumption reduction of the machining chain process was also found to be fruitful [11,12]. Furthermore, several studies have been done on energy consumption for machining [13], metal forming [14], injection molding [15] and additive printing process [16]. Moreover, several researchers have studied energy breakdown analysis in some laser-based manufacturing [17,18,19]. Primarily for machining, some EC model and estimation procedures and energy-efficiency increasing methods have also been presented in [20,21,22,23]. Warsi et al. [24] studied specific energy consumption for high-speed machining by providing an energy plan for production efficiency improvement. Other than these, the influence of tool wear [25], feed rate and speed [26], and product quality [27] on EC was carried out. Some researchers also focused on comparing different technologies, considering energy, environmental, and cost issues. Lunetto et al. [28] introduced a comparative life-cycle assessment (LCA) method to choose the best technology for manufacturing a product comparing conventional milling with an additive manufacturing technology such as electron beam melting (EBM), and its subsequent finish machining. Their study considered CO2 emission, cumulative energy demand, and cost matrices for comparison purposes. Furthermore, Tagliaferri et al. [29] illustrated that additive manufacturing technologies differed substantially in production cost and eco-compatibility of each manufacturing technology. Finally, Anderson et al. [30] performed an economic analysis for laser-assisted machining of Inconel 718 and found its significant benefit over conventional ones with ceramic and carbide inserts. However, extremely few studies were found using multi-objective optimization. For instance, with the goal of energy consumption reduction, cutting force minimization in face milling [31] and tool life enhancement for turning [32] were considered.
Taguchi method is widely applied either individually or in combination with different meta-heuristic techniques such as ANN [30,33], GA, CSA to optimize different machining processes. This method requires no mathematical model and is generally famous for the design of experiments and multi-objective optimization. Additionally, the Grey relation theory can handle both incomplete information and unclear problems extremely precisely. Sharma et al. [34] conducted experiments based on the Taguchi concept for parameter optimization of Nd:YAG laser cutting. Kasman [35] investigated laser micro-milling on the AISI H13 tool steel. The most influencing factor was found to be scan speed for both surface roughness and milling depth. Chen et al. [36] also adopted the Taguchi method for optimizing such micro-engraving parameters as beam expansion ratio, focal length, laser power, pulse repetition rate, and engraving speed. The experiment was conducted by the Nd:YAG laser on the coated glass. Argade and Arakerimath [37] applied the Taguchi method combined with Grey relational grade analysis to optimize the process parameters (cutting speed, laser power, and gas pressure) for CO2 laser cutting of stainless steel. Moreover, an analysis of variance (ANOVA) was used to study the effect of reference parameters on responses (kerf width and surface roughness). Campanelli et al. [38] employed Taguchi optimization for Nd:YAG laser ablation process parameters such as laser speed, focus, power, and the number of removed layers intending to obtain the desired workpiece surface roughness. Çaydaş and Hasçalık [39] studied the effect of laser power and cutting speed on surface roughness, kerf width, and width of the heat-affected zone using Grey relational analysis. Francesco et al. [40] employed an artificial neural network approach to determine an optimal set of the laser bending parameters, e.g., scan speed, laser power, and number of scans, to produce the desired bend angle and minimize the processing time.
The literature shows that the manufacturing sector consumes a third of global energy, contributing substantially to environmental pollution, mainly through CO2 gas emissions. Hence, reducing energy consumption in manufacturing is crucial to enhancing environmental sustainability. Optimizing the process parameters is an effective way to minimize energy consumption and CO2 gas emissions and simultaneously maximize the process performance characteristics. However, extremely few studies try to optimize the process parameters to reduce energy consumption and simultaneously improve process performance using multi-objective optimization techniques. The combined Grey–Taguchi approach can potentially optimize various manufacturing processes. Moreover, many studies have been found to report on theoretical and experimental aspects of CO2 laser-based micromachining of Polymethylmethacrylate (PMMA) [41,42,43,44,45,46], which is a widely adopted technique for industrial marking. However, no systematic studies concurrently examine the effect of laser engraving parameters on energy consumption, CO2 gas emissions, production rate, and material removal rate, and optimize the process parameters to minimize energy consumption and CO2 gas emissions and maximize the production and material removal rates. Therefore, this study uses the Grey–Taguchi approach to optimize laser engraving of Polymethylmethacrylate (PMMA) to reduce energy consumption and CO2 gas emissions, and simultaneously increase the production and material removal rates. This study focuses on:
  • examining the effect of laser engraving process parameters, e.g., laser power, scanning speed, scan gap, and defocus distance on the response variables such as energy consumption, CO2 gas emissions, production rate, and material removal rate (MRR); and
  • identifying the optimal set of laser engraving process parameters using the Grey–Taguchi approach that would minimize energy consumption and CO2 gas emissions and maximize the production and material removal rates.

2. Materials and Methods

2.1. Material

PMMA, an amorphous polymer that combines exceptionally high optical properties (transparency, protection from UV radiation, etc.) and good machinability (shaped in foils or extruded in bars), is frequently used in industrial environments. Moreover, laser marking is frequently practiced on PMMA to engrave logos, or for esthetical reasons, and to provide tailored functionalities to the material, e.g., hydrophobicity, antifog, variation of the optical coefficient, etc. Moreover, laser marking accounts for more than 75% of the laser sources market, representing a remarkable industrial scenario for laser-based manufacturing. Hence, in this experimental study, an acrylic sheet made of polymethylmethacrylate (PMMA) with a transmittance of 92%, a tensile strength of 75 MPa, and a thermal expansion coefficient of 70 × 10−6/K was used for engraving purposes.
Unlike laser cutting-through or drilling, CO2 laser engraving has the scope to remove only a few microns from the bulk material, the thickness of the foil does not have a remarkable effect on the laser engraving, and hence, this process can be applied to any size and thickness. In this study, the sample selected had a dimension of 95 mm × 90 mm × 2 mm. Workpieces of PMMA were engraved on the laser engraving machine according to a specially designed geometry under different process parameters.

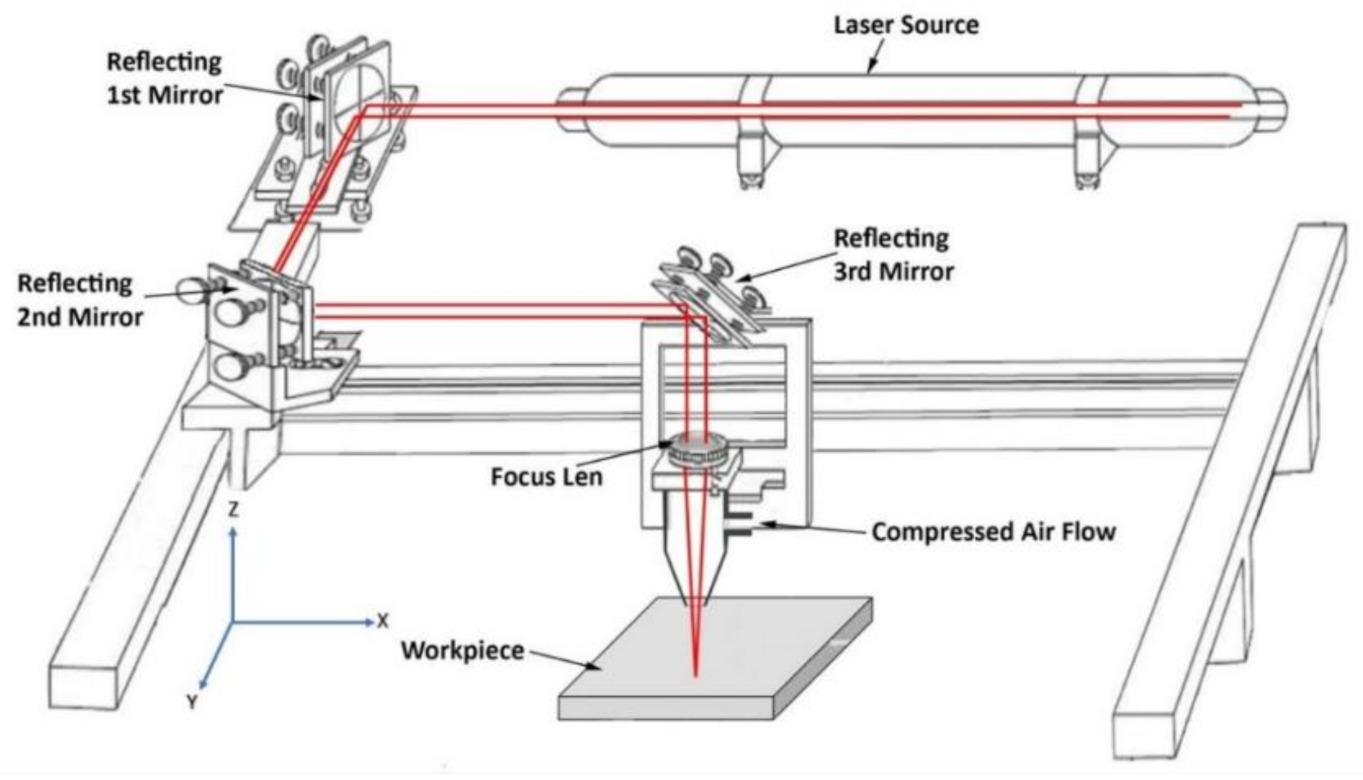
2.2. Experimental Details

PMMA, being a low-cost polymer, offers a high absorption of nearly 95% for the far-infrared frequencies (10.64 µm) and its interaction with CO2 radiation has the capability to obtain high quality machined surfaces as their interaction immediately leads to the development of volatile monomers (MMA) without any chemical degradation. Hence, this study performed engraving tests using a commercially designed CNC CO2 laser machine (BODOR BCL 1006, Jinan, China). The machine works with a fundamental wavelength of 10.6 μm and runs with a maximum power of 80 W in CW mode. The schematic of the laser-assisted engraving setup is shown in Figure 1. This setup used a beam expander to enlarge the laser beam diameter and the mirror set to reflect the expanded beam into the laser head. Moreover, the focal lens in the head was used to focus the beam onto the PMMA surface. Compressed air flow was used to protect the laser head lens from excessive heat-up and prevent vapor igniting. PMMA sheet was placed on the Z platform. The beam was focused perpendicularly onto the upper sheet surface by 8 mm focal distance lens into a minimum spot diameter of 55 µm. The choice of the focal length of 8 mm was driven by the need to find a trade-off point between the concurrent needs of having a small spot diameter, with a consequent higher energy density, and having better beam quality with lower divergence. Furthermore, an 8 mm focal length from the workpiece reduced the risk of contaminating the optics by vapors or melt drops evolving from the working area. The laser head position was controlled by a linear motor along the X-Y axis, and the laser head manually adjusts the amount of defocus length in the Z-direction.
The laser engraving was controlled using a computer-engaging laser engraving cutting software RD Works V8.0, where the designed shape was generated. The engraving process was then started by connecting the laser system to the computer and then importing the designed image (Figure 2) from the rdl file into the software, where the image converts into grayscale. After that, the laser speed, power, and scan gap were configured, and the print design was sent to the laser system for engraving. The engraved 3D object depicted in Figure 2 was used as a target objective to engrave onto the polymer and has a maximum length, width, and depth of 90 mm, 85 mm, and 1.45 mm, respectively. It is worth mentioning that these are the officially recognized standard dimensions of the university logo engraved while making souvenirs. Hence, the dimensions selected are not linked with the limitation of laser engraving machining.

2.3. Experimental Design

During experimentation, laser power, scanning speed, scan gap, and defocal length were considered as control factors taking energy consumption, machining time, and material removal rate as response variables. Control factors were selected based on the industrially recommended laser engraving parameters used in various industries. In order to determine the operating range of each of the input parameters, initial trial runs were conducted based on a one-at-a-time approach, i.e., one of the process parameters was varied, keeping others constant. A roughness value lower than or equal to 1.5 µm of the surface thus produced was considered as a surface quality criterion to select the operating range of each of the input parameters. To design the experimental plan, Taguchi L9 orthogonal array was used. Therefore, nine unique sets of combinations were generated, and laser engraving trials were carried out in a random order to avoid systematic error.
The parameters, along with the levels, are summarized in Table 1. The laser power level was set to 25%, 40%, and 55% of maximum power 80 W resulting in its designed level of 20 W, 32 W, and 44 W. The planned laser power, scanning speed (300 mm/s, 350 mm/s, 400 mm/s), and scan gap (0.035 mm, 0.050 mm, and 0.065 mm) were synchronized in software for the designated machining trials. It is worth noting that the scan gap, the distance between adjacent hatches on the PMMA substrate, directly influences the surface roughness, imposing the distance between adjacent crests and valleys. The higher is the value; the higher is the resulting roughness compared to the lower processing times. However, if two adjacent passes are even partially superimposed, the energy delivered to the bulk material may degrade the polymer. Thus, the range of the scan gap variation was intentionally selected to avoid this significant drawback.
In this study, to adjust the defocus distance, a calibrator of 8 mm height was first placed on the workpiece to obtain the focal point where the defocus distance equals zero (0). The nozzle position was then moved to 2.65 mm up and below the focal point to obtain the defocus distance of +2.65 mm and −2.65 mm, respectively. It is worth mentioning that according to laser propagation theory, defocusing is limited to a distance called Rayleigh length (zR), for which the area of the beam cross-section is doubled. For the experimental setup used, the boundaries of the Rayleigh length corresponded to ±2.65 mm from the focal point.
In this study, the quantity of electrical energy consumption by the different parts of laser engraving machine such as light, air pump, exhaust fan, water chiller, stepper motor and drive, laser device, etc., was measured using the smart 80 A single-phase energy meter (Model: UEM80-2D M, Class 1 according to EN 62053-21) and summed to calculate the total energy required to make a piece of product. The amount of CO2 emission corresponds to the total electric energy consumption for each experiment was estimated using the latest Grid Emission Factor of Bangladesh, which is about 0.67 ton CO2/MWh. The laser interaction with PMMA was not considered in this study as source of CO2 emission for the following reasons: as stated in paragraph 2.2, CO2 radiation emitting at 10.64 µm generated an almost pure vaporization process on PMMA (polymer chains broken into volatile monomers with no degradation or local combustion); the CO2 footprint of the laser/matter interaction is negligible with respect to that generated to produce the electrical energy to be used by the laser setup. The hourly production rate was calculated from the counted machining time that elapsed to complete the sample’s engraving process following the particular design. For each experiment, the mass of samples was measured before and after the engraving. Each sample was weighed three times using a precision weighing machine (Model: i2000) with an accuracy of 0.01 g, and the mean value of mass (m) removed was divided by the density (ρ) of PMMA (1.19 g/cm3) to calculate the volume of material removed, as shown in Equation (1). Finally, MRR (mm3/s) was calculated based on the resulted volume and machining time. During experimentation, the 3D object was engraved in a single pass. Each set of experiments was carried out three times to ensure repeatability and traceability of the results. Finally, the mean value of each measured response was calculated and used in the analysis. The designed set of experiments and measured response variables are shown in Table 2.
V = m / ρ

2.4. Optimization Procedure: Grey Relational Analysis

Grey relational analysis (GRA) is one of the most widely used Grey system theory models pioneered by Deng (1986). The main advantage of GRA is its suitability for solving problems with incomplete and insufficient information. Nonetheless, the GRA method is capable of handling multiple quality characteristics of multiple input parameters. Optimization of the multiple responses can be performed using this technique by determining the optimum level of responses. The sequence of the GRA calculation is detailed below.

2.4.1. Data Normalizing

In the Grey–Taguchi method, the measured value of responses is initially converted into the same scale within the range of 0 to 1. This conversion is called data normalizing or Grey relational generation, which is done to avoid adopting different units and thus reducing the variability. This approach of normalizing is employed by two different equations depending on the desired quality characteristics.
If the expectancy is the smaller, the better, then it is expressed by Equation (2).
x i k = m a x   y i k y i k m a x   y i k m i n   y i k
If the expectancy is the larger, the better, then it is expressed by Equation (3)
x i k = y i k m i n   y i k m a x   y i k m i n   y i k
where i = 1, 2, …, m, k = 1, 2, …, n, m is the number of the experimental run, n is the number of response variables, x i k denotes the sequence of any response after data normalizing for the ith experimental run, y i k represents the initial sequence of the respective response.

2.4.2. Computation of Grey Relational Co-Efficient (GRC)

The normalized data are then utilized to compute the sequence of deviation of the normalized sequence using Equation (4).
Δ 0 i k = x 0 k x i k
Here, Δ 0 i is the absolute deviation between the reference sequence x 0 k and comparability sequence x i k . The GRC value is then determined using Equation (5). GRC value establishes a relation between the original experimental value and the corresponding normalized value:
ξ i k = Δ m i n   + ζ Δ m a x Δ 0 i k + ζ Δ m a x
where ξ i k indicates the GRC of a specific response. Thus, GRC is calculated as a function of Δ m i n   ,   Δ m a x ,   and Δ 0 i . Δ m i n   and Δ m a x are the lowest and the highest deviation of each response factor indicated in Equations (6) and (7), respectively. ζ is the distinguishing coefficient which is assigned in the range ζ 0 ,   1 . Usually, ζ value is set at 0.5 to give identical weights and stability to each variable.
Δ m i n = m i n i . m i n k . Δ 0 i k
Δ m a x = m a x i . m a x k . Δ 0 i k

2.4.3. Grey Relational Grade (GRG) Analysis

The GRG value reveals the level of correlation between the reference sequence and the comparability sequence. Therefore, it states the relational order of experimental runs. The higher value of GRG indicates a better combination of multi-performance characteristics by the respective run and vice-versa. GRG is computed by averaging the GRC values, as shown in Equation (8)
γ i = 1 n i = 1 n ξ i k
where γ i signifies the GRG value for the ith experiment.

3. Results and Discussion

3.1. Measurement of Arithmetic Average Surface Roughness

Firstly, surface roughness was considered as a measure of surface quality. Nine samples were cut by the same laser, each of which was 10 mm × 10 mm in dimension and made of acrylic plastic. Samples were then laser engraved to remove a layer of material from the whole surface for each combination of the control parameters shown in Table 2. The measurements of arithmetic surface roughness on a line profile were done accordingly to ISO 4287:1997 (Geometrical Product Specifications (GPS)—Surface texture: Profile method—Terms, definitions, and surface texture parameters). Considering a cut-off distance of 0.8 mm, which is expected to detect all the required surface asperities (ISO 4287:1997) at a level of surface finishing, the total measured length used was 8 mm (5 cut-off lengths plus 4 mm extra overtravel distance). A Surtronic 25 (Roughness Checker, Taylor Hobson, UK) with a resolution of 0.01 µm was used to measure the roughness of the laser-engraved surface. For each sample, the arithmetic average roughness Ra was measured five times in the direction of the beam scanning trajectory and another five times in its perpendicular direction. As shown in Table 3, the roughness data obtained from each sample were averaged and used to characterize the machined surface quality: Ra is directly influenced by laser power and inversely by the scan speed.
Negative values of defocus generate smoother surfaces, while positive defocus (with the laser spot placed inside the thickness of the specimen) worsens the quality. As for the scan gap, its influence must be normalized to the spot diameter of 0.055 mm; flanking of grooves produces lower roughness while superimposing them has the opposite behavior. As a result, the combination of all these effects can hardly be defined by theoretical models using an a priori approach. Therefore, taking into account that the preliminary tests have overall shown values of Ra lower than 1.5 µm, the parameters range adopted in this study was deemed to be adequate for a good surface finish of the laser engraving of the logo depicted in Figure 2. Moreover, this Ra value corresponds to the average value in the range of a generic surface finishing roughness for chip removal processes according to [47]. For obtaining Ra values lower than 1 µm, multiple superimposed passes at lower power would be needed. Then, the total energy consumption, depending on the switch-on time of the laser, should be calculated by multiplying the energy consumption for a single pass for the number of needed passes to obtain the removal. This strategy would result in a less effective vaporization process as the energy loss to overcome the material threshold would be higher due to reflective phenomena; the subsequent passes do not find a perpendicular smooth surface as it happens at the first pass, and a not negligible amount of energy is not absorbed and is then not useful for the vaporization process [48].

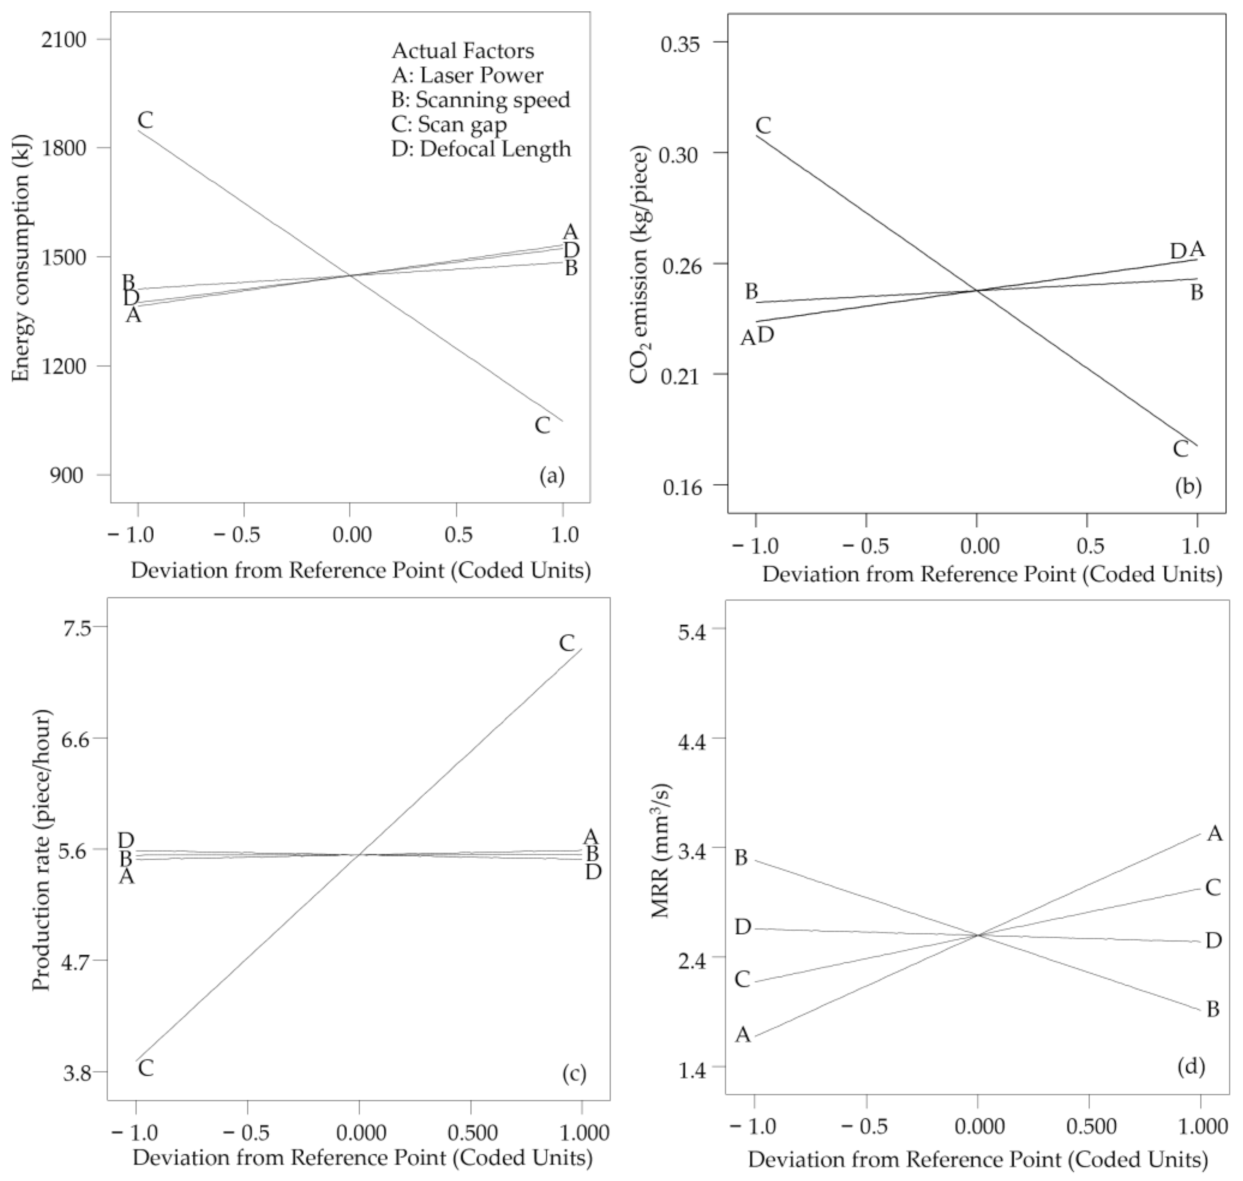
3.2. Comparative Parametric Effects on Response Variables

Figure 3a–d depicts the perturbation plots to compare all input factors’ effects on an individual response variable at the center point in the design space. The figures show that the scan gap has the most significant negative impact on energy consumption and CO2 emission, whereas the opposite phenomenon is observed on the production rate and material removal rate (MRR). Figure 3a–c illustrates that laser power, scanning speed, and defocus distance have minor effects on energy consumption and CO2 emission. Though the laser power is the prominent parameter ruling the removal process during the marking operation, the energy release to the material may be mitigated by increasing the scan speed (lower incident time), the defocusing distance (lower energy density), and the scan hatch distance (scan gap). Hence, this result might be due to the combined effect of multiple concurrent parameters used to determine the laser marking of adequate quality at lower processing times and reduced CO2 emission. However, from Figure 3d, it is evident that laser power and scanning speed have the most significant positive and negative impacts on MRR, as similarly evidenced in the laser engraving of metals [49].
As stated previously, the results confirmed that all the process variables contributed in the definition of the surface roughness so that, as also observed in [50], the concurrent effects are difficult to be discerned. Concerning the achieved roughness values ranging around the reference of 1.5 µm, they are aligned to those obtainable with similar texturing strategies based on the flanking of parallel grooves [48].
The energy consumption is significantly influenced by the scan gap since lower values need a higher number of scanned lines. Overall, the energy consumption for removing 1 kg of PMMA by CO2 laser marking varies in the range of 105–106 J/kg which is comparable to other laser-based processing of polymers, as reported in [51].

3.3. Laser Engraving Parameter Optimization

The optimization problem for this study can be conventionally presented as:
Minimizeenergy consumption, CO2 emission
Maximizeproduction rate, MRR
Subjected to 20 P 44
300 S 400
0.035 G 0.065
2.65 L 2.65
In this study, Grey rational analysis (GRA) is employed to solve this optimization problem. The original response data were transformed (or normalized) using the smaller, better criteria expressed by Equation (2) for energy consumption and GHG emission. For production rate and MRR, on the other hand, a higher value is desired. Hence, Equation (3) is applied to normalize the production rate and MRR data. After normalizing, the responses’ reference sequence was between 0 to 1, as presented in Table 4. The deviation sequences were computed by using Equation (4) and included in Table 5. The Grey rational coefficient (GRC) for each value of the responses was then determined by Equation (5). Lastly, the mean of the GRCs was calculated to figure out the value of Grey rational grade (GRG) for each run. These GRG values were used to establish run orders. Calculated values of GRC of each response and GRG of each experimental run along with its respective order are given in Table 6. From this table, it is noticeable that the highest (0.99) and the lowest (0.36) GRG values are found for experiment numbers 7 and 8, respectively. Accordingly, experiment numbers 7 and 8 have been ranked as order 1 and 9, respectively, indicating that experiment number 7 is the optimum result for the studied engraving process. It means that the laser engraving process carried out at laser power of 44 W, scanning speed of 300 mm/s, scan gap of 0.065 mm, and defocal length of 0 mm would minimize energy consumption and GHG emission and maximize production rate and MRR.
Once the order was ascertained, the average GRG was computed by summing all GRG values for a particular input factor level and dividing it by the number of experiments counted. All the average GRG values were thus calculated and shown in Table 7. The difference between the highest and the lowest average GRG values was also calculated and given in the same table under ‘Delta’. This delta value serves as a correlation measure between the reference sequence and comparability sequence. It provides the relative importance of each factor on a response, i.e., a higher value of average GRG indicates a stronger correlation between a specific input factor and response variables under consideration. Thus, the input factors were ranked in ascending order of average GRG values. From Table 7, it is apparent that the scan gap, an input factor ranked as 1, shows the highest level of significance on the GRG, i.e., combinedly, this factor has the most significant effect on all the response variables. Similarly, scanning speed and defocus distance length are the second and third critical process input parameters that significantly affect the responses. The laser power, holding rank 4, has the lowest impact on the responses.
Furthermore, the Grey–Taguchi approach was integrated to obtain the optimum level of process input factors. According to this integrated approach, the highest level of each factor shown in Table 7 is considered optimal. As can be seen from the table, the maximum average Grey relational grades exist at level 3 of laser power (44 W), level 1 of scanning speed (300 mm/s), level 3 of scan gap (0.065 mm), and level 2 of defocus distance (0 mm). Hence, this is considered the optimum combination of the laser engraving input parameters to minimize the energy consumption and machining time and maximize the MRR.

4. Conclusions

For the laser system, machining process used, and limits of the laser engraving process parameters considered in this study, the conclusions that can be drawn are as follows:
  • Scan gap is the most significant factor affecting energy consumption, CO2 gas emissions, and production rate, whereas other factors, e.g., laser power, scanning speed, and defocal length, have little impact on them.
  • With the increase in scan gap, energy consumption and the consequent emissions of CO2 gas to engrave an image on the acrylic polymer noticeably decrease, and its production rate, on the other hand, increases significantly.
  • Laser scanning speed and laser power are the most significant factors affecting the material removal rate, whereas the scan gap’s impact is relatively lower.
  • The material removal rate substantially increases and decreases with laser power and scanning speed, respectively.
  • As compared to the other factors considered in this study, the defocal length has the most negligible impact on energy consumption, CO2 gas emission, production rate, and MRR.
  • The Grey–Taguchi approach has the potential for determining the optimal set of the laser engraving process parameters. With this laser-process-material combination, process parameters such as laser power, scanning speed, and scan gap must be 44 W, 300 mm/s, and 0.065 mm, respectively, to ensure the lowest energy consumption and CO2 gas emissions, and the highest production and material removal rates provided that the laser must be focused on the surface.
  • The technique employed in this study can be used to make any manufacturing process more energy and environment sustainable, as process optimization is found to reduce its energy consumption with a consequent decrease in CO2 emission to the environment without hindering its production rate.
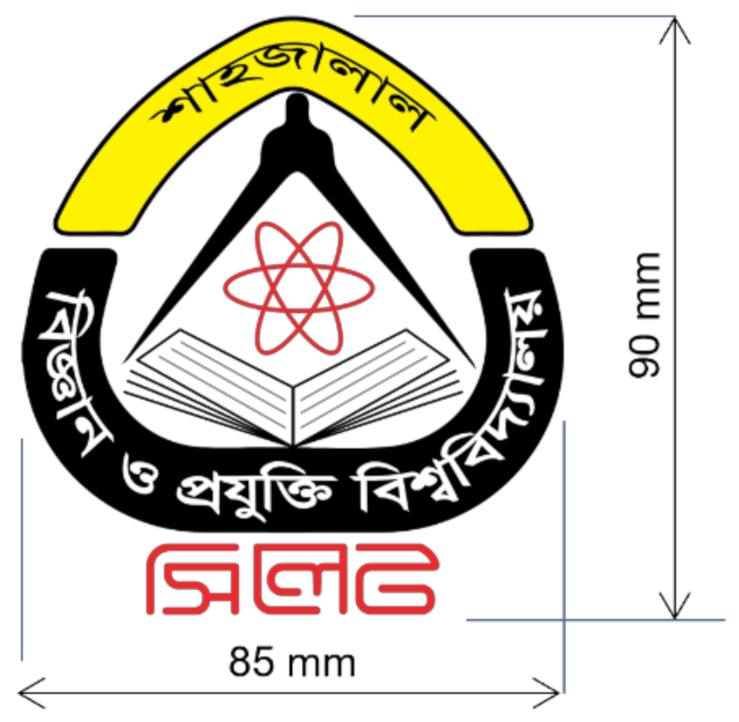
  • This study used bitmap image to engrave a logo onto the PMMA substrate where the laser beam burns the pixels row by row in the bitmap. However, for marking or scoring the material surface better, surface, a vector engraving technique where the laser beam follows the path of vector strokes without cutting all the way through can be used in future.

Author Contributions

M.M.A.K. and S.S. contributed to the study conception and experimental design. M.H.K. performed experiments. M.M.A.K., S.S. and L.R. analyzed the data and wrote the first draft of the manuscript. All authors commented on previous versions of the manuscript. All authors have read and agreed to the published version of the manuscript.

Funding

This research received funding from the University Research Center, Shahjalal University of Science and Technology (project code: AS/2020/1/46).

Data Availability Statement

The data presented in this study are available on request from the corresponding author. The data are not publicly available due to the confidential agreement with the funding Institution.

Acknowledgments

The authors would like to acknowledge the University Research Center, Shahjalal University of Science and Technology for providing financial support (project code: AS/2020/1/46). The help extended by the machine operators during the experimental investigation is also sincerely acknowledged.

Conflicts of Interest

The authors declare no conflict of interest.

References

  1. Haraguchi, N.; Cheng, C.F.C.; Smeets, E. The Importance of Manufacturing Econ. Development: Has This Changed? World Dev. 2017, 93, 293–315. [Google Scholar] [CrossRef]
  2. International Energy Agency. Tracking Industrial Energy Efficiency and CO2 Emissions; OECD: Paris, France, 2007. [Google Scholar]
  3. International Energy Outlook. 2013; p. 312. Available online: https://www.eia.gov/outlooks/ieo/pdf/0484(2013).pdf (accessed on 10 June 2021).
  4. Akbostancı, E.; Tunç, G.İ.; Türüt-Aşık, S. CO2 emissions of Turkish manufacturing industry: A decomposition analysis. Appl. Energy 2011, 88, 2273–2278. [Google Scholar] [CrossRef]
  5. Dornfeld, D. Leveraging Manufacturing for a Sustainable Future. In Glocalized Solutions for Sustainability in Manufacturing; Hesselbach, J., Herrmann, C., Eds.; Springer: Berlin/Heidelberg, Germany, 2011; pp. 17–21. [Google Scholar]
  6. Jovane, F.; Yoshikawa, H.; Alting, L.; Boër, C.R.; Westkamper, E.; Williams, D.; Tseng, M.; Seliger, G.; Paci, A.M. The incoming global technological and industrial revolution towards competitive sustainable manufacturing. CIRP Ann. 2008, 57, 641–659. [Google Scholar] [CrossRef]
  7. Li, Y.; Lu, H.; Daniel, W.J.T.; Meehan, P.A. Investigation and optimization of deformation energy and geometric accuracy in the incremental sheet forming process using response surface methodology. Int. J. Adv. Manuf. Technol. 2015, 79, 2041–2055. [Google Scholar] [CrossRef]
  8. Wang, Z. Optimization calculation of reverse energy consumption based on feature parameter of NC code. Int. J. Adv. Manuf. Technol. 2017, 93, 3437–3448. [Google Scholar] [CrossRef]
  9. Hanafi, I.; Khamlichi, A.; Cabrera, F.M.; Almansa, E.; Jabbouri, A. Optimization of cutting conditions for sustainable machining of PEEK-CF30 using TiN tools. J. Clean. Prod. 2012, 33, 1–9. [Google Scholar] [CrossRef]
  10. Chen, X.; Li, C.; Jin, Y.; Li, L. Optimization of cutting parameters with a sustainable consideration of electrical energy and embodied energy of materials. Int. J. Adv. Manuf. Technol. 2018, 96, 775–788. [Google Scholar] [CrossRef] [Green Version]
  11. Rentsch, R.; Karpuschewski, B. Energy and Resource efficiency analysis of manufacturing chains by modular process models and simulation. Procedia Manuf. 2020, 43, 159–166. [Google Scholar] [CrossRef]
  12. Rentsch Rüdiger Heinzel, C.; Brinksmeier, E. Artificial Intelligence for an Energy and Resource Efficient Manufacturing Chain Design and Operation. Procedia CIRP 2015, 33, 139–144. [Google Scholar] [CrossRef] [Green Version]
  13. Zhao, G.Y.; Liu, Z.Y.; He, Y.; Cao, H.J.; Guo, Y.B. Energy consumption in machining: Classification, prediction, and reduction strategy. Energy 2017, 133, 142–157. [Google Scholar] [CrossRef]
  14. Ingarao, G.; Di Lorenzo, R.; Micari, F. Sustainability issues in sheet metal forming processes: An overview. J. Clean. Prod. 2011, 19, 337–347. [Google Scholar] [CrossRef]
  15. Matarrese, P.; Fontana, A.; Sorlini, M.; Diviani, L.; Specht, I.; Maggi, A. Estimating energy consumption of injection moulding for environmental-driven mould design. J. Clean. Prod. 2017, 168, 1505–1512. [Google Scholar] [CrossRef]
  16. Rahimifard, S.; Seow, Y.; Childs, T. Minimising Embodied Product Energy to support energy efficient manufacturing. CIRP Ann. 2010, 59, 25–28. [Google Scholar] [CrossRef]
  17. Baumers, M.; Tuck, C.; Bourell, D.L.; Sreenivasan, R.; Hague, R. Sustainability of additive manufacturing: Measuring the energy consumption of the laser sintering process. Proc. Inst. Mech. Eng. Part B J. Eng. Manuf. 2011, 225, 2228–2239. [Google Scholar] [CrossRef]
  18. Kellens, K.; Rodrigues, G.C.; Dewulf, W.; Duflou, J.R. Energy and Resource Efficiency of Laser Cutting Processes. Phys. Procedia 2014, 56, 854–864. [Google Scholar] [CrossRef] [Green Version]
  19. Paul, R.; Anand, S. Process energy analysis and optimization in selective laser sintering. J. Manuf. Syst. 2012, 31, 429–437. [Google Scholar] [CrossRef]
  20. Dietmair, A.; Verl, A.; Eberspaecher, P. Model-based energy consumption optimisation in manufacturing system and machine control. Int. J. Manuf. Res. 2011, 6, 380. [Google Scholar] [CrossRef]
  21. Duflou, J.R.; Sutherland, J.W.; Dornfeld, D.; Herrmann, C.; Jeswiet, J.; Kara, S.; Hauschild, M.; Kellens, K. Towards energy and resource efficient manufacturing: A processes and systems approach. CIRP Ann. 2012, 61, 587–609. [Google Scholar] [CrossRef] [Green Version]
  22. Rief, M.; Karpuschewski, B.; Kalhöfer, E. Evaluation and modeling of the energy demand during machining. CIRP J. Manuf. Sci. Technol. 2017, 19, 62–71. [Google Scholar] [CrossRef]
  23. Wang, Q.; Zhang, D.; Tang, K.; Zhang, Y. Energy consumption model for milling processes considering auxiliary load loss and its applications. Int. J. Adv. Manuf. Technol. 2019, 105, 4309–4323. [Google Scholar] [CrossRef]
  24. Warsi, S.S.; Jaffery, S.H.I.; Ahmad, R.; Khan, M.; Agha, M.H.; Ali, L. Development and analysis of energy consumption map for high-speed machining of Al 6061-T6 alloy. Int. J. Adv. Manuf. Technol. 2018, 96, 91–102. [Google Scholar] [CrossRef]
  25. Shi, K.N.; Zhang, D.H.; Liu, N.; Wang, S.B.; Ren, J.X.; Wang, S.L. A novel energy consumption model for milling process considering tool wear progression. J. Clean. Prod. 2018, 184, 152–159. [Google Scholar] [CrossRef]
  26. Diaz, N.; Choi, S.; Helu, M.; Chen, Y.; Jayanathan, S.; Yasui, Y.; Kong, D.; Pavanaskar, S.; Dornfeld, D. Machine Tool Design and Operation Strategies for Green Manufacturing. In Proceedings of the 4th CIRP International Conference on High Performance Cutting, Gifu, Japan, 24–26 October 2010. [Google Scholar]
  27. Guo, Y.; Loenders, J.; Duflou, J.; Lauwers, B. Optimization of Energy Consumption and Surface Quality in Finish Turning. Procedia CIRP 2010, 1, 512–517. [Google Scholar] [CrossRef]
  28. Lunetto, V.; Priarone, P.C.; Kara, S.; Settineri, L. A comparative LCA method for environmentally friendly manufacturing: Additive manufacturing versus Machining case. Procedia CIRP 2021, 98, 406–411. [Google Scholar] [CrossRef]
  29. Tagliaferri, V.; Trovalusci, F.; Guarino, S.; Venettacci, S. Environmental and Economic Analysis of FDM, SLS and MJF Additive Manufacturing Technologies. Materials 2019, 12, 4161. [Google Scholar] [CrossRef] [Green Version]
  30. Anderson, M.; Patwa, R.; Shin, Y.C. Laser-assisted machining of Inconel 718 with an economic analysis. Int. J. Mach. Tools Manuf. 2006, 46, 1879–1891. [Google Scholar] [CrossRef]
  31. Wang, Y.-C.; Kim, D.-W.; Katayama, H.; Hsueh, W.-C. Optimization of machining economics and energy consumption in face milling operations. Int. J. Adv. Manuf. Technol. 2018, 99, 2093–2100. [Google Scholar] [CrossRef]
  32. Bhushan, R.K. Optimization of cutting parameters for minimizing power consumption and maximizing tool life during machining of Al alloy SiC particle composites. J. Clean. Prod. 2013, 39, 242–254. [Google Scholar] [CrossRef]
  33. Madić, M.; Radovanović, M.; Trajanović, M.; Manić, M. Multi-objective Optimization of Laser Cutting Using Cuckoo Search Algorithm. J. Eng. Sci. Technol. 2015, 10, 12. [Google Scholar]
  34. Sharma, A.; Yadava, V.; Rao, R. Optimization of kerf quality characteristics during Nd: YAG laser cutting of nickel based superalloy sheet for straight and curved cut profiles. Opt. Lasers Eng. 2010, 48, 915–925. [Google Scholar] [CrossRef]
  35. Kasman, Ş. Impact of parameters on the process response: A Taguchi orthogonal analysis for laser engraving. Measurement 2013, 46, 2577–2584. [Google Scholar] [CrossRef]
  36. Chen, Y.H.; Tam, S.C.; Zheng, H.Y. Application of the Taguchi method in the optimization of laser micro-engraving of photomasks. Int. J. Mater. Prod. Technol. 1996, 11, 333–344. [Google Scholar]
  37. Argade, P.V.; Arakerimath, R.R. Parametric Investigations on CO2 Laser Cutting of AISI 409 to Optimize Process Parameters by Taguchi method. Int. J. Eng. Trends Technol. 2016, 37, 311–316. [Google Scholar] [CrossRef]
  38. Campanelli, S.L.; Casalino, G.; Contuzzi, N.; Ludovico, A.D. Taguchi Optimization of the Surface Finish Obtained by Laser Ablation on Selective Laser Molten Steel Parts. Procedia CIRP 2013, 12, 462–467. [Google Scholar] [CrossRef]
  39. Çaydaş, U.; Hasçalık, A. Use of the grey relational analysis to determine optimum laser cutting parameters with multi-performance characteristics. Opt. Laser Technol. 2008, 40, 987–994. [Google Scholar] [CrossRef]
  40. Francesco, L.; DiIlio, A.; Paoletti, A. Optimization of Multi-pass Laser Bending by Means of Soft Computing Techniques. Procedia CIRP 2015, 33, 502–507. [Google Scholar]
  41. Genna, S.; Leone, C.; Lopresto, V.; Tagliaferri, V. An experimental study on the surface mechanisms formation during the laser milling of PMMA. Polym. Compos. 2015, 36, 1063–1071. [Google Scholar] [CrossRef]
  42. Klank, H.; Kutter, J.P.; Geschke, O. CO2-laser micromachining and back-end processing for rapid production of PMMA-based microfluidic systems. Lab. A Chip 2002, 2, 242–246. [Google Scholar] [CrossRef]
  43. Prakash, S.; Kumar, S. Experimental investigations and analytical modeling of multi-pass CO2 laser processing on PMMA. Precis. Eng. 2017, 49, 220–234. [Google Scholar] [CrossRef]
  44. Snakenborg, D.; Klank, H.; Kutter, J.P. Microstructure fabrication with a CO2 laser system. J. Micromechanics Microengineering 2003, 14, 182–189. [Google Scholar] [CrossRef]
  45. Sudarsono Gatut, Y.; Hasto, S.; Gontjang, P.; Diky, A.; Nurrisma, P.; Susilo, I.; Iim, F.; Yunus, A.R.; Yono, H. Design and fabrication of optical waveguide as directional coupler using laser cutting CO2 on acrylic substrate. J. Phys. Conf. Ser. 2019, 1153, 012100. [Google Scholar] [CrossRef]
  46. Yuan, D.; Das, S. Experimental and theoretical analysis of direct-write laser micromachining of polymethyl methacrylate by CO2 laser ablation. J. Appl. Phys. 2007, 101, 024901. [Google Scholar] [CrossRef]
  47. ASME/ANSI B46.1-1985 (Surface Texture); American Society of Mechanical Engineers: New York, NY, USA, 1985.
  48. Romoli, L.; Tantussi, G.; Dini, G. Experimental approach to the laser machining of PMMA substrates for the fabrication of microfluidic devices. Opt. Laser Eng. 2011, 49, 419–427. [Google Scholar] [CrossRef]
  49. Nikolidakis, E.; Choreftakis, I.; Antoniadis, A. Experimental Investigation of Stainless Steel SAE304 Laser Engraving Cutting Conditions. Machines 2018, 6, 40. [Google Scholar] [CrossRef] [Green Version]
  50. Leone, C.; Matarazzo, D.; Genna, S.; D’Addona, D.M. Cognitive approach for laser milled PMMA surface characteristics forecasting. Opt. Lasers Technol. 2019, 113, 225–233. [Google Scholar] [CrossRef]
  51. Franco, A.; Romoli, L. Characterization of laser energy consumption in sintering of polymer based powders. J. Mater. Process. Technol. 2012, 212, 917–926. [Google Scholar] [CrossRef]
Figure 1. Schematic diagram of the laser engraving system.
Jmmp 05 00078 g001
Figure 2. Designed image with the engraved 3D object.
Jmmp 05 00078 g002
Figure 3. Perturbation plot (a) Energy consumption (b) CO2 emission (c) Production rate (d) MRR.
Jmmp 05 00078 g003
Table 1. Laser Engraving Parameters.
ParametersNotationLevels
123
Laser power (W)P203244
Scanning speed (mm/s)S300350400
Scan gap (mm)G0.0350.050.065
Defocus distance (mm)D−2.650+2.65
Table 2. Design matrix with input factors and measured responses.
Exp. No.Control ParametersMeasured Responses
Laser Power (W)Scanning Speed (mm/s)Scan Gap (mm)Defocus Distance (mm)Energy Consumption,
kJ (±SD)
CO2
Emission, kg/piece (±SD)
Production Rate,
Hourly (±SD)
Material Removal Rate
mm3/s (±SD)
1.203000.0352.651822.31 (±23.8)0.31 (±0.004)3.88 (±0.052)1.87 (±0.024)
2.203500.0501443.92 (±18.9)0.24 (±0.003)5.62 (±0.078)1.74 (±0.022)
3.204000.065−2.65944.46 (±12.3)0.16 (±0.002)7.23 (±0.094)1.47 (±0.019)
4.323000.05−2.651255.74 (±16.4)0.21 (±0.002)5.55 (±0.062)2.98 (±0.039)
5.323500.0652.651230.60 (±16.1)0.21 (±0.002)7.29 (±0.086)2.57 (±0.033)
6.324000.03501624.13 (±21.2)0.27 (±0.003)3.89 (±0.051)2.10 (±0.027)
7.443000.0650951.60 (±12.4)0.16 (±0.002)7.47 (±0.091)5.32 (±0.069)
8.443500.035−2.652084.56 (±27.3)0.35 (±0.004)3.93 (±0.051)2.83 (±0.037)
9.444000.052.651679.74 (±22.0)0.28 (±0.003)5.56 (±0.069)2.49 (±0.032)
Table 3. Design matrix with Input factors and surface roughness as quality measure.
Expt. No.Laser Power (W)Scanning Speed (mm/s)Scan Gap (mm)Defocus Length (mm)Surface Roughness Ra (µm) (±SD)
1203000.0352.651.19 (±0.014)
2203500.0500.69 (±0.008)
3204000.065−2.650.88 (±0.011)
4323000.05−2.650.53 (±0.006)
5323500.0652.650.63 (±0.007)
6324000.03501.36 (±0.016)
7443000.06501.07 (±0.012)
8443500.035−2.650.60 (±0.007)
9444000.052.650.92 (±0.011)
Table 4. Normalizing sequence of the responses.
Exp. No.Energy ConsumptionCO2 EmissionProduction RateMRR
1.0.230.230.000.10
2.0.560.560.480.07
3.1.001.000.930.00
4.0.730.730.460.39
5.0.750.750.950.29
6.0.400.400.000.16
7.0.990.991.001.00
8.0.000.000.010.35
9.0.360.360.470.27
Table 5. Deviation sequence of the response.
Exp. No.Energy ConsumptionCO2 EmissionProduction RateMRR
1.0.770.771.000.90
2.0.440.440.520.93
3.0.000.000.071.00
4.0.270.270.540.61
5.0.250.250.050.71
6.0.600.601.000.84
7.0.010.010.000.00
8.1.001.000.990.65
9.0.640.640.530.73
Table 6. Grey relational co-efficient and Grey relational grade.
Exp. No.Grey Relational CoefficientGrey Relational Grade
Energy ConsumptionCO2 EmissionProduction RateMRRMagnitudeOrder
1.0.390.390.330.360.378
2.0.530.530.490.350.485
3.1.001.000.880.330.802
4.0.650.650.480.450.564
5.0.670.670.910.410.663
6.0.460.460.330.370.417
7.0.990.991.001.000.991
8.0.330.330.340.440.369
9.0.440.440.480.410.446
Table 7. Response table of average GRG.
ParametersLevel 1Level 2Level 3DeltaRank
Laser power0.550.540.600.064
Scanning speed0.640.500.550.142
Scan gap0.380.490.820.441
Defocus length0.490.630.570.133
Publisher’s Note: MDPI stays neutral with regard to jurisdictional claims in published maps and institutional affiliations.

