
An Experimental Study of the Cyclic Compression after Impact Behavior of CFRP Composites


German Aerospace Center, Institute for Composite Materials and Adaptive Systems, Lilienthalplatz 7, 38108 Braunschweig, Germany
*
Author to whom correspondence should be addressed.
J. Compos. Sci. 2021, 5(11), 296; https://0-doi-org.brum.beds.ac.uk/10.3390/jcs5110296
Submission received: 14 October 2021
/
Revised: 5 November 2021
/
Accepted: 8 November 2021
/
Published: 10 November 2021
(This article belongs to the Special Issue Carbon Fiber Composites)
Abstract
:The behavior of impact damaged composite laminates under cyclic load is crucial to achieve a damage tolerant design of composite structures. A sufficient residual strength has to be ensured throughout the entire structural service life. In this study, a set of 27 impacted coupon specimens is subjected to quasi-static and cyclic compression load. After long intervals without detectable damage growth, the specimens fail through the sudden lateral propagation of delamination and fiber kink bands within few load cycles. Ultrasonic inspections were used to reveal the damage size after certain cycle intervals. Through continuous dent depth measurements during the cyclic tests, the evolution of the dent visibility was monitored. These measurements revealed a relaxation of the indentation of up to 90% before ultimate failure occurs. Due to the distinct relaxation and the short growth interval before ultimate failure, this study confirms the no-growth design approach as the preferred method to account for the damage tolerance of stiffened, compression-loaded composite laminates.
1. Introduction
To achieve a damage tolerant composite structure, it is vital to consider the influence of damage on the fatigue behavior of fiber reinforced plastic (FRP) composites. Cyclic loading may propagate the initial damage, reduce the residual strength and decrease the fatigue life of a damaged laminate. However, the influence of the damage differs severely, depending on the initial damage type and the cyclic load case. The critical damage mode under compression load is typically delamination which permits sublaminates to buckle significantly reducing the laminate’s capability to sustain load [1,2,3]. As delamination is located inside the laminate and not visible on the surface, the tolerance of delamination damage is particularly challenging to achieve a damage tolerant design. A typical cause of delamination damage is the low-velocity impact [4,5], as impact threat usually cannot be completely avoided on aerospace structures [6]. Hence, ways and means to design an airworthy structure with the expected damage have to be established.
Damage Tolerance (DT) is the state of the art design philosophy to maintain the structural integrity of an aircraft structure [7]. DT requires taking the expected damage into account during the design. Briefly summarized, there are three admissible concepts which can be applied to approve the DT of aerospace composite structures: slow growth, arrested growth and no-growth [8,9,10]. These concepts define, that an accidental damage may either grow stably (slow growth) or must not grow at all (no-growth) before it can be discovered and repaired during a scheduled inspection. Arrested growth is the combination of both variants.
Among these admissible DT concept, a no-growth policy currently seems to be the only viable method to cope with delamination [11,12]. Pascoe stated in a recent overview article [13], that even though a slow-growth approach possibly could offer weight benefits, insufficient information of impact damage evolving under fatigue loading prevents an application of slow-growth design approaches.
A damage tolerant design is driven by the load sustaining capability of the damaged structure throughout a design interval. The respective design interval of load cycles is either defined through the scheduled interval of an inspection procedure or throughout the service life of the structural component. The damage size to be considered for each interval depends on the respective visibility of the impact damage. Depending on the inspection procedure, a certain surface dent depth is considered as detectable. The largest damage which cannot be detected within this procedure is assumed to remain in the laminate until an inspection with higher sensitivity. Thus, the design is driven by the load sustaining capability of the largest damage which could possibly remain in the structure over the design interval. The determination of the respective damage size is based on the visibility criterion of the damage. While this criterion is the crack length for metallic structures [14], the metric to assess the damage visibility within a visual inspection procedure is the remaining dent depth on the surface. If the dent depth exceeds a certain threshold, it is considered as detectable. This surface dent accompanies each the impact damage and is caused by resin debris preventing crack closure after the impact [15].
According to the compression after impact (CAI) standards [16,17,18] the dent depth is measured directly after the impact event. However, for the practical application dent relaxation has to be taken into account as the decrease of the dent depth could result in an underestimation of the damage. In the CMH-17 Vol.3, a relaxation between 30% and 70% is reported [19], depending on the time, the environmental exposure and the mechanical loading. There are hardly any experimental investigations available which quantify the influence of these factors. The figure in the CMH derive from a study by Michèle Thomas from 1994, where the dent depth relaxation due to aging, environmental exposure, and mechanical loading were analyzed in coupon experiments [20]. The dent decrease through mechanical load was found to be up to 75% for 200,000 tension/compression load cycles with a load ratio of and up to 32% for 200,000 compression/compression load cycles with a load ratio of . For load level under 50% of the static residual strength no relaxation was observed. Thomas proposed the relation in (1) for the maximum expectable relaxation, which considers the cumulative effects of time, aging and mechanical loading. The dent depth is the minimum achievable value through the mentioned relaxation effects. This minimum is assumed as a linear function of the initial dent depth after the impact . Further, Dubinskii et al. [21] studied the dent relaxation in stiffened panels, considering the influence of time and the environmental conditions. In their experimental analysis, a relaxation between 22% and 61% was reported for the investigated conditions.
Due to the limited detectability of delamination within the standard inspection procedures and the dent relaxation, the considerable damage for such residual strength approval is comparably large. Only a special detailed inspection method [22] or a structural health monitoring system [23,24] offer possibilities to detect smaller damage which cannot be discovered through visual inspection procedures.
In practical application, the no-growth requirement is realized through strain allowables, which may never be exceeded [25,26]. As outlined by Dienel et al. [27], aircraft manufacturers determine strain allowables “based on extensive experimental campaigns”. Such an experimental determination procedure for a DT strain allowable is based on residual strength tests after impact [28,29]. The operational load might further decrease the residual strength, due to fatigue and damage propagation effects. Hence, residual strength testing after cyclic loading is additionally required, as demanded in the AC 20-107B guidelines [8]. The corresponding behavior of impact-damaged composites under cyclic compression load is a topic which was studied over and over in the literature. An overview is presented in the review by Nettles et al. [30]. In 24 considered studies, hardly any delamination growth was observed before ultimate failure. If any growth was detected, it happened at high load levels and close to the ultimate collapse [12,31,32,33]. Only in few cases, a significant period of delamination growth before the collapse is reported [11,25,34,35]. In another review article, Molent and Haddad investigate various experimental damage growth studies from the literature. They conclude, that there are sufficient examples in the literature where a slow and stable damage growth behavior was proven to occur systematically. The combination of this knowledge about stable damage growth with a suitable prediction method would enable a damage tolerant design based on the slow growth approach. Nonetheless, as outlined by Pascoe [13], there are still unresolved challenges before a reliable prediction method could be established. These challenges concern the driving phenomena of the damage propagation, the final failure, and even the characterization of a detected impact damage during an inspection. Further, in contrast to metallic materials, the growth of delamination under cyclic loading in a composites comprises barely one order of magnitude in the SERR [1]. Thus, a small uncertainty in the load might severely change how a delamination evolves. These challenges keep the no-growth concept the only currently applicable design concept.
In this work, the authors describe an experimental investigation of the damage tolerance behavior of carbon fiber reinforced plastic (CFRP) coupon specimens under cyclic compression load. The investigation includes the fatigue life, the damage growth behavior, the residual strength properties and the damage visibility including the relaxation. For that purpose, a set of 30 standard CAI specimens is tested in the undamaged and the damaged condition. For the latter case, quasi-static and cyclic compression-compression load are aspects of the inquiry. Through ultrasonic inspection, 3D-scanning, dent measurements and cross section images the DT-relevant metrics throughout the cyclic loading are investigated.
2. Experimental Methods and Procedures
The test campaign for the present study consists of compression after impact experiments on the coupon level. From the set of 30 coupons, three were used to determine the quasistatic, undamaged reference strength. The 27 remaining specimens were impacted according to the CAI standard AITM 1.0010 [17] to achieve a barely visible impact damage (BVID). Afterwards, quasi-static CAI tests determine the residual strength and cyclic compression after impact (CCAI) tests are used for damage propagation analysis. According to the CAI standard, the specimens have in-plane dimensions of and a nominal thickness of mm which is achieved through the stacking sequence with a total of 32 plies. All specimens were manufactured from an IMA/M21e prepreg material with a nominal ply thickness of mm. The corresponding material properties are for example given in the article of Nezhad et al. [36] or Bogenfeld et al. [37].
2.1. Impact Tests
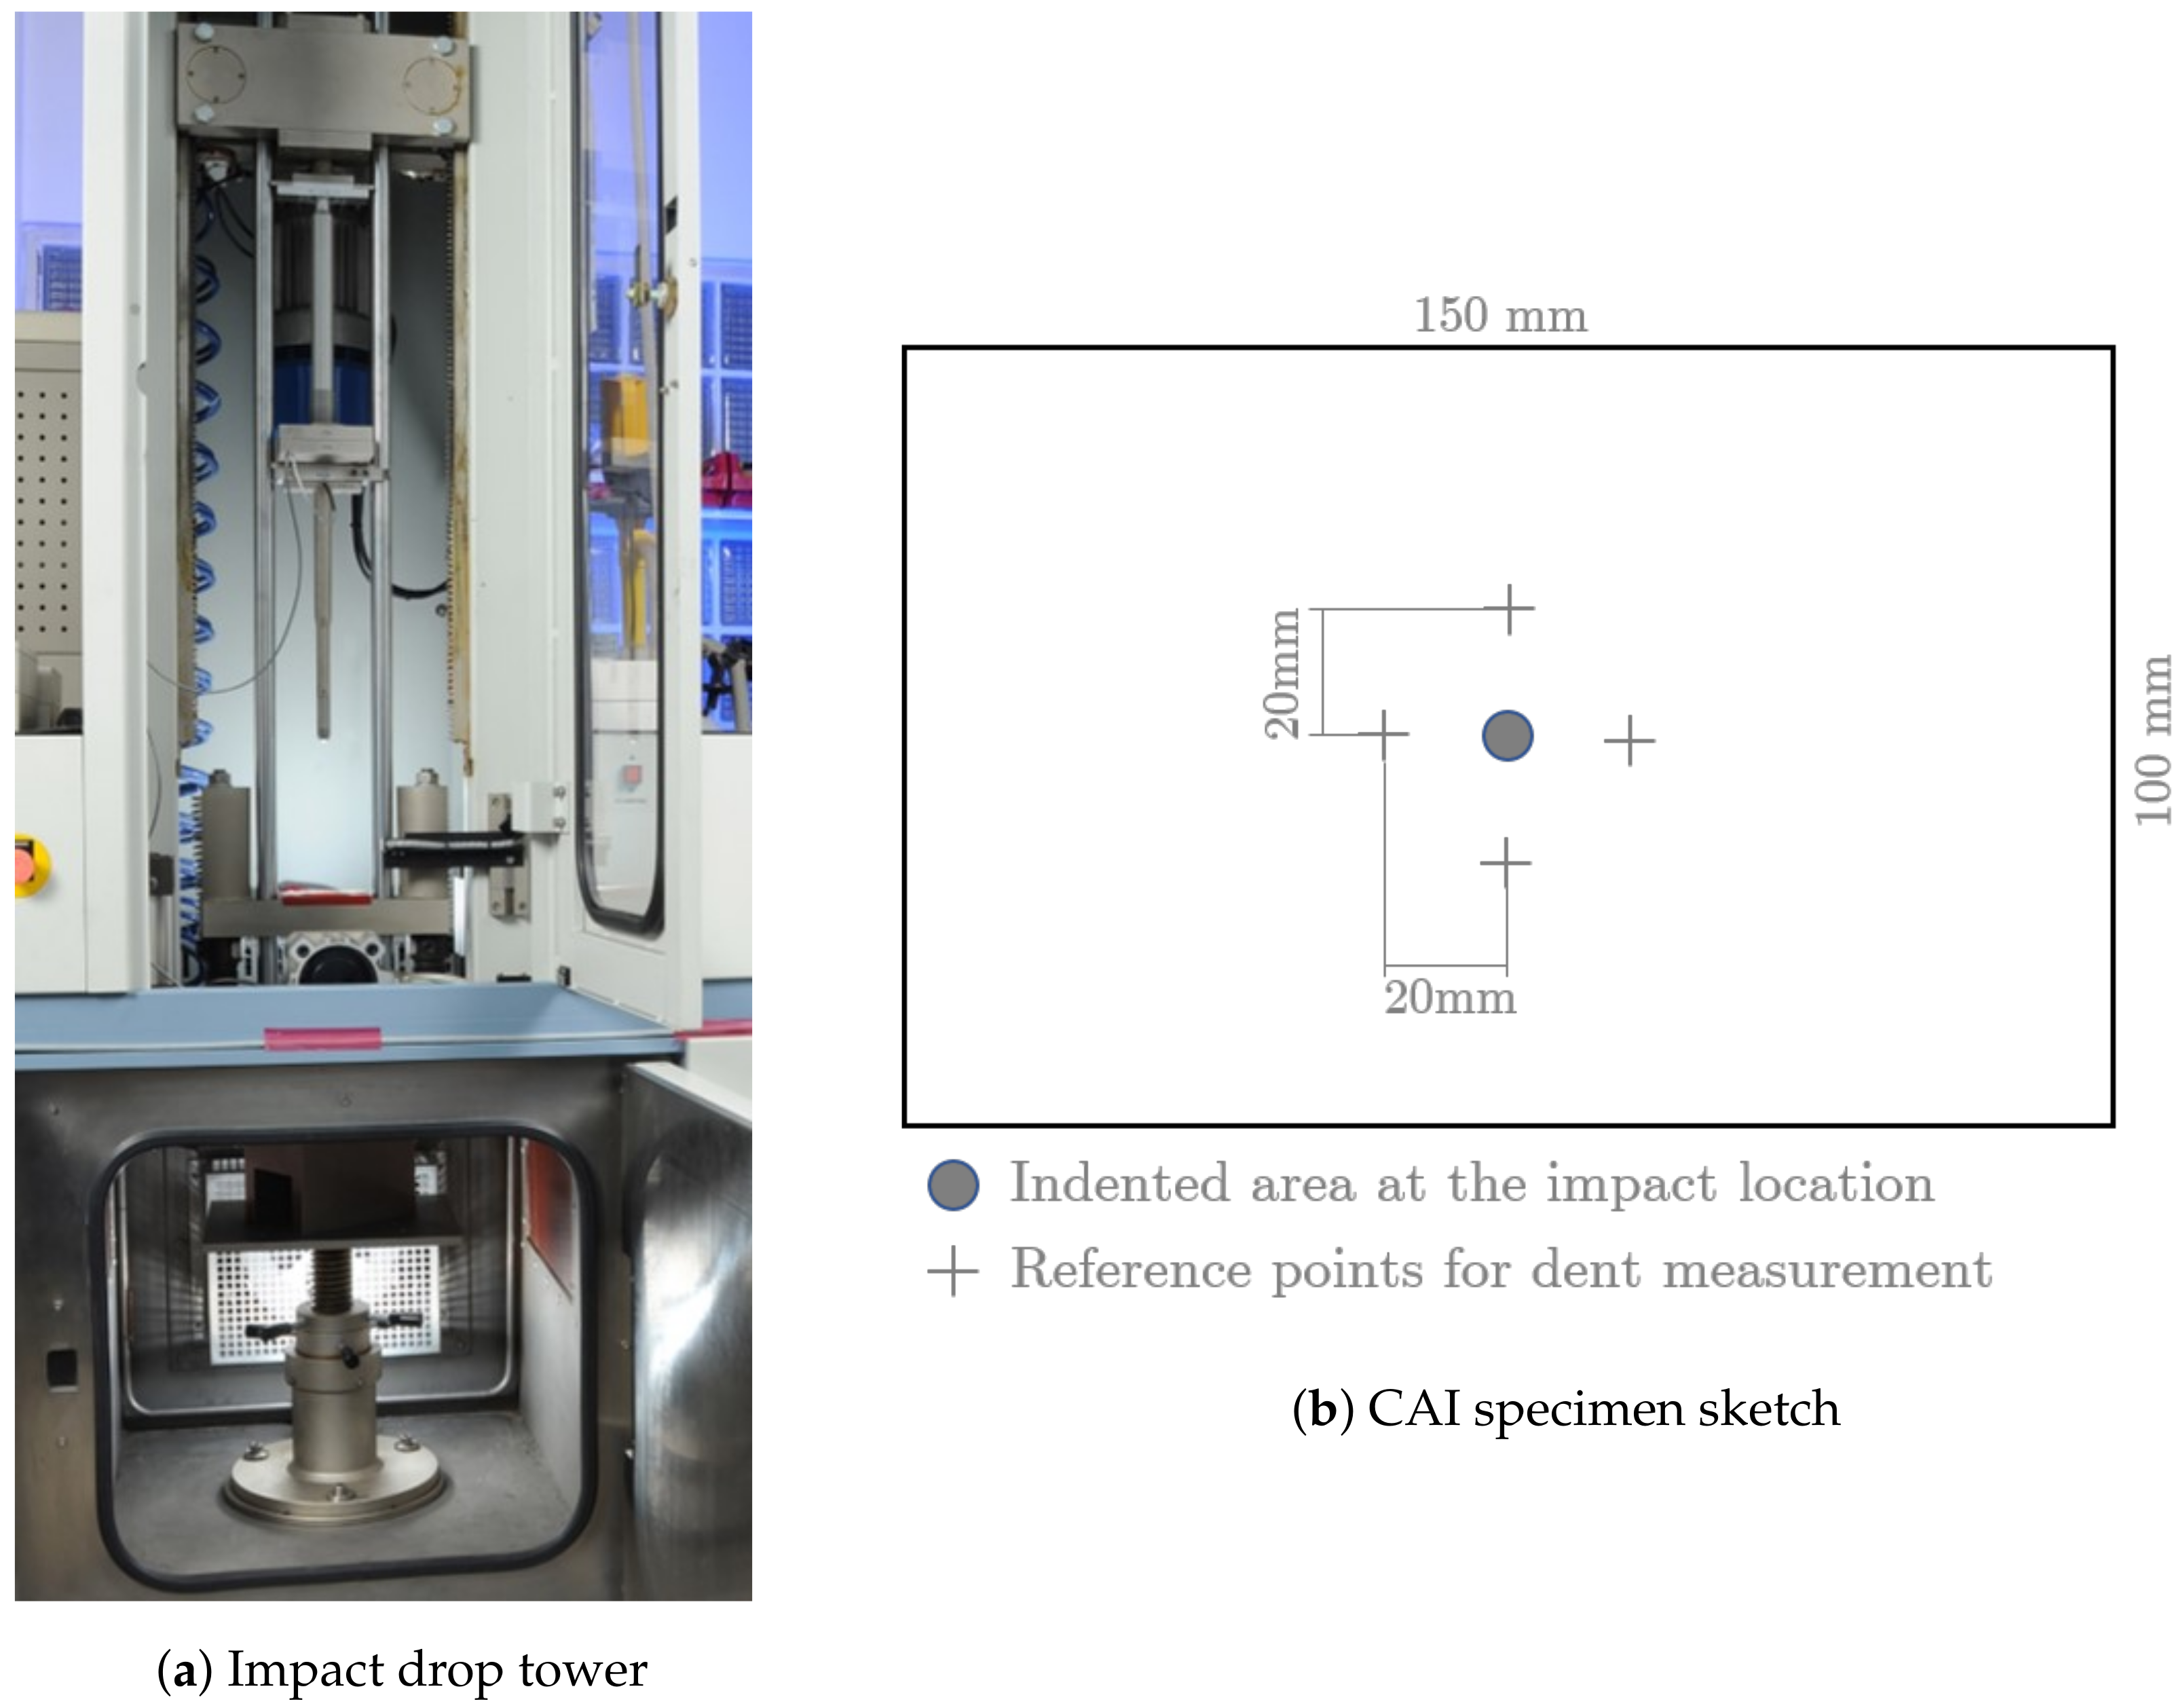
The primary subject of the test campaign is the damage evolution under cyclic compression load. For that aim, the results of the impact experiments are treated as initial conditions for the damage tolerance experiments after the impact. This section briefly describes the impact tests and the obtained results. All impact tests were conducted in a CEAST Fractovis impact drop tower as shown in Figure 1a. The impactor consisted of a hemispherical head with diameter of mm and a total drop weight of . The boundary conditions of the specimen fixture comply with the AITM standard, where the specimen is clamped on a frame with a cutout. A crucial part of the test procedure for this study is the measurement of the surface dent depth. Therefore, the impacted specimen is placed in a fixture and the surface is probed through a dial gauge. According to the standard, the maximum dent depth at the impact location is determined. Afterwards, the average dent depth at four reference points mm removed from the impact point is subtracted from the maximum value. The sketch in Figure 1b shows these measurement points. This procedure permits an accuracy of less than mm for repeated measuring of the same specimen.
The delamination damage is made visible through ultrasonic scanning. The ultrasonic scan was conducted in an immersion tank with an Olympus V309 ultrasonic transducer with a 5 MHz frequency and a focal length of 50 mm. The resulting D-scan provides detailed information about the delamination per interface and the C-Scan is the basis for the total damage envelope which is further referenced as the projected delamination area [38].
The impact energy level was determined through preliminary experiments in order to obtain a dent depth of mm. This dent threshold marks a DT-critical damage for the service life of an aerospace structure, as the value of mm defines the BVID limit for a damage which is likely to remain undetected in a detailed visual inspection [39,40]. An impact energy level of was found to correspond with the dent depth of mm. This energy level was used for all impacts in this study.
All specified impact parameters and the characteristic measurement values of the impact tests are provided in Table 1. While the delamination area shows a scatter of around ±20%, which is typical for delamination damage [41,42]. Also, the dent depth reveals a significant scatter which even increases after the relaxation. This effect can also observed in the measured dent depth by Dubinskii et al. [21]. The other characteristic values which derive from the force history curves, reveals only slight scattering.
A metric of particular interest is the dent depth after the time-dependent relaxation. The value of mm is 17% smaller than the value measured directly after the impact. This observation is in accordance with the 20% of dent relaxation reported by Thomas [20] and the relaxation of 22% reported by Dubinskii et al. [21]. Even though in both mentioned studies the relaxation was measured over a much longer time frame, in the present test series no further time-dependent relaxation was detected in measurements conducted after several days. Possible influence factors on the time-dependent relaxation velocity might be the damage size, the material and the stacking sequence of the laminate which we can deduce from the different relaxation behavior in reported in the studies by Dubinskii et al. [21] and Wagih et al. [43].
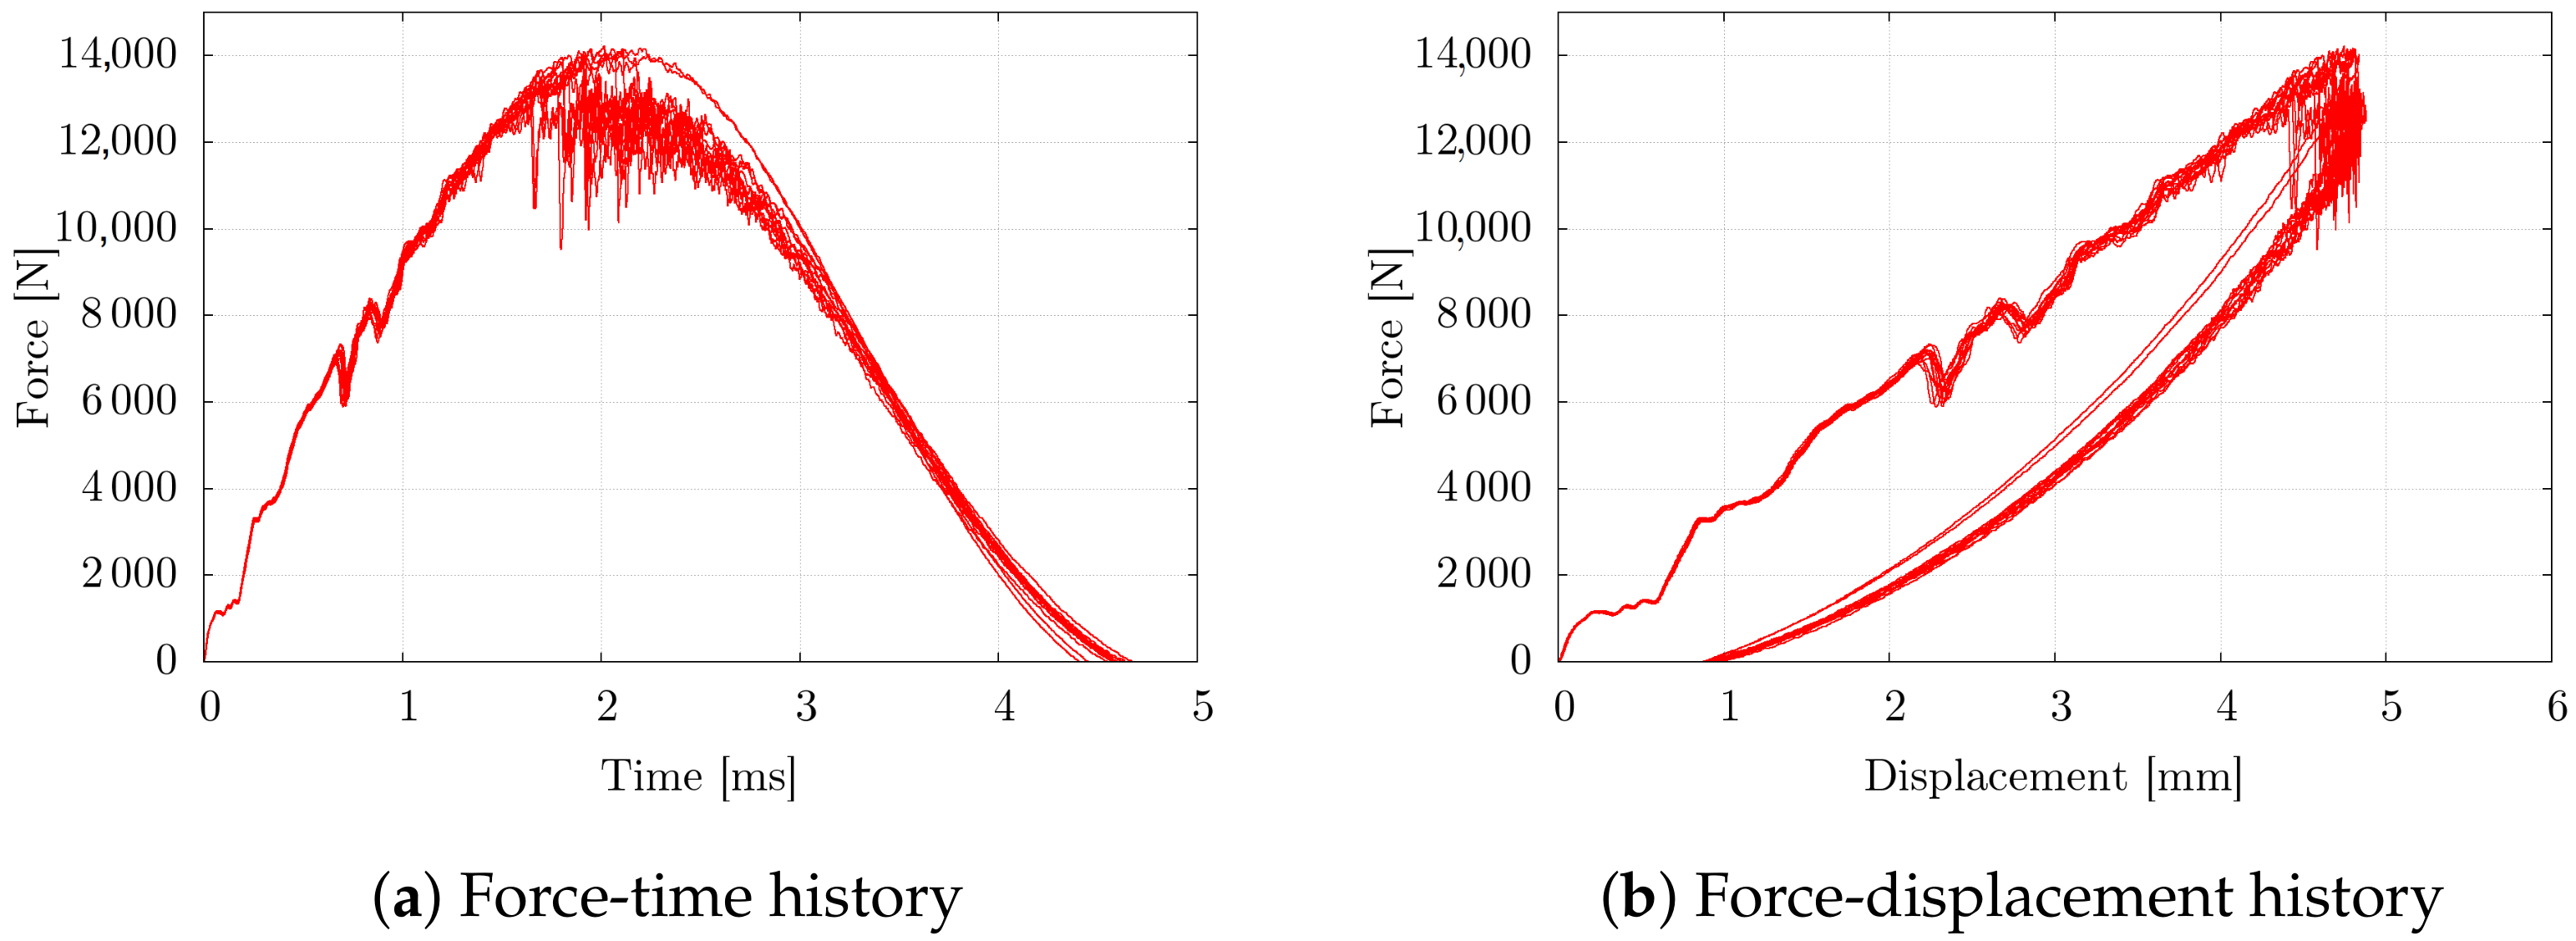
The Figure 2 depicts the set of curves for all 18 tests with impact energy. This set of curves confirms a relatively low scatter between the individual tests. Notably, the response curves of three specimens deviate from the set of curves after the peak force is reached. The major force drop which occurs in most cases around [12 kN] did not happen during these impacts. This might indicate that a certain damage, like a fiber fracture in a particular ply or a delamination in a particular interface did not occur in these tests.
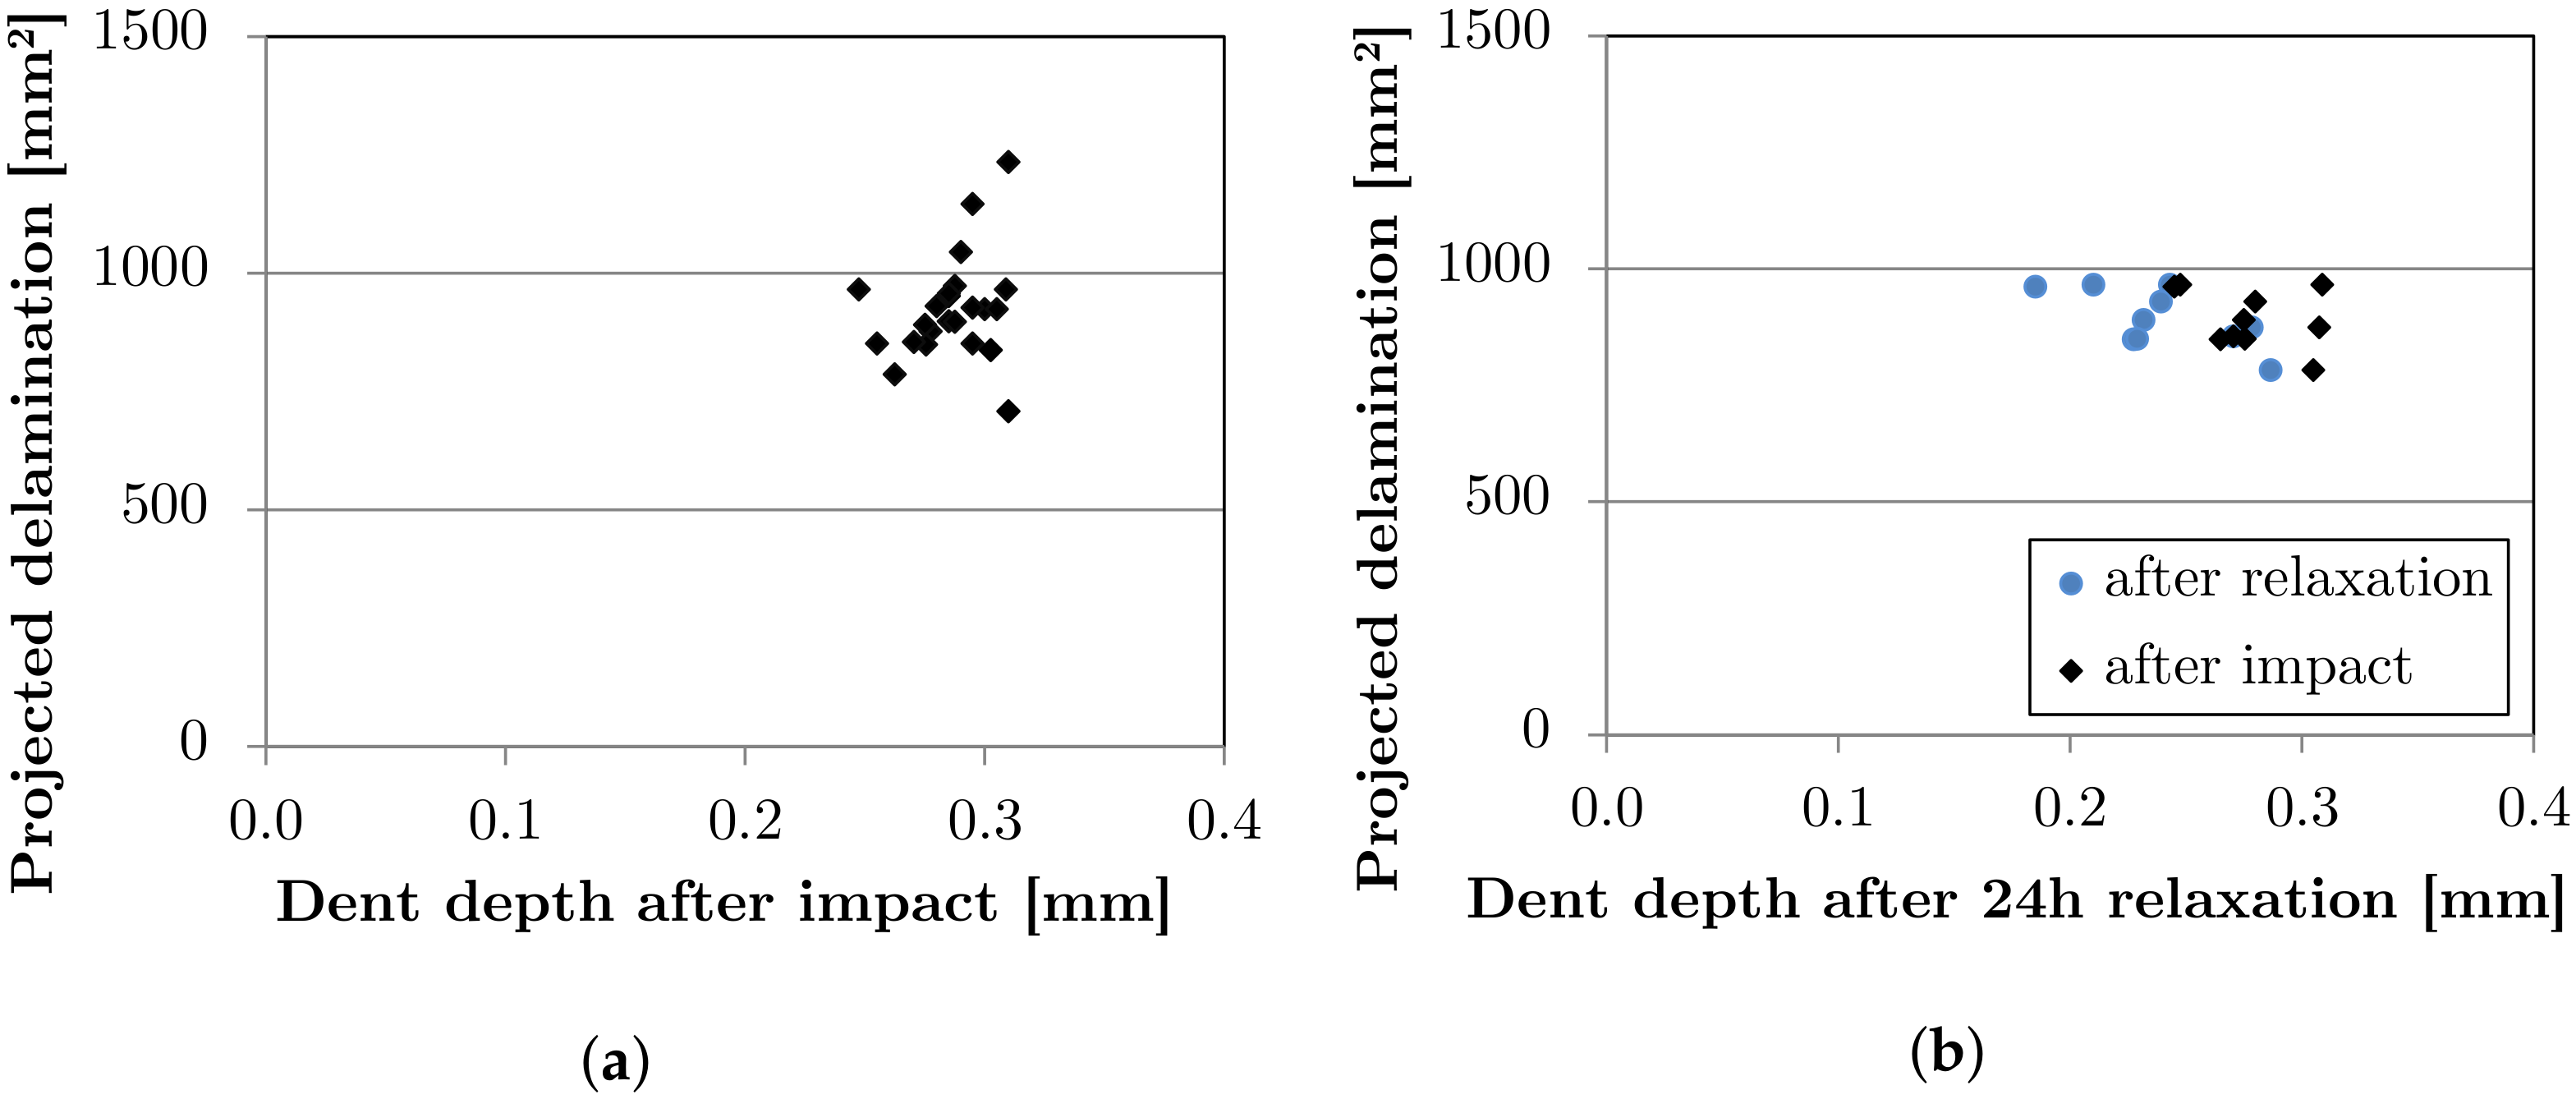
The dent depth is the typical metric to assess the severity of a damage with regard to the residual strength reduction. However, this reduction is not driven by the dent but by the corresponding delamination area. Thus, the correlation of the projected delamination area and the dent depth shall be further investigated. This correlation is depicted in Figure 3a for the projected delamination area and the dent depth directly after the impact. The Figure 3b shows the correlation after a relaxation period of 24 h (Figure 3b). The damage area is measured through the area of the projected delamination in the ultrasonic C-scan.
Commonly, the impact energy correlates positively with the dent depth and this in turn with the delamination area [44,45]. However, for this coupon test series on the same impact energy level, the values of the dent depth scatter (cf. Figure 3). There is no significant correlation for the dent depth and delamination area on the same energy level. The dent depth after relaxation appears to be slightly negatively correlated (cf. Figure 3b), however the data does not allow the generalization of this observation, particularly due to the fact that the number data points with a same dent depth do not offer sufficient statistical certainty.
2.2. Compression after Impact Tests
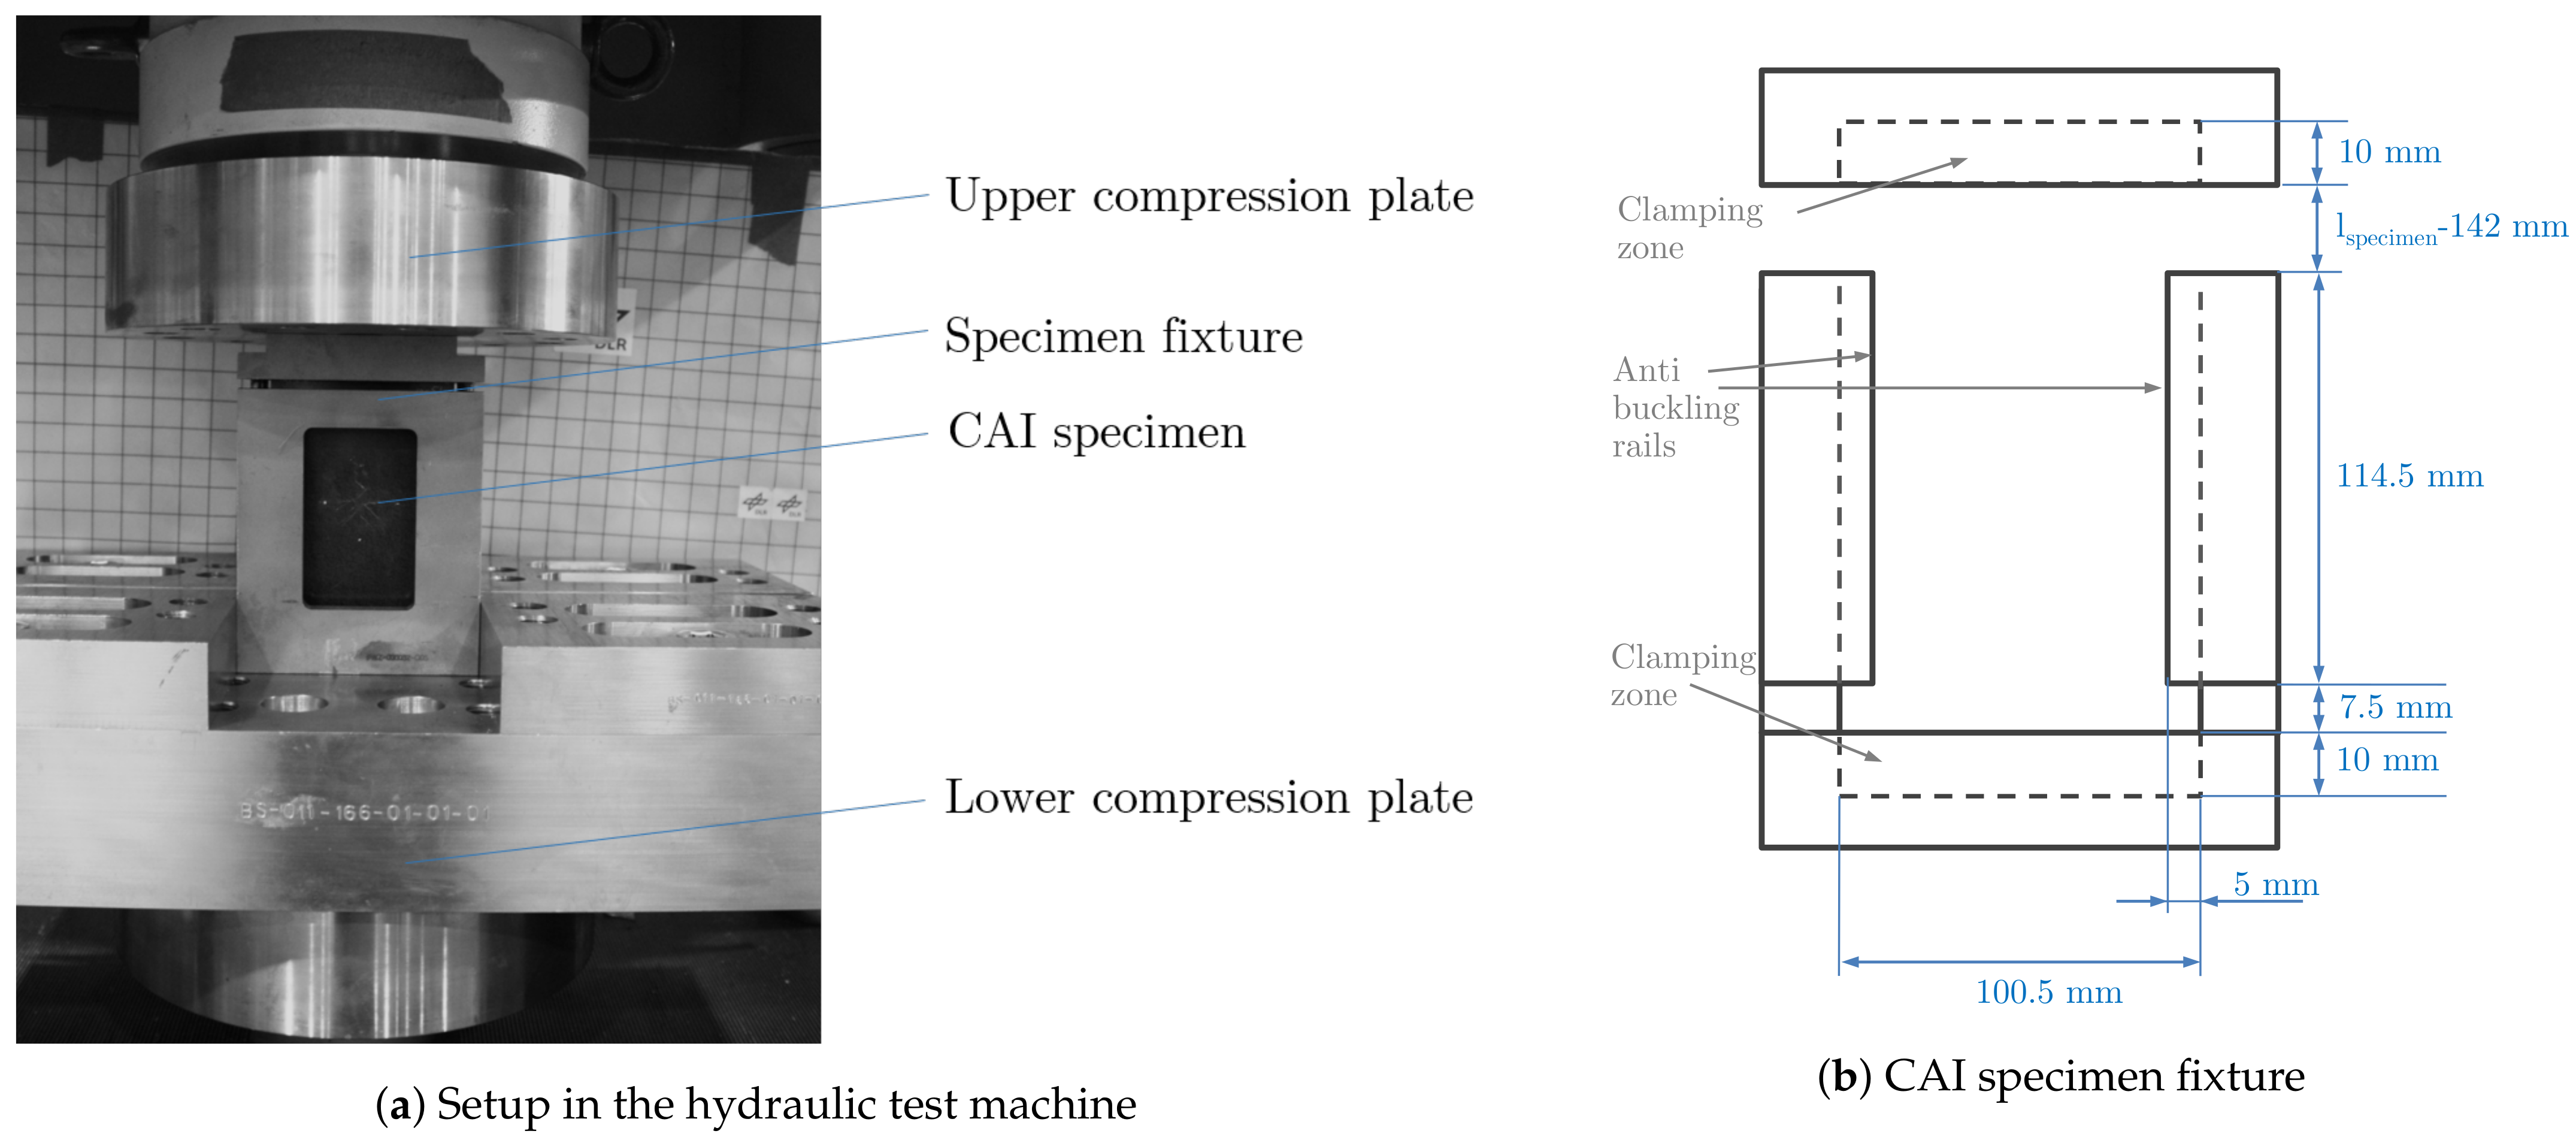
The compression after impact tests were conducted on a kN hydraulic testing machine equipped with compression plates. Figure 4 shows the experimental setup, where the CAI specimen fixture is placed in the test machine. To prevent lateral movement of the fixture, limit stops were mounted on the lower compression plate. The CAI specimen fixture prevents the global buckling of the specimen through vertical anti-buckling rails which are located around mm from the specimen edges.
A series of quasi-static compression tests with impacted and virgin specimens was conducted in order to determine the reference strengths. The average residual strength value determined in the quasi-static CAI tests defines the load level of 100% which causes instant failure of the specimen. For the cyclic experiments, the load level has to be reduced. Hence, the load levels for the tests were chosen relative to the quasi-static residual strength. High load levels are particularly interesting, inasmuch as these permit the highest probability of damage growth according to various studies [11,30]. The typical strain limit of a composite structure with a no-growth design [8] is commonly quantified between and as stated, for example, by Clark [25], Baker [46], or Riccio [3]. Baker even claims that no damage growth might occur for loads at as high as 80% of the limit strain. Hence, the test campaign in this study began with the load level of 90%. The further load levels were chosen during the test campaign, based on the observed behavior during the previous tests. The Table 2 gives an overview about all load level applied for the CCAI tests.
To conduct a cyclic test, additional load parameters have to be defined. For a given absolute maximum force—which is defined by the load level—the absolute minimum force of the cyclic load is defined by the load ratio. This load ratio was chosen as . This choice safely avoids the loosening of the contact between the compression plate of the testing machine and the specimen fixture. A permanent contact is necessary to prevent rattling. Hence, the absolute load minimum of the sinusoidal amplitude is exactly ten percent of the defined maximum. Furthermore, the control loop of the cyclic test has to be considered. It is not possible to keep the applied limit values for force and displacement constant throughout the load cycles because the specimen stiffness decreases under fatigue load. Constant displacement parameters are the safe approach to prevent sudden specimen failure. However, the stiffness reduction is likely to decrease the load to a level where delamination is unlikely to grow. In contrast to that, constant force parameters forward a progressive damage behavior. Hence, constant force parameters were chosen for this study, in order to forward the damage propagation.
A loading frequency of Hz was experimentally determined as the maximum tolerable value for experiments on a load level of 90%. The limiting factor is the temperature of the specimen which rises due to internal friction during the cyclic loading. At a frequency of Hz, the temperature increase measure on the surface of the specimen was less than . For long intervals of 50,000 and more cycles on the load levels 50% and 30% the frequency was increased to Hz. The respective temperature increase on the specimen surface during the test was less than .
The detection and the measurement of the delamination growth and the development of the dent depth are vital to the objectives of the investigation. The respective information has to be obtained after a certain number of load cycles. For that purpose, the cyclic test was conducted in intervals. After each interval, the test was interrupted for ultrasonic testing and/or dent measurement. The interval length was either a predefined value or arose from a required ultrasonic examination after acoustic evidence of damage propagation. Hence, the number of cycles in an interval varies for each cycle interval and for each specimen.
3. Results and Discussion
3.1. Endurance and Residual Strength
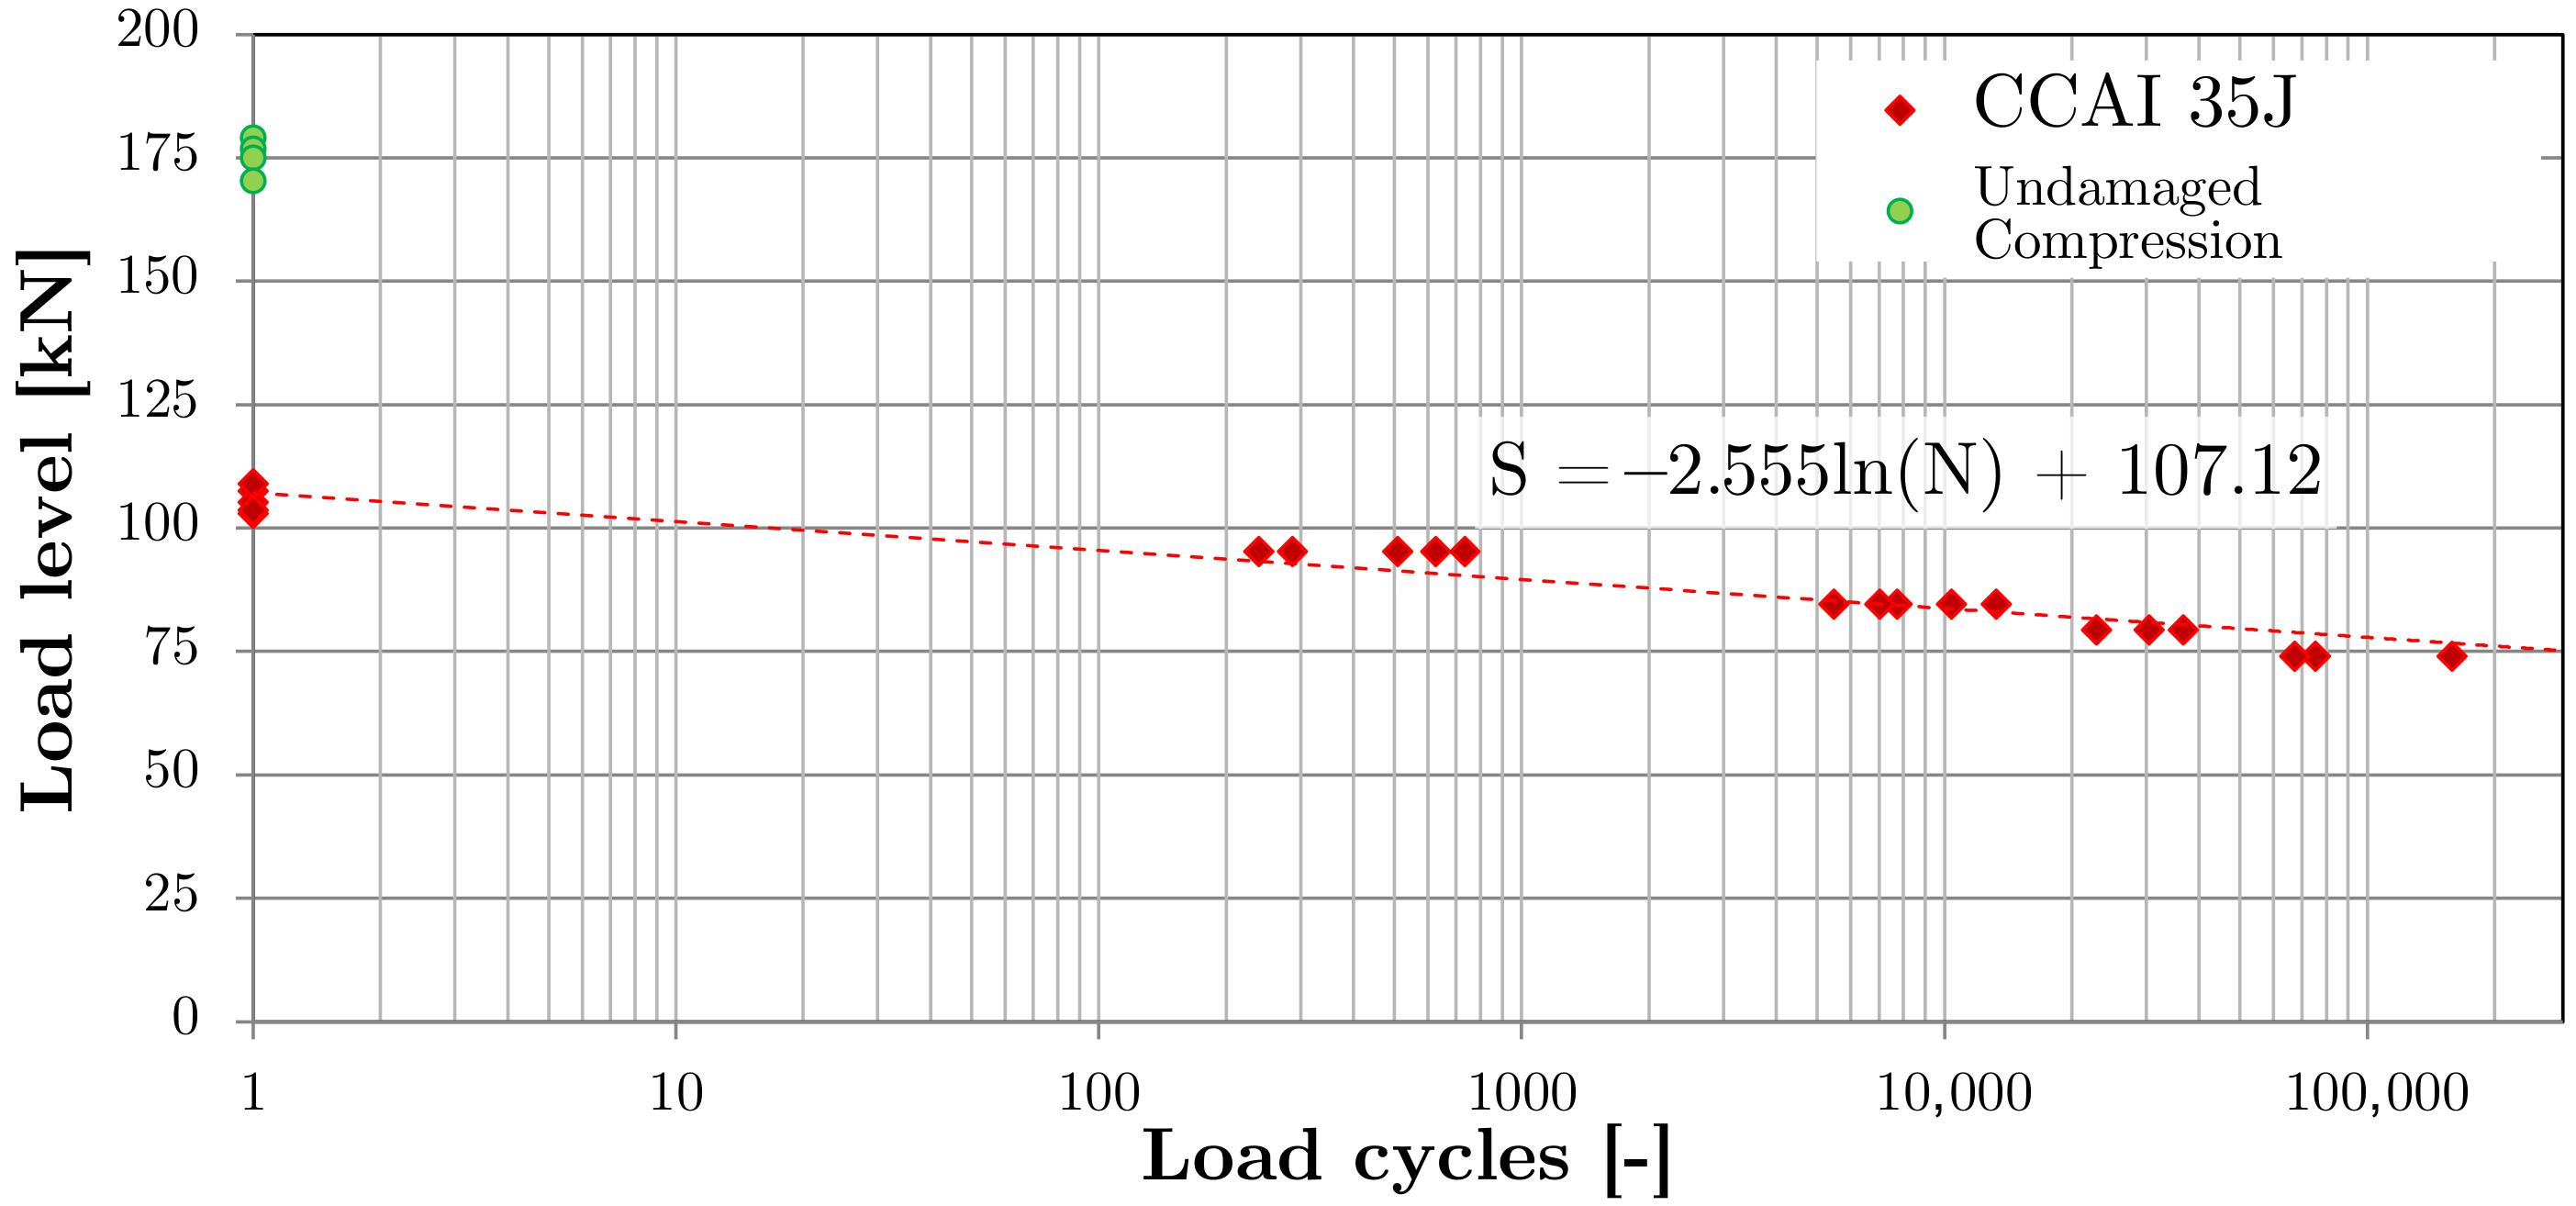
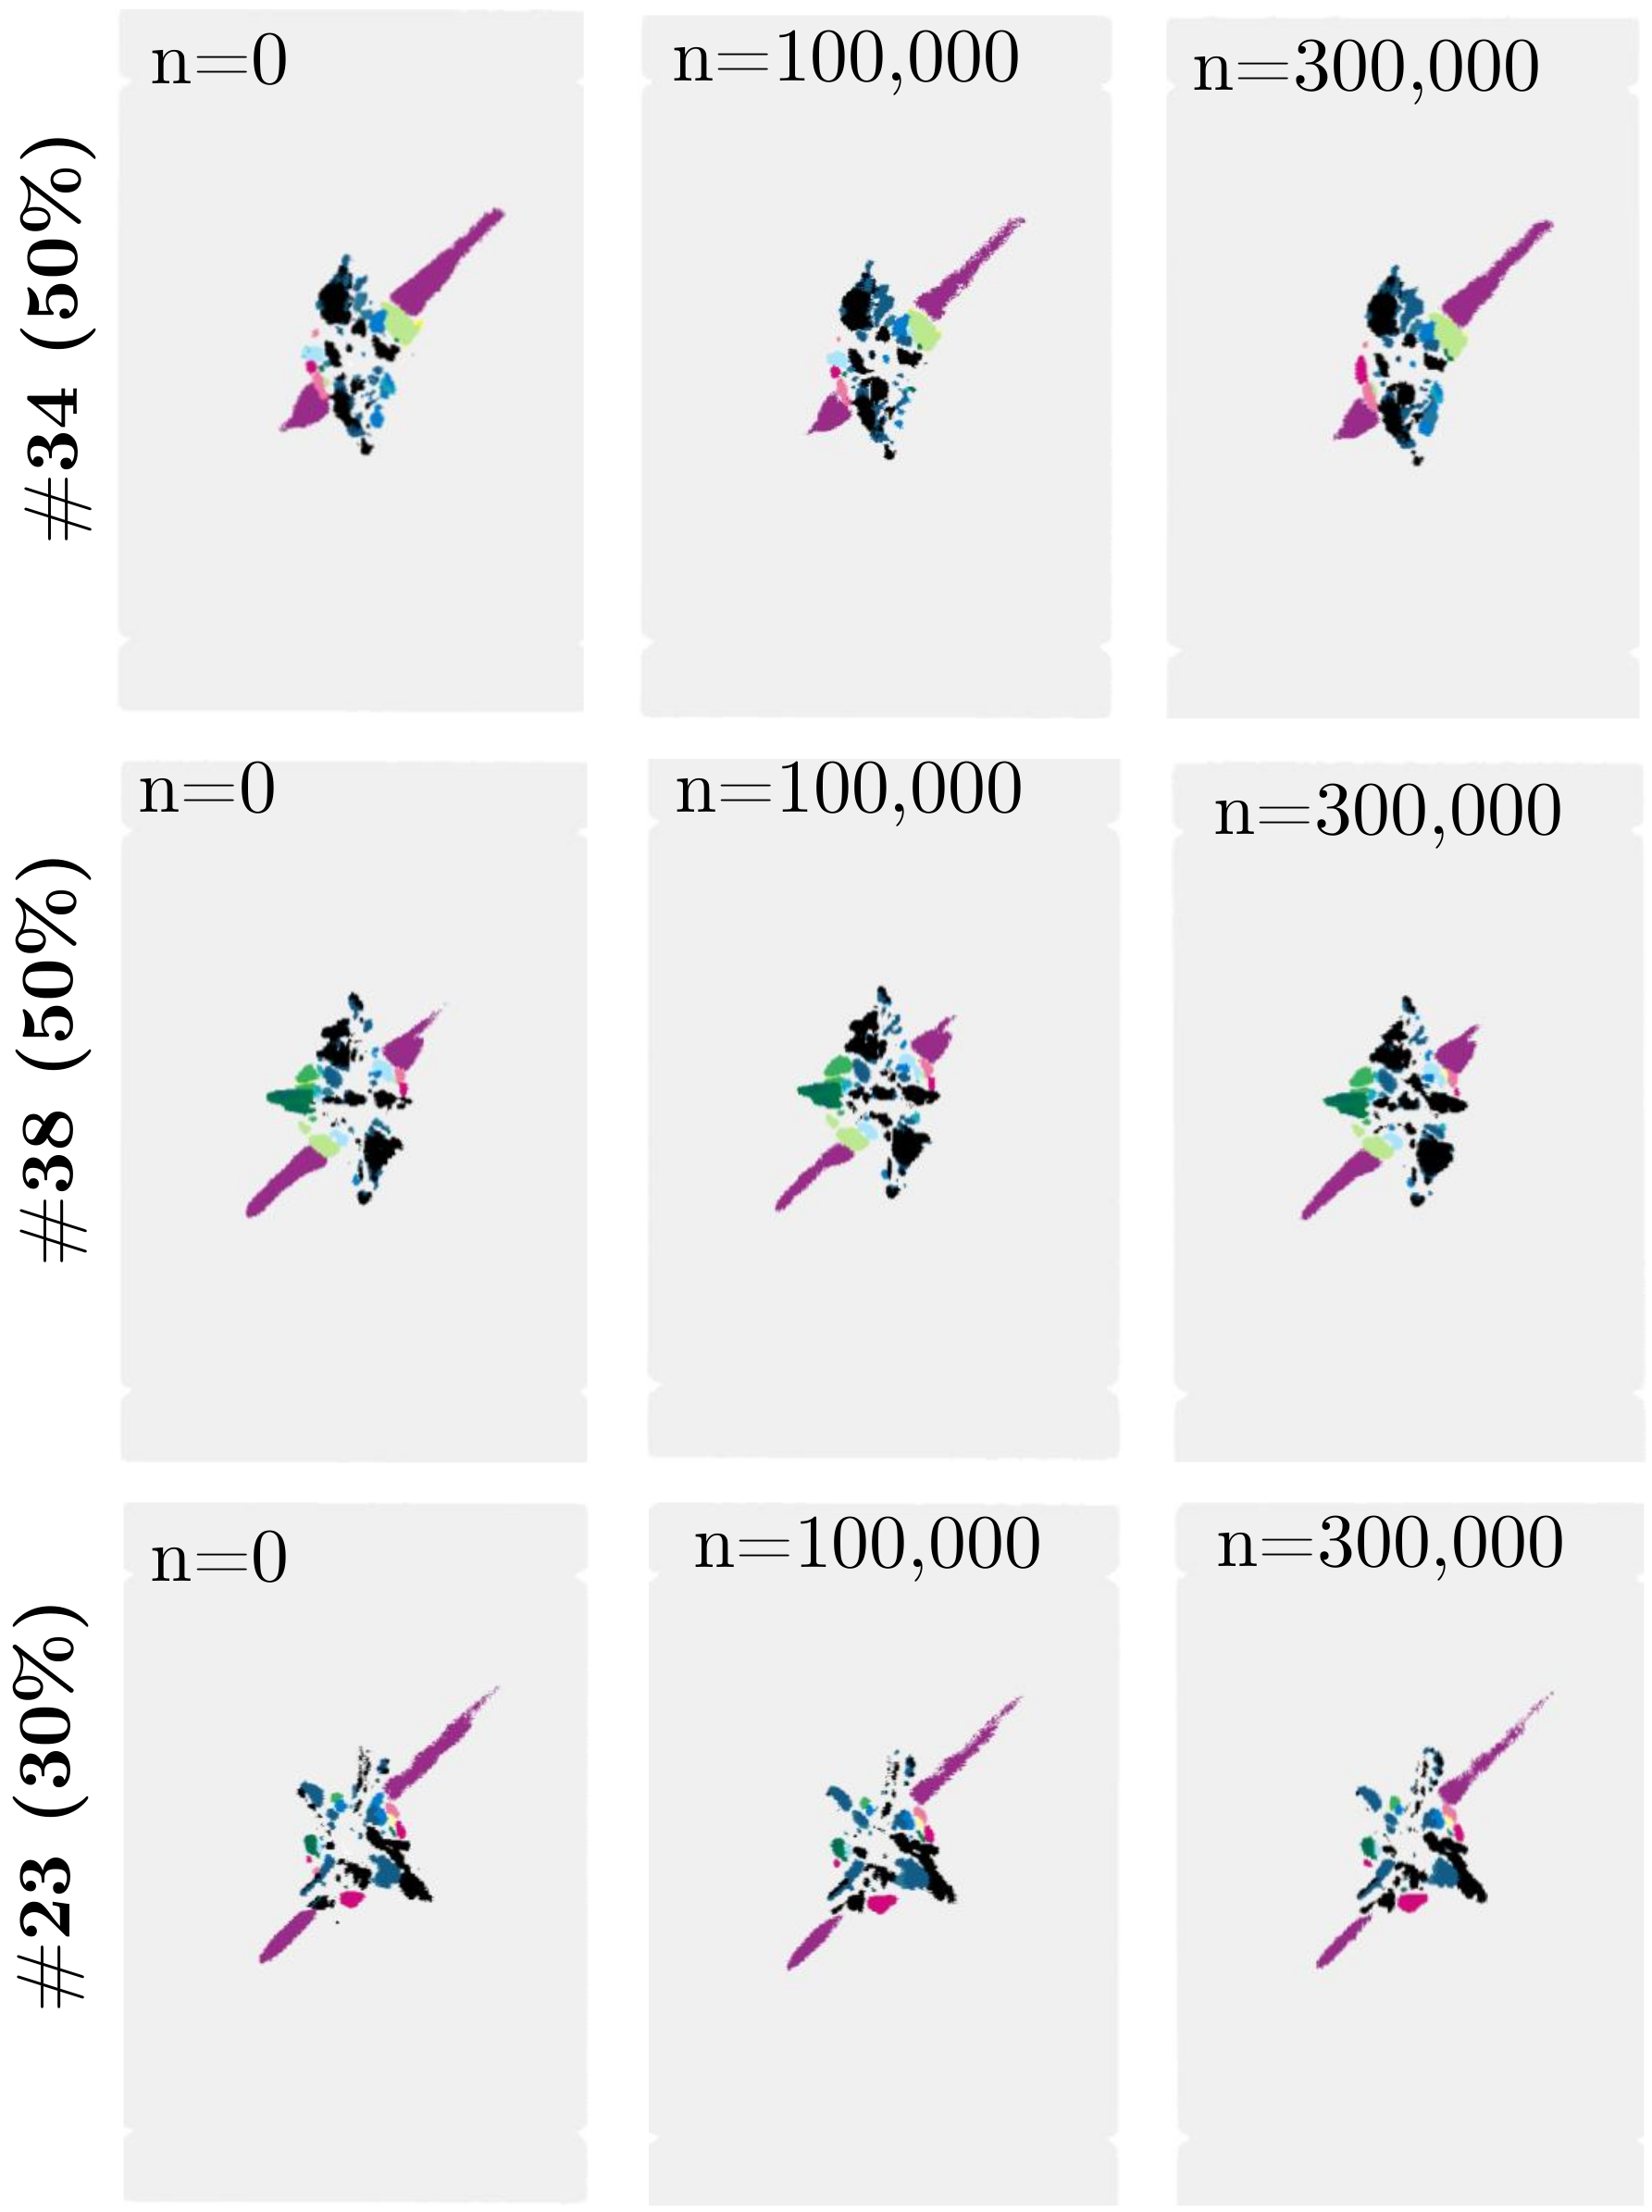
A primary result of a CCAI experiment is the endurance of each specimen. The combined results from each load level result in the respective endurance limits, which permits us to derive an stress-life curve (S-N curve) as shown in Figure 5. The strong endurance increase for smaller load levels leads to a particularly flat S-N curve, which appears to be a typical phenomenon for compression/compression fatigue and was also observed by Post et al. [47]. Up to 300,000 load cycles were conducted. The specimens on the 50% and 30% load level as well as one specimen on the 75% load level did not fail after 300,000 cycles and were therefore excluded from the S-N-curve. For the specimen on the 75% load level a possible explanation can be found in the impact damage. The respective specimen corresponds to one of the impact history curves without the major force drop (cf. Section 2.1). This is due to fewer fiber breaks that occurred on the surface and as a consequence the endurance of the specimen increases.
An issue of particular interest is the relation of the S-N curves with and without impact damage. However, the CAI specimens were found to be unsuitable for the cyclic test of pristine specimens. Friction between the specimen and the fixture initiated delamination at the loading edge. An entirely different failure mode occurred which does not permit to assess the fatigue behavior of the laminate. To overcome this deficiency, the fatigue behavior of the undamaged laminate could be determined on a standard compression specimen with tabs. Additional tests using standard compression specimens would have to be conducted to obtain the virgin S-N curve. As shown in the experimental work of Uda et al. [33], a linear superposition of the fatigue knockdown and the impact knock-down is a conservative estimate of the combined fatigue after impact knock-down. The advantage of this procedure is the reduction of the test effort. With a known S-N curve for the undamaged laminate, conservative estimates for the S-N curve corresponding to each each damage size could be obtained through the determination of the quasi-static residual strength.
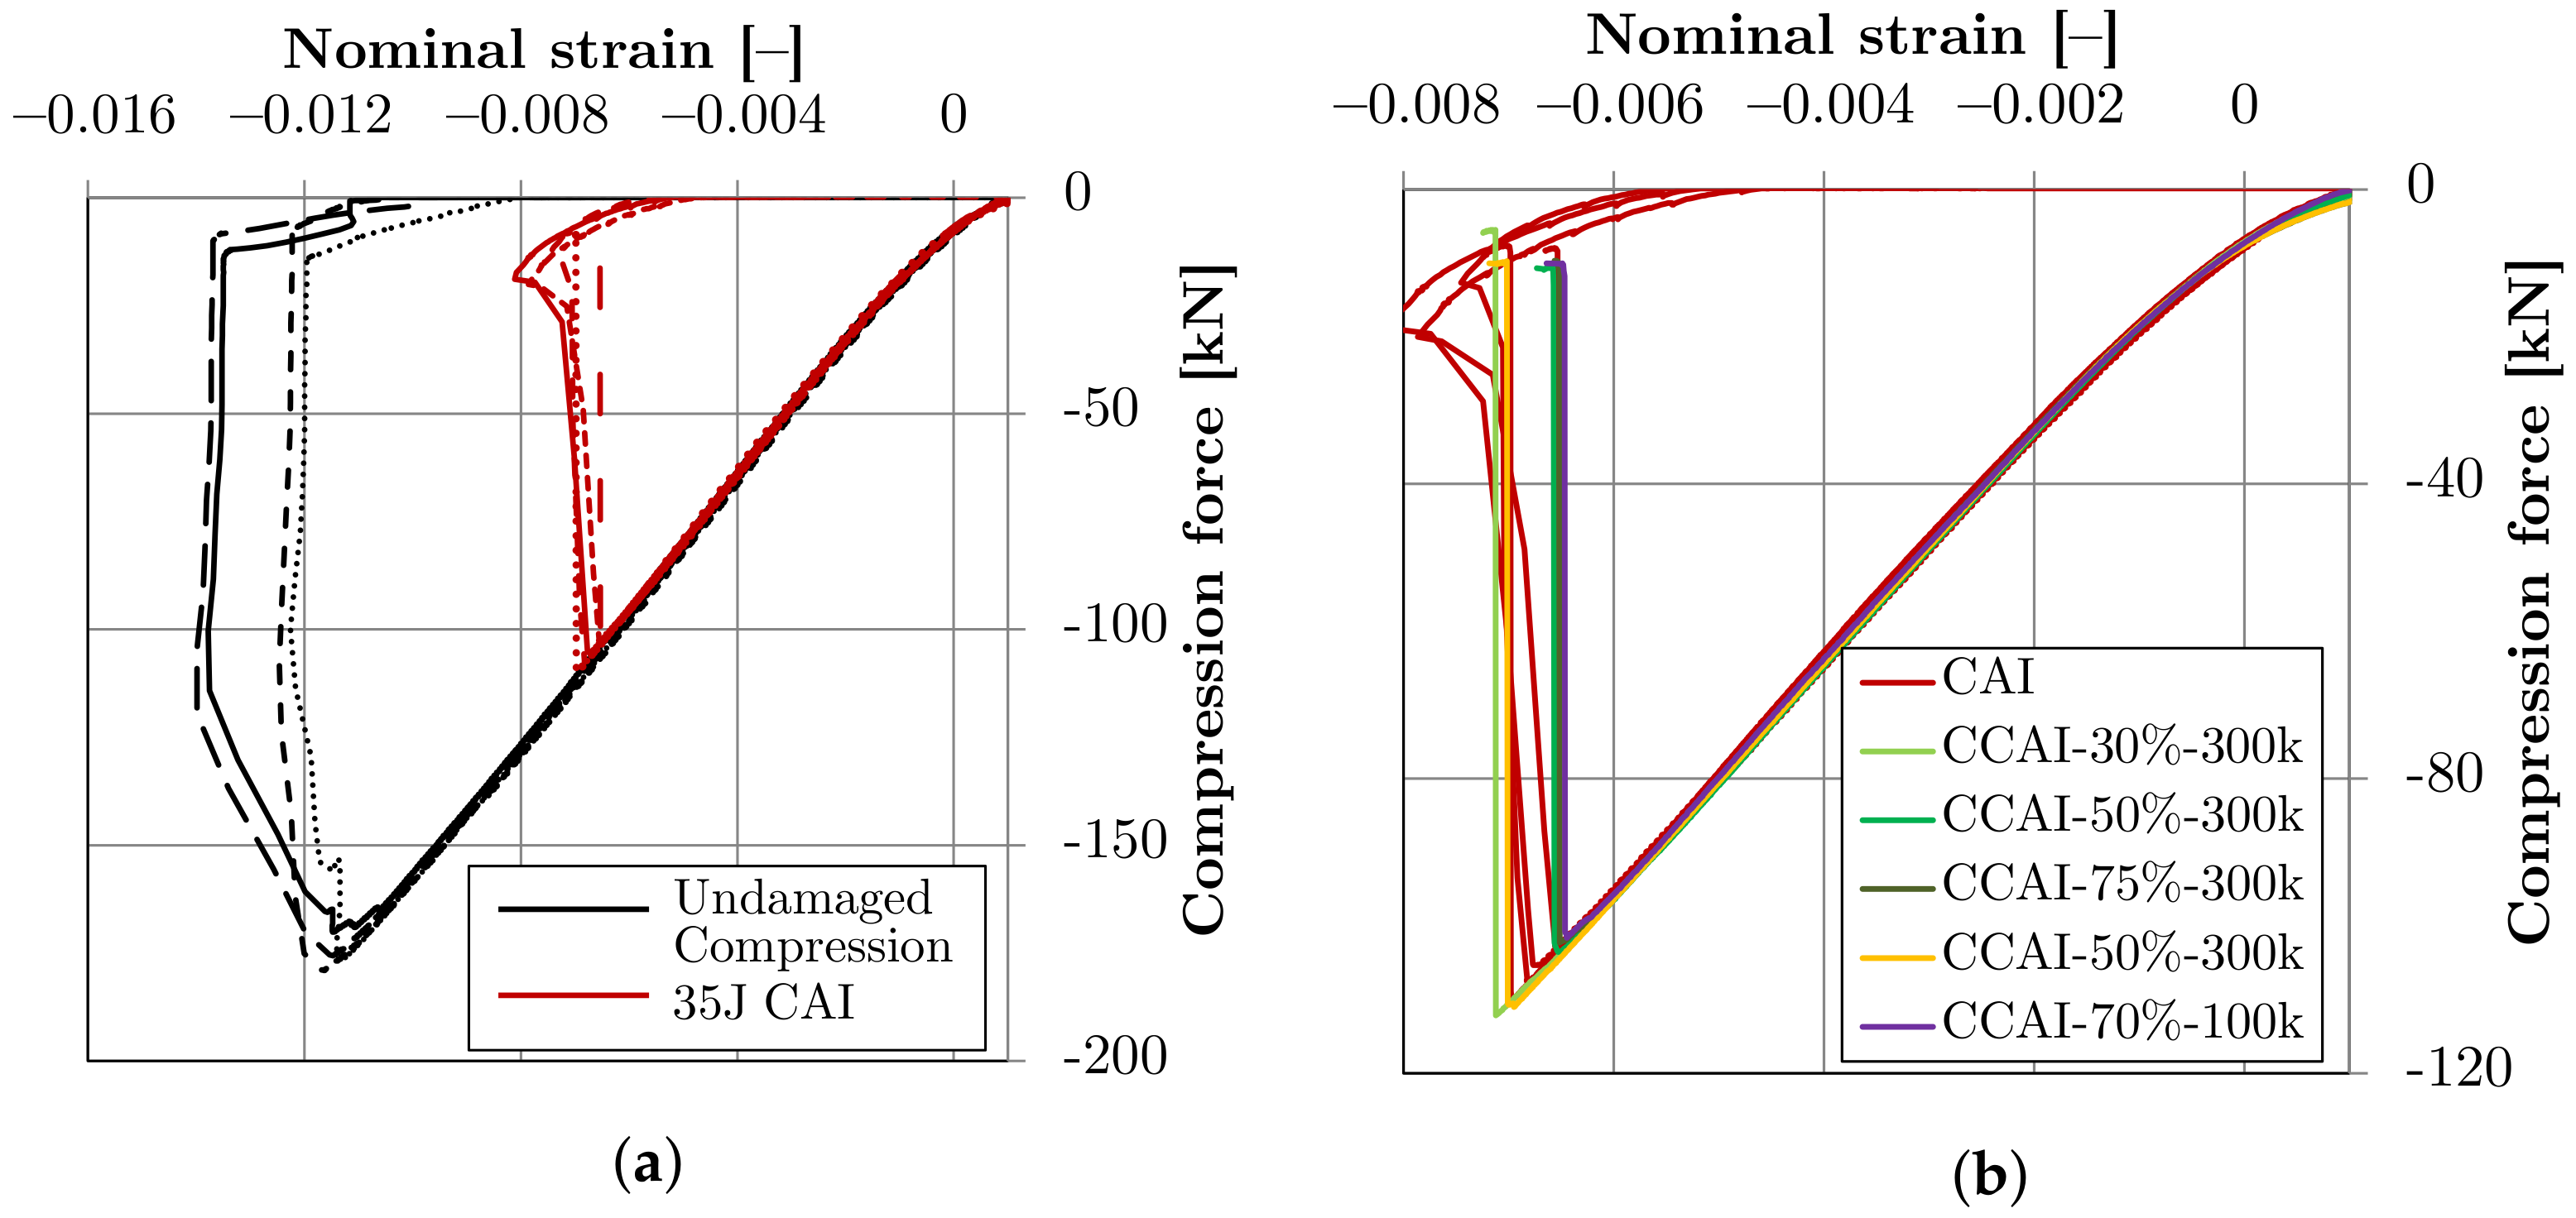
Further, the influence of the cyclic loading on the residual strength was investigated. The force-strain curves for all quasi-static compression experiments are depicted in Figure 6. The first diagram in Figure 6a compares the compression tests with the CAI tests. The curves reveal a 1.0% stiffness decrease by the impact damage. Due to negligible scatter of the stiffness, this small value is statistically significant. The strength decrease is severe and constitutes 40%. Hence, the impact damage affects the strength more severely than the stiffness while the failure strain reduces proportionally to the strength. An observation which confirms that a sudden event—likely the sublaminate buckling—initiates the ultimate failure. The qualitative failure mode differs between the damaged and the undamaged specimens. While impact damaged specimens have their weakest zone where the damage is located, a virgin specimen has its weakest zone in the unsupported length where the anti-buckling rails end (due to the geometry of the CAI fixture, cf. AITM 1.0010 [17]). The failure emerges in this unsupported length. Due to this failure at a different weak point, the true undamaged reference strength of the CAI specimen is higher than this measured value.
The diagram in Figure 6b compares the CAI tests of the impacted specimens with those that were additionally subjected to cyclic loading. A significant stiffness decrease due to the cyclic load could not be measured in these tests. The experiments also didn’t reveal a significant strength decrease. The ultimate failure load of most CCAI specimens is in the range of scatter of the CAI specimens. A similar behavior was observed for the cyclic tension after impact behavior in an earlier study [41]. Remarkably, there are two exceptions which revealed a higher failure load than the reference CAI tests. Whether these values shall be considered as a consequence of a natural scatter or whether there is indeed a cause for this is not clear. One possible explanation are the initial differences in the delamination size and shape before cyclic loading. In this case an increased sample size for the CAI specimens should reveal if the two specimens with higher values for the residual strength are consequence of the initial differences. Another possible explanation is that ply-debris shifted by cyclic loading into the interfaces might in certain cases impede sublaminatebuckling of the open delaminations and therefore slightly increase the residual strength.
3.2. Damage Propagation
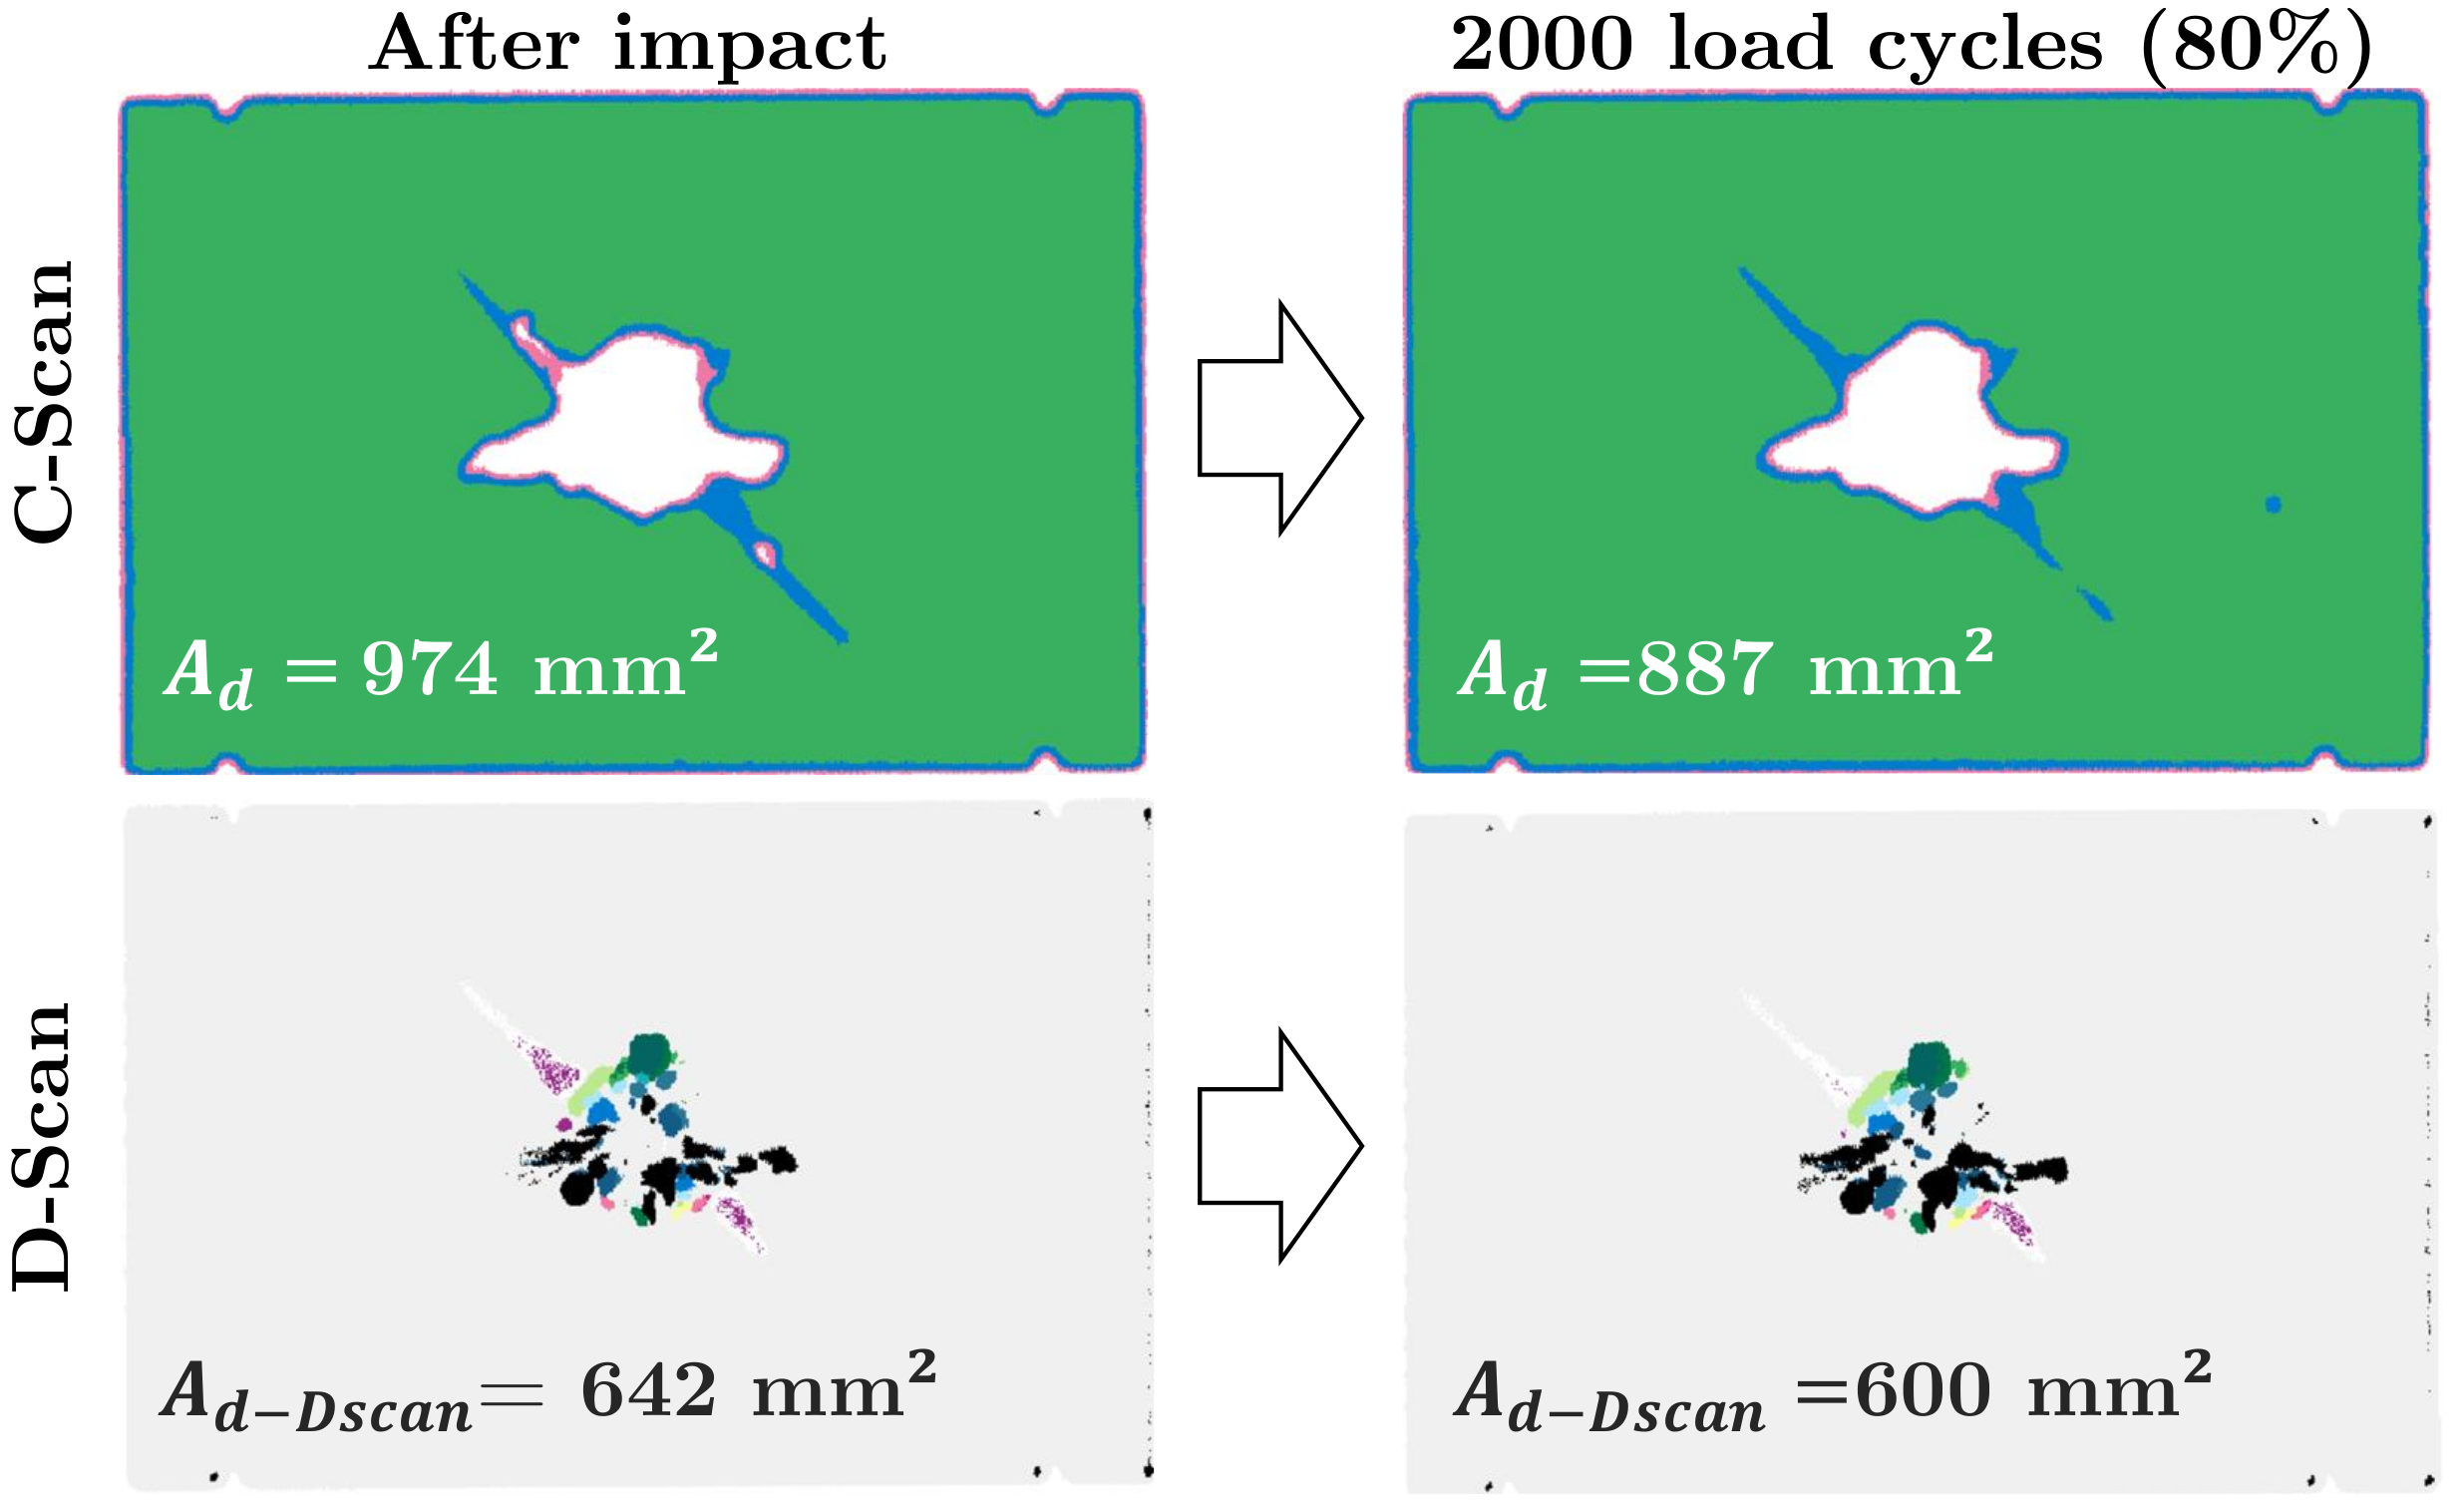
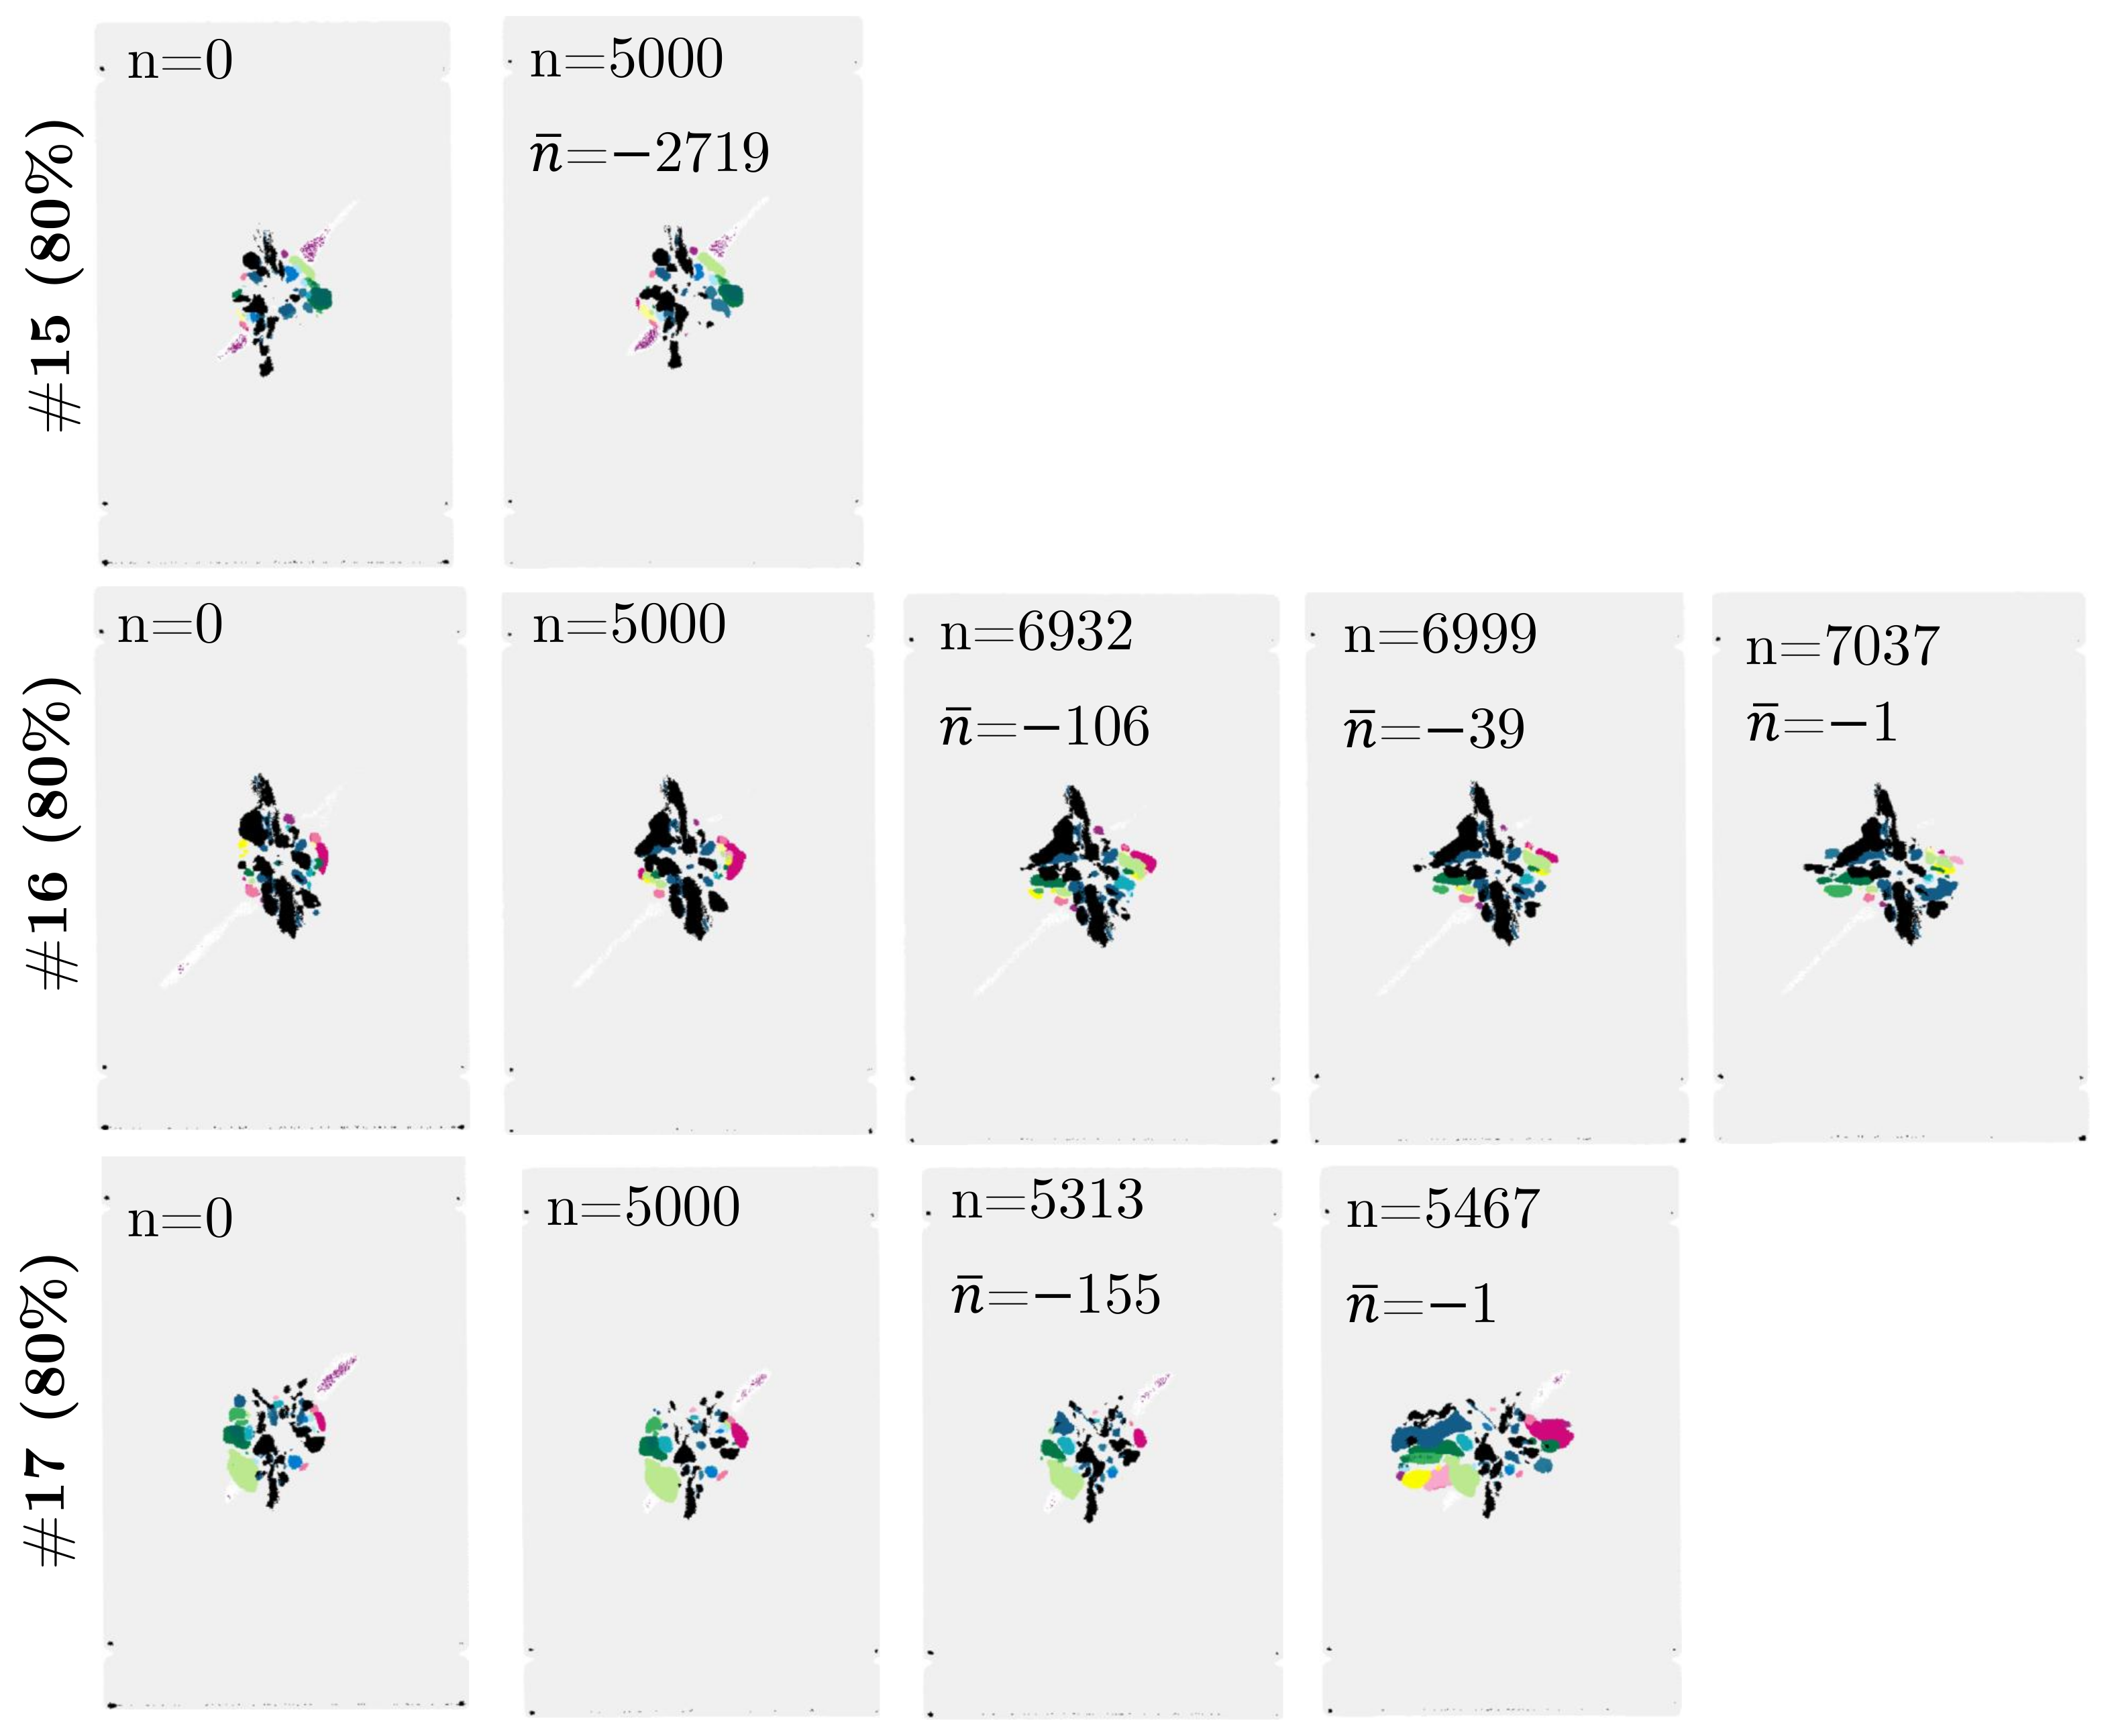
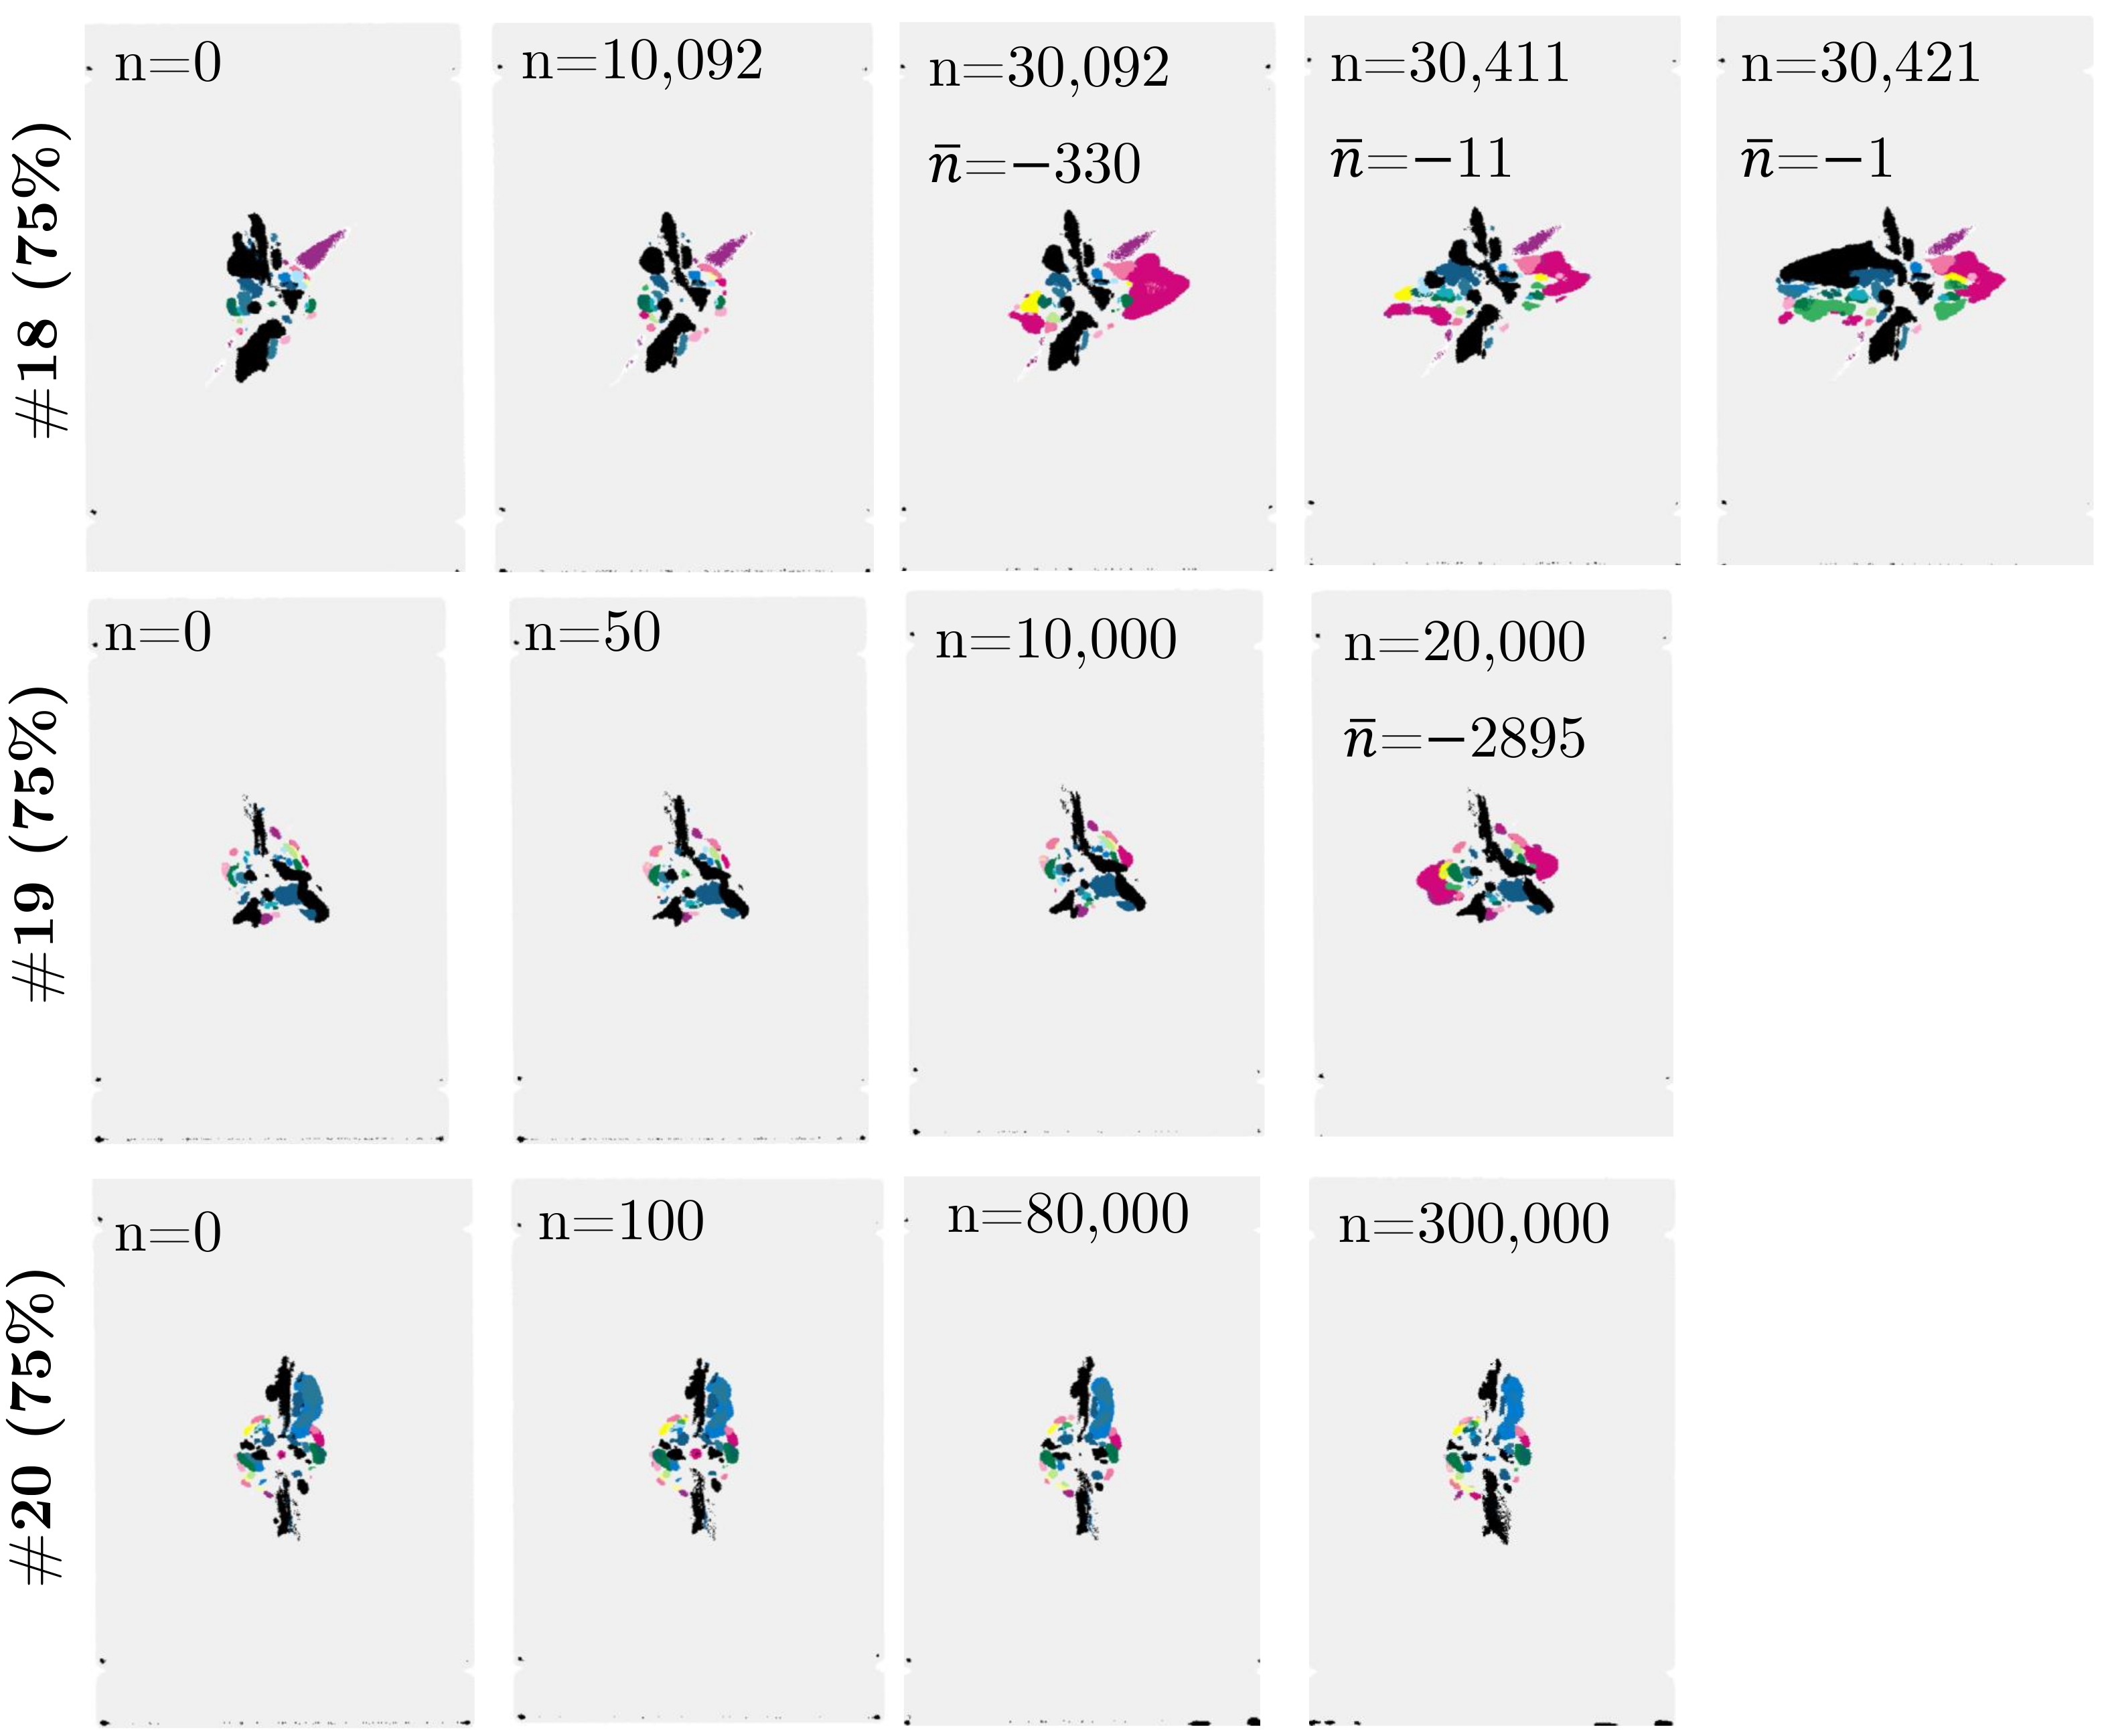
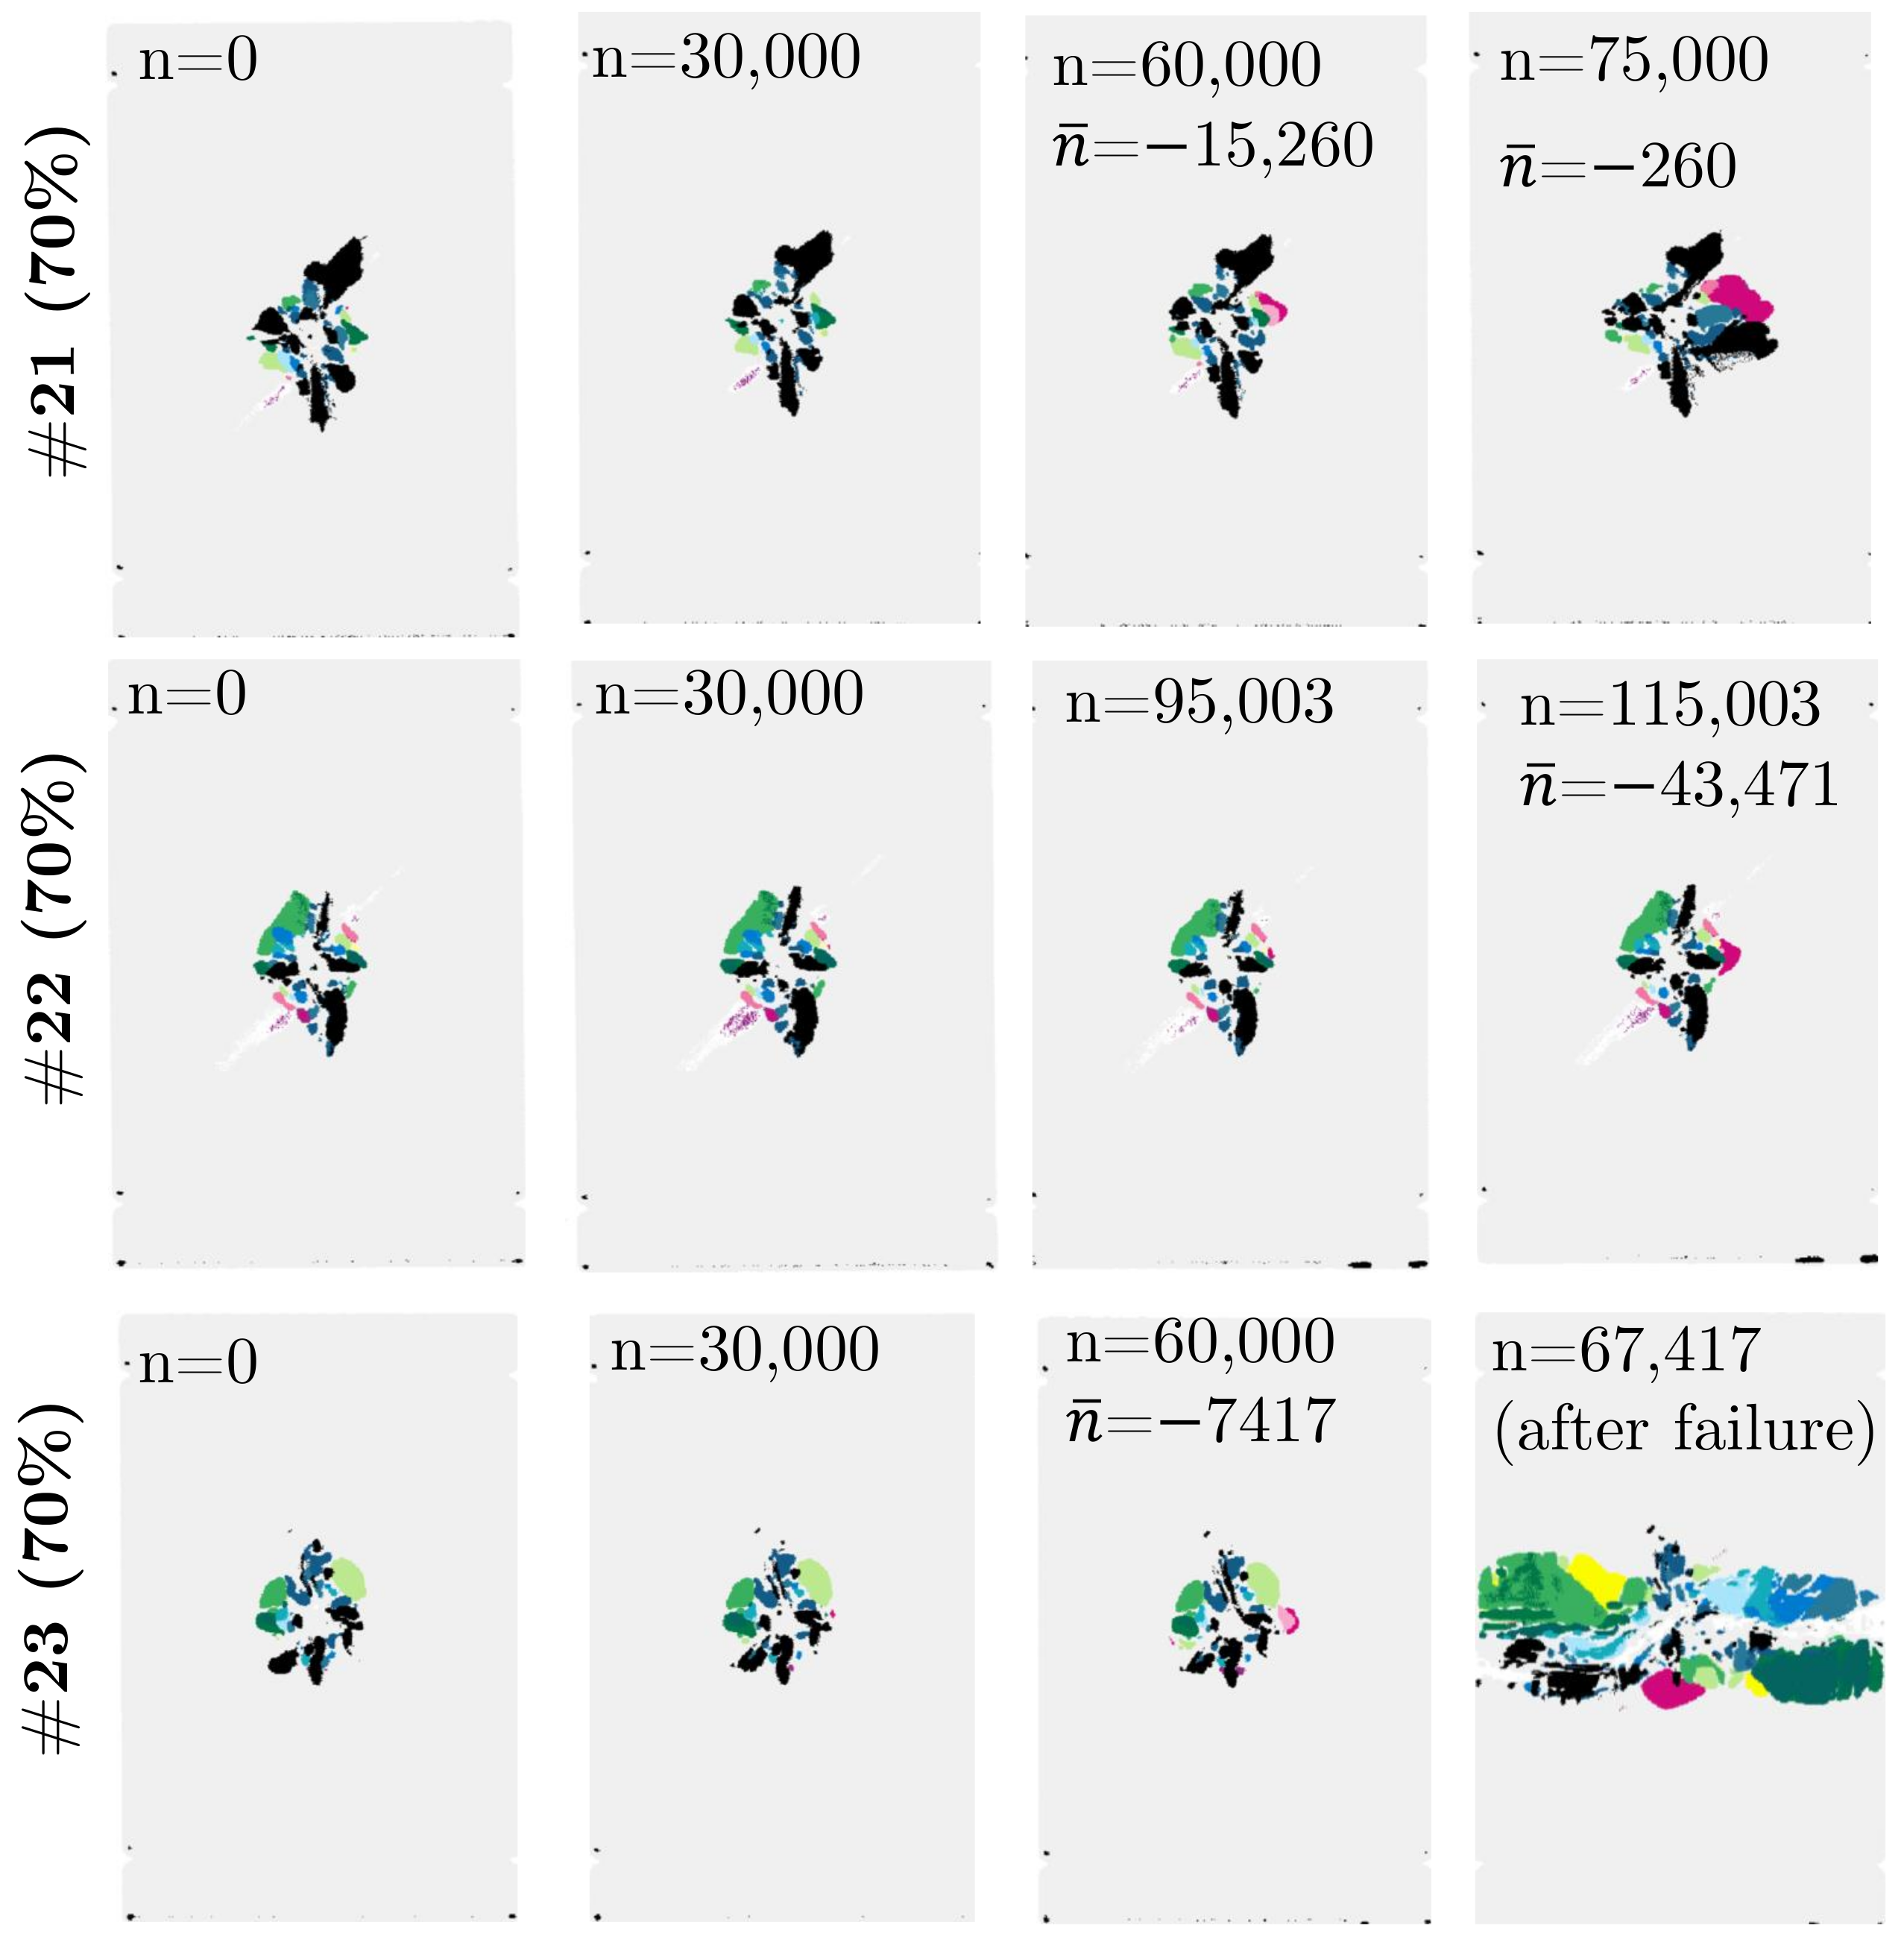
The information about the delamination growth is key to possibly establish a slowgrowth approach in the damage tolerant design [13]. For that purpose, the damage was inspected and measured after certain intervals—either after a predefined interval of cycles or after acoustic evidence for damage propagation. After an interval, the specimen was removed from the testing machine for an ultrasonic inspection. However, the ultrasonic scanning revealed an additionally difficulty when assessing the damage size after cyclic loading. The scans exhibit an apparent decrease of the delamination area as depicted in Figure 7. A similar effect was reported by Feng et al. [48] in their study on the structural level.
This decrease could be observed in both scanning methods, the through-transmission scan (C-scan) and the time of flight evaluation of the pulse-echo scan (D-Scan). As an actual decrease of the damage is not a plausible explanation, this observation is probably due to a restrictions of both measurement methods: The C-Scan evaluates the echo from the bottom of the immersion tank. The amplitude of the sound wave which passed twice through the laminate is measured. A reduced delamination size in the C-Scan implies, a stronger echo signal. Hence, the damping of the laminate in the damaged region became less than directly after the impact. In the D-Scan, the echo produced by each delamination is evaluated. If a certain threshold value is exceeded, the respective location is considered as damaged. Thus, a decrease of the delamination area in the D-Scan has to be caused by a smaller echo from the delaminations themselves. In Section 3.4, we explain this effect through the mechanics of the cracked laminate.
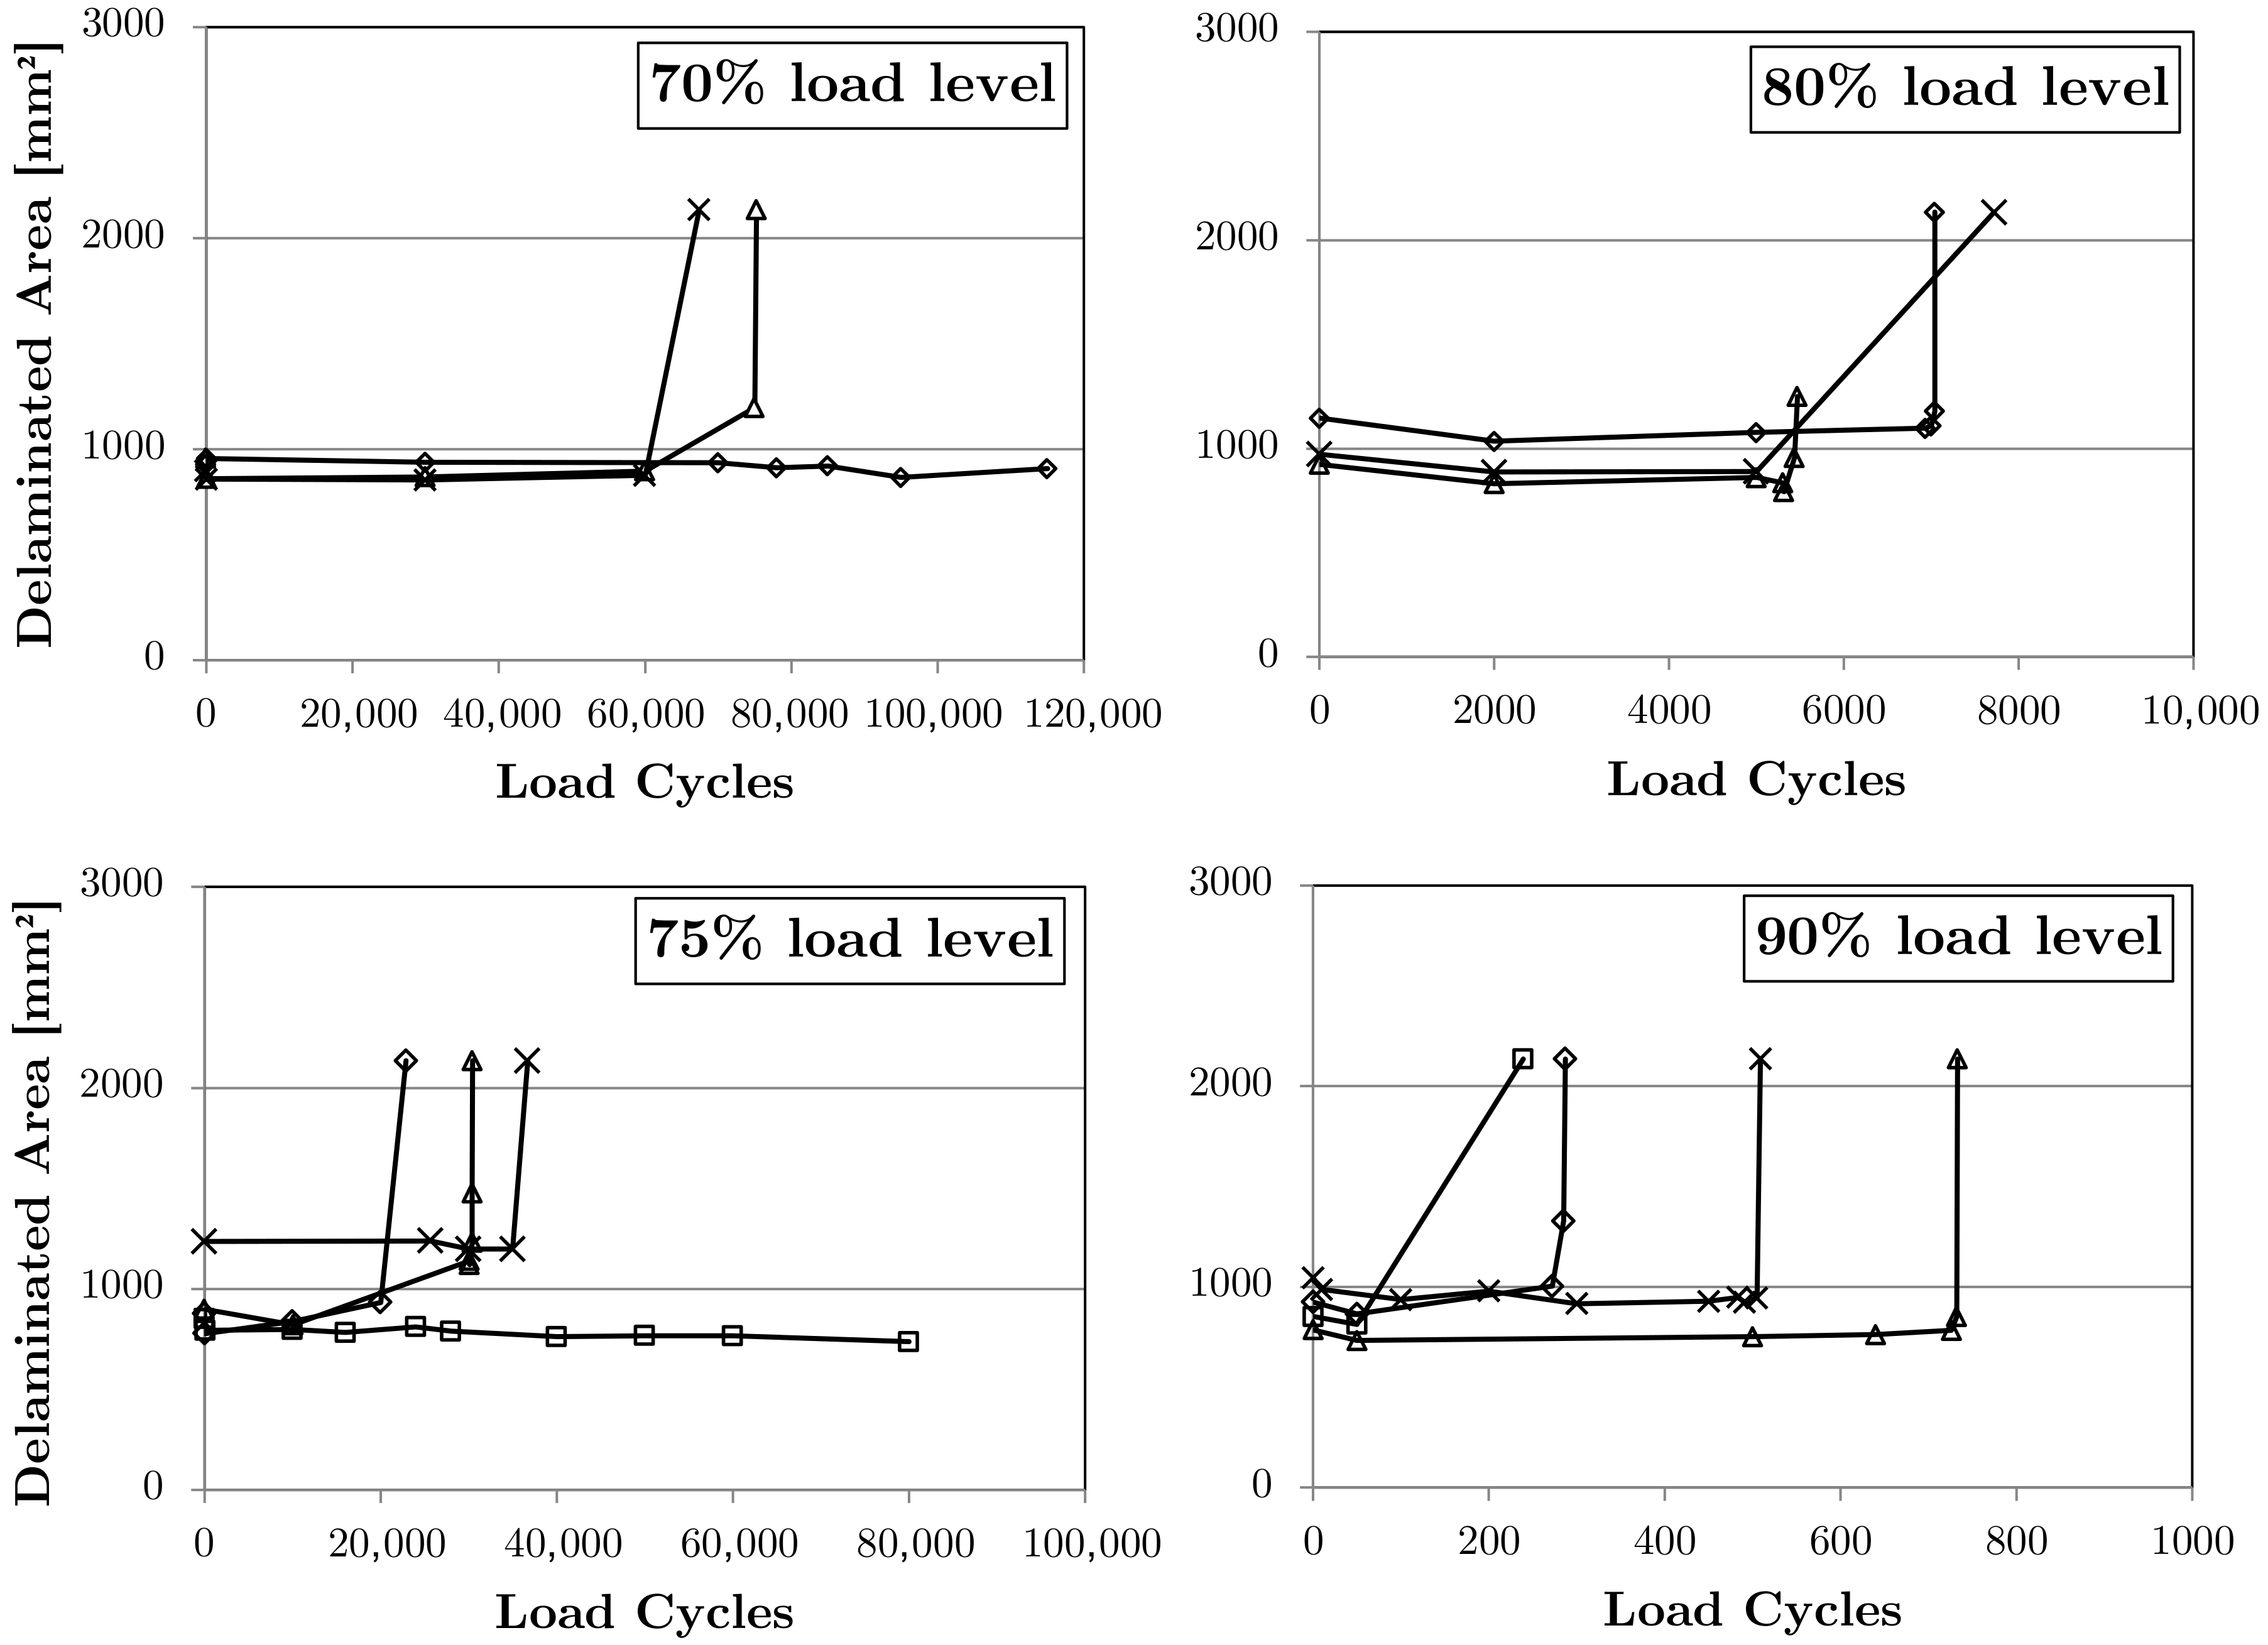
For the damage evolution investigation in this campaign, the decrease of the delamination area has to be quantified. According to the conducted measurements, a maximum decrease of 15% and an average decrease of 9 ± 3% were identified. Depending on the load level, the minimum measured delamination area was found after less than one hundred cycles and or even after nearly 100,000 cycles, as the damage growth curves in Figure 8 show.
The quantitative delamination history for three specimens on each load level is shown in the four diagrams in Figure 9 (on the load levels 50% and 30%) no damage growth occurred). Further, the Figure A1, Figure A2 and Figure A3 depicts the D-scan images of all inspected specimens.
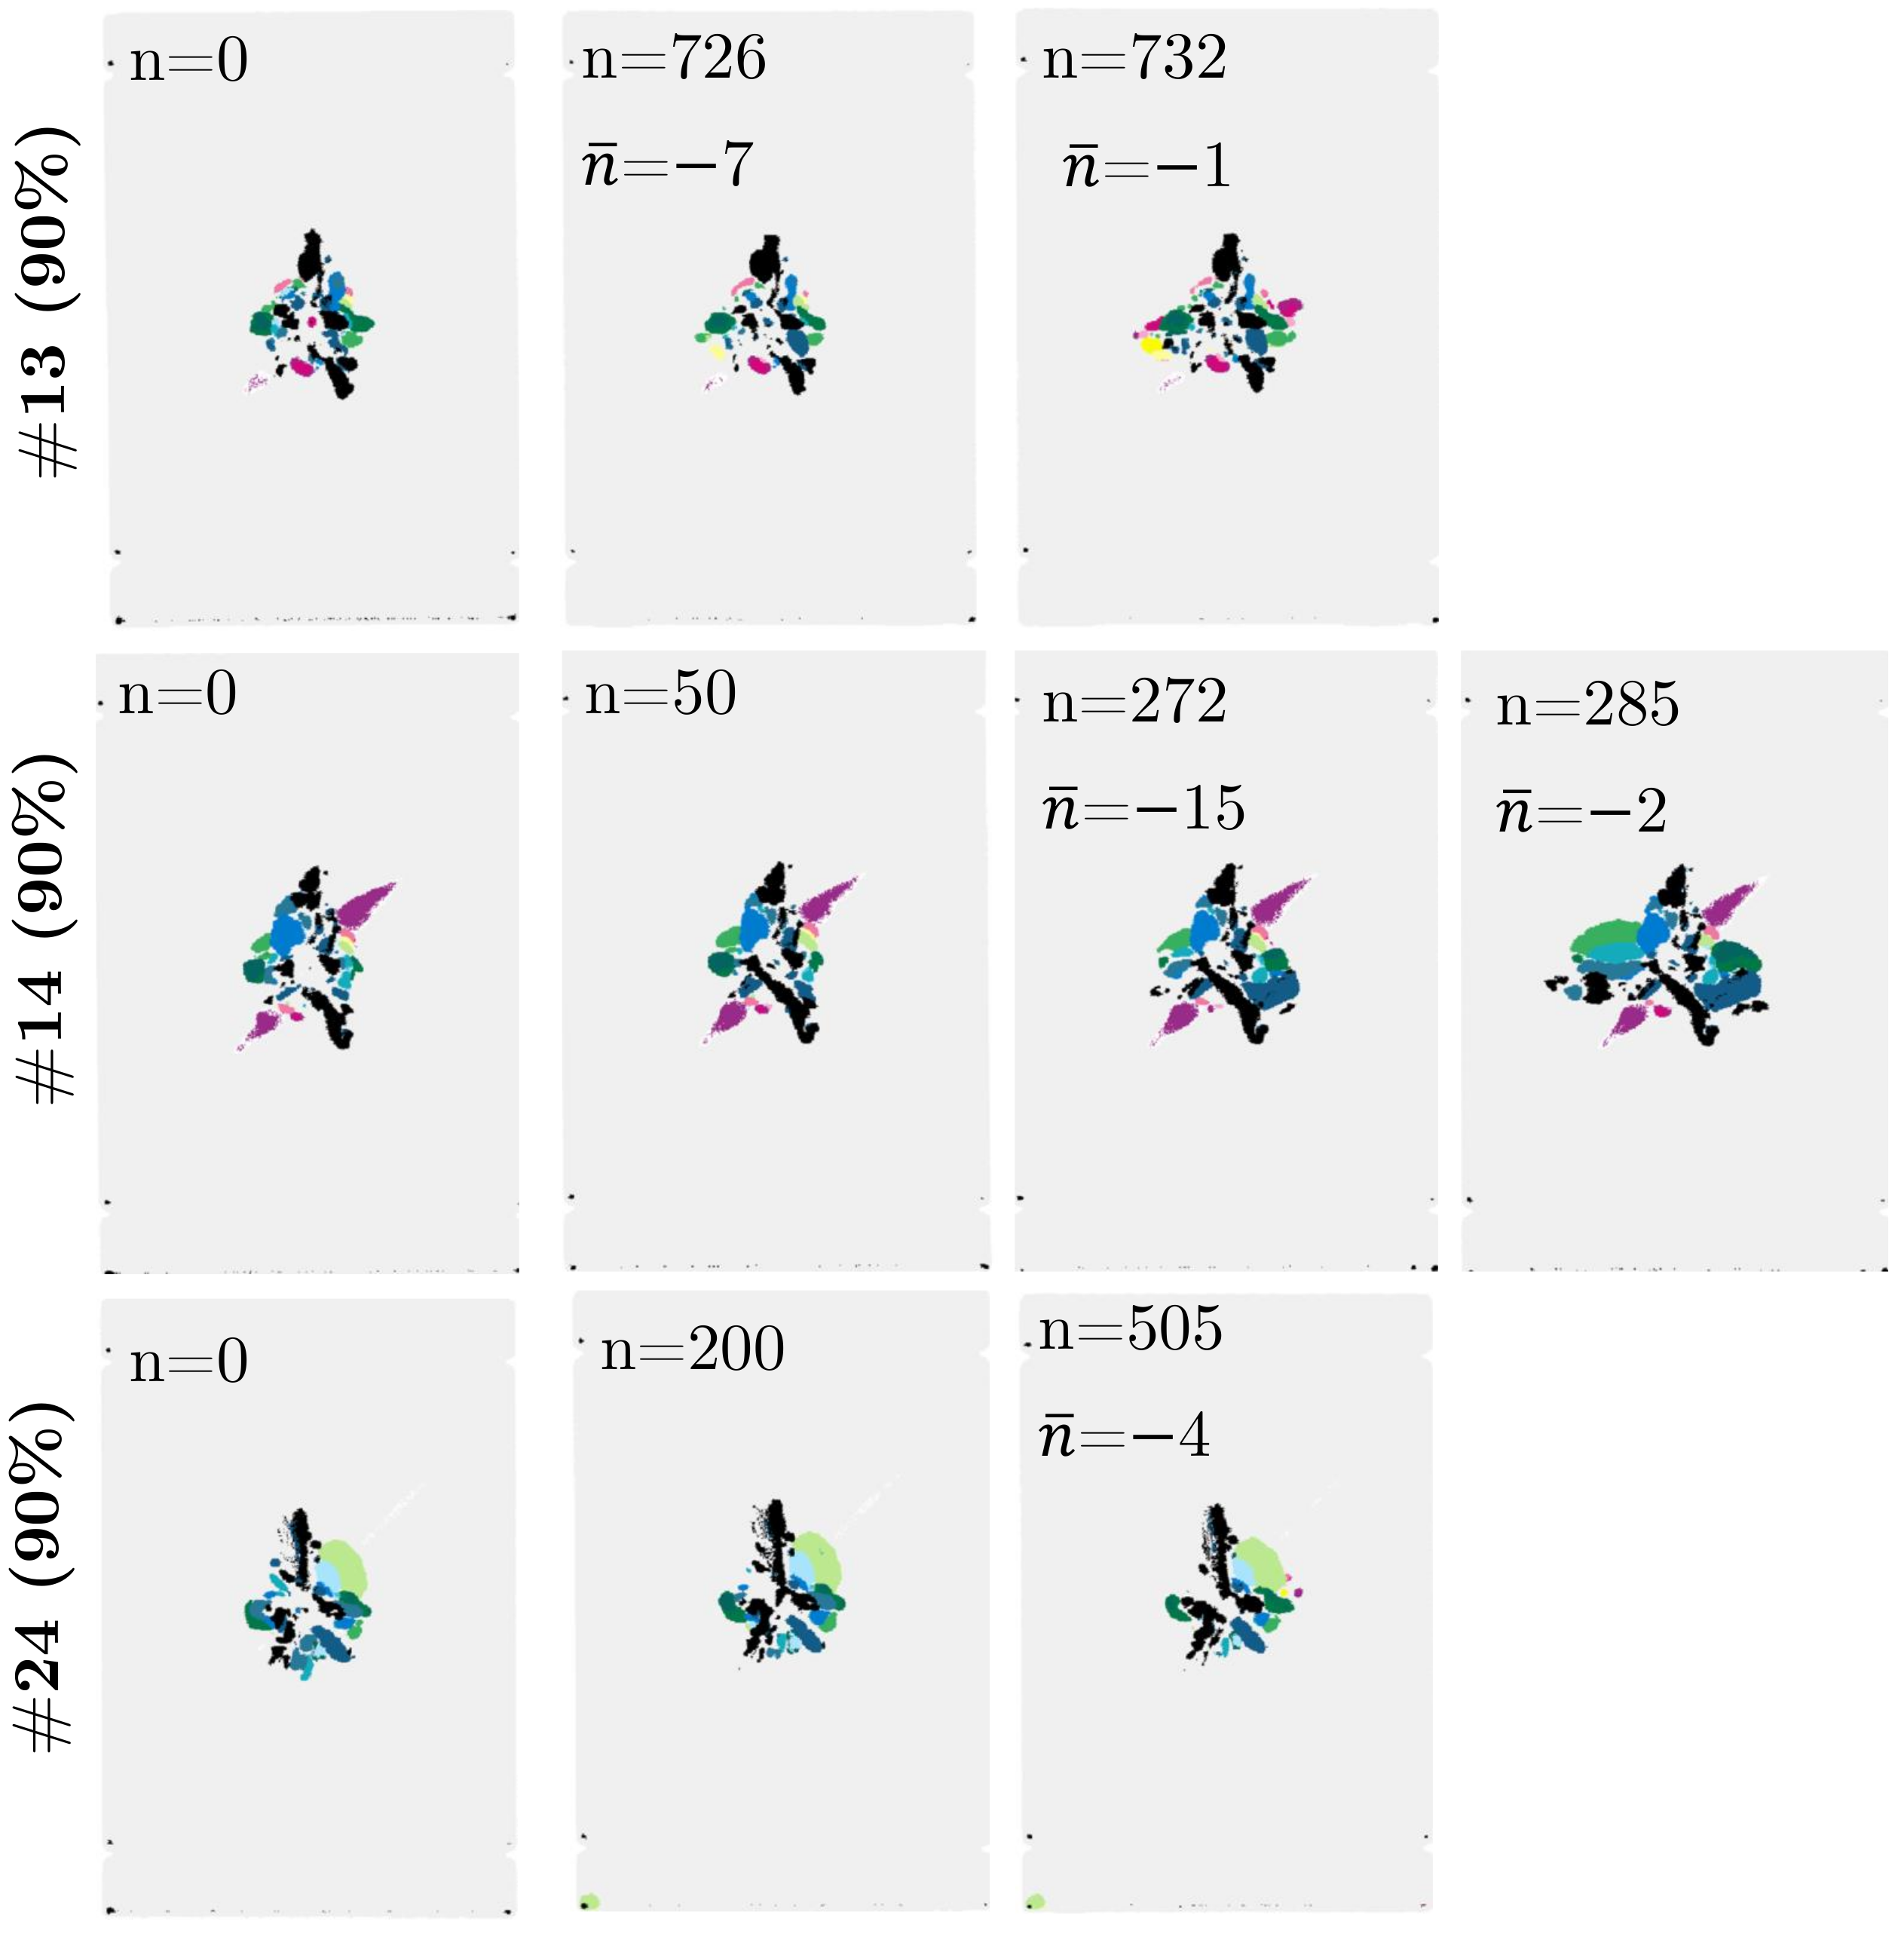
In accordance with the most results in the literature (cf. Nettles 2011 [30]), there was hardly any damage growth observed before the ultimate failure. The damage growth period was in most cases less than 1% of the total load cycles before failure. In many cases the damage growth could be perceived acoustically before ultimate failure. This indication was used to conduct an ultrasonic scan. In some cases, the test was afterwards continued in small cycling intervals. This procedure allowed to observe the CCAI failure as detailed as possible (specimens 13, 14, and 17 in Figure A1 and specimen 18 in Figure A2). These results show, that delamination begins to grow perpendicularly to the loading direction in the interfaces close to the specimen’s back surface.
It is clearly visible that a considerable damage growth does not occur until a few cycles before the final specimen failure. On all four load levels, the specimens failed suddenly. In some cases, it was not possible to conduct an ultrasonic scan closely to the ultimate failure. The earliest detected damage growth is visible on specimen 21 in Figure A2 . After 60,000 cycles—80% of the life until failure—a small increase of a delamination close to the back face was detected.
These observations do not provide any evidence for a possible slow-growth approach (in contrast to the tension after impact behavior [41]). Instead, the need for a no-growth design to account for the DT under compression load is confirmed.
3.3. Damage Visibility
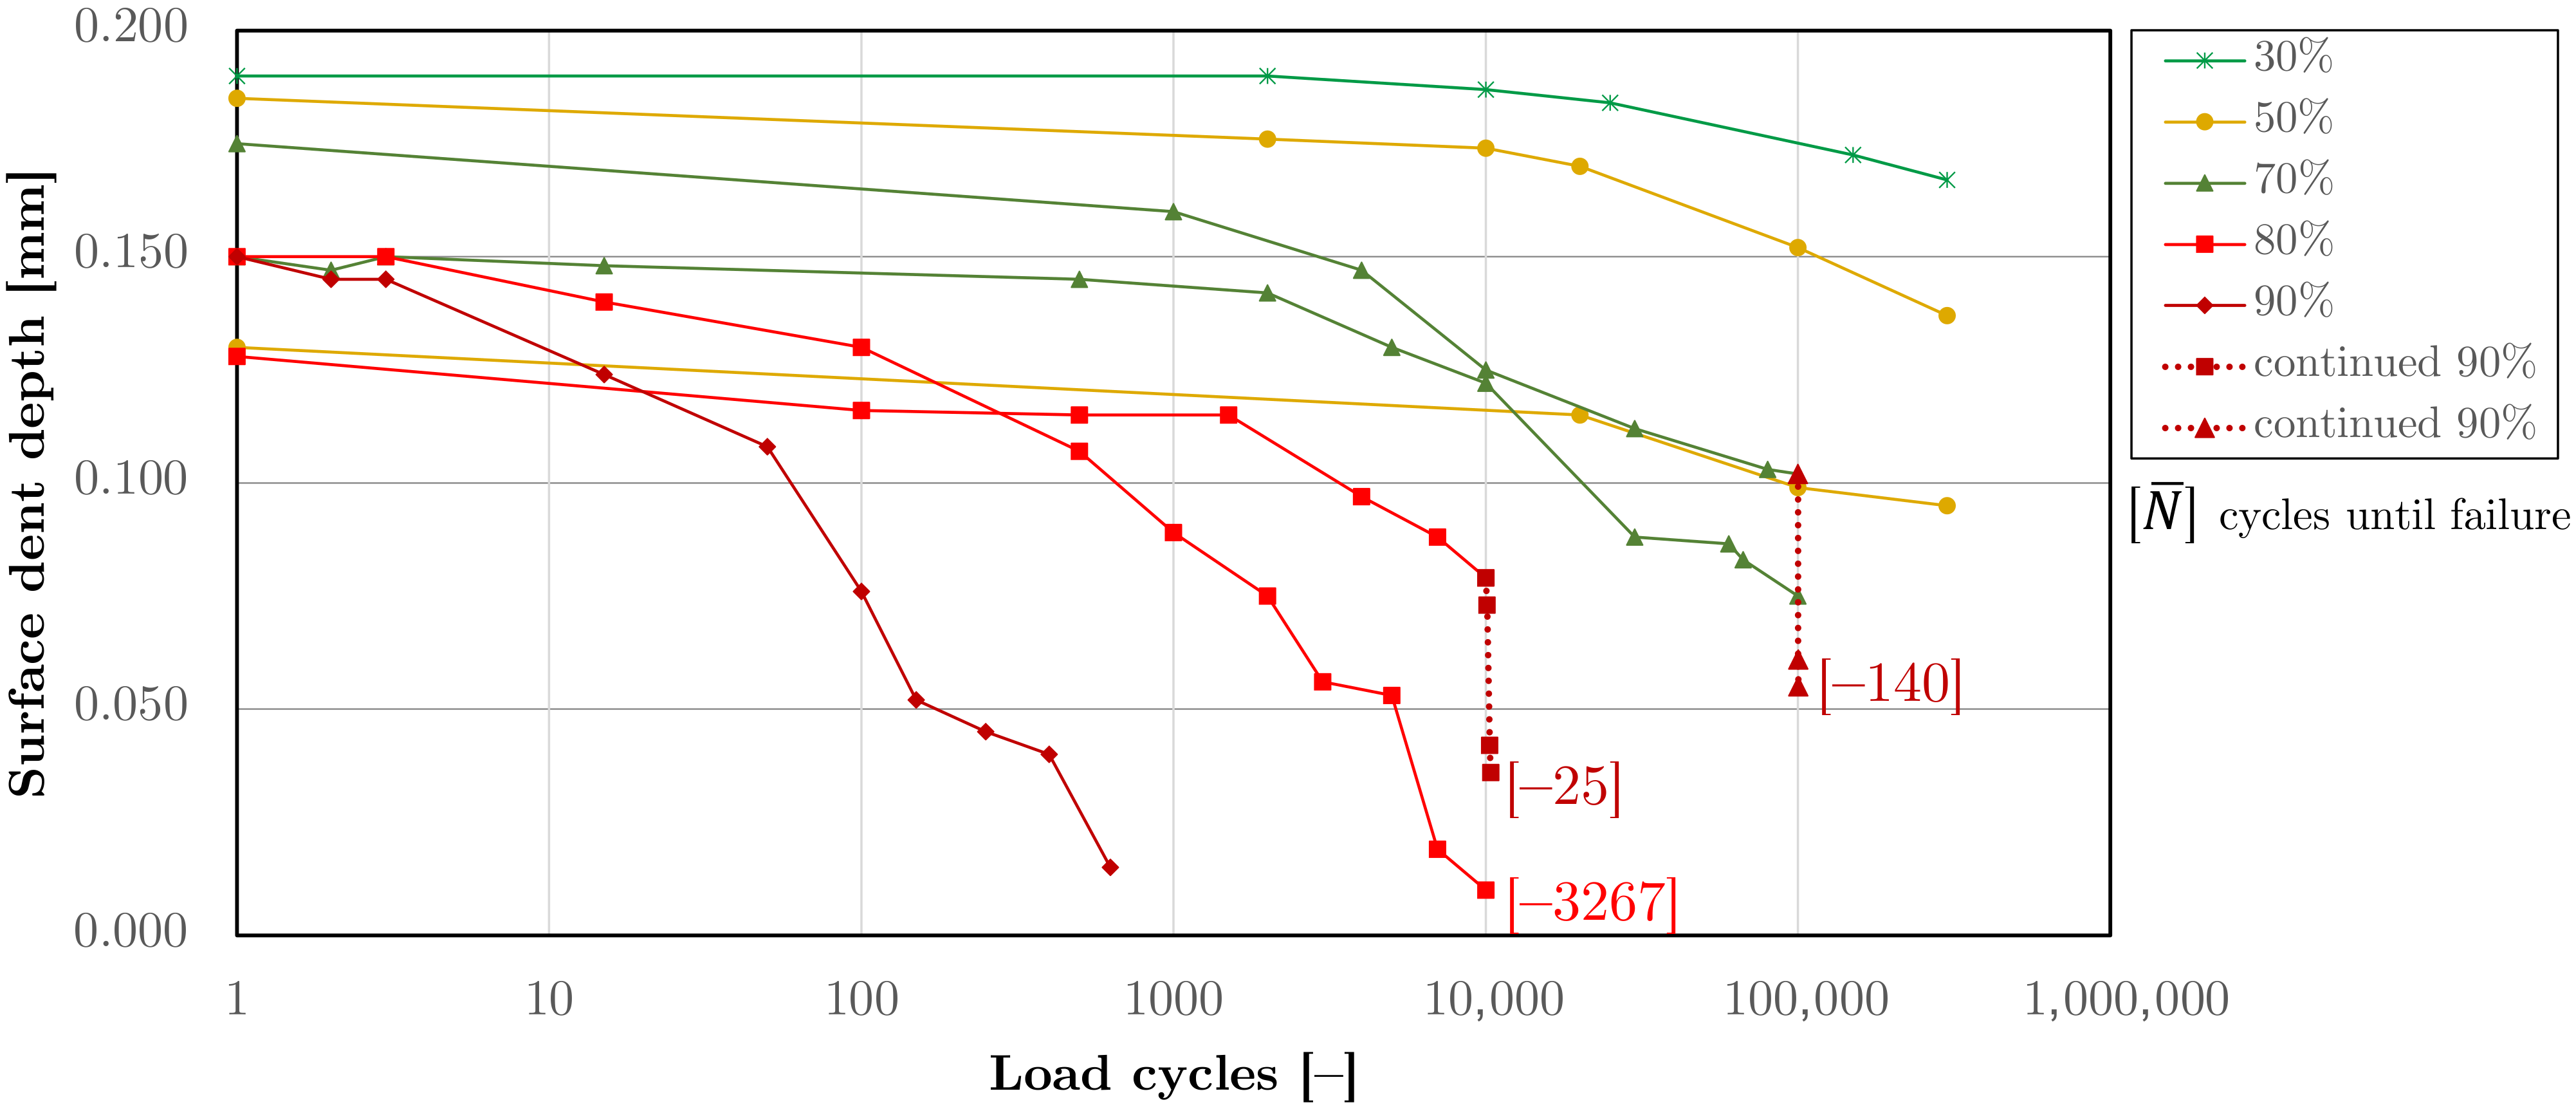
The metric to assess the damage visibility in a damage tolerant design is the dent depth at the impact location. As shown by Thomas [20] or Dubinskii [21], significant relaxation of the dent depth after the impact has to be expected. The relevant dent depth to assess the visibility is the value after the relaxation, as stated in the Composite Materials Handbook [49]. Hence, the actual value of interest is the relaxed dent depth .
The diagram in Figure 10 depicts the measured relaxation throughout the cyclic tests. The curves approve a significant relaxation which increases with the load level. Both the relaxation velocity and the maximum achievable dent relaxation depend on the load level. While the loading with 90% and 80% caused the dent depth to reach nearly zero, the relaxation velocity of other specimens slowed down significantly after a certain limit value was reached. However, cycles with an increased load level, confirmed that this limit could be overcome and the relaxation continued. In contrast to the claim of Thomas [20], a lower limit for a load level where no load-driven relaxation occurs, was not found in this study. Nonetheless, in the experiments of Feng et al. [48] a relaxation of approx. 10% was reported on a load level of 40%.
According to the Equation (1) from Thomas [20], the average initial dent depth of mm would result in a value of mm after the load-driven relaxation. This value agrees with the observation in our study, that high load levels caused the dent to relax entirely.
The inversion of the equation Equation (1) suggests an initial dent depth of mm to result in the limit value of mm after the relaxation. However, the impact test on the CAI standard specimen does not permit an appropriate investigation of the respective damage size in certain cases. In the preliminary impact study to define the energy level for the test campaign, energies up to were tested. The damage width corresponding to the impact comprised already the entire supported specimen width, while the initial dent depth was still only mm. Further increasing of the impact energy to achieve a larger dent is not possible, as the damage size would be limited by the supported width of mm. Hence, the suitability of the CAI standard impact to assess the DT relevant BVID has to be questioned for the investigated laminate.
Further, the DT relevant damage size, which is associated with the visibility threshold of mm, is in fact higher than the dent depth after relaxation apparently indicates. For the laminate under investigation, the respective BVID size would be at least (result of the impact test with an initial dent depth of mm). As the BVID is the smallest damage which can be detected in a detailed visual inspection, this large damage size indicates the need for the detection of smaller damage within the inspection. Improved damage detection methods beyond visual inspection have to be considered. Either through special detailed inspection procedures [22] or through structural health monitoring (cf. guided waves [23,50,51] or acoustic emission [52]) are possible options to detect damage independently from the dent depth.
3.4. Explanation of the Dent Relaxation
The causes of the dent relaxation and the seemingly decreasing delamination area were further investigated through polished cross sections of the impacted specimens. Two sample specimens were cut to gain insight on the damage mechanisms caused by the cyclic load. The first specimen, depicted in Figure 11a, was cut directly after the impact. The visible damage in this picture reveals open delaminations and inter-fiber fracture. This effect is already known by the work of Bouvet et al., who found that small resin debris prevents delamination cracks from closing [15].
The second image in Figure 11b corresponds to a specimen which was subjected to cyclic load which lead to a dent relaxation from mm to mm. Apparently, the cyclic load affects the crack pattern in the laminate. Through the continuous loading and unloading, the ply debris shifts enabling closure of previously blocked cracks and the cracked ply realigns. This further relaxation has direct influence on the surface dent depth as, according to Bouvet et al., the blocking of the crack closure is a primary cause of the surface dent accompanying an impact damage.
Also the seemingly reduced delamination area in the ultrasonic scan can be explained through this realignment. When a delamination crack entirely closes, the adjoining faces lie against each other. This direct contact of the separated plies reduces the damping of the ultrasonic sound wave in the through-transmission scan. In the same way, the delamination face produces a lower echo signal which is evaluated for the D-Scan. Thus, the measured delamination area decreases without an actual decrease of the damage.
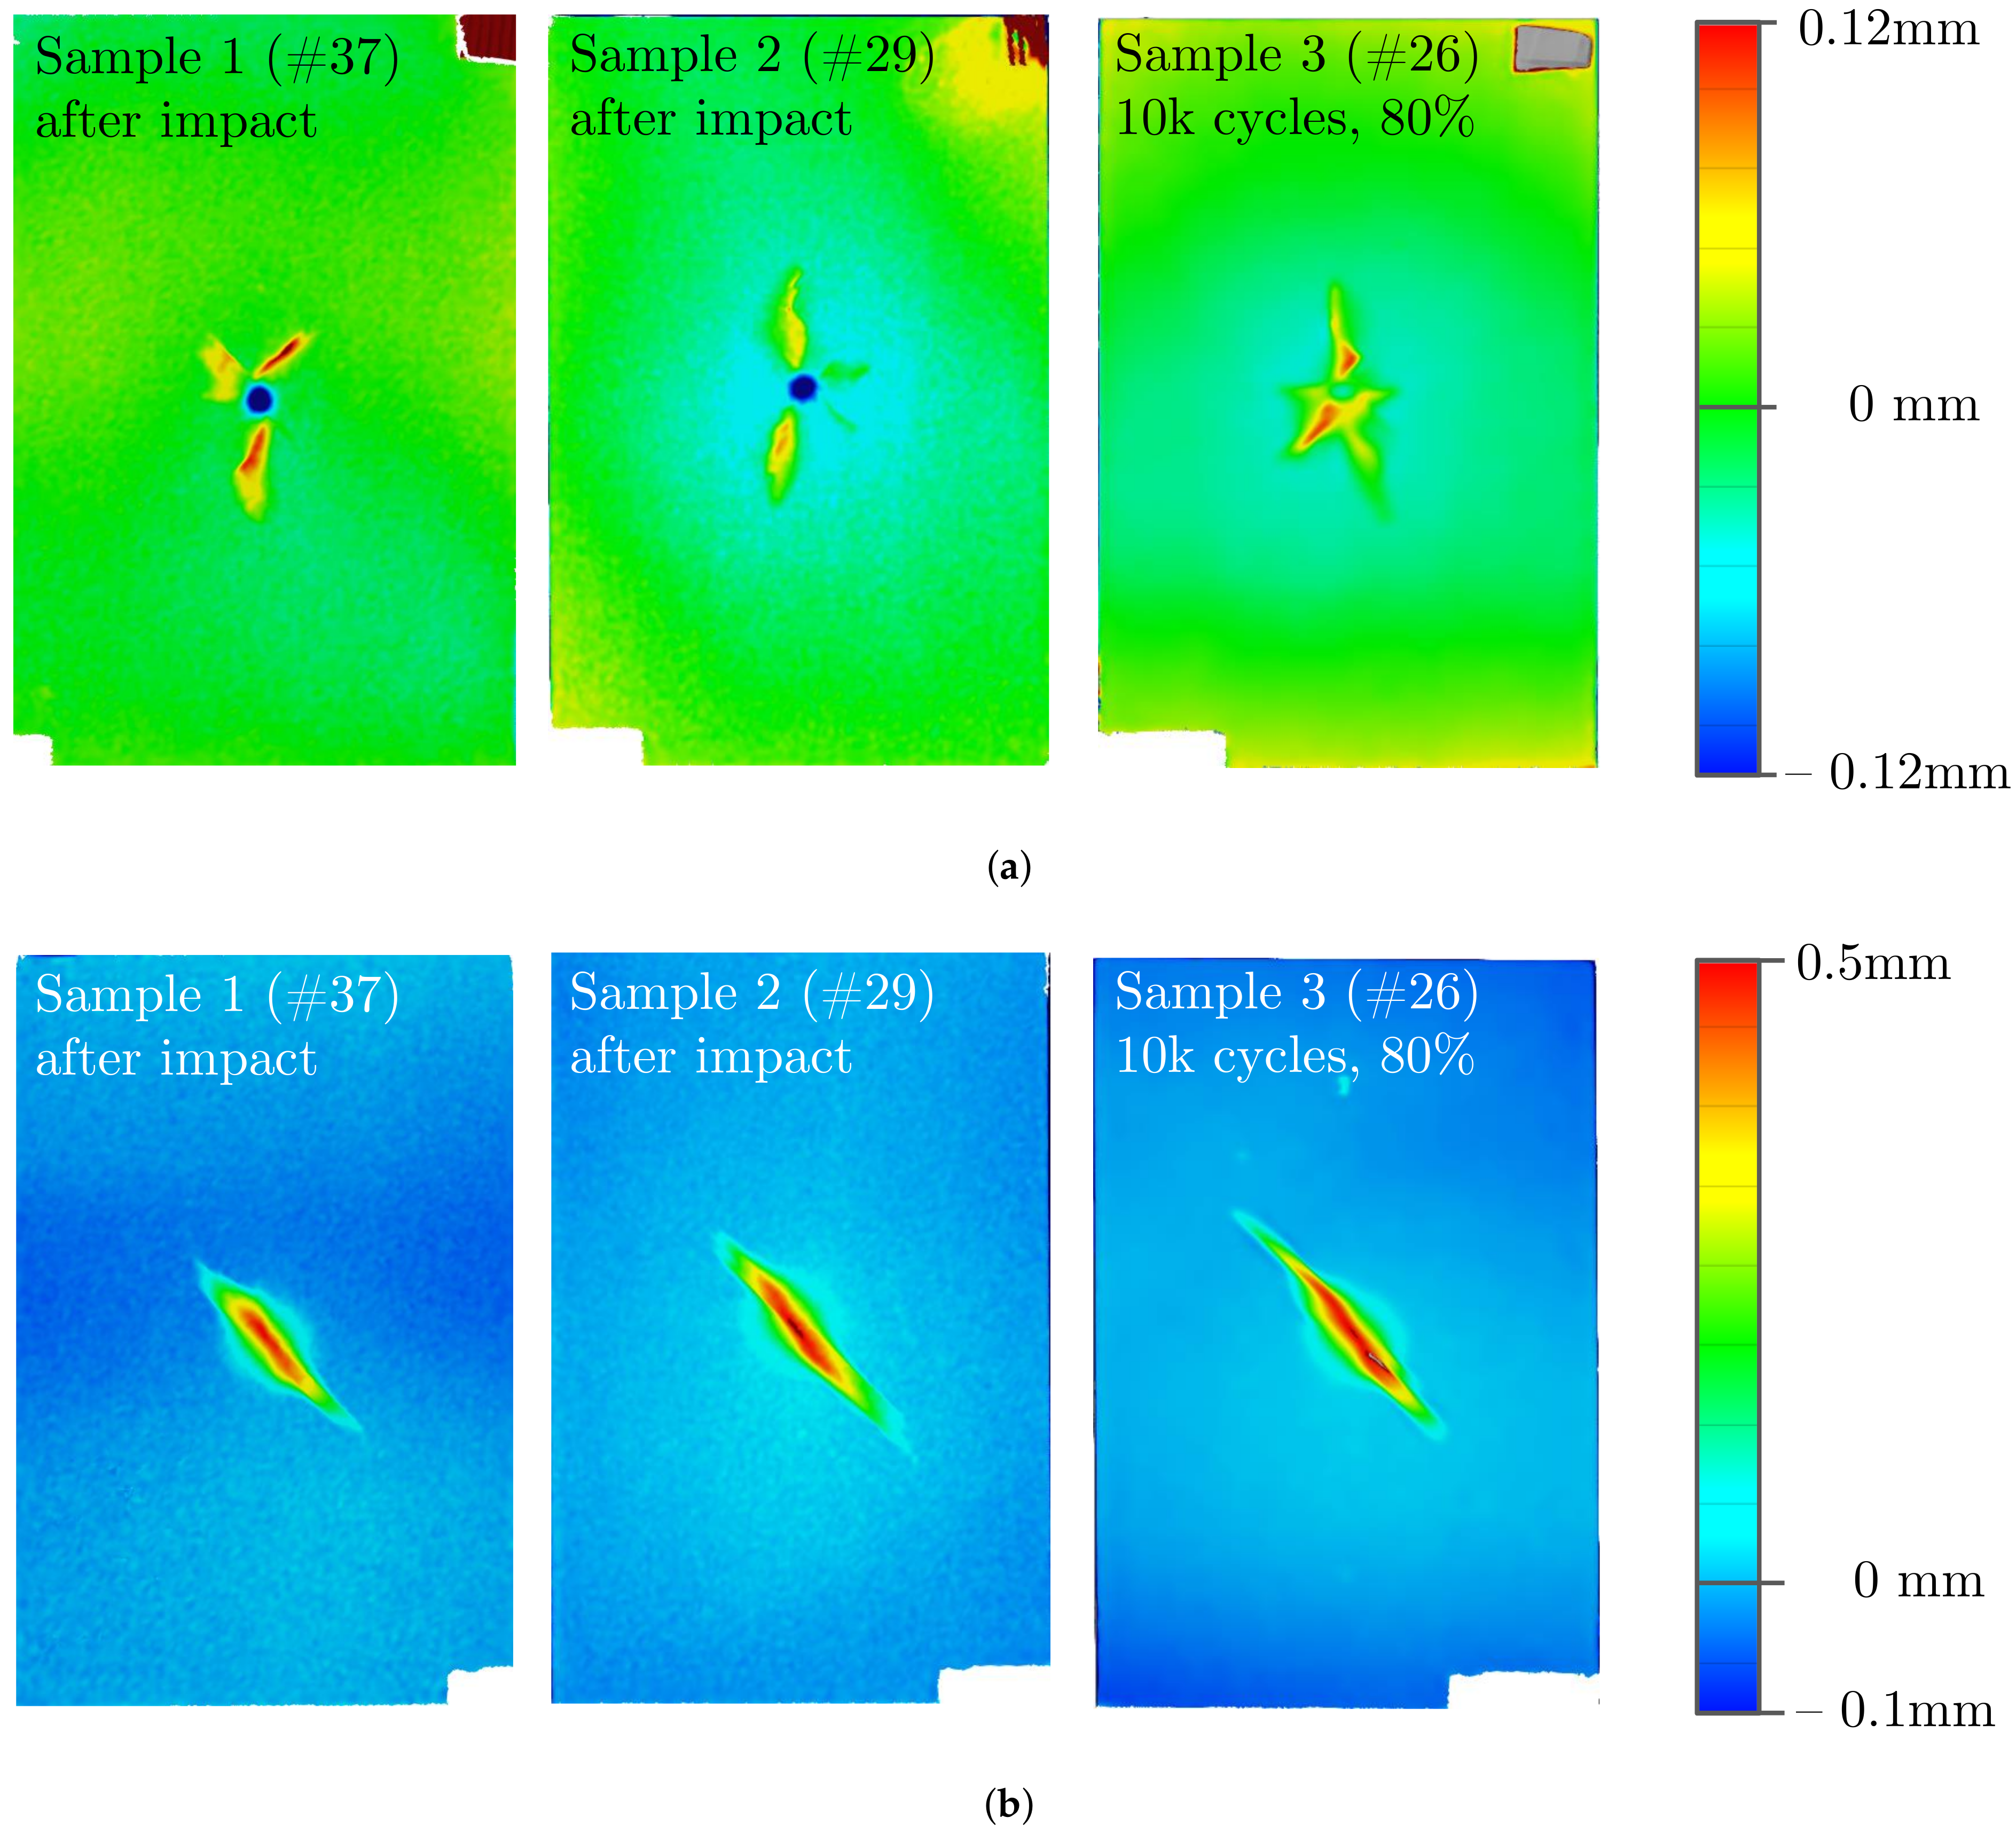
For the further investigation of the relaxation phenomena, the geometry of selected specimens was measured through 3D scanning by an ATOS digital image correlation test equipment (https://www.gom.com/en/products/3d-scanning/atos-compact-scan, accessed on 9 November 2021). The results of these measurement can be seen in the Figure 12. Two specimens were scanned directly after the impact, a third specimen was scanned after 10,000 cycles at a load level of 80%. Obviously, the deformation at the impact location is dominated by a significant dent (blue) on the impact side. This dent vanished entirely, in case of the third specimen which was subjected to cyclic loading. The deformed state on the back side is driven by a different phenomenon. A fiber bundle sticking out due to small fiber fracture combined with the ply splitting which occurs on the back side. This deformation on the back side is qualitatively similar for the specimens before and after the load-driven relaxation. In agreement with this discovery, no relaxation on the back side could be measured. The stick out height remained constant over the time and cyclic load. Eventually, the scans reveal a slight imperfection of the specimens, pertaining the deformation mode of the impact load. This deformation can be observed before and after the cyclic load. From these observations, it is concluded that the relaxation primarily affects the local dent at the impact location.
3.5. Damage Mode of the Ultimate Failure
To assess the influence of the cyclic load on the ultimate failure under compression, the observed damage pattern after a quasi-static test is compared with the damage pattern observed after failure through cyclic loading. The impact damage analyzed in the presented test campaign includes significant compression-driven fiber failure on the impact side. The impact back side shows hardly any fiber failure but ply splitting through interfiber failure. The typical damage pattern of the compression after impact experiments emerges through a fiber kink band which results from the propagation of the preexisting fiber cracks in the upper plies. As the images of a specimen after the quasi-static CAI test shows in Figure A4a, the kink band causes an actual crack in the uppermost ply over the entire specimen width. In contrast to that, no visible fiber cracking emerges on the backside of the same specimen. Instead, the lower plies buckle and sublaminates separate from the other plies. This crack pattern, which is referred as type I failure in the following, was observed on all five specimens subjected to quasi-static CAI tests.
The failure pattern of the specimen that were subjected to cyclic load was found to differ from the above-described failure type I. The Figure A4b,c show two specimens which failed under cyclic load on the load levels 70% and 90%, respectively. Instead of a fiber kink band with broken fibers, the uppermost ply buckles with the fibers remaining intact for the most part. This pattern is referred as failure type II. In some cases, broken fibers on the impact side were still observed, for instance on the left side on of the specimen in Figure A4c, which we interpret as a mixture both failure types. Also, on the coupons’ back side differences between the quasi-static failure and the cyclic failure were found. Instead of the ply buckling with intact fibers, the cracking of fibers in the lowermost ply can be observed. In Figure A4c such cracking comprises the entire specimen width, in case of the specimen depicted in Figure A4b broken fibers emerge only in the edge regions. Failure of type II was not observed on any specimen after quasi-static failure in the CAI test. Nonetheless, in case of ultimate failure under cyclic load different types emerged. Finally, the residual strength tests with specimens previously subjected to cyclic loading revealed a behavior which resembles the CAI failure. The Table 3 provides an overview about the number of specimens for each test type and the respective failure type.
There are various possible reasons for the observed differences in the failure modes. First, the above-described dent relaxation under cyclic load affects the specimen geometry at the impact location (cf. Section 3.4). After the impact, the centric dent on the specimen (cf. Figure 12a) represents a geometric imperfection. With this dent relaxing through the cyclic loading, the imperfection gets reduced. Second, the cyclic compression causes fatigue effects to the entire laminate. Micro cracking in the matrix material can initiate independently from the impact damage [53,54]. Such cracking weakens the matrix and could facilitate the occurring of fiber kinking, as this failure mode depends on the capability of the matrix to stabilize the fibers [55]. This reduced stabilization could explain the cracked fibers on the back side under cyclic load. Third, it is possible that the relocation of the ply-debris out of blocked cracks into empty breakout-spots and the resulting realignment of the cracked plies might impede sublaminate buckling and facilitate fiber kinking resulting in a shift of failure modes. Eventually, the combination of all the phenomena can be the cause of the different failure patterns.
4. Conclusions and Outlook
In this experimental investigation was studied how impact damage in CFRP coupons specimens evolves under cyclic compression load. The impact-damaged specimens were impacted and subjected to different cyclic load levels between and with a maximum of 300,000 cycles. Through ultrasonic inspection, 3D scanning, and dent measurement various effects were revealed concerning the damage propagation, the dent relaxation, and the influence to the residual strength:
- The most part of the specimen life under cyclic load the damage remains unchanged.
- Shortly before the final failure, the impact damage begins to propagate perpendicularly to the loading direction. In particular, delamination growth was found at the interfaces close to the back side.
- The dent at the impact location relaxes significantly under cyclic loading. Relaxation was observed on all load levels and can lead to the complete disappearance of the dent.
- The ultimate failure under cyclic loading reveals a different failure mode than the ultimate failure under quasi-static load. Under cyclic loading, fiber breakage is observed mainly on the back side while ply buckling occurs on the impact side.
The results confirm the known difficulties about the evolution of impact damage under cyclic compression loading, which require a damage tolerant design through the no-growth approach. Additionally, the dent relaxation decreases the damage detectability through visual inspection methods which indicates that improved detection methods can significantly reduce the DT relevant damage size.
Further, the investigation revealed effects of scatter concerning the impact damage and the resulting residual properties. To achieve a further understanding of this scattering, the occurring damage modes, their causes, and their correlation with particular residual properties have to be further investigated.
Author Contributions
Conceptualization, R.B.; Data curation, R.B.; Formal analysis, R.B. and C.G.; Investigation, R.B. and C.G.; Methodology, R.B.; Visualization, R.B.; Writing—original draft, R.B. and C.G.; Writing—review & editing, R.B. and C.G. All authors have read and agreed to the published version of the manuscript.
Funding
This research was funded through the DLR projects KonTeKst and oLAF.
Institutional Review Board Statement
Not applicable.
Informed Consent Statement
Not applicable.
Data Availability Statement
The data generated during the current study is currently not publicly available due to available from the corresponding author on reasonable request.
Acknowledgments
All research was accomplished within the DLR projects KonTeKst and oLAF. The authors acknowledge the DLR for funding these projects.
Conflicts of Interest
The authors declare no conflict of interest.
Appendix A. Result Figures of the Cyclic Coupon Tests
Figure A1.
Observation of the delamination growth in the ultrasonic D-scan of selected specimens on the load levels 90% and 80%.
Figure A1.
Observation of the delamination growth in the ultrasonic D-scan of selected specimens on the load levels 90% and 80%.


Figure A2.
Observation of the delamination growth in the ultrasonic D-scan of selected specimens on the load levels 75% and 70%.
Figure A2.
Observation of the delamination growth in the ultrasonic D-scan of selected specimens on the load levels 75% and 70%.


Figure A3.
Observation of the delamination growth in the ultrasonic D-scan of selected specimens on the load levels 50% and 30%.
Figure A3.
Observation of the delamination growth in the ultrasonic D-scan of selected specimens on the load levels 50% and 30%.

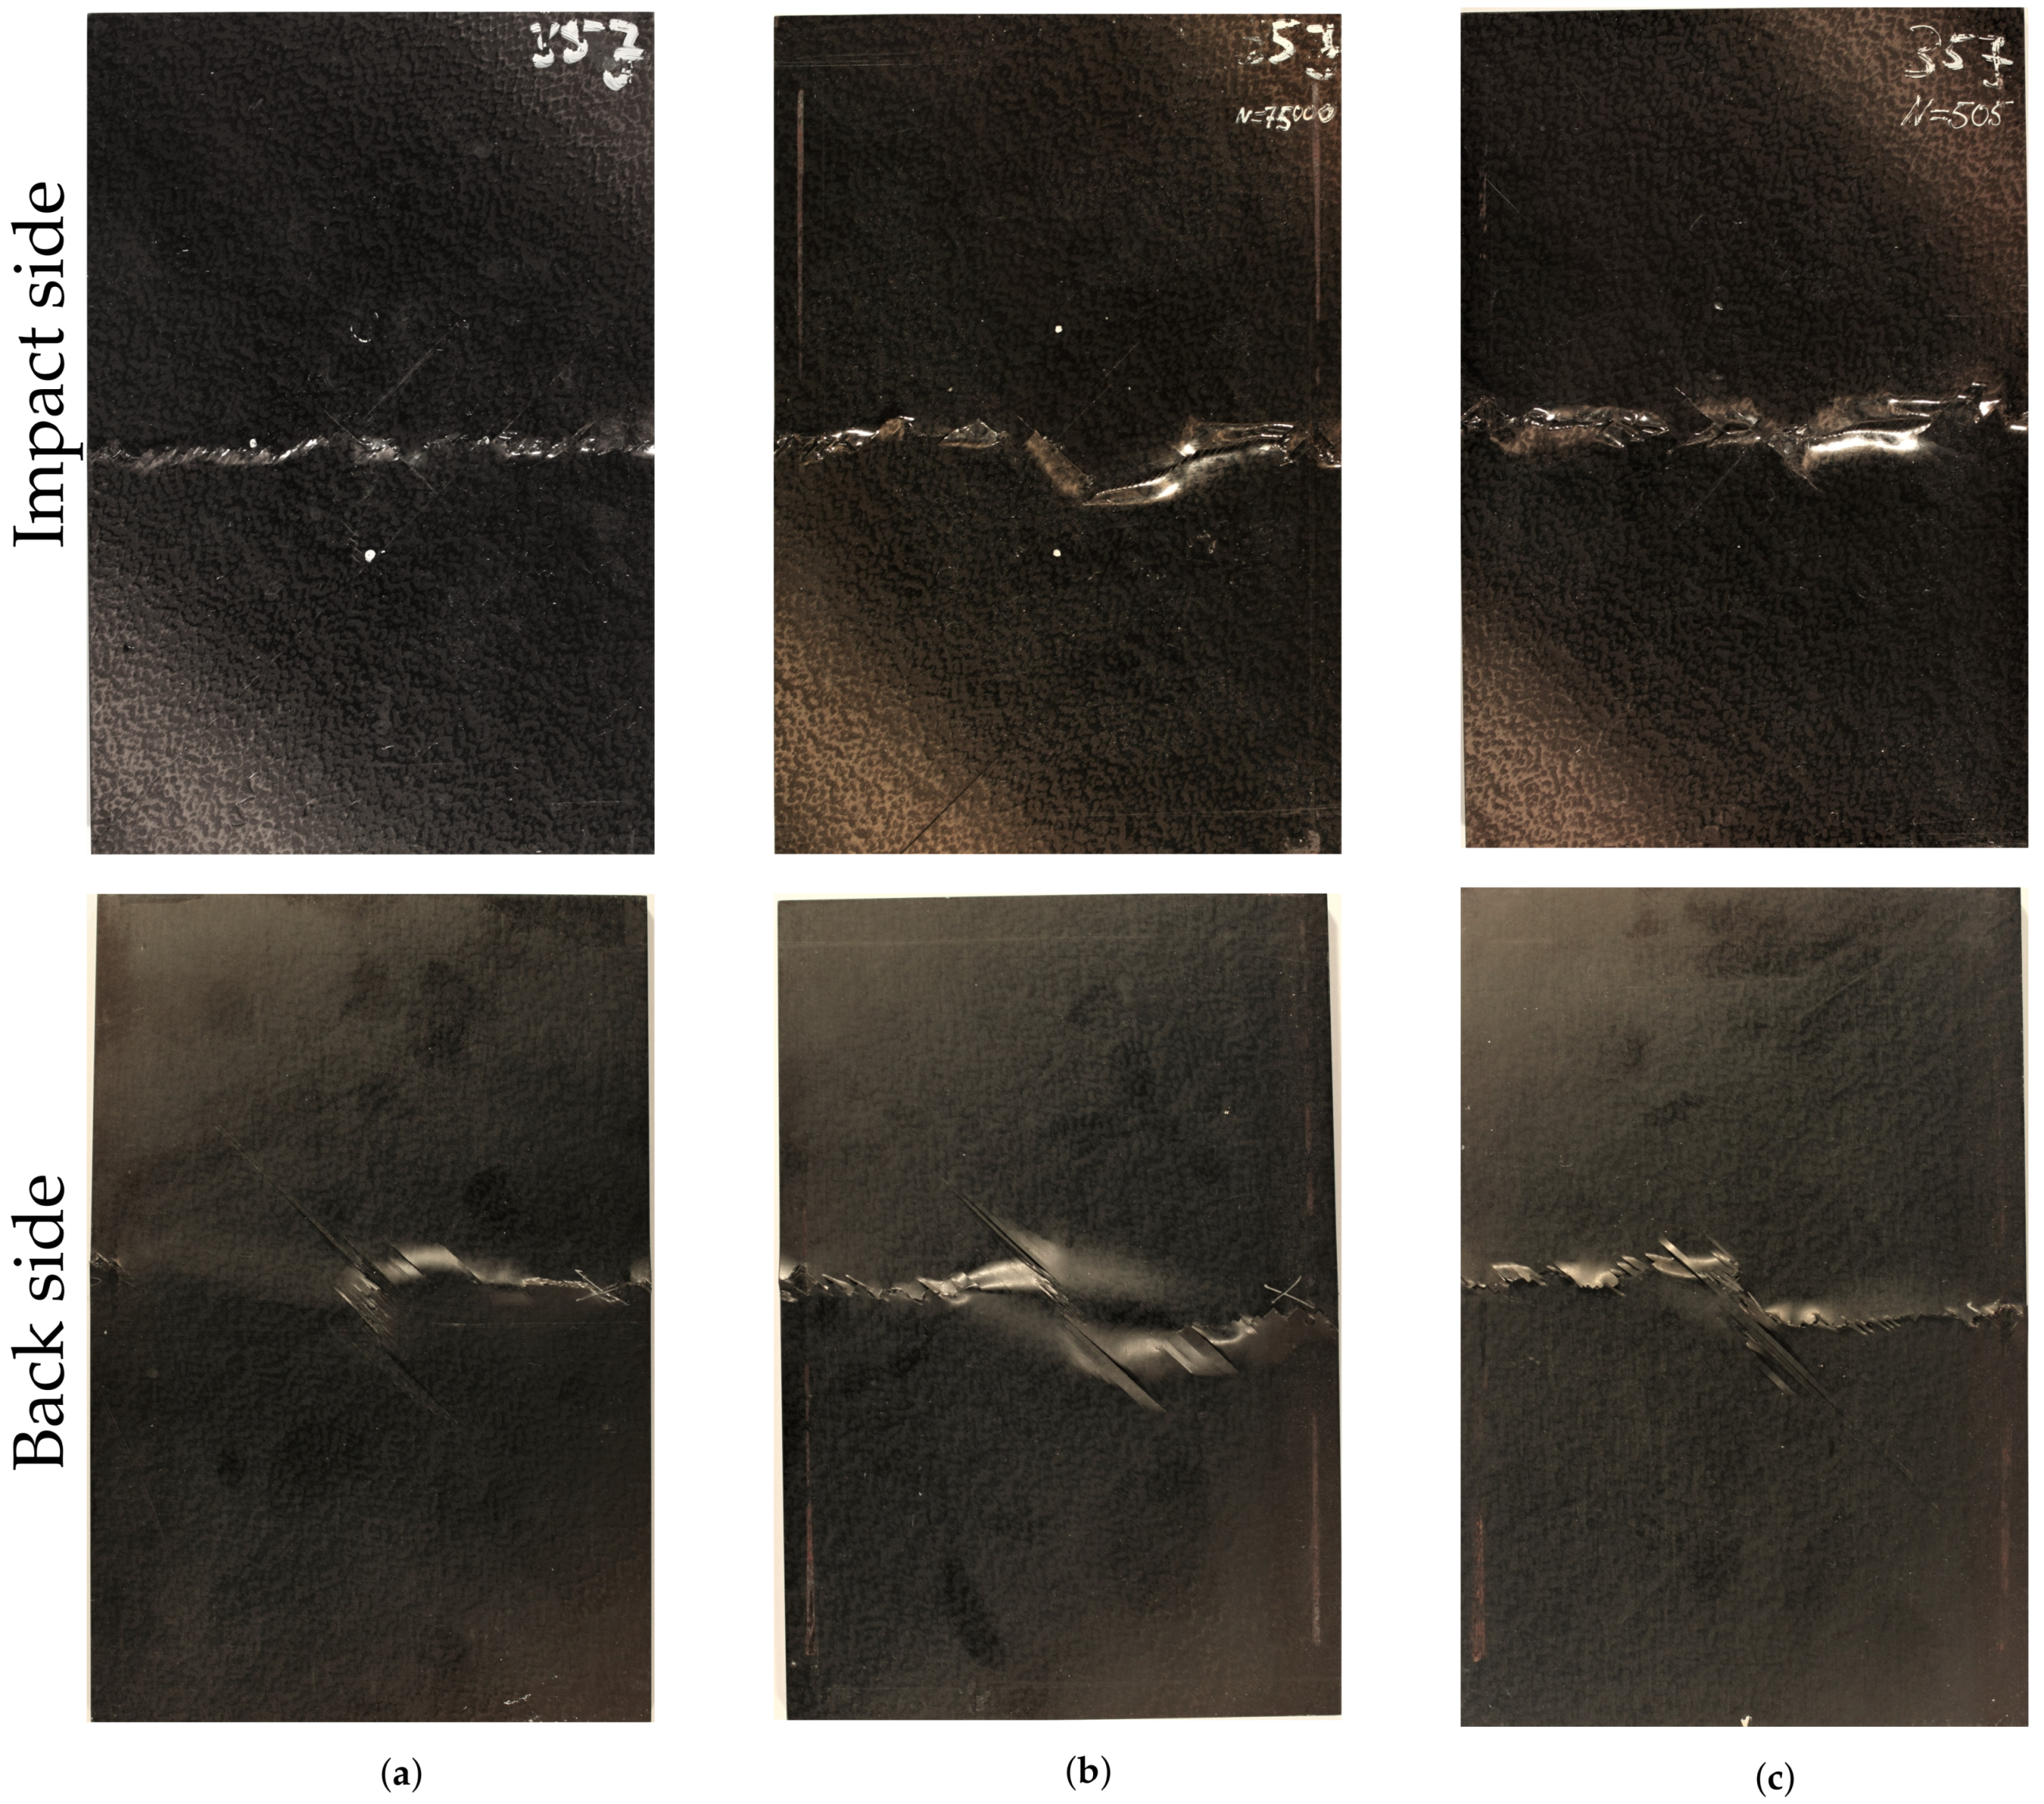
Figure A4.
Exemplary images of three specimens after ultimate failure. The upper row shows the impact side, the lower row the back side. (a) Failure type I (Quasistatic failure, example: CAI failure), (b) Failure type II (Cyclic failure, example: 70% load level), (c) Mixed failure type (Cyclic failure, example: 90% load level).

References
- O’Brien, T.K. Towards a Damage Tolerance Philosophy for Composite Materials and Structures; Technical Report March; NASA: Hampton, WV, USA, 1988.
- Abir, M.; Tay, T.; Ridha, M.; Lee, H. On the relationship between failure mechanism and compression after impact (CAI) strength in composites. Compos. Struct. 2017, 182, 242–250. [Google Scholar] [CrossRef]
- Riccio, A. GARTEUR AG-32: Damage Growth in Composites Final Report TP-176; Technical Report; Second University of Naples: Caserta, Italy, 2012. [Google Scholar]
- Abrate, S. Impact on Composite Structures; Cambridge University Press: Cambridge, UK, 1998. [Google Scholar]
- Richardson, M.; Wisheart, M. Review of low-velocity impact properties of composite materials. Compos. Part A Appl. Sci. Manuf. 1996, 27, 1123–1131. [Google Scholar] [CrossRef]
- Dubinskii, S.; Feygenbaum, Y.; Senik, V.; Metelkin, E. A study of accidental impact scenarios for composite wing damage tolerance evaluation. Aeronaut. J. 2019, 123, 1724–1739. [Google Scholar] [CrossRef] [Green Version]
- Federal Aviation Administration. Advisory Circular 25.571-1D; Federal Aviation Administration: Washington, DC, USA, 2011.
- Federal Aviation Administration. Advisory Circular: 20-107B—Composite Aircraft Structure; Federal Aviation Administration: Washington, DC, USA, 2009.
- EASA. AMC 20-29 Composite Aircraft Structure—Annex II to ED Decision 2010/003/R of 19/07/2010; EASA: Cologne, Germany, 2010; pp. 1–36. [Google Scholar]
- Goudou, P. Decision No 2010/003/R of the Executive Director of the European Aviation Safety Agency; Technical Report; EASA: Cologne, Germany, 2010. [Google Scholar]
- Mitrovic, M.; Hahn, H.T.; Carman, G.P.; Shyprykevich, P. Effect of loading parameters on the fatigure behaviour of impact damaged composite laminates. Compos. Sci. Technol. 1999, 59, 2059–2078. [Google Scholar] [CrossRef]
- Davies, G.; Irving, P. Impact, Post-Impact Strength and Post-Impact Fatigue Behaviour of Polymer Composites; Elsevier Ltd.: Amsterdam, The Netherlands, 2014; pp. 231–259. [Google Scholar] [CrossRef]
- Pascoe, J.A. Slow-growth damage tolerance for fatigue after impact in FRP composites: Why current research won’t get us there. Procedia Struct. Integr. 2020, 28, 726–733. [Google Scholar] [CrossRef]
- IASB. Handbuch Struktur Berechnung; Number 2016; Struktur-Berechnungsunterlagen, Industrie-Ausschuss: Ottobrunn, Germany, 1976; pp. 1–20. [Google Scholar]
- Bouvet, C.; Rivallant, S.; Barrau, J.J. Low velocity impact modeling in composite laminates capturing permanent indentation. Compos. Sci. Technol. 2012, 72, 1977–1988. [Google Scholar] [CrossRef] [Green Version]
- ASTM. ASTM D7136—Standard Test Method for Measuring the Damage Resistance of a Fiber-Reinforced Polymer Matrix Composite to a Drop-Weight Impact Event; ASTM: West Conshohocken, PA, USA, 2005. [Google Scholar] [CrossRef]
- Airbus Industries. AITM 1-0010 Determination of Compression Strength after Impact; Airbus Industries: Leiden, The Netherlands, 2005. [Google Scholar]
- Deutsches Institut für Normung. DIN EN 6038—Bestimmung der Restdruckfestigkeit nach Schlagbeanspruchung; Deutsches Institut für Normung: Berlin, Germany, 1996. [Google Scholar]
- SAE International. Polymer Matrix Composites Materials Usage, Design, and Analysis. In Composite Materials Hanbook (CMH-17); SAE International: Wichita, KS, USA, 2012; Chapter 12; Volume 3. [Google Scholar]
- Thomas, M. Study on the Evolution of the Dent Depth due to an Impact on Carbon/Epoxy Laminates. Consequences on Impact Damage Visibility and on in Service Inspection Requirements for Civil Aircraft Composite Structures. In Proceedings of the MIL-HDBK 17 Meeting, Monterey, CA, USA, 29–31 March 1994; pp. 126–129. [Google Scholar]
- Dubinskii, S.; Fedulov, B.; Feygenbaum, Y.; Gvozdev, S.; Metelkin, E. Experimental evaluation of surface damage relaxation effect in carbon-fiber reinforced epoxy panels impacted into stringer. Compos. Part B Eng. 2019, 176, 107258. [Google Scholar] [CrossRef]
- Papa, I.; Ricciardi, M.R.; Antonucci, V.; Langella, A.; Tirillò, J.; Sarasini, F.; Pagliarulo, V.; Ferraro, P.; Lopresto, V. Comparison between different non-destructive techniques methods to detect and characterize impact damage on composite laminates. J. Compos. Mater. 2019, 54, 617–631. [Google Scholar] [CrossRef]
- Moix-Bonet, M.; Eckstein, B.; Wierach, P. Probability—Based Damage Assessment on a Composite Door Surrounding Structure. In Proceedings of the 8th European Workshop On Structural Health Monitoring (EWSHM), Bilbao, Spain, 5–8 July 2016. [Google Scholar]
- Sikdar, S.; Banerjee, S. Structural Health Monitoring of Advanced Composites Using Guided Waves, 1st ed.; Lambert Academic Publishing: Beau Bassin, Mauritius, 2017. [Google Scholar]
- Clark, G.; Van Blaricum, T.J. Load spectrum modification effects on fatigue of impact-damaged carbon fibre composite coupons. Composites 1987, 18, 243–251. [Google Scholar] [CrossRef]
- Rhead, A.T.; Butler, R.; Hunt, G.W. Compressive strength of composite laminates with delamination- induced interaction of panel and sublaminate buckling modes. Compos. Struct. 2017, 171, 326–334. [Google Scholar] [CrossRef]
- Dienel, C.P.; Meyer, H.; Werwer, M.; Willberg, C. Estimation of airframe weight reduction by integration of piezoelectric and guided wave–based structural health monitoring. Struct. Health Monit. 2018, 18, 1778–1788. [Google Scholar] [CrossRef] [Green Version]
- Sebaey, T.A.; González, E.V.; Lopes, C.S.; Blanco, N.; Costa, J. Damage resistance and damage tolerance of dispersed CFRP laminates: Design and optimization. Compos. Struct. 2013, 95, 569–576. [Google Scholar] [CrossRef]
- Dubary, N.; Bouvet, C.; Rivallant, S.; Ratsifandrihana, L. Damage tolerance of an impacted composite laminate. Compos. Struct. 2018, 206, 261–271. [Google Scholar] [CrossRef] [Green Version]
- Nettles, A.; Hodge, A.; Jackson, J. An examination of the compressive cyclic loading aspects of damage tolerance for polymer matrix launch vehicle hardware. J. Compos. Mater. 2011, 45, 437–458. [Google Scholar] [CrossRef]
- Melin, L.G.; Schön, J. Buckling behaviour and delamination growth in impacted composite specimens under fatigue load: An experimental study. Compos. Sci. Technol. 2001, 61, 1841–1852. [Google Scholar] [CrossRef]
- Symons, D.D.; Davis, G. Fatigue testing of impact-damaged T300/914 carbon-fibre-reinforced plastic. Compos. Sci. Technol. 2000, 60, 379–389. [Google Scholar] [CrossRef]
- Uda, N.; Ono, K.; Kunoo, K. Compression fatigue failure of CFRP laminates with impact damage. Compos. Sci. Technol. 2009, 69, 2308–2314. [Google Scholar] [CrossRef]
- Saunders, D.S.; Van Blaricum, T.J. Effect of load duration on the fatigue behaviour of graphite/epoxy laminates containing delaminations. Composites 1988, 19, 217–228. [Google Scholar] [CrossRef]
- Chen, A.S.; Almond, D.P.; Harris, B. In situ monitoring in real time of fatigue-induced damage growth in composite materials by acoustography. Compos. Sci. Technol. 2001, 61, 2437–2443. [Google Scholar] [CrossRef]
- Nezhad, H.Y.; Merwick, F.; Frizzell, R.; McCarthy, C. Numerical analysis of low-velocity rigid-body impact response of composite panels. Int. J. Crashworthiness 2015, 20, 27–43. [Google Scholar] [CrossRef]
- Bogenfeld, R.; Kreikemeier, J.; Wille, T. Review and Benchmark Study on the Analysis of Low-Velocity Impact on Composite Laminates. Eng. Fail. Anal. 2018, 86, 72–99. [Google Scholar] [CrossRef]
- Bogenfeld, R. A Combined Analytical and Numerical Analysis Method for Low-Velocity Impact on Composite Structures. Ph.D. Thesis, Technische Universität Carola-Wilhelmina zu Braunschweig, Braunschweig, Germany, 2019. [Google Scholar]
- Fualdes, C. Composites@Airbus Damage Tolerance Methodology. In FAA Workshop for Composite Damage Tolerance and Maintenance; National Institute for Aviation Research: Wichita, KS, USA, 2006. [Google Scholar]
- Baaran, J.; Wölper, J.; Greef, M. NSR Impact Damage Assessment; German Aerospace Center: Braunschweig, Germany, 2009. [Google Scholar]
- Bogenfeld, R.; Schmiedel, P.; Kuruvadi, N.; Wille, T.; Kreikemeier, J. An experimental study of the damage growth in composite laminates under tension–fatigue after impact. Compos. Sci. Technol. 2020, 191, 108082. [Google Scholar] [CrossRef]
- Schoeppner, G.; Abrate, S. Delamination threshold loads for low velocity impact on composite laminates. Compos. Part A Appl. Sci. Manuf. 2000, 31, 903–915. [Google Scholar] [CrossRef]
- Wagih, A.; Maimí, P.; González, E.V.; Blanco, N.; De Aja, J.R.; De La Escalera, F.M.; Olsson, R.; Alvarez, E. Damage sequence in thin-ply composite laminates under out-of-plane loading. Compos. Part A Appl. Sci. Manuf. 2016, 87, 66–77. [Google Scholar] [CrossRef]
- Caprino, G.; Lopresto, V.; Langella, A.; Leone, C. Damage and energy absorption in GFRP laminates impacted at low-velocity: Indentation model. Procedia Eng. 2011, 10, 2298–2311. [Google Scholar] [CrossRef] [Green Version]
- Rivallant, S.; Bouvet, C.; Hongkarnjanakul, N. Failure analysis of CFRP laminates subjected to compression after impact: FE simulation using discrete interface elements. Compos. Part A Appl. Sci. Manuf. 2013, 55, 83–93. [Google Scholar] [CrossRef] [Green Version]
- Baker, A.A. Composite Materials for Aircraft Structures; AIAA Education Series; American Institute of Aeronautics & Astronautics: Reston, WV, USA, 2004; p. 599. [Google Scholar]
- Post, N.L.; Cain, J.J.; Lesko, J.J.; Case, S.W. Design knockdown factors for composites subjected to spectrum loading based on a residual strength model. In Proceedings of the ICCM International Conference on Composite Materials, Edinburgh, UK, 27–31 July 2009. [Google Scholar]
- Feng, Y.; He, Y.; Zhang, H.; Tan, X.; An, T.; Zheng, J. Effect of fatigue loading on impact damage and buckling/postbuckling behaviors of stiffened composite panels under axial compression. Compos. Struct. 2017, 164, 248–262. [Google Scholar] [CrossRef]
- SAE International. Composite Materials Handbook Volume 3—Polymer Matrix Composites: Materials, Usage, Design, and Analysis; Wichita State University: Wichita, KS, USA, 1994; p. 85322. [Google Scholar]
- Sikdar, S.; Kudela, P.; Radzieński, M.; Kundu, A.; Ostachowicz, W. Online detection of barely visible low-speed impact damage in 3D-core sandwich composite structure. Compos. Struct. 2018, 185, 646–655. [Google Scholar] [CrossRef] [Green Version]
- Willberg, C. Development of a New Isogeometric Finite Element and Its Application for Lamb Wave Based Structural Health Monitoring. Ph.D. Thesis, Otto von Guericke University Magdeburg, Magdeburg, Germany, 2012. [Google Scholar] [CrossRef]
- Xu, J.; Wang, W.; Han, Q.; Liu, X. Damage pattern recognition and damage evolution analysis of unidirectional CFRP tendons under tensile loading using acoustic emission technology. Compos. Struct. 2020, 238, 111948. [Google Scholar] [CrossRef]
- Krause, D. A physically based micromechanical approach to model damage initiation and evolution of fiber reinforced polymers under fatigue loading conditions. Compos. Part B Eng. 2016, 87, 176–195. [Google Scholar] [CrossRef]
- Lüders, C. Mehrskalige Betrachtung des Ermüdungsverhaltens Thermisch Zyklierter Faserkunststoffverbunde; Technische Universität Carola-Wilhelmina zu Braunschweig: Braunschweig, Germany, 2020. [Google Scholar]
- Pinho, S.T.; Darvizeh, R.; Robinson, P.; Schuecker, C.; Camanho, P.P. Material and structural response of polymer-matrix fibre-reinforced composites. J. Compos. Mater. 2012, 46, 2313–2341. [Google Scholar] [CrossRef]
Figure 1.
CEAST Fractovis impact drop tower for the impact tests (a) and a sketch of the CAI standard specimen (b) according to AITM 1.0010 [17].
Figure 1.
CEAST Fractovis impact drop tower for the impact tests (a) and a sketch of the CAI standard specimen (b) according to AITM 1.0010 [17].

Figure 2.
Set of force-time and force-displacement history curves of the CAI impacts.

Figure 3.
Data points of the measured dent depths and the projected delamination area of the impact experiments Not all specimens were subjected to a dent measurement after relaxation. Hence, not each data point in the diagram Figure 3a corresponds to a data point in the diagram Figure 3b. (a) Measurement after the impact, (b) Measurement after 24 h relaxation.

Figure 4.
Test setup (a) and a sketch of the fixture (b) for the compression after impact tests.

Figure 5.
S-N-curve of the CCAI experiments with impact damage.

Figure 6.
Force-strain history of the compression tests with the virgin specimens, the impacted CAI specimens, and the CCAI specimens with a cyclic load history. (a) Compression and CAI specimens. (b) CAI and CCAI specimens.
Figure 6.
Force-strain history of the compression tests with the virgin specimens, the impacted CAI specimens, and the CCAI specimens with a cyclic load history. (a) Compression and CAI specimens. (b) CAI and CCAI specimens.

Figure 7.
Example for the apparent shrinking of the delamination area after 2000 load cycles at a load level of 80%.
Figure 7.
Example for the apparent shrinking of the delamination area after 2000 load cycles at a load level of 80%.

Figure 8.
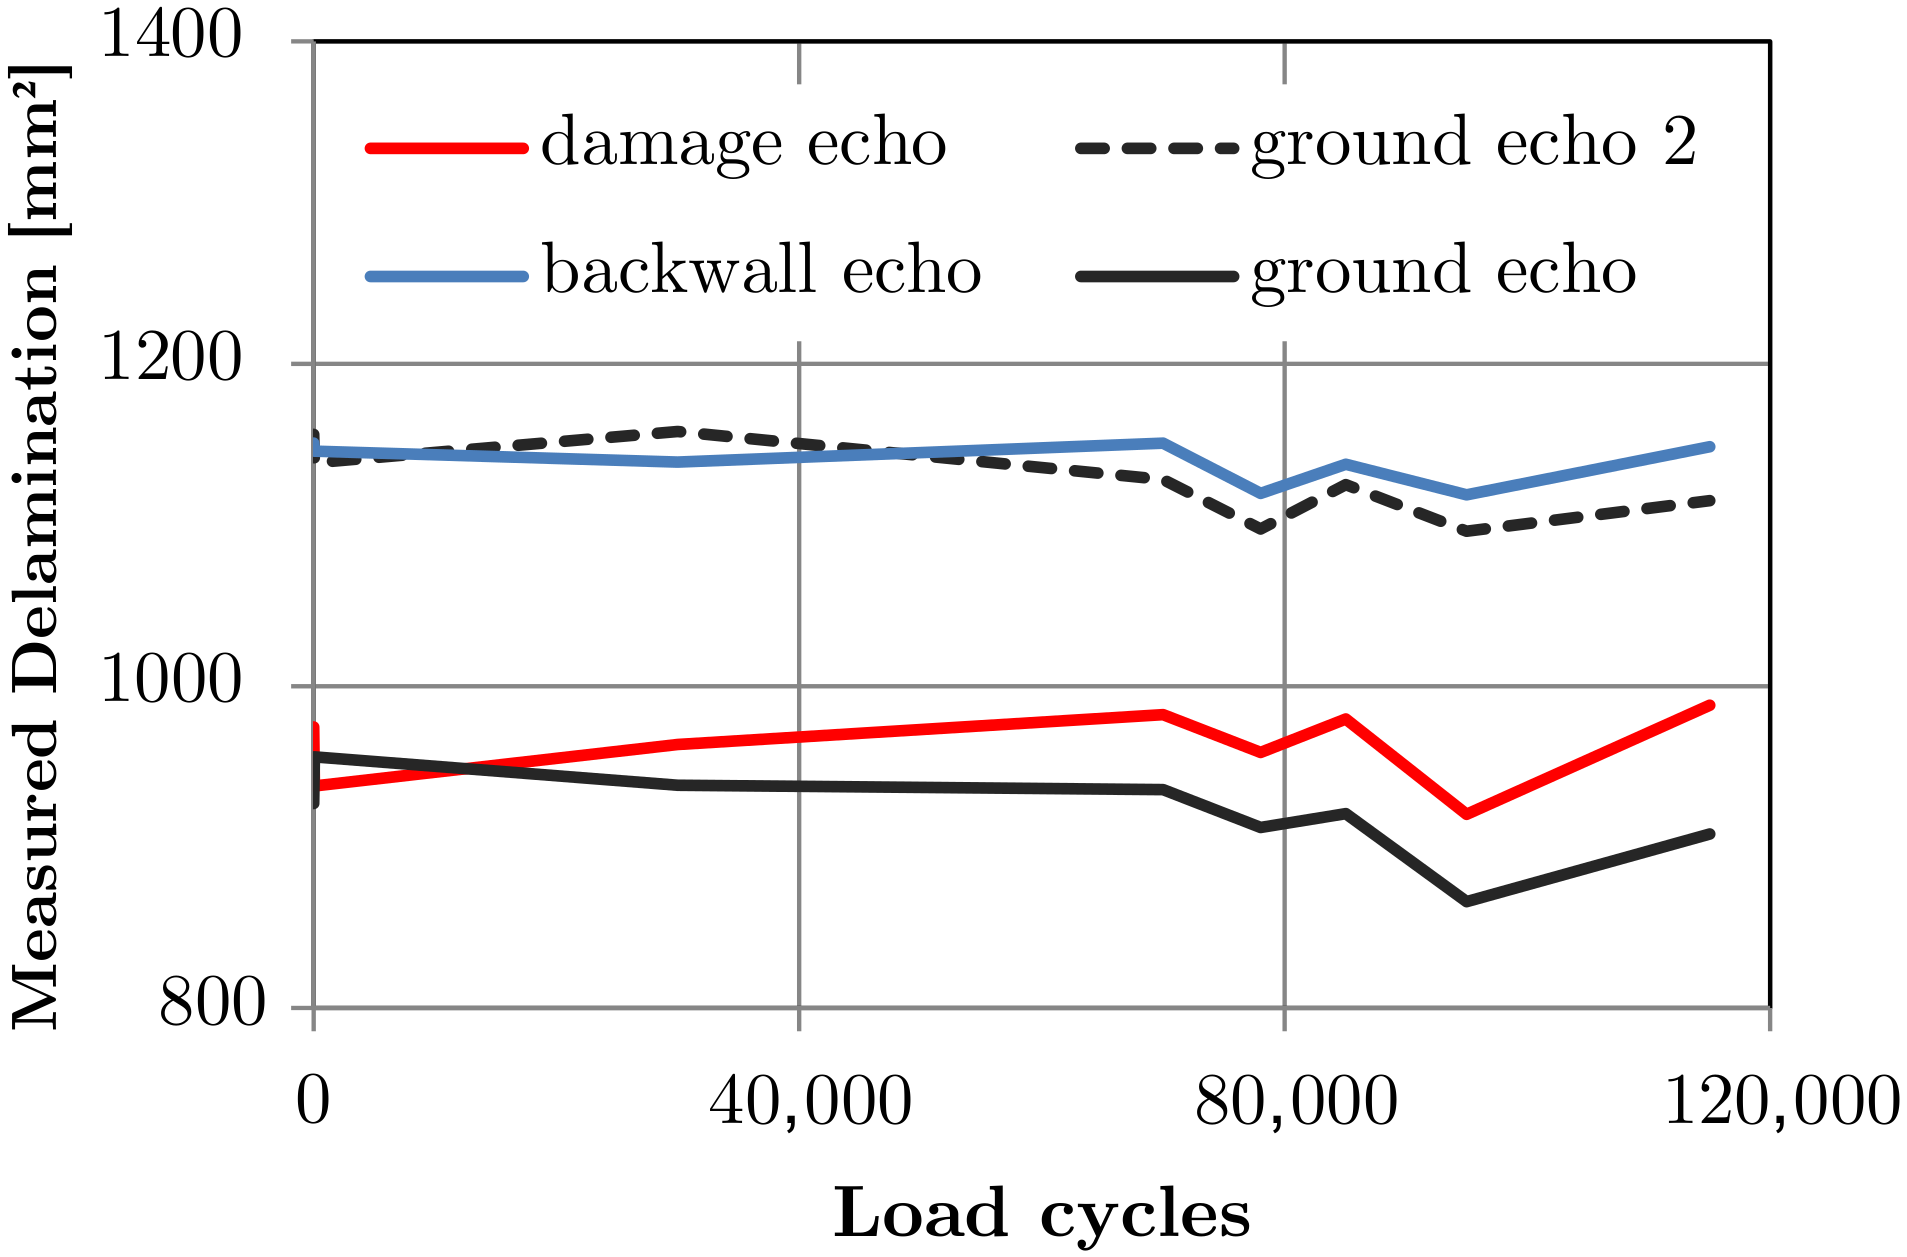
Evaluation of the different ultrasonic results for the sample specimen (70% load).

Figure 9.
Delamination history of the specimens per load level obtained from the ultrasonic scanning between the load interval. The last data point of each curve represents the final failure.
Figure 9.
Delamination history of the specimens per load level obtained from the ultrasonic scanning between the load interval. The last data point of each curve represents the final failure.

Figure 10.
Relaxation of the dent depth at the impact spot depending on the cyclic load. represents the number of cycles until ultimate failure under cyclic load for the specimens concerned.
Figure 10.
Relaxation of the dent depth at the impact spot depending on the cyclic load. represents the number of cycles until ultimate failure under cyclic load for the specimens concerned.

Figure 11.
Polished cross sections of impact damage of one specimen cut after the impact (a) and a second specimen cut after relaxation due to fatigue loading (b).
Figure 11.
Polished cross sections of impact damage of one specimen cut after the impact (a) and a second specimen cut after relaxation due to fatigue loading (b).

Figure 12.
Surface geometry measured through 3D scanning directly after the impact (two specimens) and one specimen after the relaxation over 10k load cycles (one specimen). (a) Scans of the impact side, (b) Scans of the back side.
Figure 12.
Surface geometry measured through 3D scanning directly after the impact (two specimens) and one specimen after the relaxation over 10k load cycles (one specimen). (a) Scans of the impact side, (b) Scans of the back side.


Table 1.
The characteristic values and the respective standard deviation of the coupon impact tests.
Table 1.
The characteristic values and the respective standard deviation of the coupon impact tests.
| Parameter | Unit | Value |
|---|---|---|
| impact energy | [J] | |
| impactor mass | [kg] | |
| impactor diameter | [mm] | |
| max. contact force | [kN] | |
| dent depth after impact | [mm] | |
| dent depth after 24 relaxation | [mm] | |
| proj. delamination | [mm] | |
| contact duration | [ms] | |
| energy absorption | [J] |
Table 2.
Load levels for the CCAI tests and the distribution of the specimens.
| Load Level | (Nominal) | Tests Total 1 | |||
|---|---|---|---|---|---|
| 100% | kN | kN | kN | 5 | |
| 90% | kN | kN | kN | 5 | |
| 80% | kN | kN | kN | 5 | |
| 75% | kN | kN | kN | 4 | |
| 70% | kN | kN | kN | 5 | |
| 50% | kN | kN | kN | 2 | |
| 30% | kN | kN | kN | 1 |
1 Not all specimens were subjected to cyclic load until failure. After a certain amount of cycles, some specimens were used for quasistatic residual strength tests, cyclic test with increased load or for cross section images.
Table 3.
Frequency of occurrence of the observed failure modes for specimen broken under quasi-static load (CAI), cyclic load (CCAI), and quasistatic load after cyclic loading (In total, 26 specimens were tested until failure. The missing 27th specimen in Table 2 was used for cross section images before the final failure (cf. Figure 11b).
| Failure Type | CAI Failure | CCAI Failure | Quasi-Static Failure after CCAI |
|---|---|---|---|
| Type I | 5/5 | 4/16 | 4/5 |
| Type II | - | 10/16 | 1/5 |
| Between type I and II | - | 2/16 | - |
Publisher’s Note: MDPI stays neutral with regard to jurisdictional claims in published maps and institutional affiliations. |
© 2021 by the authors. Licensee MDPI, Basel, Switzerland. This article is an open access article distributed under the terms and conditions of the Creative Commons Attribution (CC BY) license (https://creativecommons.org/licenses/by/4.0/).
Share and Cite
MDPI and ACS Style
Bogenfeld, R.; Gorsky, C. An Experimental Study of the Cyclic Compression after Impact Behavior of CFRP Composites. J. Compos. Sci. 2021, 5, 296. https://0-doi-org.brum.beds.ac.uk/10.3390/jcs5110296
AMA Style
Bogenfeld R, Gorsky C. An Experimental Study of the Cyclic Compression after Impact Behavior of CFRP Composites. Journal of Composites Science. 2021; 5(11):296. https://0-doi-org.brum.beds.ac.uk/10.3390/jcs5110296
Chicago/Turabian StyleBogenfeld, Raffael, and Christopher Gorsky. 2021. "An Experimental Study of the Cyclic Compression after Impact Behavior of CFRP Composites" Journal of Composites Science 5, no. 11: 296. https://0-doi-org.brum.beds.ac.uk/10.3390/jcs5110296