Article

Thermomechanical Multifunctionality in 3D-Printed Polystyrene-Boron Nitride Nanotubes (BNNT) Composites

by
Tawakalt Mayowa Akintola
1,2,
Phong Tran
1,2,
Rebekah Downes Sweat
1,2 and
Tarik Dickens
1,2,*
1
Department of Industrial and Manufacturing Engineering, FAMU-FSU College of Engineering, 2525 Pottsdamer St., Tallahassee, FL 32310, USA
2
High-Performance Materials Institute, 2005 Levy Ave, Tallahassee, FL 32310, USA
*
Author to whom correspondence should be addressed.
Submission received: 18 November 2020 / Revised: 10 February 2021 / Accepted: 13 February 2021 / Published: 20 February 2021
(This article belongs to the Special Issue Multiscale Analysis of Polymer Nanocomposites)

Abstract

:
In this work, polystyrene (PS) and boron nitrides nanotubes (BNNT) composites were fabricated, prepared, and characterized using modified direct mixing and sonication processes. The polymer composites were extruded into filaments (BNNTs at 10 wt. %) for 3D printing, utilizing the fused deposition modeling (FDM) technique to fabricate parts for mechanical and thermal applications. Using a direct mixing process, we found that the thermal conductivity and the mechanical strength of the PS-BNNT composite were respectively four times and two times higher compared to the sonication method. The thermal stability and glass transition temperatures were positively affected. A 2D microstructural mechanical entanglement model captured the exact geometry of the nanotubes using the MultiMechanics software, and the performance of the additive manufactured (AM) PS-BNNT composites part for thermomechanical application was simulated in COMSOL. The modified direct mixing process for PS-BNNT, which affects morphology, proved to be effective in achieving better interfacial bonding, indicating that BNNTs are promising fillers for improving thermal and mechanical properties, and are applicable for thermal management and electronic packaging.

1. Introduction

Additive manufacturing (AM) is a rapidly emerging technology that allows physical parts to be graphically designed from a computer and created with a layer-by-layer model approach [1,2,3,4,5,6,7,8]. Many variations of model parts have been constructed using AM technology, including sheet lamination [1,9], direct energy deposition [10,11,12], laser sintering [13,14], and material extrusion [4,6,15,16]. One commonly used AM technique is fused deposition modeling (FDM) under material extrusion; this is widely used due to the relatively low cost and ease of use for commercial applications [4,17,18,19]. This technique offers the advantages of not needing chemical postprocessing or resin curing, as well as being a cost-effective approach for achieving quality, high-precision products in additive manufacturing. The working technique in FDM printers required extruding a thermoplastic polymer filament through a heated die and onto a print bed; the technique is controlled by the bed and the height of the print nozzle to create a layer-by-layer 3D printed part [19,20,21,22].
Currently, the demand for an insulating polymer composite with high thermal conductivity in electronic packaging is increasing. The use of carbon nanotubes (CNTs) with polymers has been investigated with respect to thermal conductivity; however, it was found that CNTs have challenges related to purity, dispersion, and lack of interfacial bonding between polymers [23,24,25]. Unlike CNTs, boron nitrides nanotubes (BNNTs) are electrically insulating materials with high thermal conductivity and good interfacial bonding with matrixes. This interaction plays a significant role in determining the nanocomposites’ performance and structural integrity [23,24,25,26,27]. Over the past few years, boron nitride (BN), due to its excellent thermal and mechanical properties, has been investigated for its use in several fields, such as aerospace, biomedical, and electronics [26,28,29,30,31,32,33,34].
Researchers have implemented different approaches to combine BNNTs with other polymer materials. Donnary et al. used a nanoparticle–microparticle mixture of saline coupling and ball-milling to improve the dispersion of 20 wt. % BN in epoxy [32]. Ball-milling is an efficient method of breaking large aggregates into a nanopowder to disperse the BN filler in the matrix effectively. This resulted in a ~10% improvement in BN/epoxy composite thermal conductivity, which is higher than 0.16 W/mK pure epoxy with an increase of breakdown strength. However, the problem in the nanofiller studies still exists due to its aggregated state, which affects the filler dispersion, and this is detrimental to the thermal conductivity. Muratov et al. utilized a chemical modification process (3-aminopropyl-3ethoxy-silane) to alter the BNs to achieve a better dispersion in polypropylene (PP), resulting in two times an increased amount of filler [35]. This yield doubled the thermal conductivity compared with functionalized BN/PP but reduced the mixture viscosity while improving the thermal conductivity of the composite. Other methods have reported advantages of the solubility of BNNTs and its purification using techniques such as peroxide treatments, super acid extraction, and water-vapor treatment at high temperatures [32,36,37,38,39]. Purification allows for the treatment of nanoparticles, which increases the filler content in the composite produced, yet it has exhibited downsides. Although the boron particles may be removed, this can damage the nanotubes, which affects the aspect ratio and quality of BNNTs [40]. Only a few researchers were able to modify BNNTs with noncovalent functionalities by sonicating the nanotubes in an aqueous solution under ambient conditions, but they did not investigate how the material performs using a 3D printing approach [41].
This research attempts to fabricate a lightweight nanocomposite using the additive manufacturing (AM) technique to produce a part. This paper reports two manufacturing processes proposed to disperse BNNTs in polystyrene polymer and the multiproperties (thermal and mechanical properties) achieved using additive manufacturing techniques. The first process involves sonicating a dimethylformamide (DMF) solution to achieve a useful reagent to synthesize and disperse BNNTs, thus requiring less power for sonication under ambient conditions. The second process examines the randomly mixed BNNTs in DMF with a polystyrene polymer to provide a simple approach to tailor the nanocomposite towards achieving a dispersion as reportedly implemented [42]. The two processes resulted in significant changes in the surface morphology, mechanical properties, thermal properties, and heat performance. The sonication process was noted to have affected the nanoparticle due to the energy generated from the probe. The direct mixing process has the possibility of producing a better surface morphology in the composite. These findings can streamline a possible approach to chemically disperse BNNTs while improving the properties and incorporating AM techniques to produce lightweight materials for future thermal management applications or electrically insulating materials.

2. Materials and Methods

2.1. Preparation of the Composite Material for 3D Printing

The length distribution of the as-received BNNTs was ~100 μm with an average diameter of 50 nm with varying aspect ratios. Polystyrene (PS) pellets (Mw = ~35,000) were purchased from Sigma-Aldrich (St. Louis, MO, USA). The composition used for both the sonication and direct mixing processes in this research was 100 parts and 10 parts by weight (wt.) using PS as the pristine and BNNT as the filler added separately for both processes, which will be referred to as PS and 10 parts by wt. (10 wt. % BNNT in PS matrix) PS-BNNT, respectively. This weight percentage was selected based on previous experimentation [43].
First, 5 g of PS was dissolved in a Pyrex flask containing 100 mL dimethylformamide (DMF) for 55 min with constant stirring using a magnetic stirrer set at 200 rpm at 120 °C to form a solution for both processes. A modified direct mixing process was separately implemented where BNNTs were randomly dispersed in 200 mL (DMF) for 20 min with constant stirring using a magnetic stirrer set at 200 rpm at 120 °C. The two solutions (dissolved PS and randomly dispersed BNNTs) were combined into PS-BNNT. For the sonication process, 250 mg of BNNTs were dissolved in 200 mL of DMF and covered with aluminum foil in an ice bath (keeping the temperature of the bath at an ambient temperature), then a probe tip was used to sonicate the BNNTs. Misonix Sonicator 3000 (Misonix Inc., Farmingdale, NY, USA) is used with the processing time set at 1 h with a 10 s pulse and a 2 s rest. The real-time energy monitor generated about 500 watts, which could affect the surface morphology of the mixture. An ice bath was used to prevent heat buildup, which is produced from the powerful shearing of the probe tip that could cause the mixture to become intensely agitated. The sonication process was used to disentangle the BNNTs within the dimethylformamide (DMF), which acts as a dispersant medium for the nanotubes. In contrast, direct mixing was used to randomly dispersed the BNNTs without going through rigorous shearing. The two solutions (dissolved PS and sonicated BNNTs) were combined into the PS-BNNT solution and were re-sonicated for 30 min. The solutions for the two processes (direct mixing and sonication) were poured separately into 1300 mL deionized water for them to cool to room temperature and then filtered. The nanocomposite was collected and dried at 80 °C in the vacuum overnight. However, the sonicated sample was still wet, while the direct mixing sample was dried into powdery form. Hence, the sonicated sample was dried again under heat at 60 °C for 4 h, which resulted in a PS-BNNT composite with visible globules.

2.2. Characterization Techniques

Scanning electron microscopy (SEM) was performed using a Helios G4 UC (Thermo Fisher Scientific, Waltham, MA, USA) to evaluate the PS-BNNT microstructure. This SEM is a multi-technique dual beam (electron and Ga ion) field-emission scanning electron microscope (FE-SEM) with a spatial resolution for an imaging of 0.7 nanometers. Images were acquired at 5 kV for examining the morphologies of the PS-BNNT composite at different processing conditions. The samples examined by SEM for PS-BNNT were analyzed, but since the samples were nonconductive, they were coated using gold sputter before the imaging process was carried out. All sample images were placed on the surface of the dried PS-BNNT composite for each process to ensure the dispersion of BNNT in the matrix. The transition temperature and thermal stability were determined using a differential scanning calorimeter (DSC Q100-TA Instruments, New Castle, DE, USA) set to equilibrate at 25 °C, held isothermally for 10 min, and ramped at 10 °C/min to 280 °C. The thermogravimetric analyzer (TGA Q50-TA Instruments, New Castle, DE, USA) was set to ramp at 10 °C/min to 800 °C in the presence of nitrogen (40%) and air (60%) at a constant pressure of 20 PSI for BNNT, PS, and PS-BNNT. A laser flash (Netzsch LFA 457 Micro Flash, Netzsch-Gerätebau GmbH, Selb, Germany) technique was used to measure the thermophysical properties following the ASTM E1461 standard [44]. The thermal specimen samples were 3D-printed with dimensions of 15 × 15 × 2 mm3 and sanded down to 10 × 10 × 1 mm3 to remove unwanted layers. The samples were then spray-coated black so they can absorb heat during measurements. The thermal conductivity results were calculated from the measured thermal diffusivity, density, and heat capacity using the equation
λ = α ρ C p
where λ is the thermal conductivity, α is the thermal diffusivity, ρ is the density, and Cp is the specific heat capacity under constant pressure. A semiempirical theory by Lewis and Nielsen was used to model the predicted thermal conductivity to justify the experimental results from a laser flash analysis (LFA).
Finally, a dynamic mechanical analyzer (DMA Q800, TA Instruments, New Castle, DE, USA) test was performed in a tensile mode to evaluate the mechanical properties of the PS and PS-BNNT composites. The samples were exposed to a series of increasing isothermal temperatures at a ramp rate of 10 °C/min to 180 °C. At each temperature, the sample was deformed at the constant amplitude and held isothermally at 30 °C for 2 min over a frequency of 1 Hz. The mechanical performance of the extruded PS and PS-BNNT filaments was evaluated according to ASTM D3379 standard test method [45]. All test samples (with a diameter of 1.75 mm) were strained at 2%/min at a gauge length of 10 mm at room temperature.

2.3. Preparation of 3D-Printed Heat Sink

The nanocomposite filament of a 1.75 ± 0.05 mm diameter was extruded for printing by a twin-screw (Filabot EXTS10, Filabot, Barre, VT, US) extruder heated to 240 °C for approximately 10 min, and a 1.75 mm die at 20 rpm speed was manually spooled. A printed PS-BNNT heat sink mesoscale structure (20 × 20 × 10 mm3) with a fin encompassing a 2 µm spacing for heat transfer was designed using computer-aided design (CAD) and printed by a LulzBot 3D printer using a fused deposition technique. The heating process was captured by an infrared FLIR TG165 spot thermal camera (FLIR® Systems, Inc, Wilsonville, OR, USA).

3. Results and Discussion

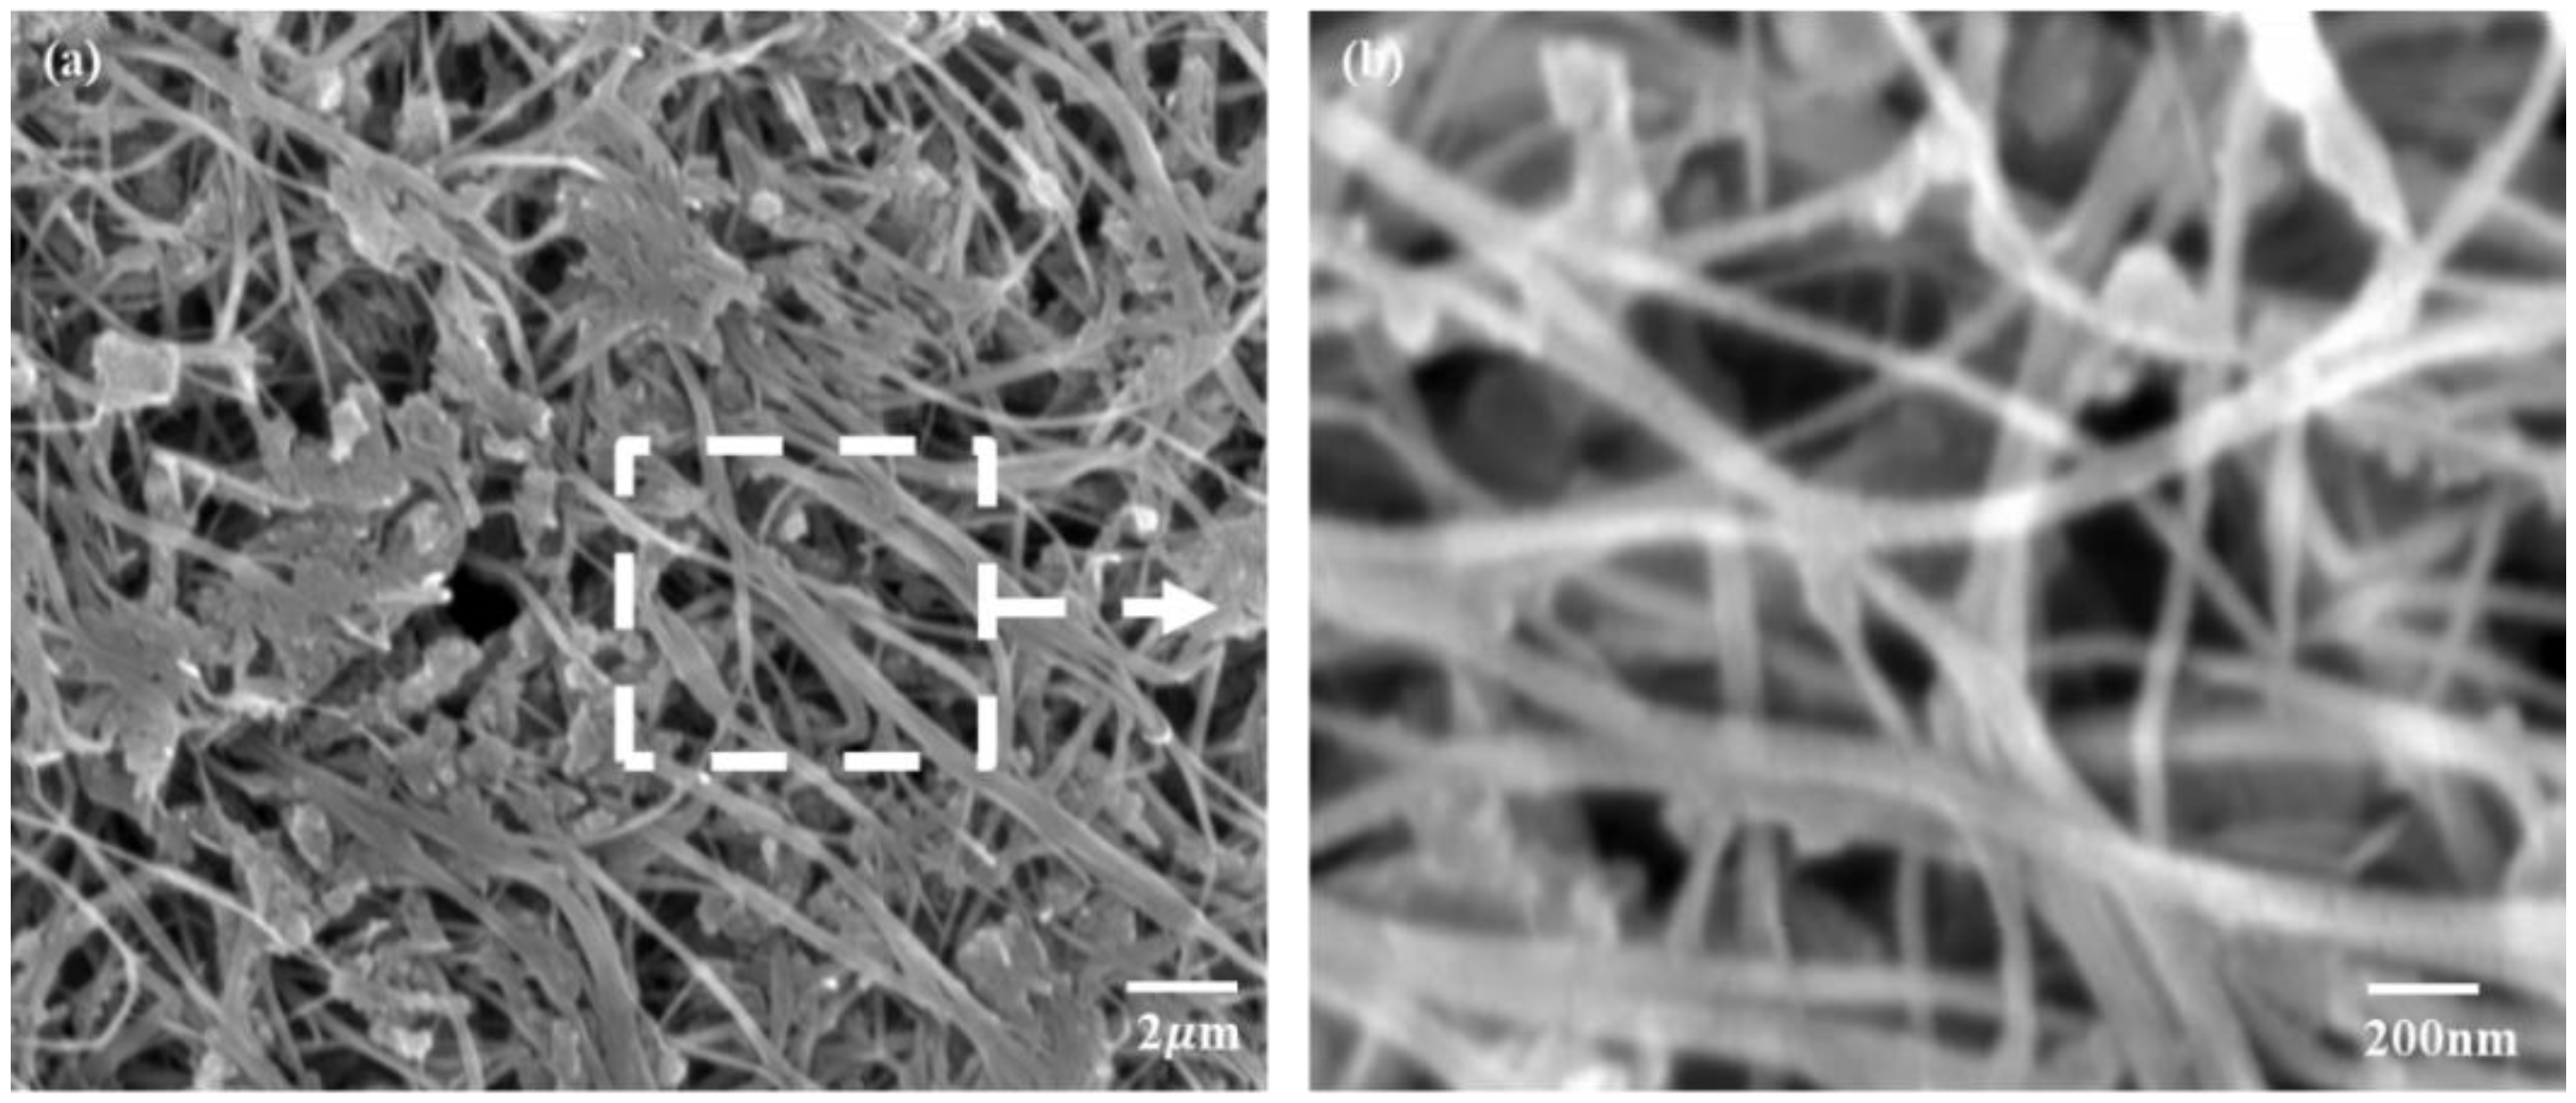
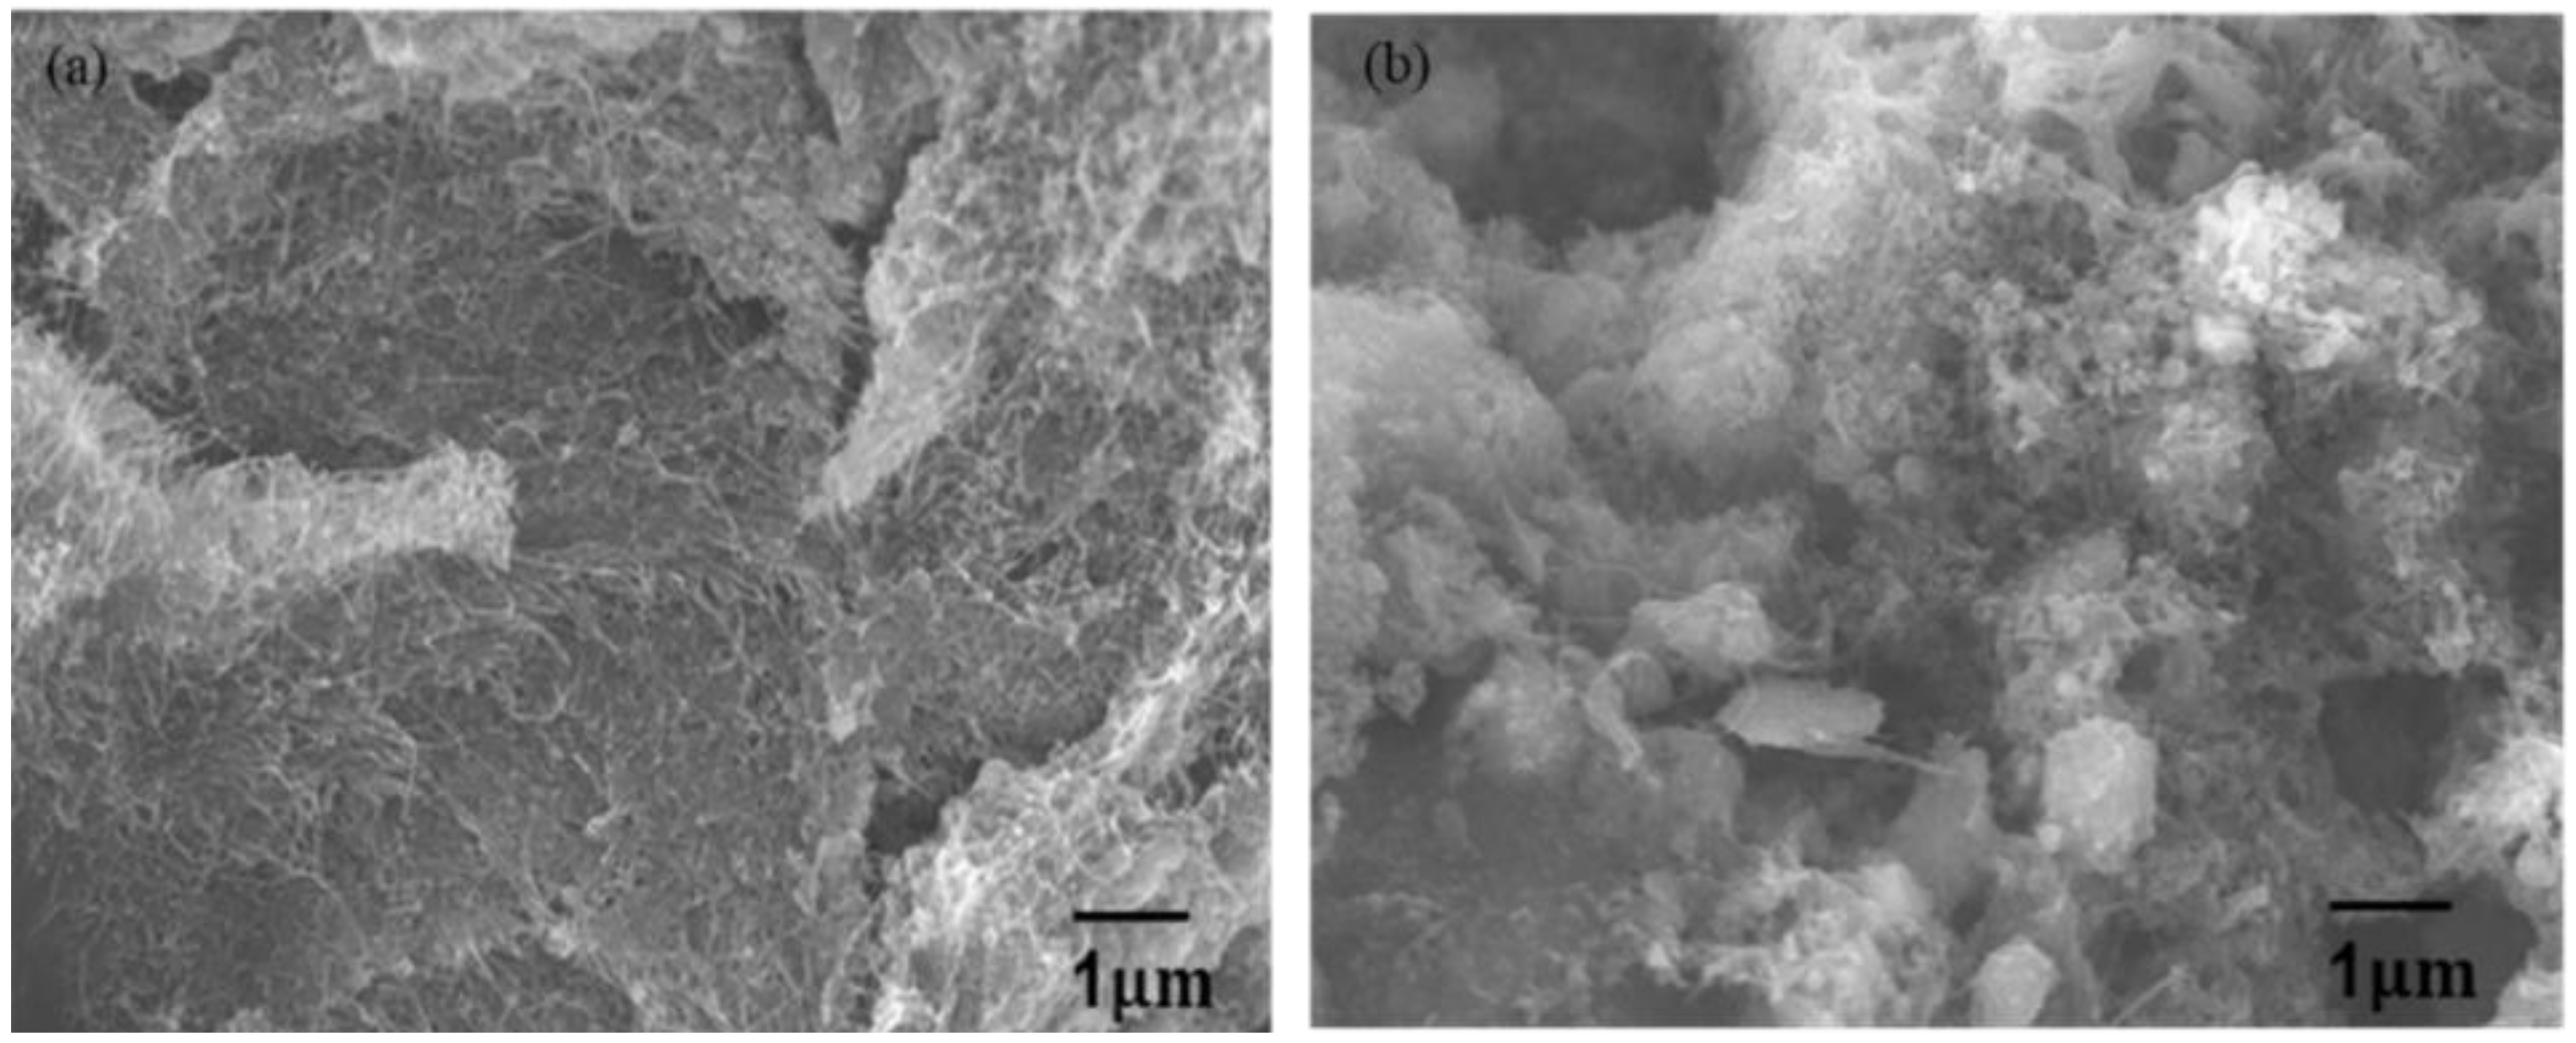
3.1. Scanning Electron Microscope (SEM)

The morphologies of the PS-BNNT composites using the different process methods of direct mixing and sonication were acquired at 5 kV. Figure 1 shows the SEM surface images of the as-received BNNT raw material with visible entangled nanotubes, which are further illustrated in the nanoscale (Figure 1b). The long-intertwined nanotubes act as the thermomechanical net for the composite after the mixing and sonication processes with polystyrene. These morphologies were used for micromechanical modeling.
For the two processes, the surface imaging analyzed the BNNT dispersion within the PS-BNNT composite for the processes. The SEM image of direct mixing in Figure 2a depicts the surface morphology of the PS-BNNT composite, showing little agglomeration and good dispersion, unlike sonication (Figure 2b). This observation is due to less moisture content after filtration, which resulted in a powdery form after vacuum drying the nanocomposite. For the sonication process, the collected PS-BNNT composite exhibited more moisture after filtration and vacuum drying, which required more heat to dry out the moisture. This resulted in visible globules at the surface of the nanocomposite as shown in Figure 2b. An artifact of the heating solution during sonication induced the reaggregation of the polymer molecules within the composite, resulting in polymerization. In addition, heating of the solution means that there is an optimal duration for sonication to initiate a refined nanoparticle size [46]. The energy generated from the sonicator can affect the interaction of nanoparticles with the PS matrix, contributing to a lack of surface interfacial bonding within the PS-BNNT composite. This lack of surface interaction could result in low thermal properties in the composite [46,47], as a different processing will result in different structures, interactions, and properties.

3.2. Thermogravimetric Analysis (TGA) and Differential Scanning Calorimeter (DSC)

Figure 3a shows the TGA analysis for BNNTs that underwent a slow and steady weight increase at a higher temperature due to the oxidation of boron [48]. The oxidation of BNNTs started from 400 °C; they were thermally stable up to 600 °C and later experienced a steady increase in the temperature up to 800 °C, while the PS underwent a weight loss at around 200 °C with its onset at approximately 394.29 °C and then completely burn off. The PS-BNNT composites for sonication and direct mixing resulted in similar weight losses as the weight fraction of BNNTs in the composite can be controlled by the concentration of the polymer solution. Another noted difference in the PS-BNNT composites was that the weight percentages of BNNTs for both processes discovered with TGA analysis are slightly different. The direct mixing was noted to be slightly higher at approximately 11.5 wt. % and 10.2 wt. % for the sonicated PS-BNNT composite.
The glass transition temperature (Tg) indicates the ability to change the state of a polymer during the transition with an increase in temperature. This ability depends on the material composition, which in turn affects the chain mobility and degrades the thermomechanical features of the material [49,50]. Because the chain mobility is modified based on the BNNT content, the melting temperature (Tm) of the crystalline state of the PS-BNNT composite will result in changes in the glass transition [31,51]. The DSC analysis of the pure PS and the variation of Tg with the concentration of the BNNTs in the 10 wt. % PS-BNNT composites is shown in Figure 3b. The change in Tg value is attributed to the enhancement in the plasticity of pure PS, which enabled the movement of chain segments of the polymer. During the heating scan, the sonicated PS-BNNT composite has an increase in Tg (108.48 °C) compared with the one that underwent the direct mixing process, which recorded a slight increase (104.60 °C). The increase in the Tg for the sonicated samples can be due to the processing route of the PS-BNNT composite, and it can also be attributed to energy generated from the probe and re-sonication of the composite. This was observed to influence the molecular chains in the PS-BNNT composite, which is in agreement with the literature on fillers [52] compared to pure PS (94 °C). This rise in energy during sonication has been reported to lead to larger crystallites, most likely due to rapid aggregation kinetics [46]. Finally, the melting peak (Tm) was observed at 125 °C for pure PS and PS-BNNT composites (sonication and direct mixing) at 218 °C and 221 °C, respectively, as the addition of BNNTs is expected to hinder the chain diffusion in the overall composite.

3.3. Thermal and Mechanical Characterization

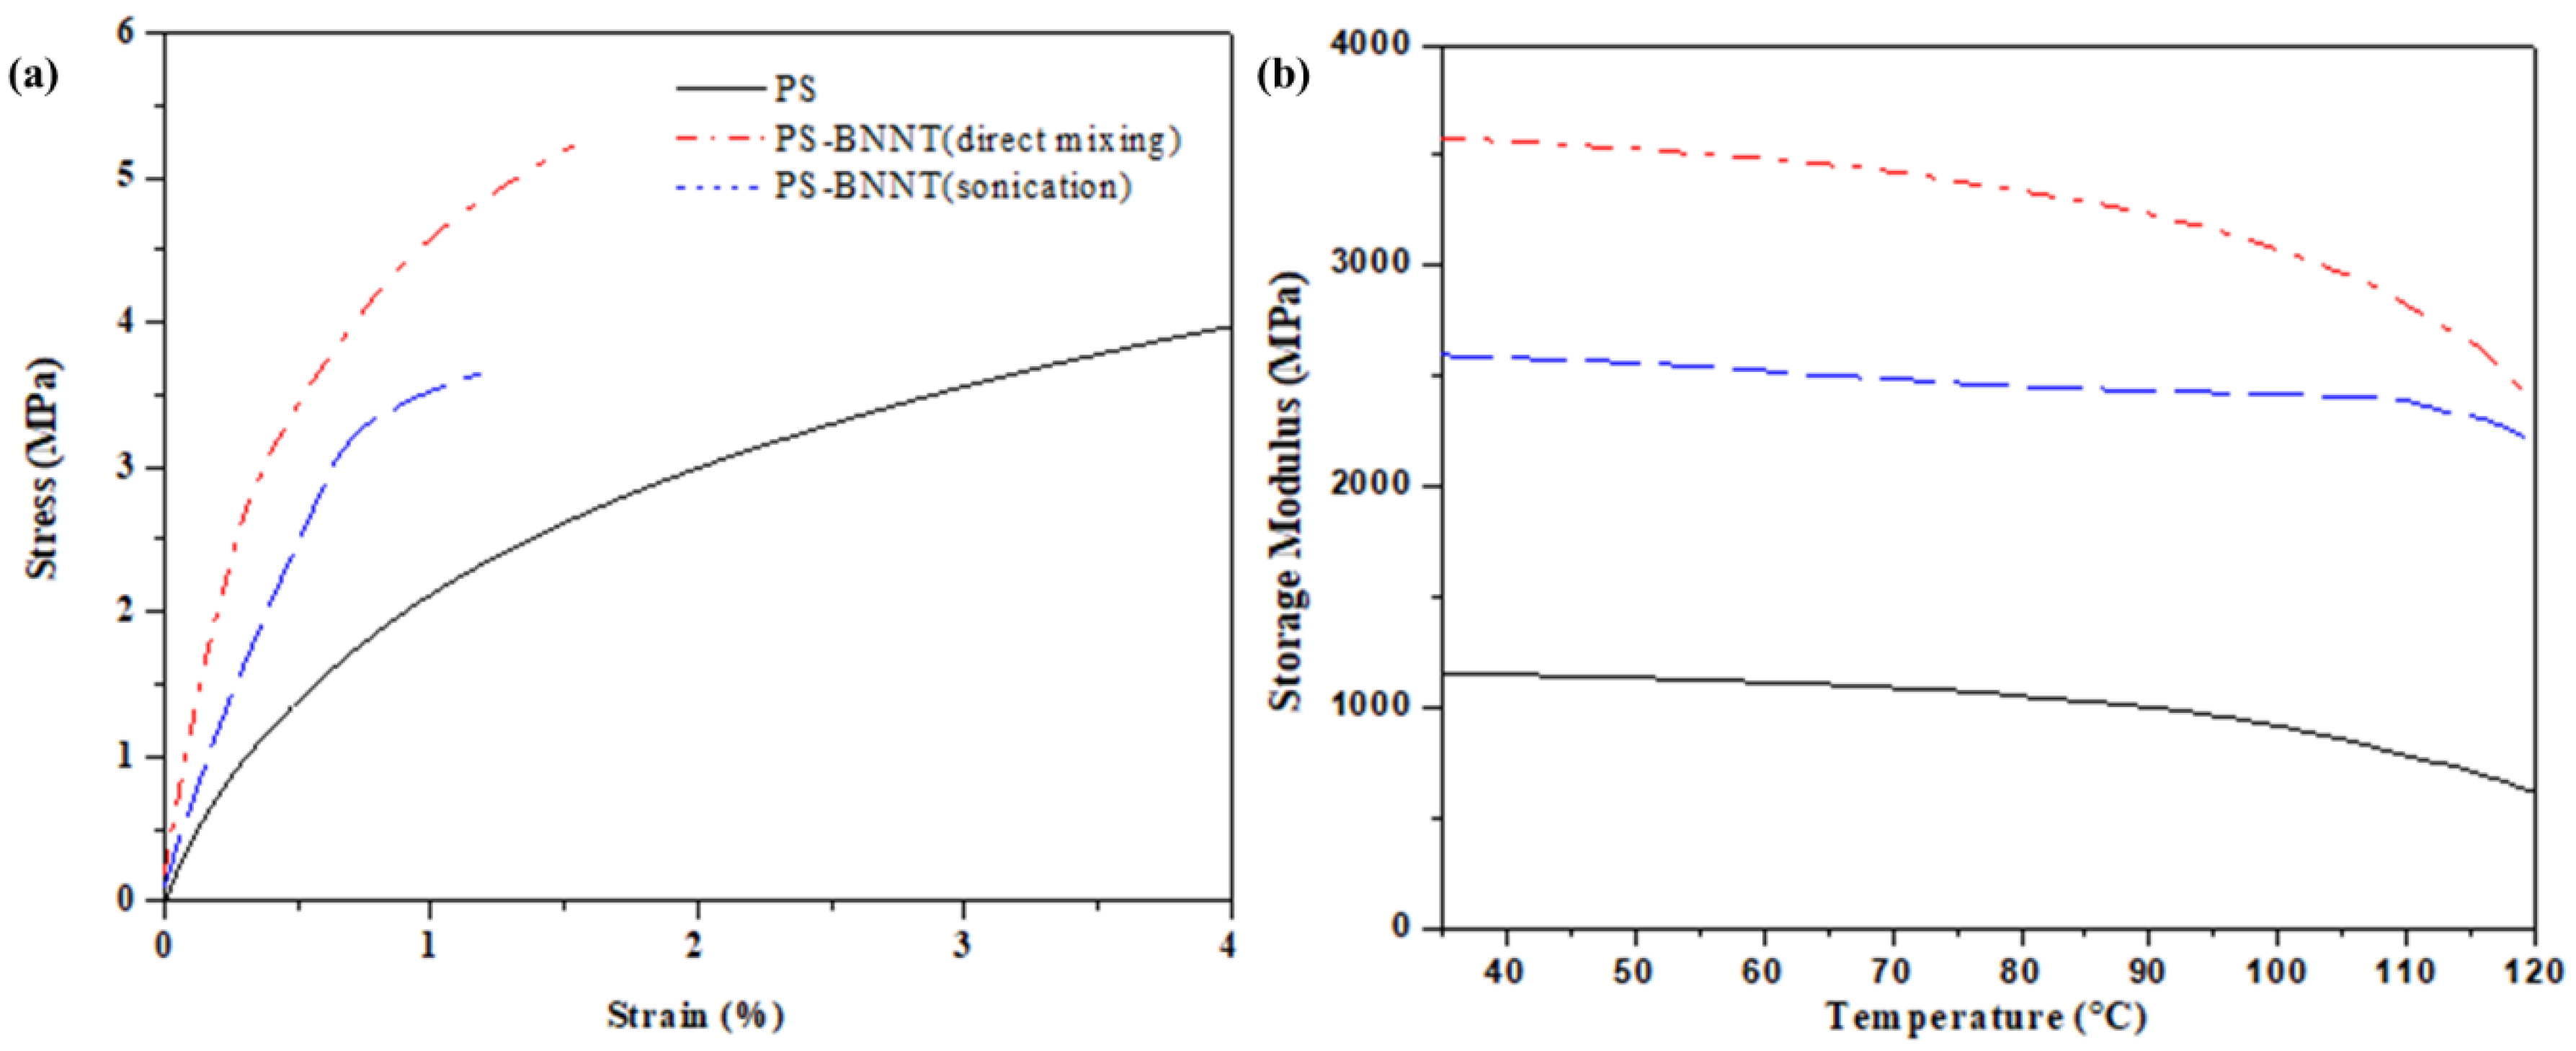
3.3.1. Dynamic Mechanical Analysis

Figure 4a shows the typical stress–strain curve of the pure PS and PS-BNNT composites. The presence of BNNTs in the PS matrix resists the segmental movement of the polymer chains upon application of tensile stress, which led to an enhancement in modulus (Figure 4b). The mechanical performance of the PS-BNNT composites for both processes was significantly increased compared to pure PS. The elastic modulus is one of the fundamental characteristics of material observed; it is clearly defined elsewhere, e.g., in ASTM standard D638. The value of the modulus is well known for commonly used materials such as PS. The elastic modulus observed for PS is 2 GPa, which corresponds to the data in Figure 4b where different test methods used were considered, but it differs by orders of magnitude from Figure 4a. In addition, an increase in the elastic modulus was observed for 10 wt. % PS-BNNT composite to be at almost 3.5 GPa and 4.5 GPa for both processes before yielding. These results are consistent with the literature [53,54,55,56,57], and a similar trend was observed in the storage modulus (Figure 4b). For the two processes, the PS-BNNT composite exhibited a different stress–strain profile compared to the pure PS (Figure 4a). As the strain increased, the stress–strain curve for the sonication deviated from the initial linear elastic behavior and then yielded. This is possibly due to the BNNTs re-aligning under loading and their likely slippage at the PS-BNNT interface. Unlike sonication, the directly mixed PS-BNNT composite showed a more elastic behavior and remained strong enough to retain more stress compared to pure PS, which exhibited a plastic behavior; this behavior in the composite shows the possibility of stretching in the macrostructure [58,59], which is similar to the discovery by Downes et al. [60] in CNTs. From the two processes, direct mixing exhibited the best mechanical properties for the PS-BNNT composites.
Figure 4b shows the curves of analysis carried out at various temperatures in order for us to evaluate the thermal stability of the materials. A significant increase in storage modulus was observed. In both glassy and rubbery regions, the storage moduli of the PS-BNNT composite for the two processes (direct mixing and sonication) were observed to be higher than that of the pure PS. At 40 °C, the storage modulus was only 1.1 GPa (1100 MPa) for pure PS (in Figure 4b), whereas it increased to almost 2.6 (2600 MPa) and 3.6 GPa (3600 MPa) for the 10 wt. % PS-BNNT composite for both processes. At a lower temperature, the material is known to be in a glassy state, and it gradually undergoes a transition from the glassy to the rubbery region with an increase in the temperature. The storage moduli fall with an increase in the temperature, and its energy dissipation is at a maximum during this transition as the loss factor (Tan δ ) peaks to the maximum. The glass transition peak observed from the Tan δ shows a great improvement in the thermal stability of PS-BNNT composites. The glass transition temperature occurs at 75 °C for pure PS, whereas it shifts to temperatures as high as 120 °C and 125 °C for the PS-BNNT composite. The maxima of the Tan δ occurs at a temperature where energy loss occurs due to an additional degree of freedom taking place. This measure of the Tg is associated with the α -relaxation of polymeric materials. Finally, the inclusion of the BNNT fillers could influence the molecular dynamics in the composite, thereby increasing the glass transition and the thermal stability of the composite as compared to pure PS. It was observed that the well-dispersed direct mixing of BNNTs restricts the segmental motion of the polymer chain inside the PS matrix.

3.3.2. Mechanical Deformation Model of BNNT in the Composites

The SEM image of the PS-BNNT composite was digitized into a 2D microstructural mechanical entanglement model that directly captures the exact geometry of the nanotubes, as shown in Figure 5a,b. The model shows the microscale geometry of the BNNT networks from a densely packed microstructure of PS-BNNT composite. The model results in Figure 5d,f show the resultant stress in the matrix in the direction of the induced strain (X-direction) during mechanical deformation. The nonlinear Newton–Raphson solver was used in the commercial software MultiMechanics (19.0, MultiMechanics-Siemens, Omaha, NE, USA). The micromechanics individual constituent approach allows for the separation of influencing factors, including micro- and nanoscale interactions and component-specific properties that impact distortion and failure modes [58,59]. The PS and the BNNT constituents have known mechanical properties (Young’s modulus, Poisson’s ratio). The PS matrix (3 GPa, 0.33) and BNNTs (895 GPa, 0.23) were used as the micromechanical inputs as individually defined [61,62].
The stress–strain responses that occurred in the mechanical deformation of the two processes (direct mixing and sonication) allow the model to twist and distort in the set boundary conditions (Y-direction) on the expected distortion in the composite. This allows sliding and alignment to occur in the mode of mechanical deformation during the application of strain in the nanotube’s bundles caused by strain distortion (Figure 5c–f). In direct mixing processes, a more bundled and higher stress concentration was observed. The red areas noted on the model parts are more prominent in the direct mixing composite than the sonicated composite, with less stress concentration. It therefore explains the higher stress–strain curve in Figure 4a. In comparison, the sonication process shows a lower and flattened stress–strain curve, which was observed to have split bundles. This observation is due to the BNNTs’ ability to move and not be constrained (within) in the bundle. However, it was noted to be shorter and thus resulted in a lower strength.

3.3.3. Laser Flash Analysis (LFA)

Polystyrene is an amorphous material that is temperature and crystallinity dependent. Therefore, the temperature range was set to stop at 348 K (75 °C) as the average glass transition temperature of pristine PS is 94 °C and the density of the PS-BNNT composites was measured to be 0.99 cm3, which was lower compared to conventional heat sink materials, such as metal [63,64].
The thermal conductivity was calculated from an LFA measuring thermal diffusivity and heat capacity results that showed the nonstable thermal properties of pure PS, as shown in Figure 6. This change possibly occurred at the melting stage during the filament extrusion in which the polymer chains were disordered in the crystalline structure, thus affecting the thermal features in the material [49,65]. The directly mixed PS-BNNT composite demonstrated the highest thermal conductivity of 0.382 W/mK, which was four times higher than the sonicated PS-BNNT composite at 373 K (100 °C) and ten times higher than pure PS 0.030 W/mK at 373 K (100 °C), respectively. The low thermal conductivity can be due to the sonication effect and may have caused damage to the nanoparticle in the PS-BNNT composite [36,46]. BNNTs are known to possess entangled long nanochains with unwanted amorphous materials, which can also affect the thermal properties of the PS-BNNT composites. However, the improvement in the thermal properties may be attributed to BNNTs’ filler interfacial interaction with PS in the PS-BNNT composites [38,66]. This depends on the relative strength of the interactions of solvent–solvent, polymer–polymer, and polymer–solvent molecules; hence, an organic solvent may absorb into PS, thus allowing for the lubrication and loosening of the molecular chains for BNNTs to interact [65].

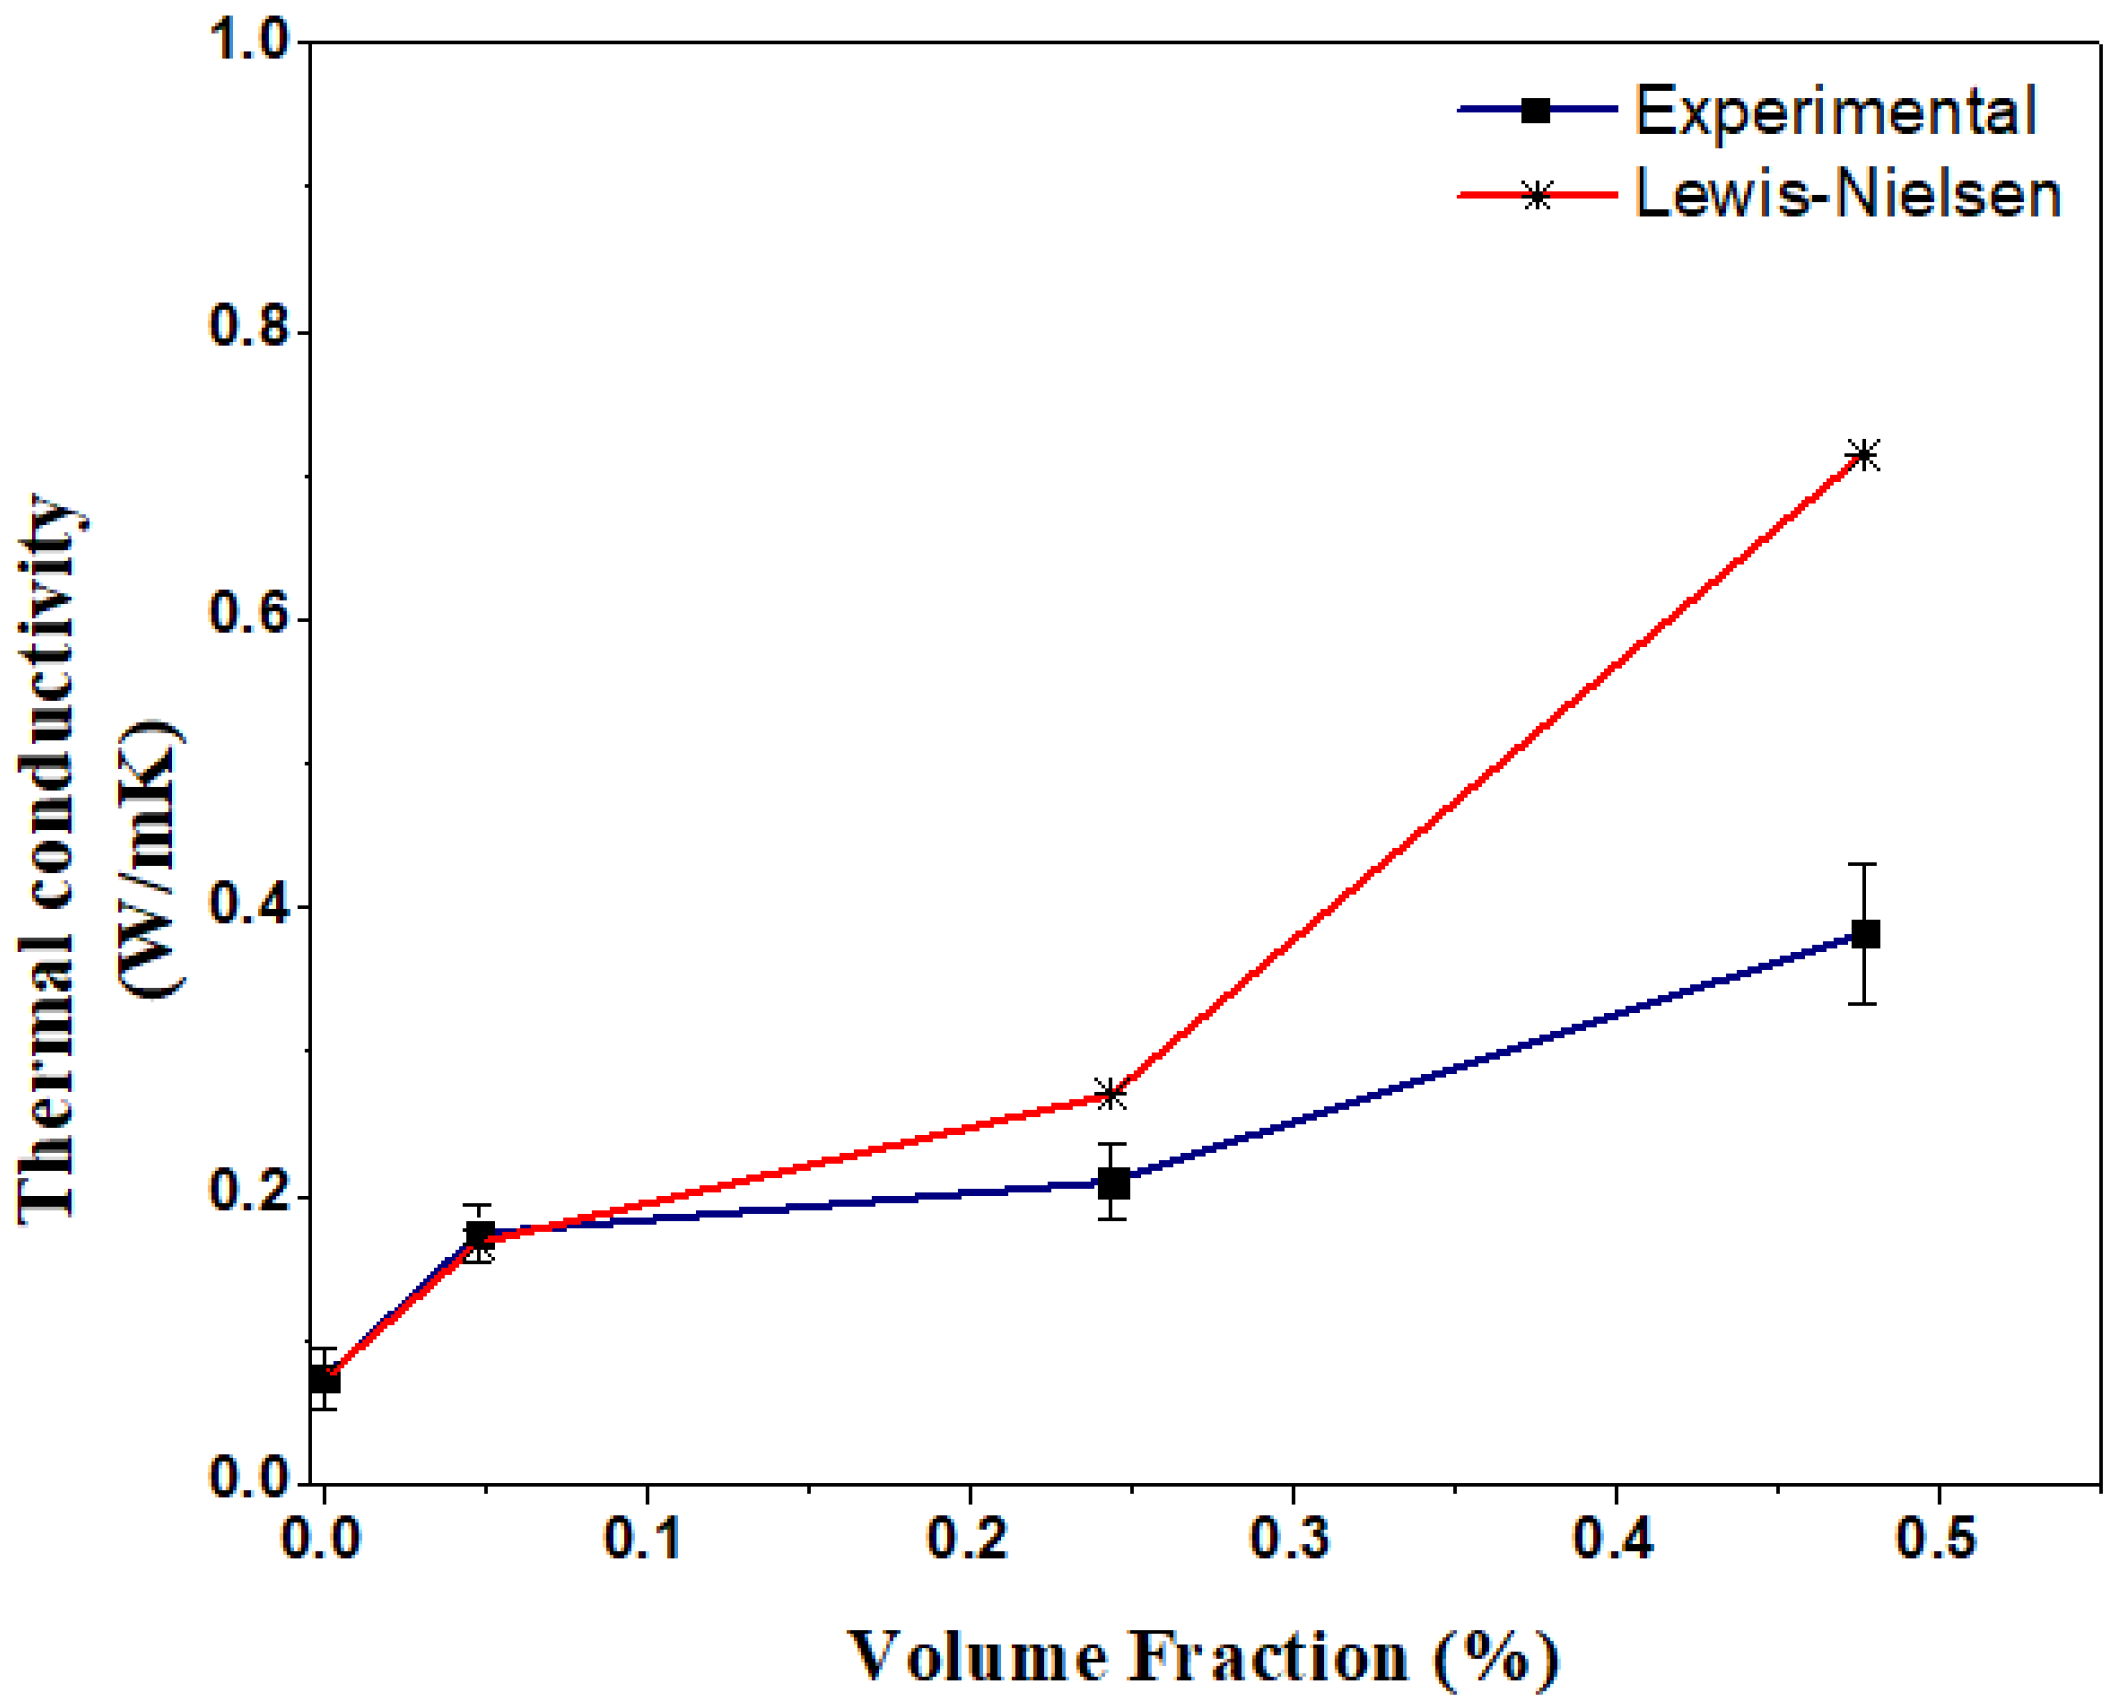
3.3.4. Thermal Conductivity Prediction Model for Particulate-Filled Composites

The thermal conductivity can be predicted using the experimental volume fraction of the filler particles. Knowing the variations of the physical properties (i.e., thermal conductivity) and the concentrations of the fillers in the composite materials is essential. The theoretical conduction model, which can be used to calculate the thermal conductivity, is stated below [67,68]:
k c = ( 1 ) k m + k f
The next equation is used for the series conduction model:
1 k c = 1 k m + k f
where k is the thermal conductivity; c is the composite; m is the matrix of the material; f is the filler; ∅ and m are the volume and the maximum packing fraction of the filler in the composite, respectively; and km and kf values are 0.14 and 600 W/mK as reported by the supplier (Sigma-Aldrich), respectively. The Lewis–Nielsen model simplifies Equations (2) and (3) to Equation (4) to easily solve for the effective thermal conductivity of particulate-filled composites such as the PS-BNNT. The composite thermal conductivity is predicted using the model given as [68,69,70]:
k c = [ 1 + 2 ( λ λ + 2 ) 1 ψ ( λ λ + 2 ) ]
where λ is the aspect ratio of filler, and sphericity Ψ = ( 1 + ( 1 m 2 m ) ) .
Figure 7 shows that the aspect ratio of the BNNTs, the thermal conductivity of the matrix, and the maximum packing fraction were determined to be the main factors that contributed to the thermal conductivity using the model [67]. The conductivity calculated with the Lewis–Nielsen model used the BNNTs’ maximum packing fraction values that were derived from the aspect ratio (length divided by diameter) compared to the volume fraction (0, 1, 5, and 10 wt. %) in the filler used as the experimental setup. The model shows that as we increase the volume fraction, the composition of our processed structure is different. Therefore, a departure from the rule of mixture (ROM) is based on Zhi et al. [43,66] on predicting the thermal conductivities of particulate composites. This resulted in the different point of volume fraction (at 0, 0.48, 2.43, and 4.76%) and weight percentages of the composites in Figure 7. This calculation setup is based on the previously conducted experimentation, corresponding to the thermal conductivity of nanoparticles and polymers [68,69,70]. The experimental results follow direct mixing more than sonication since the morphology of the particles is different with different processing methods, yet it still exhibited the possibility of an increase in the thermal conductivity in the nanocomposite.

3.4. Thermal Performance of 3D-Printed Heat Sink

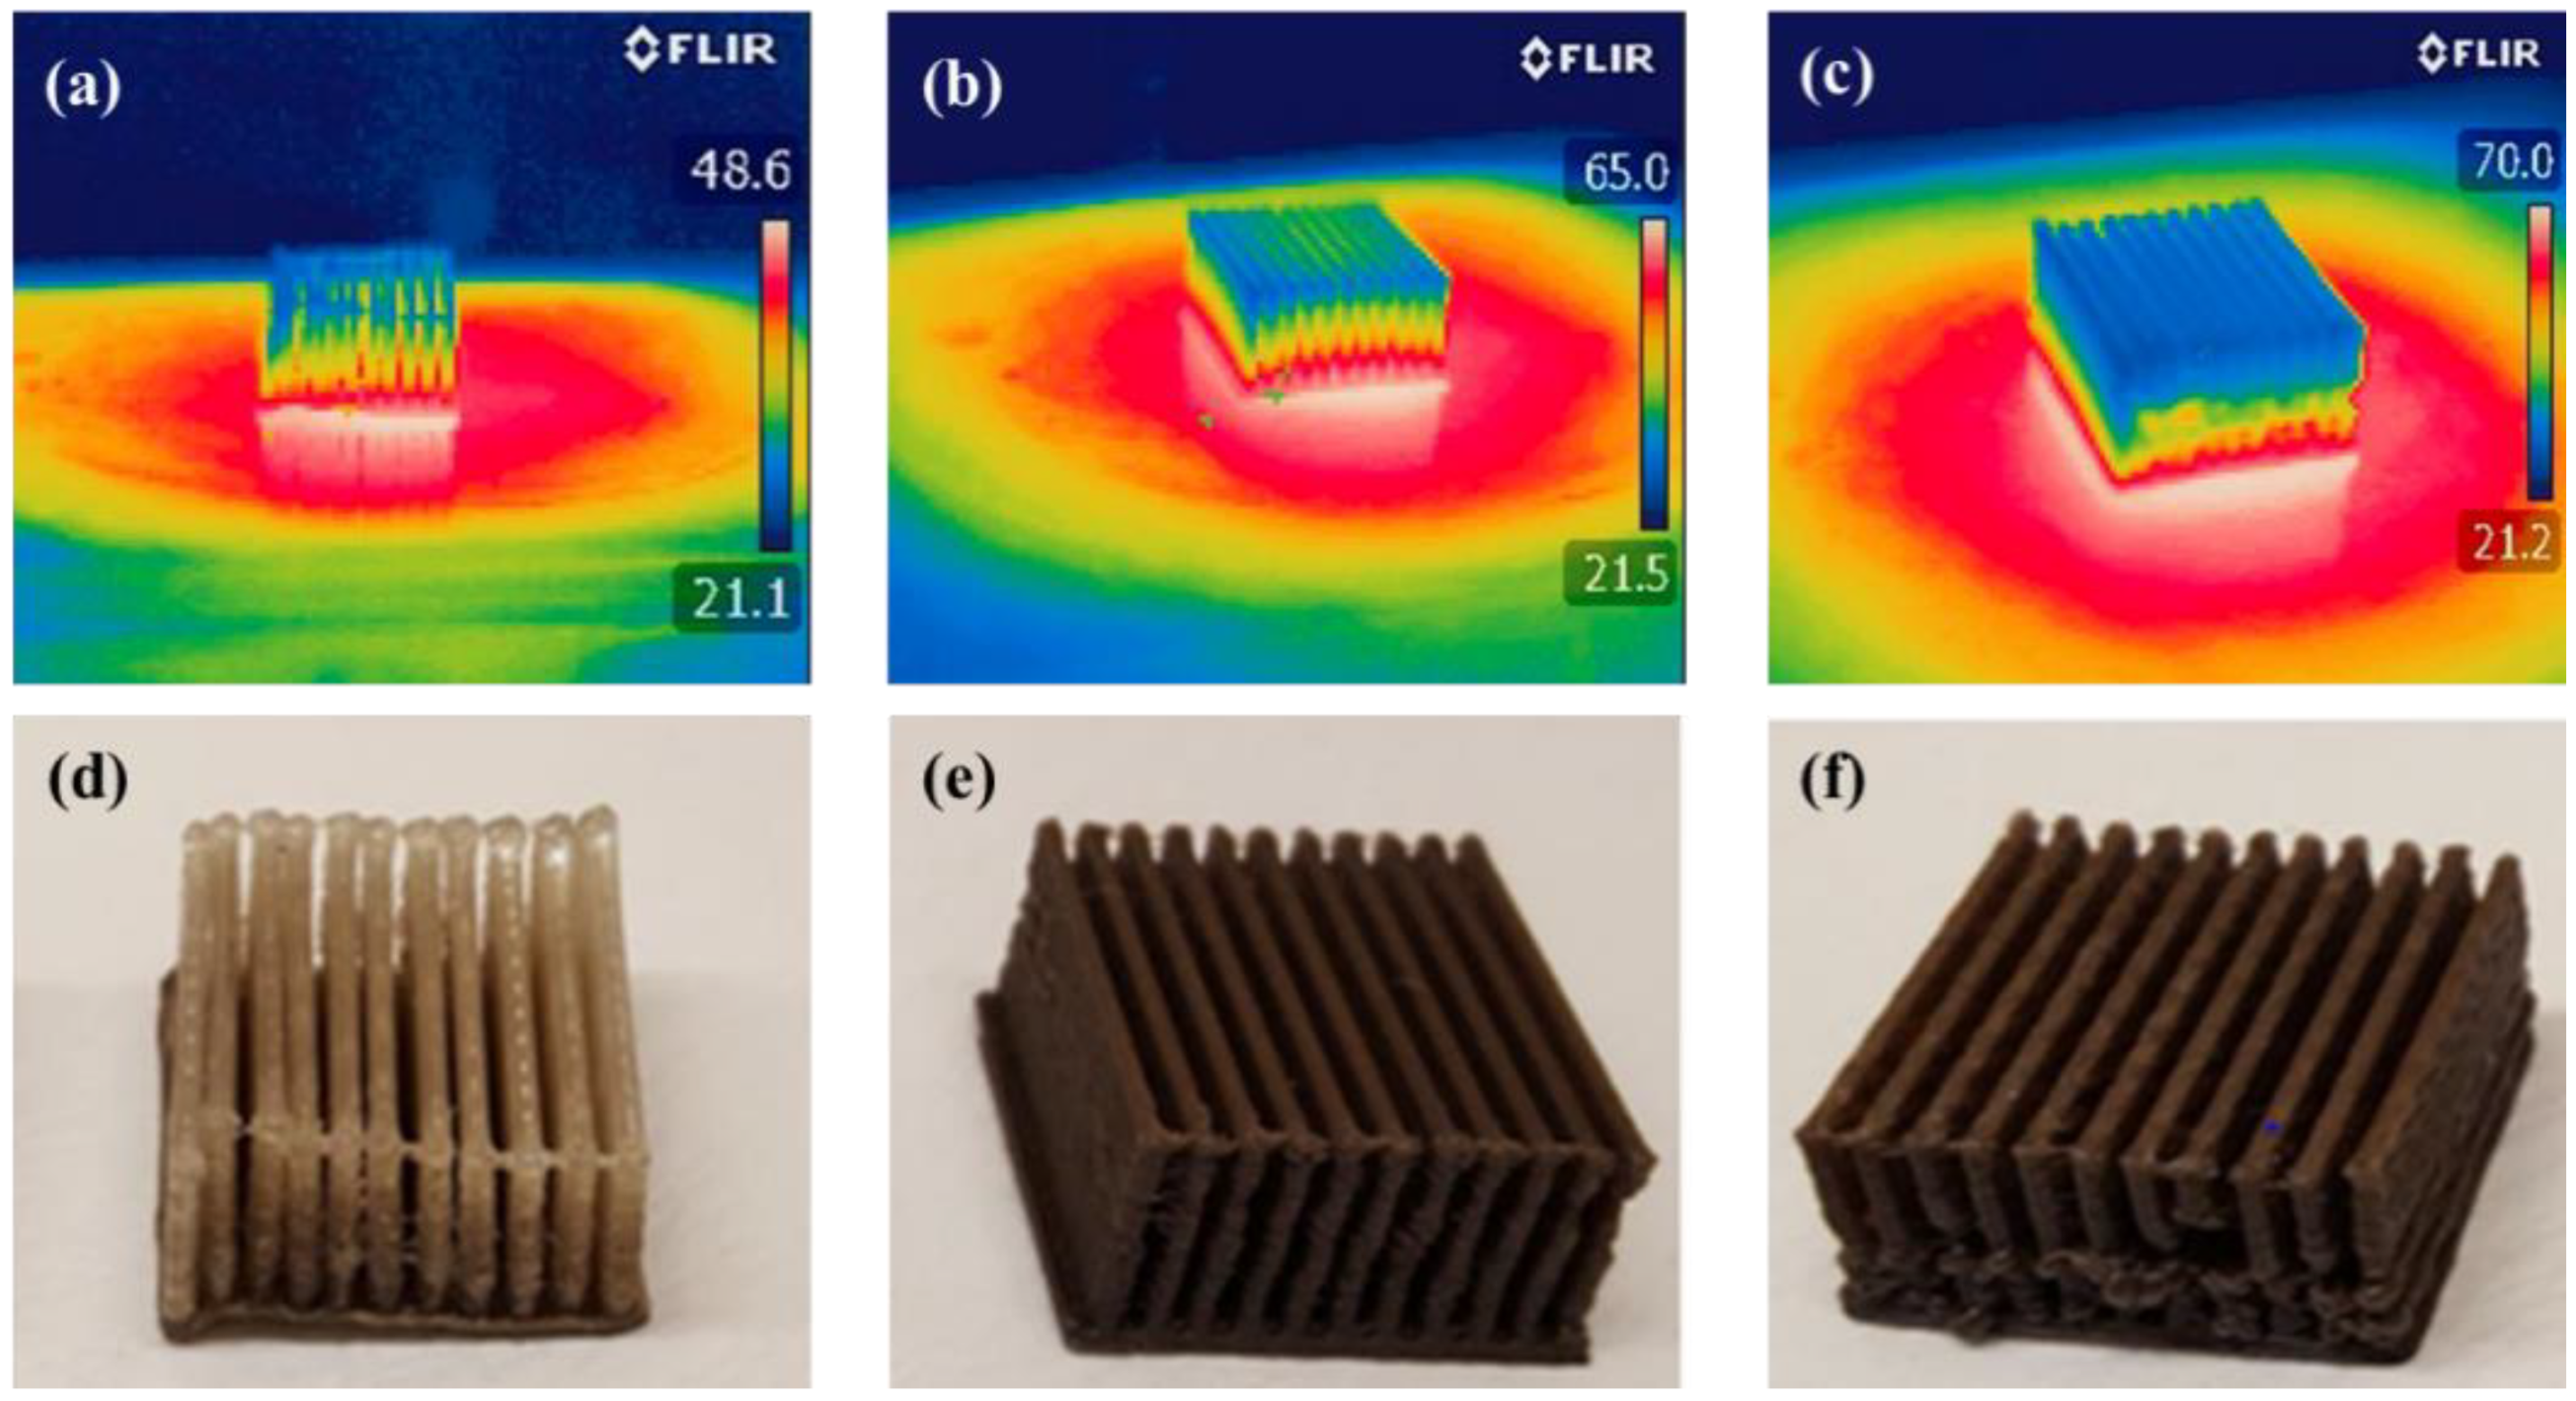
3.4.1. Infrared (IR) Thermal Imaging

The fused deposition AM technique demonstrated better manufacturing qualities and accurate dimensions in the fabrication of a heat sink shown in Figure 8d–f. The IR thermal imaging analyzed the thermal distribution, and it observed the lower and higher temperature regions in the heat sink set temperatures, as shown in Figure 8a–c. The 3D-printed heat sinks of pure PS and the PS-BNNT composite were placed on a hotplate at 70 °C and stabilized for 30 min due to the lower Tg value of the PS (94 °C as observed in Figure 3b).
The thermal images result captured throughout heating and cooling recorded the PS heat sink at a lower temperature of 48.6 °C for a shorter period (<30 min) with poor heat distribution (Figure 8a), while the temperature difference in both methods (direct mixing and sonication) is   21 °C higher in the heat distribution comparison to PS, which is in agreement with the LFA result and is similar to previously reported values [43,71,72]. The dispersion of the BNNT filler in the PS matrix validated the process, which presents a logical reason behind the uniformity in heat distribution for the PS-BNNT heat sinks for both processes. The thermal performance can be due to the alignment of microparticles in the structure during printing, as a lightweight heat sink was achievable for both processing methods as expected. Although the 3D-printed heat sink may not demonstrate the same thermal performance as conventional materials, the composites may still be applicable for lightweight, low thermal applications due to their weight advantage over metal materials [63,64].

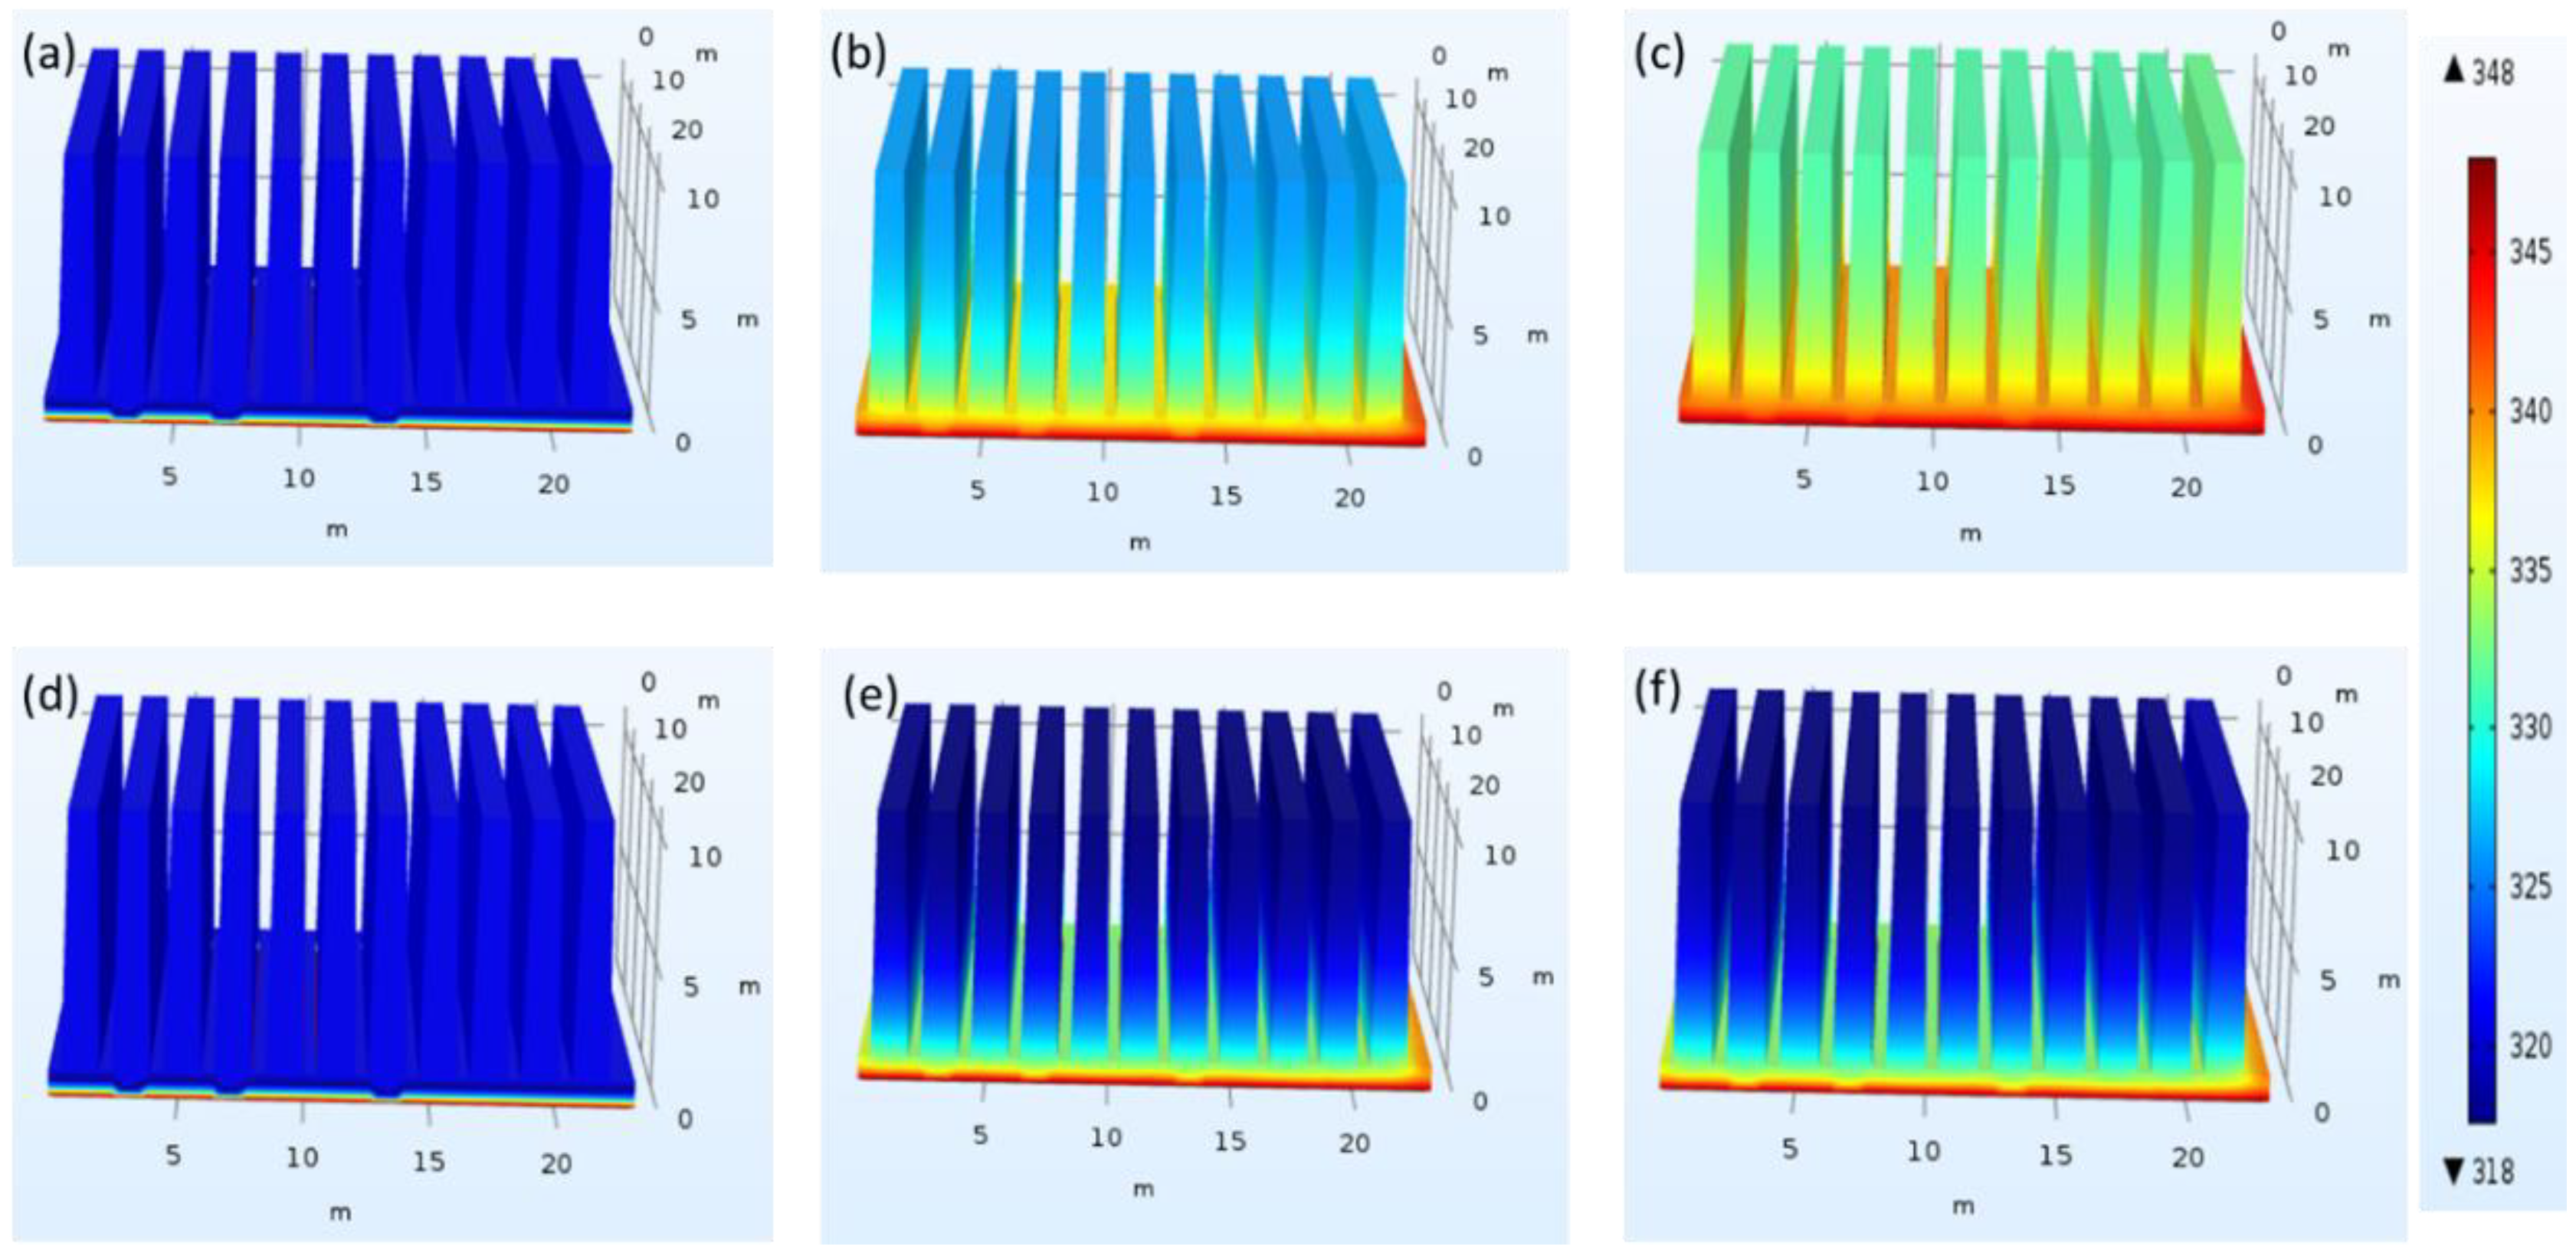
3.4.2. Heat Transfer Simulation of 3D-Printed Heat Sink

The fabricated heatsink device was simulated to show the temperature gradient at 348 K (70 °C) between the hotplate and the heat sink base. The heat sink performance was simulated with a finite element analysis using the COMSOL Multiphysics software. The model was meshed (physics-controlled mesh) with a partial differential built-in tool equation as a time-dependent study governing heat transfer model used in the simulation in the equation below [73]:
k [ δ 2 T δ x 2 + δ 2 T δ y 2 + δ 2 T δ z 2 ] q A ( T T a m b ) = 0
where k is the thermal conductivity (W/mK); A is the thermal diffusivity (m2/s), TTamb (where u = TTamb) is the boundary condition; T is the initial condition (temperature   K ); and q is heat flux; x, y, and z are the directional variables; and t is the time-dependent component (s).
Figure 9a–f shows the simulation results based on the parameter from the experiments from LFA, where k is 0.03 W/mK and 0.384 W/mK for PS and PS-BNNT composite (direct mixing as the highest conductivity), respectively. To compare the performance of the PS and the PS-BNNT (direct mixing) printed heat sinks, the model was computed for a longer time of 30 min (1600 s) at a set temperature of 348 K. Since PS is unsuitable for thermal transfer, the model heated faster at <15 min compared to the PS-BNNT composite material, which exhibited a slight temperature difference in the heat transfer from the heat sink base. These simulation results matched the IR camera images (in Figure 8) of the printed heat sinks for the PS and the PS-BNNT composite; it can be seen that a better thermal performance is indicated in the composite than in the PS heat sink.

4. Conclusions

The polymer composites made from BNNTs in a PS matrix were dispersed via direct mixing and sonication to fabricate a lightweight 3D-printed heat sink via a fused deposition AM technique. These composites were extruded into FDM 3D printing filament to test for their thermal conductivity properties and heat performance. The thermal conductivity and mechanical properties of all samples showed an enhancement with the addition of the BNNT’s content in the processes of the composite. The mechanical characterization of the samples demonstrated an increase in the storage modulus and the ultimate tensile strength with BNNTs loading compared to pure PS. BNNT bundling can be controlled based on the mixing technique, and it directly influences the nanotube–nanotube sliding and tensile strength. Mechanical models confirmed stress concentrations and a higher stress state in the highly bundled PS-BNNT when strain was applied due to interlocking. The direct mixing samples show a greater thermal conductivity than the sonicated samples, reaching a maximum value of 0.382 W/mK, which results in better heat dissipated performance for the 3D-printed heat sink. We found that the sonicated samples decrease in thermal conductivity and mechanical strength. Both the PS-BNNT composite samples demonstrated a better thermal performance than the pristine PS 3D printed heat sink. This proves the BNNTs to be a promising thermal filler material for additive manufacturing applications where lightweight material is required for thermal management in electronics and other applications. For the BNNT filler to become more viable to reach its full potential, further development in the matrix to increase filler interactions is required to provide an additional enhancement in thermal conductivity. Using additive manufacturing designs, manufacturing custom-made thermal devices with composite materials using the filament technique is possible and could save production cost and time. Further work on composite printing with the AM technique will refine the interlayer adhesion of the print to improve the conductivity.

Author Contributions

Conceptualization, T.M.A. and T.D.; methodology, T.M.A. and T.D.; software, T.M.A.; validation, T.M.A., P.T. and T.D.; formal analysis, T.M.A., T.D. and R.D.S.; investigation, T.M.A.; resources, T.D.; data curation, T.M.A. and R.D.S.; writing—original draft preparation, T.M.A.; writing—review and editing, T.M.A., P.T., T.D. and R.D.S.; visualization, T.M.A.; supervision, T.D., and R.D.S.; project administration, T.D.; funding acquisition, T.D. All authors have read and agreed to the published version of the manuscript.

Funding

This research was supported through “NSF-CREST RISE: High-Performance Additive Manufacturing of Composite Structures via Development of Reconfigurable Cyber-Physical Robotic (CPR) Systems” (Proposal No. 1646897).

Acknowledgments

The authors wish to thank the High-Performance Materials Institute for the use of the facility, as well as Frank Allen, Oluwafemi Ojo, and Taofeek Akintola for their contributions and time towards the completion of this paper.

Conflicts of Interest

The authors declare no conflict of interest.

References

  1. Chua, C.K.; Leong, K.F. 3D Printing and Additive Manufacturing: Principles and Applications (with Companion Media Pack) Fourth Edition of Rapid Prototyping, 4th ed.; World Scientific Publishing Company: Singapore, 2014. [Google Scholar]
  2. Leigh, S.J.; Bradley, R.J.; Purssell, C.P.; Billson, D.R.; Hutchins, D.A. A Simple, Low-Cost Conductive Composite Material for 3D Printing of Electronic Sensors. PLoS ONE 2012, 7, e49365. [Google Scholar] [CrossRef] [PubMed]
  3. Abdullah, A.M.; Din, T.N.D.T.; Mohamad, D.; Rahim, T.N.A.T.; Akil, H.M.; Rajion, Z.A. Surface topography study of prepared 3D printed moulds via 3D printer for silicone elastomer based nasal prosthesis. In Proceedings of the 1st Translational Craniofacial Conference, Ventura, CA, USA, 22 January 2016. [Google Scholar] [CrossRef] [Green Version]
  4. Lacey, S.D.; Kirsch, D.J.; Li, Y.; Morgenstern, J.T.; Zarket, B.C.; Yao, Y.; Dai, J.; Garcia, L.Q.; Liu, B.; Gao, T.; et al. Extrusion-Based 3D Printing of Hierarchically Porous Advanced Battery Electrodes. Adv. Mater. 2018, 30, e1705651. [Google Scholar] [CrossRef] [PubMed]
  5. Gonzalez-Gutierrez, J.; Cano, S.; Schuschnigg, S.; Kukla, C.; Sapkota, J.; Holzer, C. Additive Manufacturing of Metallic and Ceramic Components by the Material Extrusion of Highly-Filled Polymers: A Review and Future Perspectives. Materials 2018, 11, 840. [Google Scholar] [CrossRef] [PubMed] [Green Version]
  6. Go, J.; Hart, A.J. Fast Desktop-Scale Extrusion Additive Manufacturing. Addit. Manuf. 2017, 18, 276–284. [Google Scholar] [CrossRef] [Green Version]
  7. Zhou, Z.; Salaoru, I.; Morris, P.; Gibbons, G.J. Additive manufacturing of heat-sensitive polymer melt using a pellet-fed material extrusion. Addit. Manuf. 2018, 24, 552–559. [Google Scholar] [CrossRef] [Green Version]
  8. Chacón, J.M.; Caminero, M.A.; García-Plaza, E.; Núñez, P.J. Additive manufacturing of PLA structures using fused deposition modelling: Effect of process parameters on mechanical properties and their optimal selection. Mater. Des. 2017, 124, 143–157. [Google Scholar] [CrossRef]
  9. Luong, D.X.; Subramanian, A.K.; Silva, G.A.L.; Yoon, J.; Cofer, S.; Yang, K.; Owuor, P.S.; Wang, T.; Wang, Z.; Lou, J.; et al. Laminated Object Manufacturing of 3D-Printed Laser-Induced Graphene Foams. Adv. Mater. 2018, 30, e1707416. [Google Scholar] [CrossRef] [PubMed]
  10. Shim, D.-S.; Baek, G.-Y.; Seo, J.-S.; Shin, G.-Y.; Kim, K.-P.; Lee, K.-Y. Effect of layer thickness setting on deposition characteristics in direct energy deposition (DED) process. Opt. Laser Technol. 2016, 86, 69–78. [Google Scholar] [CrossRef]
  11. O’Neill, P.; Davies, S. Pulse Radiolytic Study of the Interaction of SO−·4with Deoxynucleosides. Possible Implications for Direct Energy Deposition. Int. J. Radiat. Biol. Relat. Stud. Phys. Chem. Med. 1987, 52, 577–587. [Google Scholar] [CrossRef] [PubMed]
  12. Javidani, M.; Arreguin-Zavala, J.; Danovitch, J.; Tian, Y.; Brochu, M. Additive Manufacturing of AlSi10Mg Alloy Using Direct Energy Deposition: Microstructure and Hardness Characterization. J. Therm. Spray Technol. 2017, 26, 587–597. [Google Scholar] [CrossRef] [Green Version]
  13. Kruth, J.; Mercelis, P.; Van Vaerenbergh, J.; Froyen, L.; Rombouts, M. Binding mechanisms in selective laser sintering and selective laser melting. Rapid Prototyp. J. 2005, 11, 26–36. [Google Scholar] [CrossRef] [Green Version]
  14. Yang, L.; Wang, L.; Chen, Y. Solid-state shear milling method to prepare PA12/boron nitride thermal conductive composite powders and their selective laser sintering 3D-printing. J. Appl. Polym. Sci. 2019, 137, 48766. [Google Scholar] [CrossRef]
  15. Akintola, T.M. A Process Viability Study on Additive Manufactured BNNT-Thermoplastic Heat Sinks (M.S.I.E.); Florida Agricultural and Mechanical University: Tallahassee, FL, USA, 2017; Available online: https://0-search-proquest-com.brum.beds.ac.uk/docview/2050009749/abstract/80F1D215E404412PQ/1 (accessed on 30 April 2020).
  16. Akintola, T.M.; Tran, P.; Lucien, C.; Dickens, T. Additive manufacturing of functional polymer-based composite with enhanced mechanoluminescence (ZnS:Mn) performance. J. Compos. Mater. 2020, 54, 3181–3188. [Google Scholar] [CrossRef]
  17. Mireles, J.; Kim, H.-C.; Lee, I.H.; Espalin, D.; Medina, F.; Macdonald, E.; Wicker, R. Development of a Fused Deposition Modeling System for Low Melting Temperature Metal Alloys. J. Electron. Packag. 2013, 135, 011008. [Google Scholar] [CrossRef]
  18. Alafaghani, A.; Qattawi, A.; Alrawi, B.; Guzman, A. Experimental Optimization of Fused Deposition Modelling Processing Parameters: A Design-for-Manufacturing Approach. Procedia Manuf. 2017, 10, 791–803. [Google Scholar] [CrossRef]
  19. Bellacicca, A.; Santaniello, T.; Milani, P. Embedding electronics in 3D printed structures by combining fused filament fabrication and supersonic cluster beam deposition. Addit. Manuf. 2018, 24, 60–66. [Google Scholar] [CrossRef]
  20. Yin, J.; Lu, C.; Fu, J.; Huang, Y.; Zheng, Y. Interfacial bonding during multi-material fused deposition modeling (FDM) process due to inter-molecular diffusion. Mater. Des. 2018, 150, 104–112. [Google Scholar] [CrossRef]
  21. Bellehumeur, C.; Li, L.; Sun, Q.; Gu, P. Modeling of Bond Formation Between Polymer Filaments in the Fused Deposition Modeling Process. J. Manuf. Process. 2004, 6, 170–178. [Google Scholar] [CrossRef]
  22. Bochmann, L.; Bayley, C.; Helu, M.; Transchel, R.; Wegener, K.; Dornfeld, D. Understanding error generation in fused deposition modeling. Surf. Topogr. Metrol. Prop. 2015, 3, 014002. [Google Scholar] [CrossRef]
  23. Gnanasekaran, K.; Heijmans, T.; van Bennekom, S.; Woldhuis, H.; Wijnia, S.; de With, G.; Friedrich, H. 3D printing of CNT- and graphene-based conductive polymer nanocomposites by fused deposition modeling. Appl. Mater. Today 2017, 9, 21–28. [Google Scholar] [CrossRef]
  24. Yan, J.; Uddin, M.; Dickens, T.; Okoli, O. Carbon nanotubes (CNTs) enrich the solar cells. Sol. Energy 2013, 96, 239–252. [Google Scholar] [CrossRef]
  25. Uddin, M.J.; Daramola, D.E.; Velasquez, E.; Dickens, T.J.; Yan, J.; Hammel, E.; Cesano, F.; Okoli, O.I. A high efficiency 3D photovoltaic microwire with carbon nanotubes (CNT)-quantum dot (QD) hybrid interface. Phys. Status Solidi Rapid Res. Lett. 2014, 8, 898–903. [Google Scholar] [CrossRef]
  26. Gonzalez, G.; Chiappone, A.; Roppolo, I.; Fantino, E.; Bertana, V.; Perrucci, F.; Scaltrito, L.; Pirri, F.; Sangermano, M. Development of 3D printable formulations containing CNT with enhanced electrical properties. Polymer 2017, 109, 246–253. [Google Scholar] [CrossRef]
  27. Fatemi, S.M.; Foroutan, M. Study of the Dynamic Behavior of Boron Nitride Nanotube (BNNT) and Triton Surfactant Complexes Using Molecular Dynamics Simulations. Adv. Sci. Eng. Med. 2014, 6, 583–590. [Google Scholar] [CrossRef]
  28. Xu, C.; Miao, M.; Jiang, X.; Wang, X. Thermal conductive composites reinforced via advanced boron nitride nanomaterials. Compos. Commun. 2018, 10, 103–109. [Google Scholar] [CrossRef]
  29. Chang, H.; Lu, M.; Luo, J.; Park, J.G.; Liang, R.; Park, C.; Kumar, S. Polyacrylonitrile/boron nitride nanotubes composite precursor and carbon fibers. Carbon 2019, 147, 419–426. [Google Scholar] [CrossRef]
  30. Joseph, A.M.; Nagendra, B.; Gowd, E.B.; Surendran, K.P. Screen-Printable Electronic Ink of Ultrathin Boron Nitride Nanosheets. ACS Omega 2016, 1, 1220–1228. [Google Scholar] [CrossRef] [PubMed]
  31. Bindhu, B.; Renisha, R.; Roberts, L.; Varghese, T. Boron Nitride reinforced polylactic acid composites film for packaging: Preparation and properties. Polym. Test. 2018, 66, 172–177. [Google Scholar] [CrossRef]
  32. Donnay, M.; Tzavalas, S.; Logakis, E. Boron nitride filled epoxy with improved thermal conductivity and dielectric breakdown strength. Compos. Sci. Technol. 2015, 110, 152–158. [Google Scholar] [CrossRef]
  33. Golberg, D.; Bando, Y.; Tang, C.C.; Zhi, C.Y. Boron Nitride Nanotubes. Adv. Mater. 2007, 19, 2413–2432. [Google Scholar] [CrossRef]
  34. Wang, W.-L.; Bi, J.-Q.; Sun, K.-N.; Du, M.; Long, N.-N.; Bai, Y.-J. Thermal Shock Resistance Behavior of Alumina Ceramics Incorporated with Boron Nitride Nanotubes. J. Am. Ceram. Soc. 2011, 94, 2304–2307. [Google Scholar] [CrossRef]
  35. Muratov, D.; Kuznetsov, D.; Il’Inykh, I.; Burmistrov, I.; Mazov, I. Thermal conductivity of polypropylene composites filled with silane-modified hexagonal BN. Compos. Sci. Technol. 2015, 111, 40–43. [Google Scholar] [CrossRef]
  36. Wattanakul, K.; Manuspiya, H.; Yanumet, N. Effective surface treatments for enhancing the thermal conductivity of BN-filled epoxy composite. J. Appl. Polym. Sci. 2010, 119, 3234–3243. [Google Scholar] [CrossRef]
  37. Wang, X.; Pakdel, A.; Zhang, J.; Weng, Q.; Zhai, T.; Zhi, C.; Golberg, D.; Bando, Y. Large-surface-area BN nanosheets and their utilization in polymeric composites with improved thermal and dielectric properties. Nanoscale Res. Lett. 2012, 7, 662. [Google Scholar] [CrossRef]
  38. Terao, T.; Zhi, C.; Bando, Y.; Mitome, M.; Tang, C.; Golberg, D. Alignment of Boron Nitride Nanotubes in Polymeric Composite Films for Thermal Conductivity Improvement. J. Phys. Chem. C 2010, 114, 4340–4344. [Google Scholar] [CrossRef]
  39. Guan, J.; Ashrafi, B.; Martinez-Rubi, Y.; Jakubinek, M.B.; Rahmat, M.; Kim, K.S.; Simard, B. Epoxy resin nanocomposites with hydroxyl (OH) and amino (NH2) functionalized boron nitride nanotubes. Nanocomposites 2018, 4, 10–17. [Google Scholar] [CrossRef] [Green Version]
  40. Liao, Y.; Chen, Z.; Connell, J.W.; Fay, C.C.; Park, C.; Kim, J.-W.; Lin, Y. Chemical Sharpening, Shortening, and Unzipping of Boron Nitride Nanotubes. Adv. Funct. Mater. 2014, 24, 4497–4506. [Google Scholar] [CrossRef] [Green Version]
  41. Lee, C.H.; Zhang, N.; Yap, Y.K. Functionalization, Dispersion, and Cutting of Boron Nitride Nanotubes in Water. J. Phys. Chem. C 2011, 116, 1798–1804. [Google Scholar] [CrossRef]
  42. Armbrister, C.E.E.; Shohag, A.S.; Scheiner, M.V.; Okoli, O.I. The fabrication of mechanoluminescent composites manufactured via the displaced foam dispersion technique. Plast. Rubber Compos. 2019, 48, 191–200. [Google Scholar] [CrossRef]
  43. Zhi, C.; Hanagata, N.; Bando, Y.; Golberg, D. Dispersible Shortened Boron Nitride Nanotubes with Improved Molecule-Loading Capacity. Chem. Asian J. 2011, 6, 2530–2535. [Google Scholar] [CrossRef] [PubMed]
  44. Hemrick, J.; Kistler, C.; Wereszczak, A.; Ferber, M. Thermal Conductivity of Alumina Measured with Three Techniques. J. Test. Eval. 2003, 31, 438–442. [Google Scholar] [CrossRef]
  45. Swaminathan, G.; Shivakumar, K. A Re-examination of DMA Testing of Polymer Matrix Composites. J. Reinf. Plast. Compos. 2008, 28, 979–994. [Google Scholar] [CrossRef]
  46. Al-Kaysi, R.O.; Müller, A.M.; Ahn, T.-S.; Lee, S.; Bardeen, C.J. Effects of Sonication on the Size and Crystallinity of Stable Zwitterionic Organic Nanoparticles Formed by Reprecipitation in Water. Langmuir 2005, 21, 7990–7994. [Google Scholar] [CrossRef] [PubMed]
  47. Ghaleb, Z.; Mariatti, M.; Ariff, Z. Properties of graphene nanopowder and multi-walled carbon nanotube-filled epoxy thin-film nanocomposites for electronic applications: The effect of sonication time and filler loading. Compos. Part A Appl. Sci. Manuf. 2014, 58, 77–83. [Google Scholar] [CrossRef]
  48. Xie, X.; Mai, Y.; Zhou, X. Dispersion and alignment of carbon nanotubes in polymer matrix: A review. Mater. Sci. Eng. R Rep. 2005, 49, 89–112. [Google Scholar] [CrossRef]
  49. Signori, F.; Coltelli, M.-B.; Bronco, S. Thermal degradation of poly(lactic acid) (PLA) and poly(butylene adipate-co-terephthalate) (PBAT) and their blends upon melt processing. Polym. Degrad. Stab. 2009, 94, 74–82. [Google Scholar] [CrossRef]
  50. Crosby, A.J.; Lee, J. Polymer Nanocomposites: The “Nano” Effect on Mechanical Properties. Polym. Rev. 2007, 47, 217–229. [Google Scholar] [CrossRef]
  51. Fathima, P.; Panda, S.K.; Ashraf, P.M.; Varghese, T.; Bindu, J. Polylactic acid/chitosan films for packaging of Indian white prawn (Fenneropenaeus indicus). Int. J. Biol. Macromol. 2018, 117, 1002–1010. [Google Scholar] [CrossRef] [PubMed]
  52. Bindu, J.; Kumar, K.S.; Panda, S.K.; Katiyar, V. Biopolymer Dispersed Poly Lactic Acid Composites and Blends for Food Packaging Applications. In Green Composites; Springer International Publishing: Chem, Switzerland, 2019; pp. 209–235. [Google Scholar]
  53. Fragneaud, B.; Masenelli-Varlot, K.; Gonzalez-Montiel, A.; Terrones, M.; Cavaillé, J. Mechanical behavior of polystyrene grafted carbon nanotubes/polystyrene nanocomposites. Compos. Sci. Technol. 2008, 68, 3265–3271. [Google Scholar] [CrossRef] [Green Version]
  54. Qian, D.; Dickeya, E.C.; Andrews, R.; Rantell, T. Load transfer and deformation mechanisms in carbon nanotube-polystyrene composites. Appl. Phys. Lett. 2000, 76, 2868–2870. [Google Scholar] [CrossRef] [Green Version]
  55. Zhi, C.; Bando, Y.; Tang, C.; Honda, S.; Kuwahara, H.; Golberg, D. Boron nitride nanotubes/polystyrene composites. J. Mater. Res. 2006, 21, 2794–2800. [Google Scholar] [CrossRef]
  56. Zaldivar, R.J.; Witkin, D.B.; Mclouth, T.; Patel, D.N.; Schmitt, K.; Nokes, J.P. Influence of processing and orientation print effects on the mechanical and thermal behavior of 3D-Printed ULTEM® 9085 Material. Addit. Manuf. 2017, 13, 71–80. [Google Scholar] [CrossRef]
  57. Stanković, T.; Mueller, J.; Shea, K. The effect of anisotropy on the optimization of additively manufactured lattice structures. Addit. Manuf. 2017, 17, 67–76. [Google Scholar] [CrossRef]
  58. Yu, M.-F.; Lourie, O.; Dyer, M.J.; Moloni, K.; Kelly, T.F.; Ruoff, R.S. Strength and Breaking Mechanism of Multiwalled Carbon Nanotubes Under Tensile Load. Science 2000, 287, 637–640. [Google Scholar] [CrossRef] [PubMed] [Green Version]
  59. Hao, A.; Zhang, S.; Nguyen, N.; Dong, L.; Jolowsky, C.; Sweat, R.D.; Park, G.; Liang, Z. Manufacturing Process and Mechanical Properties of Carbon Fiber/Carbon Nanotube Buckypaper Interply Hybrid Compo-Sites, Proceedings of the 21st International Conference on Composite Materials, Xi’an, China, 20–25 August 2017; High-Performance Materials Institute: Tallahassee, FL, USA, 2017. [Google Scholar]
  60. Downes, R.; Wang, S.; Haldane, D.; Moench, A.; Liang, R. Strain-Induced Alignment Mechanisms of Carbon Nanotube Networks. Adv. Eng. Mater. 2014, 17, 349–358. [Google Scholar] [CrossRef]
  61. Coumans, W.; Heikens, D.; Dirk, S. Dilatometric investigation of deformation mechanisms in polystyrene-polyethylene block copolymer blends: Correlation between Poisson ratio and adhesion. Polymer 1980, 21, 103–108. [Google Scholar] [CrossRef] [Green Version]
  62. Oh, E.-S. Elastic properties of boron-nitride nanotubes through the continuum lattice approach. Mater. Lett. 2010, 64, 859–862. [Google Scholar] [CrossRef]
  63. Shen, X.; Liu, H.; Cheng, X.-B.; Yan, C.; Huang, J.-Q. Beyond lithium ion batteries: Higher energy density battery systems based on lithium metal anodes. Energy Storage Mater. 2018, 12, 161–175. [Google Scholar] [CrossRef]
  64. Mitrano, M.; Husain, A.A.; Vig, S.; Kogar, A.; Rak, M.S.; Rubeck, S.I.; Schmalian, J.; Uchoa, B.; Schneeloch, J.; Zhong, R.; et al. Anomalous density fluctuations in a strange metal. Proc. Natl. Acad. Sci. USA 2018, 115, 5392–5396. [Google Scholar] [CrossRef] [PubMed] [Green Version]
  65. Kumar, A.P.; Depan, D.; Tomer, N.S.; Singh, R.P. Nanoscale particles for polymer degradation and stabilization—Trends and future perspectives. Prog. Polym. Sci. 2009, 34, 479–515. [Google Scholar] [CrossRef]
  66. Zhi, C.; Bando, Y.; Terao, T.; Tang, C.; Kuwahara, H.; Golberg, D. Towards Thermoconductive, Electrically Insulating Polymeric Composites with Boron Nitride Nanotubes as Fillers. Adv. Funct. Mater. 2009, 19, 1857–1862. [Google Scholar] [CrossRef]
  67. Progelhof, R.C.; Throne, J.L.; Ruetsch, R.R. Methods for predicting the thermal conductivity of composite systems: A review. Polym. Eng. Sci. 1976, 16, 615–625. [Google Scholar] [CrossRef]
  68. Pietrak, K.; Wisniewski, T.S. A review of models for effective thermal conductivity of composite materials. J. Power Technol. 2014, 95, 14–24. [Google Scholar]
  69. Pal, R. On the Lewis–Nielsen model for thermal/electrical conductivity of composites. Compos. Part A Appl. Sci. Manuf. 2008, 39, 718–726. [Google Scholar] [CrossRef]
  70. Ebadi-Dehaghani, H.; Nazempour, M. Thermal Conductivity of Nanoparticles Filled Polymers. In Smart Nanoparticles Technology; Abbass, H., Ed.; InTech Open: London, UK, 2012. [Google Scholar]
  71. Pan, C.; Kou, K.; Zhang, Y.; Li, Z.; Wu, G. Enhanced through-plane thermal conductivity of PTFE composites with hybrid fillers of hexagonal boron nitride platelets and aluminum nitride particles. Compos. Part B Eng. 2018, 153, 1–8. [Google Scholar] [CrossRef]
  72. Quill, T.J.; Smith, M.K.; Zhou, T.; Baioumy, M.G.S.; Berenguer, J.P.; Cola, B.A.; Kalaitzidou, K.; Bougher, T.L. Thermal and mechanical properties of 3D printed boron nitride—ABS composites. Appl. Compos. Mater. 2017, 25, 1205–1217. [Google Scholar] [CrossRef]
  73. Zienkiewicz, O.C.; Taylor, R.L. The Finite Element Method; McGraw-Hill: New York, NY, USA, 1991; Volume 2. [Google Scholar]
Figure 1. SEM surface image of as-received boron nitrides nanotube (BNNT) raw material with scale bars at (a) 2 µm and (b) 200 nm.
Jcs 05 00061 g001
Figure 2. SEM surface image of 10 parts by wt. (10 wt. %) PS-BNNT composite formed using (a) direct mixing and (b) sonication processes with scale bars at 1 µm.
Jcs 05 00061 g002
Figure 3. (a) TGA and (b) differential scanning calorimeter (DSC) analysis of BNNTs, PS, and 10 parts by wt. (10 wt. %) PS-BNNT composite with direct mixing and sonication processes, respectively.
Jcs 05 00061 g003
Figure 4. (a) Stress–strain curves and (b) storage modulus curves for PS, 10 parts by wt. (10 wt. %) PS-BNNT composite with direct mixing and sonication processes when deformed at a constant amplitude of 0.1% at a frequency of 1 Hz at various temperatures, respectively.
Jcs 05 00061 g004
Figure 5. (a) SEM image of PS-BNNT; (b) digitized geometry model input; (c,e) unsplit and split BNNT bundle within the PS-BNNT matrix before and after stress deformation of the composite for (d) unsplit bundles in direct mixing, and (f) split bundles in sonication processes, respectively.
Jcs 05 00061 g005
Figure 6. Laser flash analysis (LFA) calculated graph of thermal conductivity vs. temperature of pure PS and 10 parts by wt. (10 wt. %) PS-BNNT composite with direct mixing and sonication processes, respectively.
Jcs 05 00061 g006
Figure 7. Comparison between experimental thermal conductivity data and prediction of the Lewis–Nielsen model.
Jcs 05 00061 g007
Figure 8. Infrared (IR) thermal imaging to determine its thermal performance of a 3D-printed (a) polystyrene pristine, (b) PS-BNNT (sonicated), and (c) PS-BNNT (direct mixing) heat sink for 30 min at 70 °C; 3D-printed (d) polystyrene, (e) PS-BNNT (~10 wt. % BNNT) sonicated, and (f) PS-BNNT directly-mixed heat sinks used for IR imaging, respectively; color gradient: hot-red, mild-yellow, and cold-blue, respectively.
Jcs 05 00061 g008
Figure 9. Simulation results using a printed heatsink computer-aided design (CAD) model of (ac) PS and (df) the PS-BNNT composite (direct mixing) with the base temperature set at 348 K (70 °C) for 30 min (a,d) at 0 min, (b,e) at 15 min, and (c,f) at 30 min, respectively.
Jcs 05 00061 g009
Publisher’s Note: MDPI stays neutral with regard to jurisdictional claims in published maps and institutional affiliations.

