Review

3D X-ray Microscopy as a Tool for in Depth Analysis of the Interfacial Interaction between a Single Carbon Fiber and an Epoxy Matrix after Mechanical Loading

Leibniz-Institut für Verbundwerkstoffe GmbH, Erwin-Schrödinger-Straße 58, 67663 Kaiserslautern, Germany
*
Author to whom correspondence should be addressed.
J. Compos. Sci. 2021, 5(5), 121; https://0-doi-org.brum.beds.ac.uk/10.3390/jcs5050121
Submission received: 1 April 2021 / Revised: 20 April 2021 / Accepted: 29 April 2021 / Published: 4 May 2021
(This article belongs to the Special Issue Characterization and Modelling of Composites, Volume II)

Abstract

:
The benefit of fiber-reinforced composites originates from the interaction between the fiber reinforcement and the matrix. This interplay controls many of its mechanical properties and is of utmost importance to enable its unique performance as a lightweight material. However, measuring the fiber−matrix interphase strength with micromechanical tests, like the Broutman test, is challenging, due to the many, often unknown boundary conditions. Therefore, this study uses state-of-the-art, high-resolution X-ray computed microtomography (XRM) as a tool to investigate post mortem the failure mechanisms of single carbon fibers within an epoxy matrix. This was conducted at the example of single carbon fiber Broutman test specimens. The capabilities of today’s XRM analysis were shown in comparison to classically obtained light microscopy. A simple finite element model was used to enhance the understanding of the observed fracture patterns. In total, this research reveals the possibilities and limitations of XRM to visualize and assess compression-induced single fiber fracture patterns. Furthermore, comparing two different matrix systems with each other illustrates that the failure mechanisms originate from differences in the fiber−matrix interphases. The carbon fiber seems to fail due to brittleness under compression stress. Observation of the fiber slippage and deformed small fracture pieces between the fragments suggests a nonzero stress state at the fragment ends after fiber failure. Even more, these results demonstrate the usefulness of XRM as an additional tool for the characterization of the fiber−matrix interphase.

1. Introduction

Carbon fiber reinforced polymers (CFRP) possess a key role in lightweight structural design. Thereby, especially the mechanical properties of a CFRP strongly depend on the interaction between fiber and matrix. The force transfer from matrix to fiber occurs through the so-called interphase: a three-dimensional individual phase, in which the properties gradually change from matrix to fiber. Hence, it is influenced by both the properties of the matrix and the fiber [1,2] and formed by the interaction of the fiber surface with the matrix during processing [2,3]. However, its spatial dimensions are often not known or are often simply neglected. Therefore, in contrast to the interphase, an interface is understood as a geometrically well-defined 2D contact area between distinct phases such as the matrix and/or the fiber [4,5,6].
In the loaded case, additional to sufficient adhesive strength between fiber and matrix, also high cohesive strength in the matrix needs to prevail at every point along the fiber−matrix interphase to achieve a maximum stress transfer [4]. Therefore, the failure mechanisms of the fiber under mechanical loading depend strongly on the adhesive and cohesive interphase properties, which are geometrically, and in terms of mechanical properties, not well defined [1,7]. The discrepancy between actually measured and theoretically expected fiber−matrix interaction can be attributed to imperfections (pores/voids/difference in bulk elastic properties) either at the interface, in the interphase or of the constituents. Understanding the fiber−matrix interaction is of utmost importance [2,4,7] and many examples show that controlling the interphase leads to improved mechanical properties of the whole CFRP composites [8,9,10]. Describing the interphase in a composite material requires reliable and reproducible methods for characterization, but due to the small dimensions and the gradual transition to the volume properties of the matrix, its properties are difficult to measure [1]. The challenge for quantitative characterization of the interphase is not only specimen preparation itself but also the entire experimental procedure. There is no micromechanical test standard to reproducibly determine the interphase quality, e.g., by determining the force transfer between a single fiber and the surrounding matrix. Moreover, the various methods are not comparable with each other, due to differences in introduced stress states either caused by the nature of the test itself or the specific specimen dimensions, as the force can be applied either fiber-sided, as in the pull-out test and the microbond test, or matrix-sided, as in the Broutman test and the fragmentation test. The interpretation of their results is often difficult because boundary conditions such as the extension of the interphase itself or its adhesion to the fiber surface cannot be controlled reliably by the experiment or accurately modeled in such detail. For example, in the pull-out test, edge effects must be taken into account, which result in an increase in shear stress at the fiber’s entry into the matrix resin. In the microbond test, the influence of the geometry of the matrix droplet and the position of the cutting edges on the resulting stress state has been demonstrated successfully [11]. All tests mentioned above are based on a description of the shear stress in the interface instead of the normal stress as the Broutman test [12,13].
Most importantly, the resulting stress distribution in the specimen is often complex and difficult to assess. Today, it is not possible to measure only adhesive properties without the influences of the specimen’s geometry and boundary conditions, but since these quantities cannot be quantified, the real stress distribution in the interphase cannot be described. Instead, simplifications must be adopted to enable the description of the stress state to be approximated. Therefore, the properties of fiber and matrix have to be quantified. Quantifying the first failure at the interphase is a challenging task, after the first failure friction (slipping) affects the measured quantities, this complicates the interpretation of the results [14]. Optical investigation methods, such as stress-induced birefringence used during a pull-out or Broutman test are helpful for describing the micromechanical failure processes because they visualize the stress distribution along the interface at any time. However, optical evaluation of micromechanical failure processes are limited to transparent specimens. Other limitations include limited, region of interest (ROI) depth of field and resolution.
On the other hand, test methods like nondestructive imaging of the internal structure of a preloaded specimen via X-ray microscopy (XRM) are capable of supporting the identification of those stress distributions by the investigation of the fracture pattern post mortem in great detail. High-resolution 3D X-ray imaging of composite materials, especially for the analysis of structurally dependent mechanical properties has experienced significant growth over the last decade, due to enhancements in spatial resolution [15]. However, the application as an additional tool for characterizing CFRP interphases is a recently evolving topic [15,16]. The 3D visualization of failure, induced by mechanical loading can help to better understand the complex stress distribution in micromechanical tests, by combining them with a simulation-based analysis that reproduces the observed fracture pattern [4,17]. X-ray investigations of CFRP are especially challenging because of (I) the small diameter of the fibers and (II) the low contrast between carbon-based materials caused by similar atomic numbers. However, state-of-the-art microfocussed XRM enables in-line phase contrast and leads to very high-resolution at a distance by using optical and geometrical magnification.
The potential of the combination of micromechanical interphase testing with high-resolution XRM analysis for polymeric matrix composites was shown in [16], performing fragmentation tests on epoxy and vinylester matrix reinforced flax fiber composites. The authors observed fiber fragments inside failure zones, which were not detectable using classical, optical light microscopy. They showed that matrix failure can be observed at various locations, where fiber fracture occurred in all systems with a good adhesion between the constituents. In addition, many studies have shown the great potential in correlating nondestructive structural analyses with mechanical testing to achieve a deeper insight of the macro-mechanical fiber−matrix interaction [15,18,19].
Understanding the interface interactions between fiber and matrix, based on finite element (FE) simulations has still not been fully explored. Several authors use cohesive-zone-modeling to simulate the interface behavior via push-out/push-in tests in comparison to the experimentally assessed interphase behavior (friction and cohesive interaction of fiber and matrix). In [20] a cohesive/volumetric FE model, which includes an augmented Lagrangian treatment of the frictional contact between spontaneously created fracture surfaces was used. It was able to simulate the spontaneous initiation and propagation of the debonding crack front. In [21] a parametric FE simulation study of a push-in test illustrated load separation in two regimes. First, the cohesive fiber−matrix interaction was investigated and then, with increasing load, a frictional contact between the debonded part of the fiber and the matrix was simulated. Jäger et al. [22] accomplished an FE model to verify the data of cyclical loading push-out tests that allowed the determination of the contributions of elastic, plastic and frictional energy. Therefore, a model of several fibers to simulate the crack initiation and progress in a specific fiber−matrix interface was used. It was shown that the plastic deformation of the matrix had a huge impact on the crack initiation in the interface. However, the FE simulation of crack initiation in the fiber after debonding takes place, and the effects of matrix detachment are not yet sufficiently evaluated. The influence of fiber sizing on the fiber−matrix debonding via a unit-cell cohesive damage model for the pull-out test was shown by [23]. With the stress distribution model the debonding mechanism of the interface could be explained in a way that the interface debonded first from the matrix.
The present paper describes an in-depth 3D XRM analysis of single carbon fiber—epoxy matrix-based—delamination failure after a micromechanical compression test (Broutman test). The compressive stress applied to a tail-shaped Broutman specimen, with a single fiber embedded, generates a complex stress distribution within the interphase; shear stresses are superimposed by normal stresses [17,24]. This promotes an off-axis delamination between the fiber and the matrix. However, small variations in the geometry, e.g., caused by specimen preparation, can have large effects on the stress distribution within the specimen and cause unpredictable failure of the composite. The complexity of the stress state in the Broutman test specimen has been emphasized by various authors [17,24,25]. Furthermore, the toughness and stiffness of a matrix affect the deformation and failure behavior of FRPs [26], and thus the stress state under mechanical loading. Thereby, especially epoxy-based matrices suffer from high brittleness and low ductility, due to their highly cross-linked molecular network structure. To investigate the full potential of post mortem high-resolution XRM imaging for a better understanding of interphase failure, two different matrix systems were compared. The change from a more elastic to a more brittle matrix affected the failure mechanisms within the Broutman specimen. The toughness as well as the stiffness of the epoxy matrix was altered using a core-shell rubber nanoparticle modified epoxy resin.
In the present study the challenges and the benefits of XRM as a powerful tool to analyze single fiber failure on the microscale are demonstrated, using the example of a brittle and tough epoxy matrix. This should allow a better understanding of (i) the failure behavior of single carbon fibers within epoxy matrices under compressive loads and (ii) an assessment of the stress distribution within the Broutman test specimen. The gained experimental knowledge was then transferred to a simulation-based analysis.

2. Materials and Methods

2.1. Materials

The study focused on a neat DGEBA-based epoxy resin (Biresin CR144, Sika Deutschland GmbH, Stuttgart, Germany) that was cured by an anhydride curing agent (Aradur 917 from Huntsman Advanced Materials GmbH, Basel, Switzerland [27]) and a toughened cycloaliphatic epoxy resin. The latter one being toughened with 16 wt.% (final system concentration) of core-shell rubber nanoparticles (KaneAce MX553 from Kaneka Belgium N.V., Westerlo-Oevel, Belgium [28]). The reactivity was in both cases adjusted by using a 1-methylimidazol accelerator (DY070 from Huntsman Advanced Materials GmbH, Basel, Switzerland [29]). Resin and curing agent were stoichiometrically mixed at 40 °C and cured in a three-step curing cycle: (1) 90 °C for 4 h, (2) 105 °C for 2 h, and (3) 140 °C for 4 h. The neat DGEBA-based epoxy matrix has a fracture toughness of 0.58 MPa√m, the toughened matrix of 1.4 MPa√m, which allows large scale energy dissipation via the activation of toughening mechanisms.
For the single carbon fiber (C-fiber) embedded in the specimen, a HTA40E13 (5131) [30] C-fiber from Toho Tenax (Tokyo, Japan) was used. The fiber was a high tenacity type one, having a diameter of 7 µm. The C-fiber was coated with an epoxy sizing. Material properties can be seen in Table 1. For better comparability with results obtained by light microscopy, the selected resin systems were transparent.

2.2. Specimen Preparation
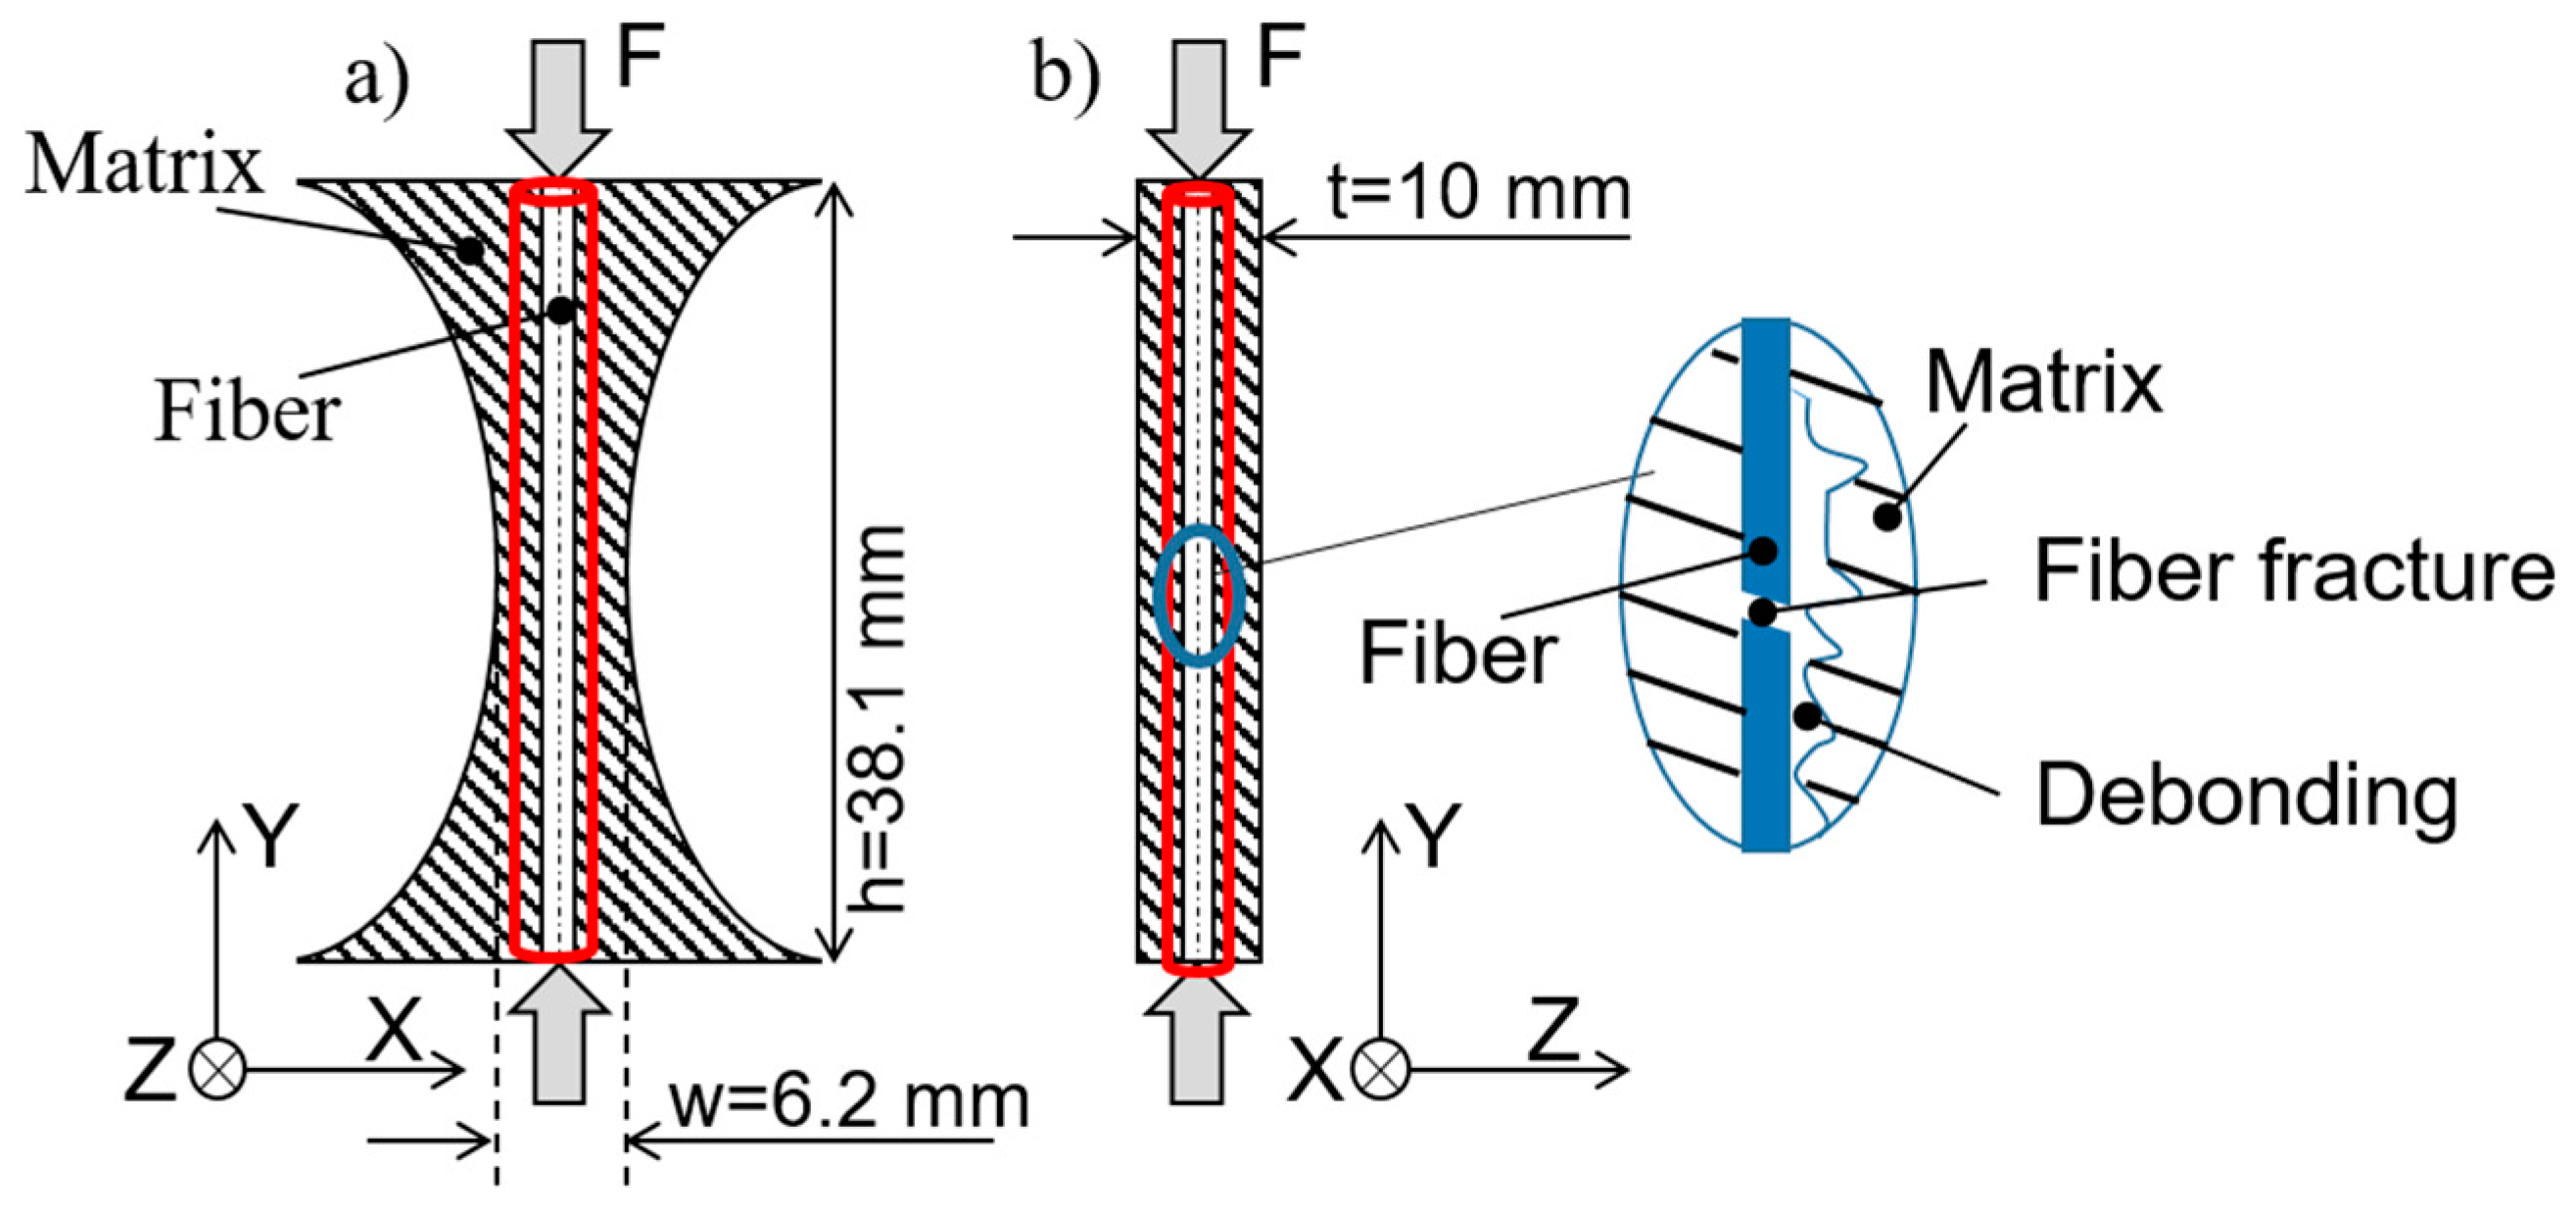
In this investigation, nonloaded (as prepared) as well as preloaded Broutman test specimens were post mortem analyzed via high-resolution 3D XRM. For X-ray imaging, the specimen size was reduced in several successive steps to achieve a specimen size suitable for acquisition of the internal structure. (Figure 1). The acquisition of the single fiber via XRM in the specimen having its original size was not possible (left, grey) due to the poor contrast of the constituents and the small fiber diameter relative to the specimen dimensions. Consequently, different specimen geometries and sizes were tested, until it was possible to visualize the embedded fiber. In a rotationally symmetric specimen (shown in the red box) the path length for the X-rays remained constant during rotation (between 0.95 and 1.2 mm), the latter resulting in an optimized imaging contrast. Two specimens were measured for each in Section 2.1 described system.

2.3. Broutman Test

The Broutman test [4,24] is based on a compressive load being applied along the direction of the embedded fiber (y-direction, cf. Figure 1). Because of the concave shape of the specimen, the highest compressive stress occurs in the smallest cross-section of the specimen. Due to the differences in the Poisson ratios of fiber and matrix, especially in the transverse direction, a debonding at the interphase is promoted (a brief model description of the test is given in Equation (1) in Supplementary Materials S1). The specimens were tested in a universal testing machine Zwick RetroLine with a 10 kN load cell. The crosshead speed was 1 mm/min. The performance of the Broutman test itself with the additional measurement set-up, were already described in [33]. Five specimens per configuration (C-Fiber with toughened polymeric matrix, C-Fiber with non-toughened polymeric matrix) were tested. During the test acoustic emission (AE) was applied to determine the fiber−matrix debonding force. Based on these results, the modelling parameters were selected. The fiber−matrix debonding force measured for the toughened matrix system was 5000 N and for the non-toughened matrix system 6500 N (more details are given in Figures S1 and S2 in S2 and the description in S3).

2.4. Optical Investigation of Specimen
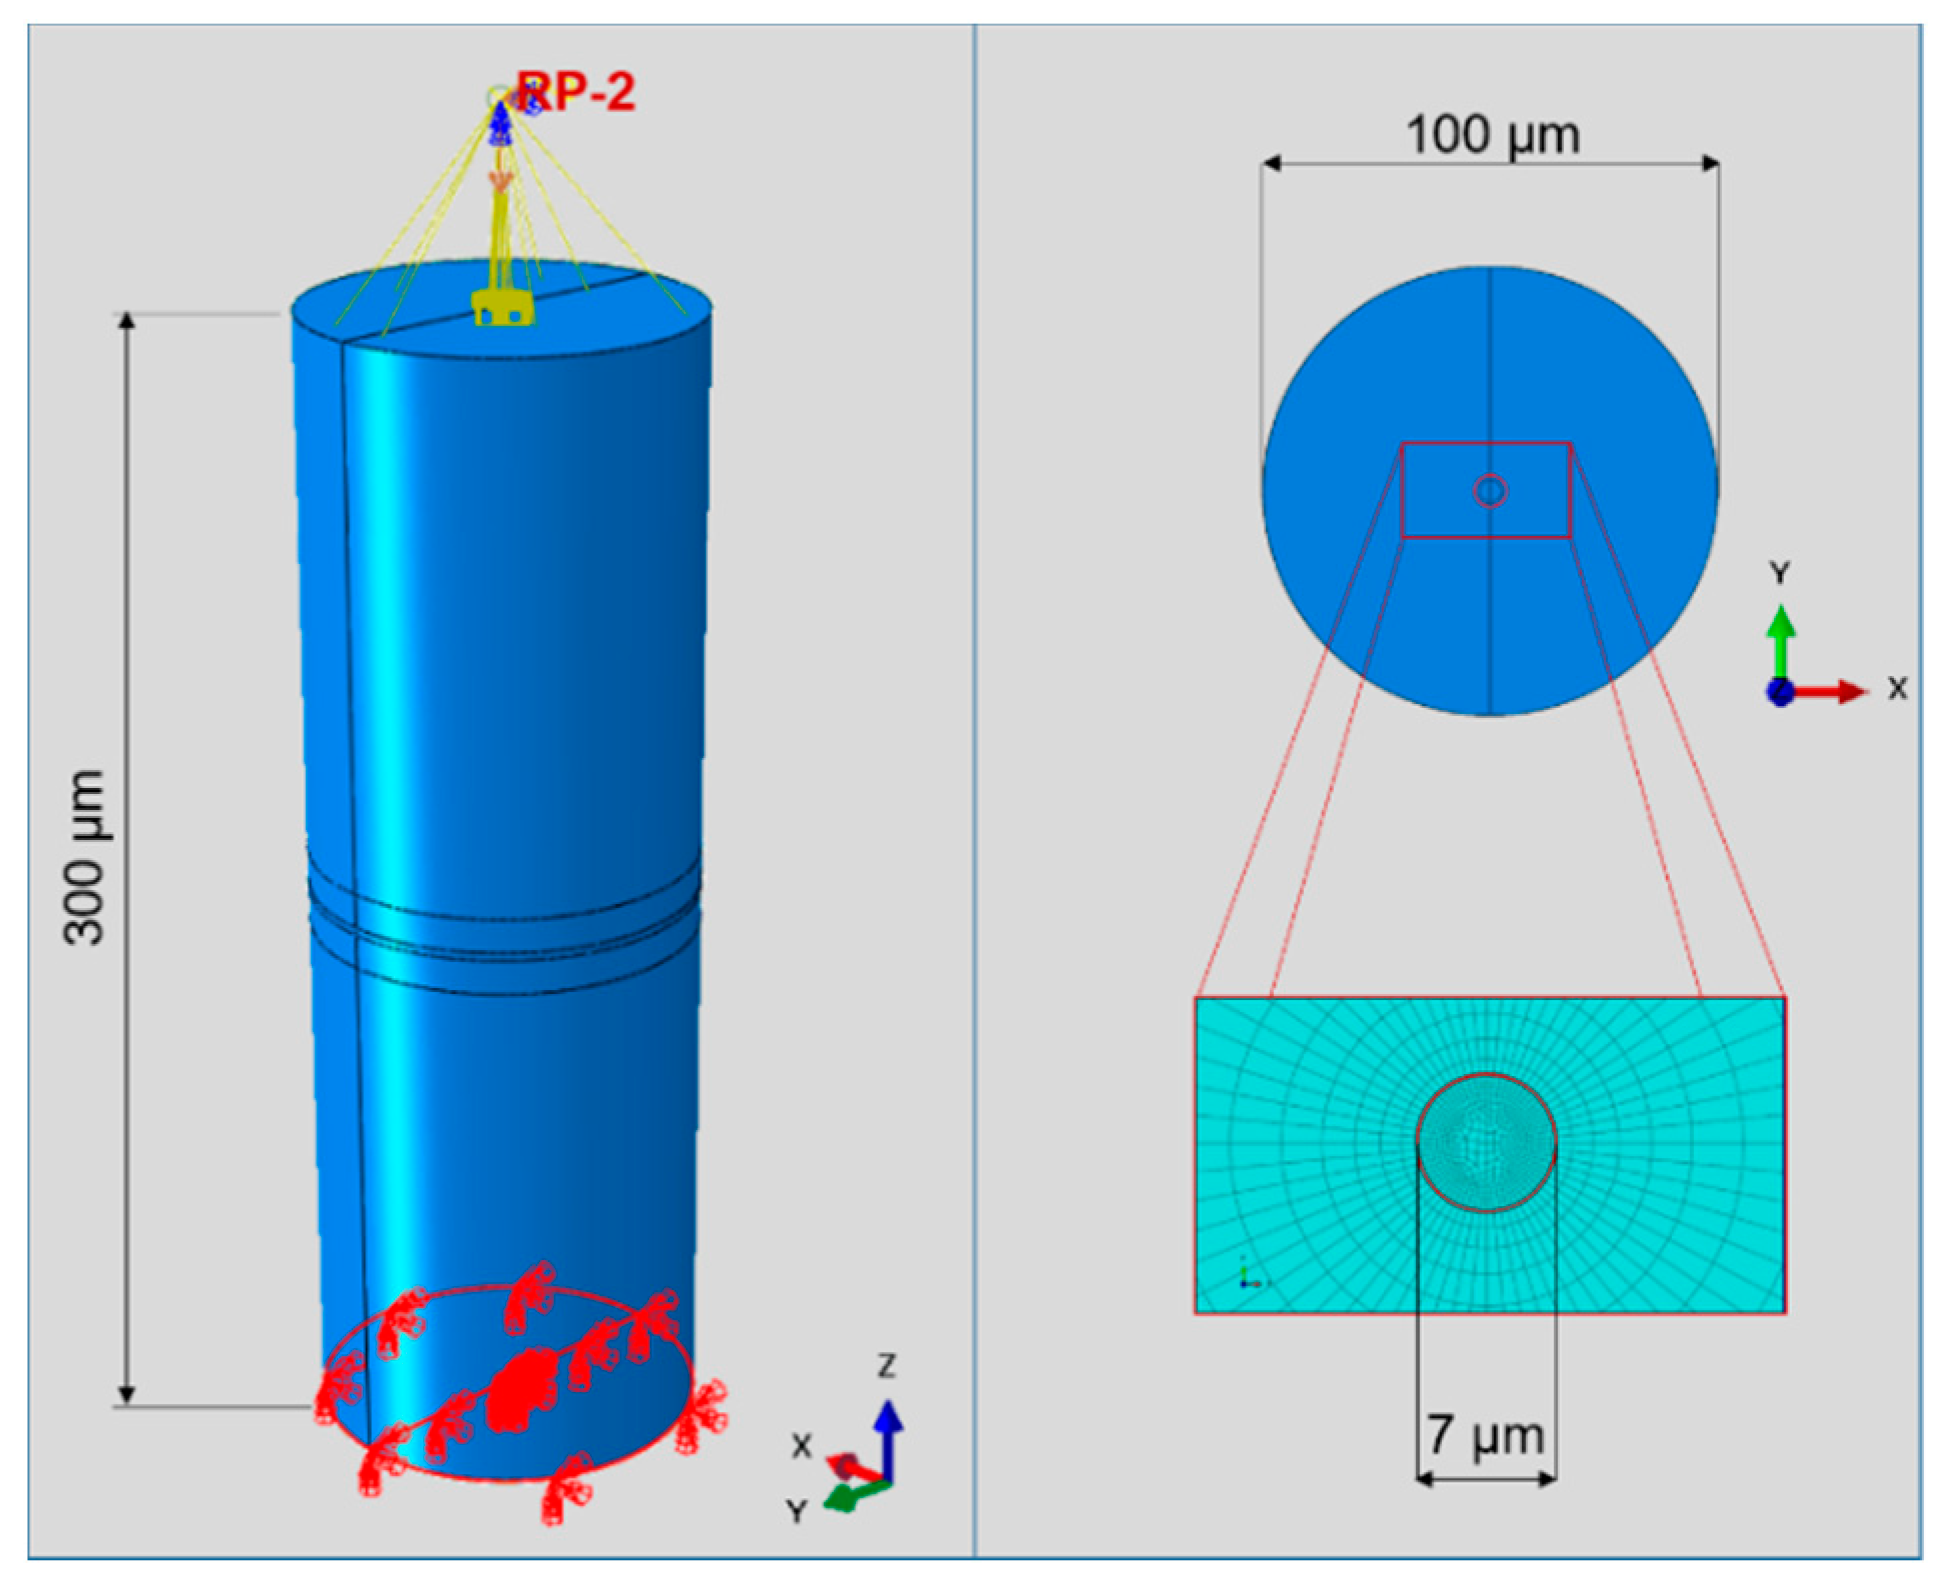
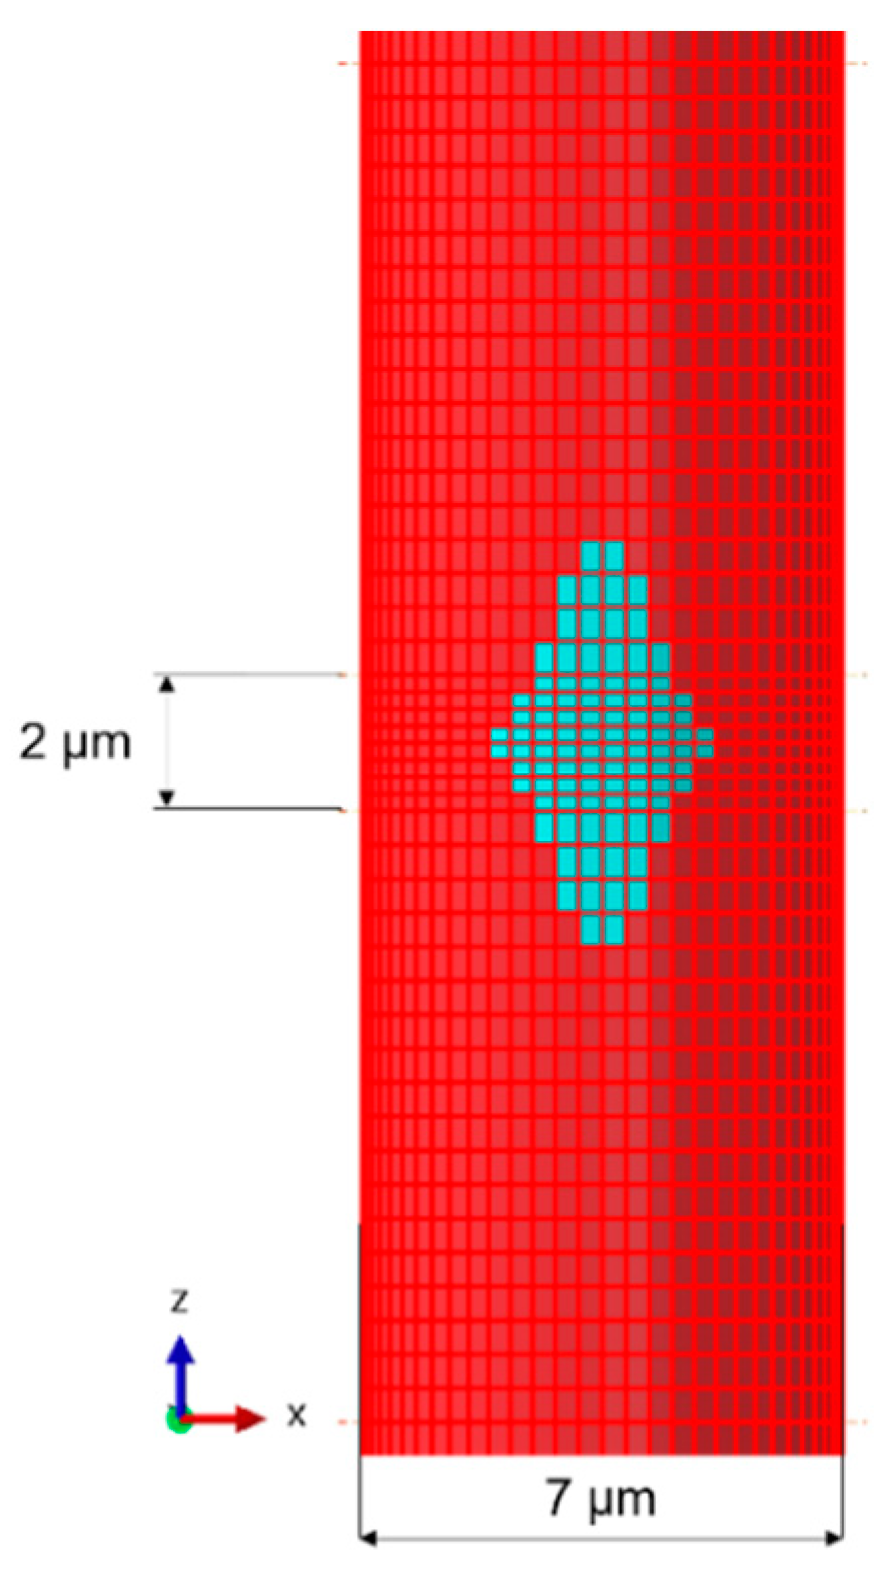
An optical investigation of the Broutman test specimens preloaded and nonloaded was conducted. Transparent specimens were analyzed with an optical microscope (Leica DM 6000, Wetzlar, Germany), with and without polarized light and with different magnifications. For the analysis of the internal structure via computed tomography (CT), the contrast between the substituents must be high enough to identify all phases (matrix, fiber and interphase) in the specimen and the introduced fracture pattern. Standard CT relies on the absorption contrast for imaging of the different phases in a material. The attenuation depends on the density of the respective material, its atomic number and the energy of the incident photon [15]. Absorption contrast alone is not sufficient to distinguish between the C-fibers and carbon-based polymeric matrix [34]. With optical high-resolution 3D XRM, an additional contrast-mechanism, so called in-line phase contrast, can be utilized: depending on the material tested, the type of X-ray source and energy, the phase difference between X-ray waves traveling through different materials, a birefringence pattern in the Fresnel-regime manifests itself, leading to an increased feature detectability compared to simple absorption contrast, allowing for the detection of C-fibers in a polymeric matrix [15,19].
For nondestructive 3D imaging of the preloaded specimen, a high-resolution XRM (Zeiss Versa 520, Oberkochen, Germany) was used. Important details of this set-up are the small spot-size X-ray source, the specimen stage, enabling 360° rotation of the specimen, and the optical magnification unit, consisting of a scintillator screen, a microscope lens and the detector.
Due to the optical magnification in front of the detector, high-resolution at a distance can be achieved at a specified maximum resolution of 500 nm. The X-ray device has an acceleration voltage range of 40–160 kV within a maximum power of 10 W. A 1000 × 1000-pixel detector was used. The configuration of X-ray accelerating voltage, exposure time, geometrical and optical magnification, filtering and number of projections used is given in Table 2. As the diameter of the specimens varied slightly over the height in the specified range due to specimen preparation, the exposure time had to be adapted slightly to achieve the same number of counts to ensure a constant contrast. The exposure time used for the nonloaded specimen is marked with an (n), for the preloaded specimen with an (l). Hence, the settings for preloaded and nonloaded specimens can still be considered as identical. For the reconstruction, the software tool “Scout-and-Scan Control System Reconstructor” (Zeiss, Oberkochen, Germany) was used. The analysis of the volume was performed using VGSTUDIO Max 3.2.2.

2.5. Modeling

To investigate the influence of a stochastically occurring debonding failure in the interface between fiber and matrix on the stress distribution within a single C-fiber, a simplified FE model was used. Boundary conditions in the fiber−matrix interface were changed to reflect different debonding scenarios, which led to different stress distributions in the C-fiber. Due to the brittle fracture behavior of the C-fiber these stress concentrations could imply fracture planes and explain the experimentally observed fracture pattern. As FEM software, Abaqus 2020 (SIMULIA) was used.
The simplified FE model is presented in Figure 2. Herein, only a section of a C-fiber embedded in epoxy resin was investigated. The HTA40E13 C-fiber with diameter of 7 µm was surrounded by epoxy resin matrix with a cylindrical shape, 100 µm in diameter. On the bottom surface boundary conditions constrained any rotations as well as an out-of-plane displacement. In-plane displacements were allowed to enable deformations due to the Poisson ratios of the materials, which is a key effect within the Broutman test setup. The top surface was constrained via a reference point on which the same boundary conditions applied, except that the top surface was pushed down by 3 µm. The interface as a 2D contact zone in between the C-fiber and the matrix was assumed as ideal bonding and realized with rough and hard contact conditions. Simulating the interface as a contact allowed the identification of contact stresses in normal and shear directions later on. The material data used for the simulation is presented in Table 1 (toughened), where the C-fiber data either were taken from the datasheet of the supplier, from literature or partially were assumed, as noted. To avoid misunderstandings, the effects of the interphase on material properties of the matrix as they would appear in between C-fiber and matrix were neglected in the FE model. The data for the matrix were measured, according to DIN EN ISO 527. The C-fiber was simulated anisotropic, the epoxy resin matrix isotropic, both with linear elastic material behavior.
Debonding failure as it would appear during the Broutman test was realized by disabling certain elements in the contact surface from the C-fiber to the matrix. Thereby, a so-called cluster defect was assumed (see also Figure 3). Disabling these interface elements allowed no force transmission in between the C-fiber and matrix and led to stress concentrations around and within the thus debonded area. Some aspects have to be taken into account, such that the deactivation of elements leads to discontinuities at the edges, especially in corners. These discontinuities cannot be avoided due to the singularity effect caused by the change from not bonded to perfectly bonded. To minimize these discontinuities, which affect the overall results, certain measures can be used, such as the reduction of the element size or the element type itself. In our case, the element dimensions within the center of the defect were 0.25 µm in height and 0.34 µm in width, outside of the central section 0.50 µm in height with same width. The central section of the defect had a height of 2 µm (marked in Figure 3) and linear hexahedral elements were used (type C3D8) to allow for a reasonable short computing time of the FE simulation. This enabled the systematic investigation of different debonding scenarios and their influence on the stress distribution inside of the C-fiber. The results presented here have been verified by calculation with a quadratic element type, which exhibited a smaller zone being influenced by the singularities but showed higher stress peaks at these areas.
The geometry of the debonded area was chosen by a qualitative assumption of the stress distribution within the Broutman test specimen [4]. The concave shape of the Broutman test specimen leads to a concentration on opposite edges of the C-fiber. In consequence, circumferential stresses lead to two peaks at these edges, whereas in the axial direction the stresses are comparably high [17]. With the FE simulation setup though, several aspects, i.e., the different circumferential stresses, as well as a possible debonding on the opposite side, were in the first step neglected, due to the simplicity of the FE model and its interpretation.

3. Results

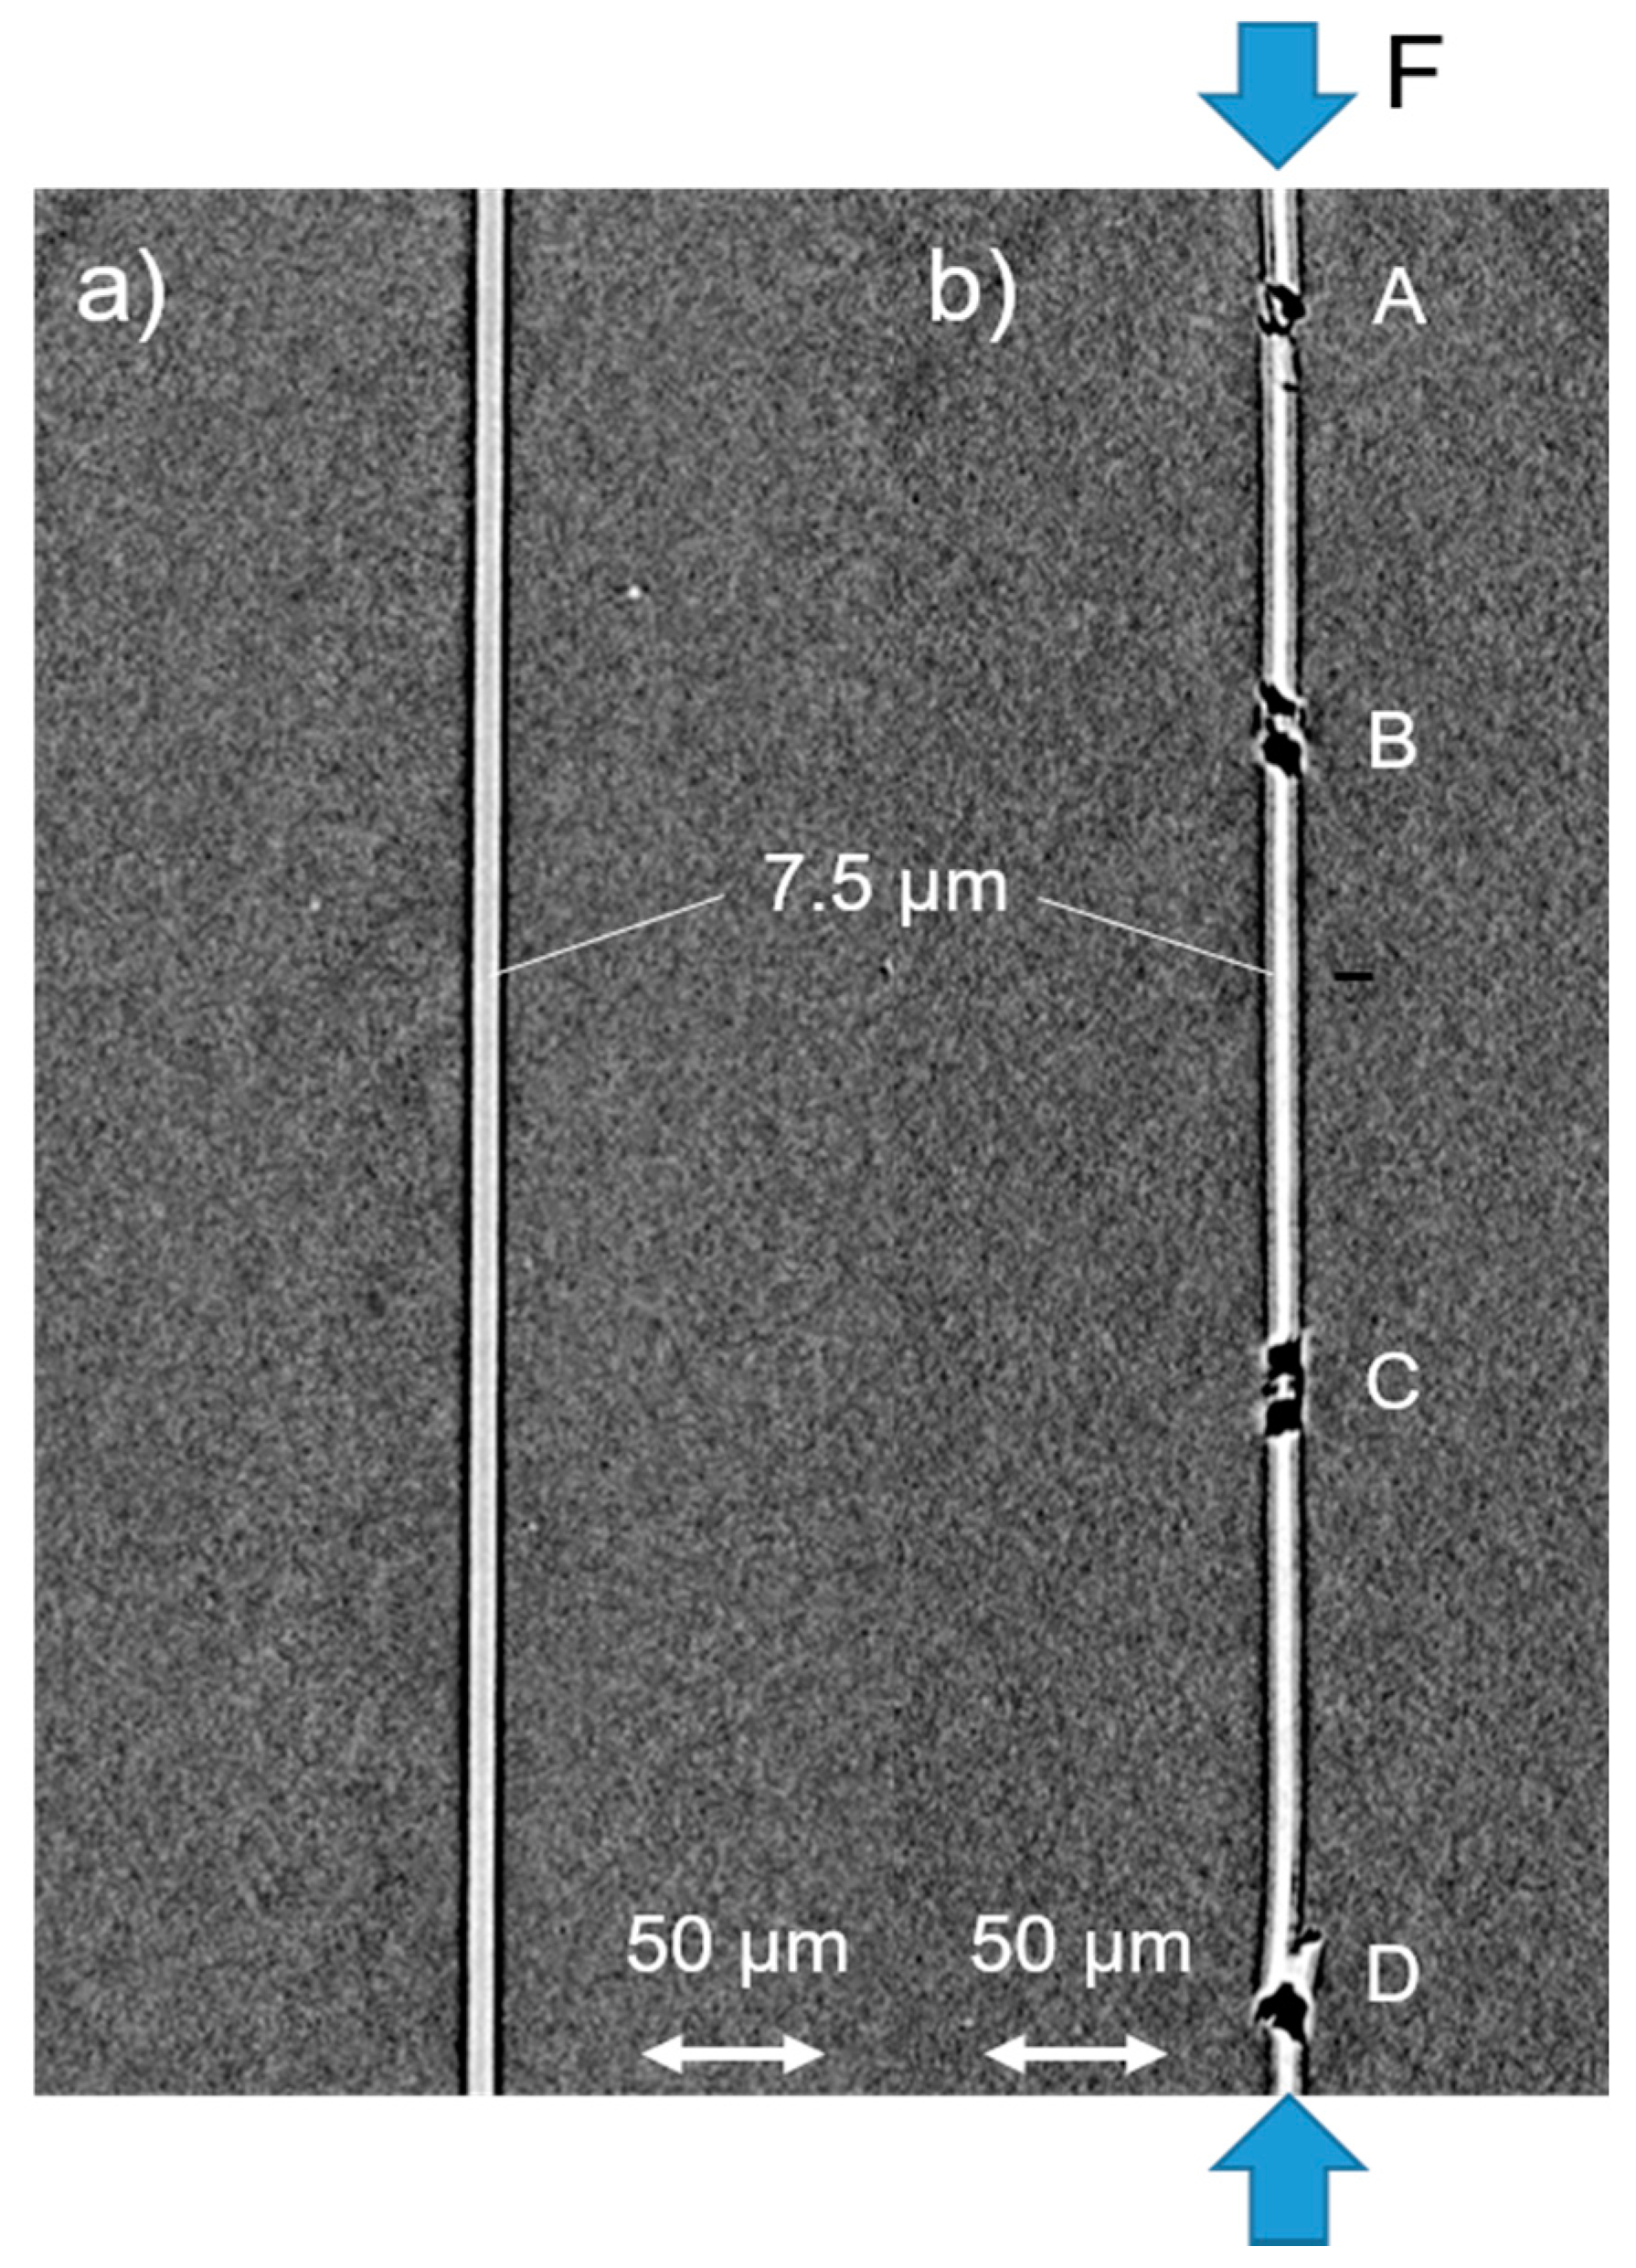
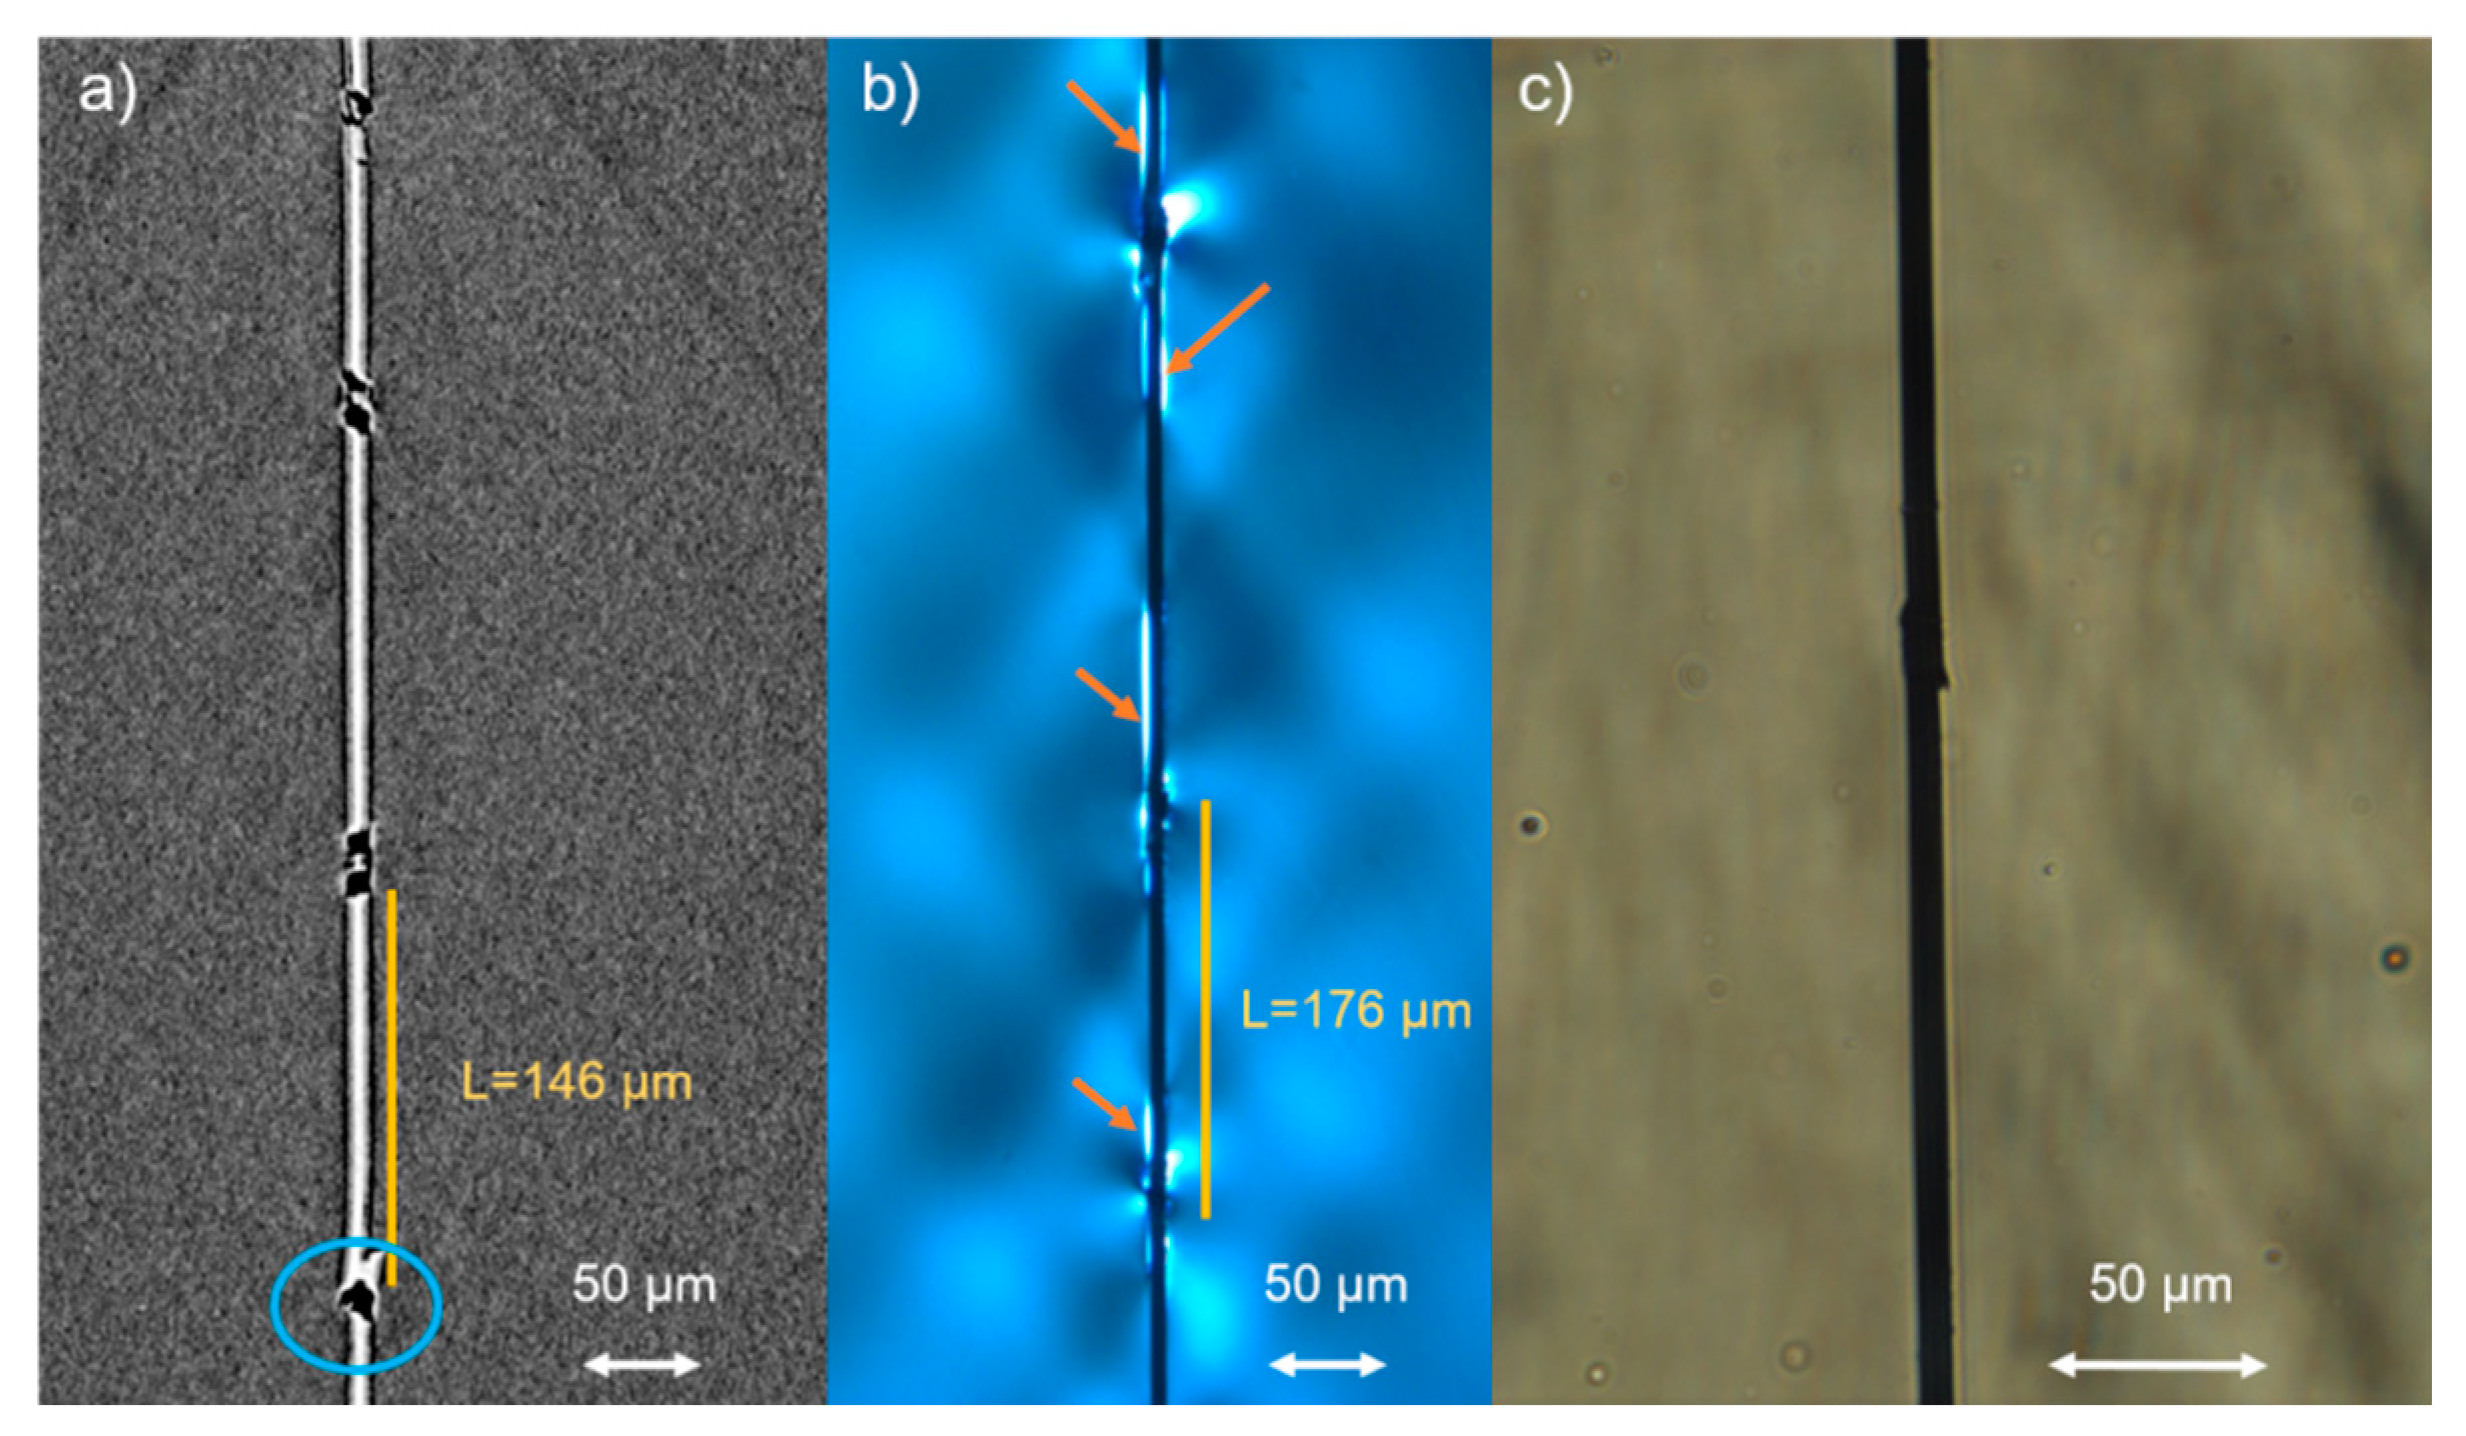
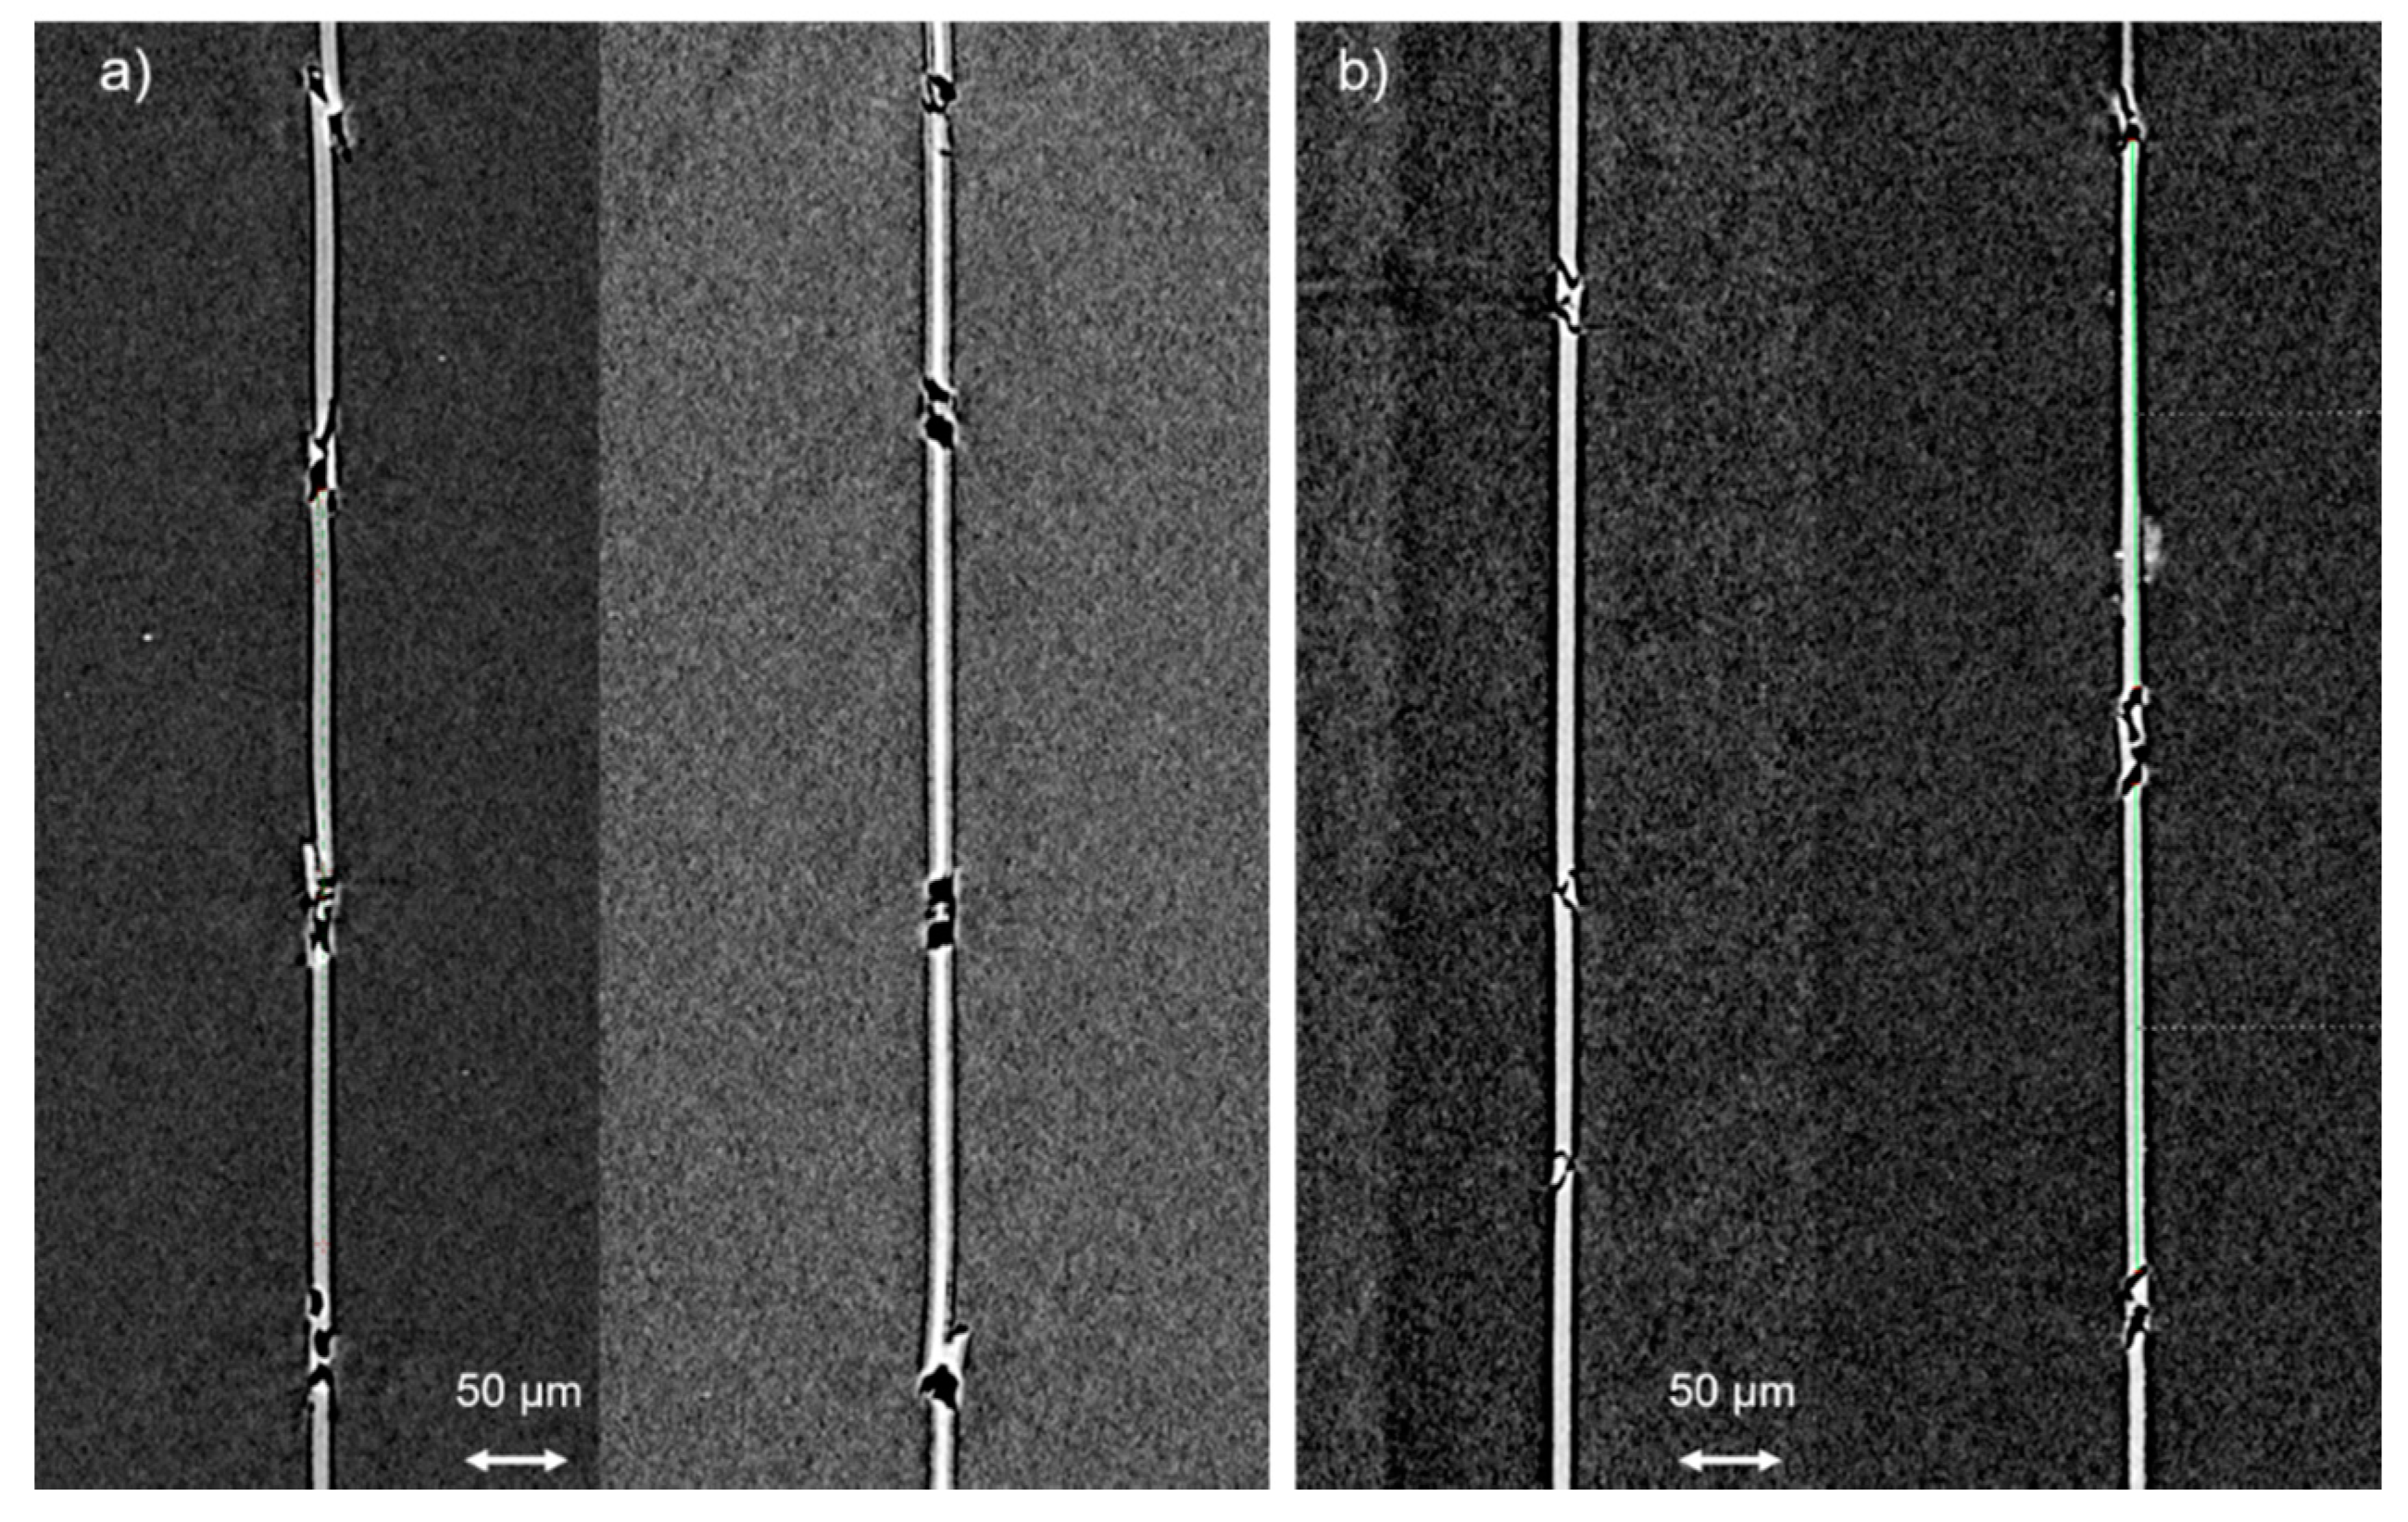
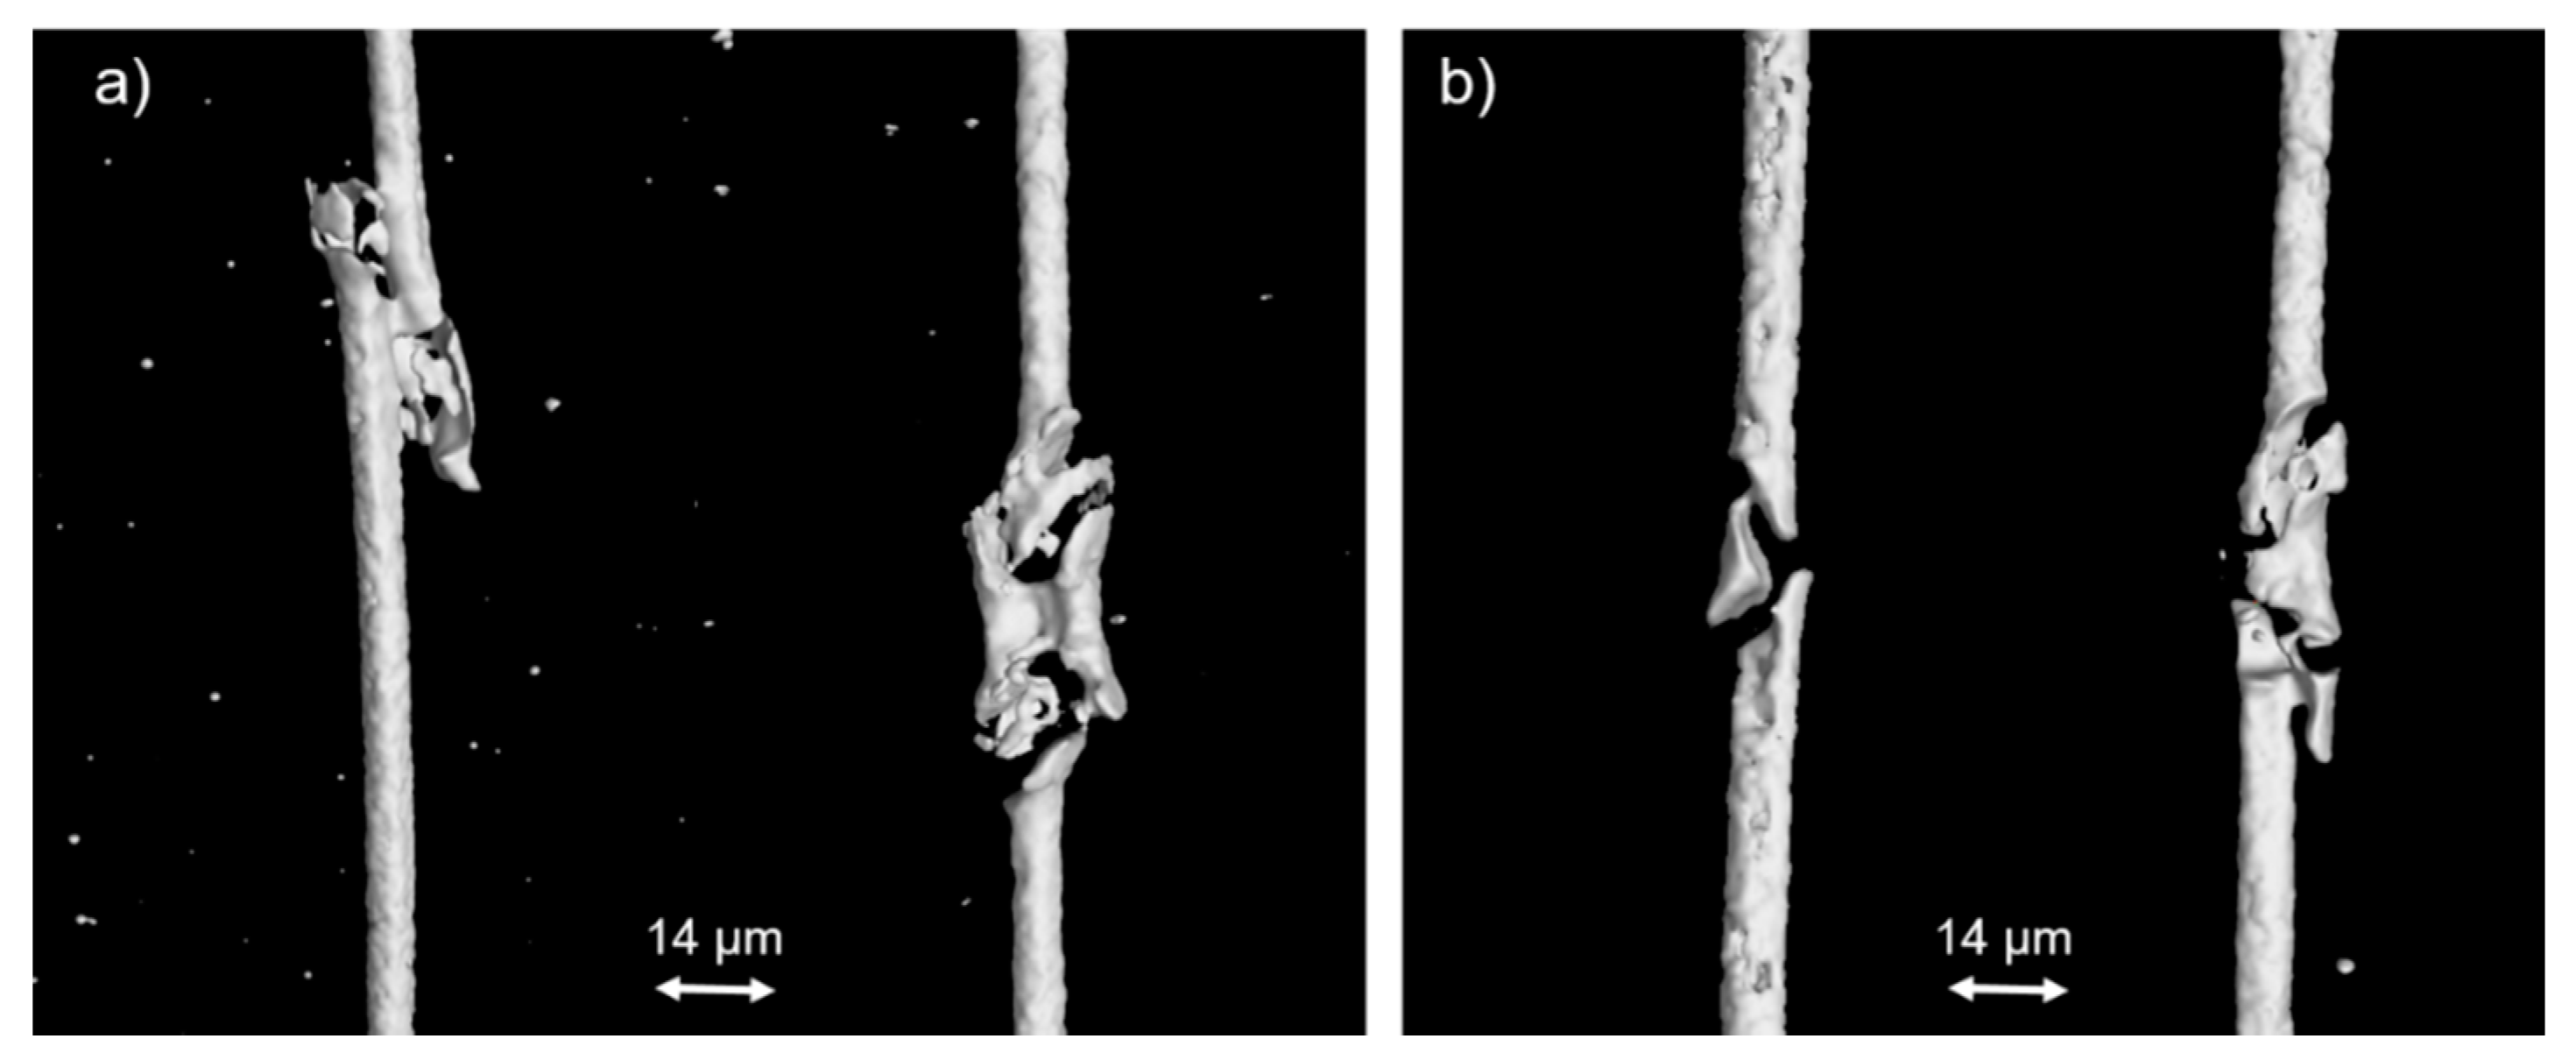
3.1. X-ray Imaging of as-Prepared Loaded and Nonloaded Broutman Test Specimen

In Figure 4, two X-ray projections of two Broutman test specimens are shown; a nonloaded specimen (a) and a preloaded specimen (b). The images were taken under identical imaging settings (Config. 4, Table 2), as described in Section 3.2 and schematically depicted in Figure 1b. The single C-fiber can be clearly distinguished with high contrast from the surrounding polymeric matrix. The as described machine settings led to an acquisition resolution of 650 nm. The mean diameter of the C-fiber can be estimated from the projections as approximately 7.5 µm, which is well in the range of the expected C-Fiber diameter, considering the resolution. Using high magnification and in-line phase contrast in the Fresnel-regime to enhance the overall contrast in the projection led to an excessive edge-contrast in the resulting projection, which appeared as a distinct black line between the C-fiber and surrounding matrix. Although the intensity of this artefact depended among other things on the acceleration voltage and magnification [15], it was not possible to completely eliminate it. Therefore, conclusions about the interface spatial dimensions between C-fiber and matrix are somehow speculative. However, the projection on the preloaded specimen in Figure 4b clearly showed four locations of fiber fracture (A, B, C and D) along the C-fiber with fracture sections of approximately 25.6 µm in length as a mean value. A characteristic fracture pattern could be seen with two fracture planes and a small fracture piece of approximately 2–8 µm in length in between. Figure 5 shows a high-resolution image of one of these C-fiber fracture sections of the projection shown in Figure 4. The volume view enabled a 3D representation of that region. This allowed the determination of the inclination angle of the fracture plane, which was in all observed cases about ±45° to the load direction.
Figure 6 shows the comparison of differently acquired failure zones extracted from the middle of preloaded Broutman specimens (toughened matrix) one projection taken with XRM (a) and two images taken using optical light microscopy, with (b) and without (c) polarized light. The X-ray projection (Figure 6a) was taken with a magnification of 200 times, with the settings described in Config. 4 in Table 2. The image, taken with polarized light (Figure 6b), also shown at 200 times magnification and Figure 6c was taken with light microscopy with a magnification of 500 times. Due to prevailing residual stresses in the matrix, either induced by the manufacturing process, i.e., shrinkage phenomena, or the applied loads, the polarized light revealed the areas on the C-fiber surface, where the matrix was debonded during testing, but the fracture point itself was not resolved in sufficient detail, so the measurement of the exact fragment length or the inclination angle of the fracture plane was not possible. The images taken with light microscopy did not visualize the observed fracture pattern, due to limited magnification and depth resolution. The X-ray imaging however revealed the most details in high resolution, offered the possibility of a volumetric visualization and enabled the examination of nontransparent specimens. Therefore, a quantitative assessment of the fracture in the C-fiber in terms of fragment length and inclination angle of the fracture plane was easily possible. In our case, the mean fragment length (L) was 176 µm, measured with the light microscope without polarized light considering five fragments of two different images taken from the same specimen. The mean fragment length measured with XRM was 146 µm, considering five fragments of two different scans taken from the same specimen. Measuring the exact fragment length is important for correlation of the fragment length and the stress distribution as Park et al. did, by comparing the results of the Fragmentation test with those gained with the Broutman test [25]. Furthermore, only X-ray imaging can visualize those small fracture pieces which are pushed into the matrix. At some locations this induced a local cohesive matrix failure mechanism. (Figure 6, blue circle) The orange arrows mark the probably debonded areas.
Figure 7 presents a projection of the toughened (a) and the non-toughened (b) specimen configuration for two specimens each. The fracture pattern of the non-toughened specimen was in most cases similar to the already described fracture pattern of the toughened specimen. The fracture section of the non-toughened specimens was approximately 22 µm in length as a mean value. The mean fragment length (L) was 183 µm, which was almost similar to the toughened system. The size of the small fracture pieces varied. The main visible difference between Figure 7a,b is the degree of fracture. In the toughened specimens, C-fiber slipping occurred. Additionally the small fracture pieces were pushed into the matrix, including cohesive matrix failure. The non-toughened specimens showed a smaller degree of fracture. After failure under compression, no further load seemed to be applied to the small fracture pieces. This can also be confirmed by the volume representation of individual fracture points of both systems, which is shown in Figure 8. A comprehensive interpretation of the results shown here will be given in Section 3.3. A comparison between the polarized light microscopy images of the toughened and non-toughened system is shown in the supplementary information (Figure S3 in S4).

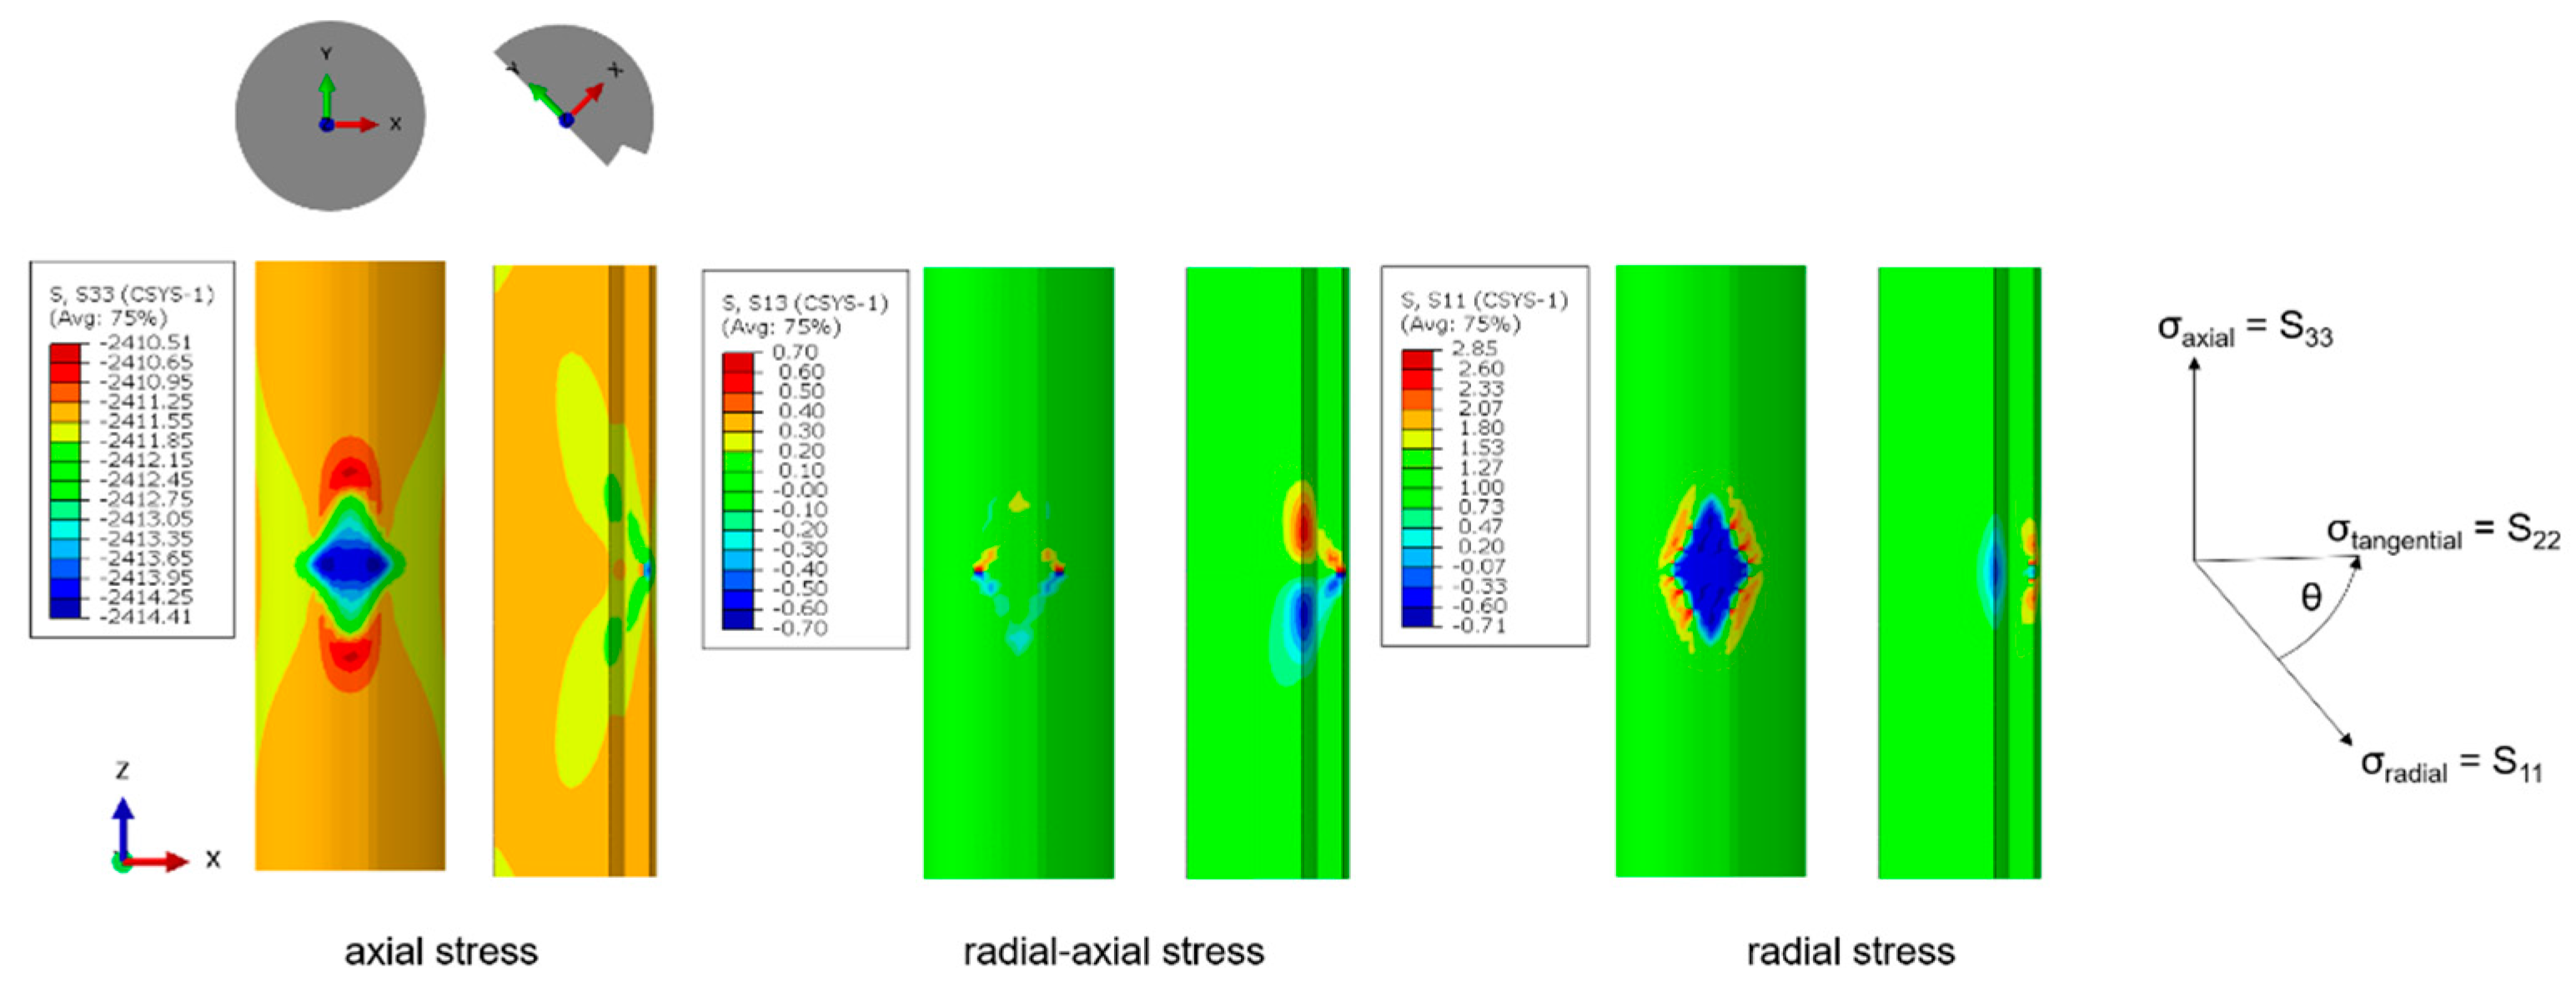
3.2. FE Simulation of the Stress Distribution in the Partially Debonded Fiber−Matrix Interface and the C-Fiber

With the help of the FE model, described above in Section 2.5, characteristic changes of the stress distribution in the fiber can be observed as consequences of the localized debonding of the fiber−matrix interface. In the present case of a cluster defect in the fiber−matrix interface, this stress distribution is presented in Figure 9 by means of a cylindrical coordinate system in a frontal and a cut view from the edge of the defect to the center line. The cut view was chosen to better visualize the stress distribution in the C-fiber. The left part of Figure 9 presents the axial stress component S33, where a stress distribution with tensional and compressive stress fields relative to the overall compressive load on the C-fiber can be observed. In the middle of the debonded area, a compressive stress concentration was present, whereas in the upper and lower boundary of the debonded area, tensional stress appeared. The difference between relative compression and tension however was within single MPa values.
The radial stress component S11 is depicted in the left part of Figure 9, showing a compression field in the middle of the debonded area, where no stress was transmitted to the matrix. Regarding the front view, singularities at the edge of the debonding can be observed, resulting in a peaked pattern of positive radial stresses. Nevertheless, the affected area of these singularities was small and only appearing at these edges, not influencing internal or superficial fiber stresses away from the singularities. In the cut view further positive stress concentrations can be observed leading to a radial expansion of the fiber.
In the middle section of Figure 9, the combined shear stress component S31 in radial-axial direction is shown. Distinctive maxima and minima can be seen, especially in the cut view. This distribution of S31 might explain the inclination angle of the fracture plane of ±45° relative to the surface of the C-fiber. By having two fracture planes, a separation of the C-fiber would lead to the fracture pattern as it can be observed in the X-ray projection in Figure 4. Accounting for the overall debonding stress, being present in the Broutman test specimen under compressive load would amplify the effects of the observed distributions of the stress components S33, S11 and S31, especially at the edges of the debonded area.

3.3. Discussion

The results shown in Section 3.1 revealed a regular fracture pattern, which raises some questions. For example, how the small fracture pieces between the fragment ends occur. The experimentally observed fracture pattern can be interpreted in several ways. The small fracture pieces between fragment ends could be an effect of secondary failure, initiated by the fragment ends remaining in contact during the test, due to the increasing compressive force and slip and crush against each other. This would imply that during fragmentation the normal stress at the fragment ends is nonzero. Several researchers have already assumed the slippage of fragment ends [24,25,35]. However, comparison of the different systems (toughened and non-toughened) shown in Figure 7 and Figure 8 shows that the small fracture pieces in the fracture section are probably not a secondary failure effect. Rather, they appear to be part of the fracture pattern that occurs during compressive loading. The strength and the time period during which the fragment ends remain in contact and compress the small fracture pieces (or pushed them into the matrix) after C-fiber failure seems to have a correlation with the fiber−matrix interaction. In [24,25] a correlation between the inclination angle of the fracture plane and the resulting stress distribution was assumed, while [25] additionally observed that slippage of the broken fragment ends was caused by the high load bearing of the matrix during compression which resulted in yield phenomena which prevented matrix failure. Both assumed a nonzero normal stress at the fragment ends due to stress discontinuity caused by fiber fracture. The visible fracture pattern with the small fracture pieces in between assume a fracture plane not perpendicular to the fiber plane but influenced by the fiber fracture itself. The Broutman test itself can only be analyzed by determining the inclination angle of the fracture plane in the analytical modelling of interphase failure. The C-fiber failed in most visible fracture locations brittle, with an inclination angle of the fracture plane of ±45° but also fiber slipping could be observed. The visible fiber slippage could be attributed to transverse tensile stresses in the interphase according to [25]. Consequently, measuring the inclination angle of the fracture plane is of great importance for evaluation of the resulting stress distributions.
The inclination angle of the fracture plane was measured as ±45° at almost every fracture point in our investigation, this indicated a brittle C-fiber failure due to ductile shear failure under compression as proposed in [36].
By comparing the results of high-resolution XRM with polarized microscopy images a non-uniform delamination behavior between C-fiber and matrix can be supposed. This means that stress discontinuities along the C-fiber have to be considered, caused by a sequence of bonding and nonbonding regions, as stated in [32]. Observing C-fiber failure due to compression in several planes is an indication of a very good adhesion between the substituents [36,37]. Hence, for the considered specimens, a good adhesion can be assumed. Many authors conflict with each other with the expected stress distribution during the Broutman test and no consistent description could be found so far. In [24] it was shown that two different failure mechanisms compete during the Broutman test, fiber failure and fiber−matrix debonding. Fiber−matrix structures with a good interfacial adhesion always showed fiber failure due to the compressive stress before debonding occurred. They assumed that the shear properties of the interphase were determined during Broutman test.
Using high-resolution XRM can help as a post mortem tool to prevent misinterpretation of measured data. Using the Broutman equation (Equation (1) in S1), the calculated normal stress is 6.8 MPa (force at first detected failure 5000 N) for the toughened and 8.7 MPa (force at first failure detected 6500 N) for the non-toughened system. In [26] the macro-mechanical interphase behavior for the same fiber−matrix systems were already characterized in detail. From qualitative observation of SEM images it was deduced that toughening the polymeric matrix system resulted in better fiber−matrix adhesion. These qualitative findings are contradictory to the interfacial strength quantitatively determined by the Broutman test. This might indicate that the calculated debonding stress based on test data results misleads the understanding of the experimental results if no further analysis of the system is performed. Reasons for this ambiguity are manifold, such as geometric inaccuracies leading to different stress states. An alternative explanation would be that the toughened matrix system failure is more ductile, with a larger overall deformation than the non-toughened system. This causes an increase in the overall stress stored elastically in the system, which is then suddenly released leading to more damage to the C-fiber, which can be seen in the XRM images. However, since the force of the first failure, determined by AE, was higher in the non-toughened system, this could indicate that failure occurs gradually, whereas in the toughened system global failure (both cohesive and adhesive) occurs more or less simultaneously, starting from the center. These would correlate with the results shown in [25].
C-fiber buckling and C-fiber crushing are all time-dependent processes due to instabilities in the system. The failure mechanism analysis in our research does not depend on a dynamic process as our purely static FE simulation is well in line with the experimentally observed fracture pattern. The occurrence of a localized delamination alone leads to the observed fracture pattern.

4. Conclusions

Careful analysis of simple X-ray projections, together with high-resolution 3D XRM images of a Broutman specimen after mechanical loading allow the accurate description of important details of the observed fracture patterns of the single C-fiber. It was possible to assess the fragment length, the angle of inclination of the fracture plane and even the size of small fracture pieces between the broken fragments.
In comparison to classical light microscopy, the analysis via XRM is not limited by resolution depth and the optical transparency of the specimen. However, in the case of transparent specimens, polarized light microscopy provides additional information regarding the location and size of the debonded area of the interphase. To the authors’ best knowledge, it is the first time a single carbon fiber within a matrix has been visualized via XRM in such a detailed manner.
With the combination of the presented techniques with regard to the single C-fiber failure mechanisms, a more profound interpretation of the failure process was possible, without assuming dynamic effects like a back-slippage of the C-fiber ends or other time-dependent failure mechanisms.
The C-fiber exhibited shear failure with an almost constant ±45° inclination angle of the fracture plane. The comparison between a toughened and a non-toughened matrix system indicated how the compression-introduced failure mechanism was influenced by the properties of the matrix system and the resulting fiber−matrix interaction. The degree of C-fiber fracture in the matrix gathered visually in the toughened system was higher than in the non-toughened. This could be an indication that the compression stress is stored in the matrix and suddenly released to the C-fiber, which leads to a higher degree of fracture in the toughened system.
Using a simple FE model, the stress distribution, prior to debonding, within the C-fiber was approximated. The FE simulation gave a first hint that a small debonded area in the fiber−matrix interface could be sufficient to introduce a stress distribution, which resulted in fiber failure with the observed fracture pattern. However, the limitation of the ROI during XRM analysis, the duration of the single exposure, and the phase contrast that provided further information about the interface are open issues that need further work. The combination of high-resolution 3D X-ray analysis of a micromechanical test, such as the Broutman test, together with a more refined simulation model shows a very promising approach to obtain a deeper understanding of the failure relevant processes in the interface and the fiber−matrix interphase itself.

5. Outlook

The results presented serve as a starting point for many further investigations. The FE model can be modified to investigate different debonding and failure mechanisms with more material-specific values and with additional improvements. The effect of a distributed debonding, i.e., two debonding locations on opposite sides on the C-fiber, were not considered here, as well as the effect of plasticity of the matrix or a cohesive zone modelling of the interphase instead of the simple representation of an infinitesimal interface.
In future activities, the variation of fiber or matrix properties or even the resulting interphase could be experimentally assessed, e.g., with high-resolution XRM. Therefore, different C-fiber types should be tested and the resulting failure patterns should be compared.
Most ambitious would be a redesign of the Broutman test specimen tail-shape to enable real 4D investigations of the interphase, by in situ testing in the XRM. With that, a better understanding of this micromechanical test could be achieved.

Supplementary Materials

The following are available online at https://0-www-mdpi-com.brum.beds.ac.uk/article/10.3390/jcs5050121/s1, S1: Micromechanical description of stress state according to Broutman, S2: Failure mechanism during Broutman test analyzed with additional methods: Figure S1: Post mortem polarized light microscopy images of the same Broutman test specimens (non-toughened) taken after different loading steps (4000 N and 6000 N). Figure S2: The cumulative number of Events of class 1, which describes a class of AE events which can be correlated (frequency dependent) with the fiber and the compression force applied in N for the toughened system, the non-toughened and two different reference systems. The further results of the tested systems and the test itself will be published elsewhere. S3: Supporting information about the Broutman test configurations and the test set-up; S4: Comparision between toughened and non-toughened matrix systems via polarized light microscopy: Figure S3: Post mortem polarized light microscopy image of the toughened and the non-toughened matrix system, indicating no visible difference in the degree of fracture.

Author Contributions

Conceptualization, J.V., A.K., T.R. and M.G.; methodology, J.V., A.K., T.R. and M.G.; formal analysis, J.V., T.R. and M.G.; investigation, J.V. and A.K.; data curation, T.R.; writing—original draft preparation, J.V., A.K., T.R. and M.G.; writing—review and editing, J.V. and M.G.; visualization, J.V. and T.R.; supervision, M.G.; project administration, M.G.; funding acquisition, M.G. All authors have read and agreed to the published version of the manuscript.

Funding

The authors gratefully acknowledge funding from the German Research Association (DFG), grant number: GU 1556/2-1.

Data Availability Statement

Acknowledgments

The support of Benjamin Kelkel who provided AE measurements during micromechanical testing and Christian Becker is highly appreciated.

Conflicts of Interest

The authors declare no conflict of interest. The funders had no role in the design of the study; in the collection, analyses, or interpretation of data; in the writing of the manuscript, or in the decision to publish the results.

References

  1. Drzal, L.T.; Madhukar, M. Fibre-matrix adhesion and its relationship to composite mechanical properties. J. Mater. Sci. 1993, 28, 569–610. [Google Scholar] [CrossRef]
  2. Jesson, D.A.; Watts, J.F. The interface and interphase in polymer matrix composites: Effect on mechanical properties and methods for identification. Polym. Rev. 2012, 52, 321–354. [Google Scholar] [CrossRef]
  3. Pilato, L.A.; Michno, M.J. Advanced Composite Materials; Springer Science and Business Media LLC: Berlin/Heidelberg, Germany, 1994. [Google Scholar]
  4. Broutman, L.J. Glass-resin joint strength and their effect on failure mechanisms in reinforced plastics. Polym. Eng. Sci. 1966, 6, 263–272. [Google Scholar] [CrossRef]
  5. Remaoun, D.; Boutaous, A. Thermomechanical stress in the evolution of shear of fiber-matrix interface composite material. Mater. Sci. Appl. 2011, 2, 399–403. [Google Scholar] [CrossRef] [Green Version]
  6. Riaño, L.; Chailan, J.-F.; Joliff, Y. Evolution of effective mechanical and interphase properties during natural ageing of glass-fibre/epoxy composites using micromechanical approach. Compos. Struct. 2021, 258, 113399. [Google Scholar] [CrossRef]
  7. Zhang, X.; Fan, X.; Yan, C.; Li, H.; Zhu, Y.; Li, X.; Yu, L. Interfacial microstructure and properties of carbon fiber composites modified with graphene oxide. ACS Appl. Mater. Interfaces 2012, 4, 1543–1552. [Google Scholar] [CrossRef]
  8. Mäder, E.; Gao, S.-L.; Plonka, R. Enhancing the properties of composites by controlling their interphase parameters. Adv. Eng. Mater. 2004, 6, 147–150. [Google Scholar] [CrossRef]
  9. Sharma, M.; Gao, S.; Mäder, E.; Sharma, H.; Wei, L.Y.; Bijwe, J. Carbon fiber surfaces and composite interphases. Compos. Sci. Technol. 2014, 102, 35–50. [Google Scholar] [CrossRef]
  10. Chen, L.; Jin, H.; Xu, Z.; Li, J.; Guo, Q.; Shan, M.; Yang, C.; Wang, Z.; Mai, W.; Cheng, B. Role of a gradient interface layer in interfacial enhancement of carbon fiber/epoxy hierarchical composites. J. Mater. Sci. 2015, 50, 112–121. [Google Scholar] [CrossRef]
  11. Nishikawa, M.; Okabe, T.; Hemmi, K.; Takeda, N. Micromechanical modeling of the microbond test to quantify the interfacial properties of fiber-reinforced composites. Int. J. Solids Struct. 2008, 45, 4098–4113. [Google Scholar] [CrossRef] [Green Version]
  12. Pisanova, E.; Zhandarov, S.; Mader, E. How can adhesion be determined from micromechanical tests? Compos. Part A Appl. Sci. Manuf. 2001, 32, 425–434. [Google Scholar] [CrossRef]
  13. Lodeiro, M.J.; Maudgal, S.; McCartney, L.N.; Morrell, R.; Roebuck, B. Critical Review of Interface Testing Methods for Composites; NPL: Teddington, UK, 1998. [Google Scholar]
  14. Pitkethly, M.; Favre, J.; Gaur, U.; Jakubowski, J.; Mudrich, S.; Caldwell, D.; Drzal, L.; Nardin, M.; Wagner, H.; Di Landro, L.; et al. A round-robin programme on interfacial test methods. Compos. Sci. Technol. 1993, 48, 205–214. [Google Scholar] [CrossRef]
  15. Garcea, S.; Wang, Y.; Withers, P. X-ray computed tomography of polymer composites. Compos. Sci. Technol. 2018, 156, 305–319. [Google Scholar] [CrossRef]
  16. Seghini, M.; Touchard, F.; Sarasini, F.; Chocinski-Arnault, L.; Mellier, D.; Tirillò, J. Interfacial adhesion assessment in flax/epoxy and in flax/vinylester composites by single yarn fragmentation test: Correlation with micro-CT analysis. Compos. Part A Appl. Sci. Manuf. 2018, 113, 66–75. [Google Scholar] [CrossRef]
  17. Schuller, T.; Beckert, W.; Lauke, B.; Ageorges, C.; Friedrich, K. Single fibre transverse debonding: Stress analysis of the Broutman test. Compos. Part A Appl. Sci. Manuf. 2000, 31, 661–670. [Google Scholar] [CrossRef]
  18. Yu, S.; Hwang, Y.H.; Hwang, J.Y.; Hong, S.H. Analytical study on the 3D-printed structure and mechanical properties of basalt fiber-reinforced PLA composites using X-ray microscopy. Compos. Sci. Technol. 2019, 175, 18–27. [Google Scholar] [CrossRef]
  19. Wirjadi, O.; Godehardt, M.; Schladitz, K.; Wagner, B.; Rack, A.; Gurka, M.; Nissle, S.; Noll, A. Characterization of multilayer structures in fiber reinforced polymer employing synchrotron and laboratory X-ray CT. Int. J. Mater. Res. 2014, 105, 645–654. [Google Scholar] [CrossRef] [Green Version]
  20. Lin, G.; Geubelle, P.; Sottos, N. Simulation of fiber debonding with friction in a model composite pushout test. Int. J. Solids Struct. 2001, 38, 8547–8562. [Google Scholar] [CrossRef]
  21. Ojos, D.E.-D.L.; Ghisleni, R.; Battisti, A.; Mohanty, G.; Michler, J.; Sort, J.; Brunner, A. Understanding the mechanical behavior of fiber/matrix interfaces during push-in tests by means of finite element simulations and a cohesive zone model. Comput. Mater. Sci. 2016, 117, 330–337. [Google Scholar] [CrossRef] [Green Version]
  22. Jager, J.; Sause, M.; Burkert, F.; Moosburger-Will, J.; Greisel, M.; Horn, S. Influence of plastic deformation on single-fiber push-out tests of carbon fiber reinforced epoxy resin. Compos. Part A Appl. Sci. Manuf. 2015, 71, 157–167. [Google Scholar] [CrossRef]
  23. Singh, D.K.; Vaidya, A.; Thomas, V.; Theodore, M.; Kore, S.; Vaidya, U. Finite element modeling of the fiber-matrix interface in polymer composites. J. Compos. Sci. 2020, 4, 58. [Google Scholar] [CrossRef]
  24. Ageorges, C.; Friedrich, K.; Schuller, T.; Lauke, B. Single-fibre Broutman test: Fibre–matrix interface transverse debonding. Compos. Part A Appl. Sci. Manuf. 1999, 30, 1423–1434. [Google Scholar] [CrossRef]
  25. Park, J.-M.; Kim, J.-W.; Yoon, D.-J. Interfacial evaluation and microfailure mechanisms of single carbon fiber/bismaleimide (BMI) composites by tensile and compressive fragmentation tests and acoustic emission. Compos. Sci. Technol. 2002, 62, 743–756. [Google Scholar] [CrossRef]
  26. Klingler, A.; Bajpai, A.; Wetzel, B. The effect of block copolymer and core-shell rubber hybrid toughening on morphology and fracture of epoxy-based fibre reinforced composites. Eng. Fract. Mech. 2018, 203, 81–101. [Google Scholar] [CrossRef]
  27. HUNTSMAN. Aradur 917 CH Safety Data Sheet; HUNTSMAN: Woodlands, TX, USA, 2016. [Google Scholar]
  28. Kaneka. Kane Ace MX553 Safety Data Sheet; Kaneka: Tokyo, Japan, 2017. [Google Scholar]
  29. HUNTSMAN. Accelerator DY 070 Safety Data Sheet; HUNTSMAN: Woodlands, TX, USA, 2012. [Google Scholar]
  30. HEXCEL. HexForce G1157 D1300, Data Sheet; HEXCEL: Stamford, CT, USA, 2017. [Google Scholar]
  31. Sika. Deutschland GmbH Biresin CR144, Data Sheet; Sika: Baar, Switzerland, 2017. [Google Scholar]
  32. Schürmann, H. Konstruieren mit Faser-Kunststoff-Verbunden; Metzler, J.B., Ed.; Springer: Berlin/Heidelberg, Germany, 2005. [Google Scholar]
  33. 22nd Symposium on Composites. Available online: https://www.scientific.net/book/22nd-symposium-on-composites/978-3-0357-3453-9 (accessed on 29 March 2021).
  34. Scott, A.; Mavrogordato, M.; Wright, P.; Sinclair, I.; Spearing, S. In situ fibre fracture measurement in carbon–epoxy laminates using high resolution computed tomography. Compos. Sci. Technol. 2011, 71, 1471–1477. [Google Scholar] [CrossRef] [Green Version]
  35. Wood, J.R.; Wagner, H.D.; Marom, G. A Model for Compressive Fragmentation. Adv. Compos. Lett. 1994, 3, 096369359400300403. [Google Scholar] [CrossRef] [Green Version]
  36. Peebles, L.H. Carbon Fibers: Formation, Structure, and Properties; CRC Press: Boca Raton, FL, USA, 2018; ISBN 978-1-351-08732-2. [Google Scholar]
  37. Drzal, L.T. The Interphase in Epoxy Composites. In Proceedings of the Epoxy Resins and Composites II; Dušek, K., Ed.; Springer: Berlin/Heidelberg, Germany, 1986; pp. 1–32. [Google Scholar]
Figure 1. Schematic illustration of the Broutman test specimen geometry (grey), the prepared specimen geometry for X-ray scanning (red) (a) front and (b) side view. Visualization of the operating force, visualization of the expected resulting failure mechanism.
Jcs 05 00121 g001
Figure 2. FE model for investigation of debonding on internal fiber stresses, setup with boundary conditions (left), top view with dimensions of the matrix (top right) and surrounded C-fiber with depicted mesh and fiber diameter (bottom right).
Jcs 05 00121 g002
Figure 3. Depiction of the investigated debonding scenario of a cluster defect in the fiber−matrix interface with shown center section of 2 µm (only the C-fiber is shown).
Jcs 05 00121 g003
Figure 4. Post mortem X-ray projections of two Broutman test specimens taken under identical settings: (a) nonloaded and (b) preloaded. The C-fiber is clearly visible in the toughened polymeric matrix, additionally the in-line phase contrast artefacts are visible in both projections as a distinct black line at both sides of the fiber. A, B, C, D mark the locations of fiber fracture with two fracture planes each and a small fracture piece in between them. The blue arrows highlight the direction of force applied during tests (compression).
Jcs 05 00121 g004
Figure 5. Example of one 3D location of fiber fracture image in high-resolution, taken by XRM, allowing the measurement of the inclination angle of the fracture planes and the size of the small fracture pieces between single fragments.
Jcs 05 00121 g005
Figure 6. Comparison between visualization of the same preloaded toughened Broutman test specimen using (a) XRM, (b) polarized light microscopy and (c) light microscopy. The measured mean fragment length L for the respective ROI is shown for comparison. The probably debonded areas are marked by the orange arrows.
Jcs 05 00121 g006
Figure 7. Post mortem X-ray projections of four Broutman test specimens taken under identical settings: with (a) toughened matrix and (b) non-toughened matrix. All show the already mentioned phase contrast effect and several locations of fiber fracture with two fracture planes each and a small fracture piece in between them.
Jcs 05 00121 g007
Figure 8. Example of one 3D image in high-resolution of a representative fiber fracture of each tested specimen, (a) with toughened matrix and (b) with non-toughened matrix, taken by XRM, allowing the measurement of the inclination angle of the fracture plane and the size of the small fracture pieces between single fragments.
Jcs 05 00121 g008
Figure 9. Effects of a fiber−matrix cluster debonding on fiber stresses, top view of the shown C-fiber segment; full fiber (left), cut view (right), axial stresses in MPa S33 (top), radial-axial shear stress in MPa S13 (middle) and radial stresses in MPa S11 (bottom).
Jcs 05 00121 g009
Table 1. Material data from the epoxy resin matrix and HTA40 E13 C-fiber, also used for the simplified debonding FE simulation.
Epoxy Resin Matrix
E [MPa]ν [−]
21500.343Toughened
29400.342Data derived from tensile tests according to DEN EN ISO 527
HTA40 E13 C-fiber
E1 [MPa]E2 = E3ν12 = ν13ν23G12 = G23G13
240,000 *28,000 **0.23 **0.3 ***50,000 **28,000 ***
* Datasheet [27,30,31]. ** Literature [32]. *** Assumed.
Table 2. Different settings used for 3D X-ray microscopy analysis.
SettingsConfig. 1Config. 2Config. 3Config. 4Config. 5
Accelerating Voltage [kV]90901607040
Exposure Time [s]38 (n)
9 (l)
203 (n)
5 (l)
10
Objective20x40x4x20x20x
FilterAirAirHE6AirAir
Specimen-detector distance [mm]22, 82923012, 312, 3
Resolution [nm]560281570650650
Number of projections30013001360130013001
Publisher’s Note: MDPI stays neutral with regard to jurisdictional claims in published maps and institutional affiliations.

