
Experimental Design of Solid Particle Wear Behavior of Ni-Based Composite Coatings


1
Department of Mechanical Engineering, ITER, Siksha ‘O’ Anusandhan Deemed to be University, Bhubaneswar 751030, India
2
Department of Chemical Engineering, Indira Gandhi Institute of Technology, Sarang 759146, India
3
CSIR—Institute of Minerals and Materials Technology, Bhubaneswar 751013, India
*
Author to whom correspondence should be addressed.
J. Compos. Sci. 2021, 5(5), 133; https://0-doi-org.brum.beds.ac.uk/10.3390/jcs5050133
Submission received: 8 April 2021
/
Revised: 2 May 2021
/
Accepted: 14 May 2021
/
Published: 17 May 2021
(This article belongs to the Special Issue Metal Composites)
Abstract
:The composition of nickel-based metal matrix NiCrBSi was varied with 5%, 10% and 15% of Al2O3 particles to obtain high wear resistant coatings by means of a high-velocity oxy fuel (HVOF) thermal spraying process. The coating was characterized by optical microscope, scanning electron microscope (SEM) and X-ray diffractometer (XRD). The physical properties of coatings such as porosity, thickness, surface roughness, surface hardness, fracture toughness, bond strength and density were measured and compared. The experimental design of Taguchi L27 orthogonal array was employed to study and compare the effect of parameters such as impingement angle, impact velocity and alumina per cent in the coating on erosion. The coating containing 15 wt.% of Al2O3 and erodent speed of 33 m/s striking at inclination angle of 30° proved to be the best arrangement in preventing volume loss to a minimum of 0.00015 cc due to low-impact energy, high bond strength and high surface hardness. Analysis of variance (ANOVA) supported the assertion that the impact angle (A) of erodent and composition (C) were the factors contributing most to the volumetric loss as indicated by their combined effect A × C leading to the highest combined factor of 7.34. The scanning electron microscopy (SEM) images of the eroded coatings reveal that the mechanisms of erosion were the fracturing of splats, development of craters, micro cutting and ploughing action.
1. Introduction
The thermal spraying method of coating on the surface is one of the methods of reducing material retrogradation process, governed by melting temperature of the coating material; the flame temperature; the gas pressure; the coating material progressive or movement speed rate; the shape of the nozzle employed; the spray distance; the surface preparation of the substrate material etc. [1,2,3,4].The high-velocity oxy fuel (HVOF) procedure involves low expenditure, high flexibility and low coating thickness in the range of a few hundreds of micrometers [5,6,7,8].
In order to improve the wear and corrosion resistance of the coatings, materials like Ni-, Co-, Ti-, and W-based alloys and ceramics are commonly used as coating materials [9,10,11]. Many researchers have reported on the tribological properties of the Ni-based coatings and stated that these coatings improve the wear and corrosion resistance of surfaces [12,13,14,15,16]. In various applications where wear resistance to oxidation or hot corrosion resistance is required, the common practice of NiCrBSi coatings is recommended [16,17]. But their use in industry is limited due to lower hardness as compared to other materials like ceramics and carbides [18]. The resistance property of these coatings is enhanced when they are reinforced with additives such as WC, Al2O3, Cr3C2, Cr2C3, TiC, TiN etc. [18,19,20,21,22,23,24,25,26,27,28].
The studies conducted by Praveen et al. [29] found out that the composite coating of 60wt.%NiCrSiB-40wt.%Al2O3on AISI304 protected the surface at both 30° and 90° impact angles when eroded at 450°C in hot air medium along with alumina erodent particles. However, the research work on wear performance of NiCrBSi and NiCrBSi-WC coatings on mild steel conducted by Rachidi et al. [30] indicated that WC reinforcement did not cause the reduction in wear but improved its hardness. The findings of the studies conducted by Natarajan et al. [31] indicated that there was significant volume and wear loss of coatings when graphite was added. The addition of 12 wt.% nanometric Al2O3 and 12 wt.% micrometric Al2O3 to NiCrBSi coating improved more or less equally its hardness but its mass loss was less in nanometric Al2O3 as compared to micrometric Al2O3 as revealed in the research work conducted by Habib et al. [32].Many researchers have gained a thorough insight into the various coating materials and coating techniques. Magnetron co-sputtering technique was adopted for depositing titanium-tantalum, CuTa/Cu and titanium-chromium composite materials to study the wear, structural and mechanical properties of the coatings [33,34,35].
The Taguchi technique in design of experiments is adopted as a tool by many researchers in order to optimize a process or product. Praveen et.al [36] employed the Taguchi optimization technique to minimize the mass loss of HVOF-sprayed NiCrBSi-Al2O3 coating which resulted in optimum parametric values for oxygen, fuel, powder feed rate and standoff distance as 200lpm, 651 lpm, 28 g/min and 250 mm respectively for the highest wear resistance. Baskaran et.al [37] implemented the Taguchi optimization technique to study the dry sliding wear behavior of 7075 aluminum matrix with 4 and 8 wt.% of TiC particles. They concluded that the combination of 4 wt.% of TiC, 9.81 N load, sliding velocity of 3 m/s and 1500 m sliding distance as the optimal blend of minimum wear. Mahapatra et.al [38] developed a genetic algorithm to generalize the method of finding out the minimum wear at optimal factor settings. Sutar et.al [39] employed the plasma coating process to deposit red mud. They designed the wear experiment using the Taguchi optimization technique and studied the dry sliding and thermal behavior of the coatings. The experimental design of Taguchi L18 orthogonal array was employed to study and compare the effect of Al 6061 composite coatings with parameters like percentage, mesh size, temperature etc. on erosion by Dabral et.al [40]. Many investigators have designed and conducted experiments on coating materials and have identified the optimal parameters that influence the wear behavior of the coatings [41,42,43]. In this present effort, grade SS420 is coated with NiCrBSi-5%Al2O3 (N5A), NiCrBSi-10%Al2O3 (N10A) and NiCrBSi-15%Al2O3 (N15A) coatings by espousing HVOF process. To compare the coatings performance in protecting the substrate from solid particle erosion, wear tests were conducted in an air jet erosion tester after exposing them to Al2O3 particles as erodent. After wear tests, the worn surfaces were analyzed from the images obtained from a scanning electron microscope. The Taguchi experimental design method was adopted to arrive at the optimum parameters by the method of analysis of variance (ANOVA).
2. Materials and Methods
2.1. Coating Material and Substrate
NiCrBSi powder designated as PAC 560FHV and Al2O3 powder with grain size 22/5 microns, designated as MEC-733 were used as coating powders. The nominal chemical composition (wt.%) of NiCrBSi powder was Ni (72), Cr (15), B (3), Si (5) and Al2O3 powder was Al2O3 (99). SS420 used as substrate has nominal chemical composition(wt.%): C (0.599), Cr (14.02), Fe (83.73), Mn (0.585), Mo (0.024), Ni (0.164), V (0.09), Si (0.383). Powder mixtures of commercial NiCrBSi alloy (95 wt.%) and Al2O3 (5 wt.%), NiCrBSi alloy (90 wt.%) and Al2O3(10 wt.%) and NiCrBSi alloy (85 wt.%) and Al2O3 (15 wt.%) were prepared with a Turbularotative mixer, for 3 h at 300 rpm in order to obtain a homogeneous powder.
2.2. Coating Procedure
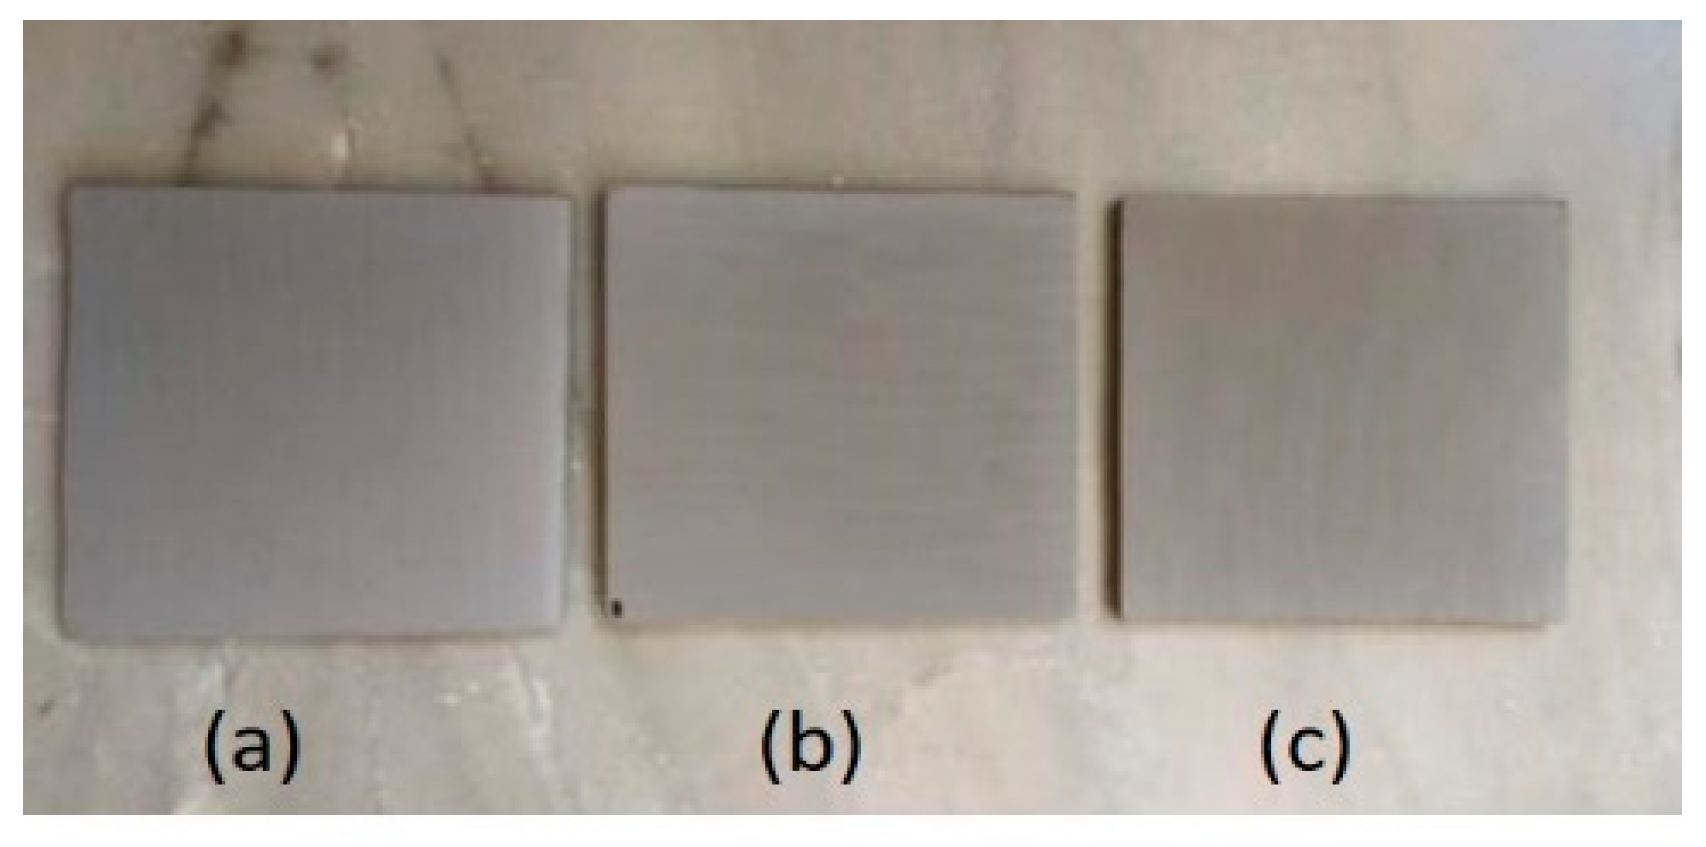
Grade SS 420 samples of size 150 mm × 150 mm × 10 mm were blasted by 20 grit brown aluminum oxide of 96.12% Al2O3 at a blasting angle of 900 and air pressure of 0.2–0.5 MPa in order to get a rough surface, for proper interlocking of specimen with the coating [44]. A distance of 0.13 to 0.15 m was maintained between the blasting nozzle and the substrate. Substrate surface roughness of 6–10 μm was obtained from this procedure. The grit blasted specimen was then cleaned in acetone medium in ultrasonic bath. Table 1 lists the coating parameters of the HVOF coating process. The coating procedure took place in a closed chamber in which the grit blasted substrate was exposed to a gas stream. The gas stream comprised of fuel (LPG) and oxygen. The ignited gas stream was then accelerated through the combustion chamber. The coating material, that is, NiCrBSi- Al2O3 powder was introduced into the chamber along with the gas stream, and struck the substrate surface with high velocity and high temperature. The coating powder was heated up uniformly to a molten or semi-molten state by the hot gas stream. In the molten or semi-molten state when it impacts the substrate it got plastically deformed and flattened to the substrate surface resulting in thin overlapping lamellas of the coating material. Figure 1 depicts the photograph of the coated samples. After the coating of the specimens, these were cut into small samples of size 25 mm × 25 mm × 5 mm to be accommodated in the sample holders in the air jet erosion tester.
2.3. Characteristics of the Coating
The optical microscope (Make: Leica, Model: DM 2700M) was used to obtain the images of the coatings at the cross section. The porosity and thickness of the coatings were determined by analysing the images obtained from the optical microscope. The porosity of the coatings was determined by identifying the voids and pores present in the coated samples and calculating its area. The surface roughness of the coating was measured in a surface roughness measuring apparatus (Taylor and Hobson, Model: S100). The cut-off length and the measuring length were fixed at 0.25mm and 6 mm respectively. Five readings of each coating were taken and the values were recorded to find out the range of Ra value. The indentation technique was used for the determination of the micro hardness value and fracture toughness value of each coating. The micro hardness values of the coatings were measured in a Vicker’s Microhardness tester (Omni-Tech, Model: S. Auto). A load of 300g was applied for a dwell time of 10 s in a diamond indenter at the cross section with ten indents on each coating. The fracture toughness value of the coating was determined at load of 500g with 10 indents on each sample. The fracture toughness values were calculated based on the Evan and Wilshaw model, according to Equation (1) [45]:
where p is the indentation load, 2a is the diagonal length of the Vickers’s indentation pyramid and 2c is the crack length.
Density of the coatings was determined theoretically using rule of mixture according to Equation (2):
where = density of the coating, = density of NiCrBSi, = density of Al2O3, volume of the coating, = volume of NiCrBSi and = volume of Al2O3
The density of the coatings was determined experimentally by peeling the coated samples and then using the Archimedes principle as per Equation (3):
where = density of the coating, = density of water, = weight of coating in air (g), = weight of coating in water (g).
The bond strength of the coating was determined in a pull off adhesion tester (Make: DeFelsko, Model: PosiTest AT-A) where a circular aluminum stud of diameter 10mm was mounted on the coated samples using an epoxy paste [46].
2.4. Erosion Test
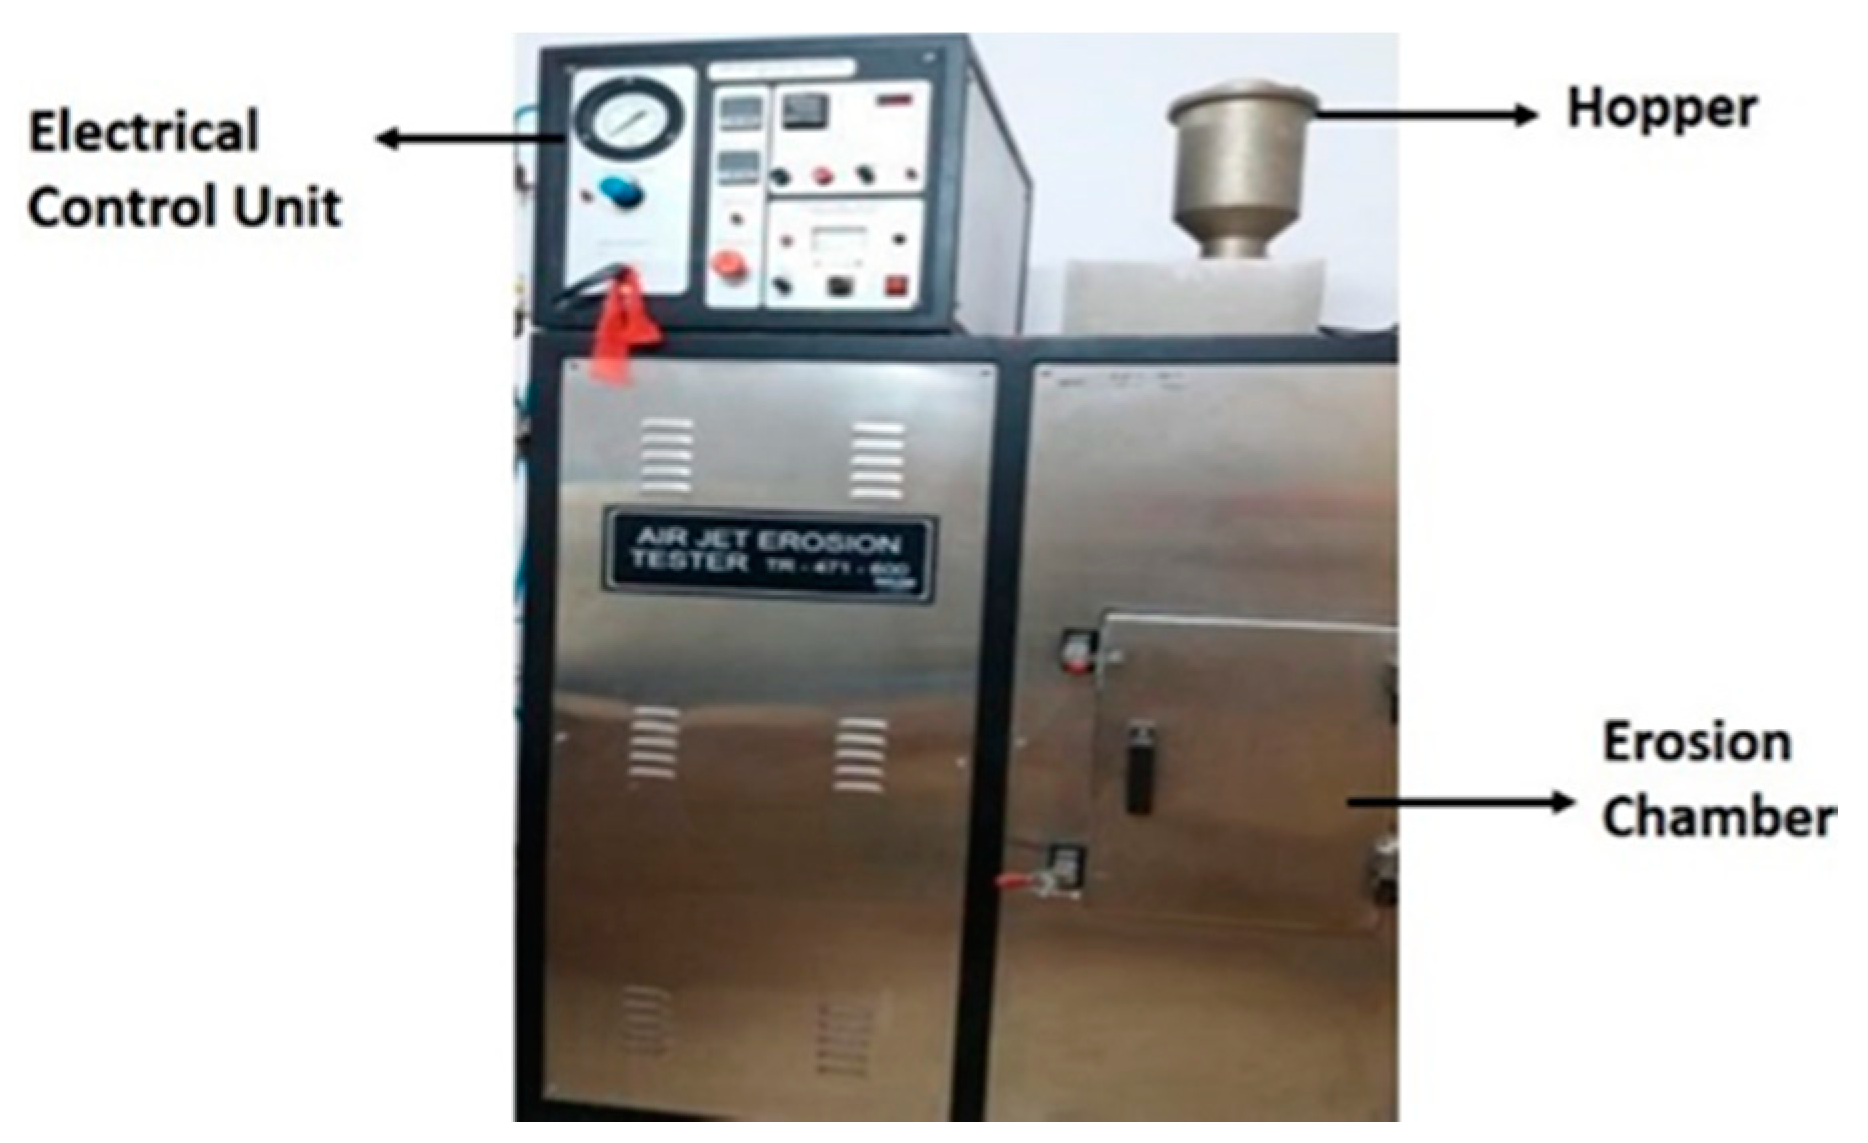
The air jet erosion test was conducted as per the ASTM-G-76 standards using in an air jet erosion tester TR-471-600 as presented in Figure 2. The erosion tester was used for ranking the materials according to their erosion resistance. The erosion procedure involved a small nozzle dispatching a gas stream embedded with silt particles.
Taguchi L27 orthogonal array experimental design was adopted based on the principle of smaller is the better characteristics considering three testing parameters such as impingement angle, impact velocity and composition of the coating under three variation levels (Table 2) pursuance with many investigators. Table 2 contains six columns of which columns 2, 3 and4 indicate the design parameters and the values under columns 5 and 6 are the corresponding volume loss and S/N ratio respectively. The descriptions of which have been presented in results and discussions section. The experiments were designed according to MINITAB-17 considering volume loss in cubic centimetres as response.
The signals to noise ratios were estimated as logarithmic transformation of the loss function according to Equation (4):
where n is the number of observations and y is the observed data for each response.
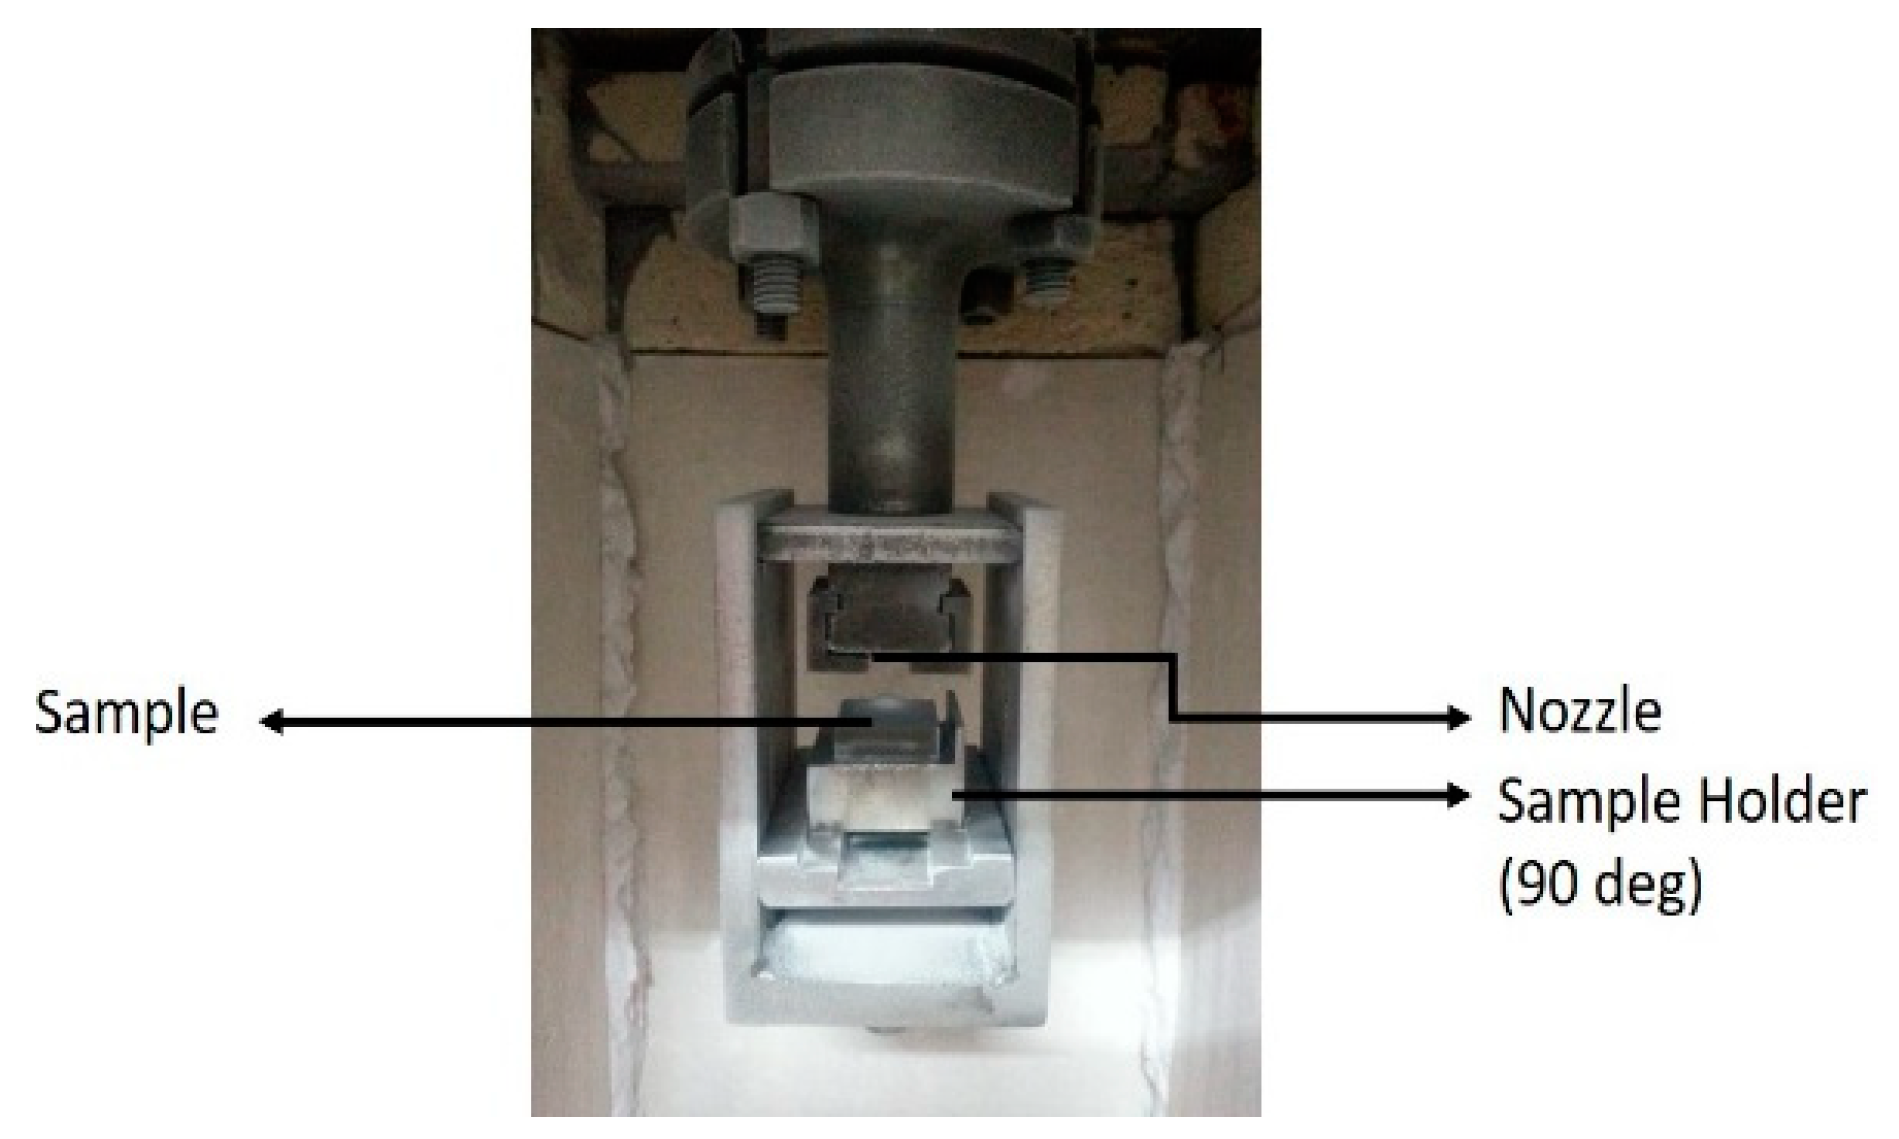
The weighed specimen was placed inside a suitable specimen holder of the erosion chamber (Figure 3) and inserted over nozzle holder bracket. The erodent of size 200 µm was filled into the hopper. A gap of 10mm was maintained between the nozzle tip and specimen. The discharge rate of 10 g/min was maintained with test duration of 10 min using the timer keys. The front door of the test rig was closed and the required air pressure was adjusted with a regulator. The erodent discharge started flowing as soon as the start button was pushed downward. The test was conducted for full duration and the erodent discharge automatically stopped on completion of the time. The specimen was removed by opening the front door and then it was cleaned and weighed. Erosion rate is defined as the ratio of the mass loss of the sample to the total mass of the striking erodent as given in Equation (5) below.
3. Results and Discussions
3.1. Experimental Results of Coating Material
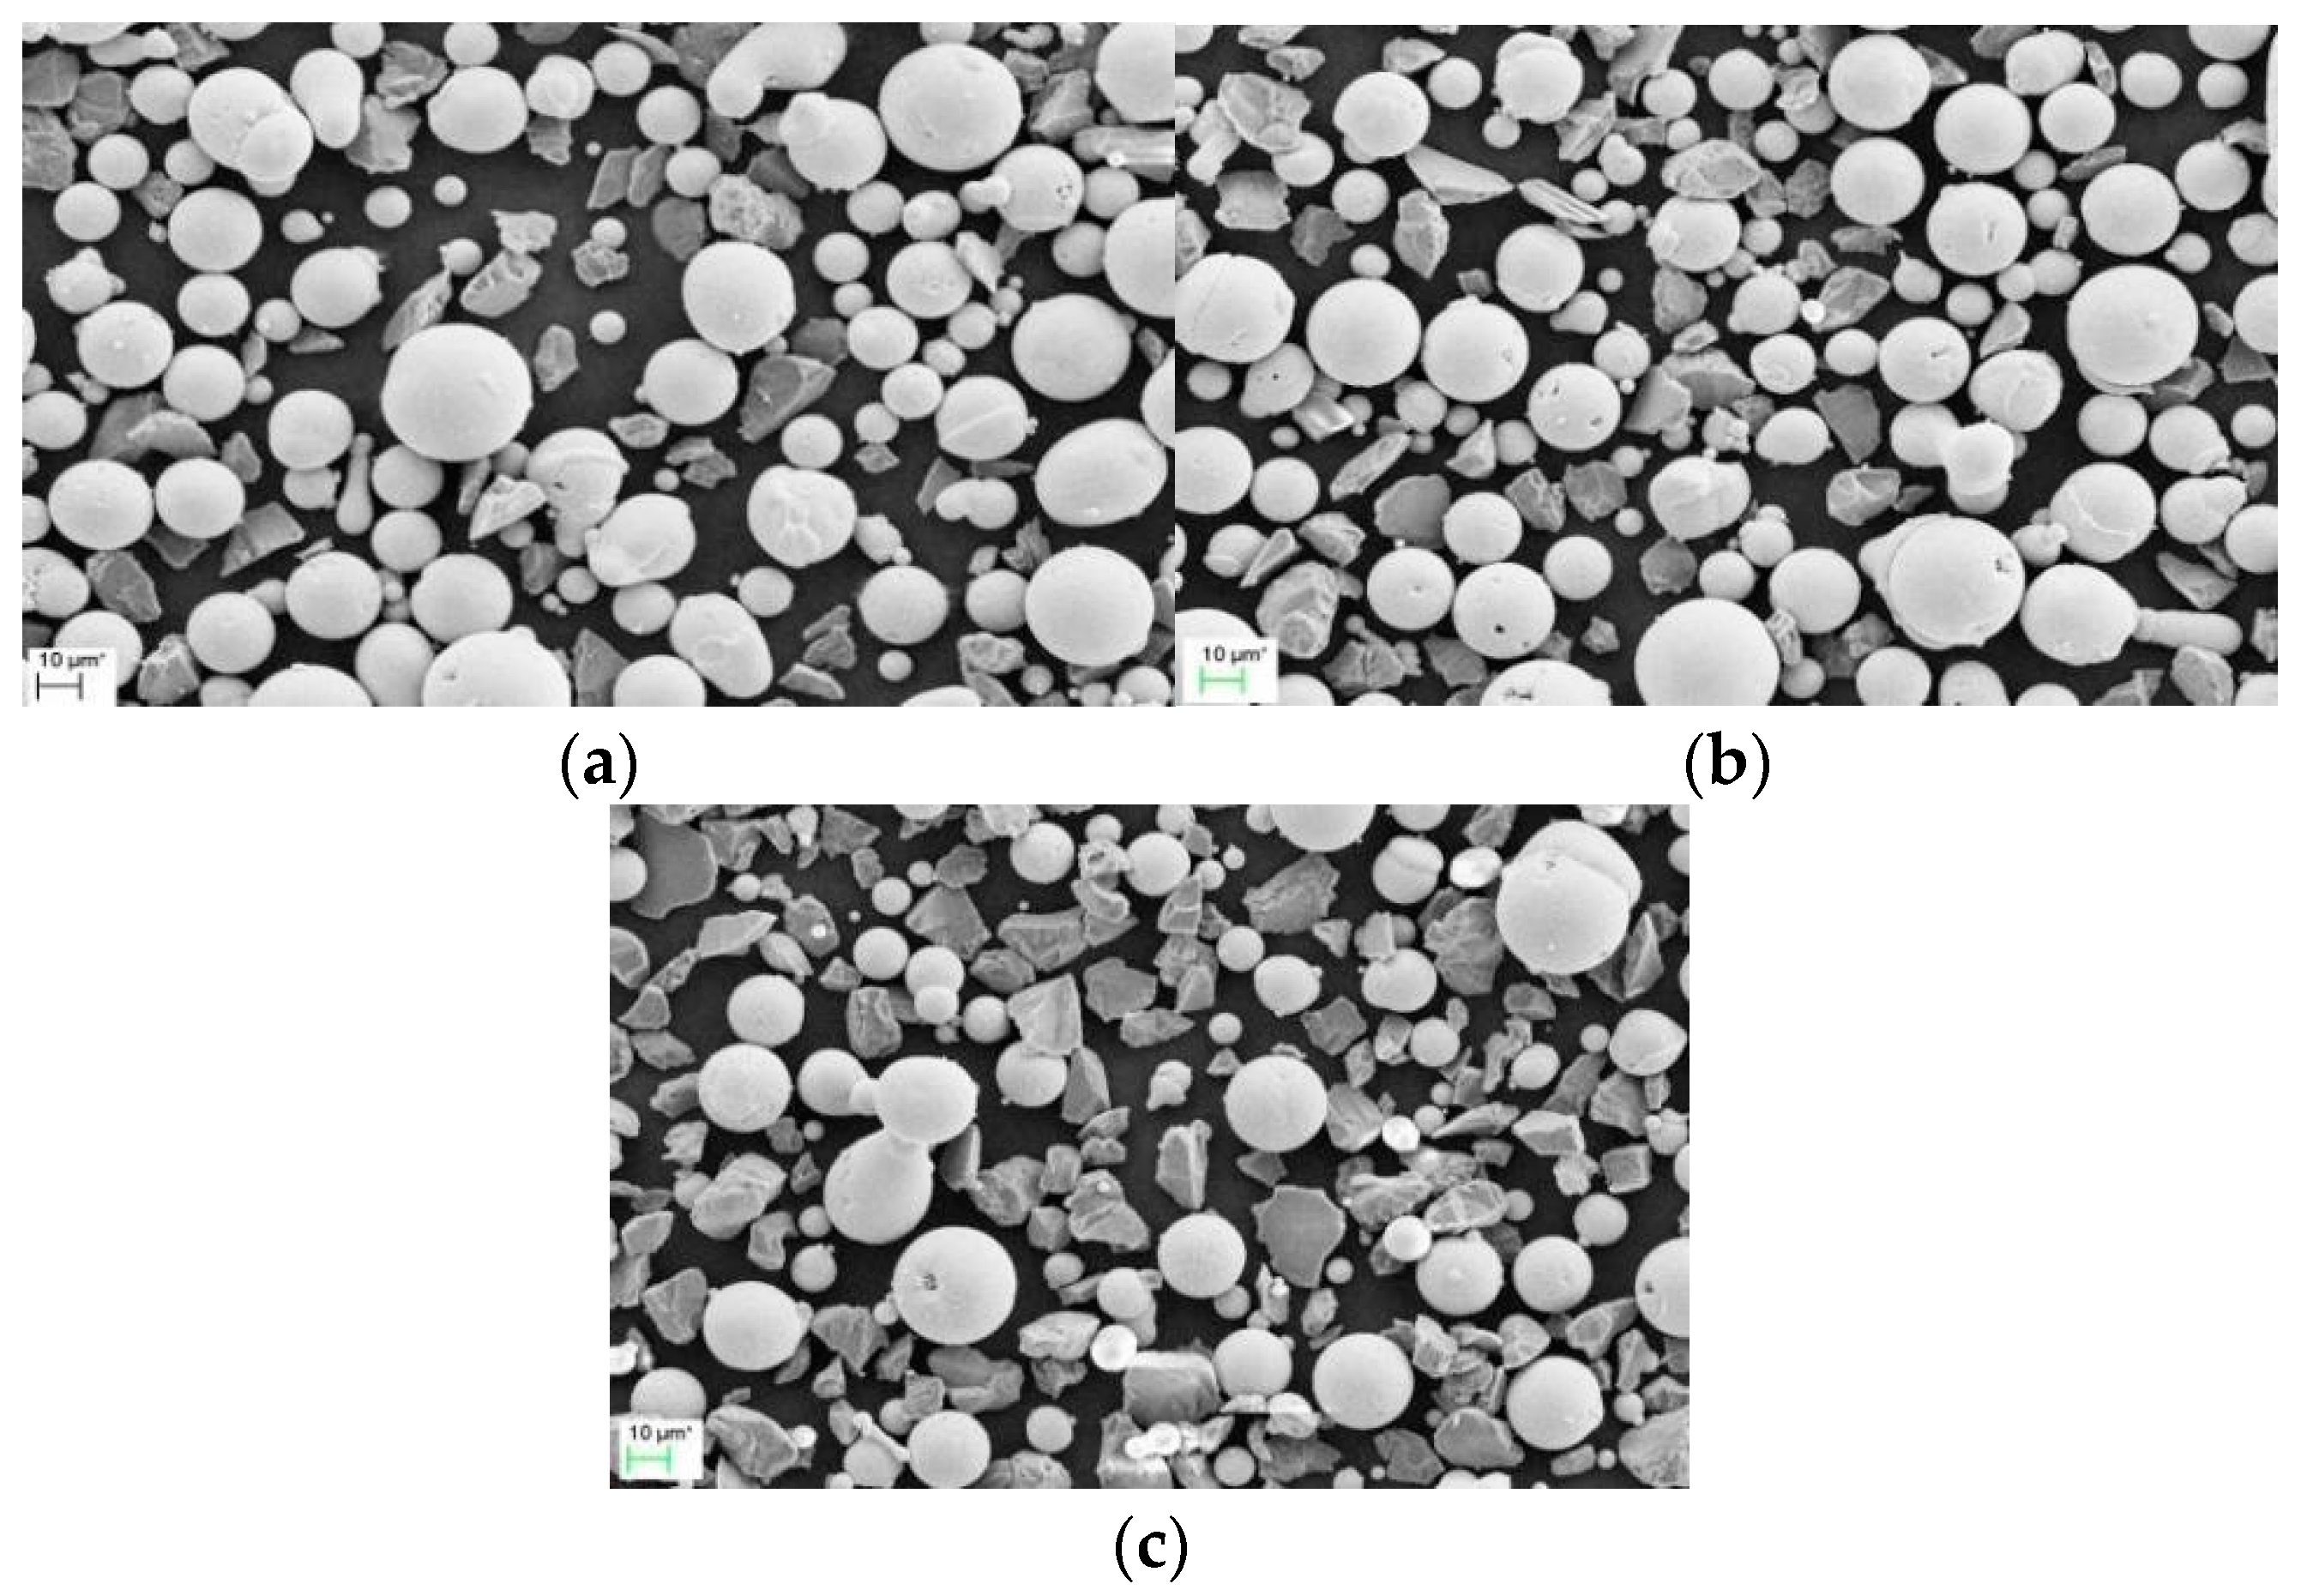
The SEM micrographs of the three coating powders are shown in the Figure 4. The images show spherical shaped NiCrBSi particles and irregular shaped alumina particles.
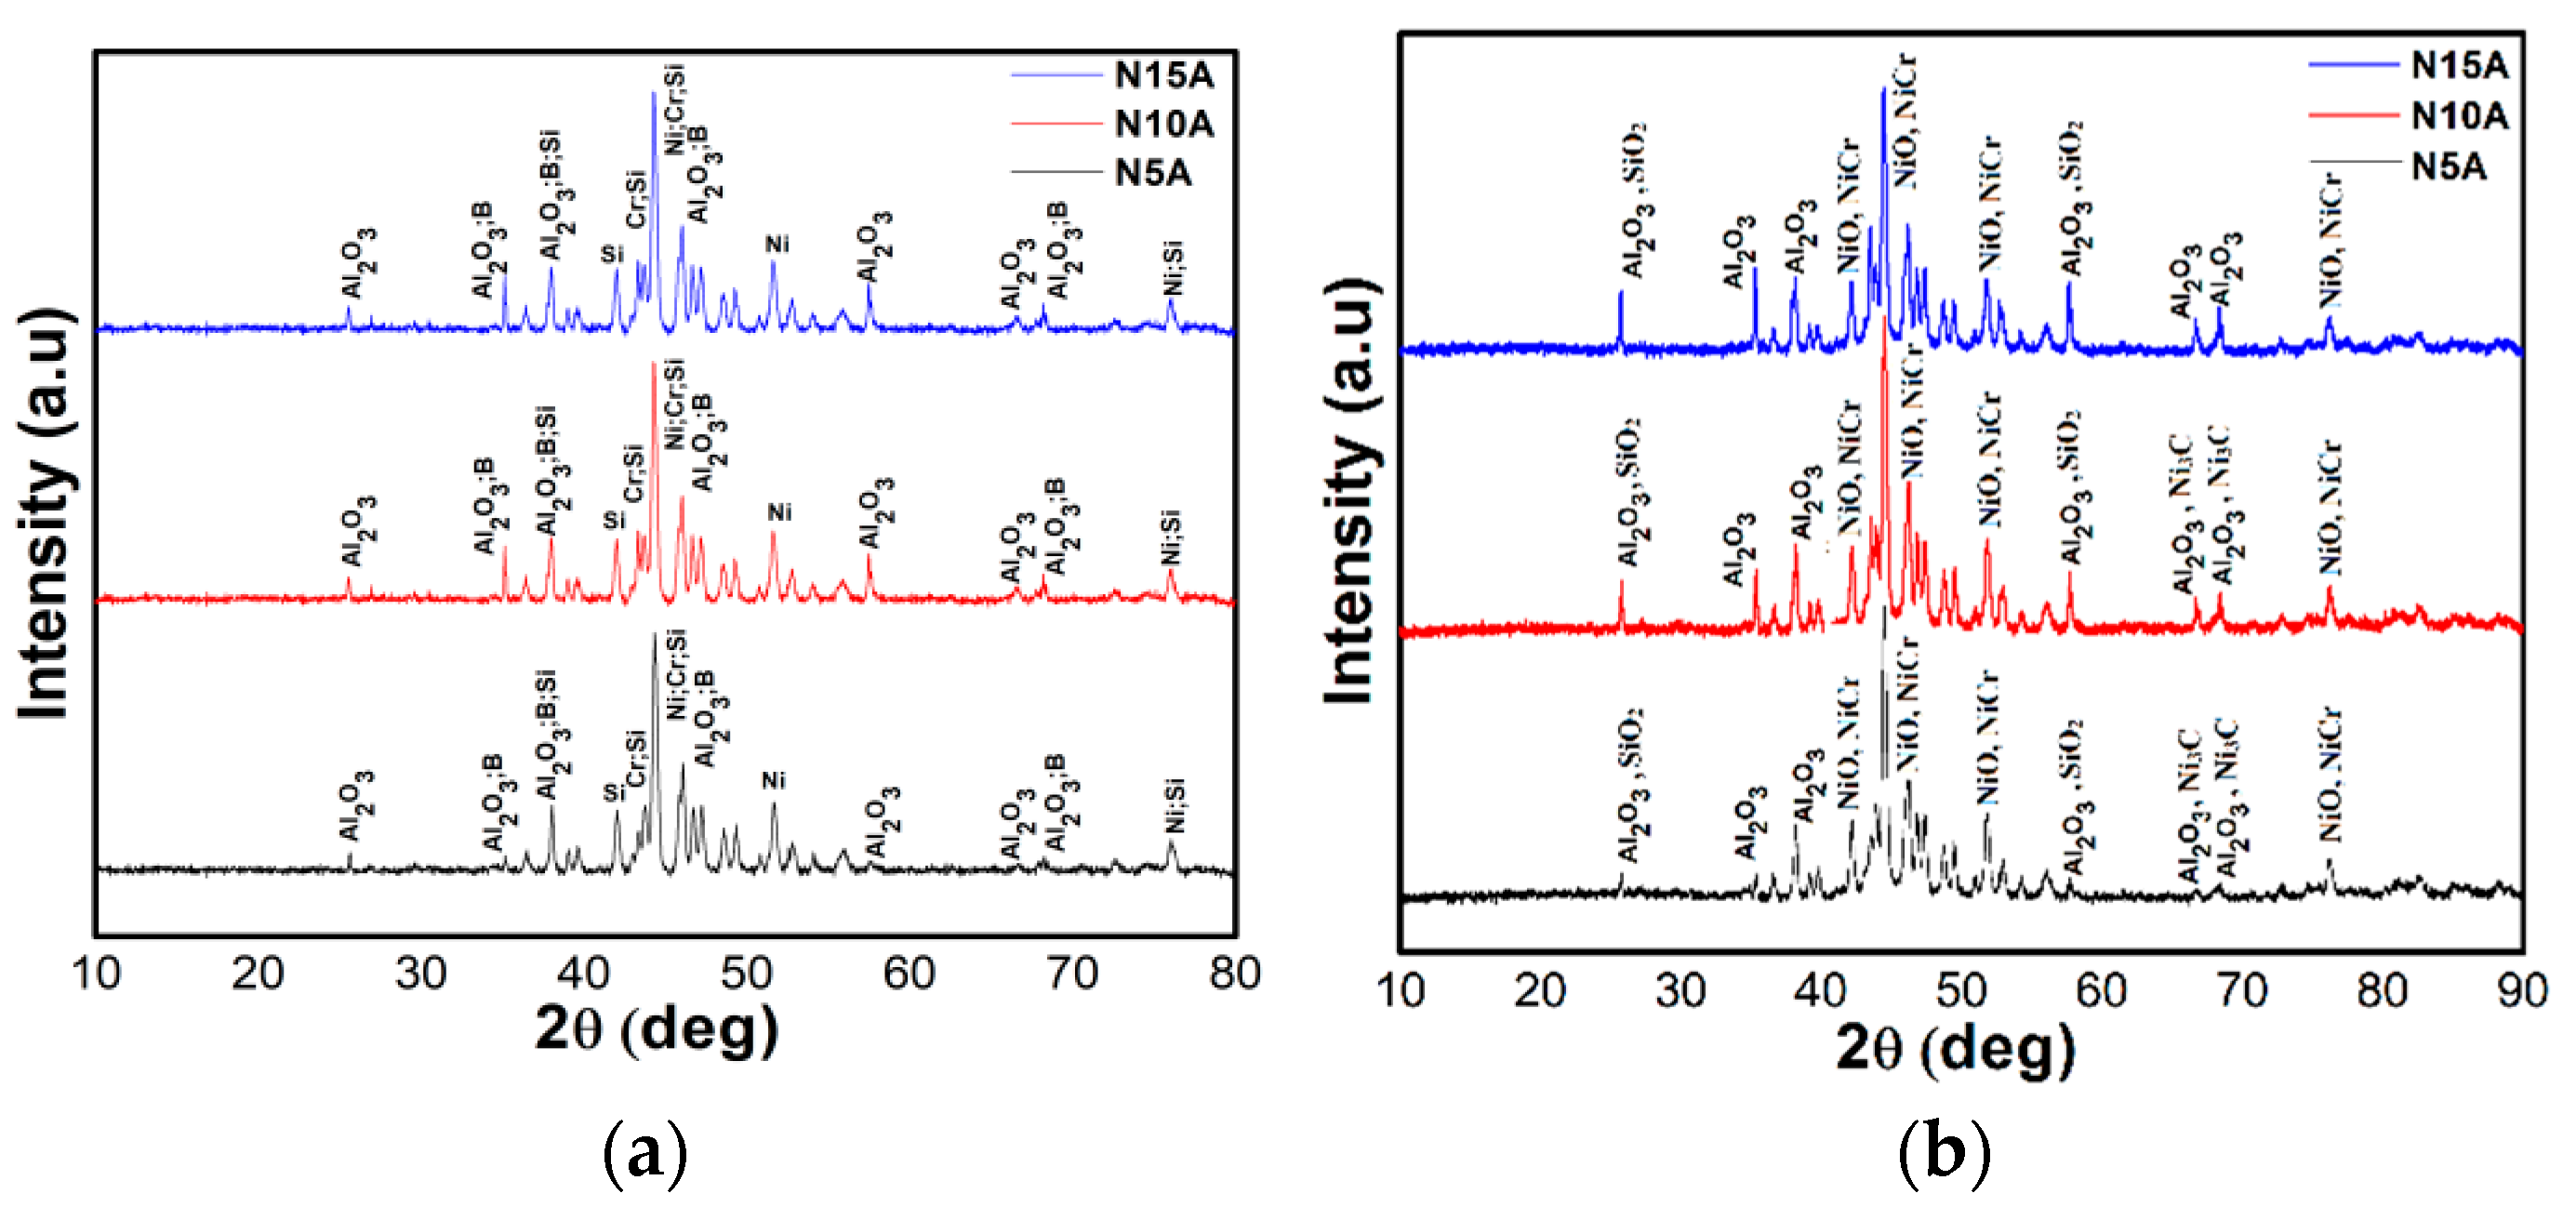
The gamma phase of the nickel and alpha phase of alumina in the coating of raw powder from the X-ray diffraction (XRD) analysis are shown in Figure 5a and the slight modifications in the width and height of the XRD peaks show amorphization during the coating process (Figure 5b). The XRD images of the coatings reveal the rise in the alumina peaks in the coatings as the per cent of alumina in the coatings increases.
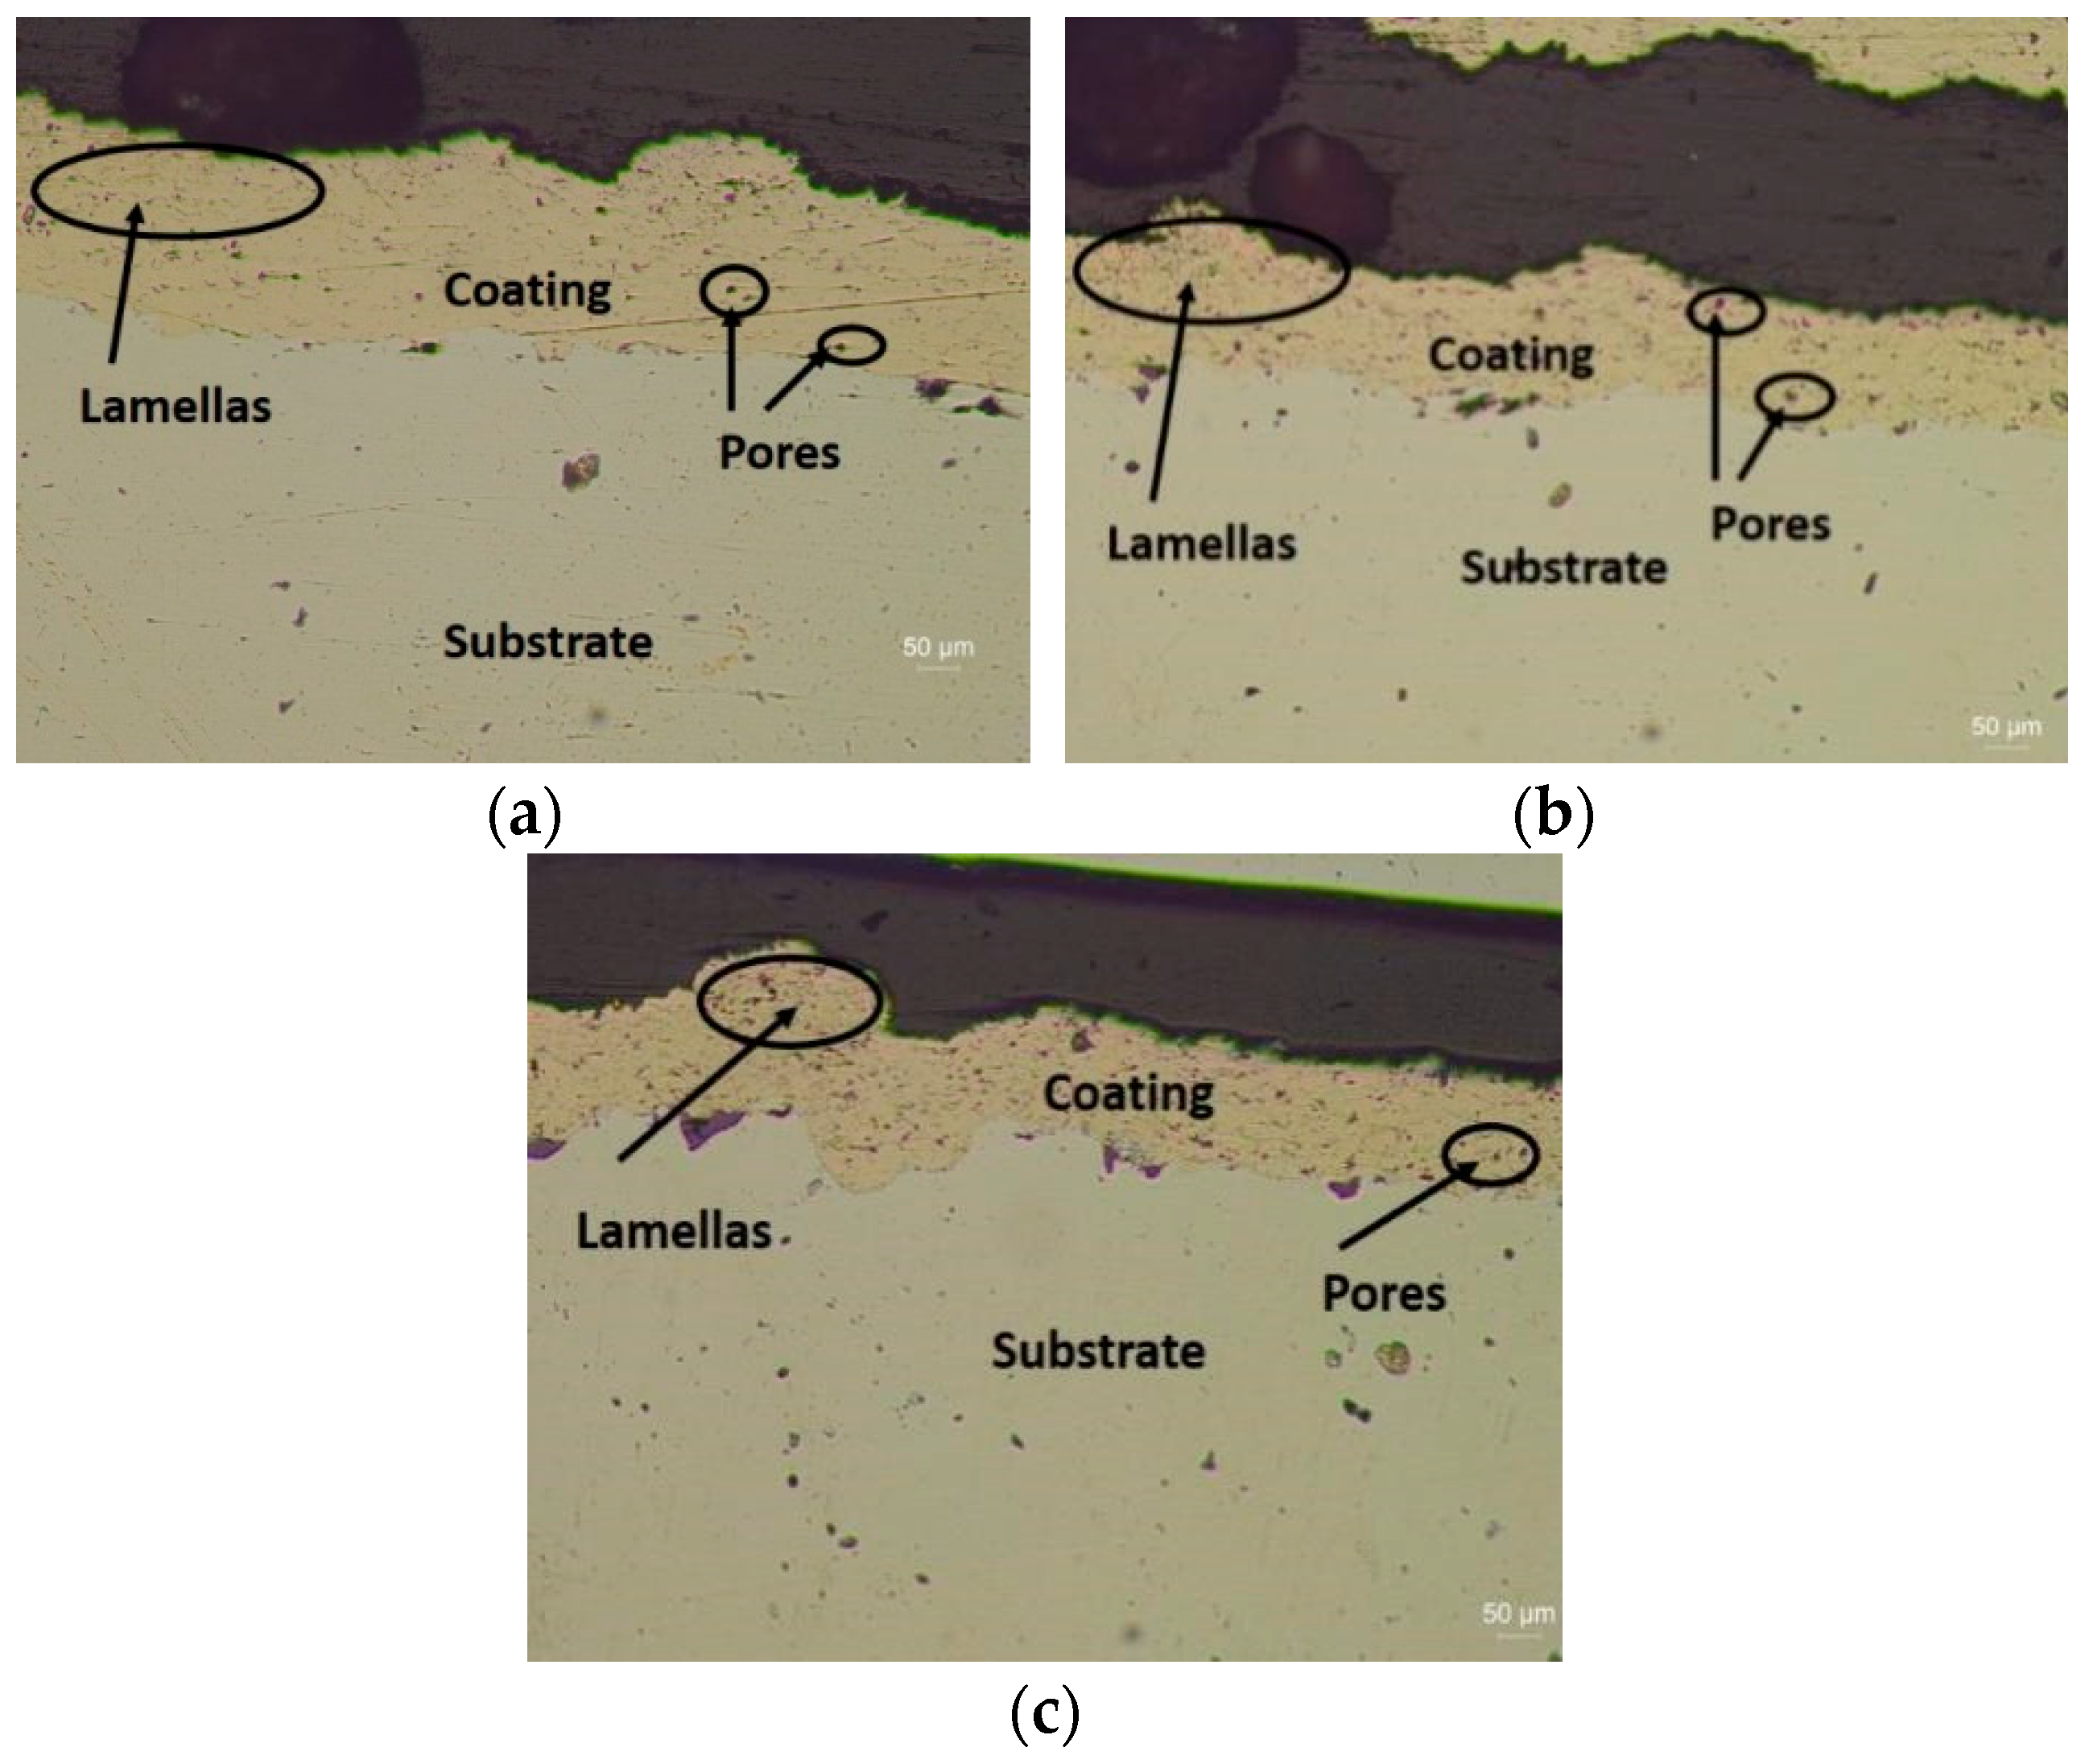
Parallel lamella like structures were visible along with few pores, voids and un-melted particles in the coating from microscopy study of the prepared samples (Figure 6).
The values of the porosity, thickness, surface roughness, surface hardness, fracture toughness, bond strength and density of the three as sprayed coatings are given in Table 3. The surface roughness value of the coatings increases with the increase in the alumina content.
The microhardness value of the coatings was taken at the cross section. The hardness values of the coatings were similar to that obtained by Praveen et al. [29] who reported the maximum hardness and average hardness value to be 778 HV0.3 and 673 HV0.3 of NiCrBSi-Al2O3 coating, respectively. N15A coating had shown highest resistance against fracture toughness among all three investigated coatings. The bond strength of the coatings was determined by a pull of tester. The separation of the coating took place at the coating/substrate interface with 25% of the aluminum stud covered with the coating. The density of the coatings was measured using Archimedes’ principle and the rule of mixture. In both the cases it was observed that the density of the coatings decreases with increase in the alumina content.
3.2. Experimental Results of Coating Material
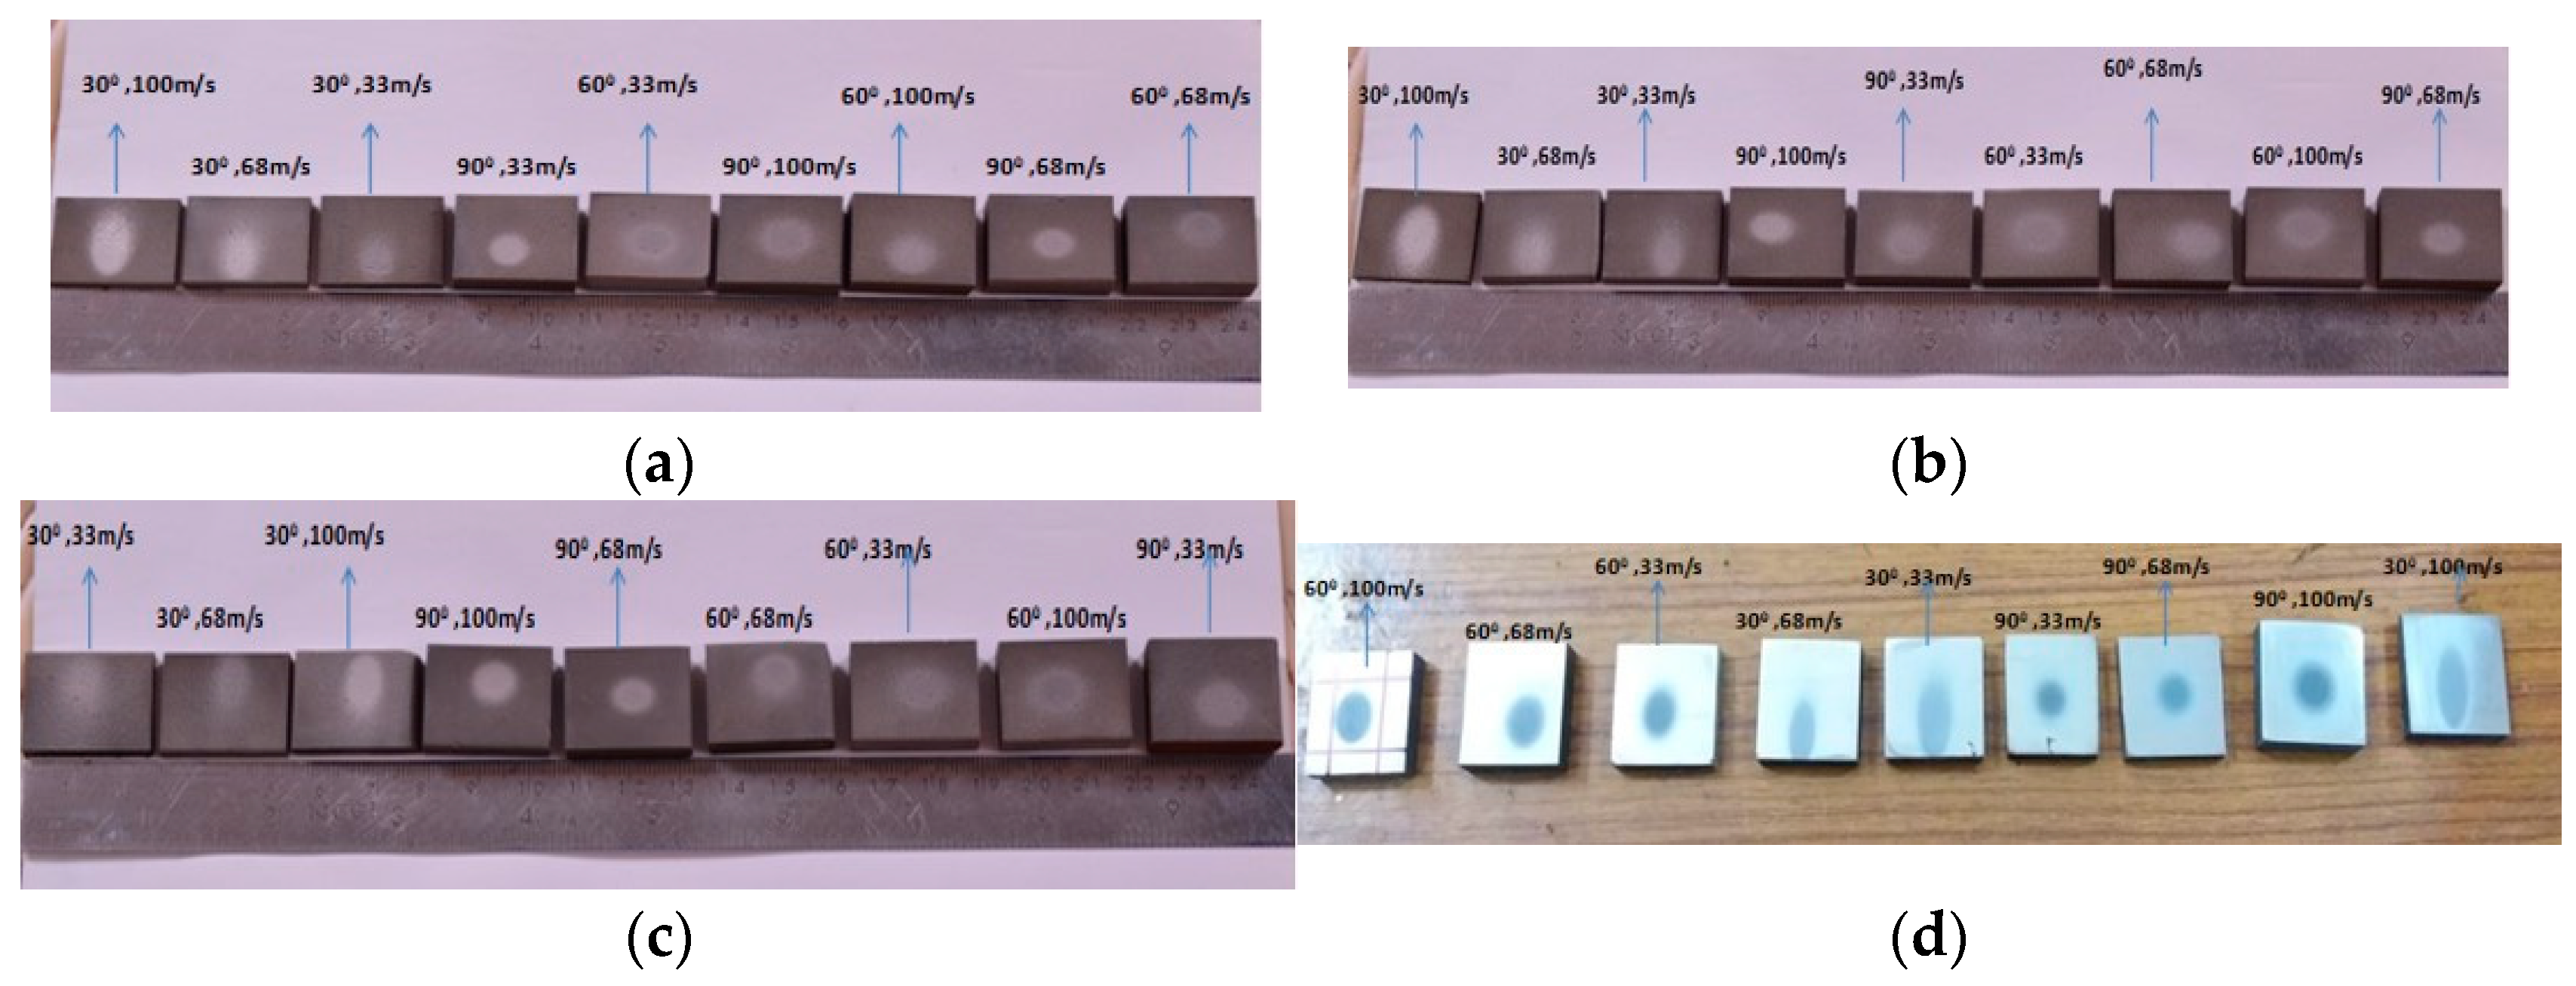
In the cases of 30° and 60° impingement angle the erosion has taken place in an elliptical shape (Figure 7). The major axis of the erosional ellipse in 30° impingement angle is longer than that of 60°.A shape of circular erosional patch has occurred when the impact angle changes to 90° as the erodent strikes along a vertical circular path. In all the three eroded samples the erosion area can be identified as outermost zone, middle zone and innermost zone where the erosion amounts to larger quantity in innermost zone, moderate quantity in middle zone and the least amount in outermost zone. The significant feature of the innermost zone is of greyish color and the other two zones are of light faded grey colors.
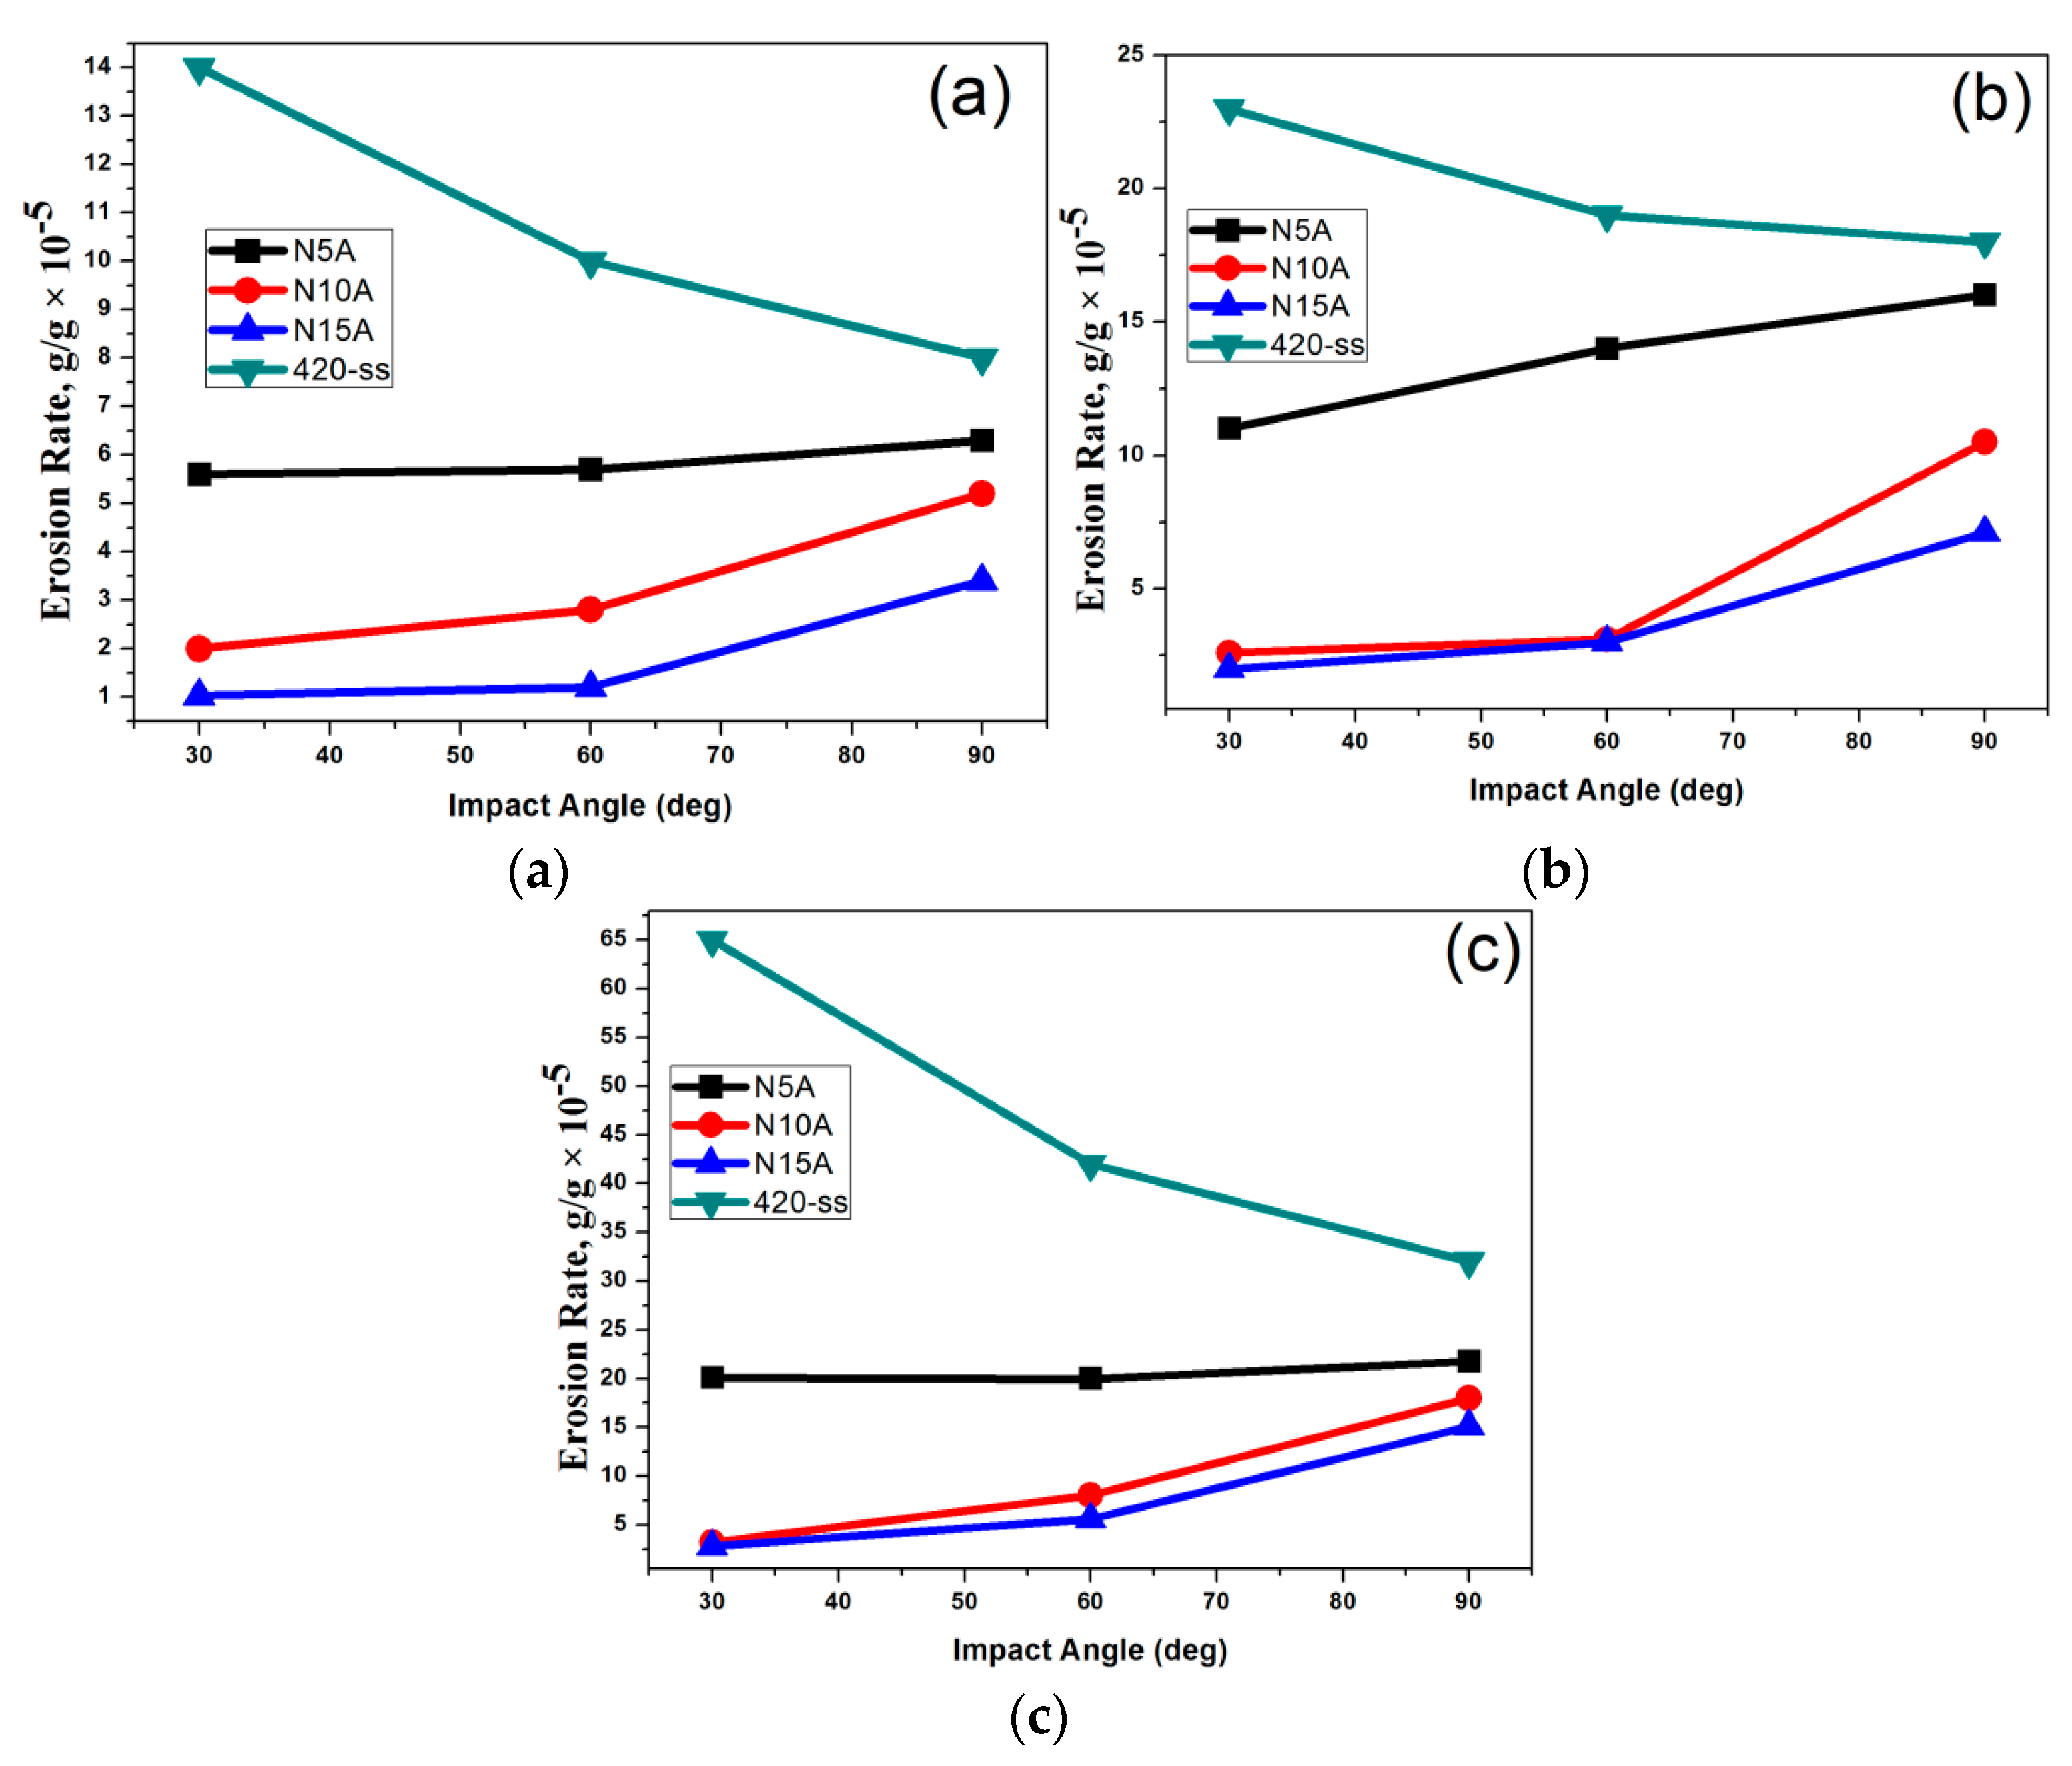
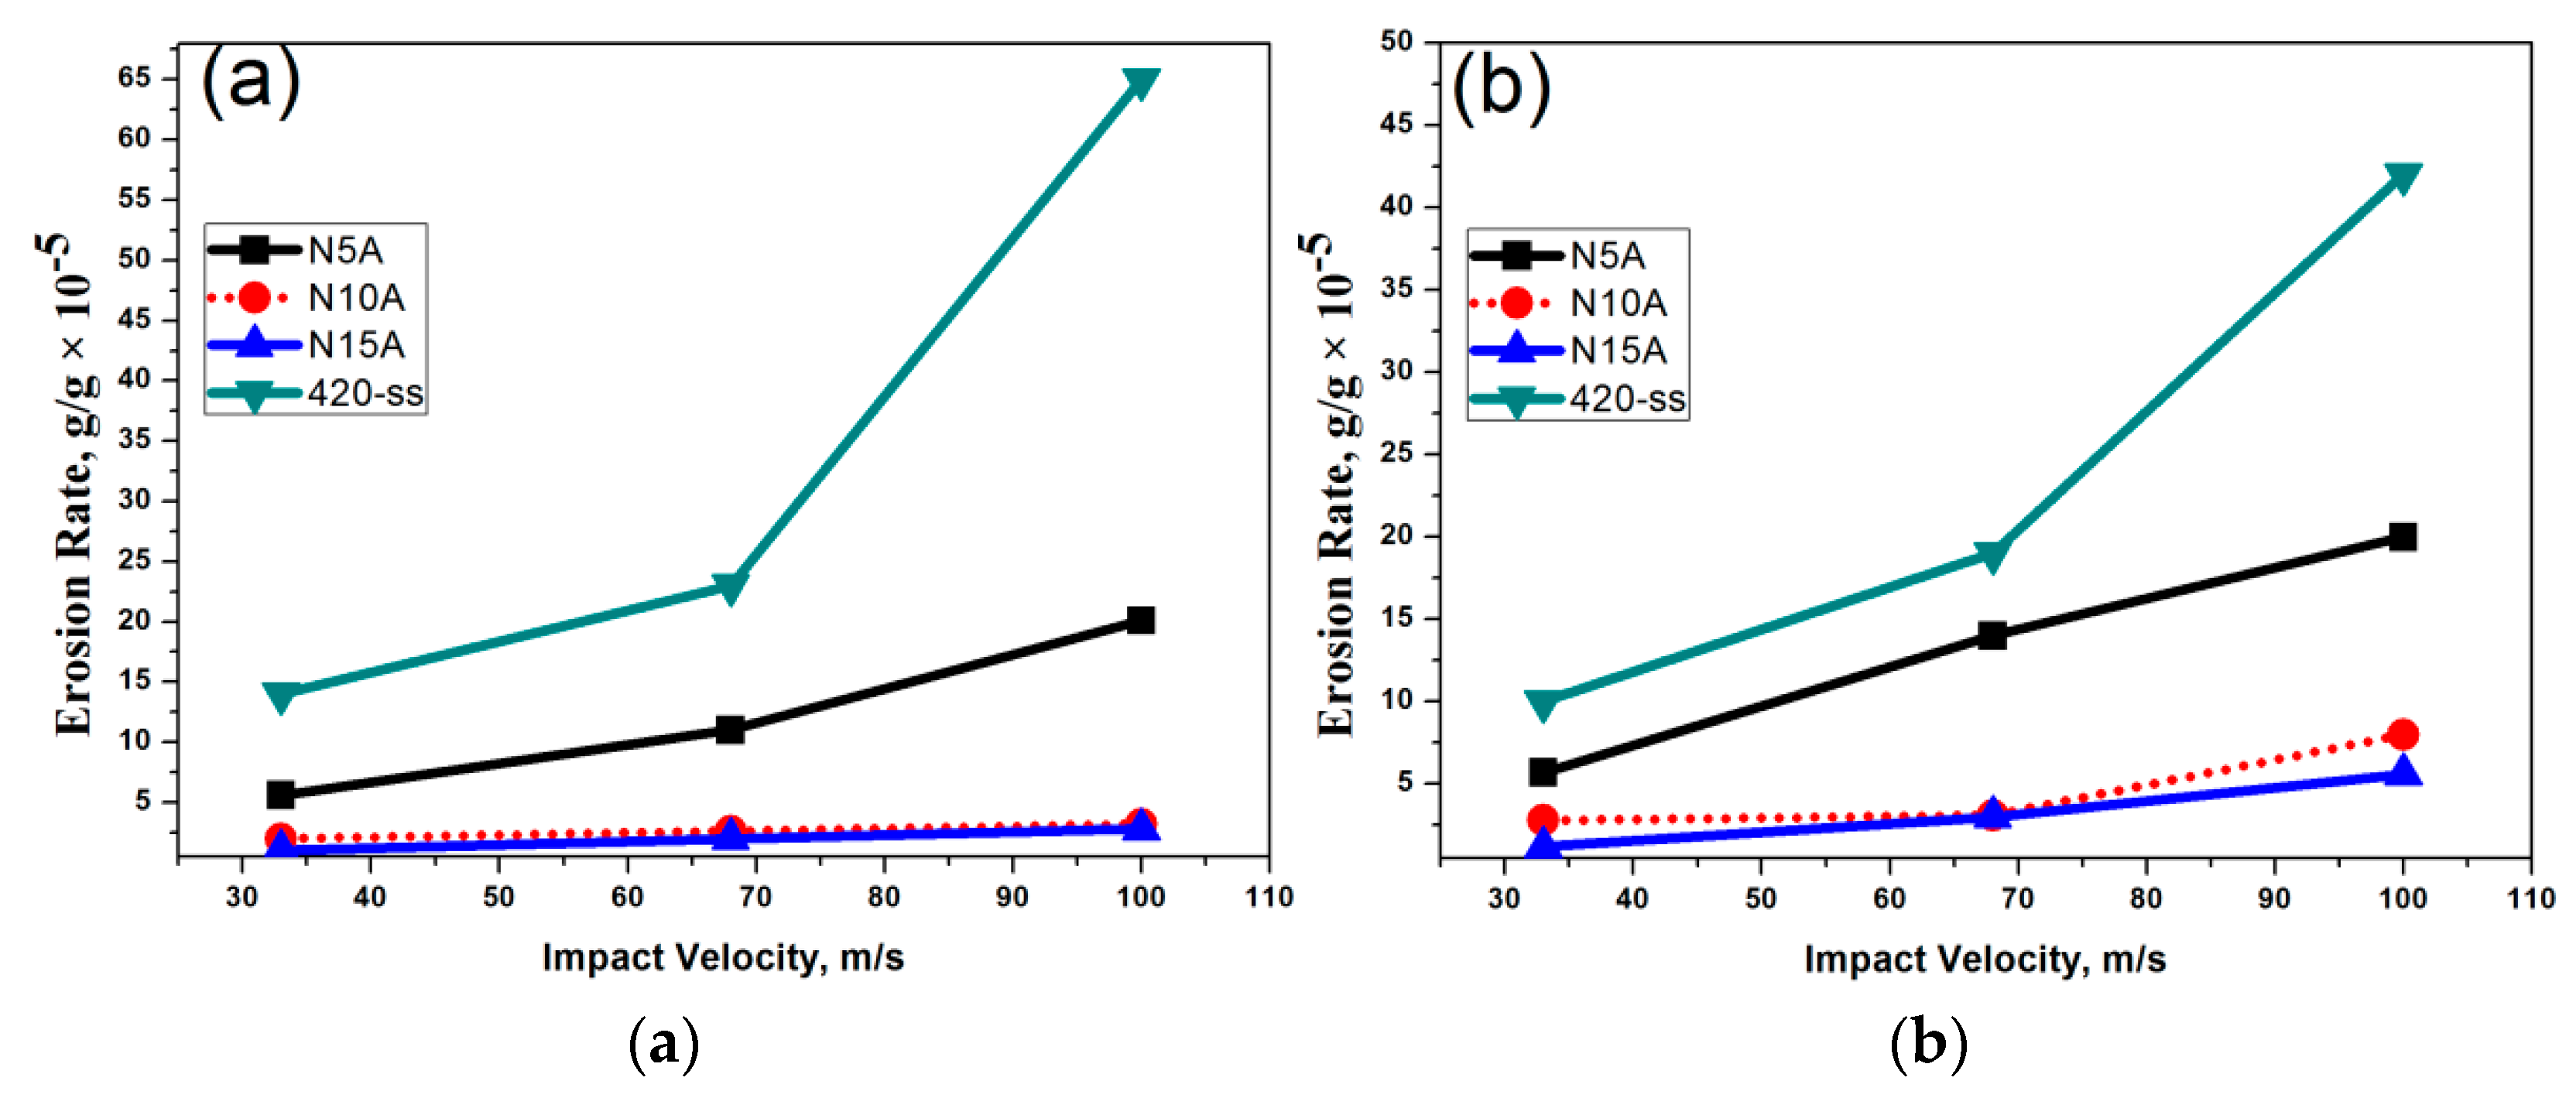
The erosion rates have been quantified at different impact velocities of 33 m/s, 68 m/s and 100 m/s and different impact angles of 30°, 60° and 90° in case of both coated and uncoated samples. The 30° and 90° impact angle caused the minimum and maximum wear, respectively, in coated samples but vice versa is the wear in bare steel indicating ductility property (Figure 8).
But a significant outcome has been observed with N15A which offered the maximum resistance to wear and the bare steel the minimum resistance at all the velocities and impact angles considered in the experiment.
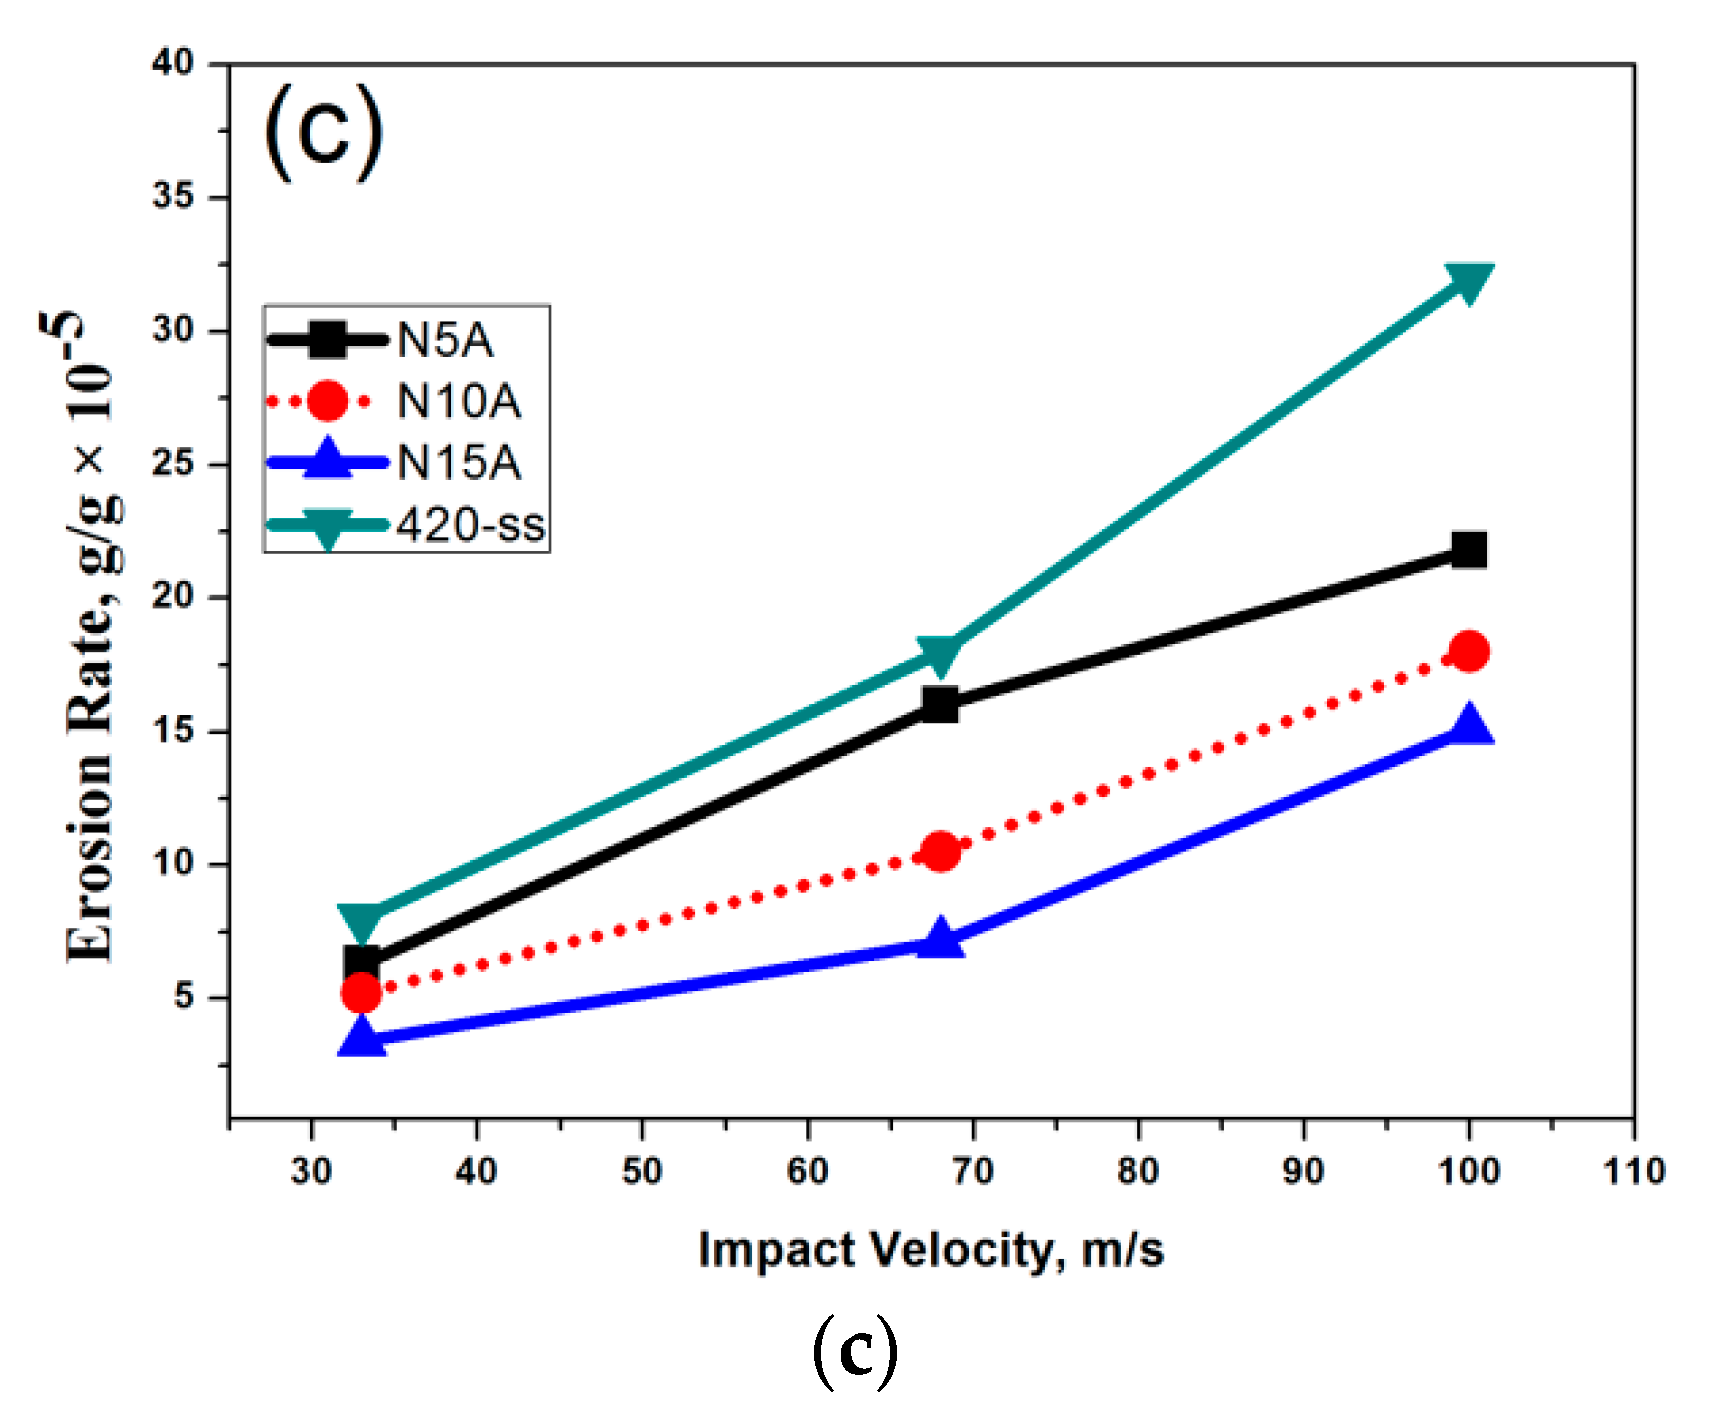
The erosion rate in both coated and uncoated samples increases as the impact velocities of erodent increases at all the above impact angles as depicted in Figure 9. This trend is attributed to higher impact kinetic energy causing more of material loss.
While considering the per cent of alumina in the coating material, N15A and N10A exhibit the identical higher resistance to wear as compared to N5A with variation of impact velocity. On the other hand, the bare grade SS420 exhibits very poor resistance to erosion even at low and high impact velocities as compared to all coated samples.
3.3. Experimental Results of Coating Material
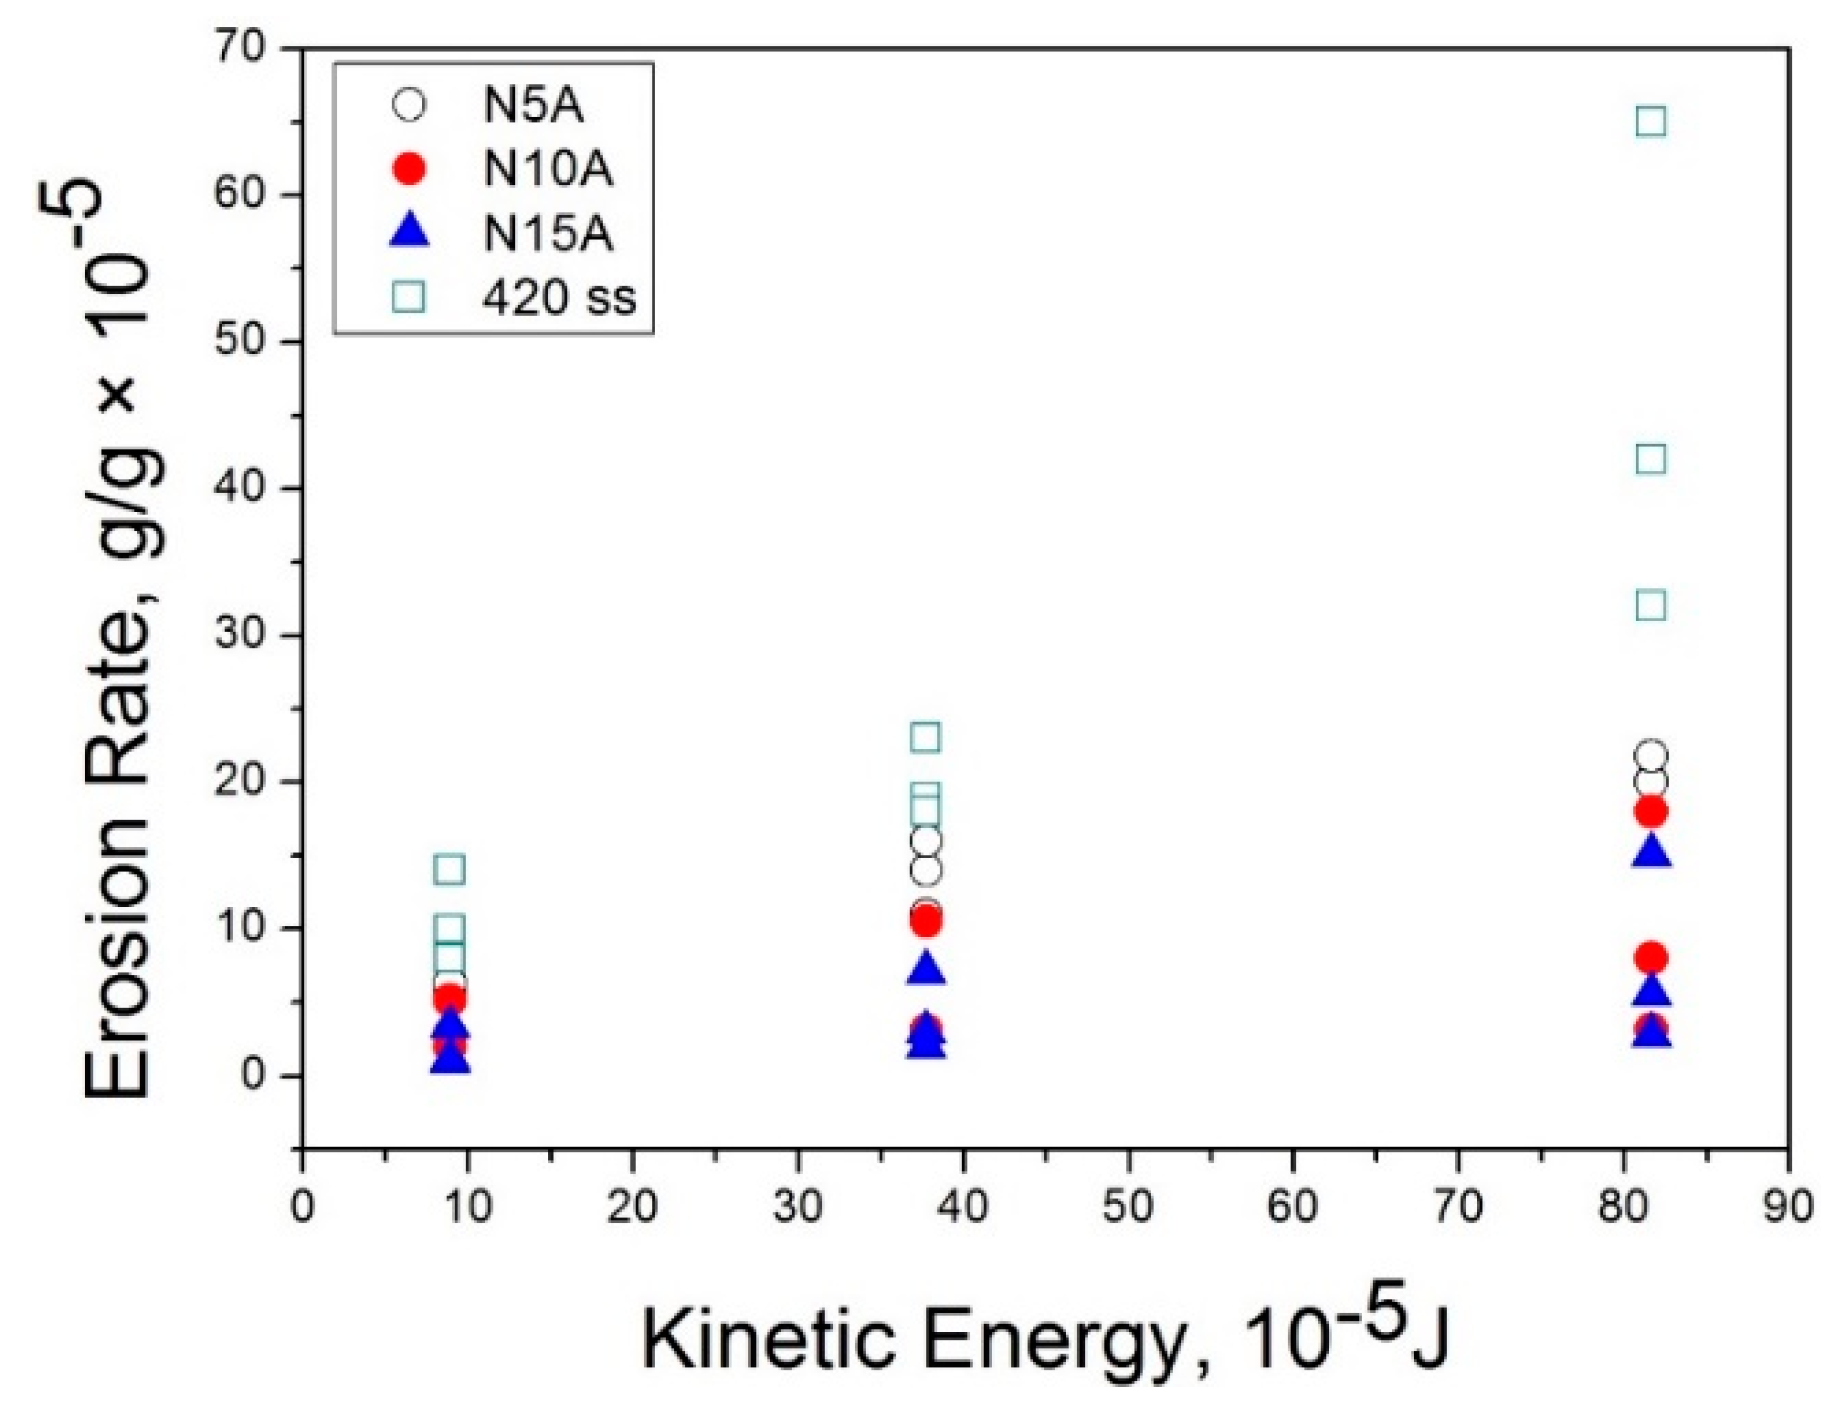
The particle impact energy has been calculated using the Equation (6):
where Ek is the particle kinetic energy, is the density of the solid particle, R is the radius of the solid particle and Vp is the impact velocity of the solid particle and its relationship with erosion rate has been presented graphically in Figure 10 which shows the erosion rate is on a higher trend with higher kinetic energy.
3.4. Erosion Mechanism
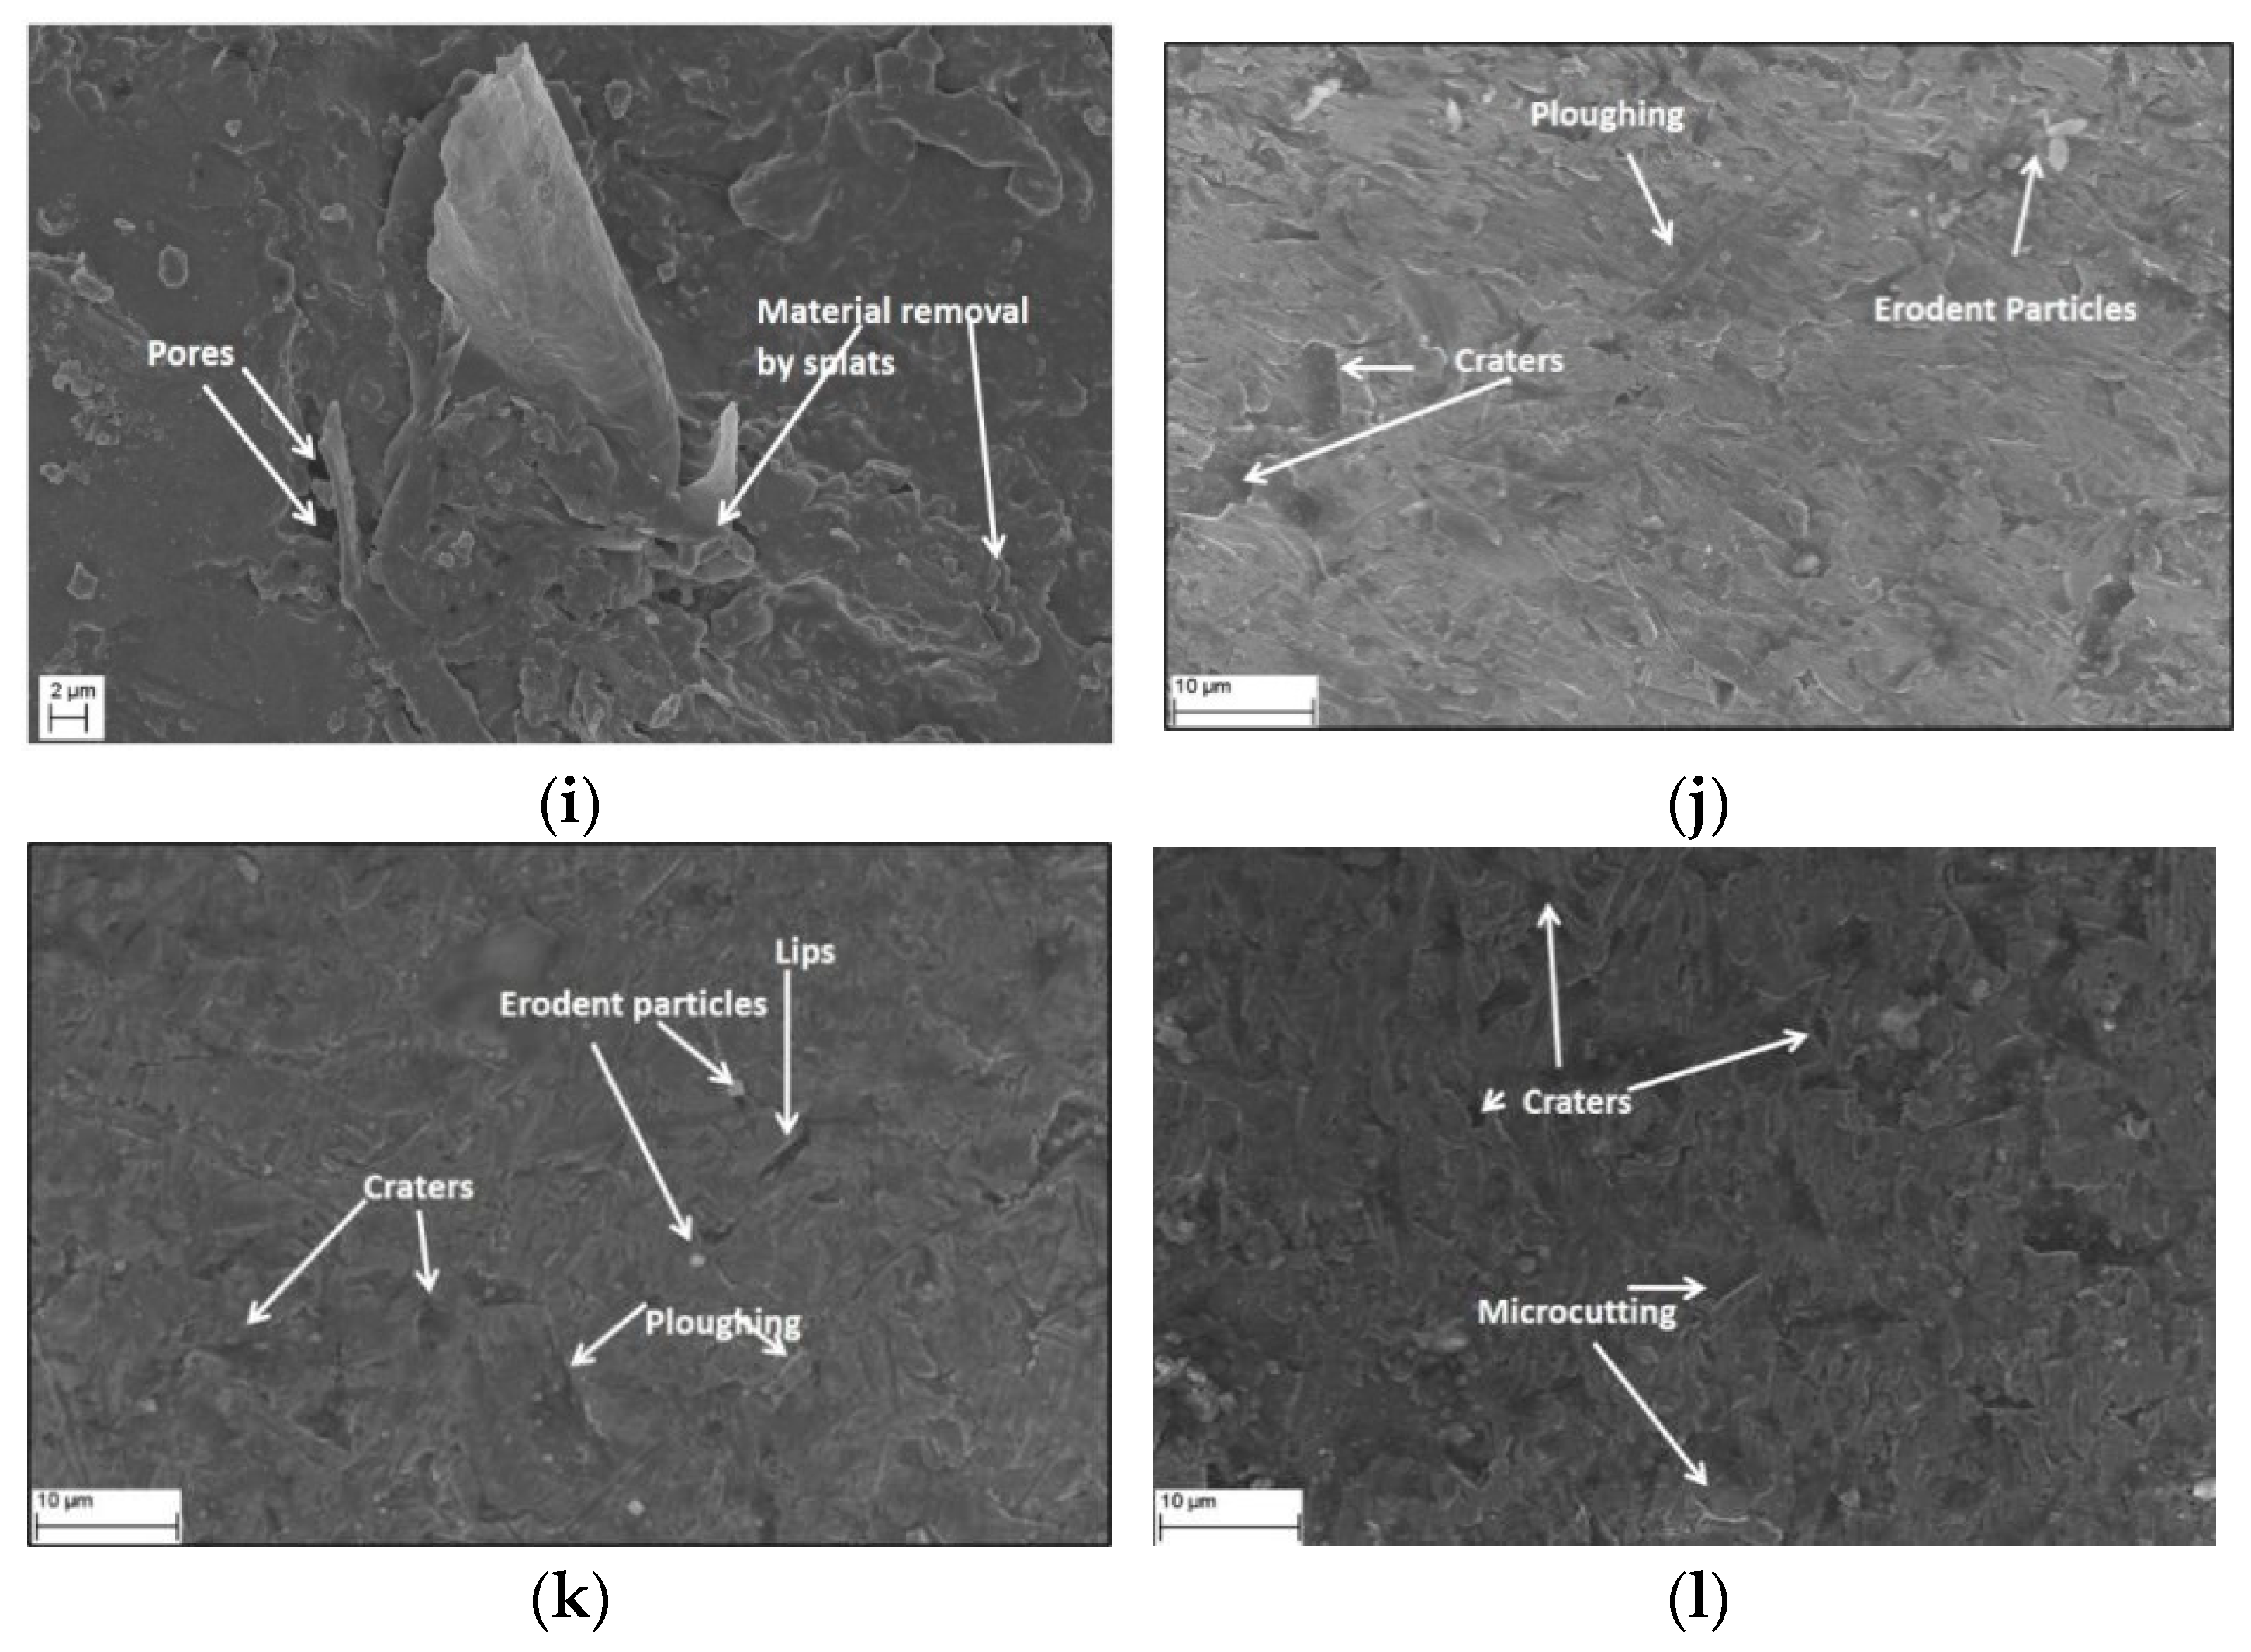
The SEM images (Figure 11) after erosion of the uncoated and coated substrate at different impact angle (30°, 60° and 90°), at impact velocity of 33 m/s and per cent of alumina in the coating reveal that the erosion of the coating is taking place in mixed mode irrespective of the alumina content in the coating. Micro cutting and ploughing action are visible on the coating surfaces. The presence of a sufficient amount of ductile matrix material may be the reason for such action. In addition, the mechanisms responsible for erosion are fracturing of alumina splats and development of craters which might have been formed due to the removal of whole of the splat or due to the pores, voids or unmelted particles present in the coatings. The stress levels are raised because of the silt impact. These levels are further intensified by the pores, voids and sharp edges of the alumina particles. This phenomenon leads to the initiation of cracks and linking of these cracks results in spalling of the coating material. Maximum damage among the sprayed coated samples is observed in N5A coating having minimum percentage of alumina. The mechanism involved in N5A coating is microcutting and ploughing. The coating material has lamella structure and the material is removed in the form of layers because of ploughing action leading to severe damage. The minimum damage occurs in N15A coating. The mechanism involved is brittle fracture caused due to the mixed ductile matrix with comparatively higher percentage of alumina than the other two coatings. In Grade SS420 maximum damage is caused by silt impact.
The surface of the N5A sample coated with 200 μm erodent particles under the action of impact velocity of 33m/s and at an impact angle of 30°, exhibits splats, pores and microcutting action as observed in Figure 11a. With the change of the impact angle to 60°, other parameters being kept constant the surface of the same coated sample shows spalling and ploughing action along with few pores (Figure 11b). When the impact angle is perpendicular, the materials are removed from the surface in the form of splats and granules with visible pitting action (Figure 11c).
In Figure 11d the SEM micrograph reveals the coating removal in the form of small numbers of splats and ploughing action. The change of impact angle from 30° to 60° for the same sample causes the appearance of a greater number of splats along with visible ploughing action as observed in Figure 11e. The Figure 11f micrograph demonstrates a greater number of splats than those of two previous cases due to the pitting action of the erodent particles when the impact angle is normal to the striking surface. Ploughing action is not visible in this case.
In the case of N15A coated sample the micrograph reveals that microcutting and ploughing action are the major phenomena of erosion on the surface (Figure 11g). At impact angle of 60°, the micrograph of N15A as pictured in Figure 11h reveals splats and ploughing action on the surface. For the same sample, the surface experiences more voids, pores and splats with negligible ploughing and microcutting action when the impact of the striking erodent occur in a perpendicular direction to the striking surface as observed in Figure 11i. From the microscopic image of SS420 uncoated sample (Figure 11j) it is observed that the erosion significantly occurred by ploughing mode along with the formation of craters with few leftover erodent particles. Figure 11k depicts ploughing action, craters and lip formation with few erodent particles. At 90° the uncoated sample shows very few craters and microcutting action on the surface (Figure 11l) which attributes to the ductility of SS420.
The uncoated sample grade SS420 has shown ductile behavior. At low impact angle, of 30° the erosion rate is higher in comparison to high impact angle of 90° for all impact velocities. However, all the sprayed samples offer higher wear resistance at 30° impact angle than that of 90° impact angle. In all the sprayed samples and uncoated samples, erosion rate rises with the increase in the impact velocity. At 30° and 60° impact angles the normal component of velocity creates craters on the surface of the coated samples and, on the other hand, the horizontal component of velocity has a cutting action on or scratches the surface. At 90° impact angle only pitting action and craters are observed on the surface of the eroded samples.
3.5. Taguchi Experimental Design
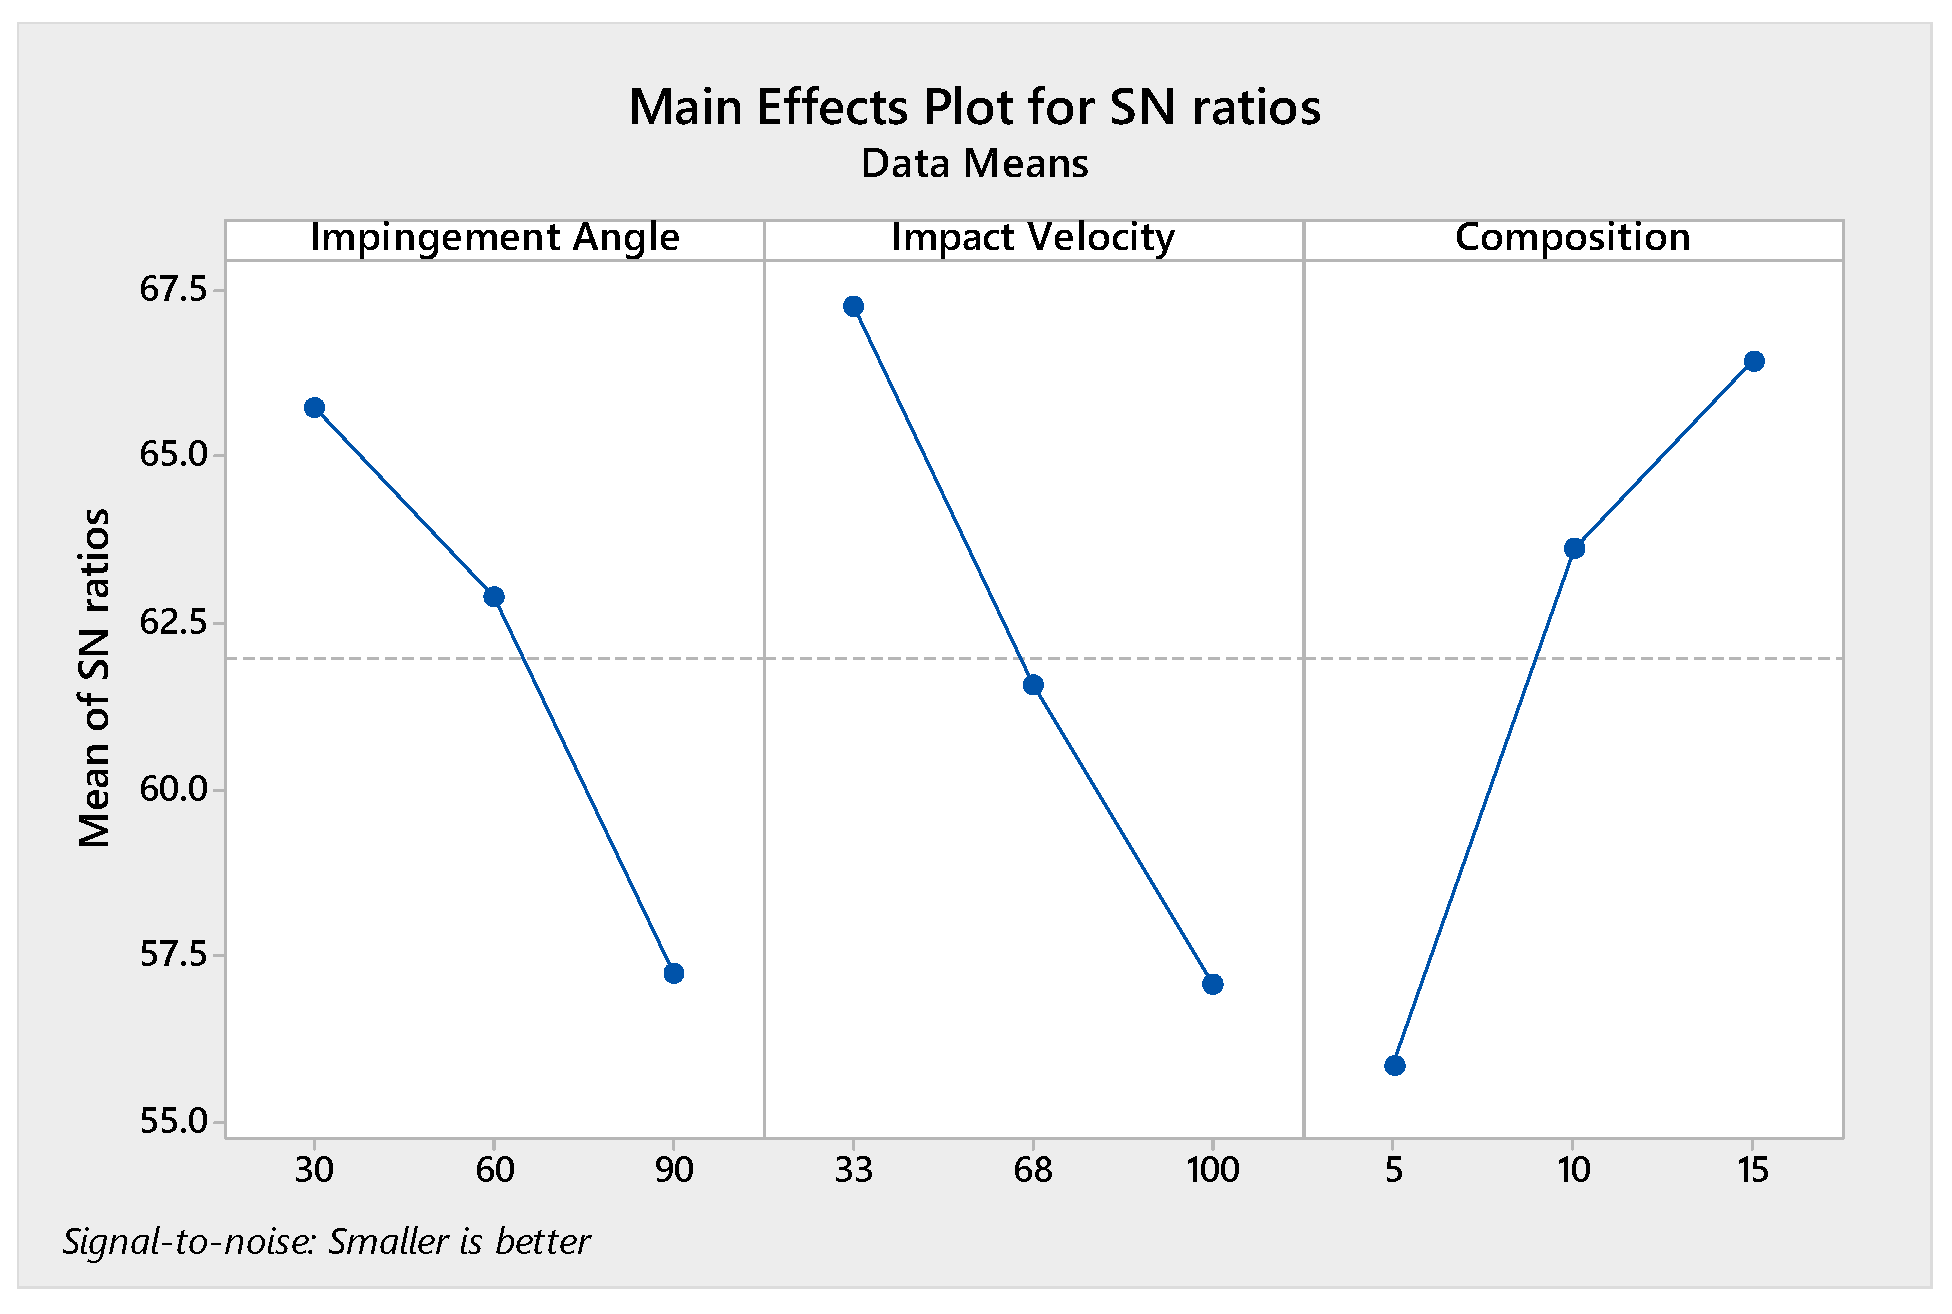
The erosion wear behavior of the coatings is designed and reported in Table 2. The values of the signal to noise ratio (S/N) in dB is mentioned in the sixth column of Table 2. The arithmetic mean of the S/N is calculated as 61.98 dB. The main effect plot for S/N ratios and means are shown in Figure 12 and Figure 13 respectively. Figure 12 shows the effect of controlling factors on volume loss caused by erosion. The response for S/N ratios for volume loss is reported in Table 4, from which it is concluded that, among all the factors, composition (weight % of Al2O3) is the most significant factor followed by impact velocity and impingement angle.
After analyzing the results from Figure 12, it is considered that the factor combination of A1, B1 and C3 is best as far as minimization of volume loss is concerned. Therefore, minimum volume loss is obtained when the impingement angle (A) and impact velocity (B) are at their lowest level, whereas the composition (C) is at its highest level.
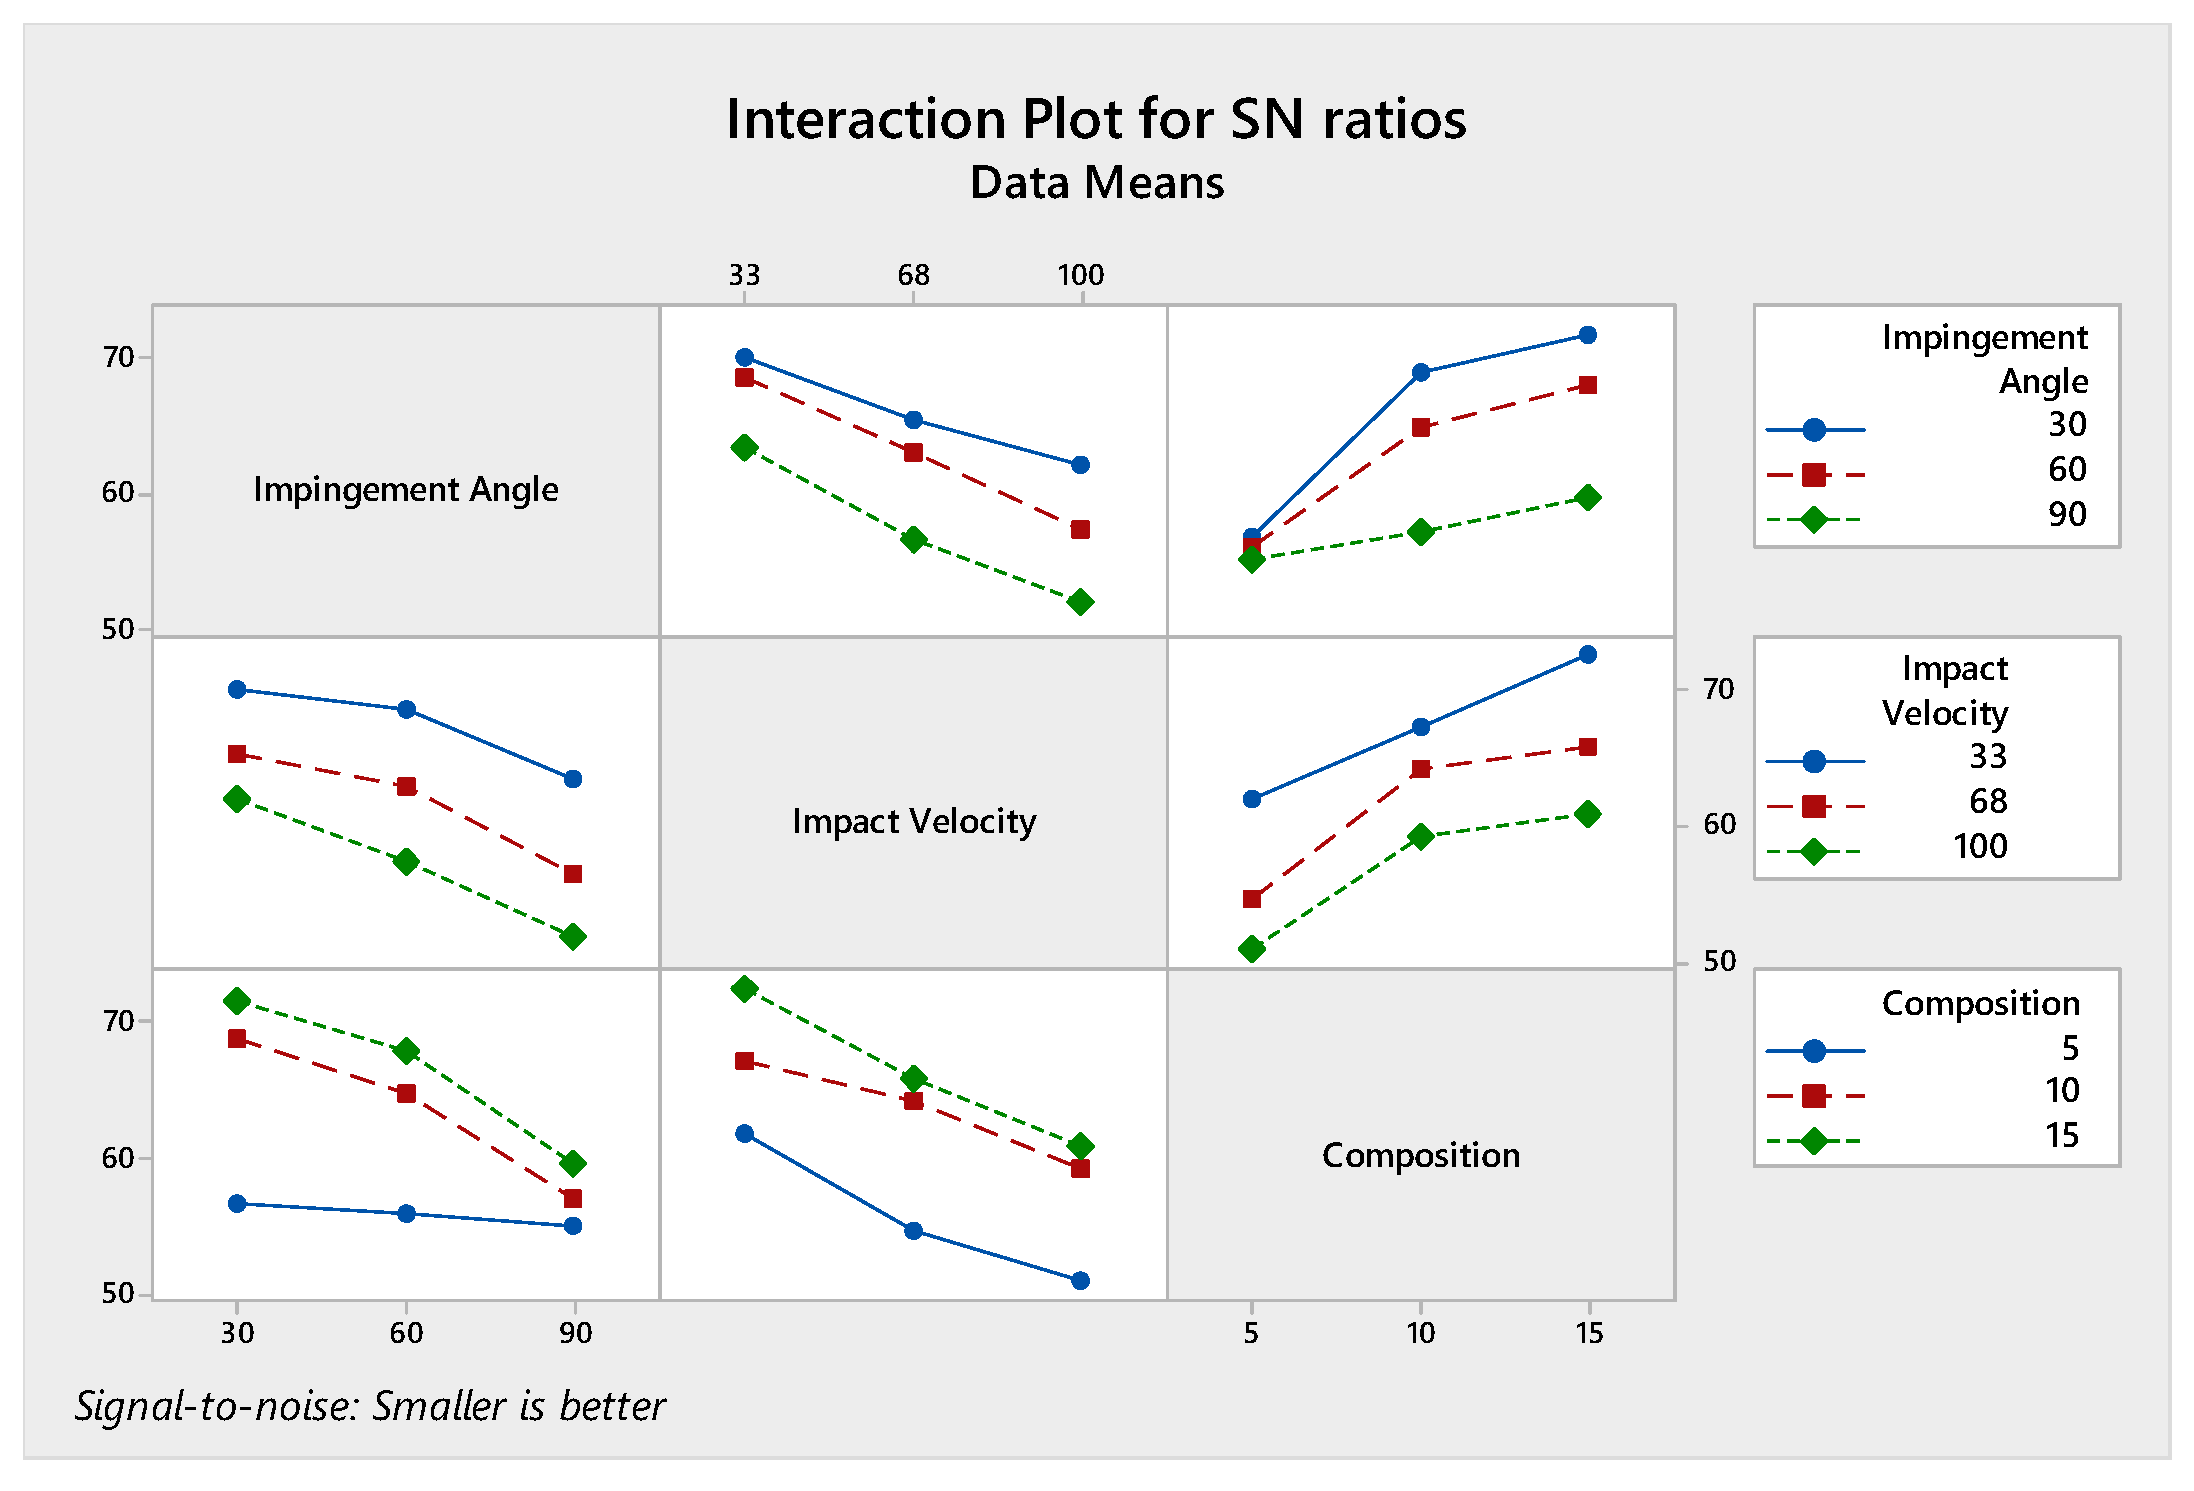
In order to identify the significant and insignificant interactions, as well as to determine the importance of each factor with respect to their percentage contribution to response, analysis of variance (ANOVA) was undertaken. The ANOVA was performed with 5% level of significance. Figure 14 illustrates the that there is strong interaction among the control parameters as they tend to intersect each other which agree with the findings of the other researchers [47,48].
The order of significance of each factor and their interaction is indicated in the 6th column of the Table 5. From analysis of both Figure 15 and Table 5 it is confirmed that, the composition (C) is the most significant factor on volume loss followed by impact velocity (B) and impingement angle (A). However, when the combined effect is considered, the interaction A × C has the maximum contribution (P % = 7.34) on volume loss followed by the interaction B × C (P % = 1.25) and A × C (P % = 0.86).
The mathematical relationship between volume loss (VL) and the control factors is determined by multiple linear regression analysis and given by Equation (7).
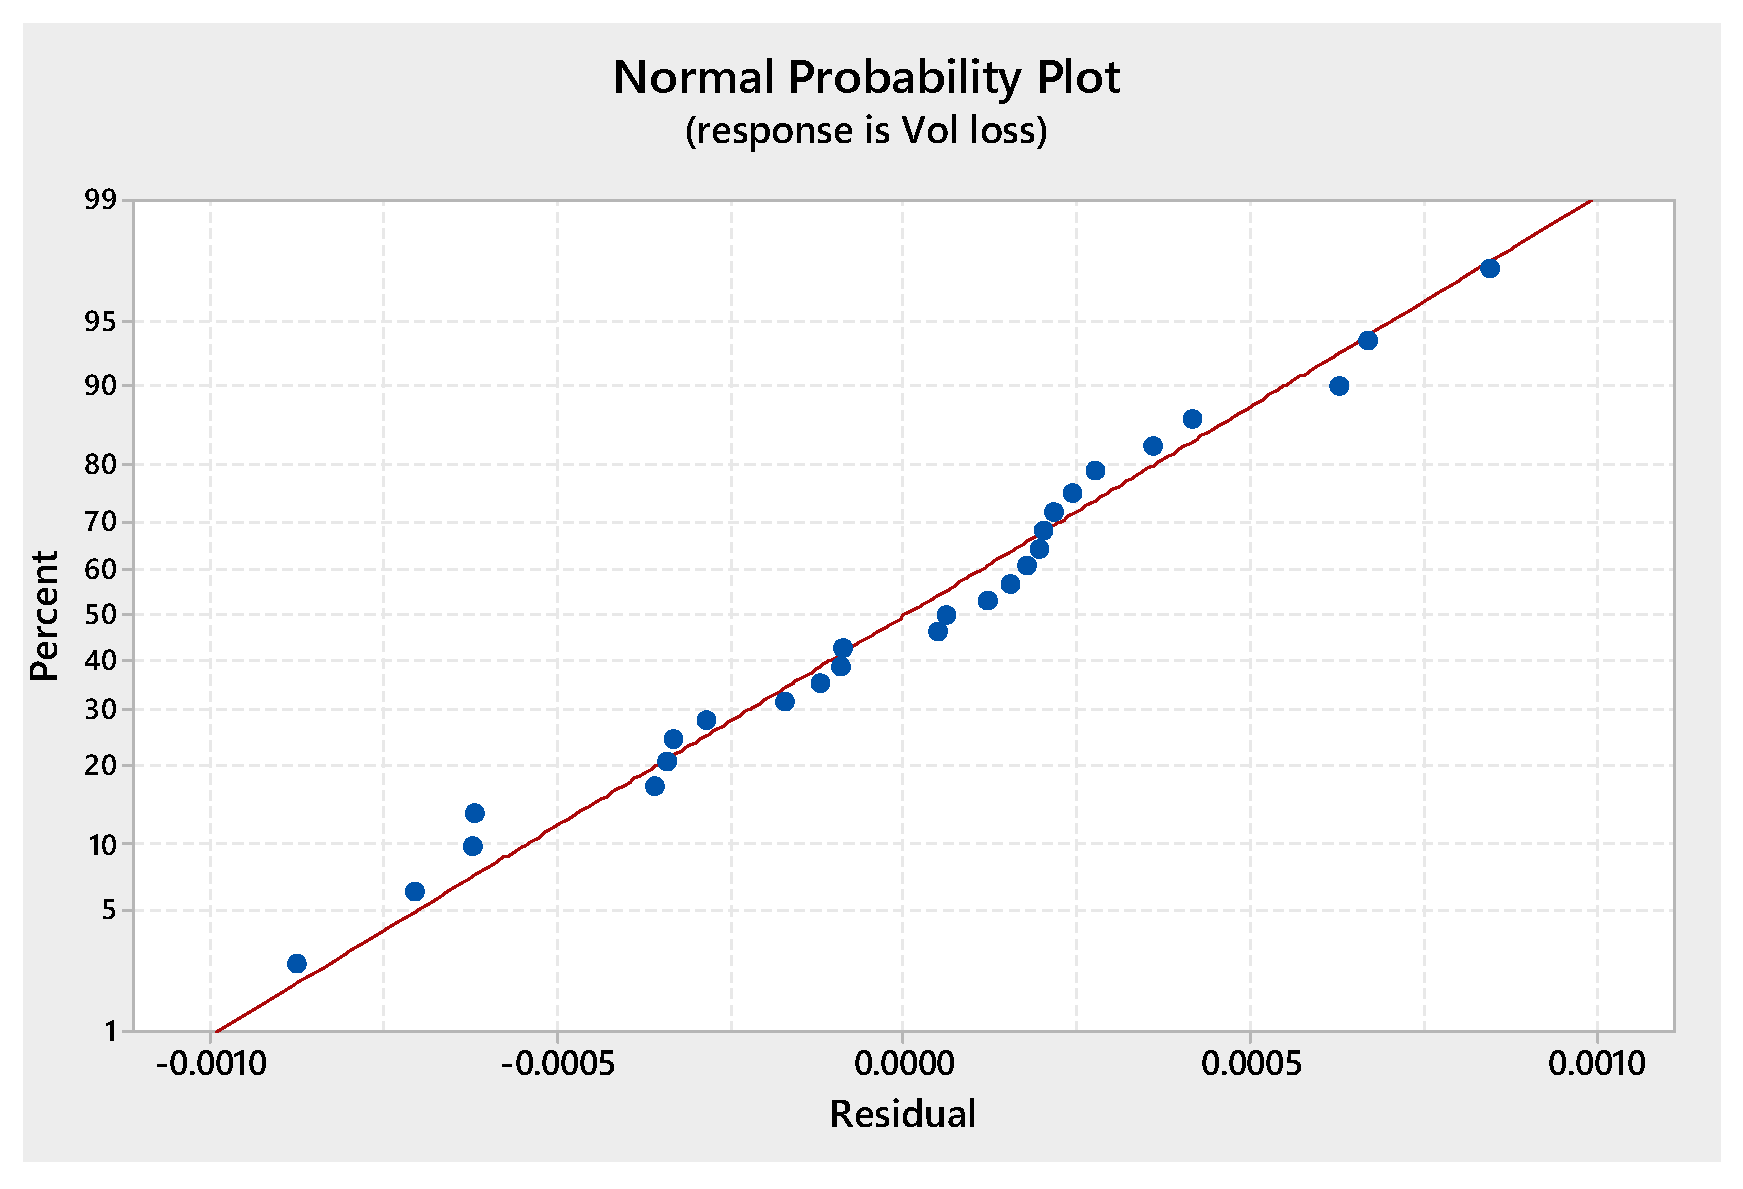
The residual plot obtained for the volumetric loss is given in Figure 15 and it can be observed that all the residuals fall closer to the straight line which implies that the developed model coefficients are significant.
4. Conclusions
The salient findings were as follows:
- The coated surface placed at an inclination of 30° offers the maximum resistance to erosion but erosion rate is significantly high when inclination angle changes to 90°. However, the reverse is the case when coated surfaces are replaced by bare steel.
- The wear rate is directly proportional to impact velocity in respect of all coatings and bare steel.
- The mechanism in SEM morphology of all the sprayed coatings is similar in form but differ from the bare substrate. SEM morphology of all the sprayed coatings includes micro cutting, fracturing of splats, development of craters and ploughing. However, in the substrate the mechanisms are ploughing and pitting along with formation of pores, voids and craters.
- NiCrBSi containing 15%Al2O3 is superior in checking erosion to other two blend of 5% and 10% Al2O3.
- The optimal condition for obtaining low volumetric loss of the coatings is found at impingement angle of 30°, impact velocity of 33 m/s and composition of NiCrBSi-15%Al2O3 using the Taguchi method.
- From the ANOVA table it was observed that the volumetric loss of the coatings was significantly affected by the composition of the coatings with a contribution of 35.89% followed by impact velocity (31.20%) and impingement angle (22.33%). The proposed statistical method was validated by a confirmation test, showing an error below 5% supporting the acceptance of the Taguchi method.
Author Contributions
Conceptualization, H.S. and P.S.; Methodology, H.S.; Software, P.S.; Validation, P.S., R.M. and S.B.; Formal Analysis, H.S.; Investigation, P.S.; Resources, R.M.; Data Curation, R.M.; Writing—Original Draft Preparation, H.S.; Writing—Review & Editing, H.S.; Visualization, R.M.; Supervision, P.S.; Project Administration, H.S.; Funding Acquisition, H.S., P.S., R.M. and S.B. All authors have read and agreed to the published version of the manuscript.
Funding
This research received no external funding.
Conflicts of Interest
The authors declare no conflict of interest.
References
- Upadhyaya, R.; Tailor, S.; Shrivastava, S.; Modi, S.C. High performance thermal-sprayed WC-10Co-4Cr coatings in narrow and complex areas. Surf. Eng. 2018, 34, 412–421. [Google Scholar] [CrossRef]
- Sharma, V.; Kaur, M.; Bhandari, S. Development and characterization of high-velocity flame sprayed Ni/TiO2/Al2O3 coatings on hydro turbine steel. J. Therm. Spray Technol. 2019, 28, 1379–1401. [Google Scholar] [CrossRef]
- Sharma, V.; Kaur, M.; Bhandari, S. Slurry jet erosion performance of high-velocity flame-sprayed nano mixed Ni-40Al2O3 coating in aggressive environment. Proc. Inst. Mech. Eng. Part J J. Eng. Tribol. 2019, 233, 1090–1106. [Google Scholar] [CrossRef]
- Kumar, R.K.; Kamaraj, M.; Seetharamu, S.; Kumar, S.A. A pragmatic approach and quantitative assessment of silt erosion characteristics of HVOF and HVAF processed WC-CoCr coatings and 16Cr5Ni steel for hydro turbine applications. Mater. Des. 2017, 132, 79–95. [Google Scholar] [CrossRef]
- Kumar, A.; Sharma, A.; Goel, S.K. Erosion behaviour of WC–10Co–4Cr coating on 23-8-N nitronic steel by HVOF thermal spraying. Appl. Surf. Sci. 2016, 370, 418–426. [Google Scholar] [CrossRef]
- Mann, B.S.; Arya, V. Abrasive and erosive wear characteristics of plasma nitriding and HVOF coatings: Their application in hydro turbines. Wear 2009, 249, 354–360. [Google Scholar] [CrossRef]
- Wang, B.; Lee, S.W. Erosion-corrosion behavior of HVOF NiAl-Al2O3 intermetallic-ceramic coating. Wear 2000, 239, 83–90. [Google Scholar] [CrossRef]
- Senapati, P.; Padhy, M.K.; Sahu, T. Coating Materials and Methodologies for the Protection of Hydro Turbine Runner. Int. J. Mech. Eng. Technol. 2017, 8, 524–536. [Google Scholar]
- Martin, A.; Rodriguez, J.; Fernandez, J.E.; Vijande, R. Sliding wear behaviour of plasma sprayed WC-NiCrBSi coatings at different temperatures. Wear 2001, 251, 1017–1022. [Google Scholar] [CrossRef]
- Maatta, A.; Kanerva, U.; Vuoristo, P. Structure and tribological characteristics of HVOF coatings sprayed from powder blends of Cr3C2-25NiCr and NiCrBSi Alloy. J. Therm. Spray Technol. 2011, 20, 366–371. [Google Scholar] [CrossRef]
- Lima, R.S.; Moreau, C.; Marple, B.R. HVOF-Sprayed coatings engineered from mixtures of nanostructured and submicron Al2O3-TiO2 powders: An enhanced wear performance. J. Therm. Spray Technol. 2007, 16, 866–872. [Google Scholar] [CrossRef]
- Navas, C.; Colaco, R.; De Damborenea, J.; Vilar, R. Abrasive wear behaviour of laser clad and flame sprayed-melted NiCrBSicoatings. Surf. Coat. Technol. 2006, 200, 6854–6862. [Google Scholar] [CrossRef]
- Zikin, A.; Antonov, M.; Hussainova, I.; Katona, L.; Gavrilovic, A. High temperature wear of cermet particle reinforced NiCrBSihardfacings. Tribol. Int. 2013, 68, 45–55. [Google Scholar] [CrossRef]
- Kim, H.J.; Hwang, S.Y.; Lee, C.H.; Juvanon, P. Assessment of wear performance of flame sprayed and fused Ni- based coatings. Surf. Coat. Technol. 2003, 172, 262–269. [Google Scholar] [CrossRef]
- Garrido, A.H.; Gonzalez, R.; Cadenas, M.; Battez, A.H. Tribologicalbehavior of laser-textured NiCrBSi coatings. Wear 2011, 271, 925–933. [Google Scholar] [CrossRef]
- Miguel, J.M.; Guilemany, J.M.; Vizcaino, S. Tribological study of NiCrBSi coating obtained by different processes. Tribol. Int. 2003, 36, 181–187. [Google Scholar] [CrossRef]
- Serres, N.; Hlawka, F.; Costil, S.; Langlade, C.; Machi, F.; Cornet, A. Dry coatings and eco-design part. 1- Environmental performance & chemical properties. Surf. Coat. Technol. 2009, 204, 187–196. [Google Scholar] [CrossRef]
- Tobar, M.J.; Alvarez, C.; Amado, J.M.; Rodriguez, G.; Yanez, A. Morphology and characterization of laser clad composite NiCrBSi–WC coatings on stainless steel. Surf. Coat. Technol. 2006, 200, 6313–6317. [Google Scholar] [CrossRef]
- Wang, H.; Xia, W.; Jin, Y. A study on abrasive resistance of Ni-based coatings with a WC hard phase. Wear 1996, 195, 47–52. [Google Scholar] [CrossRef]
- Tu, T.P.; Liu, M.S.; Mao, Z.Y. Erosion resistance of Ni–WC self-fluxing alloy coating at high temperature. Wear 1997, 209, 43–48. [Google Scholar] [CrossRef]
- Yin, B.; Zhou, H.D.; Chen, J.M.; Yan, F.Y. Microstructure and high temperature sliding wear behavior of laser remeltedNiCrBSi/35(WC–12Ni) composite coating. Surf. Eng. 2011, 27, 458–463. [Google Scholar] [CrossRef]
- Ramesh, M.R.; Prakash, S.; Nath, S.K.; Sapra, P.K.; Venkataraman, B. Solid particle erosion of HVOF sprayed WC–Co/NiCrFeSiB coatings. Wear 2010, 269, 197–205. [Google Scholar] [CrossRef]
- Buytoz, S.; Ulutan, M.; Islak, S.; Kurt, B.; Celik, O.N. Microstructural and wear character-istics of high velocity oxygen fuel (HVOF) sprayed NiCrBSi–SiC composite coating on SAE 1030 steel. Arab. J. Sci. Eng. 2013, 38, 1481–1491. [Google Scholar] [CrossRef] [Green Version]
- Harsha, S.; Dwivedi, D.; Agarwal, A. Influence of CrC addition in NiCrSiB flame sprayed coatings on microstructure, microhardness and wear behaviour. Int. J. Adv. Manuf. Technol. 2008, 38, 93–101. [Google Scholar] [CrossRef]
- Cai, B.; Tan, Y.; He, L.; Tan, H.; Gao, L. Tribological properties of TiC particles rein-forced Ni-based alloy composite coatings. Trans. Nonferrous Met. Soc. China 2013, 23, 1681–1688. [Google Scholar] [CrossRef]
- Koivuluoto, H.; Vuoristo, P. Effect of ceramic particles on properties of cold sprayed Ni–20Cr + Al2O3 coatings. J. Therm. Spray Technol. 2009, 18, 555–562. [Google Scholar] [CrossRef]
- Grewal, H.S.; Singh, H.; Agrawal, A. Microstructural and mechanical characterization of thermal sprayed nickel–alumina composite coatings. Surf. Coat. Technol. 2013, 216, 78–92. [Google Scholar] [CrossRef]
- He, L.; Tan, Y.; Wang, X.; Xu, T.; Hong, X. Microstructure and wear properties of Al2O3– CeO2/Ni-base alloy composite coatings on aluminum alloys by plasma spray. Appl. Surf. Sci. 2014, 314, 760–767. [Google Scholar] [CrossRef]
- Praveen, A.S.; Sarangan, J.; Suresh, S.; Subramanian, J.S. Erosion wear behaviour of plasma sprayed NiCrSiB/Al2O3 composite coating. Int. J. Refract. Met. Hard Mater. 2015, 52, 209–218. [Google Scholar] [CrossRef]
- Rachidi, R.; El Kihel, J.; Delaunois, F.; Vitry, V.; Deschuyteneer, D. Wear performance of thermally sprayed NiCrBSi and NiCrBSi-WC coatings under two different wear modes. J. Mater. Environ. Sci. 2017, 8, 4550–4559. [Google Scholar] [CrossRef]
- Natarajan, S.; Anand, E.; Akhilesh, K.S.; Rajagopal, A. Effect of graphite addition on the microstructure, hardness and abrasive wear behavior of plasma sprayed NiCrBSicoatings. Mater. Chem. Phys. 2016, 175, 100–106. [Google Scholar] [CrossRef]
- Habib, K.A.; Cano, D.L.; Caudet, C.T.; Damra, M.S.; Cervera, I.; Belles, J.; Ortells, P. Influence of Al2O3 particle size on microstructure, mechanical properties and abrasive wear behaviour of flame-sprayed and remeltedNiCrBSicoatings. J. Mater. Eng. Perform. 2017. [Google Scholar] [CrossRef]
- Bahrami, A.; Álvarez, J.P.; Depablos-Rivera, O.; Mirabal-Rojas, R.; Ruíz-Ramírez, A.; Muhl, S.; Rodil, S.E. Compositional and Tribo-Mechanical Characterization of Ti-Ta Coatings Prepared by Confocal Dual Magnetron Co-Sputtering. Adv. Eng. Mater. 2018, 20, 1700687. [Google Scholar] [CrossRef]
- Cesar, A.B.; Carrasco, F.O.; Cardona, A.D.; Huminiuc, T.; Polcar, T.; Rodil, S.E. Mechanical properties and microstructural stability of CuTa/Cu composite coating. Surf. Coat. Technol. 2019, 364, 22–31. [Google Scholar]
- Bahrami, A.; Delgado, A.; Onofre, C.; Muhl, S.; Rodil, S.E. Structure, mechanical properties and corrosion resistance of amorphous Ti-Cr-O coatings. Surf. Coat. Technol. 2019, 374, 690–699. [Google Scholar] [CrossRef]
- Praveen, A.S.; Arjunan, A. Parametric optimization of high-velocity oxy-fuel nickel-chromium-silicon-boron and aluminium-oxide coating to improve erosion wear resistance. Mater. Res. Express 2019, 6. [Google Scholar] [CrossRef]
- Baskaran, S.; Anandakrishnan, V.; Duraiselvam, M. Investigations on dry sliding wear behavior of in situ casted AA7075-TiC metal matrix composites by using Taguchi technique. Mater. Des. 2014, 60, 184–192. [Google Scholar] [CrossRef]
- Mahapatra, S.S.; Patnaik, A. Study on mechanical and erosion wear behavior of hybrid composites using Taguchi experimental design. Mater. Des. 2009, 30, 2791–2801. [Google Scholar] [CrossRef]
- Sutar, H.; Roy, D.; Mishra, S.C.; Patra, S.; Murmu, R. Thermal and dry sliding wear behaviour of plasma sprayed red mud fly ash coatings on mild steel. Tribol. Ind. 2018, 40, 117–128. [Google Scholar] [CrossRef]
- Dabra, R.; Panwar, N.; Dang, R.; Poonia, R.P.; Chauhan, A. Wear response of aluminium 6061 composite reinforced with red mud at elevated temperature. Tribol. Ind. 2017, 39, 391–399. [Google Scholar] [CrossRef] [Green Version]
- Radhika, N.; Vaishnavi, A.; Chandan, G.K. Optimization of dry sliding wear process parameters for aluminium hybrid metal matrix composites. Tribol. Ind. 2014, 36, 186–194. [Google Scholar]
- Kumar, T.S.; Raghu, R.; Kumar, K.K.; Shalini, S.; Subramanian, R. Optimization of three body abrasive wear behavoiur of stir cast A356/ZrSiO4 metal matrix composite. Tribol. Ind. 2018, 40, 633–642. [Google Scholar] [CrossRef]
- Prakash, J.U.; Juliyana, S.J.; Saleem, M.; Moorty, T.V. Optimization of dry sliding wear parameters of aluminium matrix composites (356/B4C) using Taguchi Technique. Int. J. Ambient. Energy 2018, 1–6. [Google Scholar] [CrossRef]
- Grewal, H.S.; Agrawal, A.; Singh, H. Slurry erosion performance of Ni–Al2O3 based composite coatings. Tribol. Int. 2013, 66, 296–306. [Google Scholar] [CrossRef]
- Evans, A.G.; Wilshaw, T.R. Quasi-static solid particle damage in brittle solids- I. Observations analysis and implications. Acta Metall. 1976, 24, 939–956. [Google Scholar] [CrossRef]
- Senapati, P.; Sutar, H. Surface erosion behaviour of NiCrBSi-Al2O3 composite coatings. Mater. Res. Express 2020, 7. [Google Scholar] [CrossRef]
- Déprez, P.; Hivart, P.; Coutouly, J.F. Friction and wear studies using taguchi method: Application to the characterization of carbon-silicon carbide tribological couples of automotive water pump seals. Adv. Mater. Sci. Eng. 2009, 830476. [Google Scholar] [CrossRef] [Green Version]
- Sudheer, M.; Prabhu, R.; Raju, K. Optimization of Dry Sliding Wear Performance of Ceramic Whisker Filled Epoxy Composites Using Taguchi Approach. Adv. Tribol. 2012, 2012, 431903. [Google Scholar] [CrossRef] [Green Version]
- Ross, P.J. Taguchi Techniques for Quality Engineering; McGraw-Hill: New York, NY, USA, 1996. [Google Scholar]
- Roy, R.K. A Primer on the Taguchi Method; Van Nostrand Reinhold: New York, NY, USA, 1990. [Google Scholar]
Figure 1.
Photograph of (a) N5A, (b) N10A and (c) N15Acoated samples.

Figure 2.
Photograph of air jet erosion tester.

Figure 3.
Photograph of the erosion chamber.

Figure 4.
Scanning electron microscopy (SEM) micrographs of (a) N5A, (b) N10A and (c) N15A coated samples.
Figure 4.
Scanning electron microscopy (SEM) micrographs of (a) N5A, (b) N10A and (c) N15A coated samples.

Figure 5.
X-ray diffraction (XRD) of (a) coating powder and (b) coated specimen.

Figure 6.
Optical images of (a) 5%, (b) 10% and (c) 15% composite coatings.

Figure 7.
Pictures of the (a) 5%, (b) 10%, (c) 15% Al2O3 composite coatings and (d) SS420 specimen after air jet erosion.
Figure 7.
Pictures of the (a) 5%, (b) 10%, (c) 15% Al2O3 composite coatings and (d) SS420 specimen after air jet erosion.

Figure 8.
Variation of erosion rates with impact angles of N5A, N10A, N15A and Grade SS420 after air jet erosion at impact velocities (a) 33 m/s, (b) 68 m/s and (c) 100 m/s.
Figure 8.
Variation of erosion rates with impact angles of N5A, N10A, N15A and Grade SS420 after air jet erosion at impact velocities (a) 33 m/s, (b) 68 m/s and (c) 100 m/s.

Figure 9.
Variation of erosion rates with impact velocities of N5A, N10A, N15A and Grade SS420 after air jet erosion test at impact angles (a) 30°, (b) 60° and (c) 90°.
Figure 9.
Variation of erosion rates with impact velocities of N5A, N10A, N15A and Grade SS420 after air jet erosion test at impact angles (a) 30°, (b) 60° and (c) 90°.


Figure 10.
Effect of particle kinetic energy on the erosion wear rate for air jet erosion.

Figure 11.
SEM Micrographs of N5A at (a) 30°, (b) 60°, (c) 90° impingement angle, N10A at (d) 30°, (e) 60°, (f) 90° impingement angle, N15A at (g) 30°, (h) 60°, (i) 90° impingement angle and SS420 at (j) 30°, (k) 60°, (l) 90° impingement angle at 33 m/s velocity and 200 μm erodent size after air jet erosion.


Figure 12.
Effect of control factors on volume loss (signal to noise ratio (S/N) ratio).

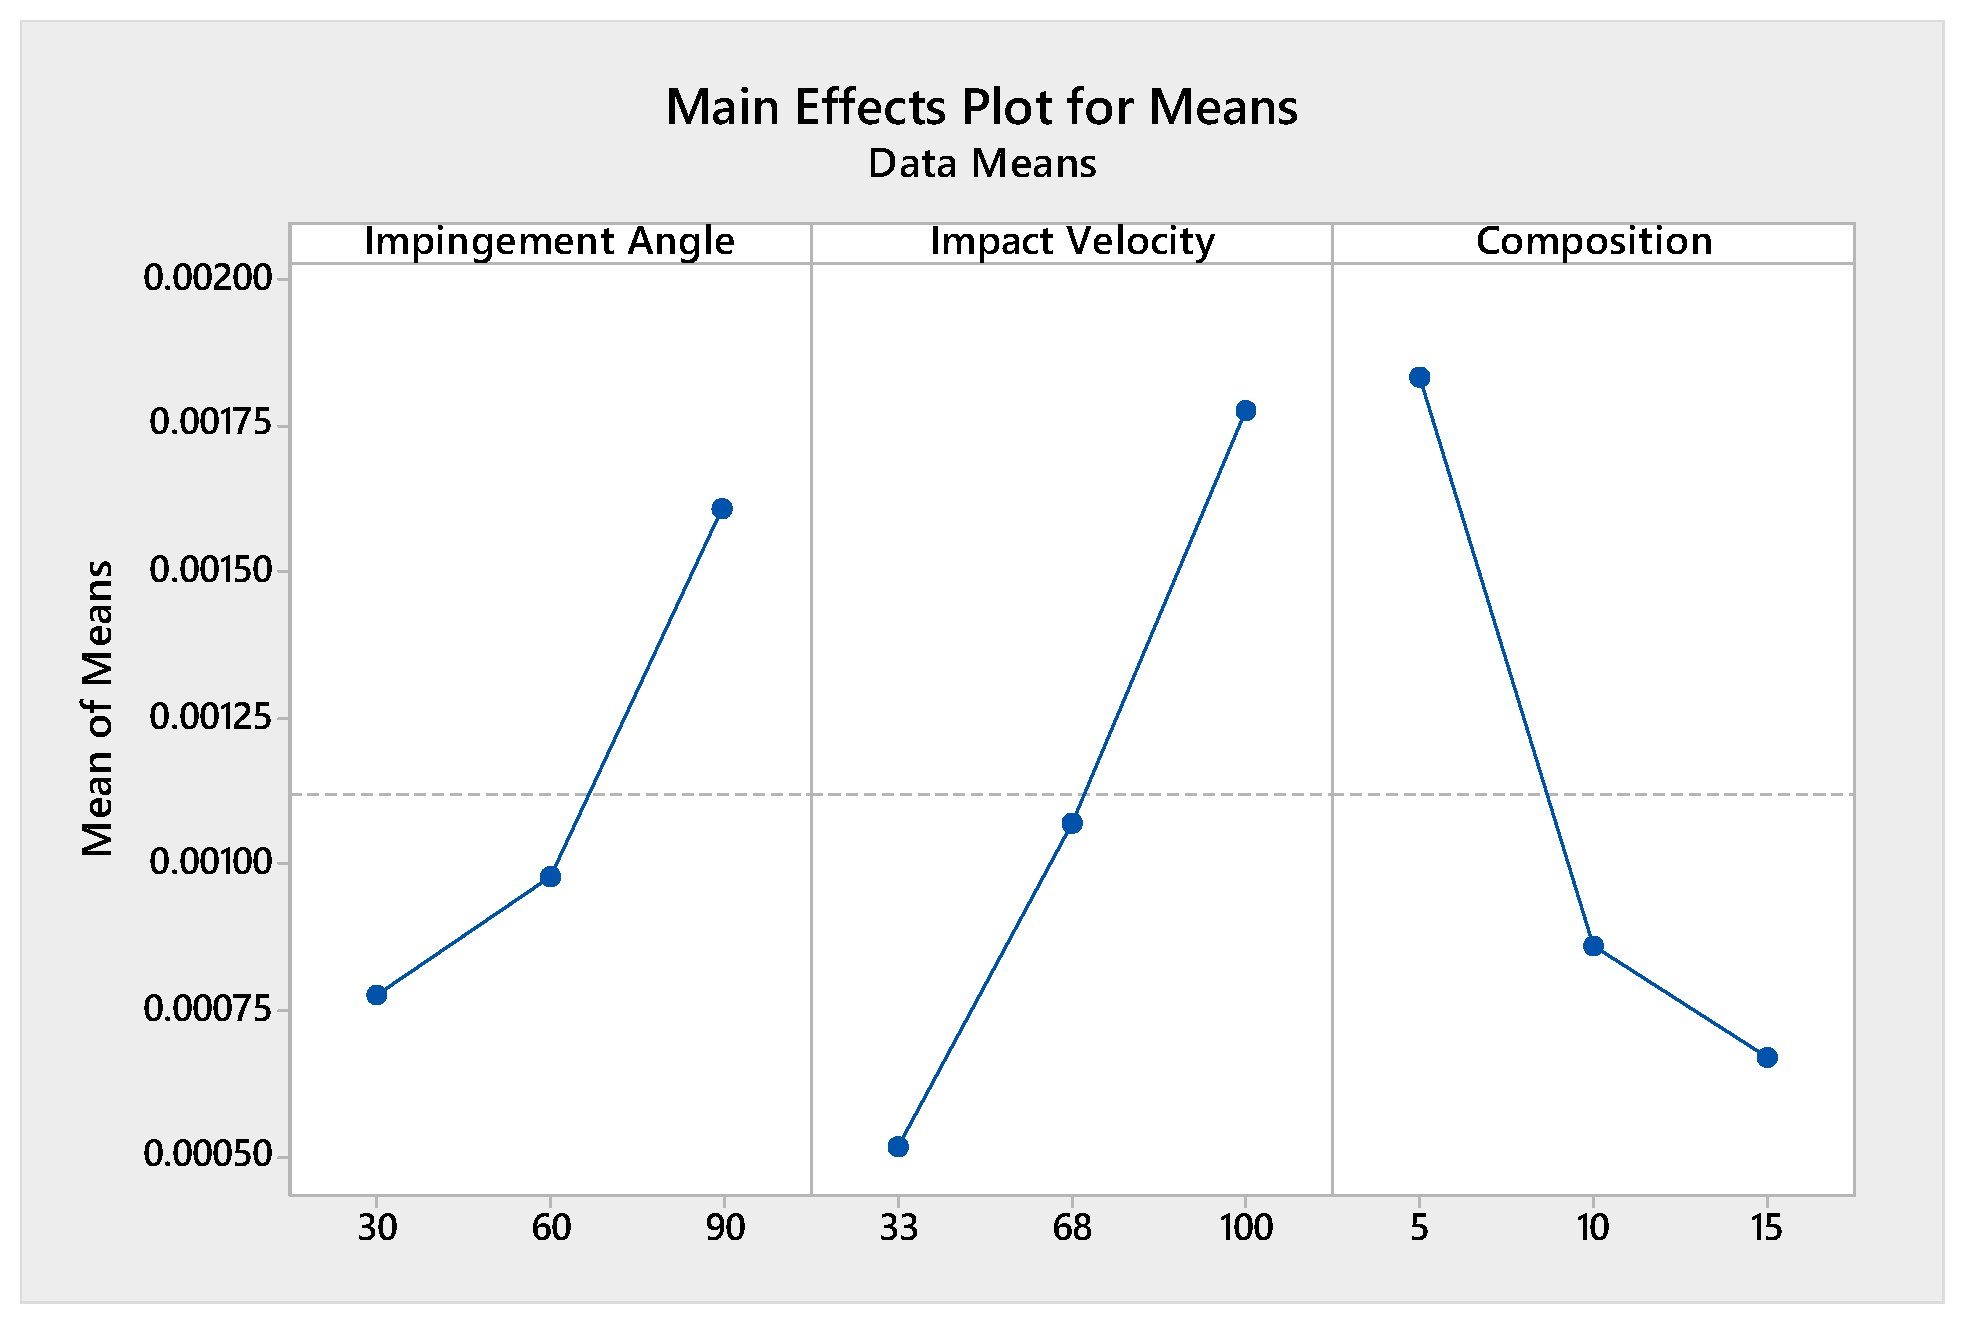
Figure 13.
Effect of control factors on volume loss (mean).

Figure 14.
Interaction plot of A × B × C on volume loss.

Figure 15.
Normal probability plot of the residuals for the volume loss.


Table 1.
Governing parameters of high-velocity oxy fuel (HVOF) coating process.
| Factors | Title/Magnitude |
|---|---|
| Pressure | Oxygen: 1 MPa |
| Air: 0.5–0.6 MPa | |
| Fuel LPG: 0.7 MPa | |
| Flow Rate | Oxygen: 0.0042–0.0045 m3/s |
| Air: 0.01 m3/s | |
| Fuel LPG: 0.001–0.0011 m3/s | |
| Nitrogen: 0.0014–0.0016 m3/s | |
| Carrier Gas | Nitrogen |
| Gun | MEC Hipo jet 2700 |
| Nozzle to substrate distance | 0.18 m |
Table 2.
Experimental design using L27 orthogonal array.
| L27(313) | Impingement Angle, ° | Impact Velocity, m/s | Composition, Al2O3 wt.% | Volume Loss, cc | S/N Ratio (dB) |
|---|---|---|---|---|---|
| 1 | 30 | 33 | 5 | 0.000766 | 62.31 |
| 2 | 30 | 33 | 10 | 0.000280 | 71.07 |
| 3 | 30 | 33 | 15 | 0.000150 | 76.47 |
| 4 | 30 | 68 | 5 | 0.001505 | 56.45 |
| 5 | 30 | 68 | 10 | 0.000364 | 68.79 |
| 6 | 30 | 68 | 15 | 0.000292 | 70.71 |
| 7 | 30 | 100 | 5 | 0.002750 | 51.21 |
| 8 | 30 | 100 | 10 | 0.000448 | 66.98 |
| 9 | 30 | 100 | 15 | 0.000408 | 67.78 |
| 10 | 60 | 33 | 5 | 0.000780 | 62.16 |
| 11 | 60 | 33 | 10 | 0.000392 | 68.14 |
| 12 | 60 | 33 | 15 | 0.000175 | 75.14 |
| 13 | 60 | 68 | 5 | 0.001915 | 54.36 |
| 14 | 60 | 68 | 10 | 0.000434 | 67.26 |
| 15 | 60 | 68 | 15 | 0.000437 | 67.18 |
| 16 | 60 | 100 | 5 | 0.002736 | 51.26 |
| 17 | 60 | 100 | 10 | 0.001119 | 59.02 |
| 18 | 60 | 100 | 15 | 0.000816 | 61.76 |
| 19 | 90 | 33 | 5 | 0.000862 | 61.29 |
| 20 | 90 | 33 | 10 | 0.000727 | 62.77 |
| 21 | 90 | 33 | 15 | 0.000496 | 66.10 |
| 22 | 90 | 68 | 5 | 0.002189 | 53.20 |
| 23 | 90 | 68 | 10 | 0.001469 | 56.66 |
| 24 | 90 | 68 | 15 | 0.001035 | 59.70 |
| 25 | 90 | 100 | 5 | 0.002982 | 50.51 |
| 26 | 90 | 100 | 10 | 0.002517 | 51.98 |
| 27 | 90 | 100 | 15 | 0.002201 | 53.15 |
Table 3.
Different properties of N5A, N10A and N15A coated samples.
| Sl No | Coating | Porosity Values (%) | Thickness (μm) ± SD | Surface Roughness, Ra Value (μm) | Surface Hardness(HV0.3) ± SD | Fracture Toughness (MPa√m) ± SD | Bond Strength (MPa) ± SD | Density (g/cc) | |
|---|---|---|---|---|---|---|---|---|---|
| Theoretical | Experimental | ||||||||
| 1 | N5A | 3–5 | 222 ± 9 | 3.6 to 5.7 | 407 ± 15 | 3.05 ± 0.7 | 19.72 ± 1.8 | 7.53 | 7.31 |
| 2 | N10A | 2–4 | 203 ± 13 | 5.0 to 6.0 | 557 ± 22 | 3.82 ± 1.2 | 19.01 ± 2.6 | 7.34 | 7.15 |
| 3 | N15A | 3–5 | 213 ± 8 | 5.0 to 6.30 | 715 ± 31 | 4.12 ± 1.5 | 22.37 ± 1.3 | 7.16 | 6.86 |
Table 4.
Response table for signal to noise ratio.
| Level | Impingement Angle | Impact Velocity | Composition |
|---|---|---|---|
| 1 | 65.75 | 67.27 | 55.86 |
| 2 | 62.92 | 61.59 | 63.63 |
| 3 | 57.26 | 57.07 | 66.44 |
| Delta (δ) | 8.49 | 10.20 | 10.58 |
| rank | 3 | 2 | 1 |
Table 5.
Analysis of variance (ANOVA) table for volume loss.
| SOURCE | DOF | Adj SS | Adj MS | F VALUE | P VALUE | P (%) | RANK |
|---|---|---|---|---|---|---|---|
| Impingement angle: A | 2 | 336.47 | 168.24 | 78.78 | 0.000 | 22.33 | 3 |
| Impact velocity: B | 2 | 470.11 | 235.05 | 110.06 | 0.000 | 31.20 | 2 |
| Composition: C | 2 | 540.79 | 270.39 | 126.61 | 0.000 | 35.89 | 1 |
| A × B | 4 | 12.71 | 3.18 | 1.49 | 0.293 | 0.86 | 3 |
| A × C | 4 | 110.59 | 27.65 | 12.95 | 0.001 | 7.34 | 1 |
| B × C | 4 | 18.87 | 4.72 | 2.21 | 0.158 | 1.25 | 2 |
| ERROR | 8 | 17.08 | 2.14 | 1.13 | |||
| TOTAL | 26 |
S = 1.461, R-Sq = 98.9%, DOF: degrees of freedom; Adj SS: adjusted sum of squares; Adj MS: adjusted mean squares; P: percentage of contribution.
Table 6.
Confirmation results for the developed model.
| Designated Level | Parameter | Error % | |
|---|---|---|---|
| Prediction | Experimental | ||
| A1B1C3 (Optimal level) | 75.52 | 76.47 | 1.25 |
| A2B1C3 | 72.68 | 75.14 | 3.27 |
| A3B1C2 | 64.21 | 62.77 | 2.29 |
| A2B2C1 | 56.42 | 54.36 | 3.78 |
Publisher’s Note: MDPI stays neutral with regard to jurisdictional claims in published maps and institutional affiliations. |
© 2021 by the authors. Licensee MDPI, Basel, Switzerland. This article is an open access article distributed under the terms and conditions of the Creative Commons Attribution (CC BY) license (https://creativecommons.org/licenses/by/4.0/).
Share and Cite
MDPI and ACS Style
Senapati, P.; Sutar, H.; Murmu, R.; Bajpai, S. Experimental Design of Solid Particle Wear Behavior of Ni-Based Composite Coatings. J. Compos. Sci. 2021, 5, 133. https://0-doi-org.brum.beds.ac.uk/10.3390/jcs5050133
AMA Style
Senapati P, Sutar H, Murmu R, Bajpai S. Experimental Design of Solid Particle Wear Behavior of Ni-Based Composite Coatings. Journal of Composites Science. 2021; 5(5):133. https://0-doi-org.brum.beds.ac.uk/10.3390/jcs5050133
Chicago/Turabian StyleSenapati, Pragyan, Harekrushna Sutar, Rabiranjan Murmu, and Shubhra Bajpai. 2021. "Experimental Design of Solid Particle Wear Behavior of Ni-Based Composite Coatings" Journal of Composites Science 5, no. 5: 133. https://0-doi-org.brum.beds.ac.uk/10.3390/jcs5050133